Article

The Strategy of Factors Influencing Learning Satisfaction Explored by First and Second-Order Structural Equation Modeling (SEM)

by
Mohammed Mamun Mia
1,
Nurul Mohammad Zayed
1,
Khan Mohammad Anwarul Islam
2,
Vitalii Nitsenko
3,4,*,
Tetiana Matusevych
5 and
Iryna Mordous
5
1
Department of Business Administration, Faculty of Business and Entrepreneurship, Daffodil International University, Dhaka 1341, Bangladesh
2
Department of Business Administration, The Millennium University, Dhaka 1341, Bangladesh
3
Department of Entrepreneurship and Marketing, Institute of Economics and Management, Ivano-Frankivsk National Technical Oil and Gas University, 76019 Ivano-Frankivsk, Ukraine
4
SCIRE Foundation, 00-867 Warsaw, Poland
5
UNESCO Chair on Science Education, National Pedagogical Dragomanov University, 01601 Kyiv, Ukraine
*
Author to whom correspondence should be addressed.
Inventions 2022, 7(3), 59; https://doi.org/10.3390/inventions7030059
Submission received: 12 June 2022 / Revised: 29 June 2022 / Accepted: 6 July 2022 / Published: 14 July 2022

Abstract

:
The goal of this research was to create a partial least square structural equation model (PLS-SEM) with a second-order structural model to investigate the interaction between research-based methodologies and relationship factors that significantly influence learning satisfaction among university students. The instruments used in this study were a simple random sampling technique for structural equation model (SEM) analysis, while a quantitative process of survey data collection was manipulated through SPSS and Smart-PLS. The presented study attempted to explore whether teachers’ strategies are linked with their students for the students’ learning satisfaction. Thus, it represents the demands and expectations of two statistically significant common phenomena: research-based components and relationship approach components. This set of teaching techniques encourages university students and enhances their learning satisfaction. Moreover, this study explored teaching strategies that influence factors having a directly significant influence on learning satisfaction at university level. Each factor measures the relationship’s construct, proven to be a second-order SEM reflective model that is statistically significant. Our study explored learning satisfaction as an integral part of teaching strategies, by first- and second-order structural equation modeling, supported by students’ expectations, and the study’s empirical results provide potential implications for learning satisfaction.

1. Introduction

Around the world, modern teaching tactics have flourished, and they are both successful and straightforward for teachers to implement [1,2]. Teaching strategies are effective in educating students and ensuring that they comprehend concepts. There is greater use of the internet in educational applications in this century, which could indicate that students and teachers would use technology more in open and flexible learning systems [1,3,4]. Strategies are critical to improve our educational system. The planned and unforeseen consequences of employing modern teaching techniques for teacher professional development must be investigated. Students and teachers both require certain skills and abilities in the use of various modern teaching strategies [3,5]. Therefore, research-based techniques must be organized in line with modern teaching relationships.
Research-based teaching techniques and factors of the relationship between students and teachers are the most significant indications of students’ satisfaction with their understanding and the enhancement of their learning, in this era [1,6,7]. Despite countless well intended efforts to progress student attainment in regularly low-performing schools, there is little indication of substantial progress.
The literature demonstrates a vast array of modern methods that are linked with learning satisfaction in the teaching system. Inventive teaching methods in academic learning are necessary [1,4,8]. Modern teaching techniques have significant influence in building constructive relationships between students and institutions [1,9,10]. The following sections explore two perspectives of learning satisfaction. Research-based teaching techniques are explained as a first-order construct, and relationship factors are established as second-order constructs.

1.1. Research-Based Teaching Techniques

The first construct selected in this research is research-based teaching techniques, which has developed as one of the wings of the conceptual framework in relation to learning satisfaction [6,11,12]. Indeed, research-based techniques encourage students’ perception of dynamic goal setting in academic and non-academic fields. This method helps the students become innovative and diversify their thinking. The research-based techniques method is one of the most important and modern teaching methods that link with traditional curricula, particularly for developing countries, such as Bangladesh. It provides students with intention to positively set their learning satisfaction in further study [9,13]. The research-based techniques that assisted in creating the educational satisfaction tool designed for this analysis were more practical than ancient teaching techniques used at the university level [6,14]. Well tested research-based teaching techniques that extend students’ abilities to retain, recall, and apply what they are instructed with do not seem to be systematically employed in classrooms [6,9,14]. Regardless of the numerous changes that occur in faculties, student performance will not improve considerably unless academics systematically use, and college leaders systematically promote, research-based tutorial methods [14,15,16].
There is almost no question that teachers have an impact on their students’ academic performance. Yet, if we look at the vast amount of significant research on the subject, it becomes clear that certain teaching tactics have a much greater influence than others. Teaching methods based on research practices are likely to have the greatest influence on student outcomes, according to research. It is necessary to know what the learners know for each lecture. The impact of such transparency on student outcomes is higher than the effect of having standards for all students. If it is not possible to quickly and clearly define what learners understand and what they will be able to perform at the end of a single lesson, the purpose of each session will be muddled. Clear lesson aims enable students to concentrate on the most important aspects of their course. Therefore, research-based techniques have a significant and positive impact on learning satisfaction when research practices are highly influenced by the students.
We can conclude from the above literature review that the first research hypothesis in this study is:
H1: 
Research-based techniques have a significant and positive impact on learning satisfaction.

1.2. Relationship

The second construct is that of relationship factors, which represents how teachers are connected with students in the classroom and outside of the class. This construct is demonstrated as a second-order construct because it cannot be directly measured. In order to measure the relationship between teachers and their students, it is necessary to have some dimensions to confirm the construct represented. The dimensions of choice, communication, collaboration, critical thinking, and creativity were selected to measure the factors of the relationship in our study, demonstrated as second-order dimensions. These five dimensions are concisely explained as follows.
Choice—The most essential dimension in the relationship factor is student choice, the element in which students are given the right to self-determination in picking their route. This dimension facilitates solid information between teachers and students. In 1998, William Glasser invented the term choice theory, which claims that we do nothing but behave and that we are motivated. Esteem and self-actualization are the most important needs in choice theory. They provide a foundation for satisfaction in the classroom, which should be a location where students can meet their needs. Therefore, we can conclude that choice has a significant and positive association to measure one of the relationship factors used as a dimension.
Collaboration—Collaboration is the procedure of two or more individuals, beings, or establishments cooperating to complete a job or attain a goal. The words collaboration and cooperation are occasionally identical. Most collaborations necessitate leadership, albeit this may entail common leadership within a decentralized and open association. Collaboration allows students be more engaged within class and outside of the class and objectives are achieved jointly. It is the most effective way to work together to fulfil a task or complete a project. Collaboration is a reflective indication of the relationship factor dimension. Addressing work difficulties in collaborative forms of communication, and making use of appropriate collaboration tools, may make a significant difference.
Communication—The communication method is key in the relationship between teachers and students, significantly influencing, for example, feedback from students. Communication is simply the act of sending data from one location, person, or cluster to another; nevertheless, each communication requires at least one sender to the community. Simply put, one of the most critical areas to focus on is teacher–student interaction. To make communication more effective, it is necessary to research learners’ likes and dislikes, and, therefore, how they change and evolve. Students should be encouraged to express themselves and to not be frightened of making errors. Encouraging individual students can be difficult, particularly in the classroom when number of students is larger than the standard number of participants. Communication is a strong factor in the relationship dimension of measuring constructs.
Critical Thinking—The ability to apply information, facts, and data to effectively solve problems is referred to as problem-solving and critical thinking. This does not imply that an immediate response is required; rather, it implies the ability to be ready to adapt to different situations, assess difficulties, and come up with solutions. However, problem-solving and critical thinking are interrelated with each other. Whenever a problem arises, critical thinking can guide one to solve the problem. Each individual is tasked with extending critical thinking. Communication and knowledge skills, analytical thinking, and better problem solving are all important foundational abilities for critical thinking. The term “critical thinking” relates to a scholar’s capacity to notice, examine, and assess materials or talents effectively.
Creativity—A person’s capacity to develop and propose unique and innovative ideas is referred to as creativity. Inventive students can use their creativity and critical thoughts to come up with new and significant ideas. Creative students can develop or manufacture something, which is a necessary talent for students to succeed in academics and at work. Creativity aids in problem-solving, increases pleasure in life, and provides a feeling of purpose. In the classroom, students’ creativity should be fostered by creating an environment that is kind and tolerant. Awareness of students’ needs and what they are expressing can encourage creative thinking. Tasks should be developed and adapted with creativity in mind. Rapid feedback on a student’s creativity is enabling. Assisting students in determining when it becomes acceptable to be innovative should be supported and encouraged in the relationship between teacher and student.
Explorations to assess have been consistently supported in the literature. The construct of relationship factors, with these five dimensions, are positively associated. The dimensions are also identified as theoretical relations and positive indications for justifying a construct. This construct, presented herein, has a significant and positive association with learning satisfaction.
Therefore, the study concludes that the second hypothesis is:
H2: 
Relationship factors have a positive and significant relation with learning satisfaction.

1.3. Learning Satisfaction

Learners’ feelings and attitudes toward the learning process, as well as the perceived amount of fulfillment associated with one’s willingness to learn, are represented by learning and achievement. Cardozo advanced the customer satisfaction idea, which gave rise to the learning satisfying theory (1965). Learning quality relates to the feelings associated with the activities that occur during learners’ participation in teaching and learning sessions. Learning satisfaction is influenced by research-based techniques and relationship factors that are positively associated. These two constructs are one of the more influential and more dynamic powers operating toward learning satisfaction between teachers and students. Recognizing the significance of student outcomes in university education is relevant in this context. This not only enhances performance but also fosters behavioral health and quality of life in students, which is beneficial to both short-term educational objectives and long-term personality development and social engagement.

1.4. Conceptual Framework

After an empirical literature review, the researcher found two hypotheses with three main constructs, as well as five dimensions. Therefore, hypotheses developed structurally led to a research conceptual framework, which was then explored by means of survey data to statistically measure variables (Figure 1).

2. Materials and Methods

2.1. Methodology

The research methodology was guided by a detailed procedure that was employed to classify, choose, and analyze the research evidence [17,18]. In social science, the research method generally used involves three paradigms: qualitative, quantitative, and mixed methods [19,20,21]. This research was conducted with the SEM technique to justify the conceptual framework, which is extensively useful in business and social sciences to develop the model or to test the theory [19]. In this study, the research method was adopted with exploratory analysis suitable for the second-order structural equation model, while the framework of the conceptual model was empirically checked by Smart PLS and SPSS to identify empirical data based on the literature review. The sampling procedure followed in this study was simple random sampling at the Daffodil International University, Dhaka. Nevertheless, the following aspects were also elaborated for this study and executed by means of step-by-step data analysis for the second-order structural equation modeling.

2.2. Data Analysis

Data analysis is a systematic process guided by method of execution of empirical data and by which method of research design is appropriate [20,21,22,23,24,25,26,27,28,29,30]. In this research, the conceptual model was generated through literature, which was used to accumulate the predicted relationship between constructs, drawn through hypotheses. The hypotheses were required to choose the appropriate method [20] for the exploratory analysis that is essential to the most common and well-known design of quantitative analysis [17,18,19,20,21,22,23,24,25,26,27,28,29,30,31,32,33] to test literature prediction from empirical data. Therefore, in this study quantitative analysis was selected by applying the statistical tools of SPSS and Smart-PLS. SPSS is more suitable for descriptive analysis, and Smart-PLS is more appropriate for inferential statistics [30,31,32,33]. The research model was reflective rather than formative. The reflective model develops the theory rather than tests the theory [20,21,22,23,24,25,26,27,28]. The research design of the strategy helps in obtaining the research prediction, identified or not. Therefore, researchers select the research design to get a suitable outcome, such as selecting the philosophy of positivism with a deductive approach because the deductive approach is more suitable to draw the conceptual framework through literature review. The strategy selected the survey method for data collection through close-ended questionnaires. A mono-method was chosen with cross-sectional time-horizon.
A plan for addressing the research topic is called a research design, while an approach utilized to carry out that plan is a research methodology [30]. Although research design and techniques are distinct, they are closely connected, because sound research design guarantees that the information gathered will enable a more fully addressed research issue [33]. So, in this study quantitative design was adopted to find the answers from survey data, which was a Likert scale of 1 to 5 points. Where 1 strongly disagrees, 2 disagrees, 3 is neutral, 4 agrees, and 5 strongly agrees. The target respondents were students of the department of business administration at Daffodil International University. A total of 113 questionnaires were distributed and, finally, 96 respondents were selected as a final data set for the empirical analysis. The study was conducted with a simple random sampling technique when the survey was completed and the data collected.
Data was explored using two statistical software, SPSS and Smart-PLS. SPSS was conducted for the items measured by exploratory factor analysis (EFA). PLS-SEM used Smart-PLS software. Data was first analyzed by the EFA to check each item factor loading achieved ≥0.50, the cut-off value required before executing the structural model. Likewise, PLS-SEM was explored to demonstrate the conceptual model by means of empirical data analysis. Therefore, the following sections are a set of EFA estimates and structural modeling validation.

2.3. Exploratory Factor Analysis (EFA)

An EFA to begin the exploratory factor structure of the SPSS, using an extraction method by Principal Component Analysis (PCA) and rotation method, was conducted through varimax with Kaiser Normalization. The results of each component achieved above 0.50, so were valid, as a value ≥0.50 was required for validity [22,23,24,25]. The Kaiser-Meyer-Olkin (KMO) Measure of Sampling Adequacy is 0.843, which is more than 0.70, while the significant level for Bartlett’s Test of Sphericity is 0.000, which is less than 0.05. Therefore, EFA analysis is statistically significant and confirmed in the matrix of extraction and rotation methods (Table 1).
Cronbach’s alpha (α) of each item achieved more than 0.70; the cut-off value should be ≥0.70 to reach a reliable edge [23,26,33] The measurements were reliable and allowed for further analysis.

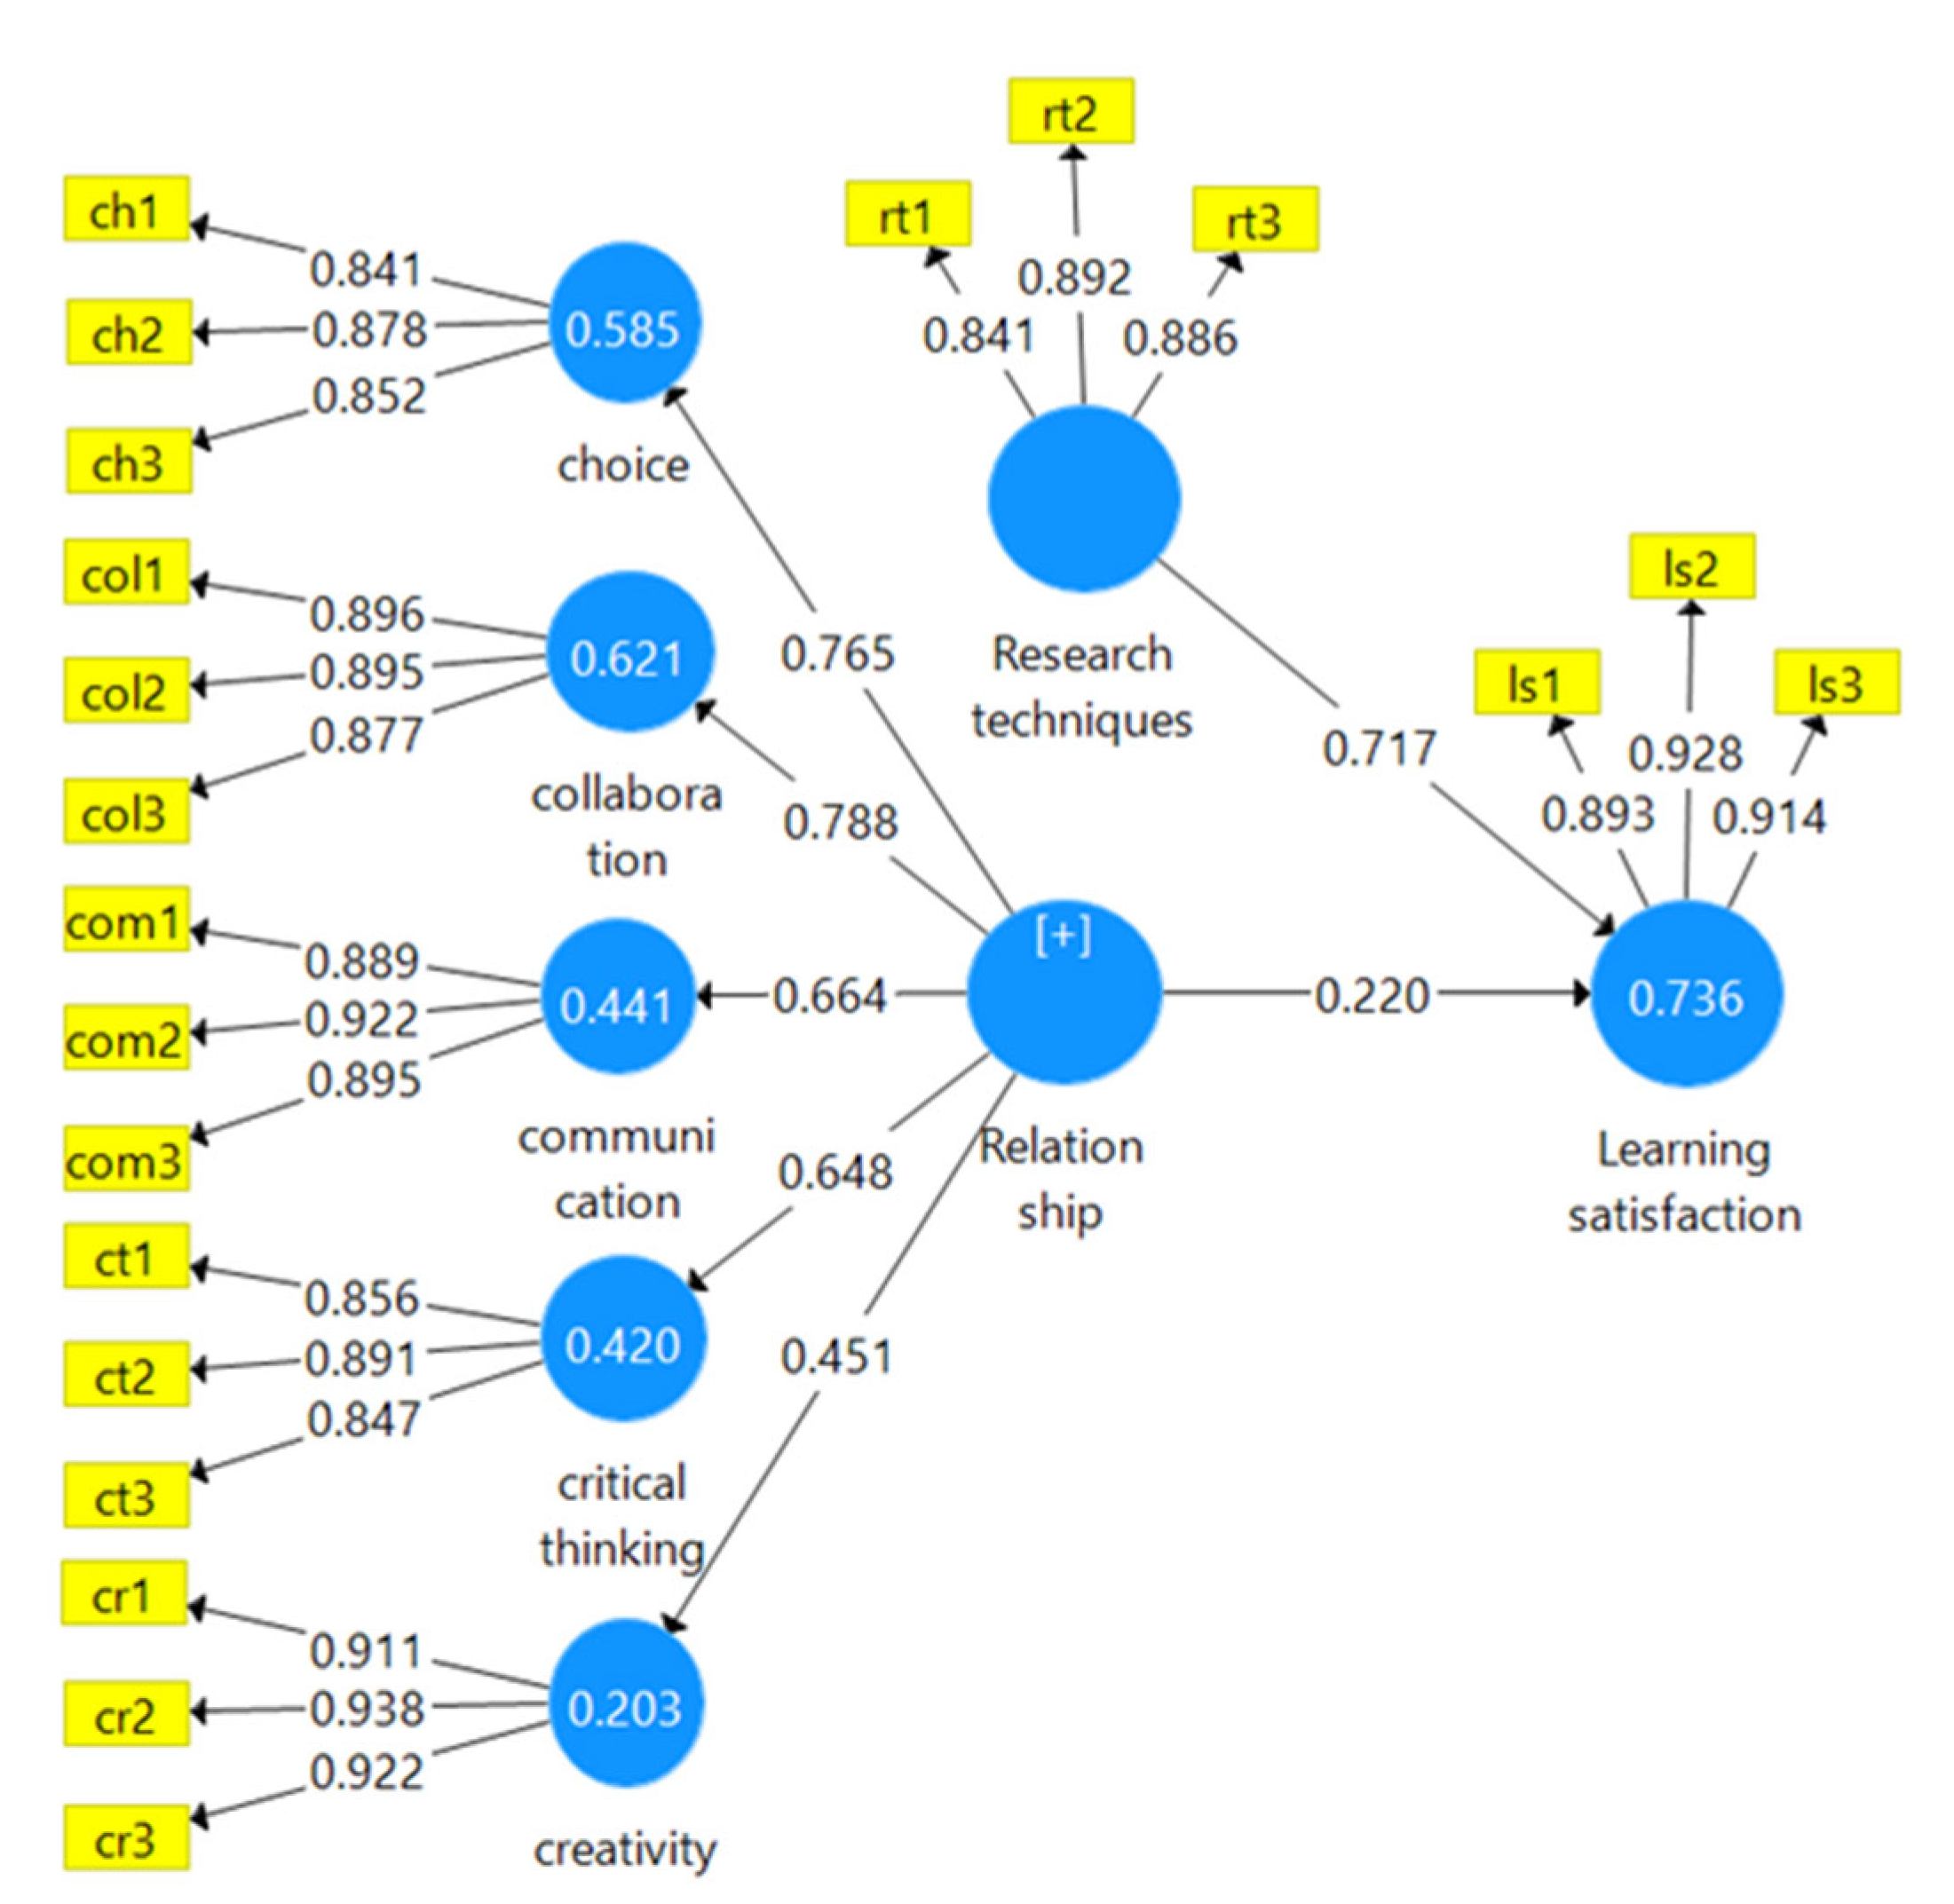
2.4. Factor Analysis by PLS Algorithm

The path analysis and SEM model with a PLS algorithm identify the path correlation coefficient, which measures the partial correlation coefficient between endogenous and exogenous variables [26,27]. The correlation coefficient ranges from −1 to +1, while the significance is 0.20. There is no required minimum level, although usually ≤0.10 is shown at bootstrapping for the significant path [28]. The PLS algorithm is essentially a series of weight vector-based regressions [29]. The weight vectors obtained upon convergence fulfil fixed point equations, while the fundamental PLS technique includes the stages listed below [30,31,32]. The following measurement figure is run by the PLS algorithm to get one of the most significant parameters, called factor loadings [33]. Thus, each item’s factor loading provided the item surface, which should be higher than, or equal to, 0.70 [27,28]. All of the measurements displayed above 0.70 factor loadings. Therefore, the measurement model was identified all of the items as strong enough to carry with the constructs without removing any single item (Figure 2). That means every construct stayed with three items.
The value of r-square in the second-order structural model for the construct of a relationship with five dimensions was strongly influenced by an exogenous variable with predictor dimensions of choice, collaboration, communication, critical thinking, and creativity. Choice achieved 58%, collaboration achieved 62%, communication 44%, critical thinking 42%, and creativity 20%. The rest of the causes might be other predictor variables.
The correlation coefficient between relationship and learning satisfaction was 0.220, which was ideally significant and allowed a precursor subset of the SEM model to run the bootstrapping model. On the other hand, the association between research techniques and learning satisfaction path coefficient was 0.717, which was highly correlated and showed that research-based education has much more influence on attaining satisfaction at the learning stage, rather than the conventional method. Nevertheless, the construct of the relationship with five dimensions has achieved ≥0.20. Therefore, the items of each dimension were statistically measured as second-order dimensions of the relationship construct. The coefficient of the path correlation between the exogenous variable of the relationship toward the five dimensions showed a strong association between them. The correlation between relationship and choice was 0.765 which was the second-highest association. The dimension of collaboration and relationship was 0.788, which was one of the highest associations. The third dimension between relationship and communication was 0.664 which was good at this level. The fourth dimension between relationship and critical thinking was 0.648, that showed a relatively high association as well. The last dimension between relationship and creativity was 0.451, which was a good association. Therefore, by the predictor variable of relationship measured with all of the dimension items the second-order was confirmed and established the reflective model.

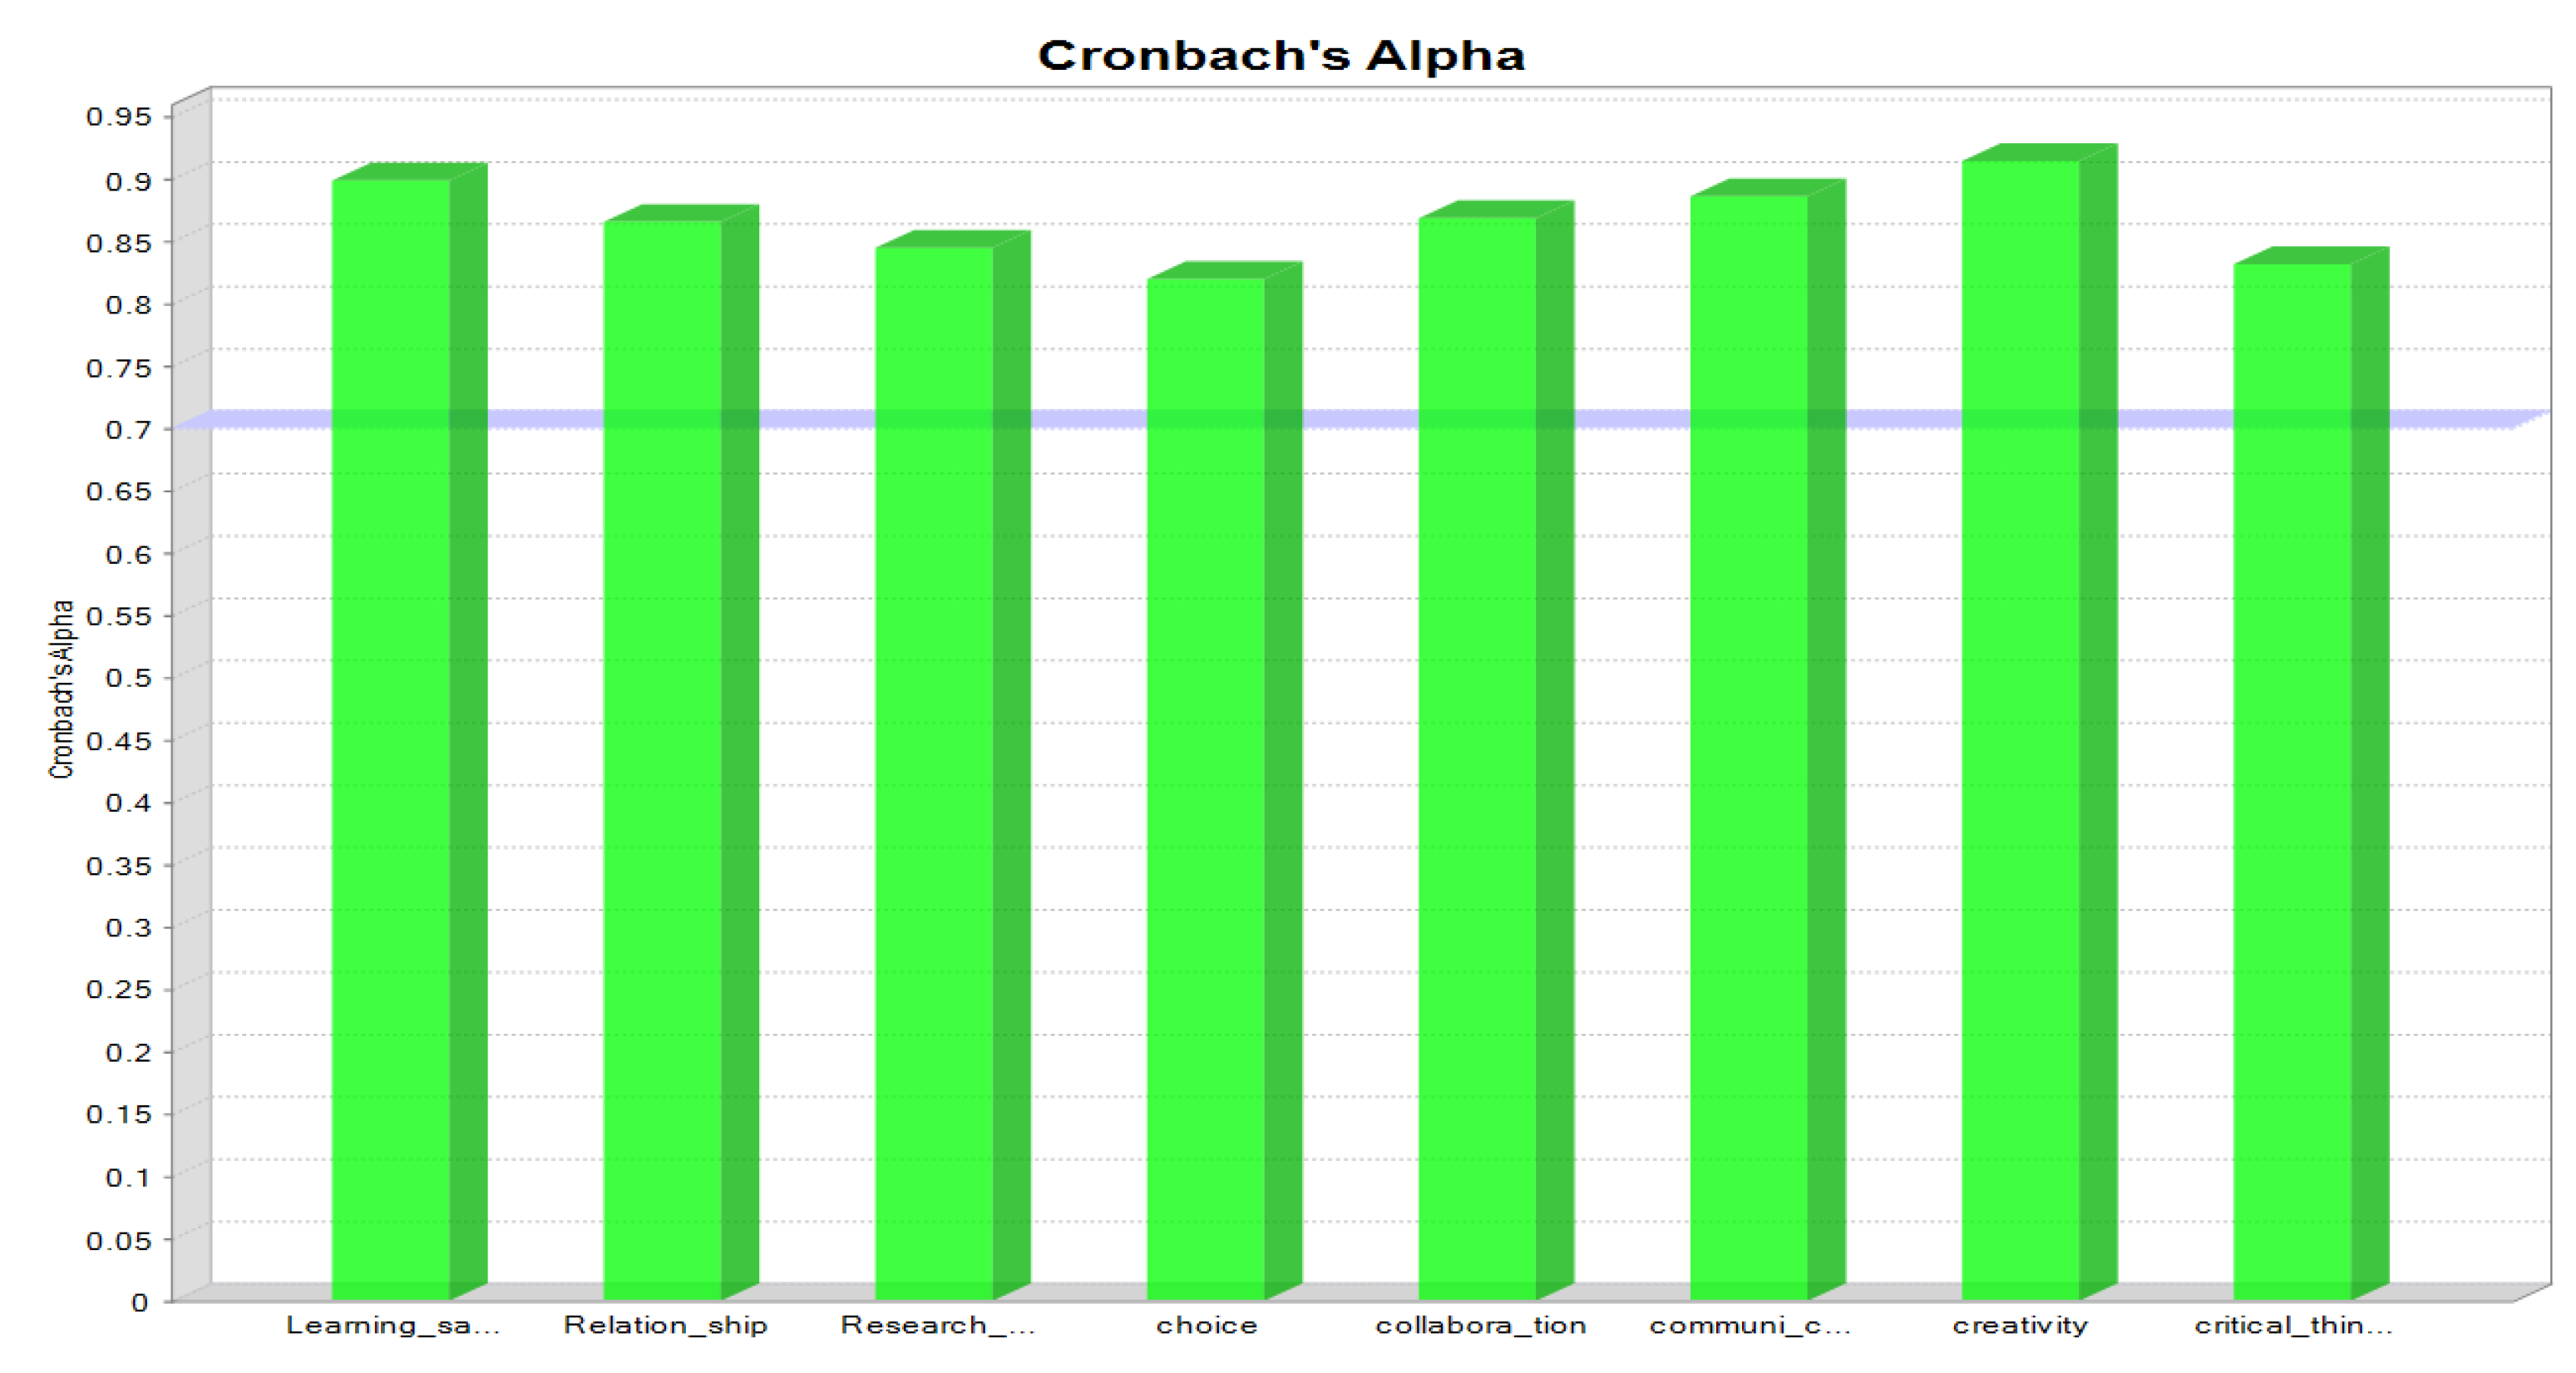
2.5. Construct Reliability and Validity

Similar to Cronbach’s alpha, composite reliability is known as construct reliability to measure the internal consistency in scale categories [30]. The constructs achieved ≥0.70 in all of the desired cut-off lines. Cronbach’s alpha should be more than or equal to 0.70 and the latent variable becomes reliable in further analysis [27,30]. As the composite values also attained more than 0.70, this identified the construct as reliable [27]. In a nutshell, the measurement model should be focused on the measurement indices, which are the factor loading ≥0.50, AVE ≥ 0.50, CR ≥ 0.70, and Cronbach’s alpha ≥ 0.70 [27,33,34]. However, the following indices were explored statistically from the survey data to justify the literature (Table 2).
The following Figure 3 shows the Cronbach’s alpha of each construct, which achieved more than 0.70. Therefore, this indication allowed further analysis, such as correlation coefficient or path coefficients.

2.6. Convergent Validity

The convergent validity is calculated using the AVE (Average Variance Extracted). AVE ≥ 0.50 means the indicators have been quantified [35]. The AVE of all the constructs achieved more than 0.50, except for one construct of the relationship, which was 0.35, which was less than 0.50. The rest of the parameters identified the path coefficient as a precursor to running further analysis, such as path analysis using bootstrapping. The following discussion of discriminant validity is described from the perspective of any discriminant issue explained with different weights, which are the Fornell-Larcker criterion, Heterotrait-Monotrait ratio, and Cross Loadings, mentioned below.

2.7. Discriminant Validity

The most important phenomenon of discriminant validity measured by different weights are the Fornell-Larcker criterion, Heterotrait-Monotrait ratio, and Cross Loadings, shown in the below consequently (Table 3).
To estimate the degree of shared variance among the model’s latent variables, the Fornell-Larcker criterion has been widely utilized [36]. Using Fornell-Larcker Criterion, each variable square root AVE being greater than its association with other variables indicates there is no discriminant issue. From Table 2 the value of AVE was calculated and shown in Table 3 in bold marking. All of the variables, when exposed to SQRT (square root) achieved what was required to justify the first criterion and there was no discriminant issue regarding the Fornell-Larcker Criterion. Using HTMT the results are described in below (Table 4).
The discriminant validity using HTMT should have a value less than 0.85 but sometimes less than 0.90 regarding correlation between the constructs for there to be no discriminant issue [36]. The discriminant issue found in our research technique was 0.954, which is more than 0.90. Nevertheless, the rest of the constructs generated were less than 0.85, which identified no discriminant issues.
Finally, the discriminant validity using a Cross-Loadings relation between the items was addressed. The parent construct items for factor loadings should be more than other correlate construct factor loading correlations [27,30,34,36,37,38,39,40]. In the cross-loading, there was the issue of discriminant validity due to the small size sample. Therefore, this study recognized the discriminant validity.

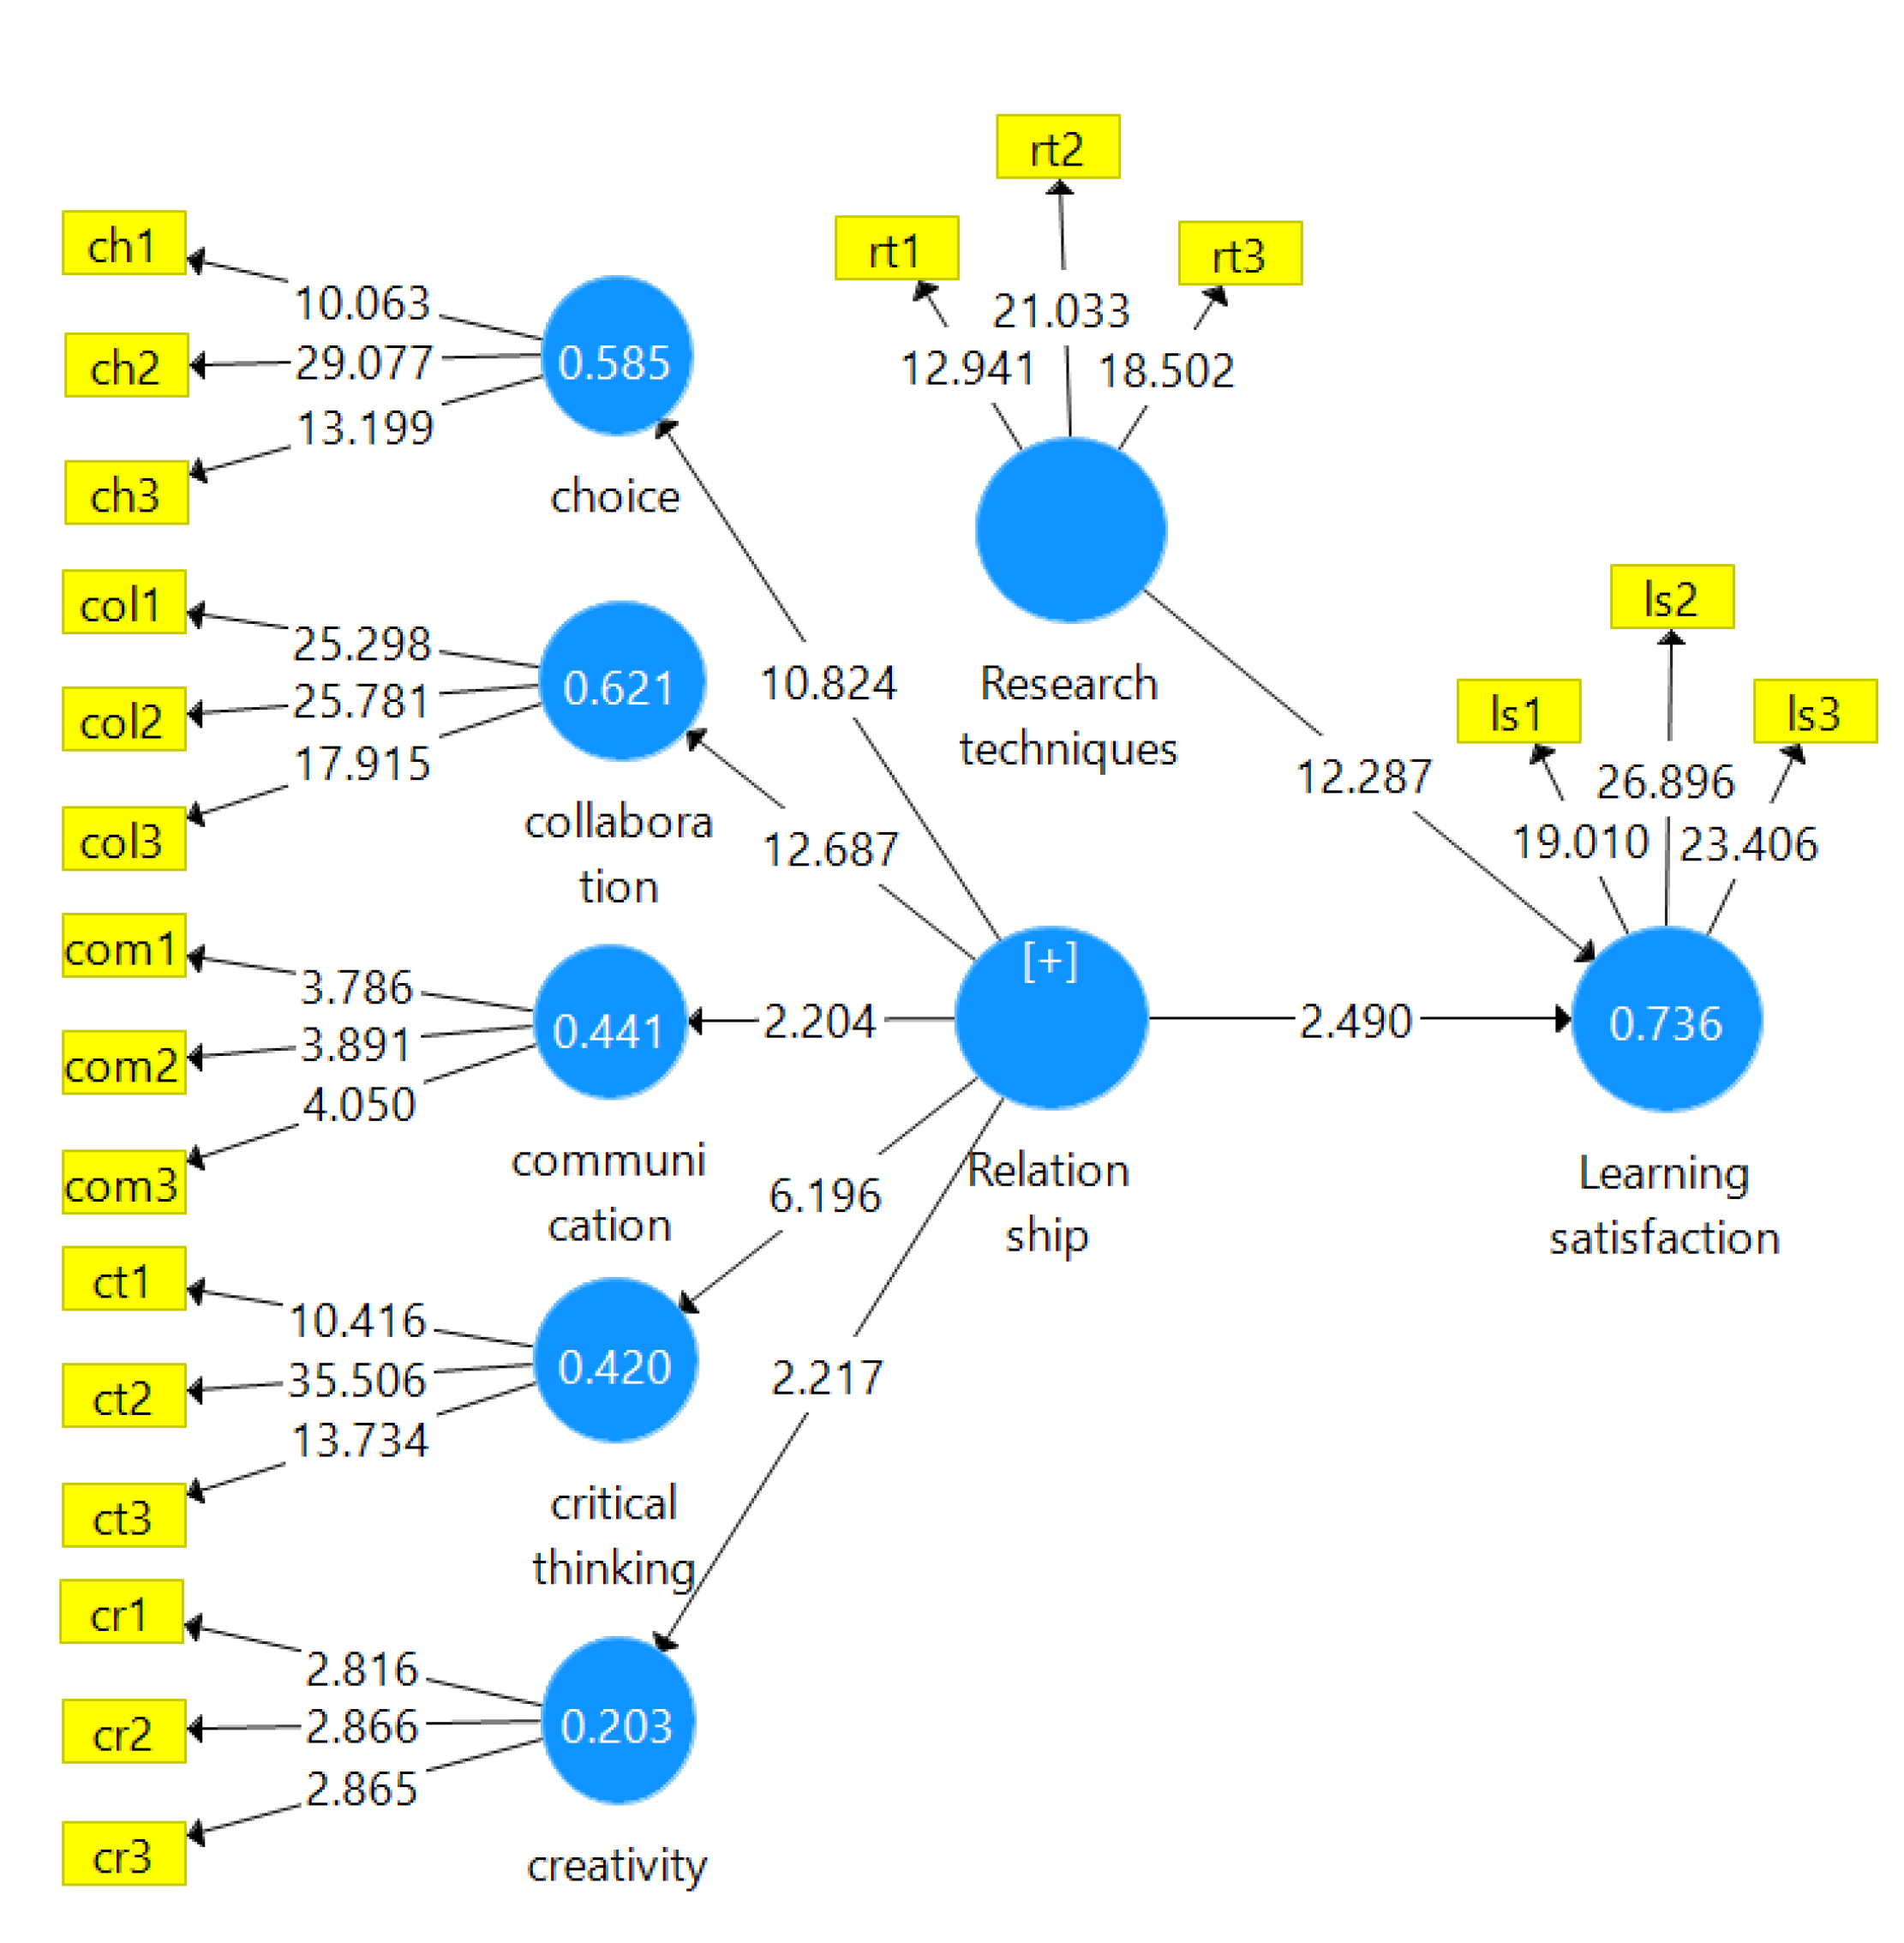
3. Hypothesized Structural Equation Model (SEM) by PLS-Bootstrapping

Bootstrapping is a nonparametric method for determining the statistical validity of PLS-SEM outcomes, such as path coefficients [30]. Under this section, the structural model was analyzed to get the outputs of empirical data through statistical analysis by Smart PLS using PLS-Bootstrapping (Table 5).
The above table shows that hypotheses reached a minimum value of 1.96 to get the significant association at the p-value to become ≤0.05. Therefore, null hypotheses were rejected and alternative hypotheses established. The theoretical prediction justified research techniques and learning satisfaction. H1 at the t-statistics was 12.287 and the p-value was 0.000, which was greater than 1.96 with less than 0.05. On the other hand, the second hypothesis also reached more than the cut-off point since t-statistics was 2.490 with p-value being 0.025 which was less than 0.05. The dimension of choice t-statistics was 10.824 at the p-value less than 0.000 between choice ← relationships, whereas collaboration was 12.687 which was also significant at the p-value level less than 0.000 between collaboration ← relationships. The association between communication ← relationships was 2.204 with a p-value 0.43, and the critical-thinking ← relationship association t-statistics was 6.196 with a p-value 0.000. In the last dimension association between creativity ← relationship the t-statistics was 2.217 at the p-value 0.040, which identified the path relation as significant. Nevertheless, the second-order indication between construct and all dimensions reached by t-statistics achieved a significant level of the p-value less than 0.05. The prediction through literature as a deductive approach was justified. The structural equation model (SEM) in Figure 4 shows the value of R2 explored.

R-Square (r2)

The value of r2 was 0.736, which was almost 74%, and indicated that the endogenous variable of learning satisfaction was influenced by predictor variables of research-based techniques and relationship factors. The remaining 26% was influenced by other predictor variables. The second-order constructs were influenced by the measurement variables of each construct with three items being good regarding predictors of measured variables.

4. Conclusions and Recommendation

The goal of this study was to design a variance-based structural equation model that could be used to evaluate the strategies in a relationship measured by five dimensions and research approaches using Smart-PLS. A competency is a set of accepting, tools, and process management methods that are systematically performed with Smart-PLS to improve the model directly as statistically meaningful. As a result, the survey data analysis was approved with Smart-PLS to validate the strategy of factors influencing learning satisfaction explored directly by the first and second-order SEM that was statistically significant and showed positive influence by the two independent variables. Path association by the research techniques was more strongly achieved than another independent variable of relationship to learning satisfaction for students. The path coefficient beta (β) was strongly associated with learning satisfaction rather than with relationship. Therefore, students’ perceptions generated through research-based techniques rated much higher in terms of student satisfaction than relationship with teachers. However, the relationship variable was also significantly demonstrated with students’ learning satisfaction. Students enjoy research-based or analytical corresponding rather than conventional teaching techniques. Finally, it may be concluded that both independent variables were confirmed by the path analysis, where, at the very beginning, literature predicted that both independent variables have a significant and positive impact on students’ learning satisfaction. Therefore, the strategies that have been influenced through the two constructs are statistically significant toward learning satisfaction. Indeed, each dimension with three items accumulated a good number of R2 percentage value that was influenced by its measured items. Moreover, the R-squared figure designated the survey data as close-fitting of the regression line. At the final stage, the empirical data displayed with all of the parameters above were achieved and confirmed the model identified by empirical results, explained in the data analysis section, through prediction as made in the hypotheses.
Further study may suggest testing the two independent variables by covariance to confirm that both variables have a strong correlation. Presently only variance-based analysis was performed due its being a reflective model, which develops the theory through a deductive approach rather than testing the theory. The association among all of the variables was confirmed before running the final model. Nevertheless, a further study could include a large number of respondents, which would lead to confirmatory factor analysis in a formative study rather than a reflective study. The statistical technique may adapt to the covariance-based approach to justify the second-order dimensions, which might confirm the constructs and dimensions as well.

Author Contributions

Conceptualization, M.M.M. and N.M.Z.; methodology, N.M.Z., K.M.A.I. and V.N.; software, M.M.M. and N.M.Z.; validation, N.M.Z. and K.M.A.I.; formal analysis, N.M.Z., V.N. and T.M.; investigation, M.M.M., T.M. and V.N.; resources, M.M.M., T.M. and I.M.; data curation, K.M.A.I., T.M. and I.M.; writing—original draft preparation, M.M.M., K.M.A.I. and I.M.; writing—review and editing, N.M.Z. and V.N.; visualization, N.M.Z. and K.M.A.I.; supervision, V.N. All authors have read and agreed to the published version of the manuscript.

Funding

This research received no external funding.

Institutional Review Board Statement

Not applicable.

Informed Consent Statement

Not applicable.

Data Availability Statement

Data sharing is not applicable.

Conflicts of Interest

The authors declare no conflict of interest.

References

  1. Murugesan, V. Modern teaching techniques in education. JASC J. Appl. Sci. Comput. 2019, 6, 2588–2595. [Google Scholar]
  2. Walczak, P. Importance of Teaching Philosophy and Ethics in the Light of the Challenges of Future Education. Future Human Image 2020, 14, 102–107. [Google Scholar] [CrossRef]
  3. Abugohar, M.A.; Yunus, K.; Rashid, R.A. Smartphone applications as a teaching technique for enhancing tertiary learners’ speaking skills: Perceptions and practices. Int. J. Emerg. Technol. Learn. 2019, 14, 74–92. [Google Scholar] [CrossRef]
  4. Lu, X.; Ma, B. Analysis of «Dual System» Talent Training Model from the Perspective of Legal Education Reform in the New Era. Ukr. Policymaker 2021, 9, 29–37. [Google Scholar] [CrossRef]
  5. Rudenko, S.; Bazaluk, O.; Tsvykh, V.; Kalmuk, I. The Role of Philosophical Disciplines in Educational Strategies for Specialist Training in the Field of Public Administration. Nauk. Visnyk Natsionalnoho Hirnychoho Universytetu 2019, 3, 158–163. [Google Scholar] [CrossRef]
  6. Tian, S. Improving the vocational education based Japanese teaching research approach using deep learning techniques. Curr. Psychol. 2020, 107, 2411–2502. [Google Scholar] [CrossRef]
  7. Rudenko, S.; Sapeńko, R.; Bazaluk, O.; Tytarenko, V. Management Features of International Educational Projects Between Universities of Poland and Ukraine. Nauk. Visnyk Natsionalnoho Hirnychoho Universytetu 2018, 2, 142–147. [Google Scholar] [CrossRef]
  8. Bazaluk, O.; Fatkhutdinov, V.; Svyrydenko, D. The Potential of Systematization of the Theories of Education for Solving of Contradictions of Ukrainian Higher Education Development. Studia Warm. 2018, 55, 63–79. [Google Scholar] [CrossRef]
  9. Fox, D.S. Research-based instructional strategies in the classroom: The missing link in the school improvement process. Adv. Educ. Adm. 2014, 21, 93–114. [Google Scholar]
  10. Kucher, A.; Mendrukh, Y.; Khodakevich, O.; Dybkova, L. Management of formation of communicative competence of the future economists: Case study of Ukraine. TEM J. 2019, 8, 1127–1136. [Google Scholar] [CrossRef]
  11. Levchuk, O.; Levchuk, K.; Husak, L. Scientific and educational consortium as institutional projection of the innovative professional training. Nauk. Visnyk Natsionalnoho Hirnychoho Universytetu 2022, 2, 148–153. [Google Scholar] [CrossRef]
  12. Litvinova, M.B.; Dudchenko, O.M.; Shtanko, O.D. Application of logistic concept for the organization of small academic groups training in higher education institutions. Nauk. Visnyk Natsionalnoho Hirnychoho Universytetu 2022, 2, 174–179. [Google Scholar] [CrossRef]
  13. Bilan, Y.; Nitsenko, V.; Ushkarenko, I.; Chmut, A.; Sharapa, O. Outsourcing in international economic relations. Montenegrin J. Econ. 2017, 13, 175–185. [Google Scholar] [CrossRef]
  14. Gillian, E.; Lew, R. Incorporating research-based teaching techniques in E-learning to teach english articles. 3L Lang. Linguist. Lit. 2018, 24, 16–28. [Google Scholar] [CrossRef]
  15. Kholiavko, N.; Popova, L.; Marych, M.; Hanzhurenko, I.; Koliadenko, S.; Nitsenko, V. Comprehensive methodological approach to estimating the research component influence on the information economy development. Nauk. Visnyk Natsionalnoho Hirnychoho Universytetu 2020, 4, 192–199. [Google Scholar] [CrossRef]
  16. Zhukova, O.; Platash, L.; Tymchuk, L. Inclusive Education as a Tool For Implementing the Sustainable Development Goals on the Basis of Humanization of Society. Probl. Ekorozw. 2022, 17, 114–122. [Google Scholar] [CrossRef]
  17. Iqbal, M.M.; Mia, M.M. Strategy of Sustainability: A Reflective Model Validation by AMOS. Acad. Strateg. Manag. J. 2021, 20, 1–12. [Google Scholar]
  18. Purohit, A. The Challenges before Higher Education for the Composite Growth of a Sustainable Society. Probl. Ekorozw. 2021, 16, 192–198. [Google Scholar] [CrossRef]
  19. Henseler, J.; Hubona, G.; Ray, P.A. Using PLS path modeling in new technology research: Updated guidelines. Ind. Manag. Data Syst. 2016, 116, 2–20. [Google Scholar] [CrossRef]
  20. Tobi, H.; Kampen, J.K. Research design: The methodology for interdisciplinary research framework. Qual. Quant. 2018, 52, 1209–1225. [Google Scholar] [CrossRef] [Green Version]
  21. Ingram, K.; Nitsenko, V. Comparative analysis of public management models. Nauk. Visnyk Natsionalnoho Hirnychoho Universytetu 2021, 4, 122–127. [Google Scholar] [CrossRef]
  22. Fincham, D.; Schickerling, J.; Temane, M.; Nel, D.; De Roover, W.; Seedat, S. Exploratory and confirmatory factor analysis of the multidimensional anxiety scale for children among adolescents in the Cape Town metropole of South Africa. Depress. Anxiety 2008, 25, 1–17. [Google Scholar] [CrossRef] [PubMed]
  23. Mia, M.M.; Majri, Y.; Rahman, I.K.A. The Impact of Soft TQM Practices on Organizational Enactment: A Mediating Role of OHSAS18001 Standard. Int. J. Soc. Sci. Perspect. 2019, 4, 1–11. [Google Scholar] [CrossRef]
  24. Osborne, J.W.; Fitzpatrick, D.C. Replication Analysis in Exploratory Factor Analysis: What it is and why it makes your analysis better. Pract. Assess. Res. Eval. 2012, 17, 1–8. [Google Scholar]
  25. Revin, F. The Shifting Image of Social Capital: Digitizing Cooperative Ties. Future Hum. Image 2021, 16, 75–82. [Google Scholar] [CrossRef]
  26. Hair, J.F.; Black, W.C.; Babin, B.J.; Anderson, R. Factor Analysis: Confirmatory Factor Analysis. In Multivariate Data Analysis, 7th ed.; Pearson: New York, NY, USA, 2010; pp. 599–606. [Google Scholar]
  27. Kamal, I.; Rahman, A.; Mia, M.M. Using Partial Least Squares Structural Equation Modeling (PLS–SEM): Mediation between Strategic Management & Performance. Int. J. Innov. Creat. Chang. 2020, 10, 392–404. [Google Scholar]
  28. Hair, J.F.; Matthews, L.M.; Matthews, R.L.; Sarstedt, M. PLS-SEM or CB-SEM: Updated guidelines on which method to use. Int. J. Multivar. Data Anal. 2017, 1, 107–123. [Google Scholar] [CrossRef]
  29. Henseler, J.; Ringle, C.M.; Sinkovics, R.R. The use of partial least squares path modeling in international marketing. Adv. Int. Mark. 2009, 20, 277–319. [Google Scholar]
  30. Hair, J.; Hult, G.T.M.; Ringle, C.M.; Sarstedt, M. A Primer on Partial Least Squares Structural Equation Modeling (PLS-SEM), 2rd ed.; SAGE Publications, Inc.: New York, NY, USA, 2017. [Google Scholar]
  31. Kroonenberg, P.M.; Lohmoller, J.-B. Latent Variable Path Modeling with Partial Least Squares. J. Am. Stat. Assoc. 1990, 85, 909–910. [Google Scholar] [CrossRef]
  32. Tanasiichuk, A.; Hromova, O.; Kovalchuk, S.; Perevozova, I.; Khmelevskyi, O. Scientific and methodological approaches to the evaluation of marketing management of enterprises in the context of international diversification. Eur. J. Sustain. Dev. 2020, 9, 349. [Google Scholar] [CrossRef]
  33. Cohen, J. Statistical power analysis for the behavioral sciences. In Hillsdale, 2nd ed.; L. Erlbaum Associates: Mahwah, NJ, USA, 1988; pp. 215–252. [Google Scholar]
  34. Iqbal, M.M.; Mia, M.M. The strategy of management system standards: A variance-based structural equation modeling (VB-SEM). Int. J. Adv. Sci. Technol. 2020, 29, 1882–1893. [Google Scholar]
  35. Amora, J.T. Convergent validity assessment in PLS-SEM: A loadings-driven approach. Data Anal. Perspect. J. 2021, 2, 1–6. [Google Scholar]
  36. Henseler, J.; Ringle, C.M.; Sarstedt, M. A new criterion for assessing discriminant validity in variance-based structural equation modeling. J. Acad. Mark. Sci. 2015, 43, 115–135. [Google Scholar] [CrossRef] [Green Version]
  37. Reynaldo, J.A.; Santos, A. Cronbach’s alpha: A tool for assessing the reliability of scales. J. Ext. 1999, 37, 1–5. [Google Scholar]
  38. Oleksiyenko, A.; Terepyshchyi, S.; Gomilko, O.; Svyrydenko, D. ‘What Do You Mean, You Are a Refugee in Your Own Country?’: Displaced Scholars and Identities in Embattled Ukraine. Eur. J. High Educ. 2020, 11, 101–118. [Google Scholar] [CrossRef]
  39. Dovgyi, S.; Nebrat, V.; Svyrydenko, D.; Babiichuk, S. Science education in the age of Industry 4.0: Challenges to economic development and human capital growth in Ukraine. Nauk. Visnyk Natsionalnoho Hirnychoho Universytetu 2020, 1, 146–151. [Google Scholar] [CrossRef]
  40. Ringle, C.M.; Wende, S.; Becker, J.-M. “SmartPLS 3.” Boenningstedt: SmartPLS GmbH. 2015. Available online: http://www.smartpls.com (accessed on 29 June 2022).
Figure 1. Conceptual Framework [6,11,12].
Inventions 07 00059 g001
Figure 2. Path (correlation) Coefficient of PLS algorithm. Source: Empirical data analysis by Smart PLS.
Inventions 07 00059 g002
Figure 3. Cronbach’s Alpha of Constructs. Source: Empirical data analysis by Smart PLS.
Inventions 07 00059 g003
Figure 4. PLS-SEM Hypothesized Model using Bootstrapping. Source: Empirical data analysis by Smart PLS.
Inventions 07 00059 g004
Table 1. Rotated Component Matrix with KMO & Bartlett’s Test and Cronbach’s Alpha (α).
Item AlphaComponents
(α)1234567
ch10.780.62
ch20.710.85
ch30.750.78
col10.82 0.75
col20.80 0.84
col30.83 0.81
com10.84 0.85
com20.80 0.82
com30.87 0.80
cr10.90 0.76
cr20.86 0.86
cr30.87 0.84
ct10.78 0.76
ct20.72 0.86
ct30.78 0.84
ls10.89 0.82
ls20.82 0.88
ls30.85 0.79
rt10.80 0.75
rt20.77 0.82
rt30.77 0.78
Kaiser-Meyer-Olkin Measure of Sampling Adequacy.
Bartlett’s Test of Approx. Chi-Square
Sphericity df
Sig.
0.843
13,590.179
210
0.000
Note: Extraction Method: Principal Component Analysis (PCA). Rotation Method: Varimax with Kaiser Normalization.
Table 2. Construct Reliability and Validity.
ConstructsCronbach’s Alpharho_AComposite ReliabilityAverage Variance Extracted (AVE)
Choice 0.820.820.890.74
Collaboration 0.860.870.920.80
Communication 0.880.890.930.81
Critical thinking 0.830.840.900.75
Creativity 0.910.920.950.85
Relationship0.870.880.890.35
Research techniques 0.840.860.910.76
Learning satisfaction 0.900.900.940.83
Source: Empirical data analysis by Smart PLS.
Table 3. Fornell-Larcker Criterion.
Constructs12345678
Learning satisfaction (1)0.912
Relationship (2)0.6150.594
Research techniques (3)0.8380.5510.873
Choice (4)0.4660.7650.3630.857
Collaboration (5)0.3960.7880.3990.6240.890
Communication (6)0.5250.6640.4440.3220.3180.902
Creativity (7)0.3150.4510.2530.2070.1640.2080.924
Critical thinking (8)0.3500.6480.3730.3000.3900.3410.1740.865
Source: Empirical data analysis by Smart PLS.
Table 4. Heterotrait-Monotrait Ratio (HTMT).
Constructs12345678
Learning satisfaction (1)-
Relationship (2)0.700
Research techniques (3)0.9540.637
Choice (4)0.5430.8660.426
Collaboration (5)0.4500.8590.4680.737
Communication (6)0.5870.7530.5100.3760.360
Creativity (7)0.3460.6020.2750.2390.1800.226
Critical thinking (8)0.4030.7730.4440.3590.4560.3960.199-
Source: Empirical data analysis by Smart PLS.
Table 5. Path Coefficients.
HypothesesConstructst-Statisticsp-ValuesRemark
H1Research techniques → for learning satisfaction12.2870.000accepted
H2Relationship → learning satisfaction2.4900.025accepted
Second-order constructs Choice ← relationship 10.8240.000accepted
Collaboration ← relationship 12.6870.000accepted
Communication ← relationship 2.2040.043accepted
Creativity ← relationship 2.2170.040accepted
Critical-thinking ← relationship6.1960.000accepted
Source: Empirical data analysis by Smart PLS.
Publisher’s Note: MDPI stays neutral with regard to jurisdictional claims in published maps and institutional affiliations.

