Article

Image Moment-Based Features for Mass Detection in Breast US Images via Machine Learning and Neural Network Classification Models

by
Iulia-Nela Anghelache Nastase
1,2,
Simona Moldovanu
1,3 and
Luminita Moraru
1,4,*
1
The Modelling & Simulation Laboratory, Dunarea de Jos University of Galati, 47 Domneasca Street, 800008 Galati, Romania
2
Emil Racovita Theoretical Highschool, 12–14, Regiment 11 Siret Street, 800332 Galati, Romania
3
Department of Computer Science and Information Technology, Faculty of Automation, Computers, Electrical Engineering and Electronics, Dunarea de Jos University of Galati, 47 Domneasca Street, 800008 Galati, Romania
4
Department of Chemistry, Physics & Environment, Faculty of Sciences and Environment, Dunarea de Jos University of Galati, 47 Domneasca Street, 800008 Galati, Romania
*
Author to whom correspondence should be addressed.
Inventions 2022, 7(2), 42; https://doi.org/10.3390/inventions7020042
Submission received: 3 May 2022 / Revised: 8 June 2022 / Accepted: 14 June 2022 / Published: 15 June 2022

Abstract

:
Differentiating between malignant and benign masses using machine learning in the recognition of breast ultrasound (BUS) images is a technique with good accuracy and precision, which helps doctors make a correct diagnosis. The method proposed in this paper integrates Hu’s moments in the analysis of the breast tumor. The extracted features feed a k-nearest neighbor (k-NN) classifier and a radial basis function neural network (RBFNN) to classify breast tumors into benign and malignant. The raw images and the tumor masks provided as ground-truth images belong to the public digital BUS images database. Certain metrics such as accuracy, sensitivity, precision, and F1-score were used to evaluate the segmentation results and to select Hu’s moments showing the best capacity to discriminate between malignant and benign breast tissues in BUS images. Regarding the selection of Hu’s moments, the k-NN classifier reached 85% accuracy for moment M1 and 80% for moment M5 whilst RBFNN reached an accuracy of 76% for M1. The proposed method might be used to assist the clinical diagnosis of breast cancer identification by providing a good combination between segmentation and Hu’s moments.

1. Introduction

Breast cancer is one of the most common and serious diseases that poses a threat to women’s health. According to [1], the female breast cancer (around 2.3 million new cases, which means 11.7% of the total cancer cases in women, and 6.9% of all cancer-related deaths in women, in 2020) and lung cancer (11.4% of the total cancer cases in women and 18% of the cancer-related deaths in women) are the types of cancer with the highest incidence. Breast cancer begins as an uncontrolled multiplication of breast cells which proliferate in the breast tissues. They can be classified as benign (some abnormality of the breast tissues but they do not threaten the patient’s life) and malignant (might affect the patient’s life).
Breast cancer is examined and investigated through many techniques such as computerized tomography, histopathological imaging, magnetic resonance imaging, mammography, and breast ultrasound (BUS). The BUS is a preferred tool for early breast cancer screening due to the significant amount of information provided in a short time [2]. Breast ultrasound imaging is most suitable for the early detection of breast cancer as it is noninvasive and nonradioactive, resulting in a direct, cost-effective improvement in patient care. Furthermore, breast ultrasound imaging is a practical and feasible approach for the early detection of breast cancer. Early diagnosis based on ultrasound can significantly improve the cure rate. However, the BUS images have poor resolution, show various features, and contain speckle noise. Moreover, to read these images, a high degree of professionalism is required for radiologists to overcome the subjectivity of the analysis.
Techniques that belong to the computer-aided diagnosis and deep learning fields can bring advances in this area and provide more accurate judgment for the clinical diagnosis of breast cancer [3,4,5,6]. Automatic segmentation of breast ultrasound images (as a method to delineate anomalies containing suspicious regions of interest) and extraction of the image features devoted to describing the tumor shape, size, and texture provide valuable references on classification for a much-improved clinical diagnosis of breast cancer [7,8,9,10,11]. Furthermore, the best features are then input into a classifier to establish the category of the tumors, followed by an evaluation of the accuracy of the method [12]. The accuracy of the image segmentation directly influences the performance of both feature extraction and classification of the tumors. Even though segmentation is a fundamental task in medical image analysis, the segmentation of BUS images is difficult because (i) BUS images are affected by speckle noise, show low contrast, show low peak signal-to-noise ratio, and contain speckle artefacts that are tissue-dependent, and (ii) a large variability among patients exists related to the breast anatomical structures. Moreover, to evaluate the segmentation performance, the ground-truth images are generated by using a manually delineated boundary.
This paper uses a machine learning- and deep learning-based system to assist doctors in making a more accurate judgment in classifying breast tumors as benign or malignant using BUS images. To test our classification strategy, we propose a method that integrates Hu’s moments in the breast tumor analysis as handcrafted and meaningful features [13]. Our method uses the tumor masks provided as ground-truth images in a publicly available BUSI image dataset (Breast Ultrasound Images Dataset (BUSI dataset) https://academictorrents.com/details/d0b7b7ae40610bbeaea385aeb51658f527c86a16, accessed on 1 December 2021). Hu’s moments provide attributes that are related to the shape of the tumors regardless of scale, location, and orientation. They are used for the extraction of the shape characteristics from the BUS images. However, Hu’s moments incorporate redundant information, and it is necessary to investigate the significance of the diagnosis difference by utilizing different shape features. We performed a statistical test (t-test, p-value) for testing the differentiation between benign and malignant tumors in the analyzed BUS images according to Hu’s moments [14]. The t-test (p < 0.05 or 95% confidence interval) is much simpler to apply and provides a quick response if the analyzed features are meaningful for the classification or less relevant. Furthermore, the remaining features are used to train a k-NN classifier for classification purposes. The k-NN technique uses learning processes based on instance [6] to identify the group’s membership by exploiting the feature similarity [15]. Moreover, the same selected features are fed into the radial basis function neural network (RBFNN), which allows discriminating between benign and malignant tumors with the highest accuracy. Multiclassification aids gathering the precise information about the cancer’s current state and, equally, supports the informed diagnosis decision [16].
The remainder of the paper is organized as follows: Section 2 discusses related studies from the literature; Section 3 presents the proposed work, as well as a concise overview of the proposed method; Section 4 discusses the experimental results obtained by employing the proposed method, as well as its performance evaluation; finally, Section 5 concludes and discusses potential future work.

2. Related Work

Many decision-support technologies based on machine learning and deep learning have been included into experimental investigations devoted to the diagnosis of various kinds of tumors, including breast tumors.
A comparative analysis of watershed, mean shift, and k-means segmentation algorithms to detect microcalcifications on breast images belonging to the MIAS database was reported in [17]. The best results were obtained by using k-means segmentation, which detected 42.8% of breast images correctly and had 57.2% false detections.
Zhang et al. [18] introduced the Hu moment invariant as a feature descriptor to diagnose breast cancer. They used k-fold cross-validation to improve the accuracy of the proposed method and to reduce the difficulty of diagnosis.
A watershed segmentation and k-NN (as a supervised learning method) classification were implemented to detect the tumors in the mammogram images and establish the risk of cancer classification [19]. The breast image classification was performed with an 83.33% overall accuracy rate.
Sadhukhan et al. [20] reported a model used to predict the best features for early breast cancer cell identification. The k-NN and support vector machine (SVM) algorithms were studied in terms of accuracy. On the basis of the contours of the cells, the nuclei were distinctly separated, and an accuracy of 97.49% was determined.
Hao et al. [21] used three-channel features of 10 descriptors to improve the accuracy of benign and malignant breast cancer recognition. An SVM algorithm was used to assess the model’s performance. A recognition accuracy of 90.2–94.97% at the image level was reported for the model based on texture features, geometric moments, and wavelet decomposition.
Another study [22] proposed a model which used three-channel features of 10 descriptors for the recognition of breast cancer histopathological images, as well as an SVM to improve the classification of benign and malignant breast cancer. The proposed model showed an increase in the recognition time and little improvement in the recognition accuracy.
Joshi and Mehta [23] analyzed the diagnosis accuracy of the k-NN algorithm using a set of 32 features and with and without dimensionality reduction techniques. The reported results showed 97.06% accuracy for benign vs. malignant classification using k-NN with the linear discriminant analysis technique.
Alshammari et al. [24] extracted intensity-based features (such as average intensity, standard deviation, and contrast between the foreground and background), shape-based features (i.e., diameter, length, degree of circulation, and elongation), or texture-based features for classification purpose. The decision tree, k-NN, SVM, naïve Bayes, and discriminant analysis algorithms were used to maximize the separation between the given groups of data and to produce higher-accuracy results.
Agaba et al. [25] used some handcrafted features such as Hu’s moment, Haralick textures, color histogram, and a deep neural network for a multiclassification task devoted to breast cancer classification using histopathological images on the BreakHis dataset. They also used various enlargements for histopathological images analysis. An accuracy score of 97.87% was reported for 40× magnification.
Xie et al. [26] used a combination of SVM and extreme learning machine (ELM) to differentiate between malignant and benign masses in mammographic images. The proposed algorithm included mass segmentation based on the level set method, feature extraction, feature selection, and mass type classification. An average accuracy of 96.02% was reported.
Zhuang et al. [27] proposed a method based on multiple features and support vector machines for the diagnosis of breast tumors in ultrasound images. Their algorithm used both characteristic features and deep learning features and a support vector machine for BUS classification. Hu’s moment invariants [13] were used to investigate the characteristics of the posterior shadowing region that were different for benign and malignant tumors. The reported results were as follows: accuracy, sensitivity, specificity, and F1-score of 92.5%, 90.5%, 95%, 90.5%, and 92.7%, respectively, showing superiority to other known methods.
Deep features have played an important role in the progress of deep learning. These features are extracted from the deep convolutional layers of pretrained CNNs or custom-designed CNNs. Shia et al. [28] used transfer learning on a pretrained CNN and trained it using a BUS dataset containing 2099 images with benign and malignant tumors. An SVM with a sequential optimization solver was used for classification. A sensitivity of 94.34% and a specificity of 93.22% were reported for the classification.
Wan et al. [29] used content-based radiomic features to analyze BUS images. This study considered 895 BUS images and three radiomic features (i.e., color histogram, Haralick’s texture features, and Hu’s moments). The classification was performed using seven well-known machine learning algorithms and a CNN architecture. The best performance in differentiation between benign and malignant BUS was reported for the random forest classifier. The obtained accuracy, sensitivity, specificity, F1-score, and average precision were as follows: 90%, 71%, 100%, 83%, and 90%, respectively.
Moldovanu et al. [30] studied and classified skin lesions using a k-NN-CV algorithm and an RBF neural network. The RBF neural network classifier provided an accuracy of 95.42% in the classification of skin cancer, significantly better than the k-NN algorithm.
Damian et al. [31] used Hu’s invariant moments to determine their relevance in the differentiation between nevi and melanomas. The reported results indicated that Hu’s moments were good descriptors as they provided a good classification between malignant melanoma and benign lesions.

3. Materials and Method
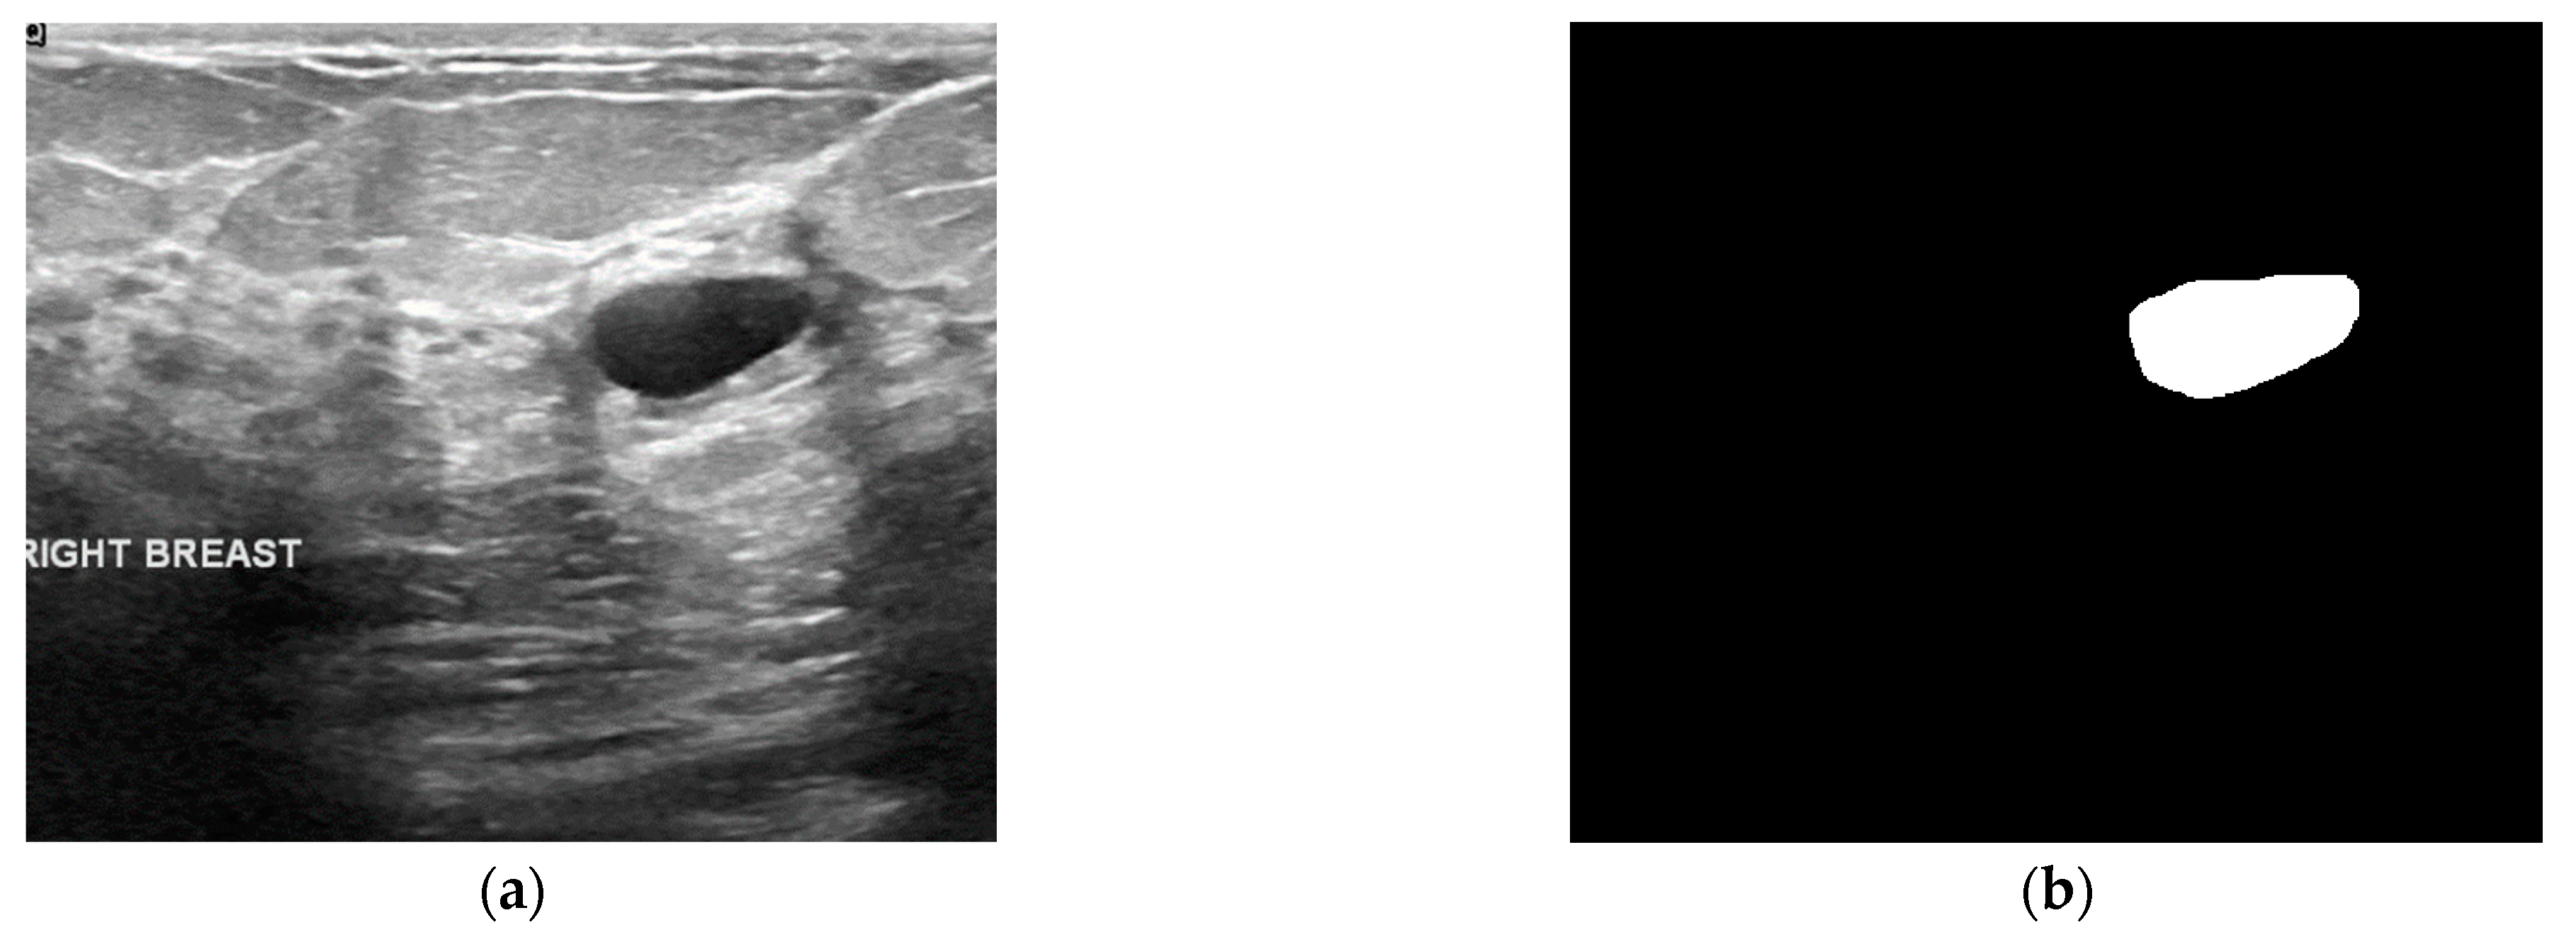
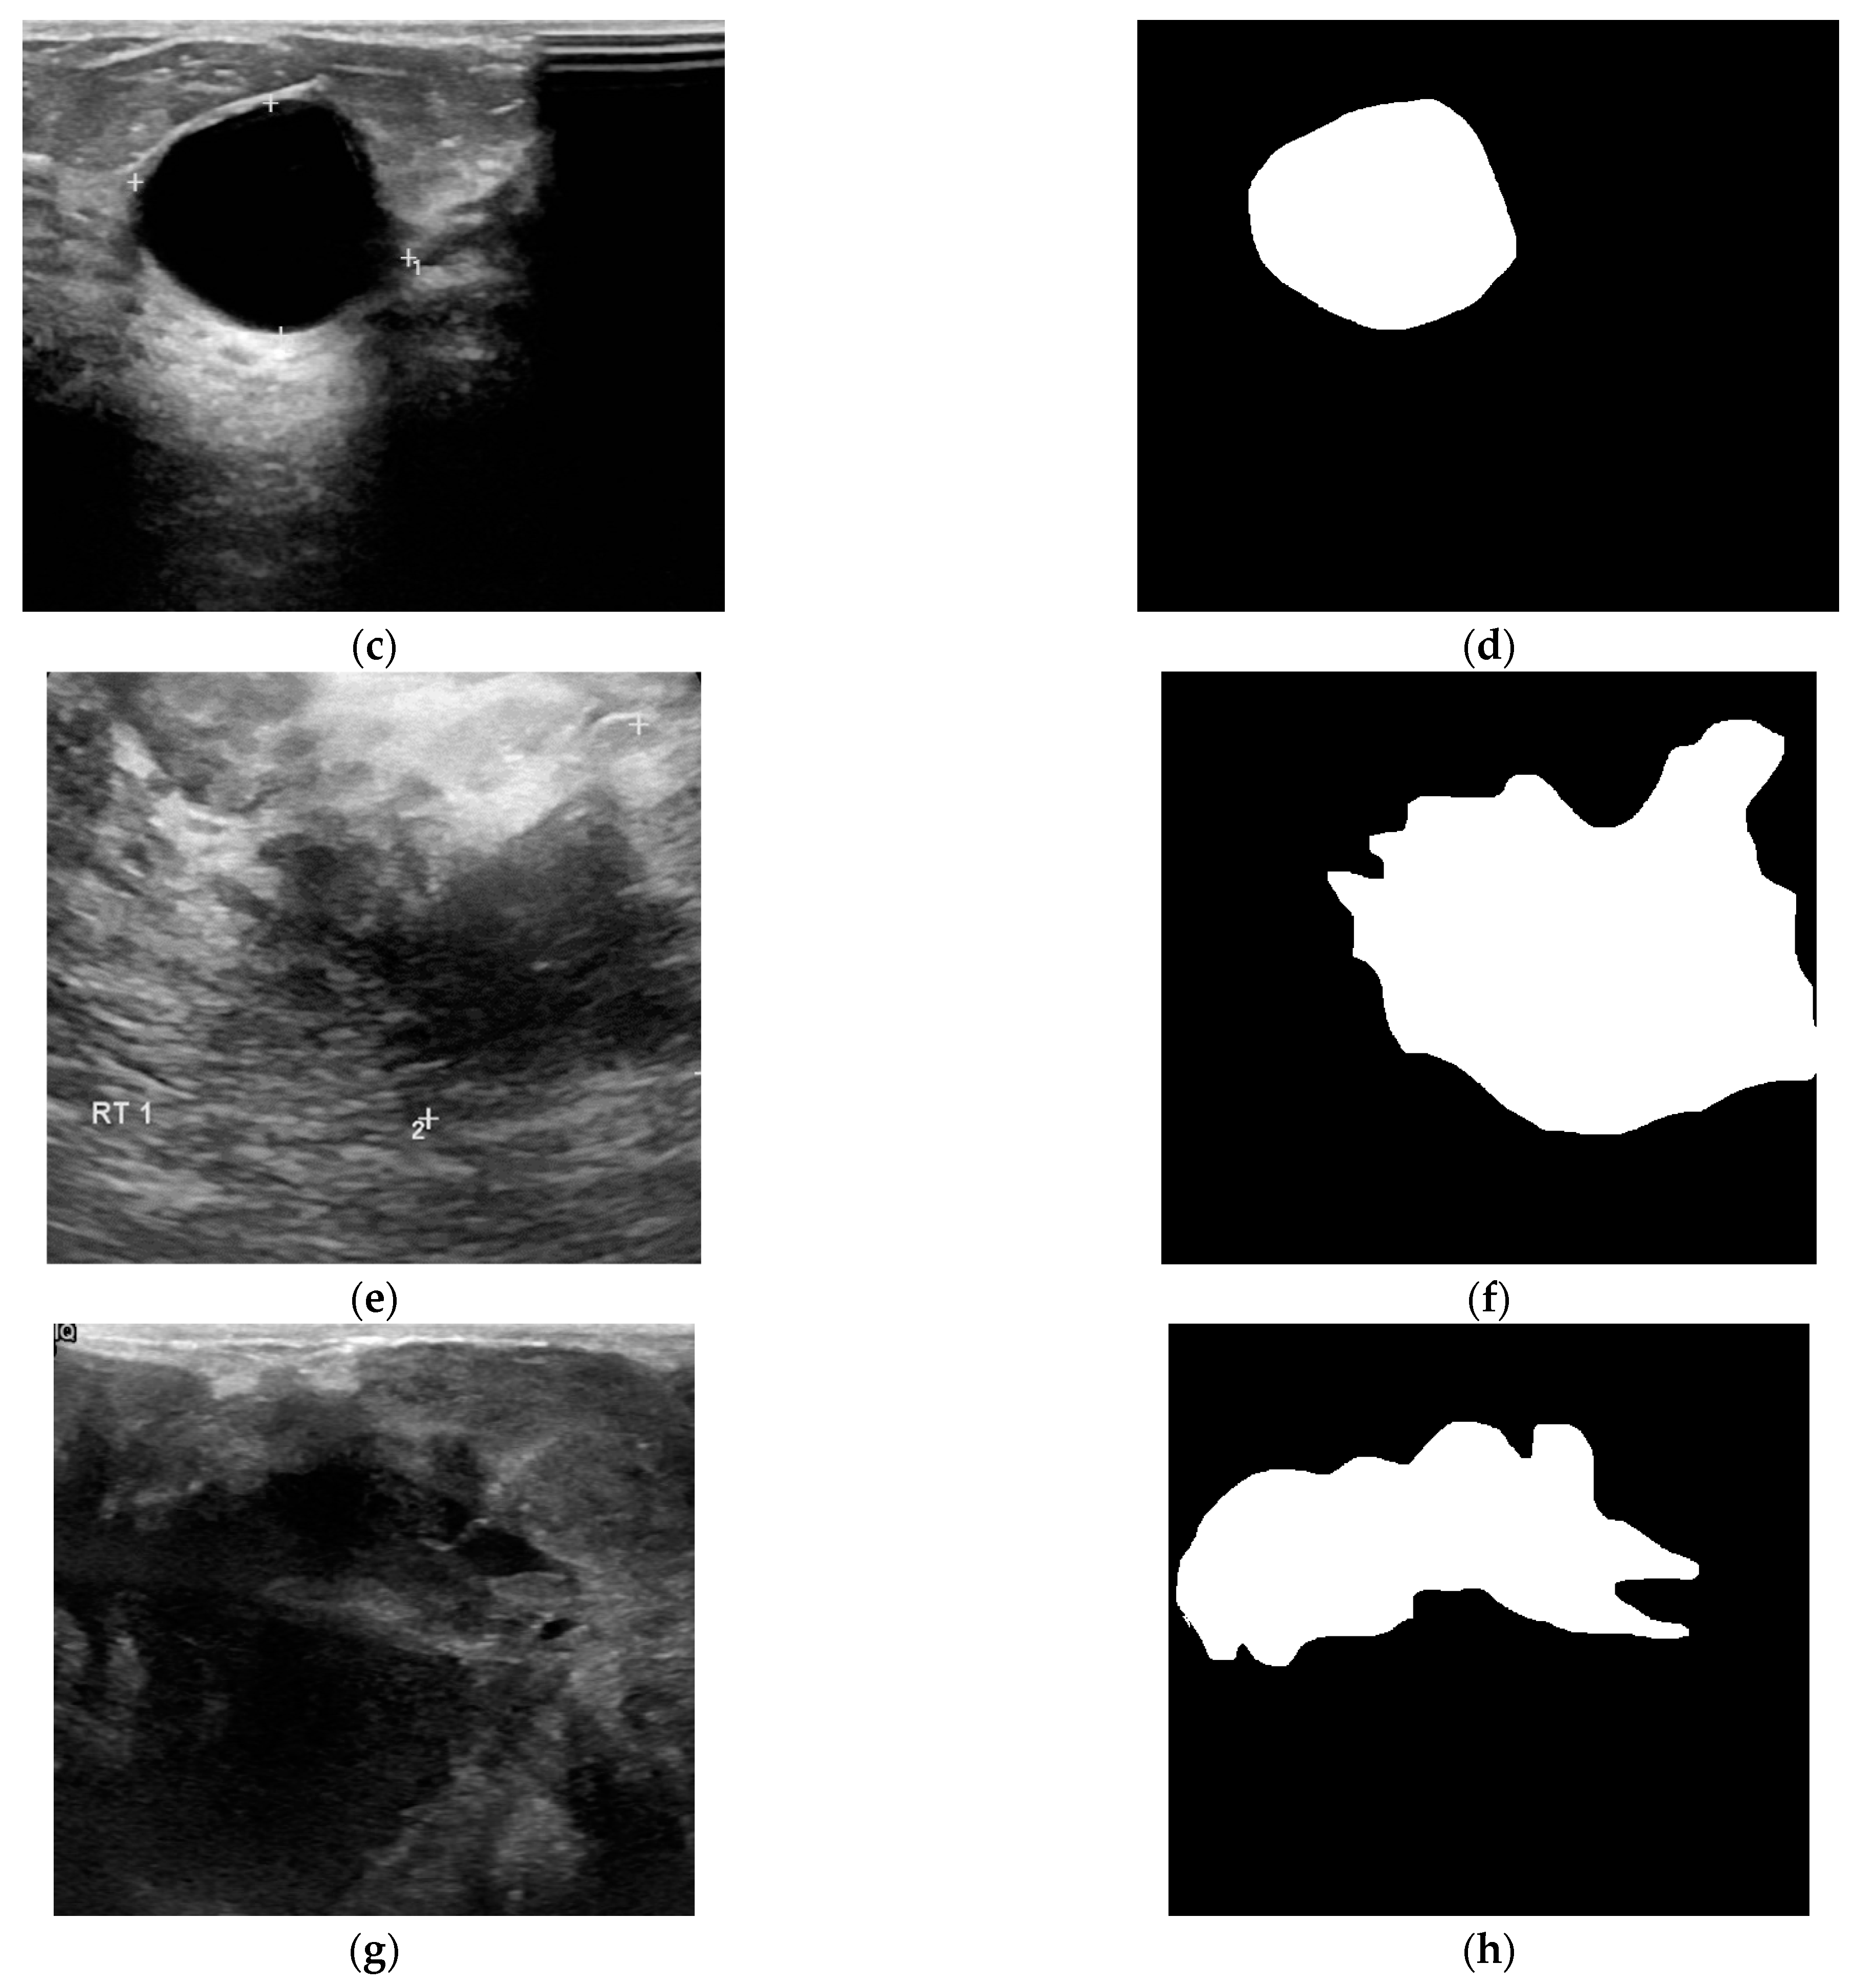
3.1. Dataset

All images used in this study belonged to the publicly available digital BUSI (breast ultrasound image) database. The images were in a PNG file format with an average image size of 500 × 500 pixels and an 8 bit gray level. The considered dataset contained 780 images classified into normal images (n = 133), images with benign lesions (n = 437), and images with malignant lesions (n = 210). The images were captured at the Baheya Hospital for Early Detection and Treatment of Women’s Cancer, Cairo, Egypt [32]. Experts of ultrasonic imaging evaluated their geometry, density, and internal echo contrast levels. Furthermore, ground-truth images were available. The ground-truth images were generated using the MATLAB programming environment and a freehand segmentation method utilized by radiologists and computer science experts (Figure 1).

3.2. Feature Extraction and Selection

The extracted features covered the shape of the breast lesions, which can be arranged in the following mathematical form:
F = [F1, F2, …, F7].
The (p + q) order of the geometric moment can be defined as follows [13]:
m p q = y = 1 N x = 1 M x p y q f ( x ,   y ) ,   p ,   q = 1 ,   2 ,   3 ,   ,
where f(x, y) is the extracted ground-truth region. The central moments are defined as
μ p q = y = 1 N x = 1 M ( x x ¯ ) p ( y y ¯ ) q f ( x ,   y ) ,   p ,   q = 1 ,   2 ,   3 ,   ,
where x ¯ = m 10 m 00 and y ¯ = m 01 m 00 represent the center-of-gravity coordinates of the image. The normalized central moment is
η p q = μ p q μ 00 ρ ,   ρ = p + q 2 + 1 .
The seven Hu moments were computed using the second- and third-order normalized central moments.
The k-nearest neighbor (k-NN) is a classifier which provides an efficient prediction model based on the closest training examples [15,33]. An object is classified by a majority vote of its neighbors, but the optimal k-value is the most sensitive factor of k-NN. To overcome this drawback, the k-NN algorithm is run many times using various k-values until the optimal value is found. The best performance provided by the validation set indicated k = 3 as the optimal value.
Not all features are useful for improving classification accuracy. In the first step, the t-test indicated which features were significant to distinguish between benign masses and malignant ones. Then, the remaining features were independently evaluated by k-NN using a fivefold cross-validation algorithm and an RBFNN. The dataset was split it into training data and test data. The concept of fivefold cross-validation indicates that the training data were randomly split into five equal parts. For each k, the mean accuracy was computed, denoting the final score of each feature. RBFNN is a neural network with a three-layer feedforward architecture (Figure 2). The input layer provides features to the hidden layer in which the nodes use Gaussian functions f1, f2, …, fn as radially symmetric functions. The output layer summarizes the number of possible output classes [30].
The RBFNN is a nonlinear and three-layer feedforward neural network. There is one unsupervised layer between input nodes and the hidden neurons and one supervised layer between the hidden neurons and output nodes. The RBFNN was trained using four folds, while one fold was used to test the classifier. The net training seeks to determine the centers of the hidden layer in a first step, followed by the computation of the weights connecting the hidden layer to the output layer. RBFNN training was carried out by determining the proper weights and biases to obtain the target output by minimizing the error function, i.e., the root-mean-square error. The training stage of the RBFNN model was terminated once the calculated error reached the goal value of 0.01, and the number of training iterations of 1000 was already completed. Ten neural networks were built by varying the number of hidden neurons from eight to 40, in steps of eight neurons, i.e., eight, 16, 24, 32, and 40 neurons. Furthermore, the spread of radial basis functions (SRBFs) was used. For each number of hidden neurons, two SRBFs (namely, 0.01 and 0.05) were established. Each network was trained until the mean squared error fell below the goal of 0.01. The SRBF of 0.01 reached the imposed goal. The goal/desired value was iteratively compared to the mean squared error. If the goal/desired value was not reached, another eight neurons were added to the structure. A total of 20 trials were run to decide the most suitable number of hidden layer neurons for effective prediction. The best results were obtained for 32 neurons in the hidden layer.

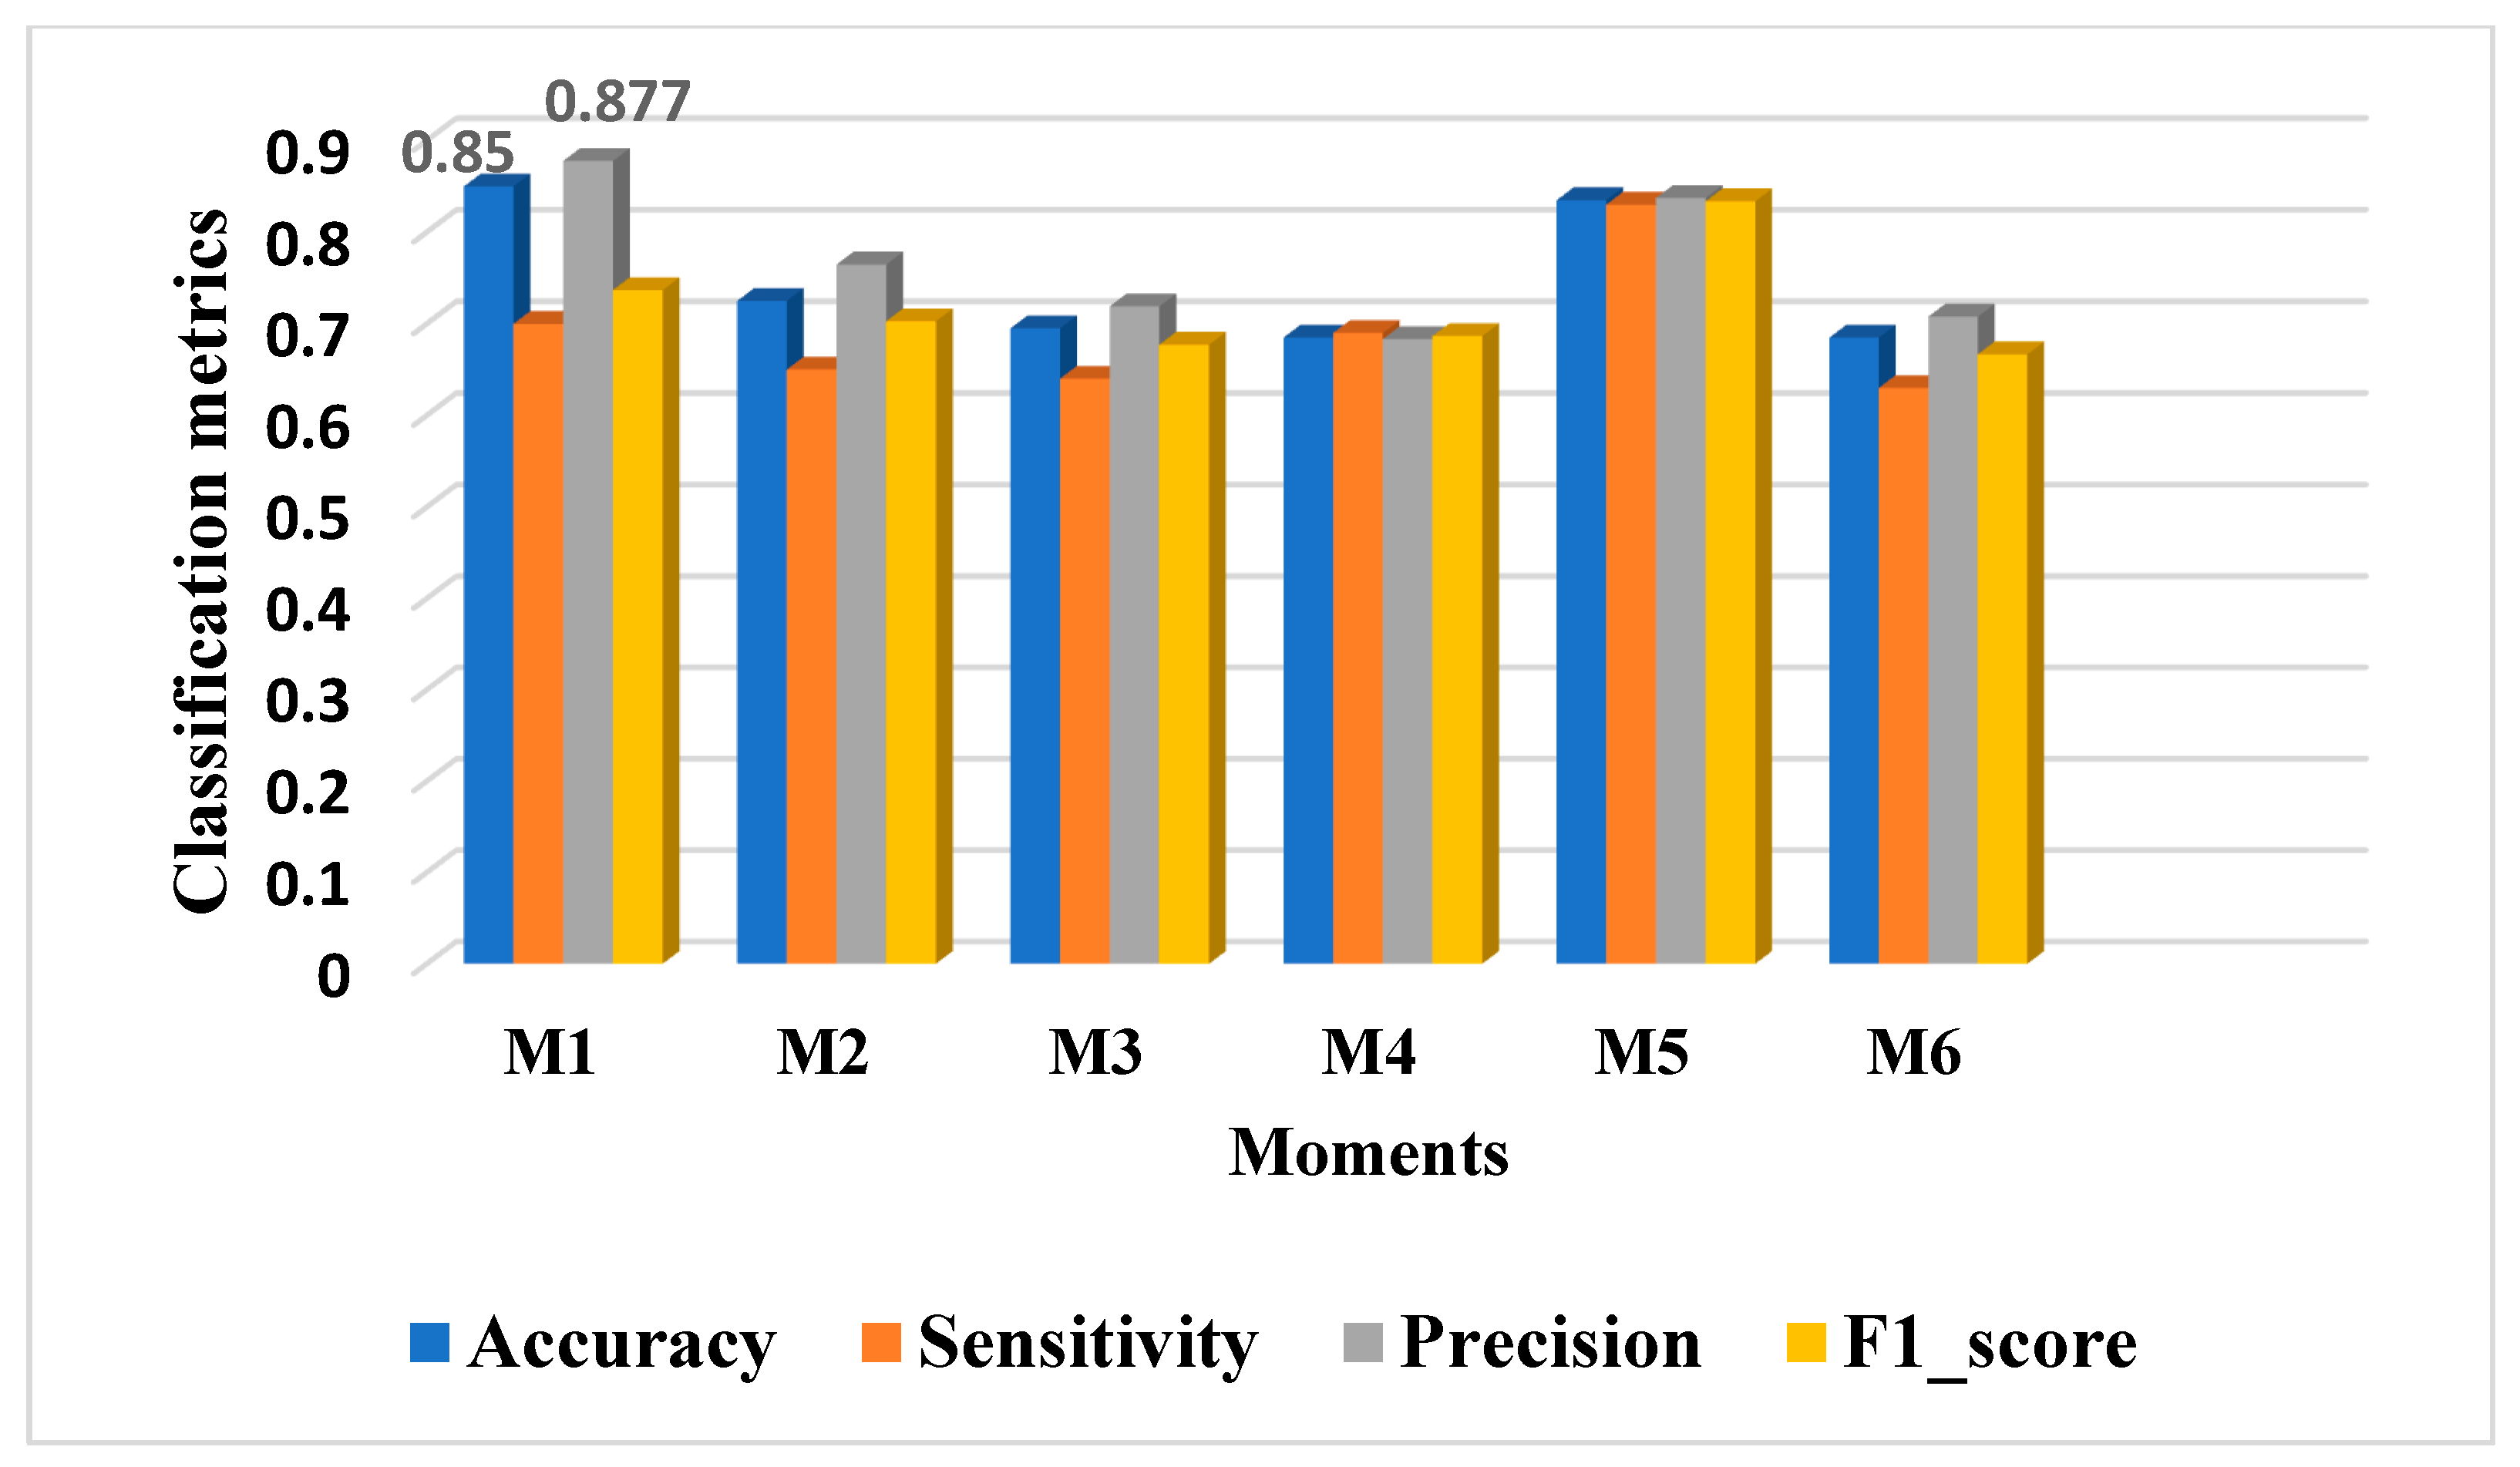
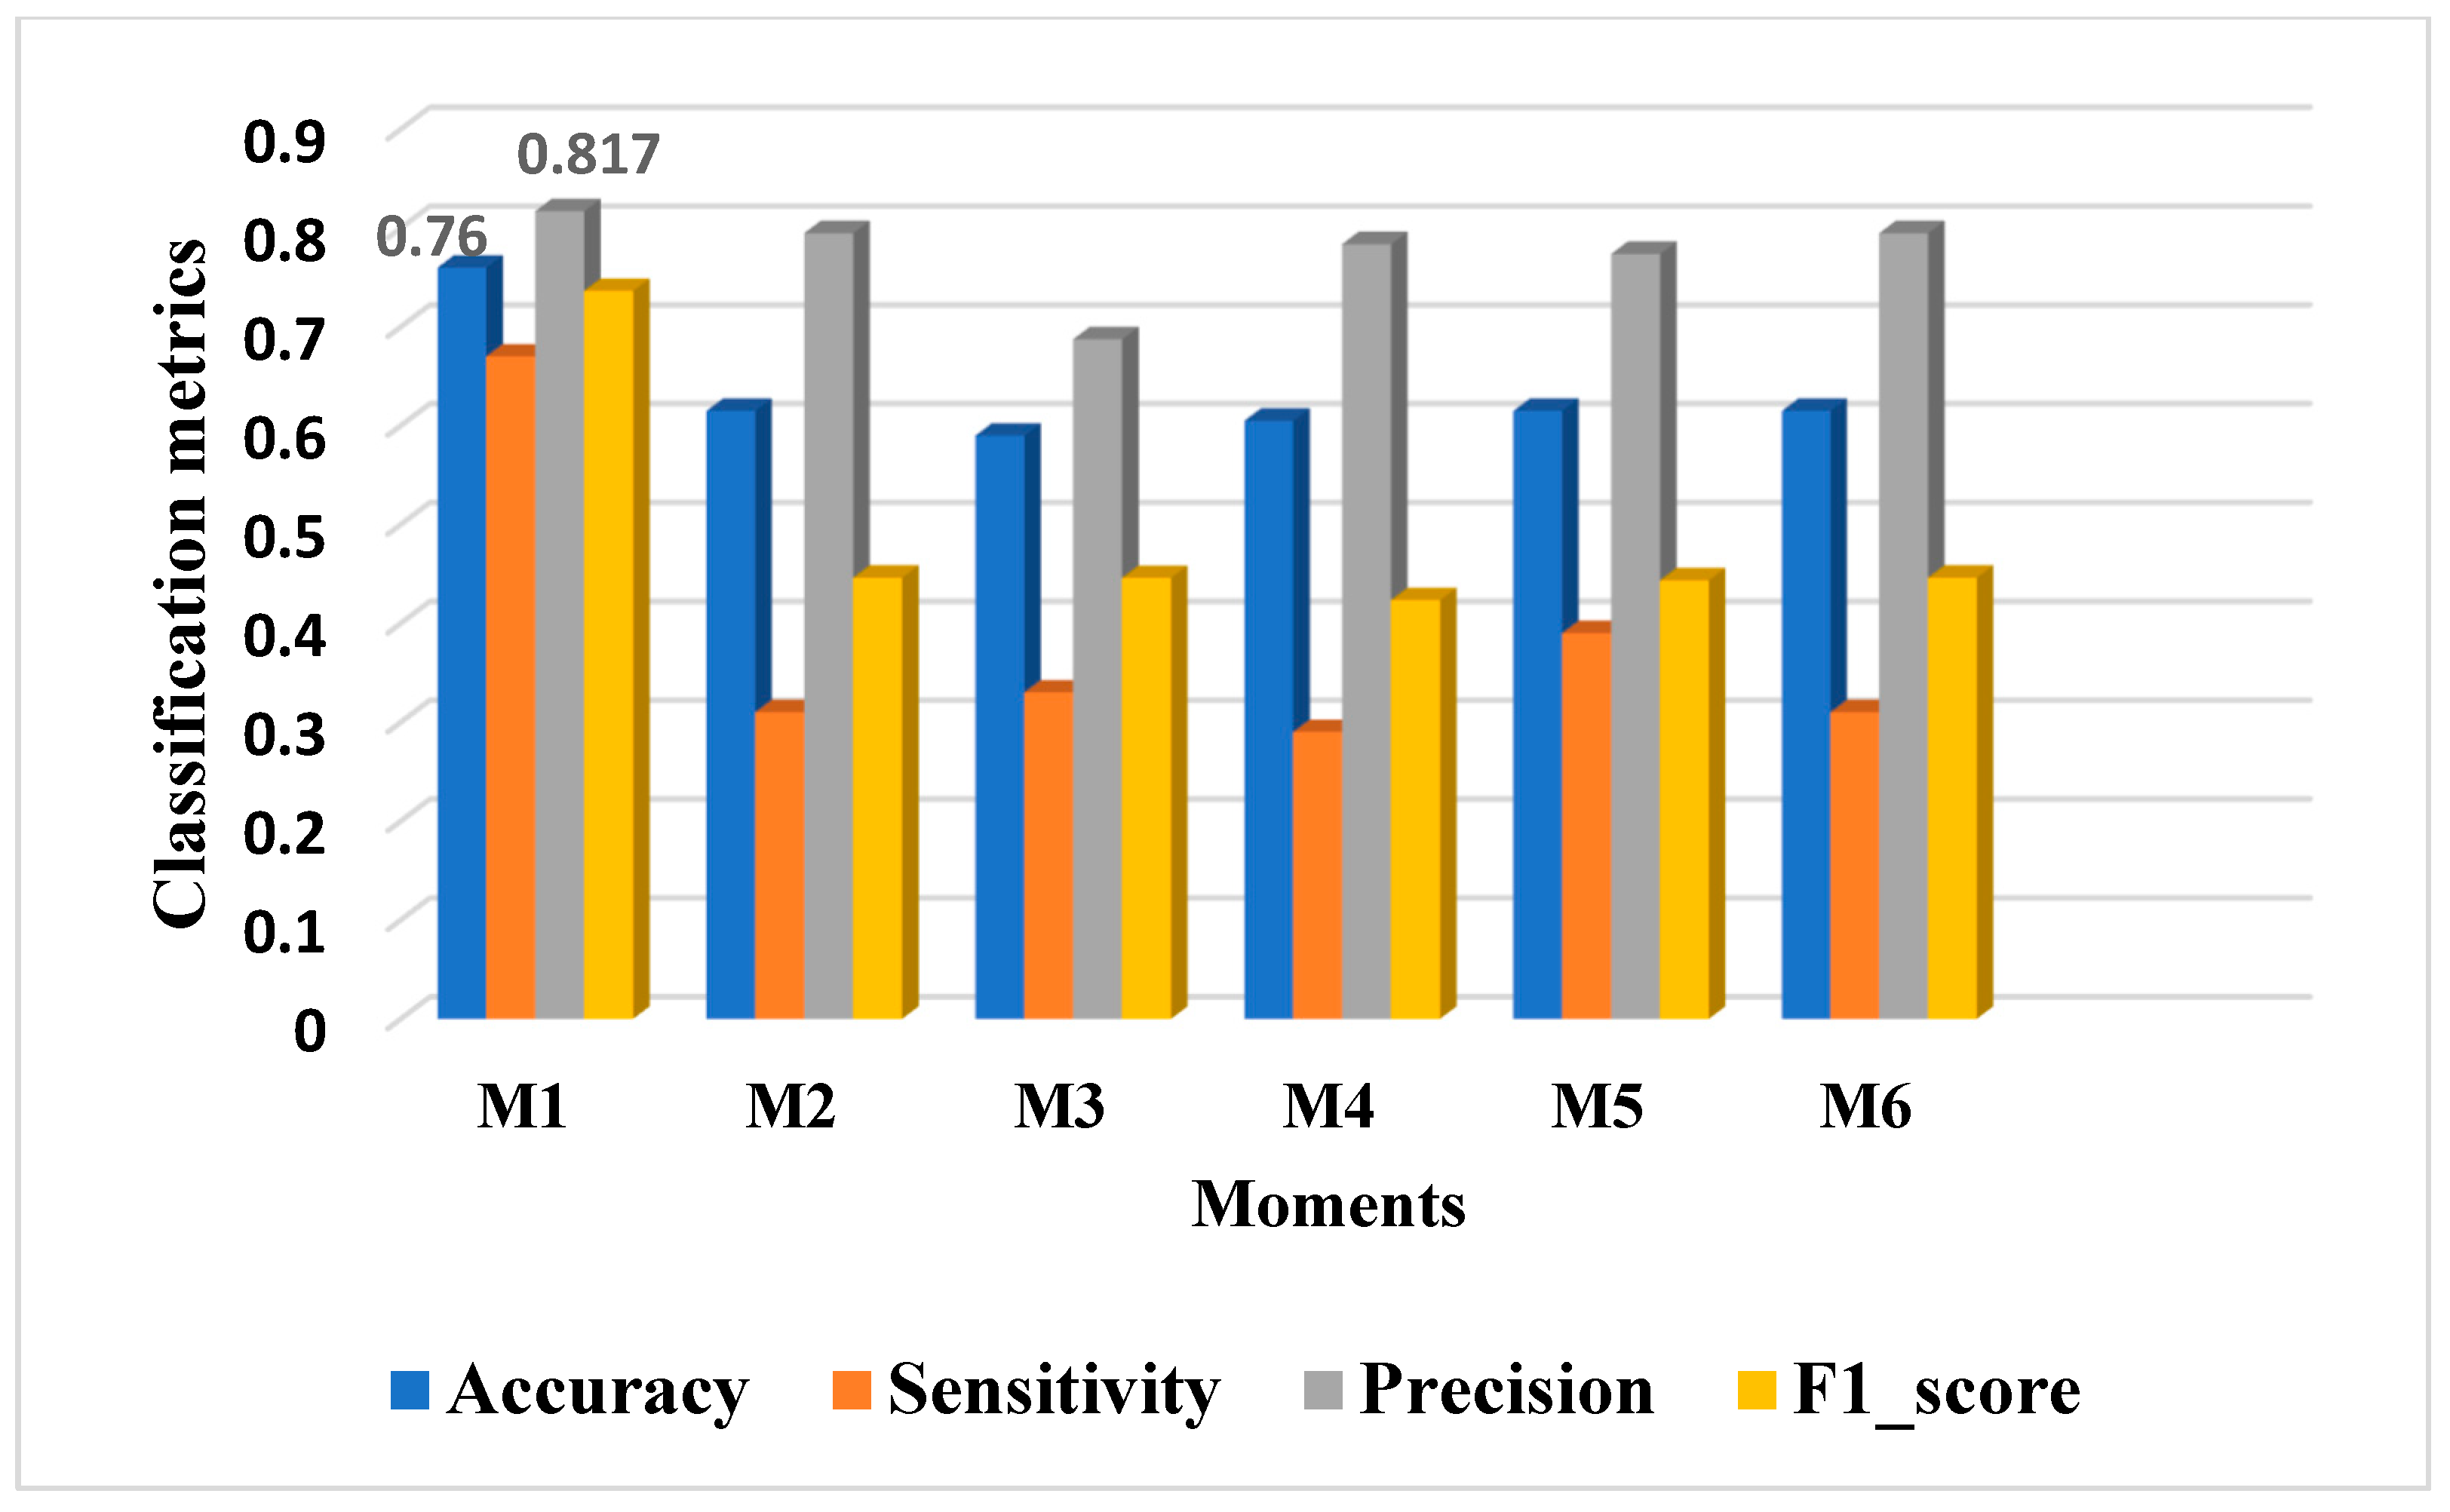
4. Results and Discussion

The dataset we used included ground-truth cases for the normal, benign, and malignant categories. Among these regions, 133 were normal tissue, 210 were malignant masses, and 437 were benign masses.
Before using the k-NN classifier, the penalty t-test was used to optimize the feature vector and improve the classification performance (Table 1).
The selected features fed a k-NN classifier and RBFNN. We used fivefold cross-validation to select the best features. In fivefold cross-validation, the feature vector (437 benign images, 210 malignant images, and a total of 3882 moments) was randomly divided into five sets. The classifiers were trained using four folds, and one fold was used to test the classifier. The provided average accuracy was considered to evaluate the k-NN and RBFNN classifiers.
The values of accuracy, sensitivity, precision, and F1-score reflect the diagnosis accuracy. Higher values for these metrics indicate a better performance of the system. Figure 3 displays the performance of the k-NN algorithm in the classification of BUS images. The selected moment features with the highest classification accuracy rate were M1 and M5. The M1 moment showed the best accuracy of 0.85, representing the number of correctly classified images. It also had the best precision of 0.87, indicating the proportion of correct positive identifications. The M5 moment provided the best sensitivity of 0.83, indicating a good performance of the classifier. Furthermore, M5 had the second-best accuracy and precision values and the highest F1-score, which denotes the harmonic mean between precision and sensitivity.
The diagnostic performance of the RBFNN is presented in Figure 4. A relatively high classification performance (i.e., accuracy value of 0.76) was obtained for M1. Moreover, M1 had a high precision (0.81), indicating the proportion of correctly positive identifications. The other moments showed lower accuracy but had a good proportion of correctly positive identifications, with precision values around 0.78. The RBFNN model built in this study showed low sensitivity and F1-scores for M2 to M6 moments.
The diagnostic performance of k-NN and RBFNN classifiers in the differentiation of benign and malignant breast lesions indicated significant differences among the classifiers in the classification performance. The data shown in Figure 3 and Figure 4 indicate the M1 moment as the best feature with relatively high classification performance. When compared to the precision values (i.e., the proportion of correctly positive identifications), the best performance results were provided by the RBFNN. In the case of the M1 moment, there were some differences in the diagnostic performance among these two models. The k-NN was found to have a high accuracy of prediction.
The differentiation ability of our approach is in line with other existing conventional models, as presented in Table 2.
The k-NN algorithm is a simple and nonparametric machine learning algorithm built to identify the group’s membership by exploiting similarity and to predict the class of the new data. The performance of the k-NN algorithm is related to the complexity of the decision boundary. When the number of neighbors is low, the algorithm chooses only the closest values to the data sample, and a very complex decision boundary is formed. In this case, the model fails at providing an adequate generalization and shows poor results. When the number of neighbors is increased, in an early phase, the model generalizes well; however, when the value is increased too much, it results in a performance drop. RBFNN as a deep learning tool requires several trials in establishing the number of hidden layers and/or choosing the activation function, but it is advantageous as it needs less effort and preprocessing. This is one of the limitations of the present study. Other limitations are related to the small size of the dataset. A neural architecture reaches good performance when handling large amounts of data. However, the recognition accuracy of the proposed method is comparable to some state-of-the-art methods. A future research direction will be devoted to improving the classification performance by combining geometric moments with other feature descriptors.

5. Conclusions

In this paper, we employed both a k-NN algorithm and an RBFNN model, and we investigated their performance in differentiating between benign and malignant breast lesions on BUS images. Both methods highlighted that moment M1 (i.e., correlated with the area of the lesion) was the feature that best differentiated between benign and malignant breast lesions. The k-NN classifier had a classification performance described by an accuracy of 0.85, while RBFNN had a decent score of 0.76. Despite the small difference in classification performance, we believe that RBFNN is a proper tool for the classification task, as the proportion of correctly positive identifications reached higher values.

Author Contributions

Conceptualization, S.M. and L.M.; methodology, S.M. and L.M.; software, S.M., I.-N.A.N. and L.M.; validation, S.M. and I.-N.A.N.; formal analysis, I.-N.A.N.; investigation, S.M. and I.-N.A.N.; writing—original draft preparation, S.M., I.-N.A.N. and L.M.; writing—review and editing, S.M. and L.M. All authors have read and agreed to the published version of the manuscript.

Funding

This research received no external funding.

Institutional Review Board Statement

Not applicable.

Informed Consent Statement

Not applicable.

Data Availability Statement

Not applicable.

Conflicts of Interest

The authors declare no conflict of interest.

References

  1. Sung, H.; Ferlay, J.; Siegel, R.L.; Laversanne, M.; Soerjomataram, I.; Jemal, A.; Bray, F. Global Cancer Statistics 2020: GLOBOCAN Estimates of Incidence and Mortality Worldwide for 36 Cancers in 185 Countries. CA A Cancer J. Clin. 2021, 71, 209–249. [Google Scholar] [CrossRef] [PubMed]
  2. Qi, X.; Zhang, L.; Chen, Y.; Pi, Y.; Chen, Y.; Lv, Q.; Yi, Z. Automated diagnosis of breast ultrasonography images using deep neural networks. Med. Image Anal. 2019, 52, 185–198. [Google Scholar] [CrossRef] [PubMed]
  3. Evans, A.; Trimboli, R.M.; Athanasiou, A.; Balleyguier, C.; Baltzer, P.A.; Bick, U.; Camps Herrero, J.; Clauser, P.; Colin, C.; Cornford, E.; et al. Breast ultrasound: Recommendations for information to women and referring physicians by the European Society of Breast Imaging. Insights Imaging 2018, 9, 449–461. [Google Scholar] [CrossRef] [PubMed] [Green Version]
  4. Wu, G.-G.; Zhou, L.-Q.; Xu, J.-W.; Wang, J.-Y.; Wei, Q.; Deng, Y.-B.; Cui, X.-W.; Dietrich, C.-F. Artificial intelligence in breast ultrasound. World J. Radiol. 2019, 11, 19–26. [Google Scholar] [CrossRef]
  5. Yao, A.D.; Cheng, D.L.; Pan, I.; Kitamura, F. Deep learning in neuroradiology: A systematic review of current algorithms and approaches for the new wave of imaging technology. Radiol. Artif. Intell. 2020, 2, e190026. [Google Scholar] [CrossRef]
  6. Liu, H.; Cui, G.; Luo, Y.; Guo, Y.; Zhao, L.; Wang, Y.; Subasi, A.; Dogan, S.; Tuncer, T. Artificial Intelligence-Based Breast Cancer Diagnosis Using Ultrasound Images and Grid-Based Deep Feature Generator. Int. J. Gen. Med. 2022, 15, 2271–2282. [Google Scholar] [CrossRef]
  7. Thummalapalem, G.D.; Pradesh, A.; Vaddeswaram, G.D. Automated detection, segmentation and classification using deep learning methods for mammograms-a review. Int. J. Pure Appl. Math. 2018, 119, 627–666. [Google Scholar]
  8. Wang, H.-Y.; Jiang, Y.-X.; Zhu, Q.-L.; Zhang, J.; Xiao, M.-S.; Liu, H.; Dai, Q.; Li, J.-C.; Sun, Q. Automated Breast Volume Scanning: Identifying 3-D Coronal Plane Imaging Features May Help Categorize Complex Cysts. Ultrasound Med. Biol. 2016, 42, 689–698. [Google Scholar] [CrossRef]
  9. Berbar, M.A. Hybrid methods for feature extraction for breast masses classification. Egypt. Inform. J. 2018, 19, 63–73. [Google Scholar] [CrossRef]
  10. Lou, J.-Y.; Yang, X.-L.; Cao, A.-Z. A Spatial Shape Constrained Clustering Method for Mammographic Mass Segmentation. Comput. Math. Methods Med. 2015, 2015, 891692. [Google Scholar] [CrossRef]
  11. Liang, X.; Yu, J.; Liao, J.; Chen, Z. Convolutional Neural Network for Breast and Thyroid Nodules Diagnosis in Ultrasound Imaging. BioMed Res. Int. 2020, 2020, e1763803. [Google Scholar] [CrossRef] [PubMed]
  12. Hassan, S.A.; Sayed, M.S.; Abdalla, M.I.; Rashwan, M.A. Detection of breast cancer mass using MSER detector and features matching. Multimed. Tools Appl. 2019, 78, 20239–20262. [Google Scholar] [CrossRef]
  13. Hu, M.-K. Visual pattern recognition by moment invariants. IEEE Trans. Inf. Theory 1962, 8, 179–187. [Google Scholar]
  14. Wason, J.M.; Mander, A.P. The choice of test in phase II cancer trials assessing continuous tumour shrinkage when complete responses are expected. Stat. Methods Med. Res. 2015, 24, 909–919. [Google Scholar] [CrossRef] [PubMed] [Green Version]
  15. Cherif, W. Optimization of K-NN algorithm by clustering and reliability coefficients: Application to breast-cancer diagnosis. Procedia Comput. Sci. 2018, 127, 293–299. [Google Scholar] [CrossRef]
  16. Sharma, S.; Mehra, R. Conventional Machine Learning and Deep Learning Approach for Multi-Classification of Breast Cancer Histopathology Images—A Comparative Insight. J. Digit. Imaging 2020, 33, 632–654. [Google Scholar] [CrossRef]
  17. Podgornova, Y.A.; Sadykov, S.S. Comparative analysis of segmentation algorithms for the allocation of microcalcifications on mammograms. Inf. Technol. Nanotechnol. 2019, 2391, 121–127. [Google Scholar]
  18. Zhang, X.; Yang, J.; Nguyen, E. Breast cancer detection via Hu moment invariant and feedforward neural network. AIP Conf. Proc. 2018, 1954, 030014. [Google Scholar]
  19. Mata, B.N.B.U.; Meenakshi, D.M. Mammogram Image Segmentation by Watershed Algorithm and Classification through k-NN Classifier. Bonfring Int. J. Adv. Image Process. 2018, 8, 1–7. [Google Scholar] [CrossRef] [Green Version]
  20. Sadhukhan, S.; Upadhyay, N.; Chakraborty, P. Breast Cancer Diagnosis Using Image Processing and Machine Learning. Emerg. Technol. Model. Graph. 2020, 937, 113–127. [Google Scholar]
  21. Hao, Y.; Qiao, S.; Zhang, L.; Xu, T.; Bai, Y.; Hu, H.; Zhang, W.; Zhang, G. Breast Cancer Histopathological Images Recognition Based on Low Dimensional Three-Channel Features. Front. Oncol. 2021, 11, 2018. [Google Scholar] [CrossRef] [PubMed]
  22. Hao, Y.; Zhang, L.; Qiao, S.; Bai, Y.; Cheng, R.; Xue, H.; Hou, Y.; Zhang, W.; Zhang, G. Breast cancer histopathological images classification based on deep semantic features and gray level co-occurrence matrix. PLoS ONE 2022, 17, e0267955. [Google Scholar] [CrossRef] [PubMed]
  23. Joshi, A.; Mehta, A. Analysis of K- Nearest Neighbor Technique for Breast Cancer Disease Classification. Int. J. Recent Sci. Res. 2018, 9, 26126–26130. [Google Scholar]
  24. Alshammari, M.M.; Almuhanna, A.; Alhiyafi, J. Mammography Image-Based Diagnosis of Breast Cancer Using Machine Learning: A Pilot Study. Sensors 2022, 22, 203. [Google Scholar] [CrossRef]
  25. Agaba, A.J.; Abdullahi, M.; Junaidu, S.B.; Hassan Ibrahim, H.; Chiroma, H. Improved multi-classification of breast cancer histopathological images using handcrafted features and deep neural network (dense layer). Intell. Syst. Appl. 2022, 14, 200066–200076. [Google Scholar]
  26. Xie, W.; Li, Y.; Ma, Y. Breast mass classification in digital mammography based on extreme learning machine. Neurocomputing 2016, 173, 930–941. [Google Scholar] [CrossRef]
  27. Zhuang, Z.; Yang, Z.; Zhuang, S.; Joseph Raj, A.N.; Yuan, Y.; Nersisson, R. Multi-Features-Based Automated Breast Tumor Diagnosis Using Ultrasound Image and Support Vector Machine. Comput. Intell. Neurosci. 2021, 2021, 9980326. [Google Scholar] [CrossRef]
  28. Shia, W.-C.; Chen, D.-R. Classification of malignant tumors in breast ultrasound using a pretrained deep residual network model and support vector machine. Comput. Med. Imaging Graph. 2021, 87, 101829–101835. [Google Scholar] [CrossRef]
  29. Wan, K.W.; Wong, C.H.; Ip, H.F.; Fan, D.; Yuen, P.L.; Fong, H.Y.; Ying, M. Evaluation of the performance of traditional machine learning algorithms, convolutional neural network and AutoML Vision in ultrasound breast lesions classification: A comparative study. Quant. Imaging Med. Surg. 2021, 11, 1381–1393. [Google Scholar] [CrossRef]
  30. Moldovanu, S.; Damian Michis, F.A.; Biswas, K.C.; Culea-Florescu, A.; Moraru, L. Skin Lesion Classification Based on Surface Fractal Dimensions and Statistical Color Cluster Features Using an Ensemble of Machine Learning Techniques. Cancers 2021, 13, 5256. [Google Scholar] [CrossRef]
  31. Damian, F.A.; Moldovanu, S.; Dey, N.; Ashour, A.S.; Moraru, L. Feature Selection of Non-Dermoscopic Skin Lesion Images for Nevus and Melanoma Classification. Computation 2020, 8, 41. [Google Scholar] [CrossRef]
  32. Al-Dhabyani, W.; Gomaa, M.; Khaled, H.; Fahmy, A. Dataset of breast ultrasound images. Data Brief 2020, 28, 104863. [Google Scholar] [CrossRef] [PubMed]
  33. Labuda, N.; Seeliger, J.; Gedrande, T.; Kozak, K. Selecting Adaptive Number of Nearest Neighbors in k-Nearest Neighbor Classifier Apply Diabetes Data. J. Math. Stat. Sci. 2017, 2017, 1–13. [Google Scholar]
Figure 1. Samples of breast ultrasound images: (a,c) grayscale image of a benign lesion; (b,d) ground truth for benign lesion; (e,g) grayscale image of a malignant lesion; (f,h) ground truth for malignant lesion [32].
Inventions 07 00042 g001aInventions 07 00042 g001b
Figure 2. The structure of an RBFNN classifier.
Inventions 07 00042 g002
Figure 3. Classification metrics for k-NN.
Inventions 07 00042 g003
Figure 4. Classification performance of RBFNN from BUSI database.
Inventions 07 00042 g004
Table 1. Results for t-test (p < 0.05).
MomentsM1M2M3M4M5M6M7
p-value0.04<0.01<0.01<0.01<0.01<0.010.90
Table 2. Comparison of existing handcrafted approaches and the present handcrafted approach.
ModelFeaturesAccuracySensitivityPrecisionF1-ScoresRef.
Hu’s moment + colored histogram + Haralick texture + SVM (linear kernel and C = 5) + VGG16Hu’s moment, colored histogram, and Haralick texture0.81820.820.850.81[16]
Hu’s moment + Haralick texture + colored histogram + DNNHu’s moment, Haralick texture, and colored histogram0.980.980.970.97[25]
Multiple features + SVMHu’s moment0.9250.950.9050.927[27]
Hu’s moment + colored histogram + Haralick texture CNNHu’s moment, colored histogram, and Haralick texture0.910.820.880.87[29]
Hu’s moment + K-NNHu’s moment0.890.830.870.83Our model
Hu’s moment + RBFNNHu’s moment0.760.670.8170.73Our model
Publisher’s Note: MDPI stays neutral with regard to jurisdictional claims in published maps and institutional affiliations.

