Article

Carbon Emissions and Renewables’ Share in the Future Iberian Power System

1
Instituto Superior Técnico, University of Lisbon, 1049-001 Lisboa, Portugal
2
INESC-ID/IST, University of Lisbon, 1000-029 Lisboa, Portugal
3
INESC-Coimbra/ESTSetúbal, Polytechnic Institute of Setúbal, 2914-508 Setubal, Portugal
*
Author to whom correspondence should be addressed.
Inventions 2022, 7(1), 4; https://doi.org/10.3390/inventions7010004
Submission received: 20 October 2021 / Revised: 26 November 2021 / Accepted: 28 November 2021 / Published: 21 December 2021
(This article belongs to the Special Issue Data Analytics in the Energy Sector)

Abstract

:
The main objective of this study is to assess if the targets set by the European Commission (EC) relating to the share of renewables and CO2 emissions by 2030 will be accomplished by the Iberian power system. In this regard, several projections for each generation technology’s installed capacity in the future power system are identified. These forecasts were issued by governmental and private Iberian organizations and by the European Association of Transmission System Operators (ENTSOE), the latter with three scenarios regarding the speed of the energy transition. The outputs of the study are extended to the 2040 horizon and include the energy generated by each technology, the CO2 emissions, the costs involved in the decarbonization, and the storage capacity needed to compensate for the renewables’ variability. The conclusion is that the Iberia peninsular is on the right path to achieve a fully decarbonized power system by 2040, outperforming by far the EC’s targets in 2030 if the governmental projections are followed. A significant capacity of storage options is envisaged to compensate for the variability of generation from renewables and to replace the power regulation services provided by the fossil fuel plants that will be shut down.

1. Introduction

1.1. Topic Overview

The Paris Agreement’s main aim is to establish the global response to the threat of climate change by restricting the global temperature rise to 1.5 degrees Celsius by the end of this century [1]. Additionally, the agreement aims to increase the ability of countries to deal with the impacts of climate change and make finance flows consistent with low Greenhouse Gas (GHG) emissions and climate-resilient pathways. The countries’ governments agreed to come together every five years to set more ambitious targets and track progress towards the long-term goal through a robust transparency and accountability system.
In this context, the European Commission (EC) presented an action plan in line with the Paris Agreement’s objectives and proposed the following targets for the years 2020 and 2030 [2]:
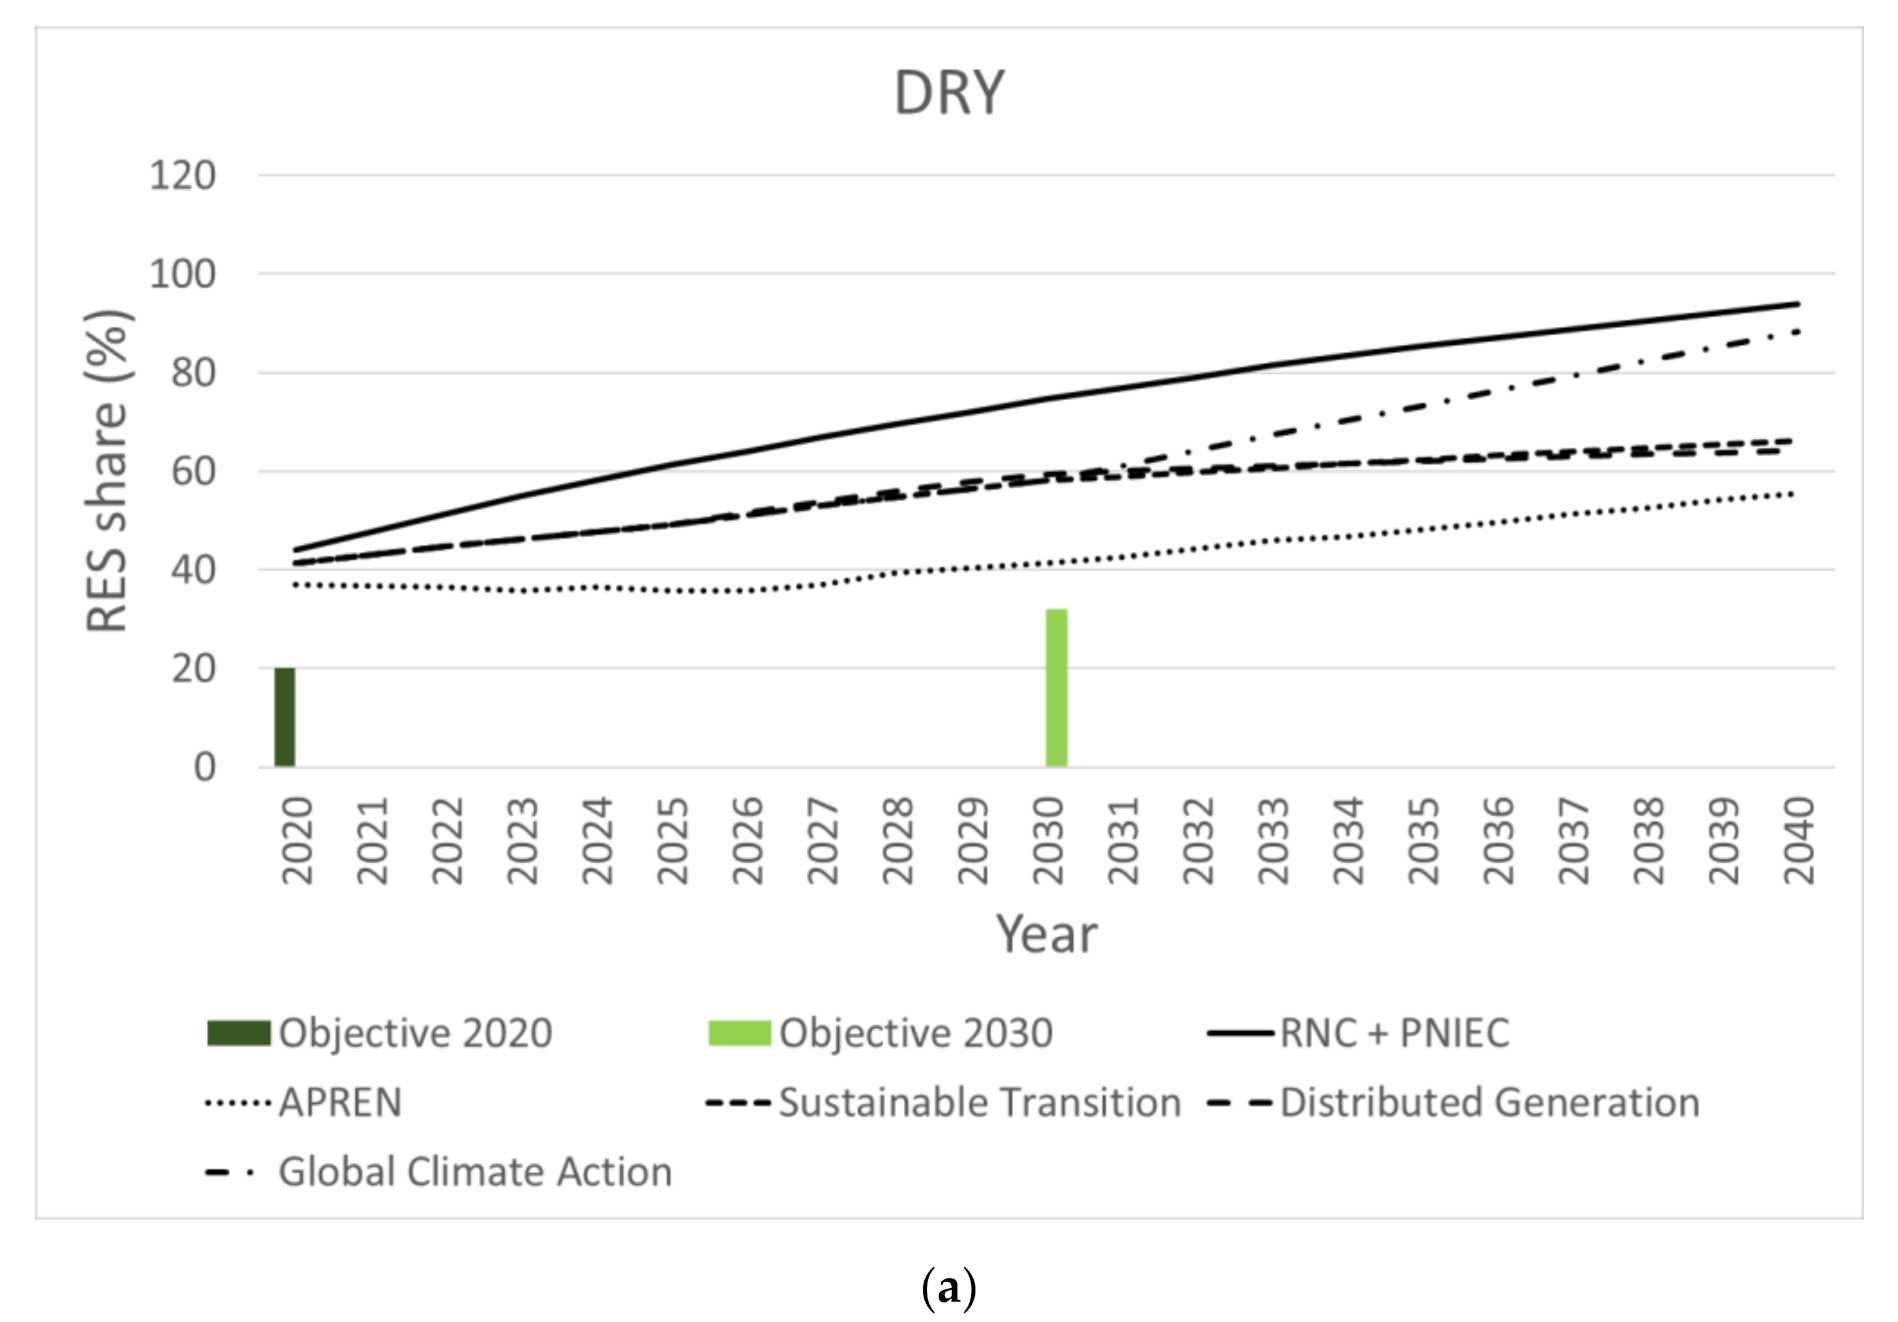
  • A 20% (2020) and 40% (2030) cut in GHG emissions compared to 1990’s levels.
  • A 20% (2020) and 32% (2030) of the European Union’s gross final energy consumed produced by Renewable Energy Sources (RES).
  • A 20% (2020) and 32.5% (2030) improvement in energy efficiency.
The European Union (EU) has recently agreed to a new RES share target of 80% by 2050, with electricity providing for half of the final energy demand in the EU [3].
It is a normal practice that the countries’ governments, and private and public institutions come up with projections for the installed capacity of the generating units for the coming years, bearing in mind the energy policies of each country. The motivation to this study is to find out in what extent the said projections would allow for accomplishing the environmental targets defined by the EC.
Portugal and Spain, constituting the Iberian Peninsula, are part of the EU, meaning that the European Commission’s objectives and targets are valid for 2020 and 2030. In this paper, the aim is to simulate the Iberian power system, to evaluate if the objectives set by the EC may be accomplished by the Iberian electricity sector or not. The horizon of the study is extended out to 2040 to verify the path towards the clean energy transition after the set objectives for 2030. The study is based on future new generation projections made by public and private entities and uses the EnergyPlan software. It is further noted that the energy transition is already ongoing in both in Portugal and Spain, namely by the announced soon-to-be decommissioned coal-fired power plants (January 2021) [4], as well as the increase in the use in renewable power.
In this paper, the RES share and CO2 emissions targets set in the EC action plan are evaluated against the Paris Agreement, specifically those targets for the Iberian (Portugal and Spain) power system, in the years 2020 and 2030. Furthermore, the paper intends to look at the pathway until 2040, to check if a future decarbonized power system is achievable in the Iberian system. It is noted that the EC’s set objectives are global, i.e., for all sectors, but this analysis is restricted to the electricity sector. To the best of the authors’ knowledge, this is the first time a study with the said objective has been carried out.
To this aim, the paper simulates the Iberian electricity generating system till 2040, using the EnergyPlan software. Newly installed capacity is taken from the projections made by reputed public and private institutions from both countries. Based on the data available, five different capacity projections were considered: (i) public (governmental) projections; (ii) private entity projections; and iii) ENTSO-E (the European association of Transmission System Operators) projections, which was further split into three scenarios, considering different speeds of the energy transition. The analysis is supported by a cost breakdown of the future power system, as seen by the considered projections. The Iberian generating system is strongly dependent on hydropower, which, in turn, is contingent on meteorological (precipitation) conditions. For instance, in Portugal, the contribution of hydropower can reach about 40% of the demand, in selected hours, should the climatic conditions so allow it. For this reason, three scenarios (wet, average, and dry) are considered in the paper to fully address all the possible scenarios. All the considered projections point to a strong boost in RES, so it is most likely that a surplus of produced electricity is generated. To use this electricity, the required storage options are discussed and quantified in the paper.
The paper intends to supply the following main contributions:
  • To offer a model for the Iberian generating system till 2040, supported by the best available capacity forecasts.
  • To verify if the government plans to decarbonize the electricity sector will allow it to reach the European objectives and to achieve a decarbonized power system beyond 2040.
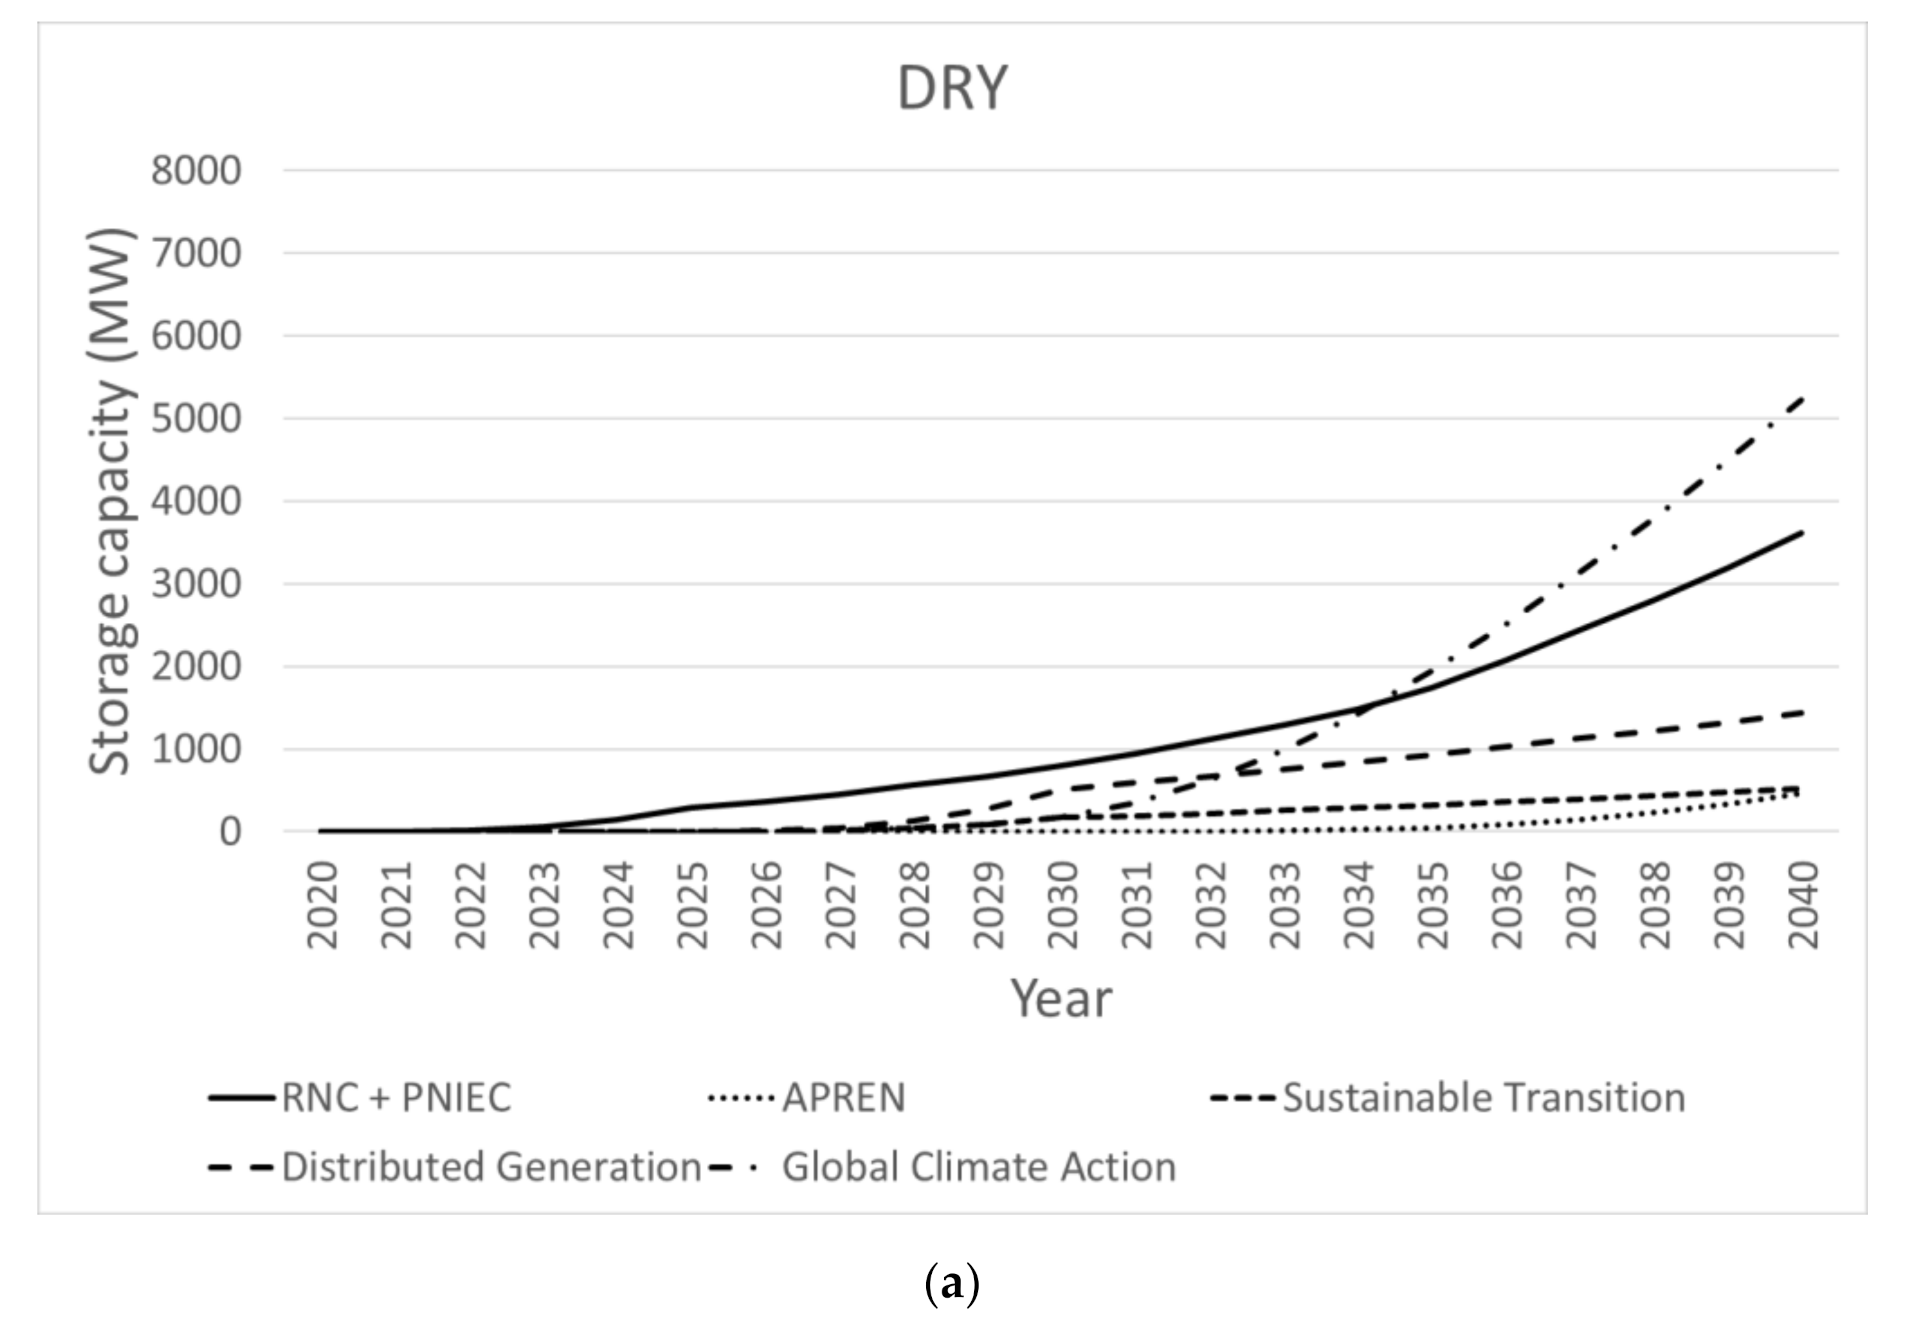
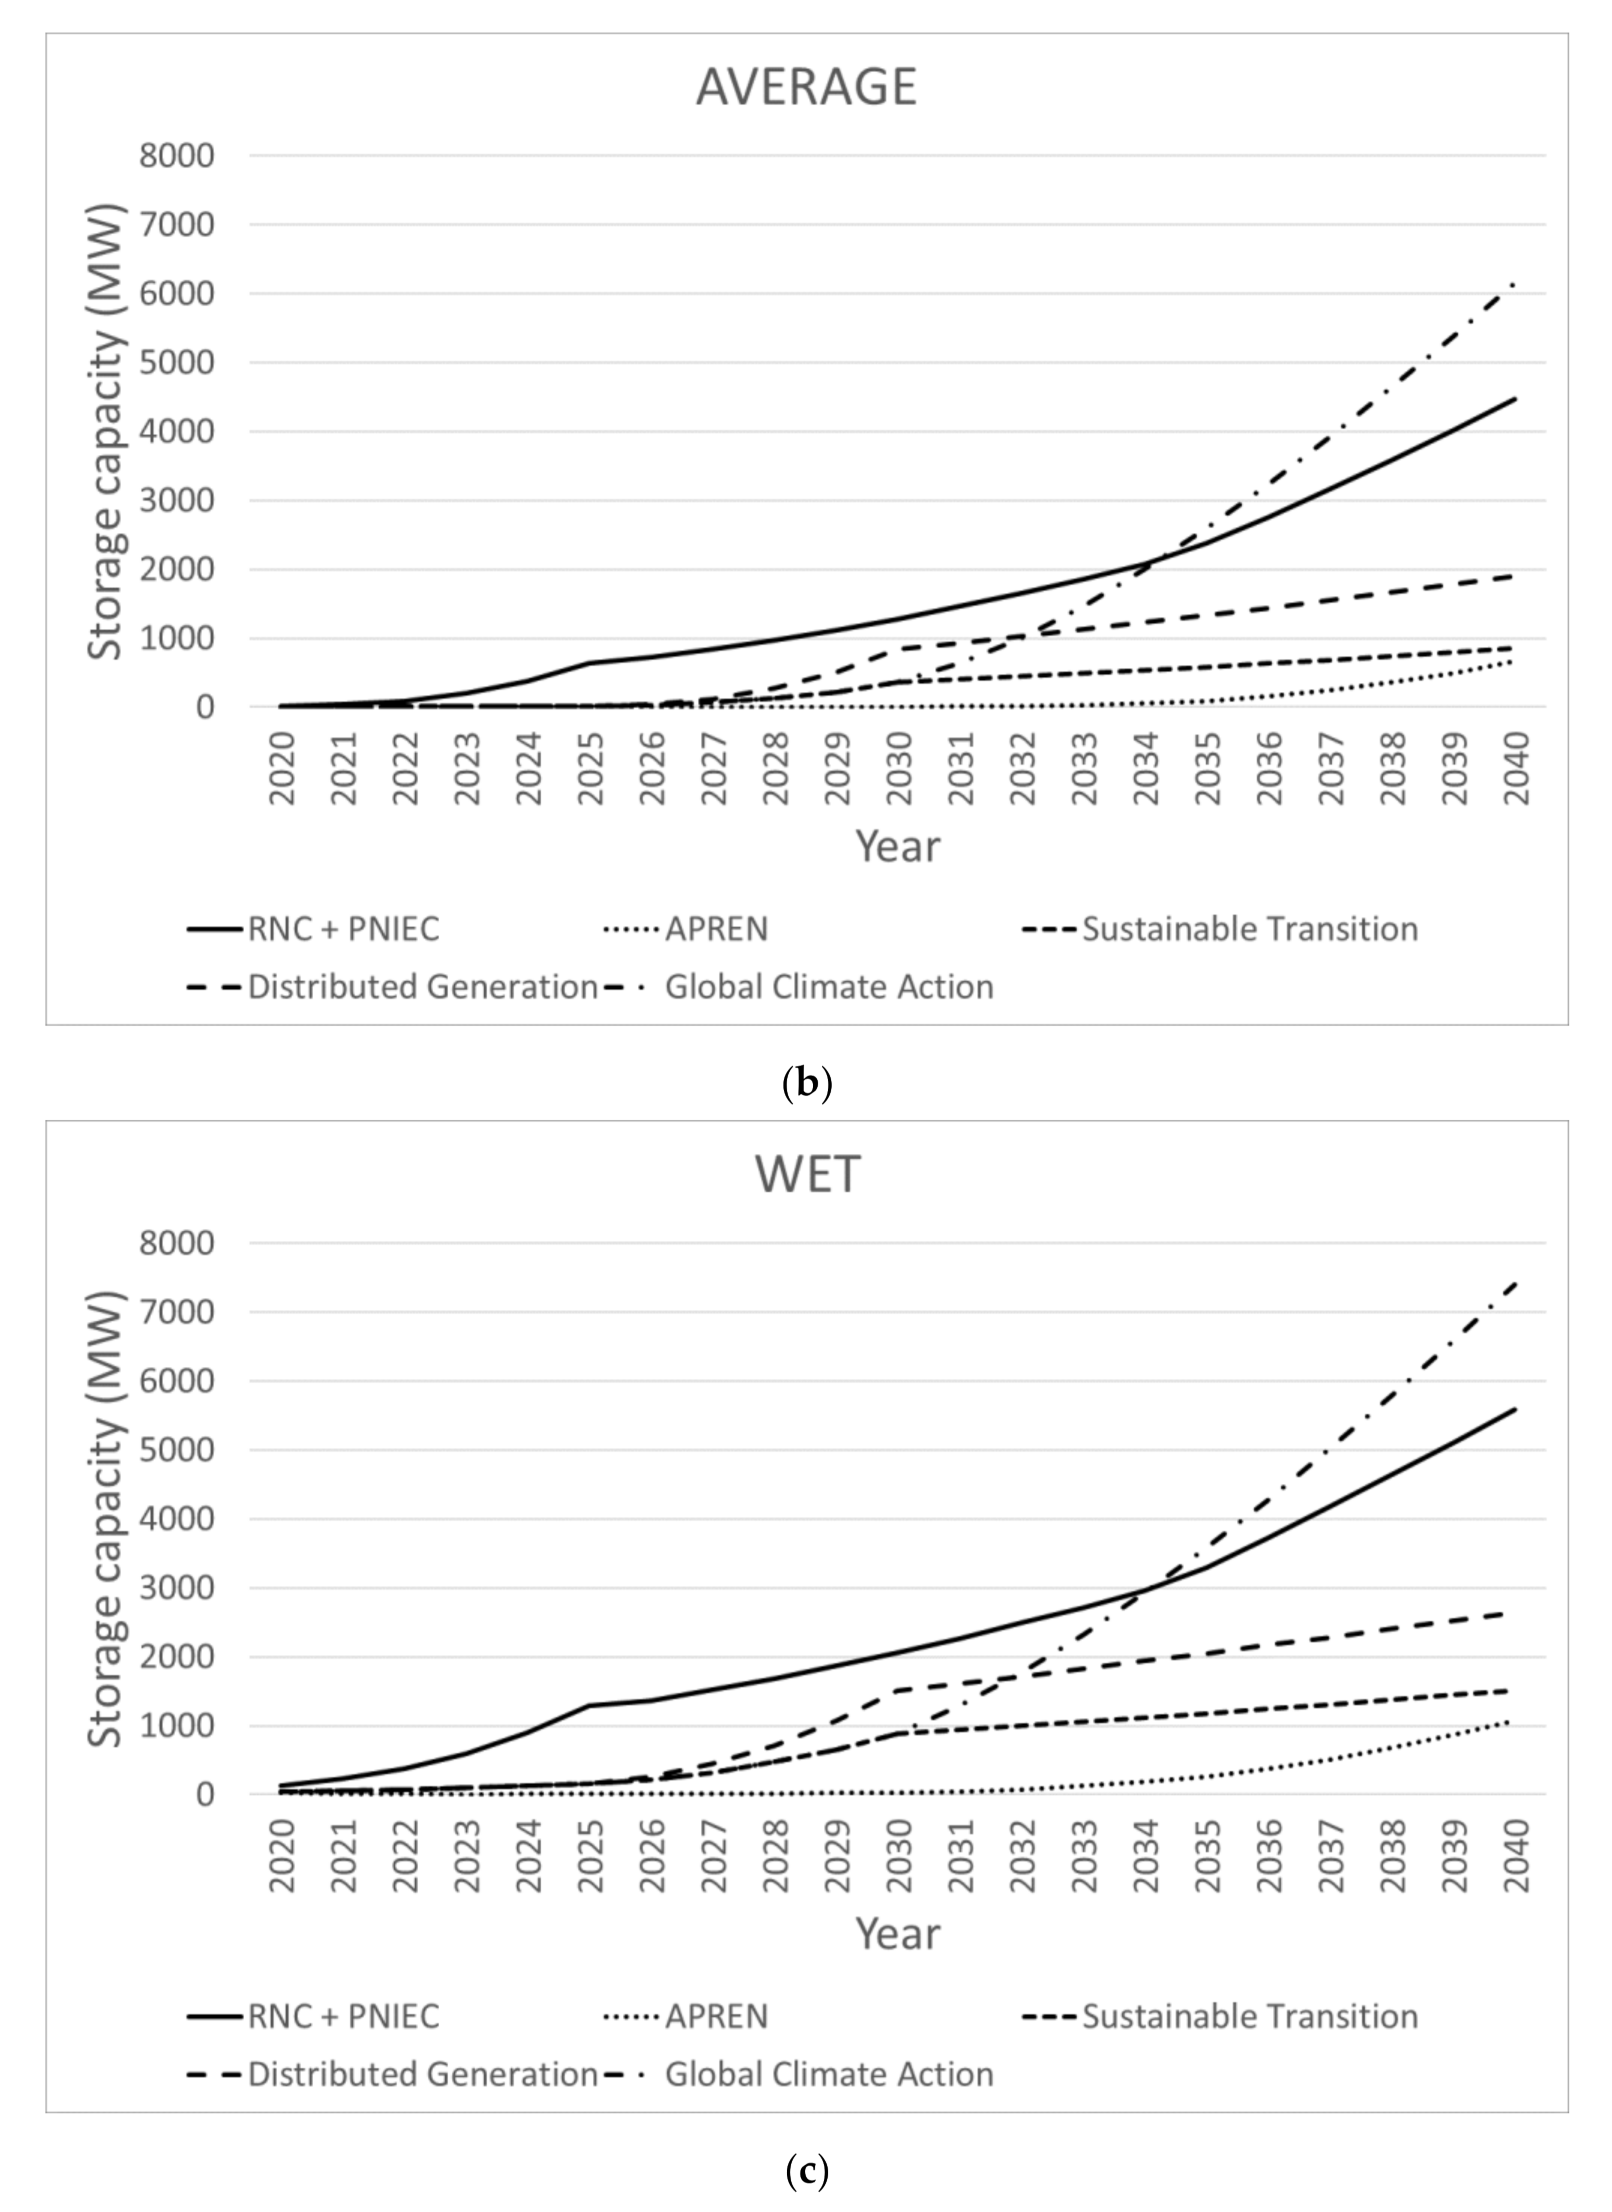
  • To quantify the storage capacity required to accommodate the surplus electricity.
  • To assist policymakers in monitoring the effects of the ongoing decarbonization policies.
All in all, the paper collected the projections made available by respected entities (Iberian governments, renewable energy associations, and the association of the European Transmission System Operators) regarding the evolution of the installed capacity (MW) of generating technologies in the Iberian Peninsula for the period 2020–2040. A well-known software, EnergyPlan from Aalborg University, commonly used in many research articles [5,6,7], was used to compute the energy mix (MWh) of each technology for the mentioned period. The inputs of EnergyPlan are the installed capacities of each technology (from the different projections), the hourly demand, and the hourly distribution of the renewable energy sources and nuclear power. The output is the hourly distribution of the output power of each technology, therefore enabling the computation of the annual energy produced. With these results in hand, the compliance with the EC targets for renewables share and CO2 emissions were assessed using the energy output corresponding to each considered projection. Moreover, an economic assessment of the costs involved in the power system decarbonization, and an outlook of the energy storage systems needed to compensate for the renewables’ variability are also offered in this paper.
The theoretical contribution of this paper may be found in the building of an adequate simulation platform that enabled the research to be carried out, comprising namely the data treatment, the design, implementation, and testing of the technical and economic models for each technology and the filtering of the relevant results. Furthermore, this contribution included the analysis and discussion of the obtained results, considering the decarbonization objectives pursued by the EC.
The findings of the research provide policymakers and policy planners with reliable information concerning the long-term impact of the policy measures implemented today.

1.2. Literature Review

The literature reports several studies on power system simulations using EnergyPlan. Hereafter, the more relevant ones are discussed.
In the Portuguese power system, the results obtained in [8] concluded that achieving a 100% RES electricity system would be theoretically possible and could guarantee the expected consumption needs. This achievement would, however, lead to a significant increase in the total capacity of the system, to ensure no shortfall during the seasons with low production from RES. On the other hand, this 100% renewable strategy would create a significant surplus of electricity production during seasons of high-RES production. A 100% RES target is hardly possible without a significant amount of storage and interconnection capacity. It is noted that, under proper climacteric conditions, the Portuguese demand has already been entirely supplied by RES power for long periods. Another article on the Portuguese power system [9] outlines the short-term electricity power generation schedule. The paper aims at analysing the increasing impact of wind power scenarios in a system containing hydro, wind, and thermal power plants. The findings show that the system’s marginal cost decreases as wind capacity increases, therefore reducing the CO2 emissions. The paper in [10] presents a long-term model to optimise the investment in new renewable capacity in Portugal. By considering the hourly variation of both the supply and demand, the authors conclude that over-investments can be avoided, and RES curtailment is reduced. The minimal thermal capacity required to safely operate the Portuguese power system under a very high penetration of renewables is identified in [11]. The study concludes that both storage and interconnections are of utmost importance to allow the integration of increasing quantities of renewable power. The study in [12] simulates the integration of a significant amount of new PV power in the Iberian electricity market. The simulation results point to an average reduction of 1.5 EUR/MWh in the clearing price. Moreover, the new PV addition will replace natural gas combined cycle power, therefore allowing for a saving of 2.7 million of Mton of CO2 emissions.
A study investigated if a fully renewable European power system is possible for 2050 [13]. Although many constraints were identified, the authors claim this power system is feasible. Another study on the potential pathway to 100% renewable energy for the EU energy system by the year 2050 [14] points that to reach the 80% and 100% less CO2 emissions in 2050 compared to 1990 levels, the annual cost of the EU energy system will be 3% and 13% higher than the fossil fuel alternative, respectively. The synergy of sector coupling and transmission reinforcement in a cost-optimised European power system [15] concludes that wind and solar are the primary energy generation technologies. Possible paths to increase flexibility is the research topic of [16]. The paper addresses both the interconnection between two countries and cross-sector interconnection, i.e., between different areas of the same power system. Both options result in a growth of the RES utilisation, however, the cross-sector interconnection further increases the system efficiency. In South-East Europe, a study analyses the path towards a 100% renewable energy system until 2050 [17]. The authors conclude that wind and PV will be the predominant technologies. Moreover, it is argued that the resulting power system will be economically viable.
A case study for the Greek power system [18] presents a spatial multi-period long-term model for the centralised generation expansion planning problem. The transition to a low-carbon electricity generation profile is pointed out, driven by constraints regarding the CO2 emissions cap, and the compulsory RES production of at least 40% of the total electricity production, from 2020 onwards.
The impact of high penetration of wind and solar PV on the Croatian power system was assessed in [19]. It is concluded that Croatia would be able to receive a large capacity of these technologies, accounting for 70% of the country’s electricity production. Still in Croatia, the energy system is highly dependent on imports, and the integration of a high share of RES is essential [20]. In this study, different hydrological conditions were assessed, while analysing import dependency, economic cost, and CO2 emissions. The results show that energy systems with a large share of nonflexible power plants have more difficulty in adapting to wind power production.
Denmark is acknowledged as being the country with the highest share of wind power in its electricity mix. Moreover, Denmark is planning not to use fossil fuels by 2050. The article in [21] addresses the possibilities of flexible demand in the future power system. The results show that more than a quarter of the electricity demand would need to be flexible which as the authors claim, will be very difficult to realise. Another article in Denmark [22] uses EnergyPlan to study the feasible technology mix to accommodate a higher share of wind power, concluding that the Vehicle-to-Grid (V2G) could improve the short-term wind power balancing. The development of a smart power system in Denmark is addressed in [23]. The paper has the goal to identify how the use of large, combined heat and power (CHP) plants can integrate as much variable RES power and biomass as possible. The results indicate that large CHP plants in Denmark would cause a divergence between socio-economy and business and the consumption of biomass would become too high. The article in [24] suggests a methodology to assess the integration of local power systems with the national power system. The case study is located in Denmark.
In Norway, a paper addressed the use of bioenergy, wind, and solar thermal in a flexible power system to raise the share of RES in the primary energy supply [25]. It is reported that further integration of wind power would reduce imports of electricity during peak demand.
In Britain, to study the benefits of energy storage [26], a model of the regional power system was developed using the EnergyPlan tool to assess the maximum technically feasible wind penetration. The conclusion is that increasing both the interconnection capacity with the mainland and energy storage allow for a reduction in the energy supply and an increase in wind penetration permits the CO2 emissions to decline.
In Hungary, an article used the EnergyPlan software to create a model able to simulate, on an hourly basis, all sectors of the national energy system [27]. Two models were created, one comprising natural gas plus biomass, and another with only biomass. In the biomass model, the utilisation of RES almost doubles, and a decrease of 10% in CO2 emissions was reported.
Targeting a small city in southern Italy, a study assesses its conversion into a zero GHG city by 2030 [28]. The results show that by replacing conventional boilers with electric heat pumps and by using electric public transport, the goal is achievable. However, an excess production problem is identified during periods of high levels of wind power production.
In Chongming, China, the impact of high-RES penetration was investigated through the relationship between the amount of excess electricity production and various RES capacities [29]. It concludes that the combination of different RES can improve the renewables penetration. However, the study highlights that a careful plan for the PV capacity installation is vital to avoid excess electricity production. In countries where energy demand is highly related to economic and social development, the impact of energy imports, fuel costs, energy security, and CO2 emissions is becoming a serious problem. In [30], the diversification of energy resources, cost of imported fuel, CO2 emissions, and energy security during 2012–2040 is analysed. The results are encouraging, as it is claimed that the supply of primary energy will decrease marginally, while cumulative renewable energy will increase.
The future power system will be decarbonized and supported in renewable energy sources, which need to be balanced by energy storage systems. Paper [31] proposes a resource scheduling algorithm including both loads and generating units (renewable and non-renewable) composing a microgrid. The authors claim significant reductions both in CO2 emissions and electricity production costs. Energy storage systems are the focus of the paper [32]. The authors propose the main guidelines to select the most appropriate energy storage system, bearing in mind its close relationship with renewable energy sources. In [33], research results from reliable sources were gathered to summarize the current situation regarding energy development in the world, namely using renewable energy sources. The authors conclude that China should pave the way to renewable sources development based on relevant international experiences.

1.3. The Current Iberian Power System

The Iberian Peninsula is composed of Portugal and Spain, the territory and population of the latter being five times larger than the former. Portugal and Spain share a common electricity market, called MIBEL (Iberian Electricity Market).
Hereafter some numbers related to the Iberian power system in 2019, which were taken from references [34] for Portugal and [35] for Spain are offered.
The total annual demand in the Iberian Peninsula is about 300 TWh, with Portugal accounting for 50 TWh and Spain for 250 TWh. The total installed capacity is 125,150 MW (20.2 GW for Portugal and 104.95 GW for Spain). In Spain, wind is the technology with largest installed capacity (25.4 GW), closely followed by combined cycle natural gas (24.6 GW) and hydro (20.5 GW). In Portugal, hydro (7.2 GW) leads the way, followed by wind (5.2 GW) and natural gas combined cycle (4.6 GW). Concerning the electricity production by source, in Portugal, 32% of the demand was produced by combined cycle power plants (20% in Spain), 27% by wind generators (21% in Spain), and 17% by hydro (10% in Spain). It should be mentioned that 2019 was a moderate dry year and that nuclear plants produced 22% of the demand in Spain, Portugal does not have this technology.

1.4. Paper Organization

The paper is organized as follows. In Section 2, the software used (EnergyPlan) is presented, and the results of the model calibration are explained. The considered scenarios and the simulation conditions and assumptions are disclosed in Section 3. Section 4 shows the results obtained and the respective discussion. Finally, in Section 4, the main conclusions of the study are drawn.

2. Materials and Methods

2.1. EnergyPlan Software and Model Calibration

2.1.1. EnergyPlan Software

To perform the simulations in this paper, EnergyPlan [36] was used. This tool uses an hourly model to simulate the energy system over one year. It allows users to simulate the whole energy infrastructure of a territory, considering potential synergies between the different sectors. The input includes levels of renewable energy, thermal, storage/conversion, transport technologies, and costs to simulate the entire national or regional energy system.
There are two general categories of regulation strategies in EnergyPlan: market economic and technical. In market economic regulation, the model dispatches units according to short-term marginal costs, and in technical regulation, the model dispatches units according to optimal technical performance.
EnergyPlan software was chosen because it is user-friendly and has a large amount of information available online. It allows the creation of an energy system model of a country or region, by generating an hourly simulation with all consumption sectors and a focus on the integration of fluctuating RES [7].

2.1.2. Model Year and Simulation

EnergyPlan is a tool particularly aimed at simulating future power systems. For the software to be able to perform these simulations, it must be calibrated against the real-world results of a reference year. The year 2017 was selected as a reference year because all the data required was readily available.
EnergyPlan requires hourly load diagrams for renewable and nuclear technologies, as well as with the demand diagram. The load diagrams are built upon information made available by the Portuguese and Spanish Transmission System Operators (TSO) are shown in Figure 1. Moreover, Figure 1 also depicts the demand diagram used in the simulations.
Referring to Figure 1, 2017 was a severe dry year, and that Concentrating Solar Power (CSP) is only present in Spain with 2.3 GW of installed capacity as of 2017.
Negative values in the hydro production diagram time series (Figure 1f) represent periods in which the water pumping consumed more power than the power generated. The production diagrams (chronological power versus time—Figure 1) have been normalized, i.e., each point (output power) was divided by the rated capacity of the concerned technology. For instance, if the abscissa is 40% in a particular hour, this means the technology generated 40% of the rated capacity, in that hour.
EnergyPlan considers nuclear and biomass together, as well as natural gas and coal. For the technologies’ efficiencies, the default values were used [37]: nuclear: 33%, coal, and natural gas: 55% (combined efficiency), and biomass: 12%. The technical simulation seeks to identify the least fuel-consumption solution, and the market economic simulation seeks the least-cost simulation based on the cost of each production unit. For the model year analysis, the choice of using the technical simulation over the market economic simulation prevailed, because it takes into consideration the consumption of each technology over their price. Table 1 shows the real-world results, the model year results, and the error.
The obtained error values are in line with the expectations, which means the EnergyPlan foresees a result that is similar to what happened in 2017. This successful calibration validates the model built in EnergyPlan.
It is notable that the import/export balance is missing in Table 1. The Iberian Peninsula imported electricity, 1.21 TWh (0.4% of the demand), in 2017. The import/export are strongly dependent on particular market conditions, namely in neighbouring countries, which are not possible to simulate in EnergyPlan. Considering that the value is insignificant, the common practice in similar studies (as the ones identified in the literature review) was adopted and a null import/export balance was assumed. This procedure will be adopted in future simulations.
Portugal and Spain are the two countries that formed MIBEL, the Iberian Electricity Market, where most of the electricity transactions take place. This explains why a single market for the two countries was simulated. The Iberian Peninsula has interconnections with France and Morocco. The import/export between the Iberian Peninsula and these neighbouring countries depends upon the market conditions and the available interconnections, and therefore are very difficult to predict. Currently, the interconnections are weak, thus making the imports/exports a small percentage of the Iberian electricity consumption. Furthermore, a significant increase in the available transfer capacity is not foreseen in the coming years due to geographical adverse conditions. This justifies the option to consider zero electricity exchanges between the Iberian Peninsula and France and Morocco.

2.2. Scenarios and Simulation Conditions

To carry out the Iberian Peninsula power system simulation until the year 2040, projections for the electricity demand, technologies’ capacity, RES distribution profiles are needed, as this is the input of the EnergyPlan software.
In this paper, three different projections for the future Iberian power system were considered.
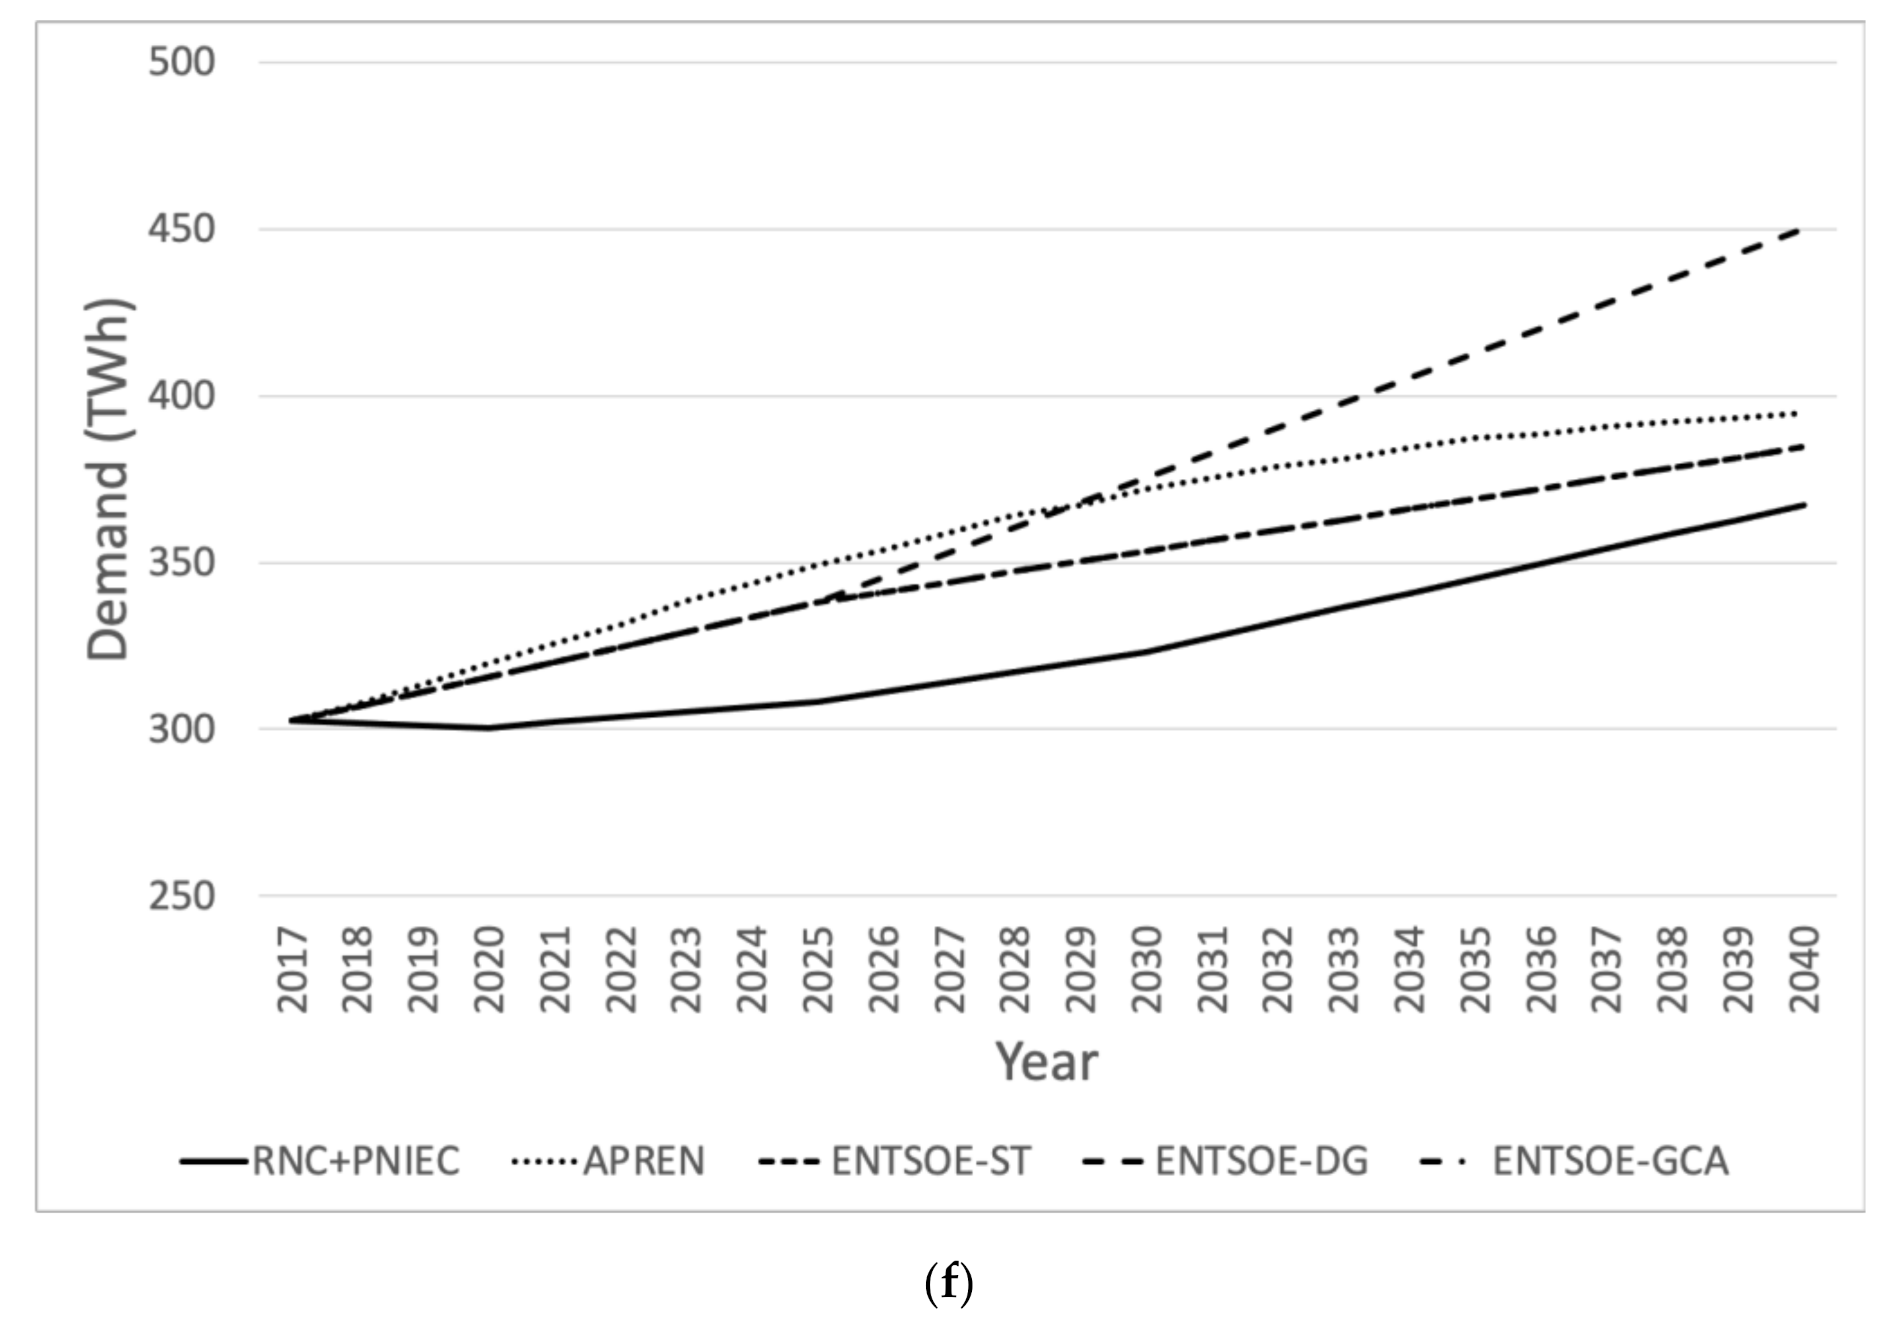
  • Public projection—This projection consists of the forecasts of both Portuguese and Spanish governmental offices. They are based on documents issued by the energy sector responsible ministries: Roadmap to Carbon Neutrality (RNC) from Portugal and Integrated National Plan for Energy and Climate (PNIEC) from Spain. This projection will be named RNC + PNIEC.
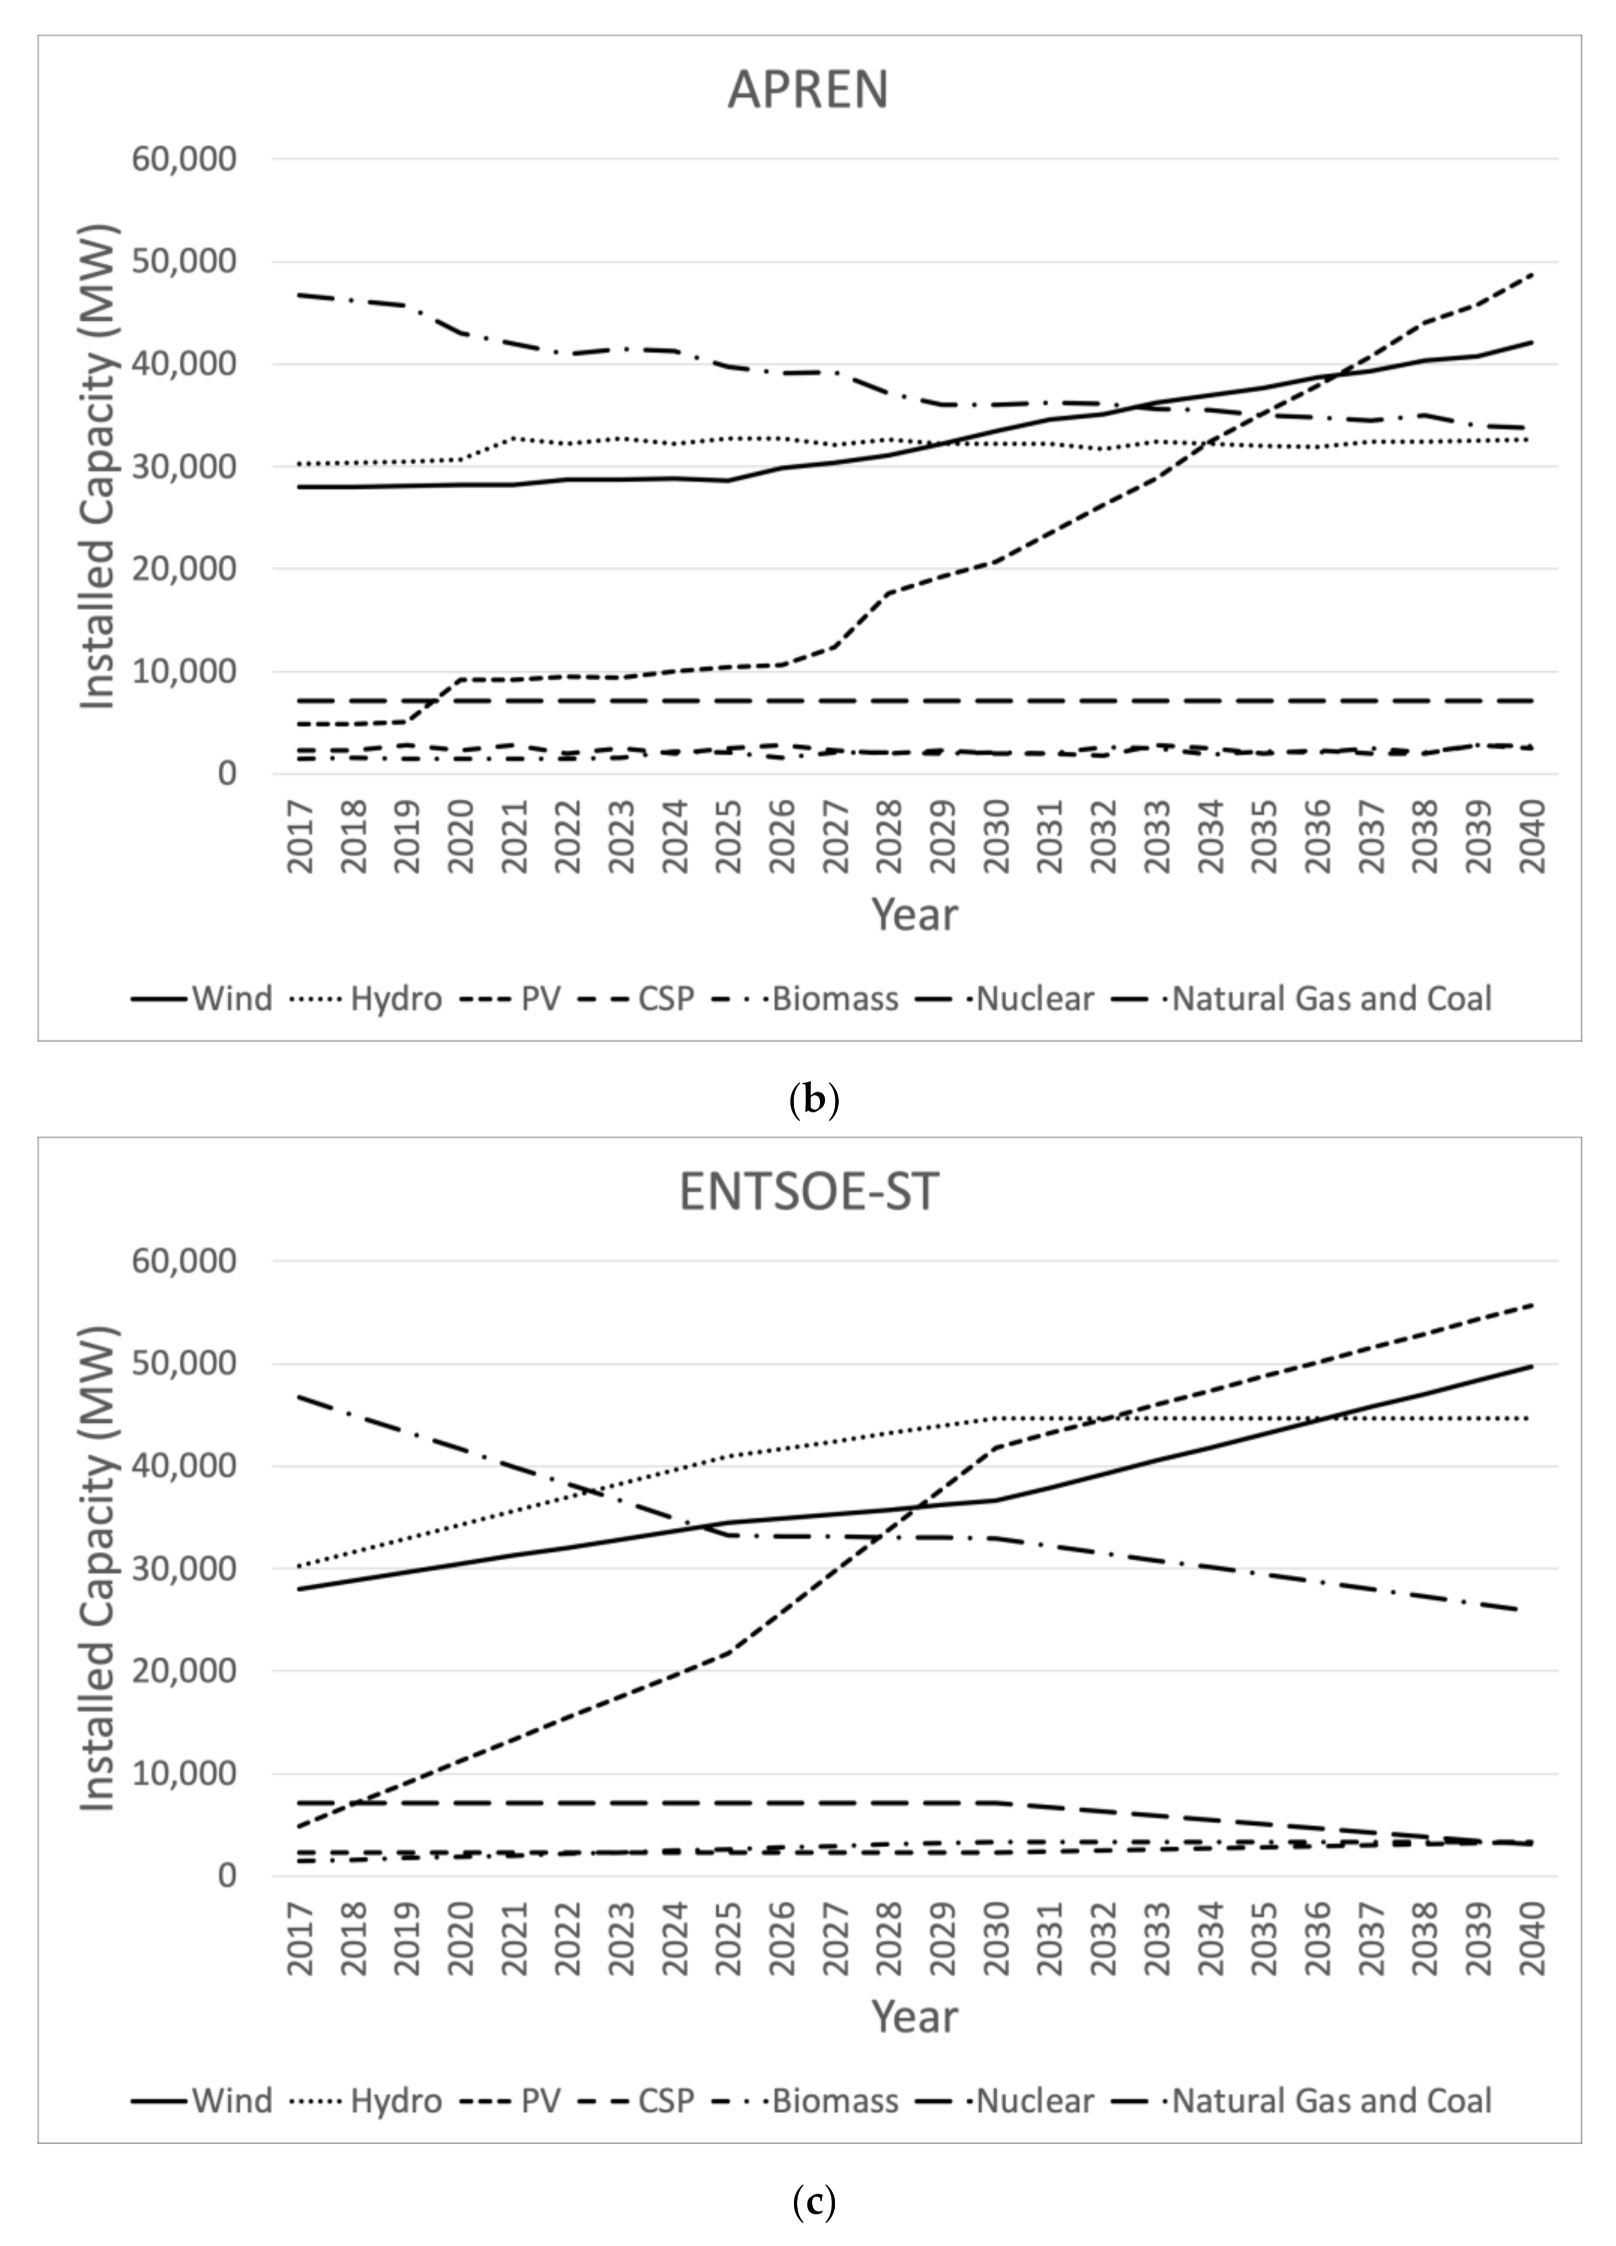
  • Private projection—This projection was issued by the Portuguese Association of Renewable Energy Producers (APREN) and contains forecasts for the Iberian Peninsula. This projection is named APREN.
  • ENTSO-E projection—This is the projection from the European Network of Transmission System Operators for Electricity (ENTSO-E). This forecast will be referred to as ENTSO-E and considers three different scenarios:
    a.
    The Sustainable Transition projection (ENTSOE-ST) assumes the replacing of coal with natural gas in the power sector.
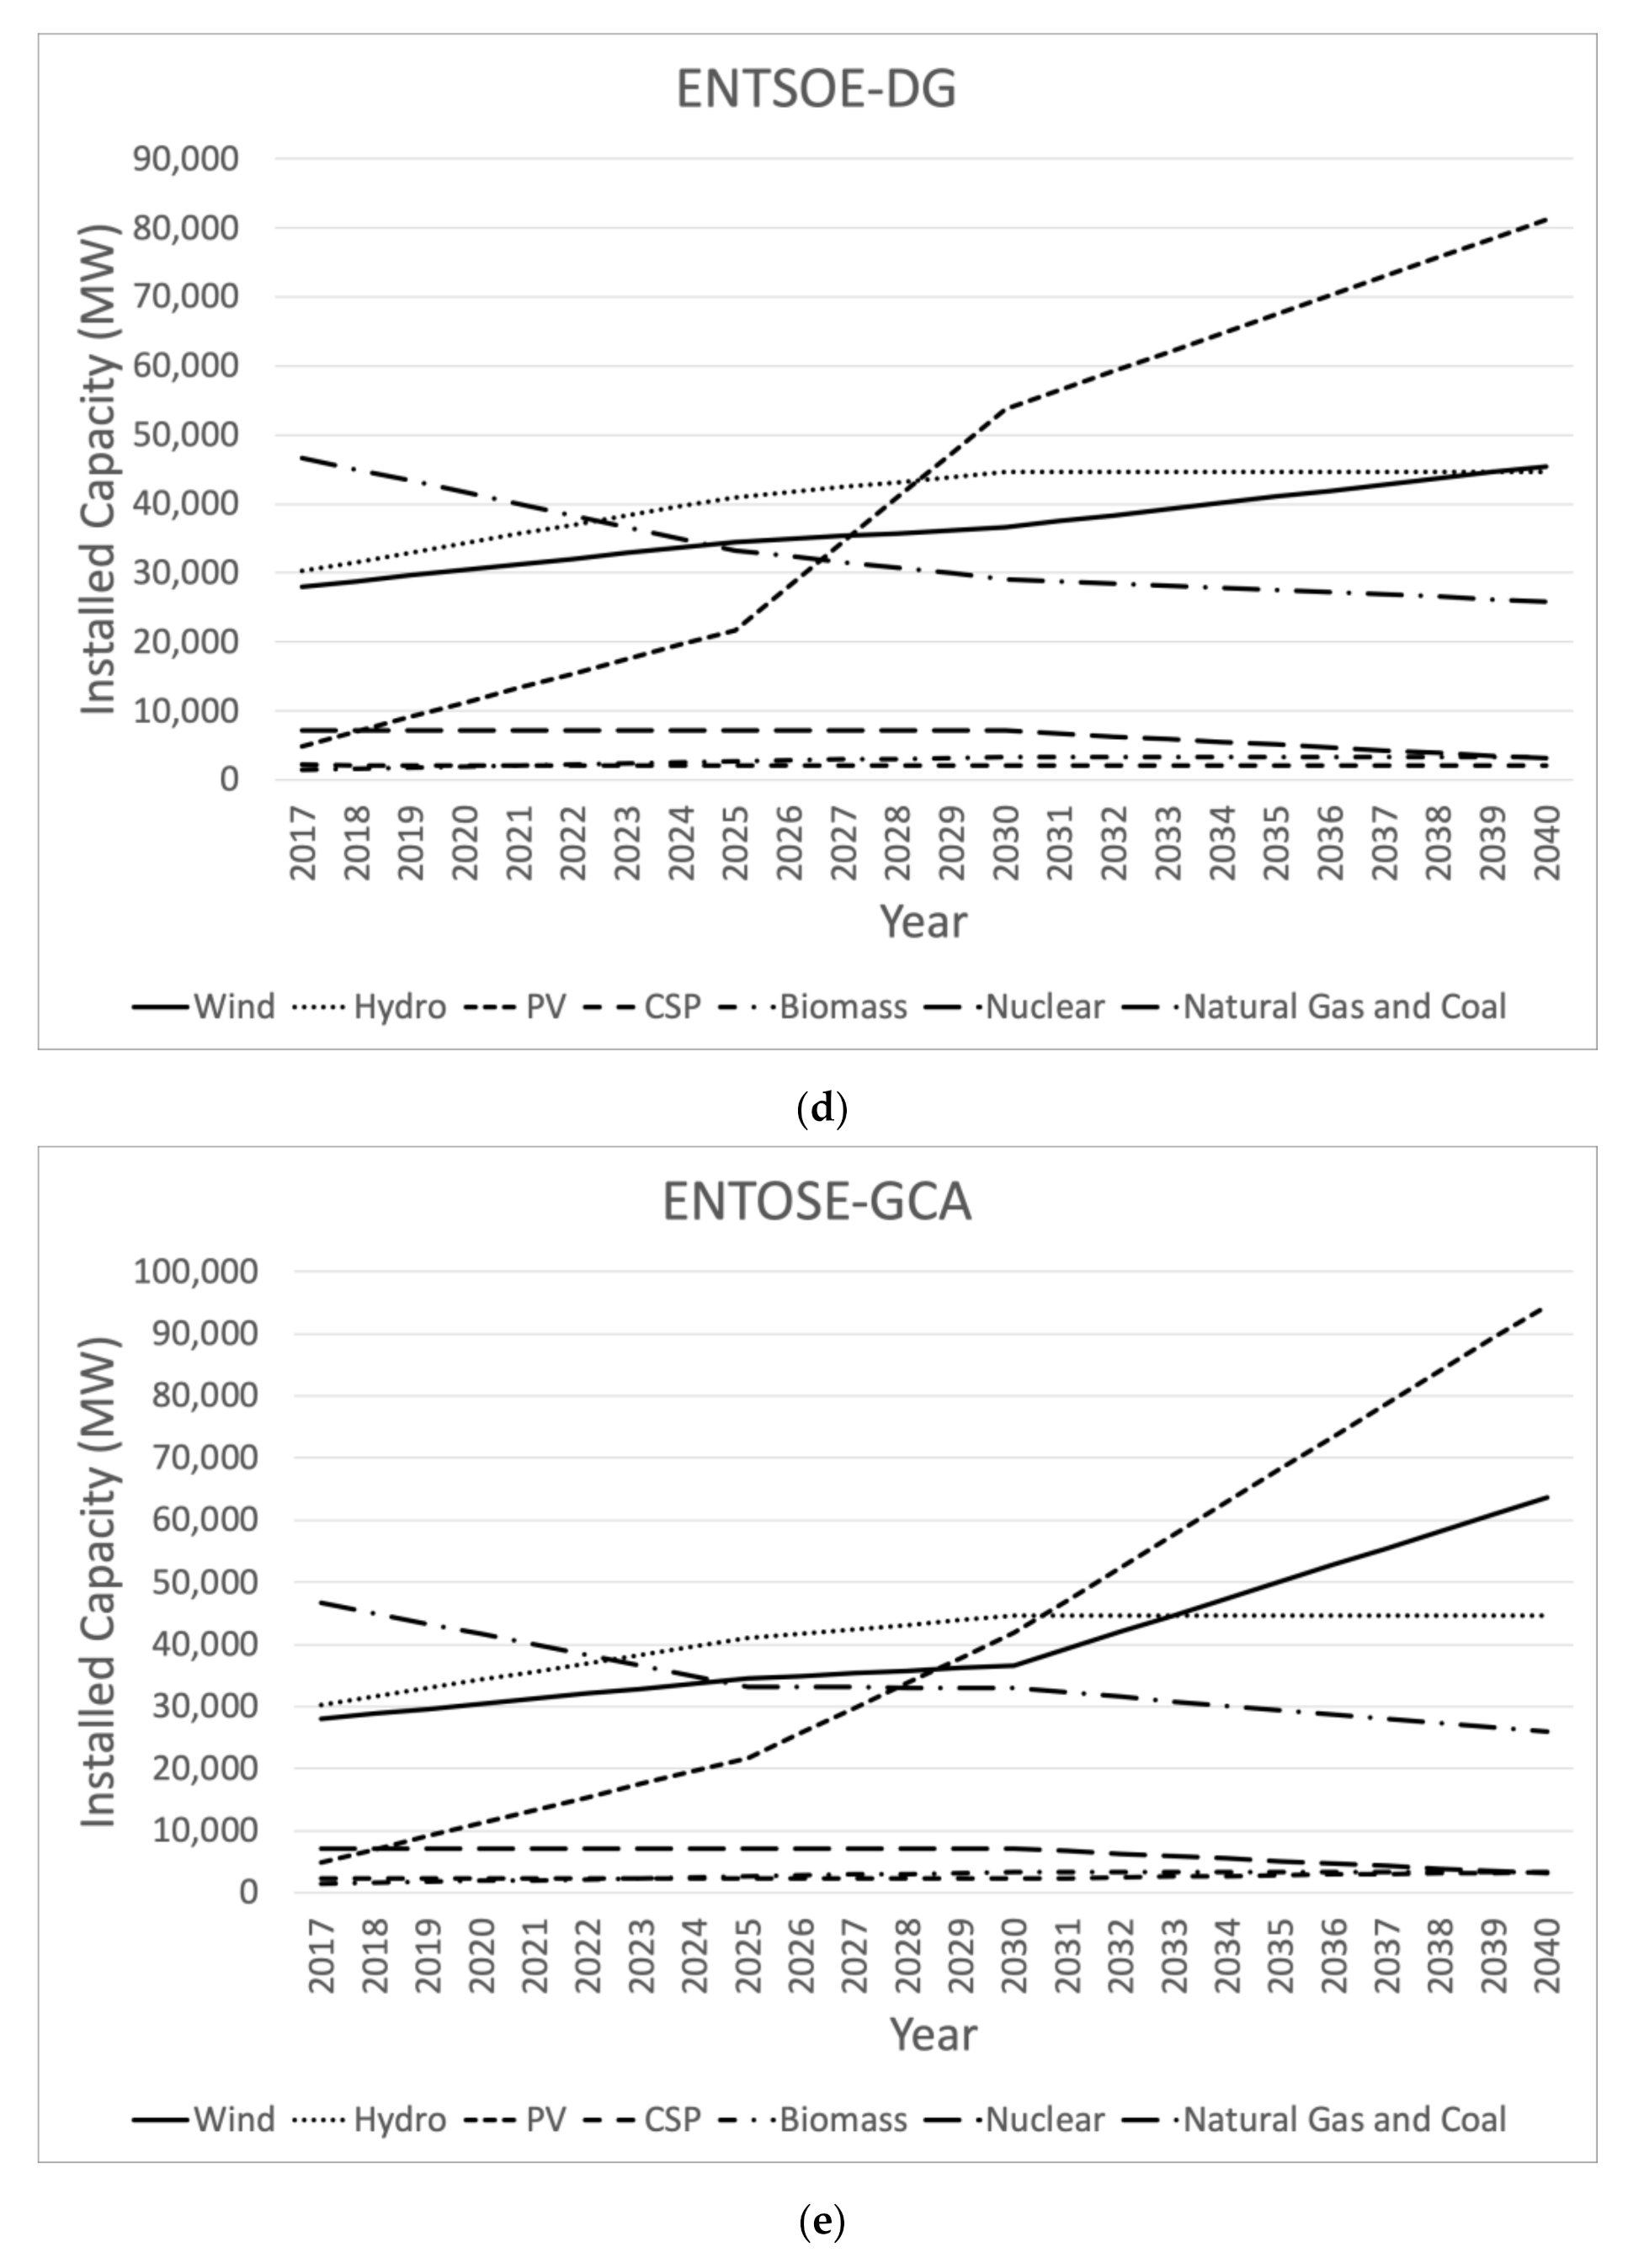
    b.
    The Distributed Generation projection (ENTSOE-DG), which represents a more decentralized development with a focus on end-user technologies, enabling efficient usage of renewable energy resources.
    c.
    The Global Climate Action projections (ENTSOE-GCA), which call for accelerated global decarbonization and large-scale RES development.
The RES distribution profiles were scaled to the new capacities from the 2017 profiles.
For each simulation, three different hydro distribution profiles were considered, a dry, an average, and a wet scenario. These distribution profiles (hourly load diagrams) were taken from the year 2017 (severe dry year), the year 2016 (wet year), and 2011 (almost an average year). The considered hydro profiles are shown in Figure 2.
The renewables are often called Variable Renewable Energy Sources (VRES). However, their variability depends on the considered time scale. On a year-by-year basis, hydropower is highly variable because it is strongly dependent on rainfall. On the contrary, solar power is fairly constant because the solar resource is more or less constant from one year to the other. Wind production is also very predictable yearly, despite being highly variable on an hourly or daily basis. The capability index measures the ratio of the produced energy in a particular year to the energy produced in an average year. In Portugal, the 20-years average hydro capability index is 0.89, with a maximum of 1.33 and a minimum of 0.41. The same metrics applied to the wind (solar) capability index provide an average of 1.02 (0.97), with a maximum of 1.18 (1.01) and a minimum of 0.91 (0.90). This explains the necessity of considering wet, dry, and average years to take into account the high variability of the annual hydro production. Concerning the wind and solar technologies this is not necessary because these technologies have a fairly constant production each year, regardless of the hourly distribution along the hours of the year.
This addition increases the number of simulations. However, the confidence levels also increased because rain conditions tend to be very different each year. This issue shows a strong influence on electricity generated by a source, especially in countries with a significant hydro component, as is the case of Portugal and Spain.
The three predictions foresee different values for the evolution of the demand till 2040. In this year, the highest forecast is from ENTSOE-DG with 450 TWh and the lowest from RNC + PNIEC with 367 TWh, and APREN forecasts 395 TWh of demand.
Figure 3 shows several generating capacity predictions, starting in the model year 2017 and ending in 2040. Moreover, the growing demand forecasts made by the several considered entities are also shown.
The available data did not include forecasts for all years but only for every 5 years. A linear interpolation was considered to fill in the gaps.
Regarding Figure 3, it is apparent that the power generation forecasts are different. However, common trends may be identified. A strong boost in PV power is expected, becoming the leading technology by 2040. The dimension of this dominance is uncertain: for APREN it will reach 50 GW, for ENTSOE-GCA, this value can double. Regarding wind power, a steady increase is predicted by all forecasts, yet not reaching the value for the PV installed capacity. Hydro is foreseen to show a slight decrease in the installed capacity, due to the lack of appropriate sites to install new hydro facilities. Fossil fuel-fired power plants are likely to decrease their installed capacity, mainly due to the decommissioning of coal power plants [4]. For the same decommissioning reasons, nuclear power is expected to decrease also.
The purpose of this paper is to investigate if respected entities’ projections for the future installed capacity in the Iberian Peninsula power system meet the EC targets in terms of renewables share and CO2 emissions in the 2040 horizon. The results (Figure 3) are different because the considered entities envisage the development of the future Iberian power system differently. The projection from the Portuguese and Spanish government entities (RNC + PNIEC) is the one that most likely will happen and stands out as the one that fulfils the EC challenges. Therefore, more attention was devoted to this projection.
In this paper, an economic assessment of the costs involved in installing and operating and maintaining (O&M) the generating technologies foreseen by each projection is carried out. For prudence, the default costs as indicated in EnergyPlan were largely used, which were found reasonable in light of the current knowledge on power systems costs. When applicable, additional costs were retrieved from [38,39]. For convenience, the considered costs were copied in Table 2 (investment, lifetime, and fixed O&M), Table 3 (variable O&M), and Table 4 (fuel price).
EnergyPlan considers the CO2 emissions price equal to 29.45 EUR/ton and the discount rate equal to 9.2%.
At this point, it is recalled that the targets set by the EC are 20% and 40% reduction of CO2 emissions by 2020 and 2030, respectively, relative to 1990 levels, and 20% and 32% of RES penetration in the gross final energy by 2020 and 2030, respectively. EnergyPlan will be used to simulate the Iberian power system, from 2020 to 2040, and check if the Iberian electricity sector can achieve these goals or not. Table 5 shows the CO2 emissions in 1990 and the CO2 emissions targets by 2020 and 2030.
Recalling that an import/export balance equal to zero was imposed. However, it is most likely that the Iberian power system shows excess production. This variable is monitored in EnergyPlan and is called CEEP (Critical Excess Electricity Production). In a real power system, there is no excess production, because it would lead to frequency unbalances and eventually grid collapse. In this study, the option of using the CEEP to pump water up to the dams was used, in the already existing pumping stations, and to charge batteries that need to be installed in the future. The required yearly installed capacity of batteries is an output of EnergyPlan.
According to the EnergyPlan manual [37], the technical simulation minimises the import/export of electricity and seeks to identify the least fuel-consumption solution. The market-economic simulation identifies the least-cost simulation based on the business-economic costs of each production unit. The latter uses water pumping to perform energy arbitrage, consuming fossil fuel-based electricity and, therefore, increasing CO2 emissions; the former uses water pumping to absorb the CEEP. In light of the objectives of this study, it was decided to use the technical simulation mode to perform the simulations.
Another important EnergyPlan parameter is the Minimum Grid Stabilization Share (MGSS). The MGSS represents the share of total electricity production in every hour that has to come from a grid stabilising unit, i.e., a fossil fuel power plant, due to its power regulating capacity. Currently, grid stabilizing units are essential, due to their power control capability. In the future, with a growing renewable power system, the function of the grid stabilizing units can be replaced by storage devices, with appropriate inertia emulation. Therefore, a 15% MGSS from 2020 to 2025 and a 0% MGSS from 2025 on have been considered.
As seen, a 0% MGSS was considered from 2025 on. This option was chosen to prevent any operational limitations due to the considered MGSS and to prioritise the dispatch of renewable energy sources. In the simulated scenarios, this problem is not relevant because the Iberian power system has enough inertia provided by the synchronous generators of the hydropower stations. Additionally, renewable sources grid-connected through power electronics can provide synthetic inertia.

3. Results and Discussion

In this section, the simulation results are presented and discussed. As it was previously highlighted, hydro production plays a significant role in the Iberian electricity system and therefore the different weather conditions must be considered. Figure 4 shows the CO2 emissions as predicted by the five projections used in this work, as well as the European CO2 emissions targets, for the different hydro scenarios.
Some conclusions can be drawn from Figure 4.
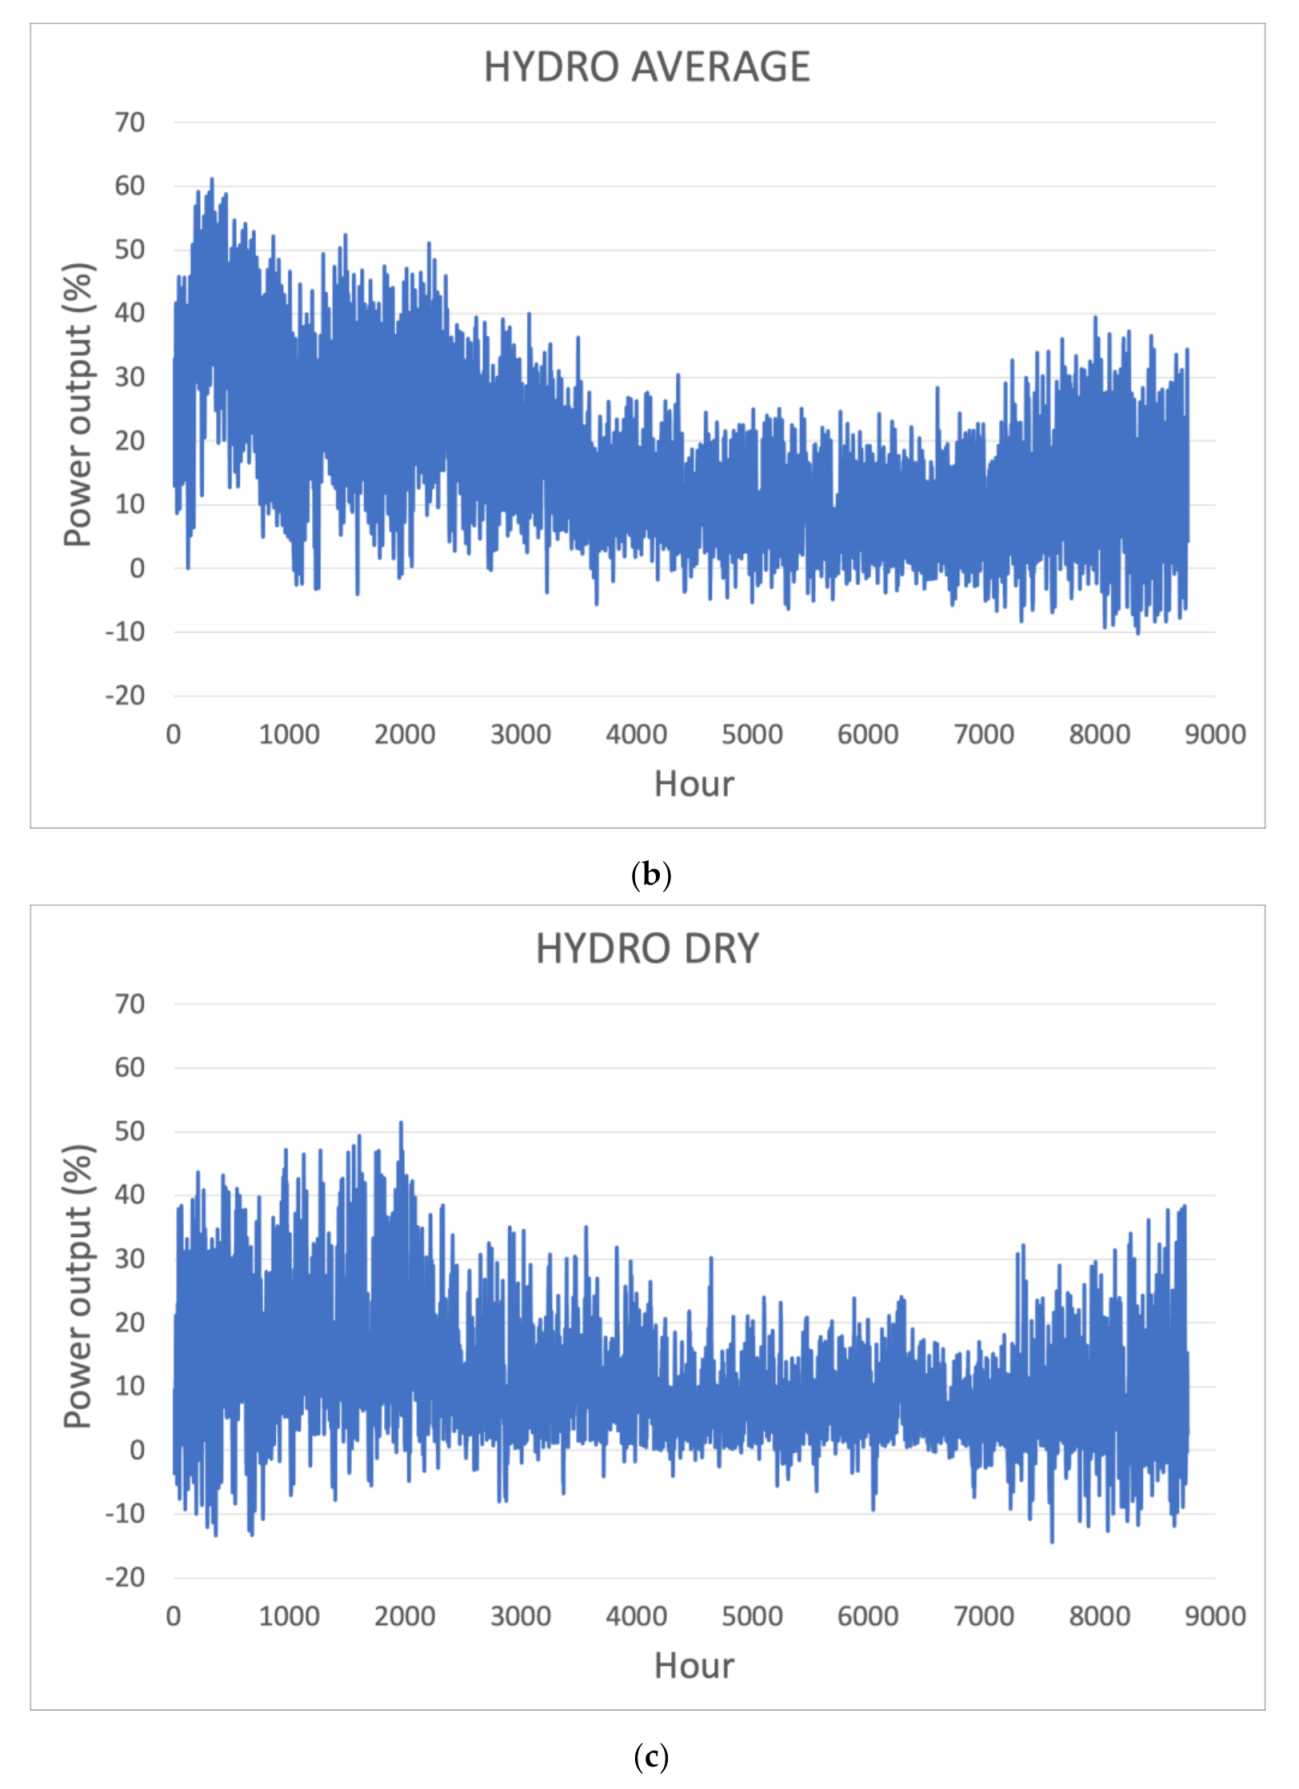
  • European CO2 emissions targets are easier achieved in wet hydro scenarios than in dry scenarios.
  • In the dry scenario, only the power system projected by RNC + PNIEC (public projection) can achieve the European CO2 emissions targets. Moreover, this power system attains the CO2 emissions targets in every hydro scenario.
  • The power system as predicted by the private projection made by APREN is unable to achieve the European objectives for the CO2 emissions regardless of the hydro conditions.
  • The ENTSOE projections struggle to achieve the CO2 emissions targets in the dry scenario but manage to cope with the targets on the remaining hydro conditions.
  • From 2030 onwards, a further decrease in CO2 emissions is expected. ENTSOE-DG projection is the exception, due to a slower replacement of fossil fuel plants.
Figure 4 shows a comparison of how all the considered projections respond to the CO2 emissions target challenge set by the EC. From the results obtained, it is clear that the projection by RNC + PNIEC is the one that allows for the fulfilment of the EC target in all the hydro scenarios (dry, average and wet). Therefore, the conclusions from Figure 4 highlight this achievement. Furthermore, the RNC + PNIEC projection is the one that most probably will happen, thus deserving a highlight.
In what concerns the second European objective, regarding the RES share in the gross final energy consumption, the RES share in the electricity sector will be analysed, to find out if in this sector the targets are achieved. Figure 5 portrays the RES share in the Iberian electricity consumption. Once again, the three graphics are related to the three hydro scenarios.
It is concluded, from Figure 5, that in the electricity sector, the situation concerning the minimum RES share in the electricity demand is very comfortable, for all the projections. The power system designed by the five projections can easily achieve the 32% objective set by the EC. The public projection, by RNC + PNIEC, points to a 100% renewable power system in 2040, regardless of the weather conditions. The private projection, by APREN, is the most pessimistic, forecasting that in 2040 the fossil fuel and nuclear contribution to the electricity supply will be still significant. The projection from ENTSOE-GCA points to almost the same values as the RNC + PNIEC forecast.
The objectives set by the EC apply to all the EU member-states. However, given the advantageous weather conditions, the governments of Portugal and Spain decided to set more ambitious goals and accelerate the decarbonization of the Iberian Peninsula towards a 100% renewable power system in the 2040 horizon. As seen in Figure 5, this objective is achievable even in the dry scenario. This is to be attained mainly by a sharp increase in PV installed capacity as can be verified in Figure 3.
In Figure 6, the generating technologies annualized costs, for each hydro scenario, are shown. The annualized cost is the sum of the investment annuity, the fixed and variable O&M, and the variable costs (fuel and CO2 emissions).
From Figure 6, it is possible to conclude that, depending on the hydro scenario, the annualized costs may vary between EUR 23 and 31 billion. Till 2030, the cheapest power system, in all hydro scenarios, is the one projected by the public forecast (RNC + PNIEC). From 2030 to 2040, the power system projected by ENTSOE-GCA is the cheapest. The power system devised by APREN is the more expensive. In general, the power system is cheaper in the wet scenario, because of the increased electricity produced by hydropower plants.
The batteries’ capacity that is required to install to obtain a zero CEEP is depicted in Figure 7 for the three hydro scenarios under analysis.
In the wet hydro scenario, when more renewable energy is produced, larger batteries capacity is required to store the higher CEEP. By 2040, considering this scenario, the ENTSOE-GCA projections point to a total battery installed capacity of almost 7.5 GW, followed by the RNC + PNIEC projection that would need almost 5.5 GW of batteries installed capacity. The difference for the hydro dry scenario is significant; ENTSOE-GCA and RNC-PNIEC point to 5.2 and 3.6 GW of batteries installed capacity, respectively. It is important to highlight that the need for batteries increases exponentially from 2030 onwards. For instance, in the hydro dry scenario, by 2030, only 800 MW and 170 MW of batteries’ capacity are required in the RNC + PNIEC and ENTSOE-GCA projections, respectively. The APREN private projection is the more modest in the total generating technologies installed capacity, this explaining that, for instance, in 2030, in the hydro dry scenario, only 30 MW of batteries are needed.
The electrical interconnections between the Iberian Peninsula and the neighbouring countries (France and Morocco) are weak and the geographical conditions prevent significant improvements on the available transfer capacity. Therefore, the Iberian Peninsula options for external exchange are very limited. On the other hand, the possibility of internal exchange between the two Iberian countries to deal with congestions motivated by the renewables’ variability is also limited, due to geographical proximity. When it is windy or sunny in Portugal, the same thing is likely to happen in Spain. Under these circumstances, the governments of Portugal and Spain are relying on storage systems to deal with renewables’ variability rather than cross-border trading with neighbouring countries.
The main objective of the energy storage systems is to compensate for the renewables’ variability. They charge when there is a production surplus and discharge when there is a production deficit. The stored energy is dispatched, when necessary, i.e., when the renewable production is unable to meet the load as if the renewable energy was produced at that moment. So, no excess energy is obtained. Furthermore, the storage devices can be charged during valley hours using the available excess renewable production.

4. Conclusions

All over Europe, there is currently great concern about the paths towards a decarbonization of the electricity sector. The European Commission (EC) has set ambitious targets to reduce CO2 emissions and to increase the Renewable Energy Resources (RES) share. In the Iberian Peninsula (Portugal and Spain), several governmental and non-governmental entities have issued forecasts about the evolution of the installed capacity for the 2040 horizon. Additionally, the European Association of Transmission System Operators (ENTSOE) has published forecasts, considering several scenarios on the pace of the energy transition.
Based on several projections, the Iberian power system was simulated from the years 2020 to 2040. The objective of the simulations was to check if the EC set targets for the 2030 CO2 emissions and RES share was fulfilled by the Iberian power system, considering the different projections. Furthermore, an economic assessment of the future power system was included, as well as a study on the storage needs to compensate for the RES variability and to replace the power regulating capacity of today’s fossil fuel power plants.
Hydropower plants are a valuable asset of the Iberian generating system. Current figures indicate that about one-quarter of the total installed capacity in the Iberia is hydro, making the precipitation levels strongly important in the produced hydro energy every year. For this reason, the analysis was performed considering three hydro scenarios: dry, average, and wet.
The paper offers a discussion on the feasibility of the EC’s targets regarding each of the five projections considered. The Iberian governments’ projection (RNC + PNIEC) is most likely the one that will happen. Therefore, the conclusions below concern only this projection.
The study concluded that the Iberian governmental plans allow to more than accomplish the EC’s targets to 2030, showing a substantial reduction in CO2 emissions, as far as the electricity sector is concerned. For instance, in the hydro average scenario, the CO2 emissions forecasted by the RNC + PNIEC projection are about one-half of the EC’s target for 2030. Additionally, the conclusions of the study show that all projections comfortably accomplish the EC’s targets related to the RES share by 2030. In particular, the governmental projection indicates a RES share of about 80%, for the hydro average scenario, when the set target was 32% by 2030.
The same projection showed the cheapest power system until 2030, with an annualized cost of around EUR 24 thousand million, in the hydro average scenario. As the Iberian system is likely to have an excess of electricity production, the need for storage devices will increase. In the hydro average scenario, 4500 MW of storage is likely to be needed to manage the surplus electricity. This is a consequence of the decarbonization of the electricity sector, as the power regulating features of the fossil fuel plants are essential and need to be replaced by storage options, with the appropriate level of inertia emulation.
Portugal and Spain are on the path to achieve carbon neutrality by 2050. As far as the power system is concerned, this route implies the continuation of the aggressive policy of increasing the renewables share, currently being followed. This paper demonstrated that the EC targets are easily surpassed, and carbon neutrality is achievable by 2050, should the governmental plans for the installation of a high share of renewables be succeeded.

Author Contributions

Conceptualization, R.C.; methodology, R.C.; software, G.M.P.; validation, P.S.; formal analysis, P.S.; investigation, G.M.P.; resources, R.C.; data curation, G.M.P.; writing—original draft preparation, G.M.P.; writing—review and editing, R.C.; visualization, P.S.; supervision, R.C.; project administration, R.C.; funding acquisition, R.C. All authors have read and agreed to the published version of the manuscript.

Funding

This research was funded by national funds through Fundação para a Ciência e Tecnologia (FCT), grant number UIDB/50021/2020 and UIDB/00308/2020.

Acknowledgments

The authors wish to thank Matthew Gough for his valuable proofread of the manuscript.

Conflicts of Interest

The authors declare no conflict of interest. The funders had no role in the design of the study; in the collection, analyses, or interpretation of data; in the writing of the manuscript, or in the decision to publish the results.

References

  1. United Nations. The Paris Agreement. 2018. Available online: https://unfccc.int/process-and-meetings/the-paris-agreement/the-paris-agreement (accessed on 18 October 2019).
  2. European Commission. 2050 Long-Term Strategy. 2019. Available online: https://ec.europa.eu/energy/en/topics/energy-strategy-and-energy-union/2050-long-term-strategy (accessed on 2 September 2019).
  3. European Commission. Going Climate-Neutral by 2050. 2018. Available online: https://ec.europa.eu/clima/sites/clima/files/long_term_strategy_brochure_en.pdf (accessed on 20 April 2019).
  4. EDP—Energias de Portugal. SA Information to the CMVM Market. Available online: https://web3.cmvm.pt/english/sdi/emitentes/docs/FR71140.pdf (accessed on 15 November 2020).
  5. Østergaard, P.A. Reviewing EnergyPLAN simulations and performance indicator applications in EnergyPLAN simulations. Appl. Energy 2015, 154, 921–933. [Google Scholar] [CrossRef]
  6. Prina, M.G.; Cozzini, M.; Garegnani, G.; Manzolini, G.; Moser, D.; Oberegger, U.F.; Pernetti, R.; Vaccaro, R.; Sparber, W. Multi-objective optimization algorithm coupled to EnergyPLAN software: The EPLANopt model. Energy 2018, 149, 213–221. [Google Scholar] [CrossRef]
  7. Prina, M.G.; Lionetti, M.; Manzolini, G.; Sparber, W.; Moser, D. Transition pathways optimization methodology through EnergyPLAN software for long-term energy planning. Appl. Energy 2018, 235, 356–368. [Google Scholar] [CrossRef]
  8. Fernandes, L.; Ferreira, P. Renewable energy scenarios in the Portuguese electricity system. Energy 2014, 69, 51–57. [Google Scholar] [CrossRef] [Green Version]
  9. Pereira, S.; Ferreira, P.; Vaz, A. Short-term electricity planning with increase wind capacity. Energy 2014, 69, 12–22. [Google Scholar] [CrossRef]
  10. Pina, A.; Silva, C.A.S.; Ferrao, P. High-resolution modeling framework for planning electricity systems with high penetration of renewables. Appl. Energy 2013, 112, 215–223. [Google Scholar] [CrossRef]
  11. Gomes, J.G.; Pinto, J.M.; Xu, H.; Zhao, C.; Hashim, H. Modeling and planning of the electricity energy system with a high share of renewable supply for Portugal. Energy 2020, 211, 118713. [Google Scholar] [CrossRef]
  12. Arcos-Vargas, A.; Nuñez, F.; Román-Collado, R. Short-term effects of PV integration on global welfare and CO2 emissions. An application to the Iberian electricity market. Energy 2020, 200, 117504. [Google Scholar] [CrossRef]
  13. Zappa, W.; Junginger, M.; Broek, M.V.D. Is a 100% renewable European power system feasible by 2050? Appl. Energy 2018, 233–234, 1027–1050. [Google Scholar] [CrossRef]
  14. Connolly, D.; Lund, H.; Mathiesen, B.V. Smart Energy Europe: The technical and economic impact of one potential 100% renewable energy scenario for the European Union. Renew. Sustain. Energy Rev. 2016, 60, 1634–1653. [Google Scholar] [CrossRef]
  15. Brown, T.; Schlachtberger, D.; Kies, A.; Schramm, S.; Greiner, M. Synergies of sector coupling and transmission reinforcement in a cost-optimised, highly renewable European energy system. Energy 2018, 160, 720–739. [Google Scholar] [CrossRef] [Green Version]
  16. Thellufsen, J.Z.; Lund, H. Cross-border versus cross-sector interconnectivity in renewable energy systems. Energy 2017, 124, 492–501. [Google Scholar] [CrossRef]
  17. Dominkovic, D.F.; Bačeković, I.; Ćosić, B.; Krajacic, G.; Pukšec, T.; Duić, N.; Markovska, N. Zero carbon energy system of South East Europe in 2050. Appl. Energy 2016, 184, 1517–1528. [Google Scholar] [CrossRef] [Green Version]
  18. Koltsaklis, N.; Dagoumas, A.S.; Kopanos, G.M.; Pistikopoulos, E.N.; Georgiadis, M.C. A spatial multi-period long-term energy planning model: A case study of the Greek power system. Appl. Energy 2013, 115, 456–482. [Google Scholar] [CrossRef]
  19. Komušanac, I.; Ćosić, B.; Duić, N. Impact of high penetration of wind and solar PV generation on the country power system load: The case study of Croatia. Appl. Energy 2016, 184, 1470–1482. [Google Scholar] [CrossRef] [Green Version]
  20. Cerovac, T.; Ćosić, B.; Pukšec, T.; Duić, N. Wind energy integration into future energy systems based on conventional plants—The case study of Croatia. Appl. Energy 2014, 135, 643–655. [Google Scholar] [CrossRef] [Green Version]
  21. Kwon, P.S.; Østergaard, P. Assessment and evaluation of flexible demand in a Danish future energy scenario. Appl. Energy 2014, 134, 309–320. [Google Scholar] [CrossRef]
  22. Pillai, J.R.; Heussen, K.; Østergaard, P.A. Comparative analysis of hourly and dynamic power balancing models for validating future energy scenarios. Energy 2011, 36, 3233–3243. [Google Scholar] [CrossRef]
  23. Lund, R.S.; Mathiesen, B.V. Large combined heat and power plants in sustainable energy systems. Appl. Energy 2015, 142, 389–395. [Google Scholar] [CrossRef]
  24. Thellufsen, J.Z.; Lund, H. Roles of local and national energy systems in the integration of renewable energy. Appl. Energy 2016, 183, 419–429. [Google Scholar] [CrossRef]
  25. Hagos, D.A.; Gebremedhin, A.; Zethraeus, B. Towards a flexible energy system—A case study for Inland Norway. Appl. Energy 2014, 130, 41–50. [Google Scholar] [CrossRef]
  26. Edmunds, R.; Cockerill, T.; Foxon, T.; Ingham, D.; Pourkashanian, M. Technical benefits of energy storage and electricity interconnections in future British power systems. Energy 2014, 70, 577–587. [Google Scholar] [CrossRef] [Green Version]
  27. Sáfián, F. Modelling the Hungarian energy system—The first step towards sustainable energy planning. Energy 2014, 69, 58–66. [Google Scholar] [CrossRef]
  28. De Luca, G.; Fabozzi, S.; Massarotti, N.; Vanoli, L. A renewable energy system for a nearly zero greenhouse city: Case study of a small city in southern Italy. Energy 2017, 143, 347–362. [Google Scholar] [CrossRef]
  29. Liu, L.; Zhu, T.; Pan, Y.; Wang, H. Multiple energy complementation based on distributed energy systems—Case study of Chongming county, China. Appl. Energy 2016, 192, 329–336. [Google Scholar] [CrossRef]
  30. Lin, B.; Raza, M.Y. Analysis of energy security indicators and CO2 emissions. A case from a developing economy. Energy 2020, 200, 117575. [Google Scholar] [CrossRef]
  31. Golpîra, H. Smart Energy-Aware Manufacturing Plant Scheduling under Uncertainty: A Risk-Based Multi-Objective Robust Optimization Approach. Energy 2020, 209, 118385. [Google Scholar] [CrossRef]
  32. Olabi, A.; Abdelkareem, M. Energy storage systems towards 2050. Energy 2020, 219, 119634. [Google Scholar] [CrossRef]
  33. Li, L.; Lin, J.; Wu, N.; Xie, S.; Meng, C.; Zheng, Y.; Wang, X.; Zhao, Y. Review and outlook on the international renewable energy development. Energy Built Environ. 2020, in press. [Google Scholar] [CrossRef]
  34. Technical Data 2019 REN. Available online: https://www.centrodeinformacao.ren.pt/PT/InformacaoTecnica/DadosTecnicos/Dados%20T%C3%A9cnicos%202019.pdf (accessed on 20 October 2020).
  35. El Sistema Eléctrico Español Síntesis 2019 REE. Available online: https://www.ree.es/sites/default/files/11_PUBLICACIONES/Documentos/InformesSistemaElectrico/2019/sintesis_ree_2019.pdf (accessed on 20 November 2020).
  36. EnergyPlan. EnergyPlan. 2019. Available online: https://www.energyplan.eu (accessed on 15 March 2019).
  37. EnergyPlan. Advanced Energy Systems Analysis Computer Model. 2019. Available online: https://www.energyplan.eu/wp-content/uploads/2019/09/EnergyPLAN-Documentation-Version15.pdf (accessed on 15 September 2019).
  38. Jülch, V. Comparison of electricity storage options using levelized cost of storage (LCOS) method. Appl. Energy 2016, 183, 1594–1606. [Google Scholar] [CrossRef]
  39. Madlener, R.; Latz, J. Economics of centralized and decentralized compressed air energy storage for enhanced grid integration of wind power. Appl. Energy 2011, 101, 299–309. [Google Scholar] [CrossRef]
  40. European Commission. 2030 Climate and Energy Framework. 2019. Available online: https://ec.europa.eu/clima/policies/strategies/2030_en (accessed on 5 September 2019).
  41. Agência Portuguesa do Ambiente. Portuguese National Inventory Report on Greenhouse Gases, 1990–2017. 2019. Available online: https://apambiente.pt/_zdata/Inventario/May2019/NIR_global2019(UNFCCC).pdf (accessed on 7 January 2020).
  42. Alcántara, V.; Roca, J. Energy and CO2 emissions in Spain. Energy Econ. 1995, 17, 221–230. [Google Scholar] [CrossRef]
Figure 1. Load diagrams of renewable and nuclear technologies and demand diagram for the calibration with the model year 2017: (a) biomass; (b) nuclear; (c) photovoltaics; (d) Concentrating Solar Power; (e) wind; (f) hydro; (g) demand.
Inventions 07 00004 g001aInventions 07 00004 g001bInventions 07 00004 g001cInventions 07 00004 g001d
Figure 2. Hydro distribution profiles (hourly load diagrams): (a) wet profile; (b) average profile; (c) dry profile.
Inventions 07 00004 g002aInventions 07 00004 g002b
Figure 3. Evolution of the generation installed capacity and demand, as foreseen by the projections, from 2017 to 2040: (a) RNC + PNIEC; (b) APREN; (c) ENTSOE-ST; (d) ENTSOE-DG; (e) ENTSOE-GCA; (f) demand.
Inventions 07 00004 g003aInventions 07 00004 g003bInventions 07 00004 g003cInventions 07 00004 g003d
Figure 4. CO2 emissions and European objectives for different hydro profiles: (a) hydro dry profile; (b) hydro average profile; (c) hydro wet profile.
Inventions 07 00004 g004aInventions 07 00004 g004b
Figure 5. RES share in the electricity consumption and European objectives for different hydro profiles: (a) hydro dry profile; (b) hydro average profile; (c) hydro wet profile.
Inventions 07 00004 g005aInventions 07 00004 g005b
Figure 6. Generating technologies annualized cost for different hydro profiles: (a) hydro dry profile; (b) hydro average profile; (c) hydro wet profile.
Inventions 07 00004 g006aInventions 07 00004 g006b
Figure 7. Batteries’ installed capacity for different hydro profiles: (a) hydro dry profile; (b) hydro average profile; (c) hydro wet profile.
Inventions 07 00004 g007aInventions 07 00004 g007b
Table 1. Real-world, EnergyPlan model year and error results for 2017 reference year.
2017Real-WorldModel ResultError
Electricity demand (TWh)302.38302.380.00%
Electricity generation (TWh)
Wind59.4759.470.00%
Hydro23.9023.880.08%
PV + CSP14.1914.180.07%
Nuclear + Biomass62.0262.03−0.02%
Natural Gas + Coal136.15137.12−0.71%
Fuel consumption (TWh)
Nuclear168.51168.500.01%
Biomass53.4653.50−0.07%
Natural gas123.00123.72−0.59%
Coal124.89125.60−0.57%
CO2 emission (Mton)81.6880.101.93%
Share of RES (%)36.8536.301.49%
Table 2. Generating technologies considered investment, lifetime, and fixed O&M.
TechnologyUnitInvestment (M EUR/Unit)Lifetime (Years)Fixed O&M (%Investment)
Small CHP unitsMW1.2253.75%
Large CHP unitsMW0.79253.8%
NuclearMW3.02301.96%
Wind MW0.9302.88%
PVMW0.69401%
CSPMW5.98258.2%
Run-of-river hydroMW3.3502%
HydroMW3.3502%
Hydro storageGWh7.5501.5%
Hydro pumpMW0.6501.5%
BiomassMW4.03203.5%
Table 3. Generating technologies considered variable O&M.
TechnologyUnitVariable O&M (EUR/Unit)
CHPMWh2.7
HydroMWh1.19
BiomassMWh15
Hydro pumpMWh1.19
Table 4. Fossil fuel considered prices.
TechnologyFuel Price (EUR/GJ)
Coal3.4
Natural gas12.2
Nuclear5.83
Table 5. CO2 emissions in 1990 and CO2 emissions targets (2020 and 2030) [40,41,42].
YearCO2 Emissions (Mton)
199073.777
202059.021
203044.266
Publisher’s Note: MDPI stays neutral with regard to jurisdictional claims in published maps and institutional affiliations.

