
A New Maximum Power Point Tracking Technique for Thermoelectric Generator Modules

 ,
,  , , and
Abstract
:1. Introduction
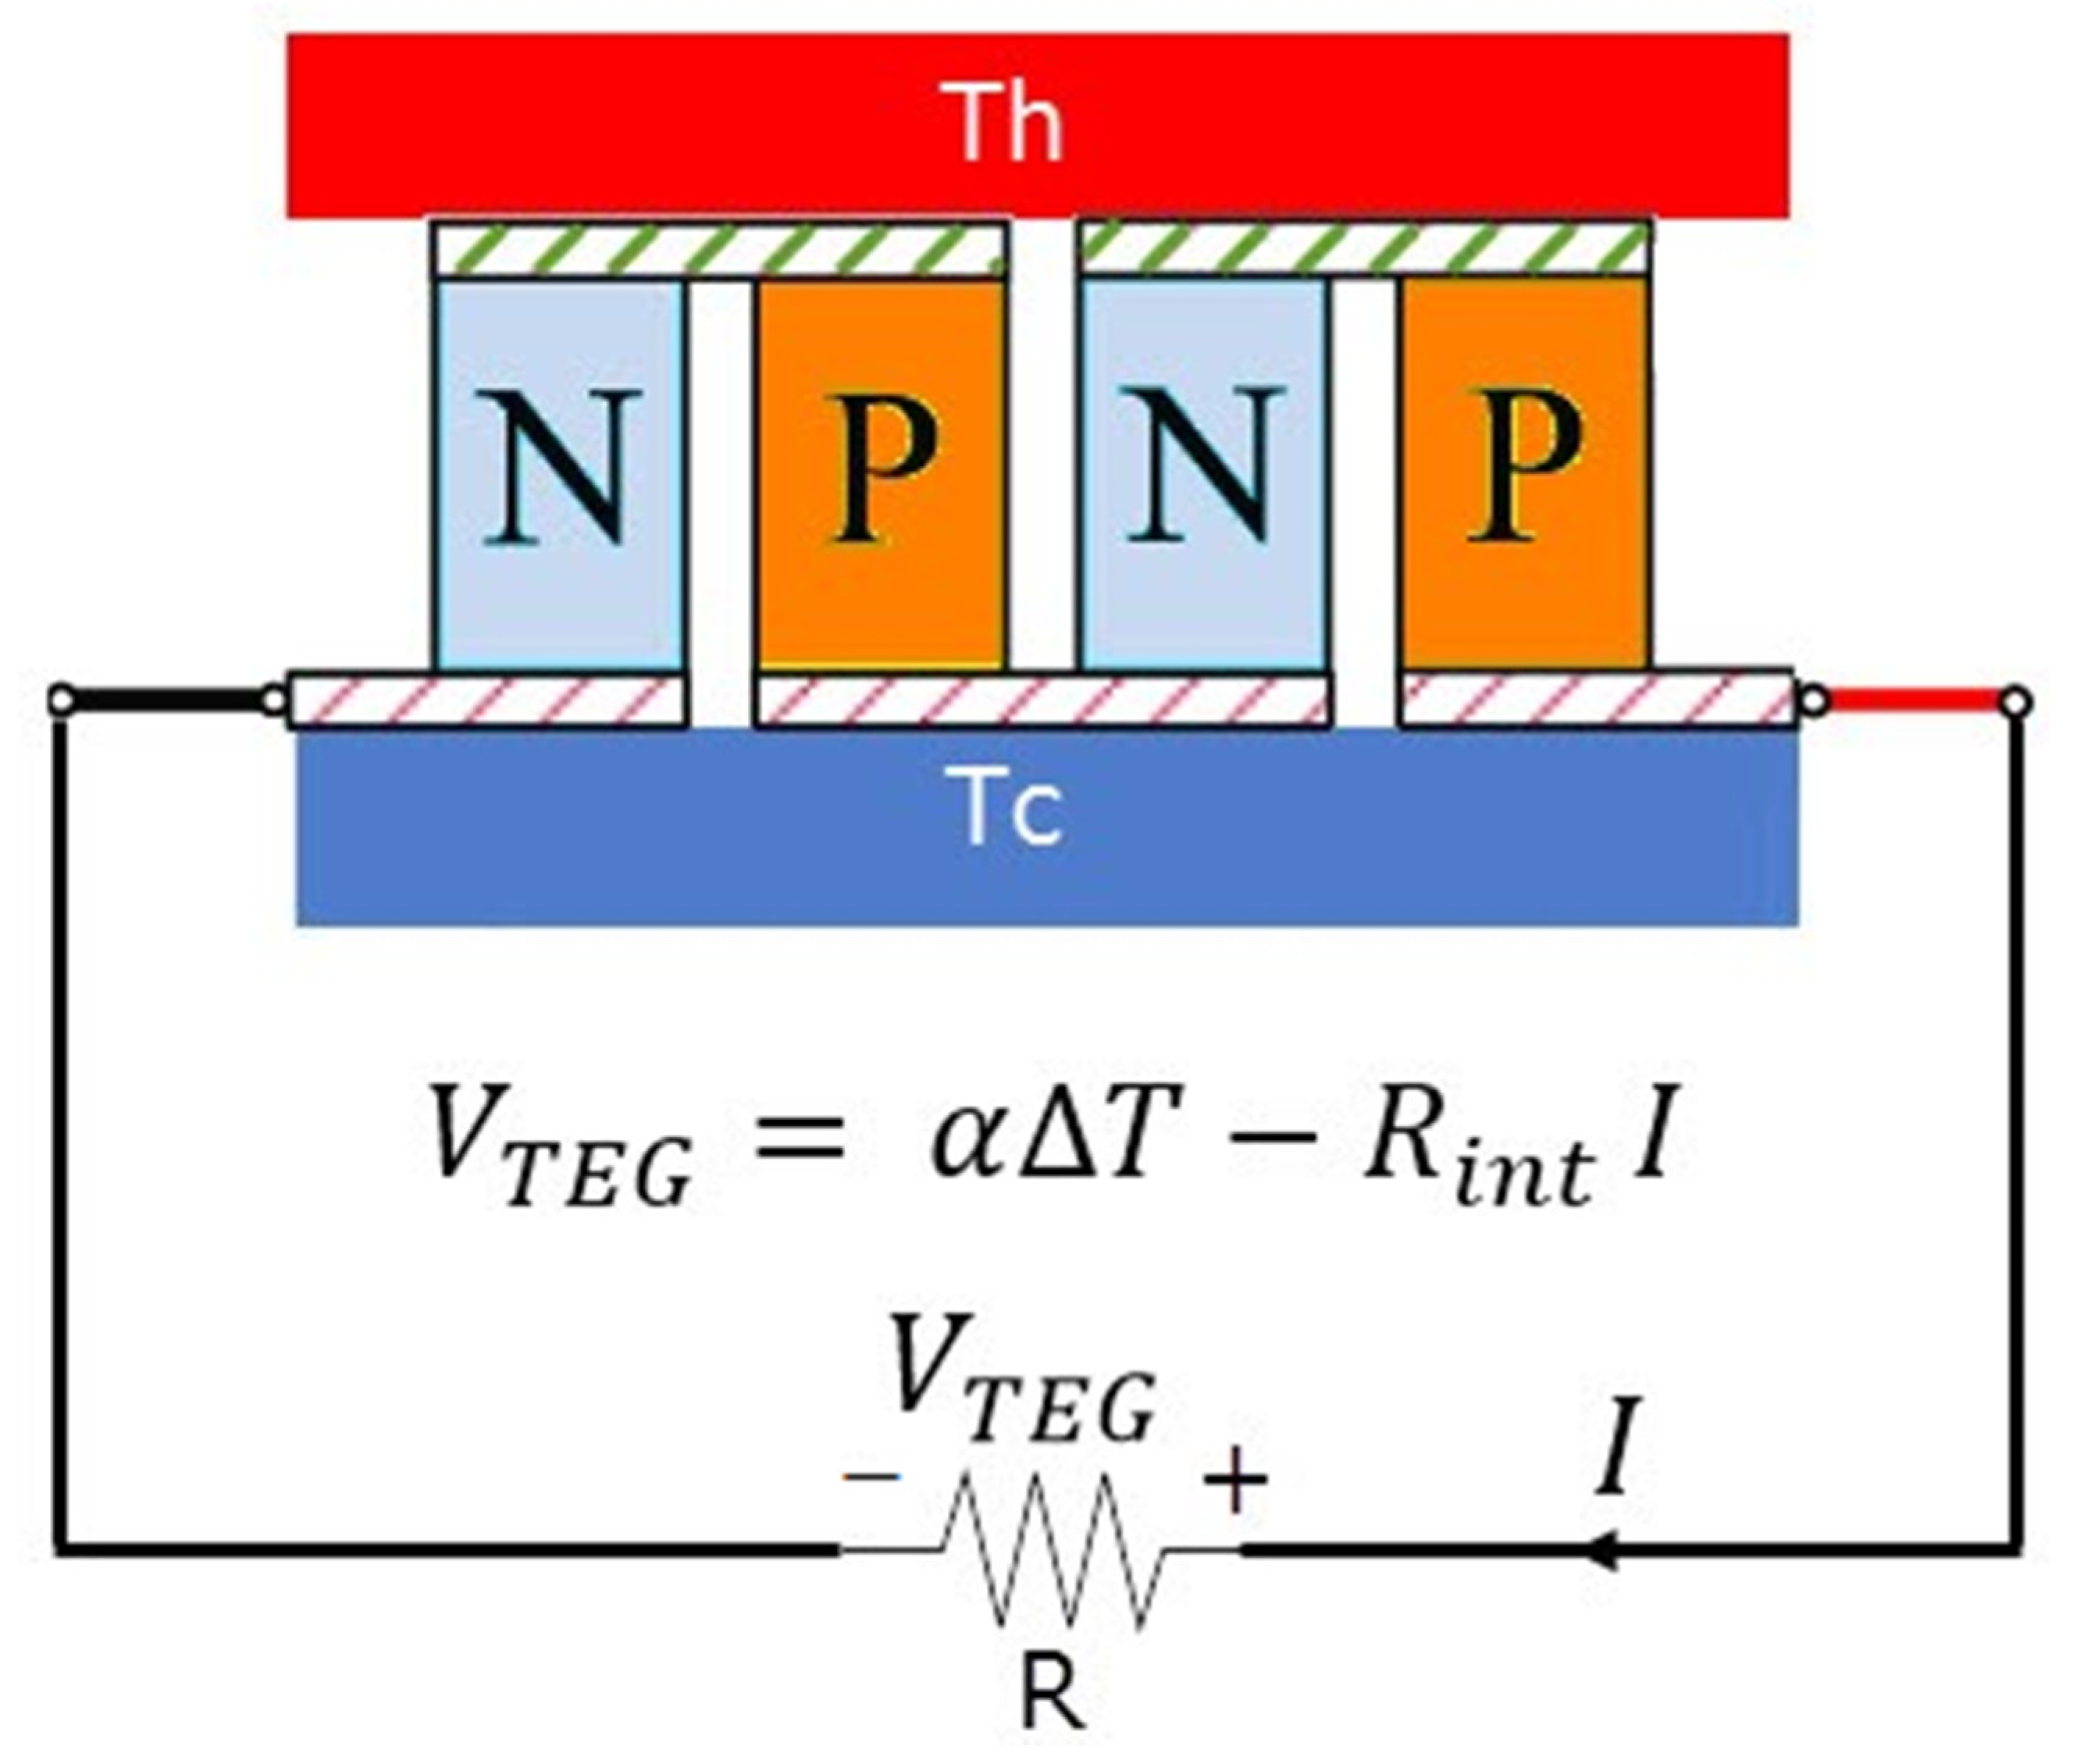
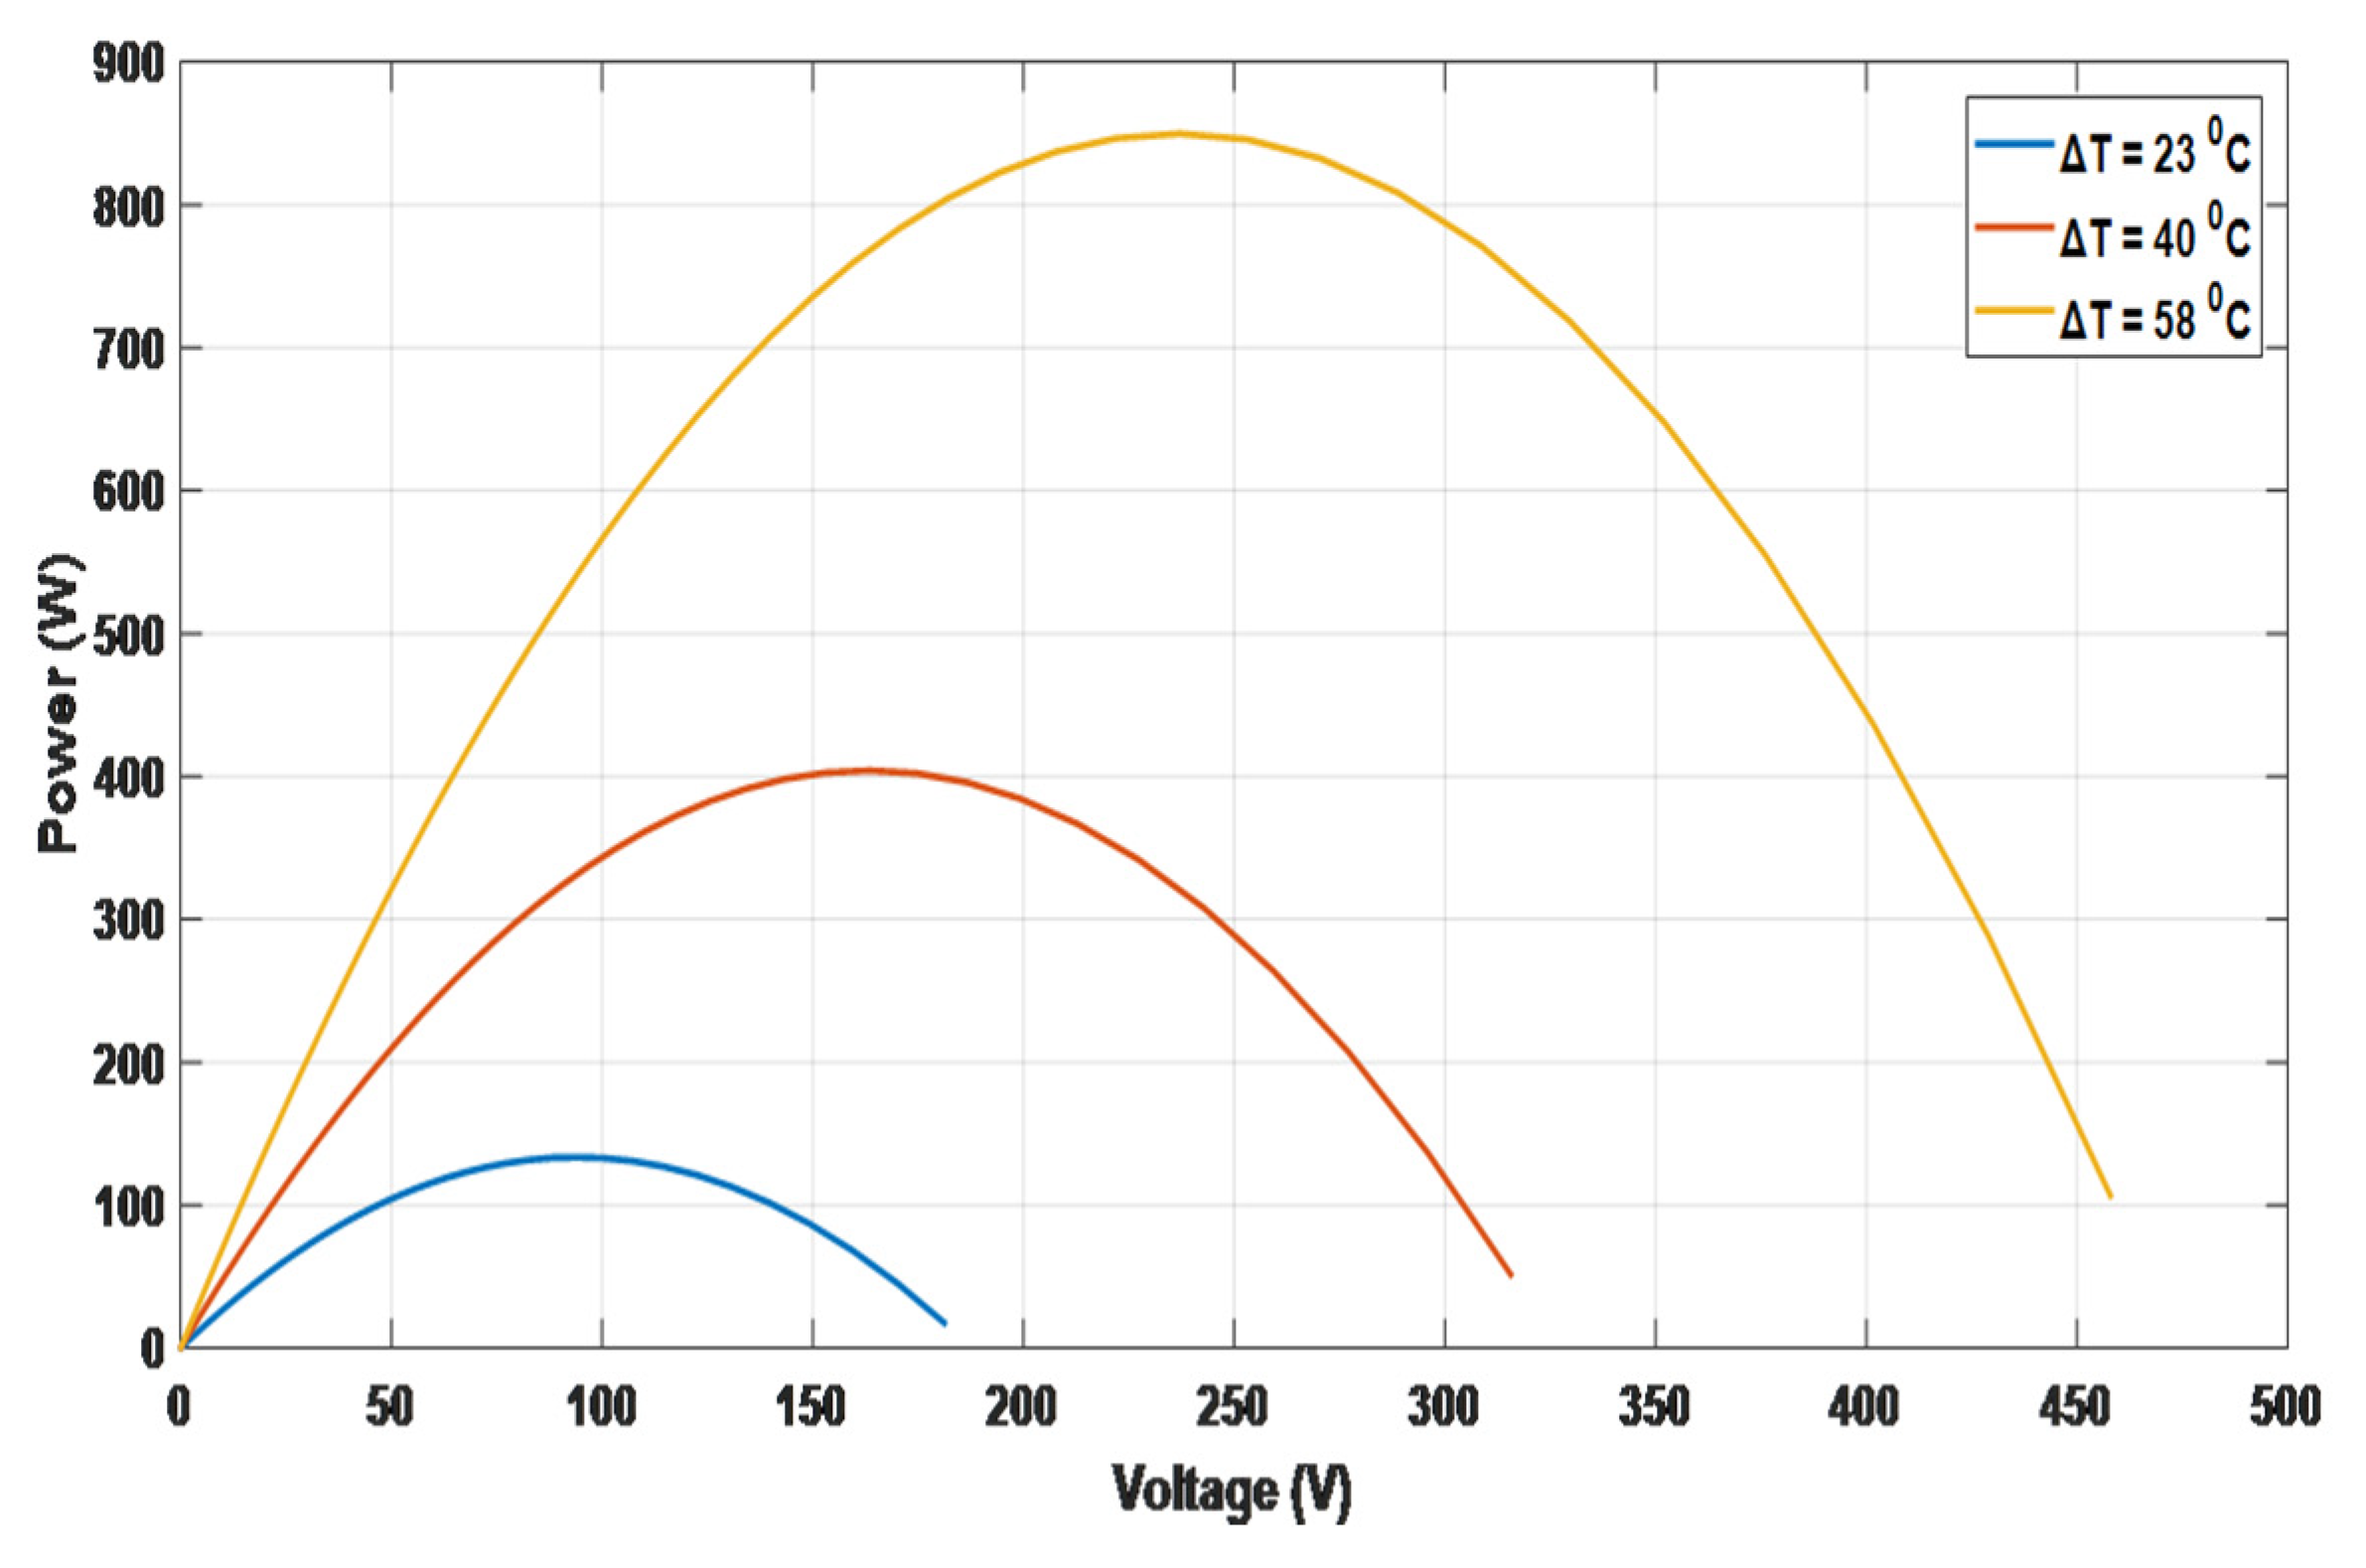
2. Modeling a Thermoelectric Generator
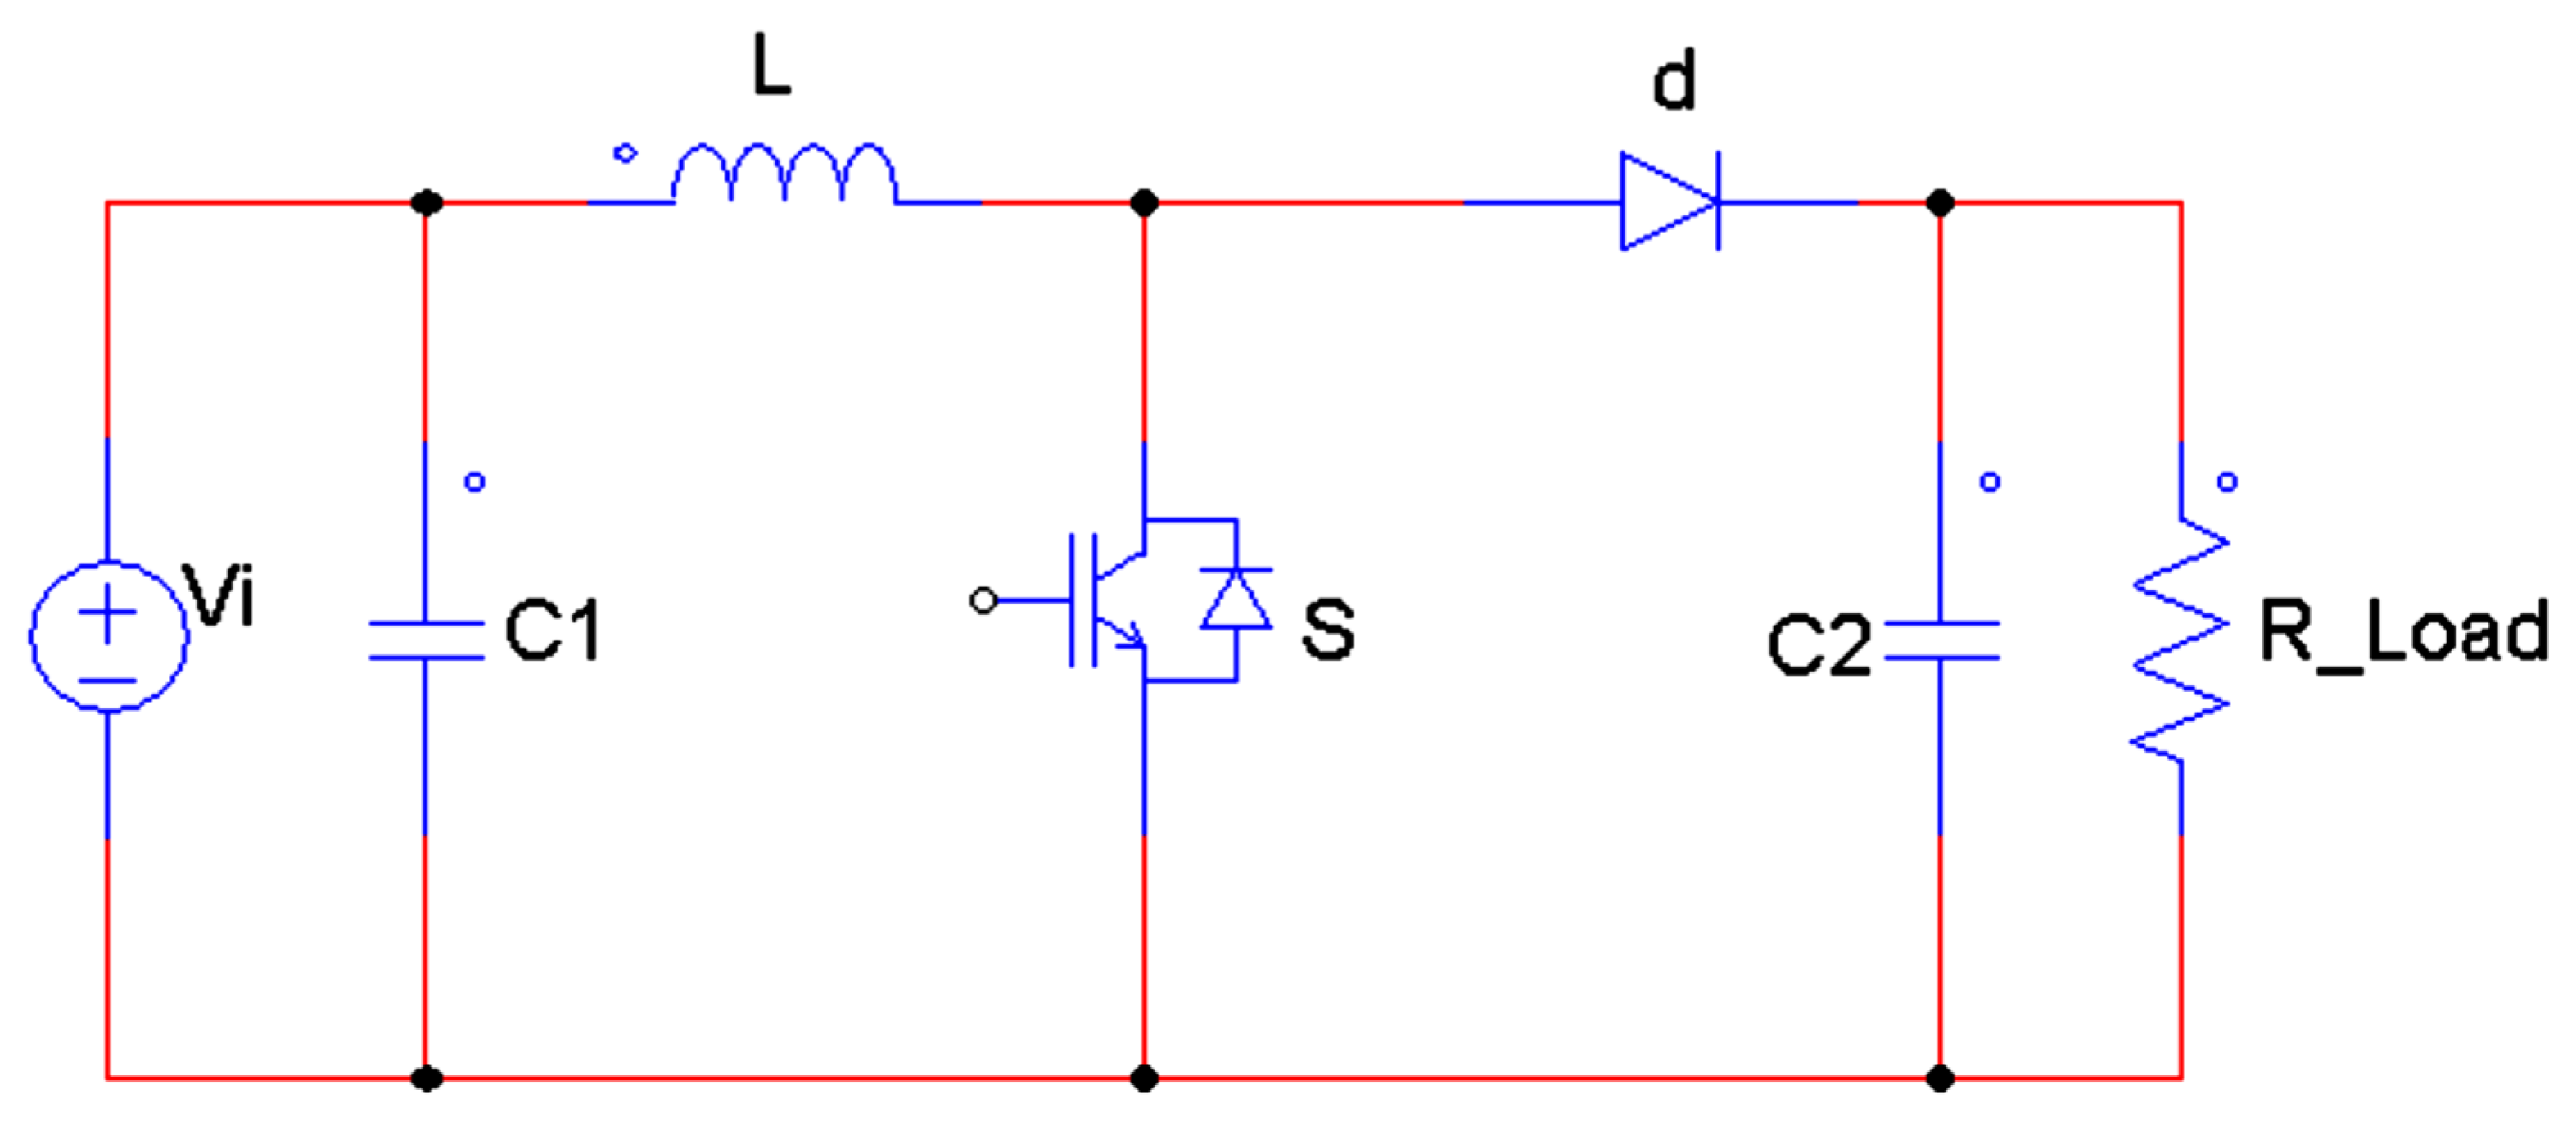
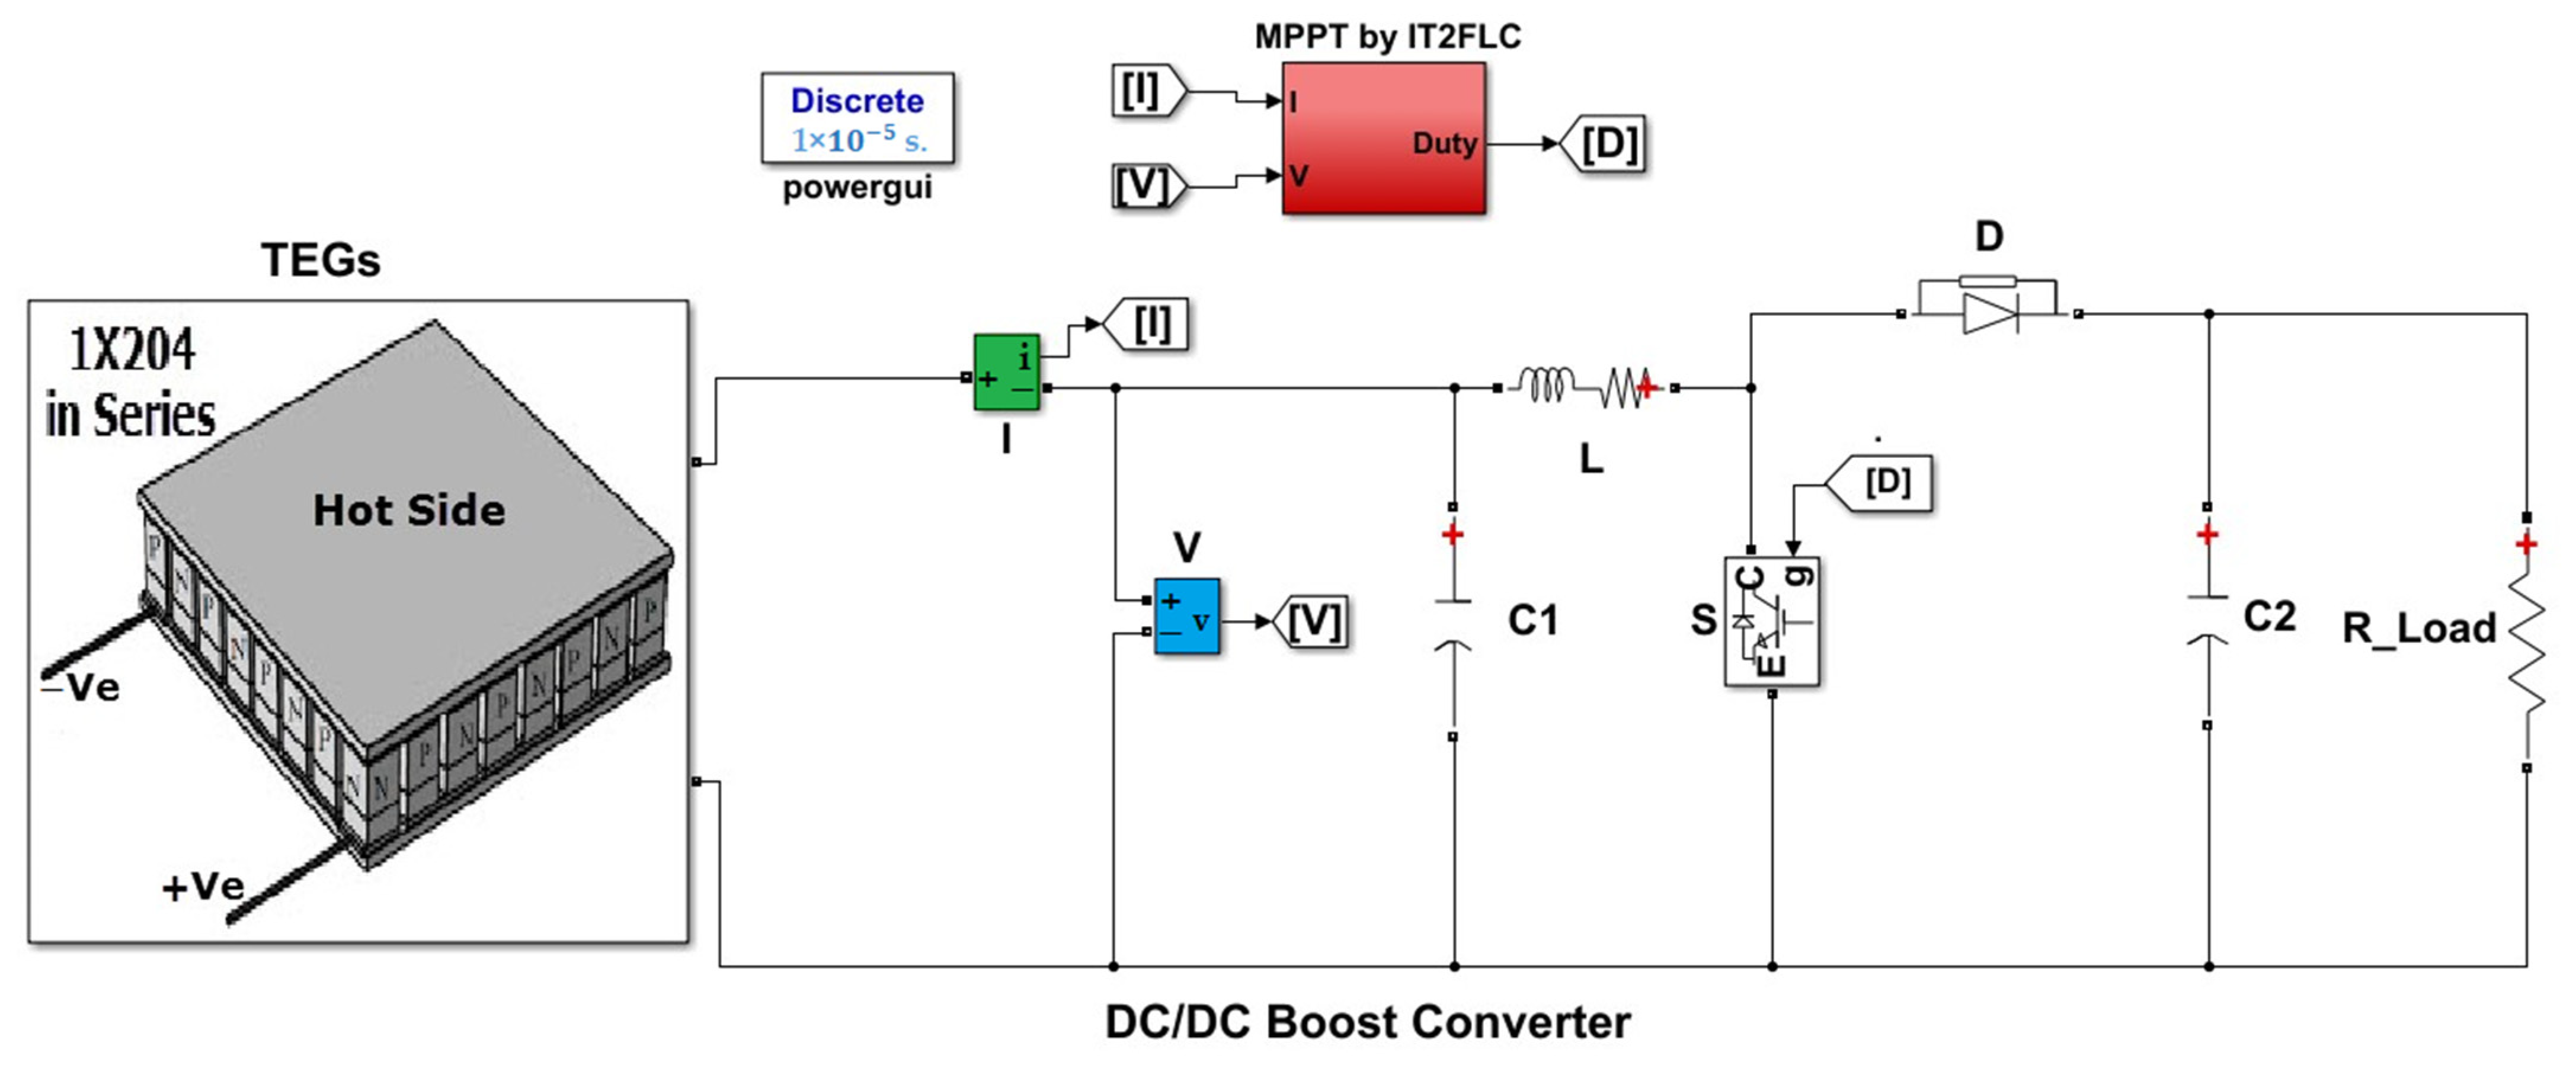
3. DC/DC Boost Converter
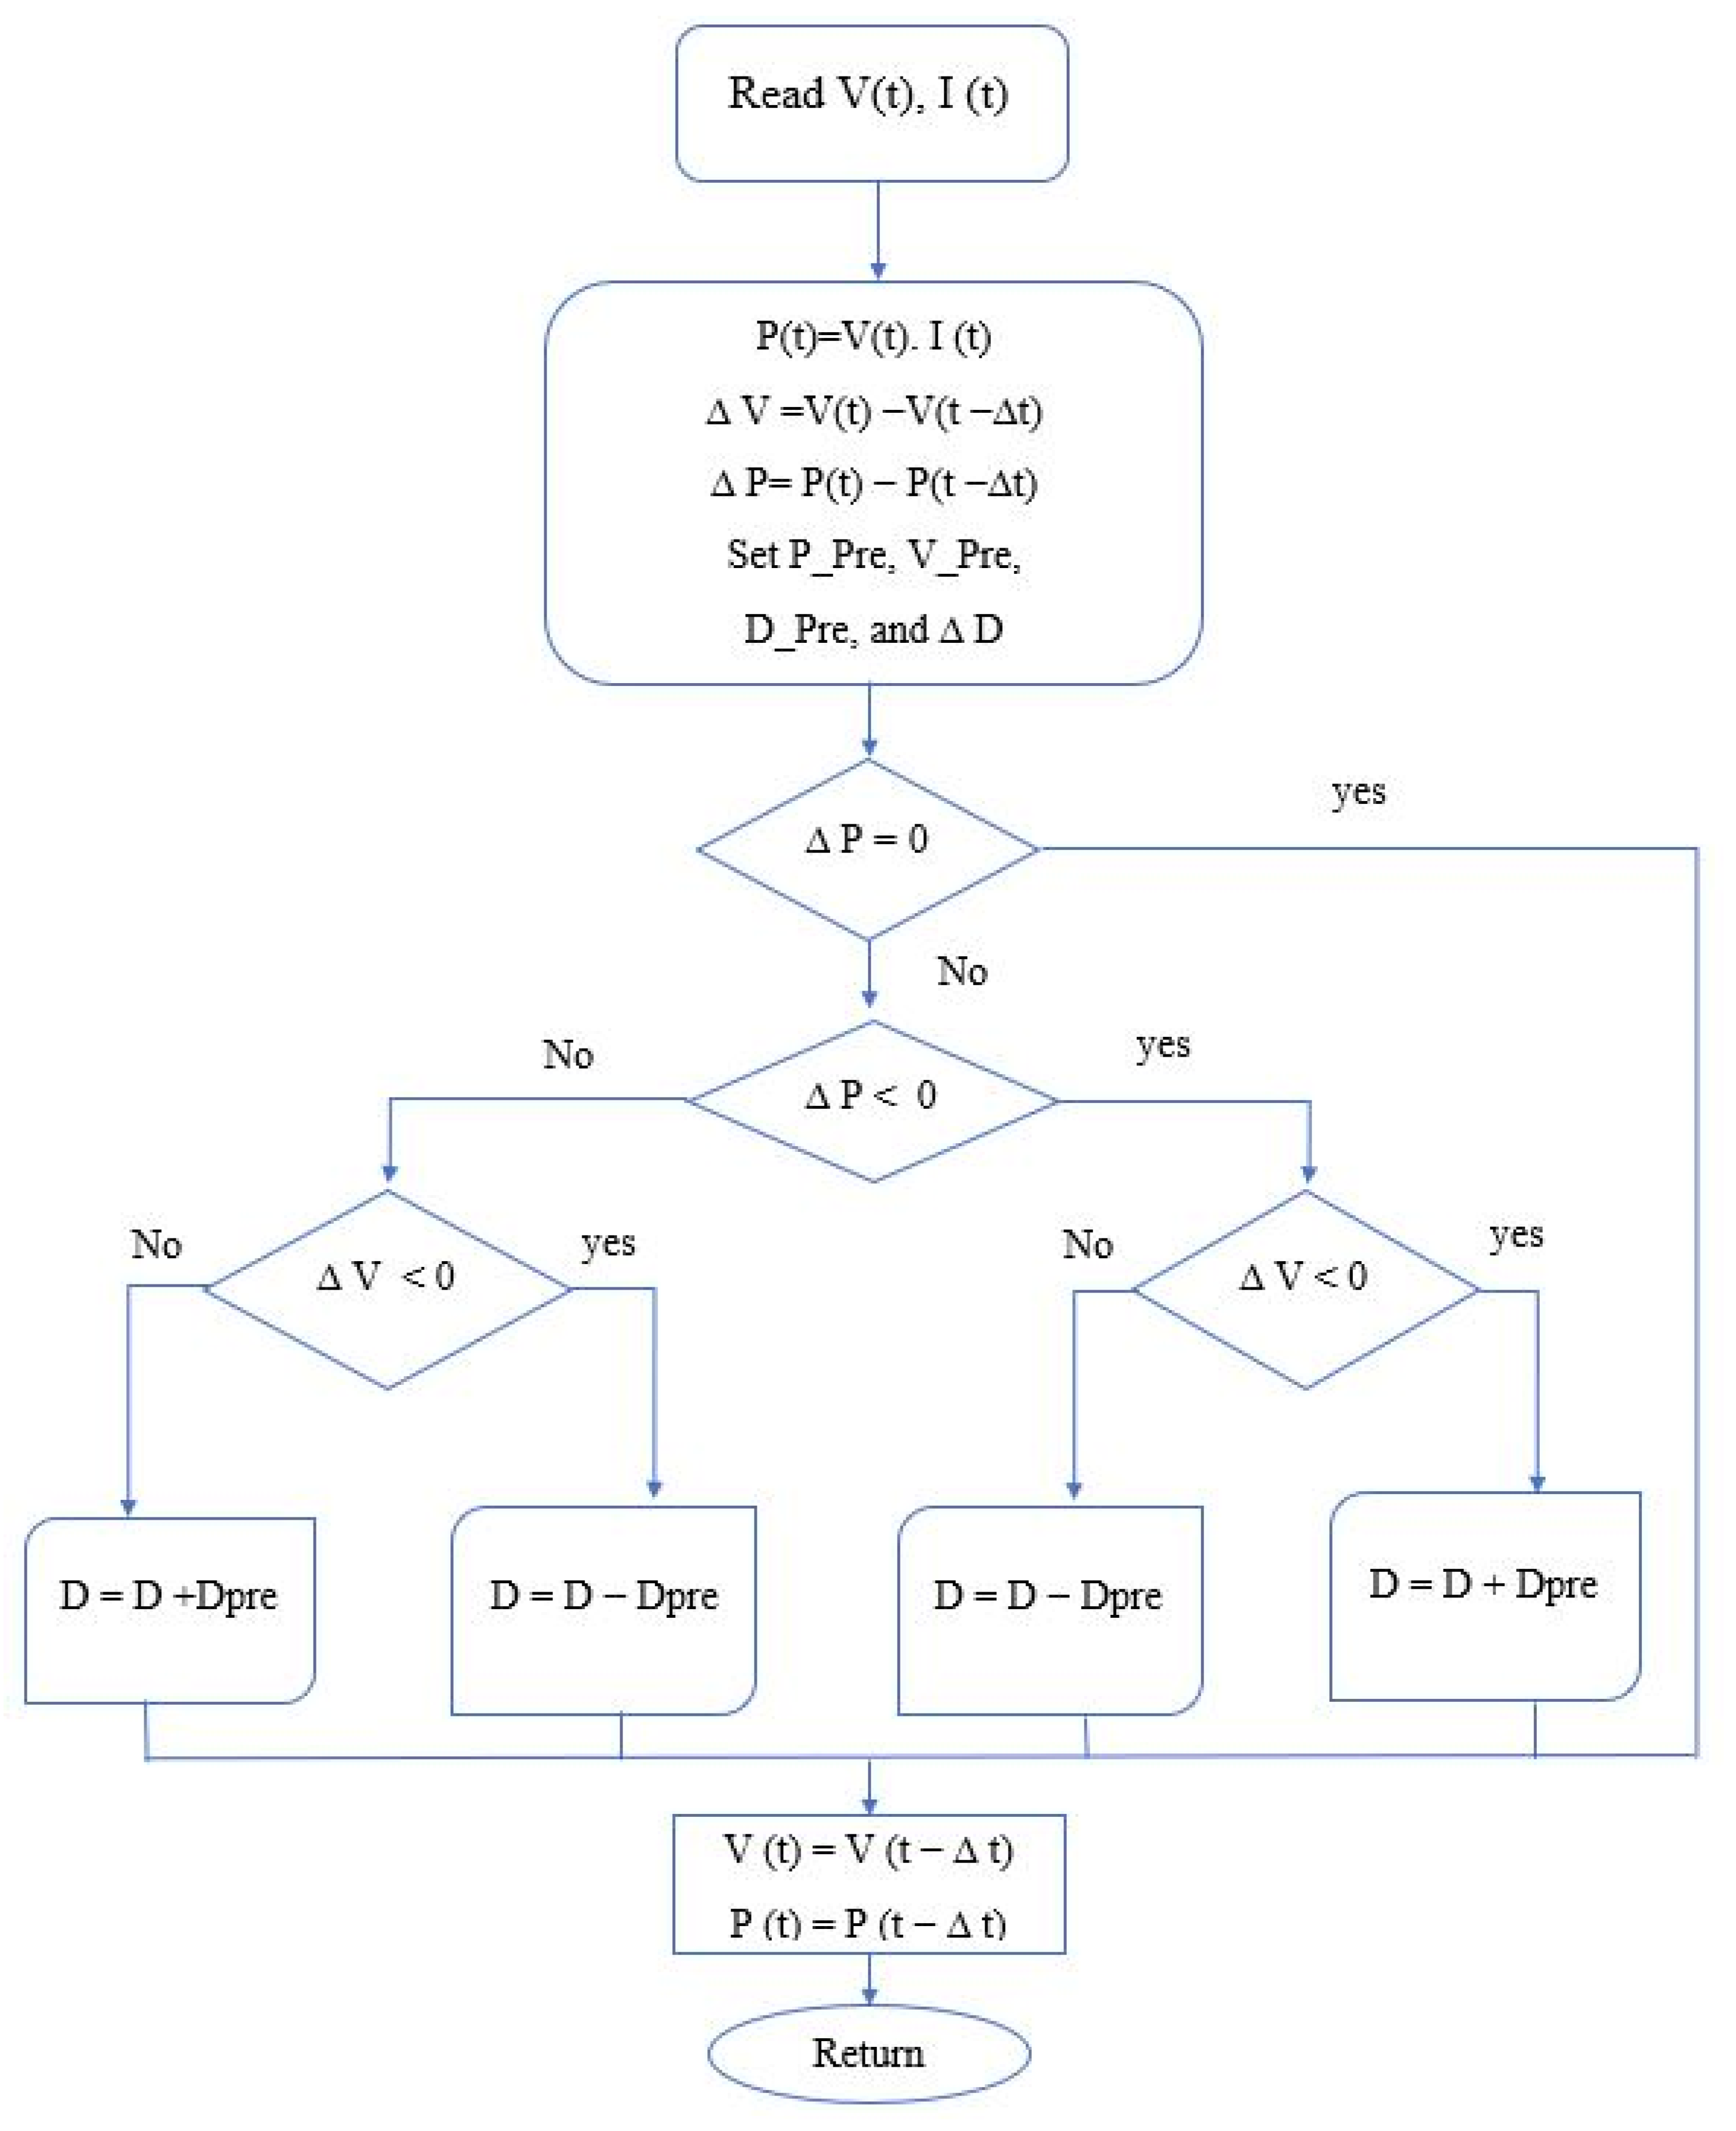
4. MPPT Technique for the Thermoelectric Generator
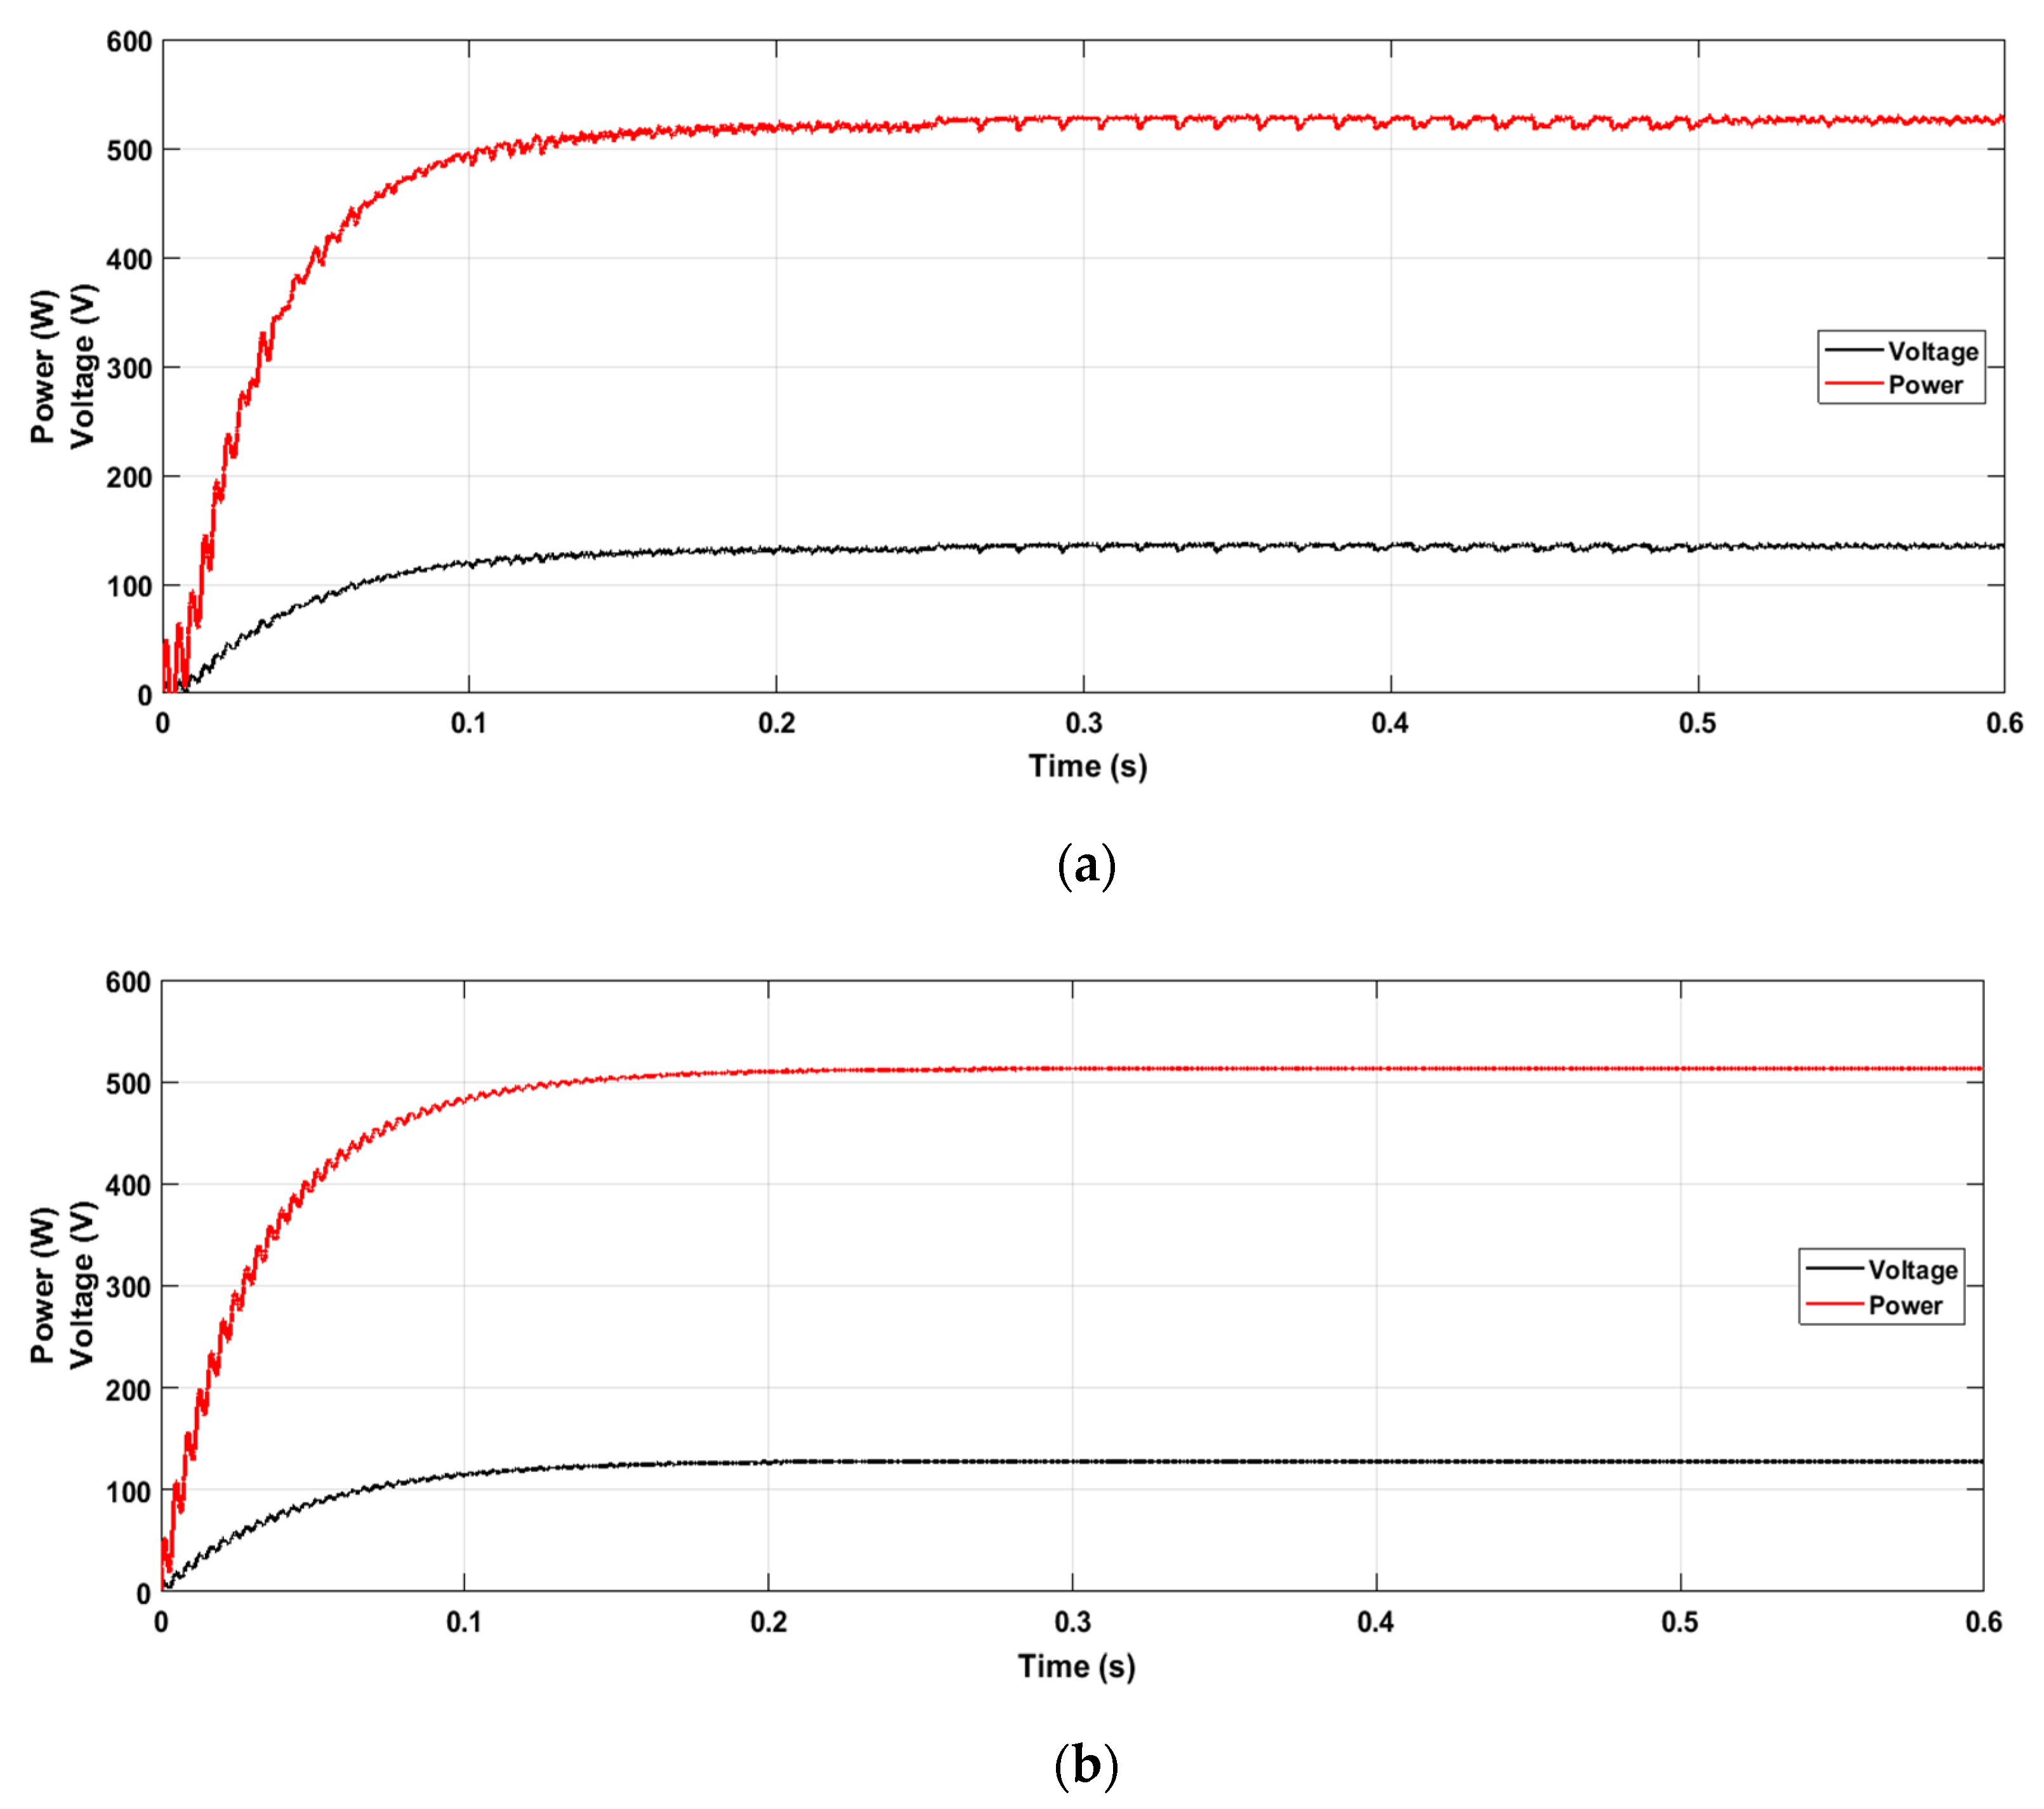
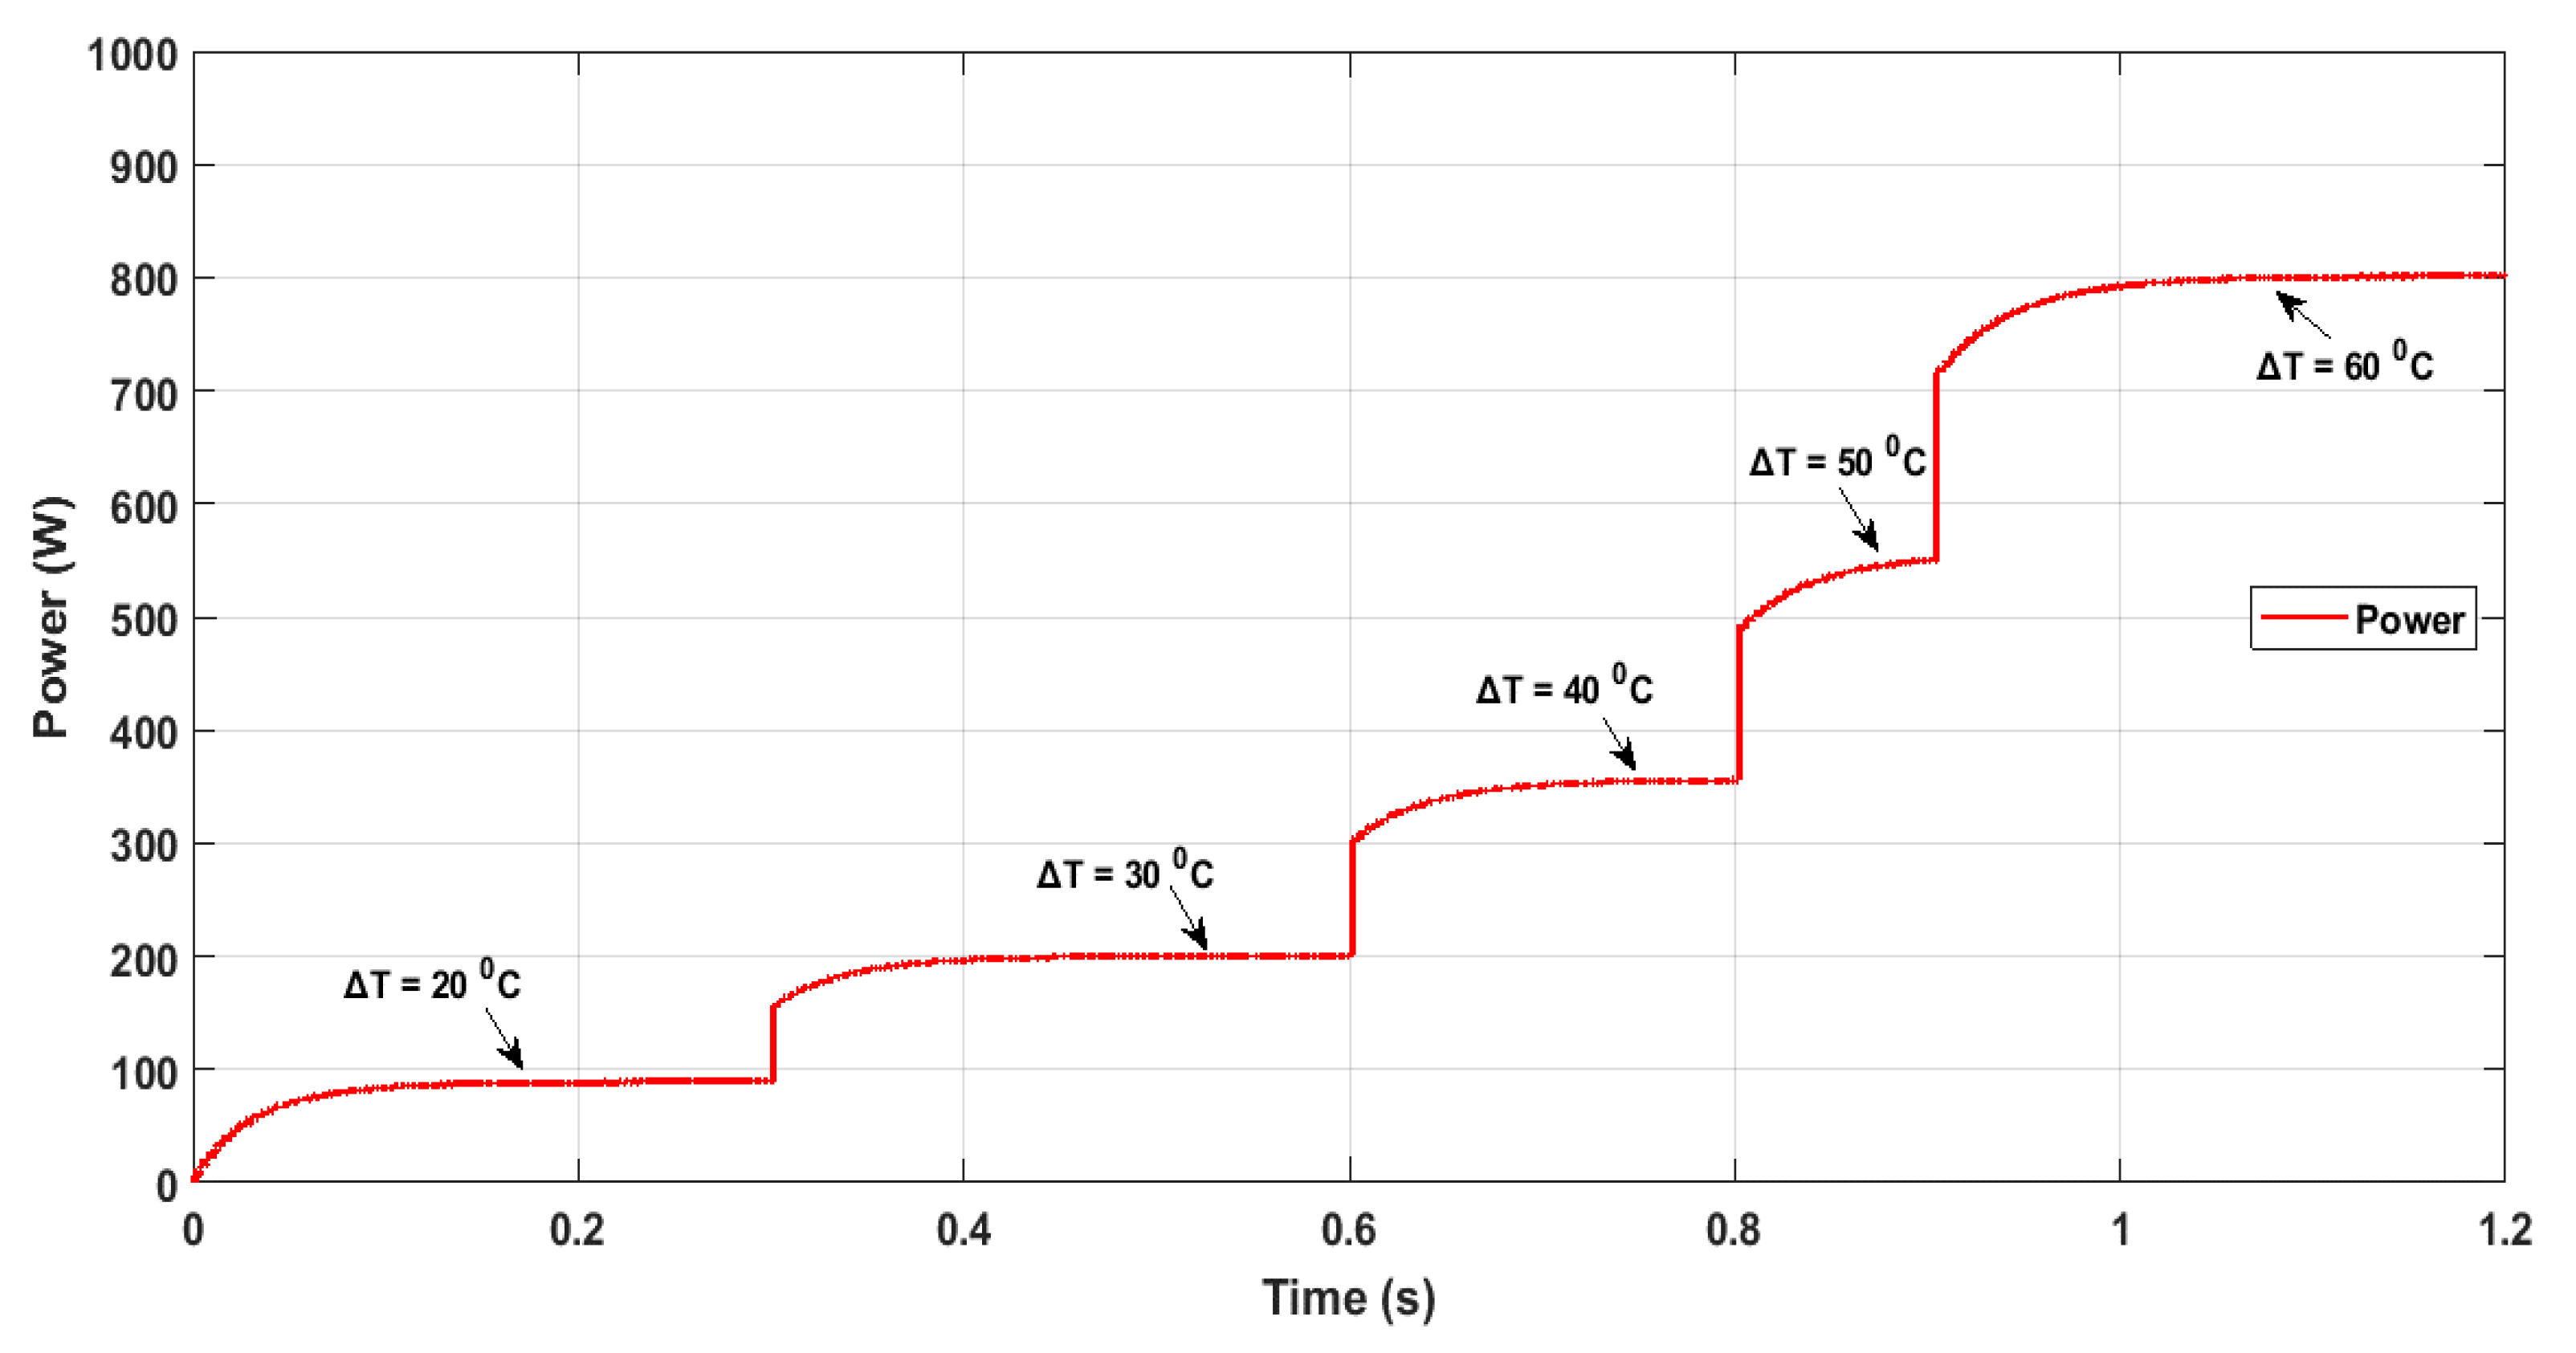
5. Simulation Results and Discussion
6. Conclusions
Author Contributions
Funding
Data Availability Statement
Conflicts of Interest
References
- Emin, D. Seebeck Effect; Wiely Online Library: Hoboken, NJ, USA, 2014; pp. 1–14. [Google Scholar] [CrossRef]
- Siouane, S.; Jovanović, S.; Poure, P. Equivalent Electrical Circuits of Thermoelectric Generators under Different Operating Conditions. Energies 2017, 10, 386. [Google Scholar] [CrossRef] [Green Version]
- Thermoelectric Generator. Wikipedia, the Free Encyclopedia. Available online: https://en.wikipedia.org/wiki/Thermoelectric_generator (accessed on 18 October 2021).
- Patel, D.; Mehta, S.B.; Shah, P. Review of Thermoelectricity to Improve Energy Quality. J. Emerg. Technol. Innov. Res. 2015, 2, 847–850. [Google Scholar]
- Khamil, K.N.; Sabri, M.F.M.; Yusop, A.M.; Mohamed, R.; Sharuddin, M.S. Modelling and Simulation of the Performance Analysis for Peltier Module and Seebeck Module using MATLAB/Simulink. J. Kejuruter. 2020, 32, 231–238. [Google Scholar]
- Bijukumar, B.; Ilango, G.S.; Nagamani, C. Design and implementation of a current controlled grid connected inverter for thermoelectric generator sources. J. Sådhanå Indian Acad. Sci. 2020, 45, 1–13. [Google Scholar] [CrossRef]
- Belkaid, A.; Colak, I.; Kayisli, K. Modeling and Simulation of Thermo Electrical Generatror with MPPT. In Proceedings of the 6th International Conference on Renewable Energy Research and Applications, San Diego, CA, USA, 5–8 November 2017; pp. 855–860. [Google Scholar]
- Kanagaraj, N.; Rezk, H.; Gomaa, M.R. A Variable Fractional Order Fuzzy Logic Control Based MPPT Technique for Improving Energy Conversion Effeciency of Thermoelectric Power Generator. Energies 2020, 13, 4531. [Google Scholar] [CrossRef]
- Zoui, M.A.; Bentouba, S.; Stocholm, J.G.; Bourouis, M. A Review on Thermoelectric Generators: Progress and Applications. Energies 2020, 13, 3606. [Google Scholar] [CrossRef]
- Electrical4U. Seebeck Effect and Seebeck Coefficient. Last Updated in 25 July 2018. Available online: https://www.electrical4u.com/seebeck-effect-and-seebeck-coefficient/ (accessed on 18 October 2021).
- Champier, D. Thermoelectric generators: A review of applications. Energy Convers. Manag. 2017, 140, 167–181. [Google Scholar] [CrossRef]
- Mamur, H.; Çoban, Y. Detailed modeling of a thermoelectric generator for maximum power point tracking. Turk. J. Electr. Eng. Comput. Sci. 2020, 28, 124–139. [Google Scholar] [CrossRef]
- Marlow Industries, Inc. SP1848 Thermoelectric Cooler. Available online: https://www.alldatasheet.com/datasheet-pdf/pdf/164951/ETC1/SP1848.html (accessed on 10 November 2021).
- Bimbhra, P.S. Power Electronics, 4th ed.; 15th reprint; Khanna Publishers: Delhi, India, 2010. [Google Scholar]
- De Brito, M.A.G.; Sampaio, L.P.; Luigi, G.; e Melo, G.A.; Canesin, C.A. Comparative Analysis of MPPT Techniques for PV Applications. In Proceedings of the 2011 International Conference on Clean Electrical Power (ICCEP), Ischia, Italy, 14–16 June 2011. [Google Scholar]
- Mendel, J.M. Uncertain Rule-Based Fuzzy Logic Systems: Introduction and New Directions; Prentice Hall PTR: Upper Saddle River, NJ, USA, 2001. [Google Scholar]
- Taskin, A.; Kumbasar, T. An Open Source Matlab/Simulink Toolbox for Interval Type-2 Fuzzy Logic Systems. In Proceedings of the 2015 IEEE Symposium Series on Computational Intelligence, Cape Town, South Africa, 7–10 December 2015; pp. 1561–1568. [Google Scholar]
- Gagliano, S.; Cairone, F.; Amenta, A.; Bucolo, M. A Real Time Feed Forward Control of Slug Flow in Microchannels †. Energies 2019, 12, 2556. [Google Scholar] [CrossRef] [Green Version]


| Specifications | Quantity/Value |
|---|---|
| No. of TEGs per Module | 204 |
| Seebeck Coefficient per Single TEG | 400 μV/K |
| Internal Resistance (Rint) of a Single TEG | 0.323 Ω |
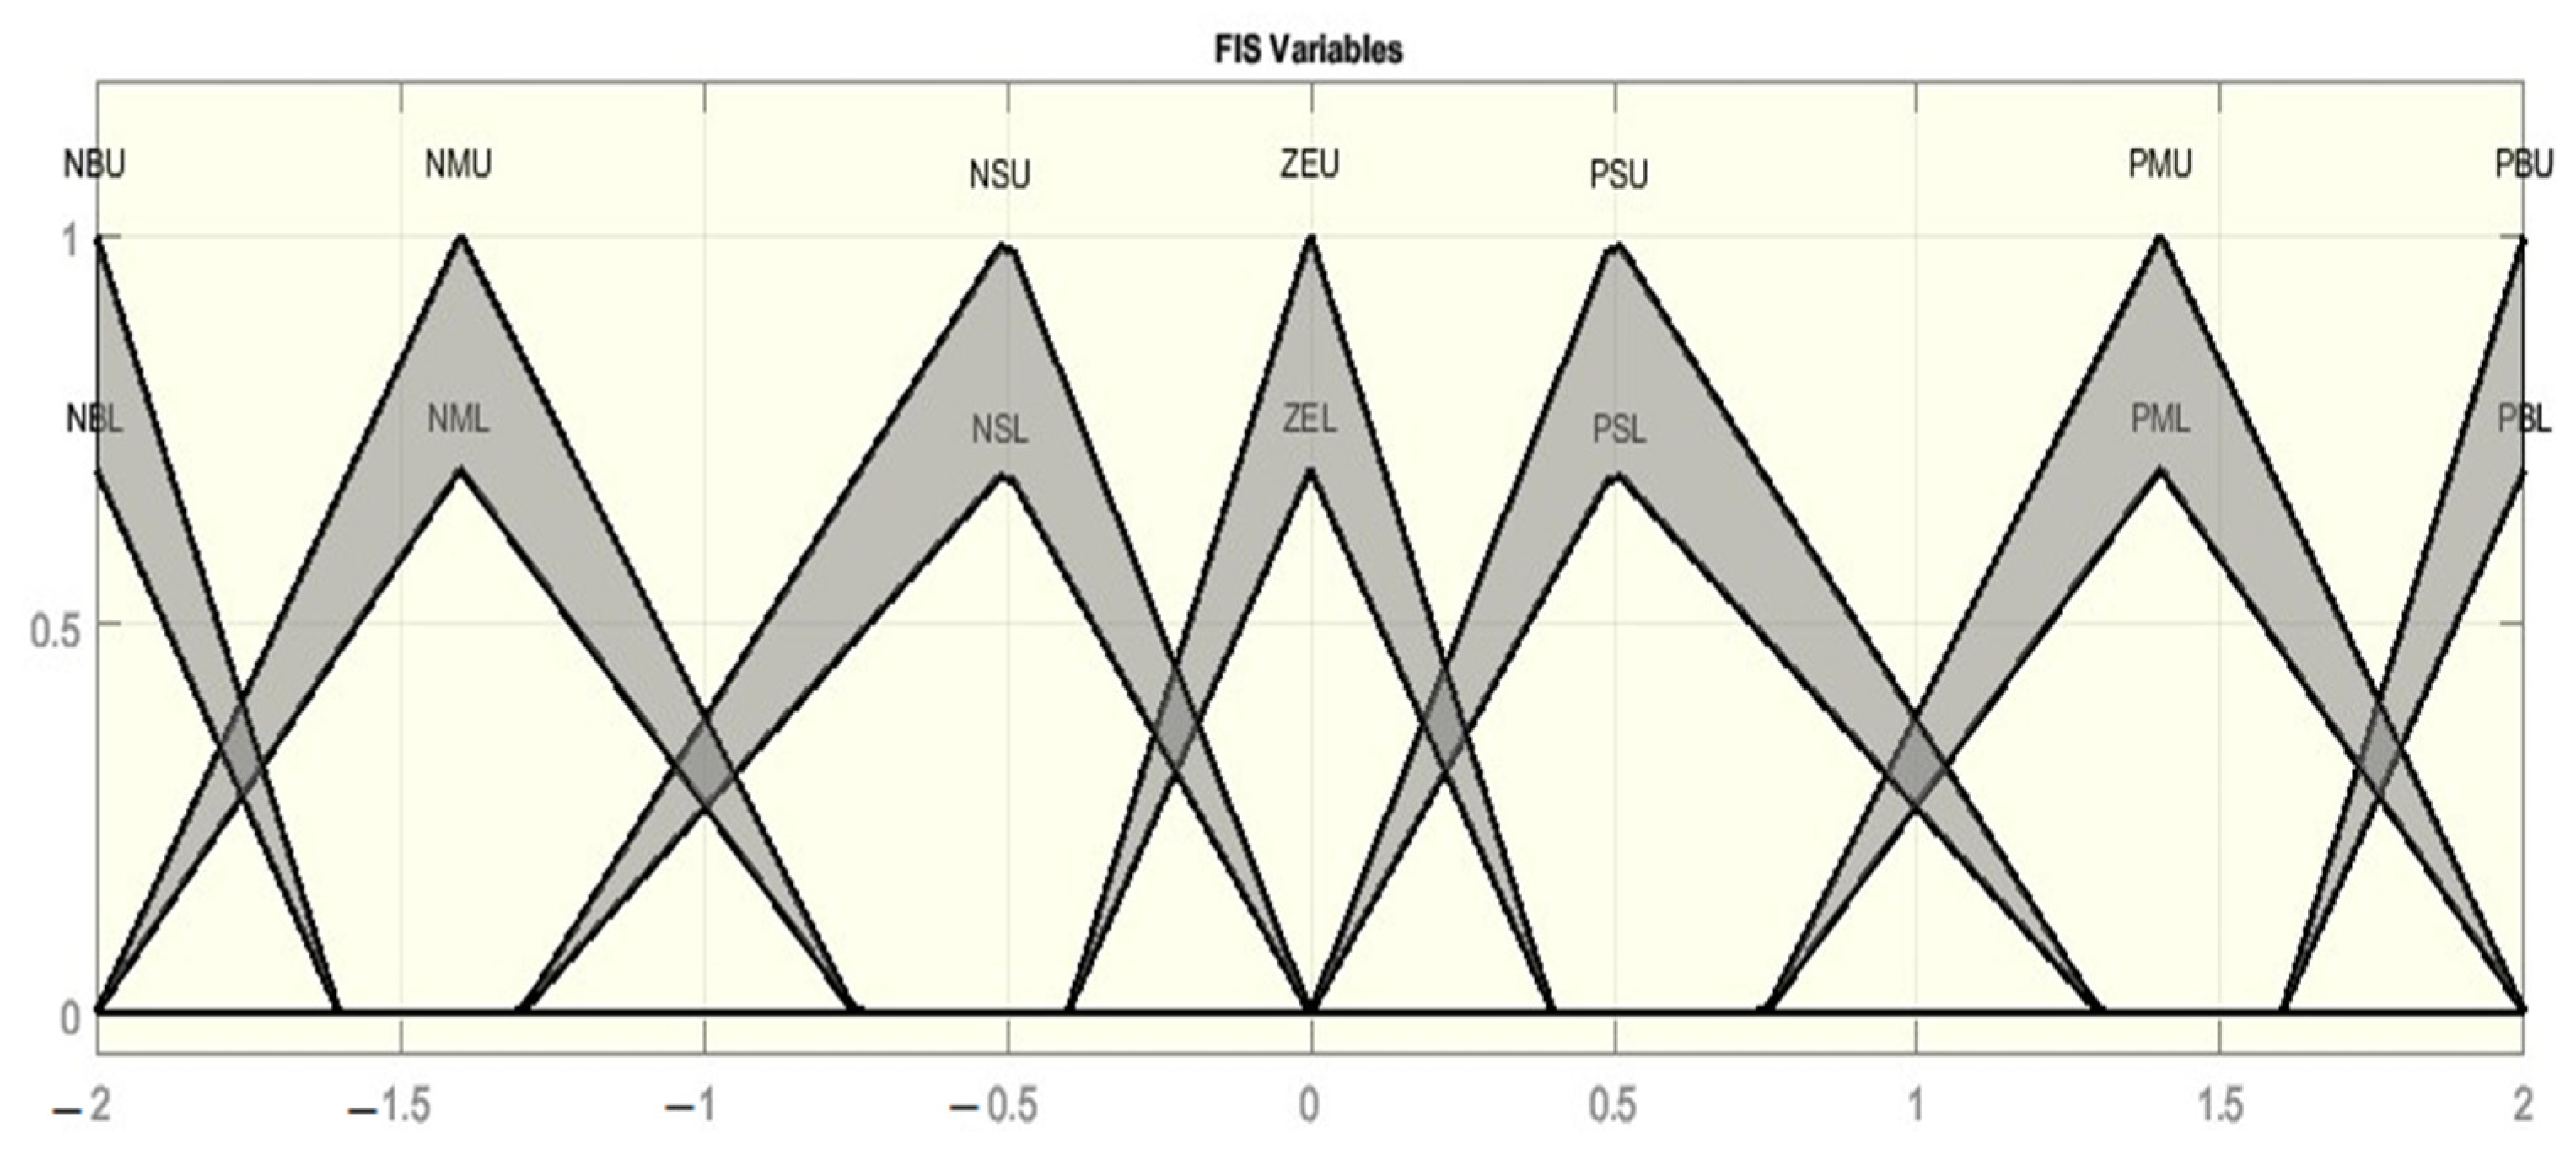
| FIS Variable | Values (Linear) |
|---|---|
| NB | [0 0 -0.0075] |
| NM | [0 0 -0.003667] |
| NS | [0 0 -0.001667] |
| ZE | [0 0 -2.385 × 10⁻¹⁹] |
| PS | [0 0 0.001667] |
| PM | [0 0 0.003667] |
| PB | [0 0 0.0075] |
| Change (P) | |||||||
|---|---|---|---|---|---|---|---|
| Change (I) | NB | NM | NS | ZE | PS | PM | PB |
| NB | PB | PB | PM | NM | NM | NB | NB |
| NS | PB | PM | PS | NS | NS | NM | NB |
| ZE | NB | NM | NS | ZE | PS | PM | PB |
| PS | NB | NM | NS | PS | PS | PM | PB |
| PB | NB | NB | NM | PM | PM | PB | PB |
| Load | 100 Ω | 50 Ω | 25 Ω | 12 Ω | 6 Ω | |
|---|---|---|---|---|---|---|
| D = 10% | Input Power (W) | 578.5 | 488.9 | 339.2 | 199 | 111.1 |
| D = 20% | Input Power (W) | 578.5 | 488.9 | 339.2 | 199 | 111.1 |
| D = 30% | Input Power (W) | 464.6 | 313.1 | 186.1 | 99.2 | 53 |
| D = 40% | Input Power (W) | 464.6 | 313.1 | 186.1 | 99.2 | 53 |
| D = 50% | Input Power (W) | 464.6 | 313.1 | 186.1 | 99.2 | 53 |
| D = 60% | Input Power (W) | 185.1 | 101.8 | 53.9 | 27.2 | 14.4 |
| D = 70% | Input Power (W) | 184 | 101.8 | 53.9 | 27.2 | 14.4 |
| D = 80% | Input Power (W) | 0.212 | 0.212 | 0.212 | 0.212 | 0.212 |
| Output Power at IT2FLC MPPT (W) | 581.4 | 511 | 368.2 | 220.5 | 124.5 |
Publisher’s Note: MDPI stays neutral with regard to jurisdictional claims in published maps and institutional affiliations. |
© 2021 by the authors. Licensee MDPI, Basel, Switzerland. This article is an open access article distributed under the terms and conditions of the Creative Commons Attribution (CC BY) license (https://creativecommons.org/licenses/by/4.0/).
Share and Cite
A. Qasim, M.; T. Alwan, N.; PraveenKumar, S.; Velkin, V.I.; Agyekum, E.B. A New Maximum Power Point Tracking Technique for Thermoelectric Generator Modules. Inventions 2021, 6, 88. https://doi.org/10.3390/inventions6040088
A. Qasim M, T. Alwan N, PraveenKumar S, Velkin VI, Agyekum EB. A New Maximum Power Point Tracking Technique for Thermoelectric Generator Modules. Inventions. 2021; 6(4):88. https://doi.org/10.3390/inventions6040088
Chicago/Turabian StyleA. Qasim, Mohammed, Naseer T. Alwan, Seepana PraveenKumar, Vladimir I. Velkin, and Ephraim Bonah Agyekum. 2021. "A New Maximum Power Point Tracking Technique for Thermoelectric Generator Modules" Inventions 6, no. 4: 88. https://doi.org/10.3390/inventions6040088