Article

Experimental Study on Performance Enhancement of a Photovoltaic Module Using a Combination of Phase Change Material and Aluminum Fins—Exergy, Energy and Economic (3E) Analysis

by
Ephraim Bonah Agyekum
1,*,
Seepana PraveenKumar
1,
Naseer T. Alwan
1,2,
Vladimir Ivanovich Velkin
1 and
Tomiwa Sunday Adebayo
3,4
1
Department of Nuclear and Renewable Energy, Ural Federal University Named after the First President of Russia Boris, 19 Mira Street, Ekaterinburg, 620002 Yeltsin, Russia
2
Kirkuk Technical College, Northern Technical University, Kirkuk 36001, Iraq
3
Faculty of Economics and Administrative Science, Cyprus International University, Northern Cyprus, Mersin 10, Nicosia 99670, Turkey
4
Department of Finance & Accounting, Akfa University, 1st Deadlock, 10th Kukcha Darvoza Street, Tashkent 100012, Uzbekistan
*
Author to whom correspondence should be addressed.
Inventions 2021, 6(4), 69; https://doi.org/10.3390/inventions6040069
Submission received: 24 September 2021 / Revised: 11 October 2021 / Accepted: 13 October 2021 / Published: 18 October 2021
(This article belongs to the Special Issue Thermodynamic and Technical Analysis for Sustainability)

Abstract

:
The electrical performance of a photovoltaic (PV) module is hugely affected by its temperature. This study proposed a passive cooling mechanism for the cooling of a PV panel. The proposed cooling system is made up of a combination of aluminum fins and paraffin wax integrated at the PV panel’s rear side. The average temperature for the cooled panel for the entire period of the experiment is 36.62 °C against 48.75 °C for the referenced PV module. This represents an average reduction of 12.13 °C for the cooled panel. The average power for the cooled panel is 12.19 W against 10.95 W for the referenced module which is 11.33% improvement. The electrical efficiencies for the cooled panel and the referenced modules are 14.30% and 13.60%, respectively, representing an improvement of 5.15% in the electrical efficiency. The cooled solar PV module had an average exergy efficiency of 7.99% compared to 5.61% for the referenced module. In terms of the economics, the results from the computations show that LCOE of the cooled panel can range between 0.198 and 0.603 $/kWh, while that of the referenced module ranges from 0.221–0.671 $/kWh depending on the number of days it operates.

1. Introduction

The generation of electrical energy from coal dependent power plants is identified as the world’s principal source of power generation. The coal dependent technologies however have their demerits, i.e., they play a key role in global warming which comes with dire consequences on the environment [1,2,3,4]. For this reason, a number of innovative technologies have been adopted in several countries to suppress pollutions from fossil power plants, some of these include integrated coal gasification, direct coal fuel cells, and carbon capture use and storage. Notwithstanding these efforts to reduce these harmful emissions from the various fossil-based power plants, there still exist an urgent need to find more efficient, cheap, and environmentally friendly alternative energy technologies to minimize global warming and pollution [5,6].
Renewable energy (RE) is identified as the surest option to liberate the world from destruction relative to pollution from power plants due to the need to meet our energy requirements. To that effect, solar energy which is one of the RE options available for electrical energy generation has gained much attention and use globally [7,8,9]. Solar energy is one of the most abundant renewable energy resources on earth, it comes at no cost. It is estimated that most people around the world live in areas that receive solar irradiation intensities that range between 500 W/m2 and 750 W/m2 per day. Similarly, the quantity of solar energy that strikes the earth’s surface is estimated to be about 173,000 TW which is 10,000 times more than the world’s primary energy requirement of 157,063.7 TW h [10]. This suggests that the world has enormous RE resource which is not fully utilized.
Solar photovoltaic (PV) technology is one of the most widely used technologies globally, particularly in countries with abundant sun energy such as Africa and Asia [11]. Report by the IEA indicates that, renewable power globally is expected to increase by about 50% which would be largely driven by solar PV technology which would account for almost 60% of this expected growth between 2019 and 2024 [12]. The PV module consist of a collection of solar cells which converts solar irradiance directly into a stream of electrical charges. The improvement in its efficiency coupled with its maturity has played a key role over its acceptance and use among end-users. The low maintenance cost, long-life span, as well as its green source of energy are all some of the positives associated with the PV system [13]. Despite these positives associated with the PV technology, its performance is affected by various factors during operation conditions, which may lead to a significant reduction in its electrical efficiency. Temperature is one of the main factors that affect a PV module’s electrical performance [14,15], particularly under hot weather conditions where the PV cell’s temperature can reach as high as 70 °C. For instance, it is estimated that above the PV panel’s operating temperature, the yield power of the PV system could reduce by up to 0.65%/K, conversion efficiency to 0.08%/K, and fill factor to 0.2%/K [16,17]. Over 80% of solar radiation that falls on a PV cell is either converted into thermal energy or reflected [18]. The increase in the modules temperature does not only affect its performance but it can also reduce the life-span of the PV module by damaging the material used to fabricate it [19].
Researchers are therefore focused on finding appropriate mechanisms to cool the PV panel under operating conditions. Studies such as Sudhakar et al. [5] combined natural water cooling system and a phase change material (PCM) to effectively manage the temperature of a PV module. They found out that, an up to down continuous water supply cooling method was the best as it resulted in an average temperature reduction of 5.4 °C, electrical efficiency of 12.4%, and power enhancement percentage of 13.54%. Nada et al. [20] also studied about the possibility of using PCM to control the PV panel’s to enhance its efficiency. They assessed four different modules, i.e., building integrated, free standing, Al2O3 nanoparticles-enhanced PCM integrated and PCM integrated experimentally. According to their study, the addition of the nanoparticles to the PCM led to a reduction of the PV module to 59 °C.
In other studies, Duan [21] proposed a new heat sink consisting of PCM and a metal foam (porous) for a concentrator PV system cooling. Results from the study suggest that embedding a metal foam in the PCM could significantly affect the cooling effect of CPV relative to a pure PCM as heat sink. Essa et al. [22] also experimentally assessed a PV efficiency enhancement strategy using a porous metallic media that is combined with PCM. According to their study the porous metallic media integrated with PCM at all times produced the highest efficiency compared to PCM only. It reached a maximum efficiency of 23%. Furthermore, Arefin [23] empirically and numerically assessed a hybrid PV-thermal water heating system with water cooling on the front surface. Results from the study suggest that the PV system’s efficiency with active cooling was about five times higher than that of the referenced PV panel. The front surface cooling led to a 1.5% increase in the panel efficiency. Alizadeh et al. [24] used single turn pulsating heat pipes (PHP) to cool PV modules whose results were compared to a copper fin with same dimensions. The outcomes disclosed that the PHP is more efficient, it led to an 18% improvement in the electrical power output compared to the referenced system.
Moreover, Amr et al. [25] employed the passive cooling technique to cool a PV system, they attached fins at the back of the module. The outcome of their study suggests a drop in the module’s temperature and an enhanced electrical efficiency as a result of the fins. Shmroukh [26] developed a cooling system for a PV panel in Qena city in Egypt. The results of the study established that the combination of the PV panel with an open-loop system increased the average efficiency of the module by 11.3% while that of the uncooled was only 6.2%. Nižetić et al. [27] conducted a study on backside convective cooling of PV panels both numerically and experimentally. The outcome of the study revealed that the specific convective profiles of the modules have a substantial impact on the panel’s electrical efficiency rate of degradation which is estimated to be in the range of 2.5% to 4.5%. Agyekum et al. [28] used water to simultaneously cool both the front and rear side of a PV module. Results from their study suggests that the proposed cooling mechanism led to a temperature drop of 23.55 °C which resulted in a 11.9% improvement in the electrical efficiency.
Similarly, Bayrak, et al. [29] empirically assessed the performance of different cooling mechanisms for a PV panel using aluminum fins, PCM and thermoelectric (TE). Results from their study indicate that the highest power generation of 47.88 W was obtained from the PV with fins, whereas the PV with TEM and PCM generated the least power of 44.26 W. Machniewicz et al. [30] studied the changes in the performance of PV module using PCM on a PV panel with four different melting temperatures. Their results shows that the temperatures between 18 and 25 °C were the most efficient relative to performance. Radziemska and Kucharek [31] conducted an empirical study on PV/PCM and according to their outcomes the PV/PCM module has a lower temperature than the referenced system. Chen et al. [32] empirically considered the consequence of U-and L-shaped fins on a PV system’s electrical performance under natural ventilation. Results from their study shows that the cooled PV module recorded electrical efficiency that is 0.3–1.8% higher than that of the referenced PV module. Agyekum et al. [33] combined both active and passive techniques to cool a PV module. They used both aluminum fins and ultrasonic humidifier to cool the PV module. Results from their study indicate that their proposed approach could reduce the temperature of the panel by 14.61 °C averagely.
Information from the above literature has shown that a PCM is an effective thermal absorber and storage medium that is capable of minimizing a PV panel’s temperature. One of such PCMs is the paraffin wax which is usually applied in a single block behind the PV module for cooling purposes. However, one major disadvantage that is associated with the single block application is the difficulty in preventing leakage of the melted paraffin wax. This normally results in loss of the paraffin wax which demands frequent replacement. The inclined nature of PV panels also makes it difficult to keep the melted PCM in position. As a result, this study proposed a mechanism that uses independent containers to house the PCM which are then fixed behind the PV module. This is combined with aluminum fins which will also rely on natural ventilation to cool the PV module. Unlike the conventional single block application mechanism of cooling PV modules using PCM as demonstrated in most of the reviewed literature, one advantage of this cooling mechanism is the ability of sections of the rear side of the PV panel to be cooled by ambient air. This is because the back of the module is not fully covered and makes room for natural air cooling. This study therefore adds to the current growing literature in relation to the cooling of PV modules.
The rest of the paper is organized as follows: Section 2 covers the materials and method used for the experiment; the results obtained from the experimental process are also presented in Section 3. Conclusions and future research recommendations are also presented in Section 4.

2. Materials and Methods

The materials used in the construction of the experimental rig and the various equipment used in recording the experimental data are presented in this section. The section also present the mathematical models used for the data reduction.

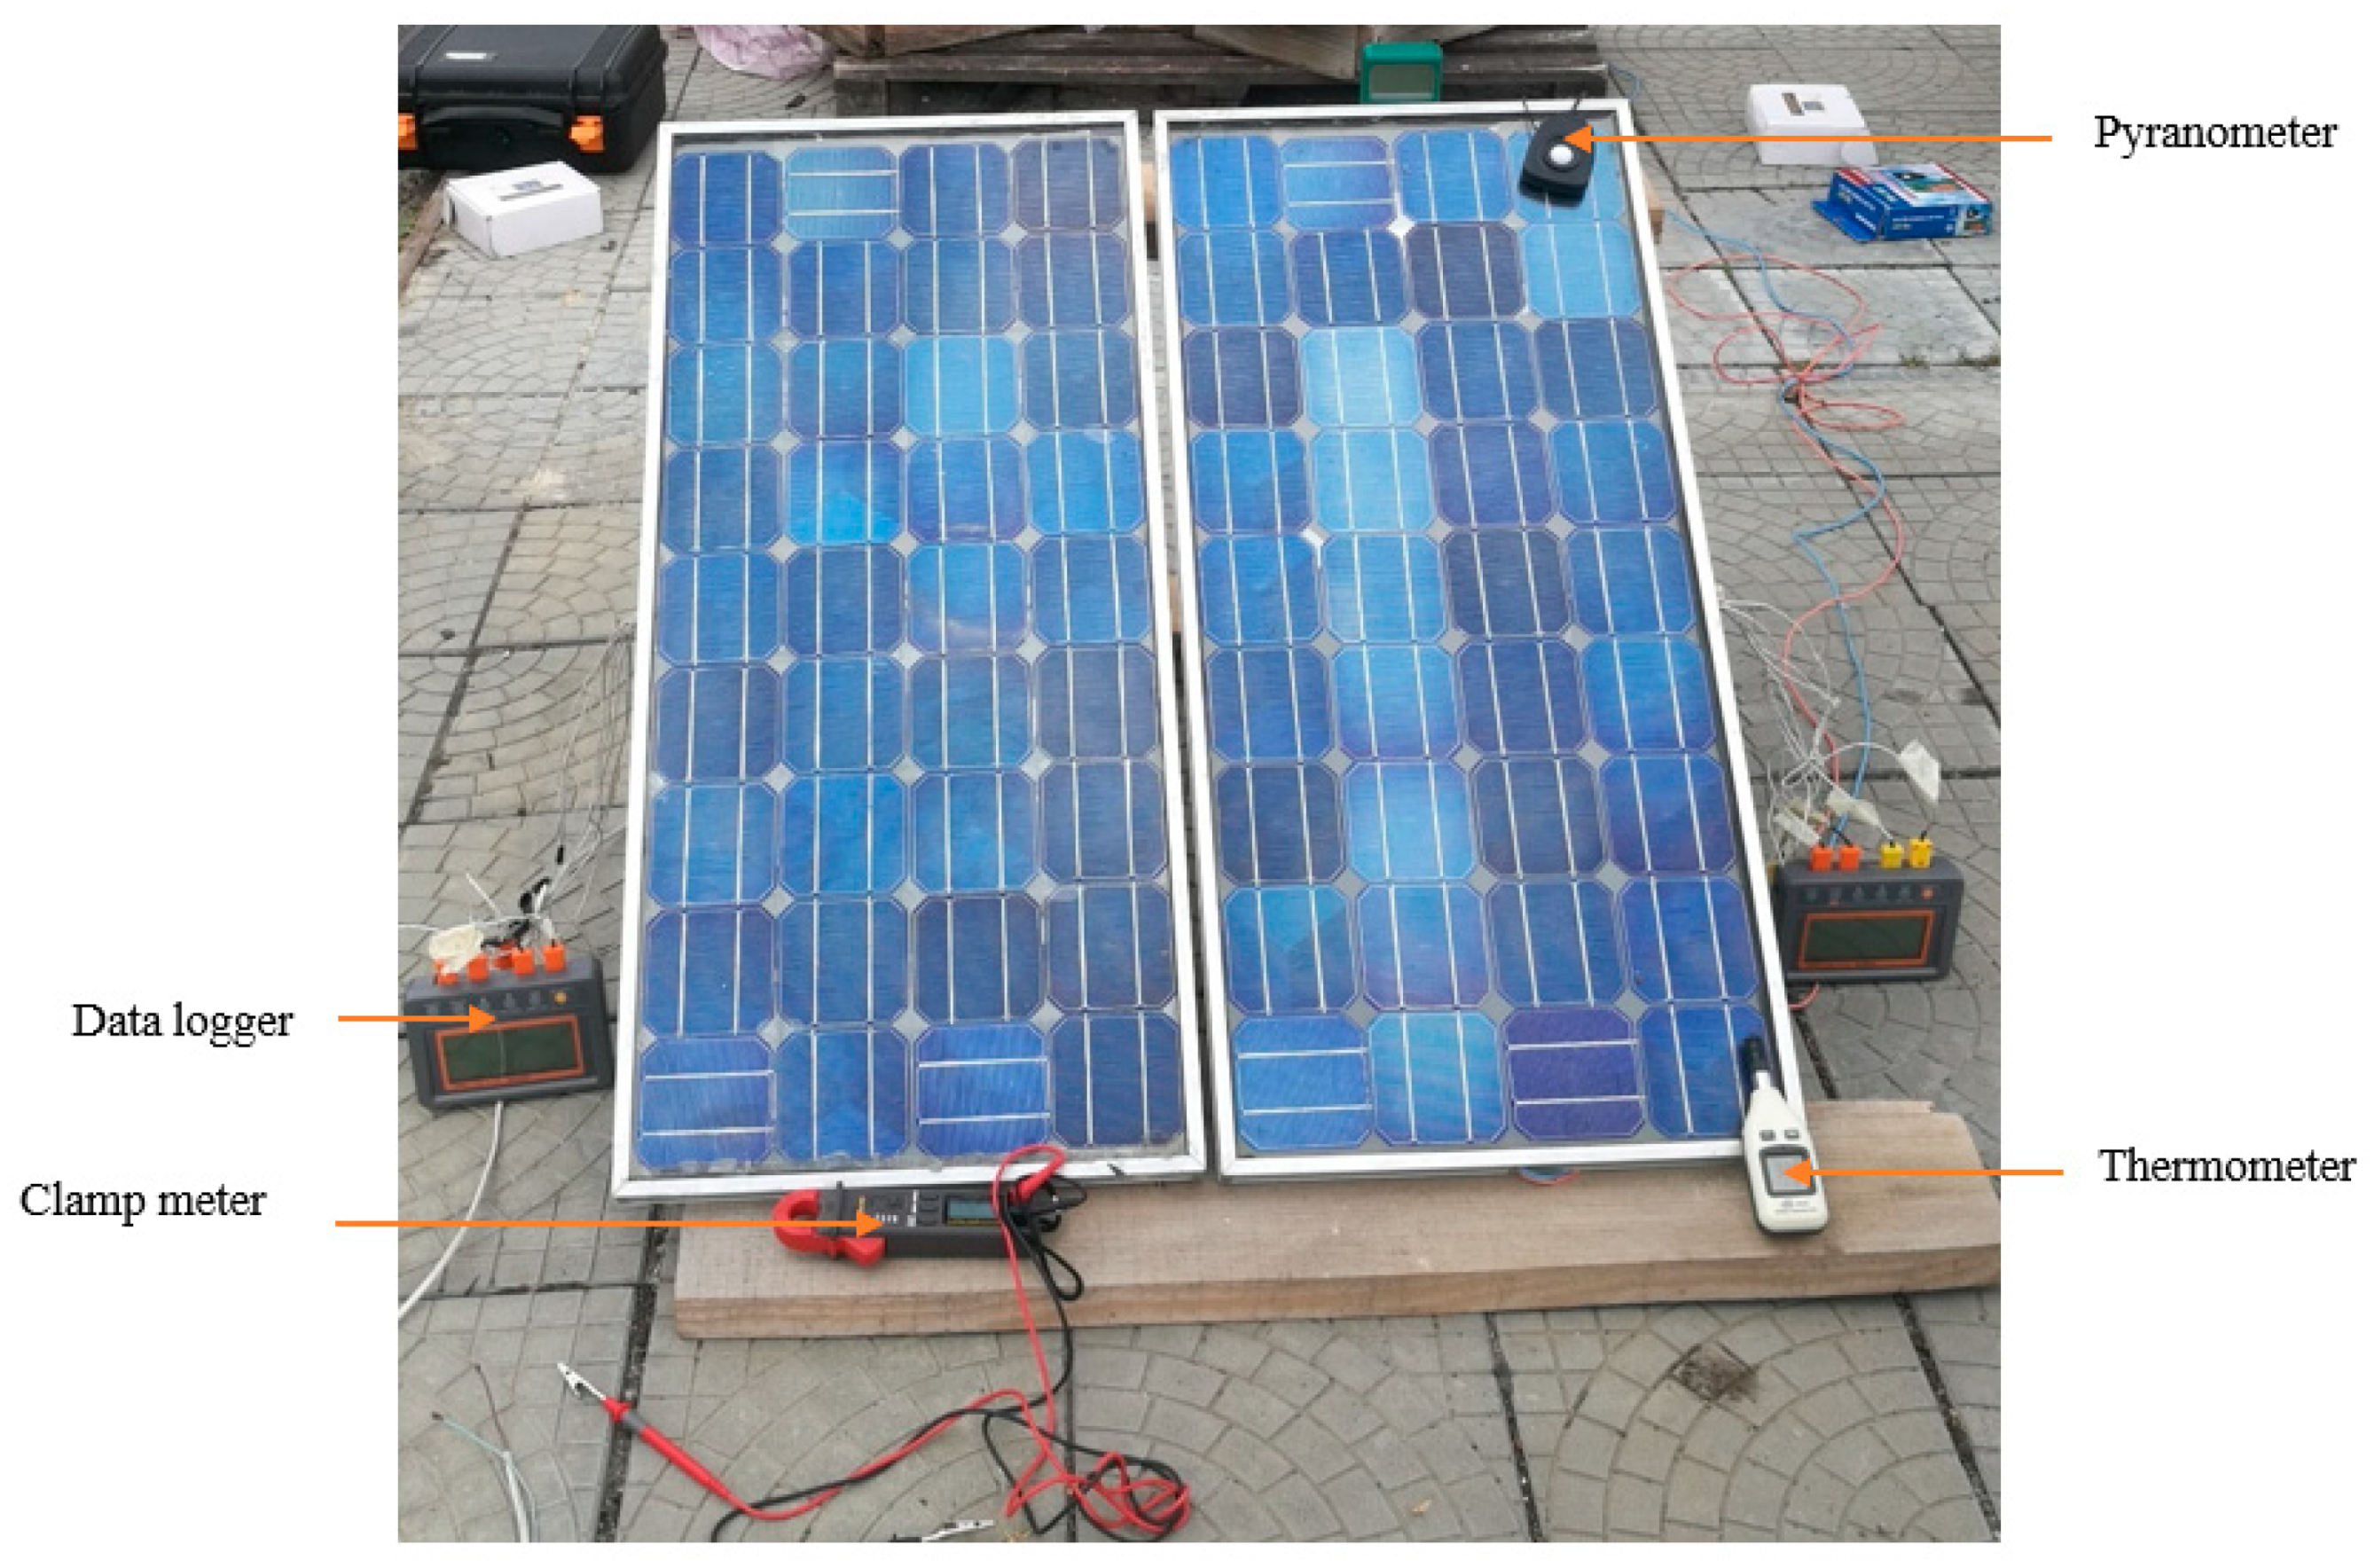
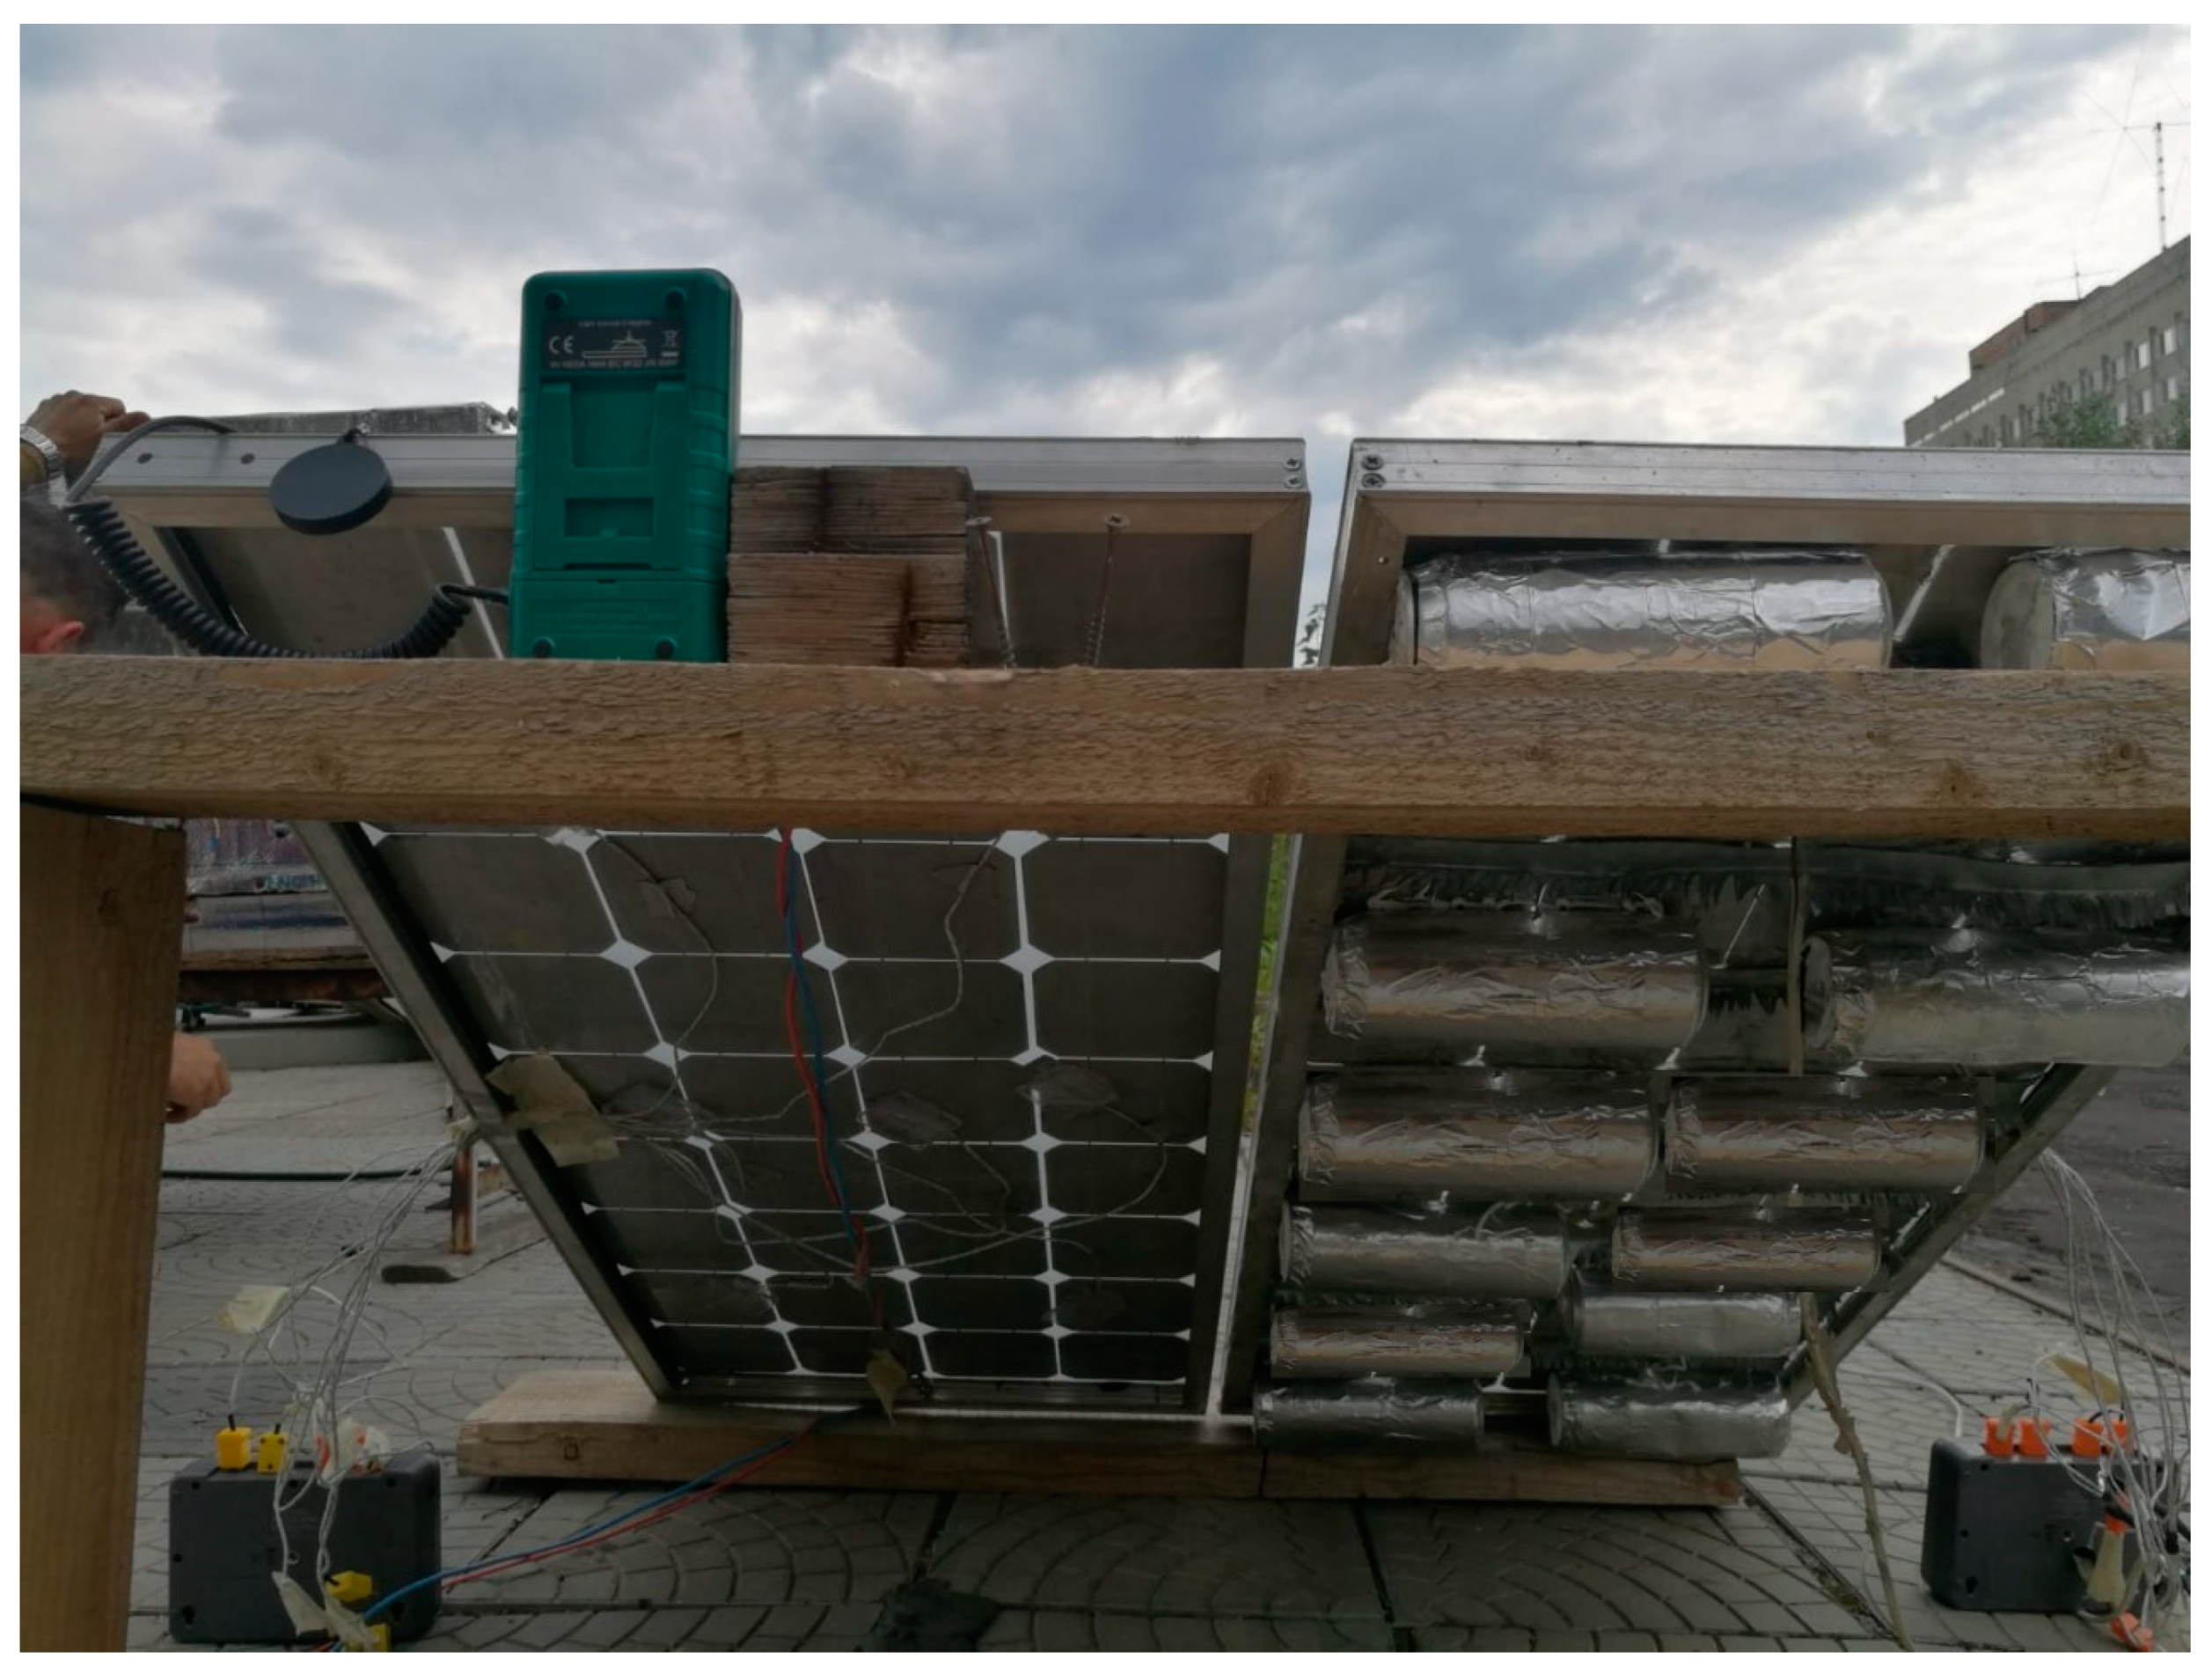
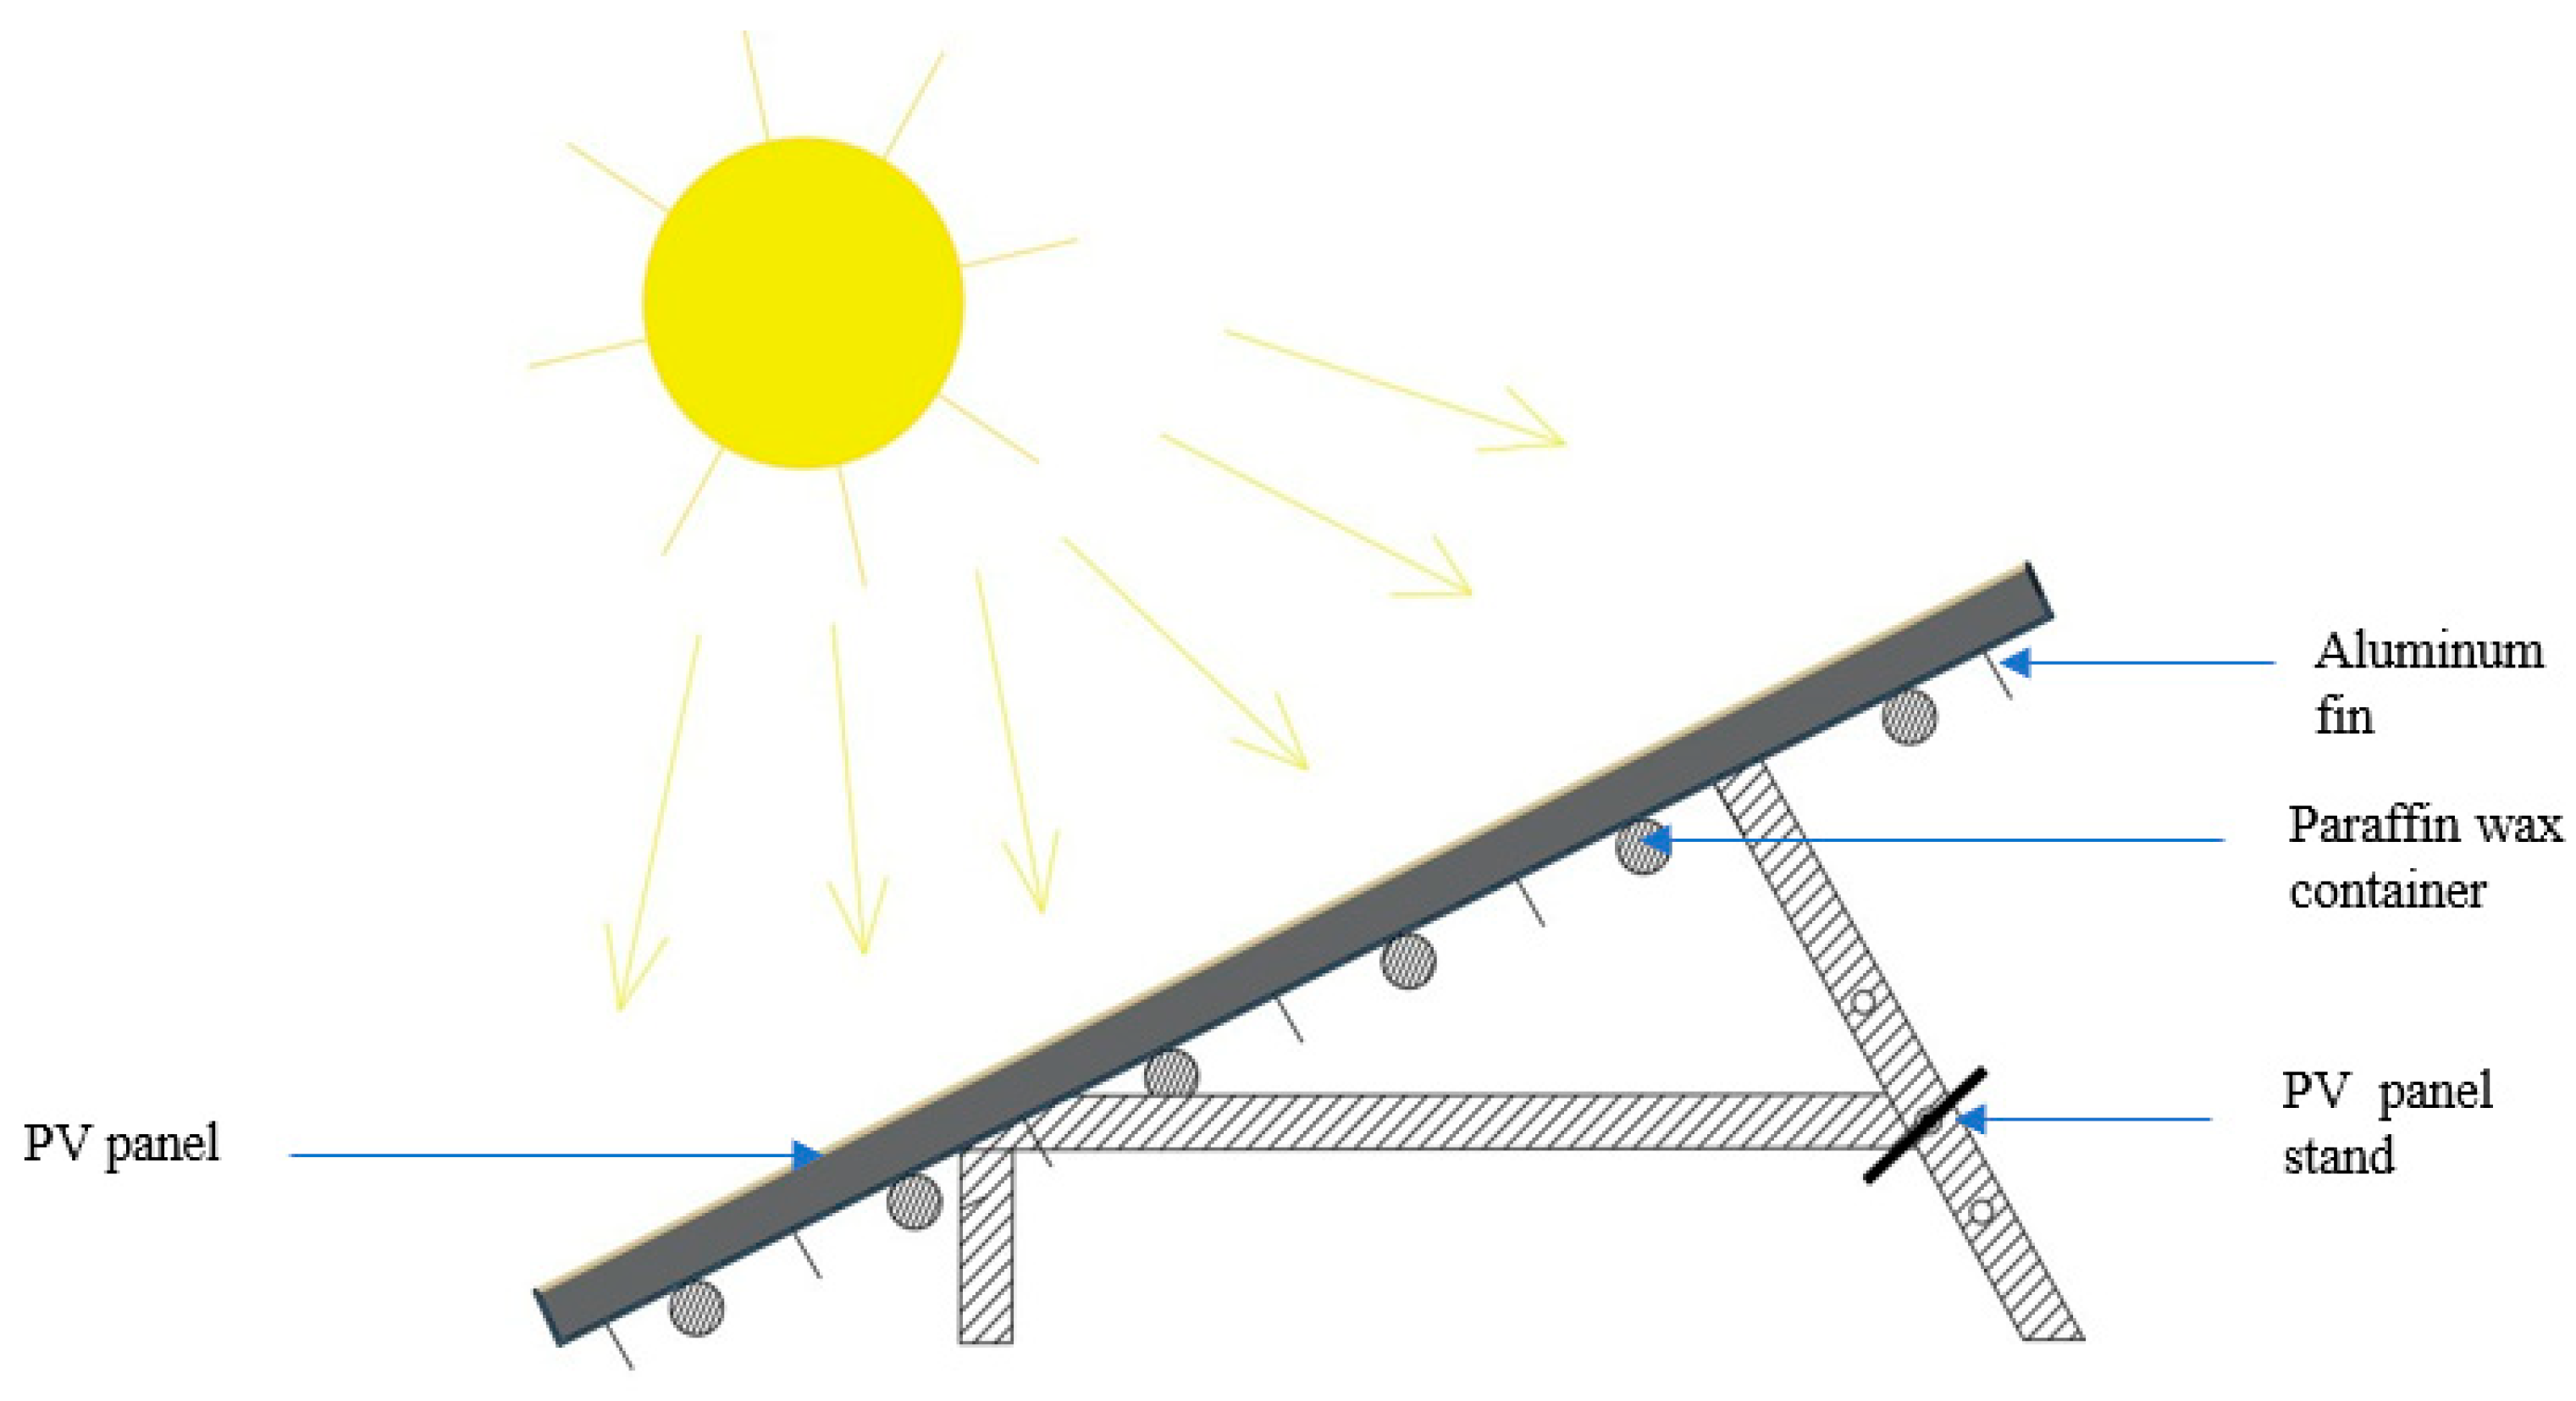
2.1. Experimental Setup and Process

The experiment was conducted in the month of July during the summer period at Ural Federal University, Russia. The experiment was conducted by comparing an enhanced PV system integrated with horizontal aluminum fins and PCM i.e., paraffin wax in aluminum containers attached to the panel’s backside. In most studies, the PCM is fixed at the rear side of the panel in a single compartment. In this study we did something different by putting the PCM in separate capsule-like aluminum containers which were latter fixed at the back surface of the PV module. The approach proposed in this study is unique and simple to construct. One major problem the cooling mechanism in the study resolves is the leakage of melted PCM. The proposed cooling method in this study is able to store the melted PCM without leakage, thereby reducing maintenance and replacement cost. This mechanism also allows the back of the panel to be cooled by natural air since the capsule containers do not fully cover the entire rear surface.
A total of 12 capsule-like aluminum containers were installed at the back of a PV panel (herein known as the cooled PV panel). The installation was done with thermal glue in order to provide adequate contact between the surface of the panel and the paraffin wax containers. The application of the thermal glue is very important and must be carefully done in order to increase the contact surface area between the paraffin wax containers and the back of the panel. As a result, enough thermal glue must be applied to achieve the maximum contact. The experimental setup is as presented in Figure 1.
In conducting the experiment, both panels were positioned 45° to the south to obtain maximum solar radiation. Figure 2 shows the rear side of the two panels (i.e., referenced, and cooled PV modules). Figure 3 is the schematic diagram of the experimental set-up. The temperature of the two panels were recorded using seven thermocouples manufactured by Weewooday and supplied by Amazon, for each module. The thermocouples were attached at different positions to allow us to find the mean temperature distribution of the PV module at each reading. The current and voltage were measured with a clamp meter (RS Components Ltd, China). The wind speed with anemometer, the intensity of the solar radiation was also measured using pyranometer supplied by Amazon, while the ambient temperature and humidity was measured using the GM 1362-EN-01 thermometer manufactured by Shenzhen Jumaoyuan Science And Technology Co., Ltd., Shenzhen, China.

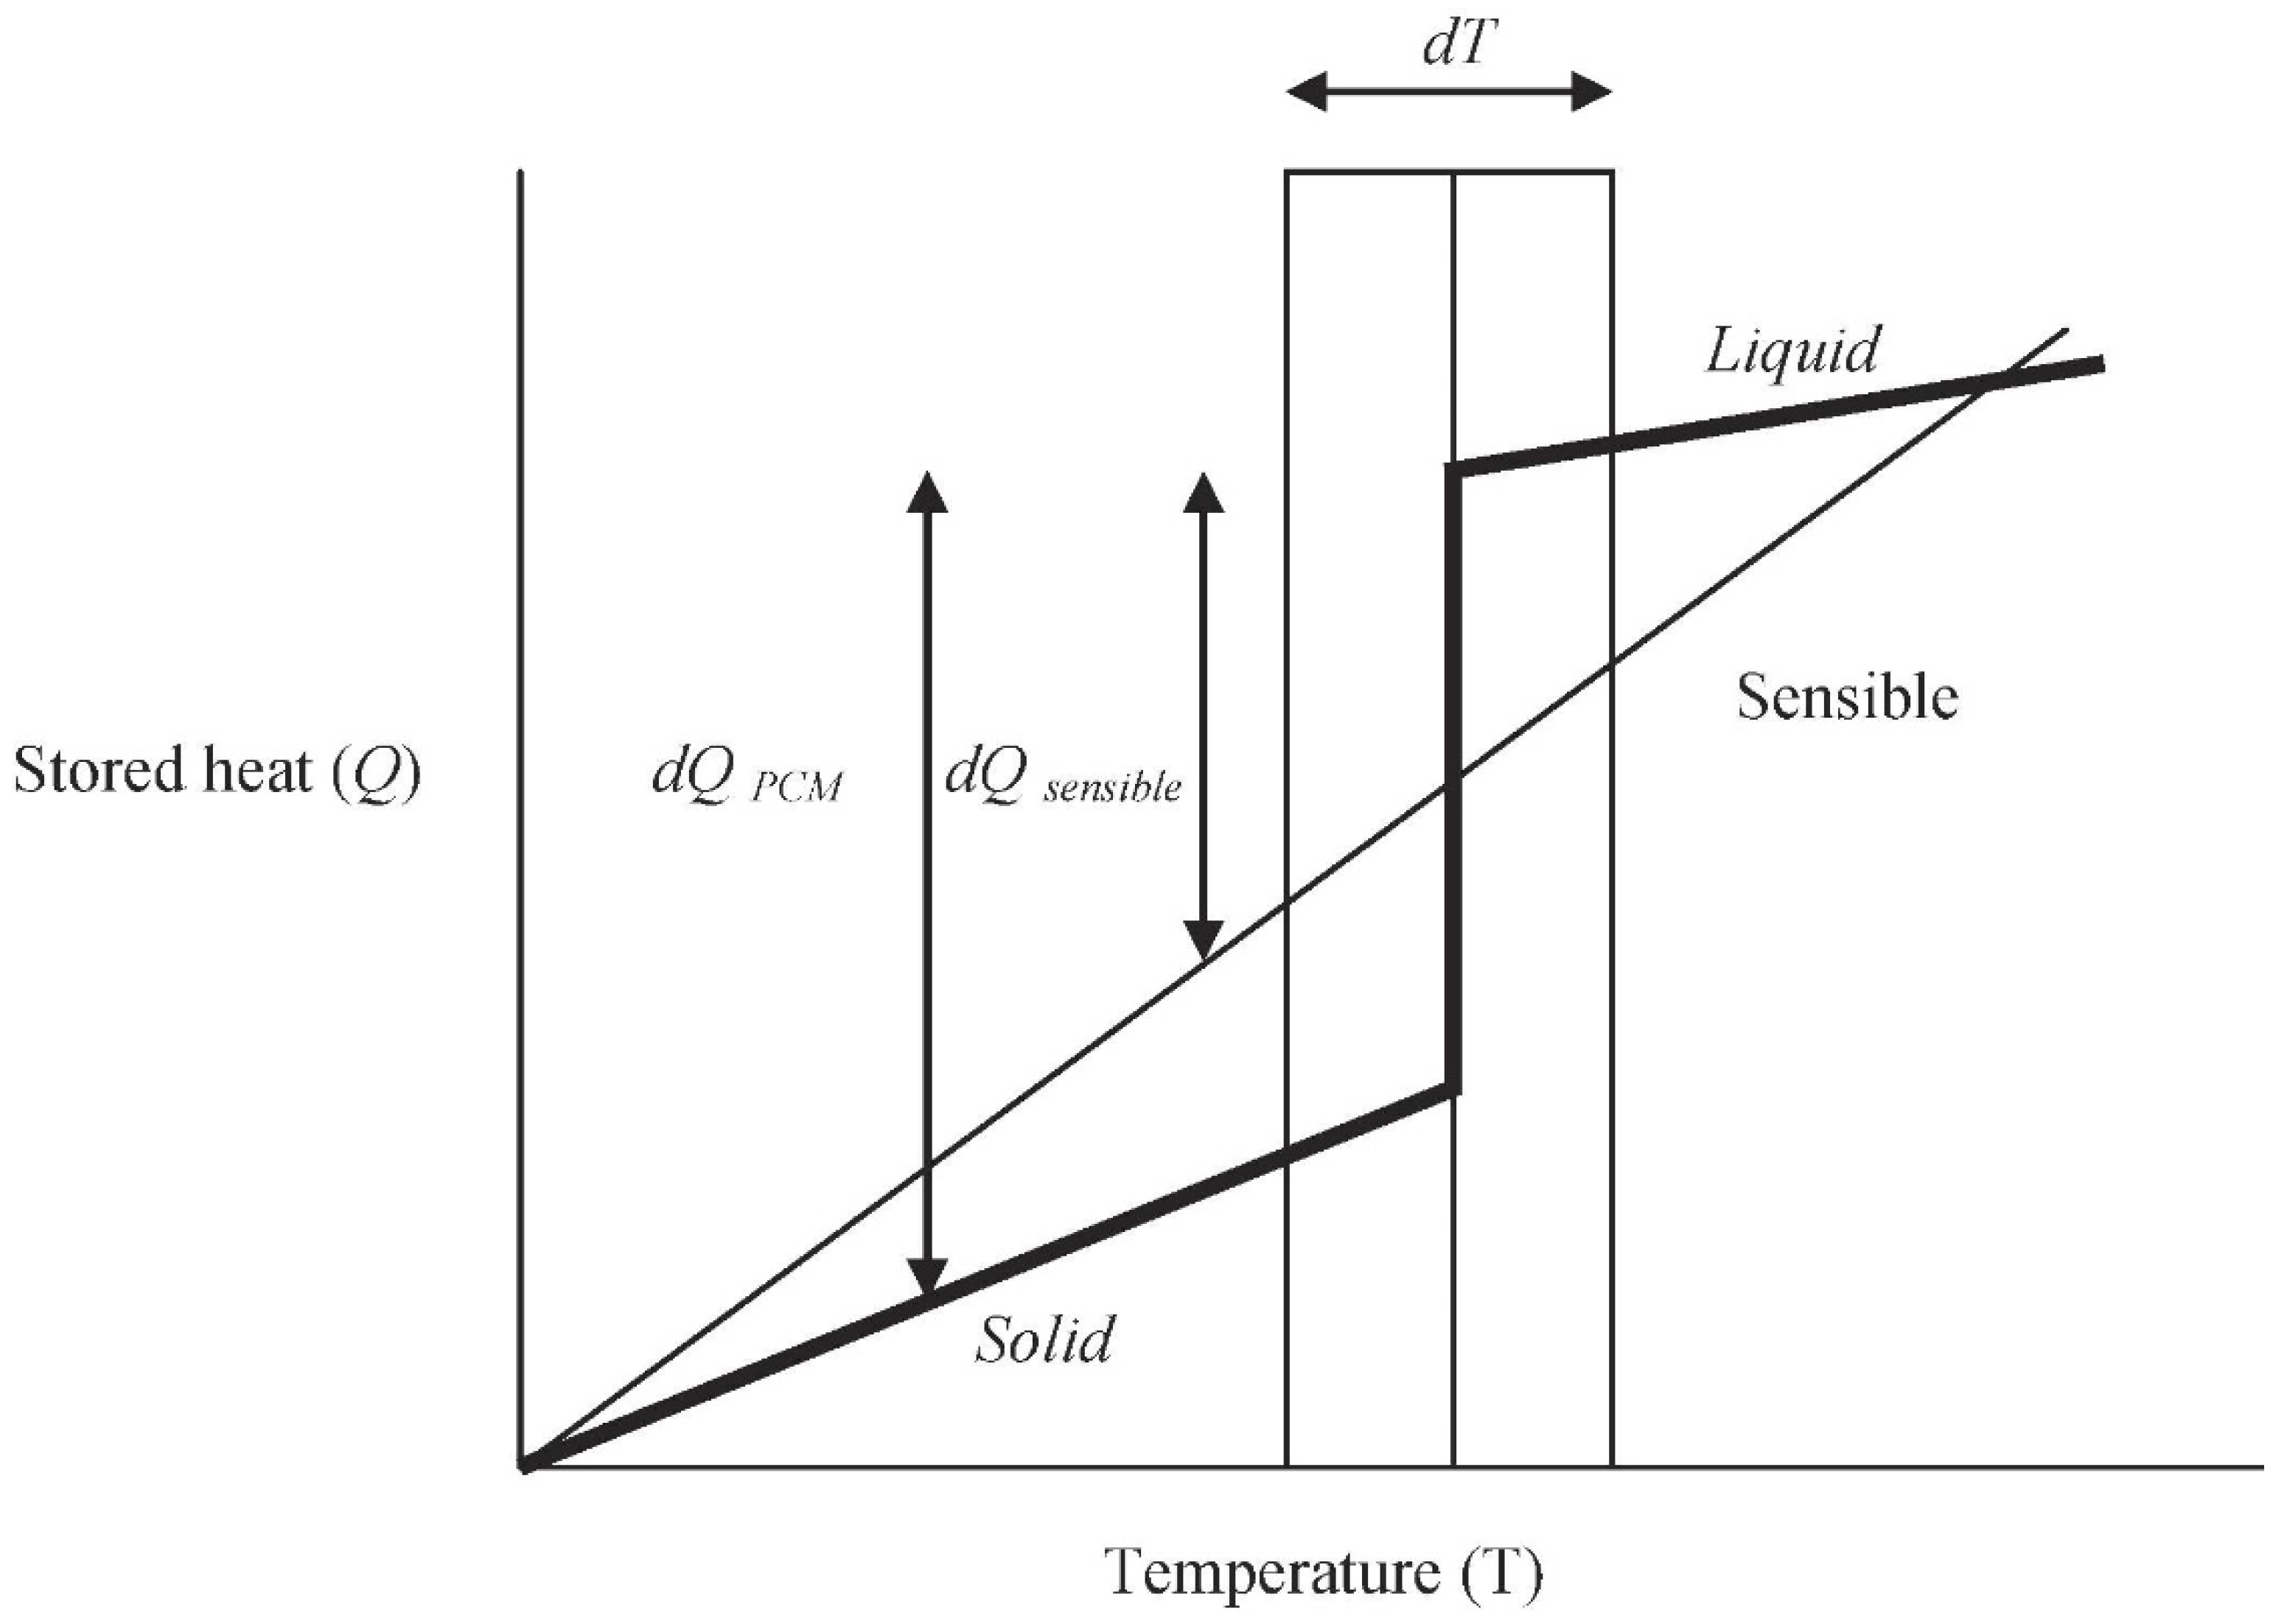
2.2. Phase Change Material

A PCM is a material that is able to store energy in the form of latent heat. Latent heat storage is about phase transition of a material, i.e., energy is released or stored as a result of the variation in the enthalpy of the phase change. As a result of the contribution of the phase changes, at the phase change temperature of the material, thermal energy storage operates virtually isothermally [34]. Latent heat thermal energy storage in terms of energy density is higher compared to that of sensible heat thermal energy storage. A PCM’s melting temperature must therefore be as low as possible to obtain the maximum improvement in electrical performance [35]. To find out the phase change of PCM (liquid or solid), with specific heat capacity for every phase, the temperature field is given as presented in [36] as indicated in Equation (1). A PCM’s behavior under varying temperature is presented in Figure 4.
T = { E / c s     T < T m   ( s o l i d   p h a s e ) T m     0 < E < H ,       T > T m   ( m e l t   z o n e ) T m + ( E H ) / c L     E H ,       T > T m   ( l i q u i d   p h a s e )
where the thermal energy is denoted with E (J/kg), c is the specific heat capacity for every phase, and the latent heat is represented by H (J/kg).
In this study, the paraffin wax was used as a PCM to cool the PV module, the characteristics of the used PCM are as follows: the melting point is 28 °C, thermal conductivity 0.2 W m−1 K−1, and heat of fusion 222 kJ/kg.

2.3. Data Reduction

The efficiency of the PV module is affected by the temperature of the panel and the ambient temperature, this is because the voltage and current of the module is subject to its temperature. The maximum power of the PV module can be estimated using Equation (2) [38].
P m p = V m p × I m p = V o c × I s c × F F
The fill factor is denoted by F F , the open circuit voltage is represented by V o c , the maximum power point on the I-V curve of the module is symbolized by subscript m .   I s c is the short circuit current. The F F and V o c reduces considerably with temperature, this is because the thermally excited electrons start to dominate the semi-conductor’s electrical properties, the I s c increases slightly [28,38].
The PV module efficiency can be defined as the ratio of the output energy generated by the PV cell to the energy input from the sun as shown in Equation (3) [39].
η = E o u t / E i n
The PV module’s efficiency can also be estimated with Equation (4).
η = P m a x E · A
where the maximum power is denoted by P m a x , the surface area of the module is represented by A (m2) and the solar irradiance under STC is denoted by E (W/m2).
The solar cell’s efficiency can also be computed using Equation (5) [17].
η p v = η r T · [ 1 β ( T p v T r T ) ]
where the efficiency of the PV cell is denoted by η p v , η r T signifies the efficiency of the PV module under reference temperature which is normally 25 °C. β denotes the temperature coefficient of power which is a material property and for crystalline silicon modules is 0.004 K−1, T p v is the PV module’s temperature and T r T is the reference temperature of the PV module.
The effect of temperature on the PV panel can be calculated using the relation for PV array power output as shown in Equation (6) [39,40].
P p v = Y p v · f p v ( G T / G T ,   S T C ) [ 1 + α p ( T C T C ,   S T C ) ]
where the PV arrays-rated capacity is represented by Y p v (kW), the PV derating factor is also represented by f p v (%), the current time step incident solar radiation on the array is denoted by G T (kW/m2), α p is the temperature coefficient of power (%/°C), G T ,   S T C represents the incident solar radiation at STC (1 kW/m2). T C (°C) denote the temperature of the cell at current time step, T C ,   S T C is the temperature of the cell at STC (25 °C).
The PV module’s performance enhancement as a result of the integration of the PCM can be assessed using stated parameters. The efficiency enhancement percentage (EEP) and the power enhancement percentage (PEP) are the differences in percentages in efficiency and power of the PV-PCM module relative to the reference PV panel. The equations used for the calculation of these parameters are presented in Equations (7) and (8) [41].
P E P = P o u t   P C M P o u t   r e f P o u t   r e f × 100 %
E E P = η o u t   P C M η o u t   r e f η o u t   r e f × 100 %
The power output of the PV-PCM module is represented by P o u t   P C M the power output from the reference PV module is denoted by P o u t   r e f . The electrical efficiency of the reference panel and the PV-PCM module are represented by η o u t   r e f and η o u t   P C M , respectively.
The average temperature reduction ( T A R ) can be calculated by summing the various temperature change amid the cooled panel and the referenced panel as presented in Ref [5] as indicated in Equation (9).
T A R = 1 N t = 0 t = n ( T p v ,   t T p v P C M ,   t )
where the temperature of the cooled panel and the reference panel are represented with T p v P C M and T p v , respectively. The t in the equation varies from 0 to n , this stands for the time at the commencement and the end of the experimentation. The total number of measurements is also denoted by N .

2.4. Exergy Analysis

Exergy is the value that demonstrates the maximum useful work of a system enclosed in an environment in a constant pressure and temperature in a reversible process. Hence in calculating the exergy efficiency of a system, the following assumptions are made [42]:
  • There is no irreversibility for the environment.
  • Uniformity in the environment relative to intensive properties.
The electrical exergy for a PV system is intended to make use of the present energy as a useful energy. An analysis of exergy takes into account the energy capability and quality. The overall exergy balance for a PV system can be mathematically expressed as follows:
E ˙ i n = E ˙ o u t
E ˙ i n = E ˙ o u t + E ˙ l o s s + E ˙ i r r e v e r s i b i l i t y
The exergy efficiency for a PV system can be defined as the ratio of the total output exergy to the total input exergy, this is expressed mathematically as indicated in Equation (11) [29].
ψ s y s t e m = E x o u t E x i n
where the input exergy for the PV module include the solar radiation intensity exergy as expressed in Equation (12) [29,43].
E x ˙ i n = ( 1 T a T s ) I s A
The output exergy can also be calculated using Equation (13) [29].
E x ˙ o u t = V m I m ( 1 T a T c e l l ) h c A ( T c e l l T a )
The exergy efficiency of the PV module can therefore be calculated using Equation (14) [44].
ψ s y s t e m = V m I m [ ( 1 T a T c e l l ) · ( h c A · ( T c e l l T a ) ) ] ( 1 T a T s ) · I s · A
where the maximum power voltage and current of the system are represented by V m and I m , respectively. The ambient temperature is denoted by T a (K). T s denotes the sun surface temperature assumed to be 5762 K, the module surface temperature is denoted by T c e l l (K). The global solar radiation (W/m2), and the module area is denoted by A (m2), the area of the module used in this study is 0.4275 m2. The convective heat transfer is denoted by h c , it depends on the velocity of wind v and can be calculated using Equation (15) [42].
h c = 5.7 + 3.8 v

2.5. Analysis of Measurement Errors

Errors associated with experiment are calculated using uncertainty analysis. There are basically two forms of errors, namely variable error and fixed error during measurements [5]. Accuracies associated with the various instruments used for the experiment are presented in Table 1. The experimental errors as a result of the measurement of the various data are estimated using the method provided in [45]. The resultant N in this method is a function of the independent variables as presented in Equation (16).
N = N ( Y 1 ,   Y 2 ,   Y 3 ,   Y n )
The percentage of uncertainty in the resultant “N” can be computed using Equation (17).
U N = ( N Y 1 Δ Y 1 ) 2 + ( N Y 2 Δ Y 2 ) 2 + + ( N Y n Δ Y n ) 2
where uncertainties in the independent variables are represented by Δ Y 1 , Δ Y 2 Δ Y n .
The percentage of total uncertainty for the PV system in this experiment is equivalent to 3.2% which is acceptable in this kind of analysis.

3. Results and Discussion

The results for the PV panel’s temperature, exergy, and electric efficiencies of the two panels are presented and discussed in this section. The weather characteristics on the day of the experiment are also presented in this section.

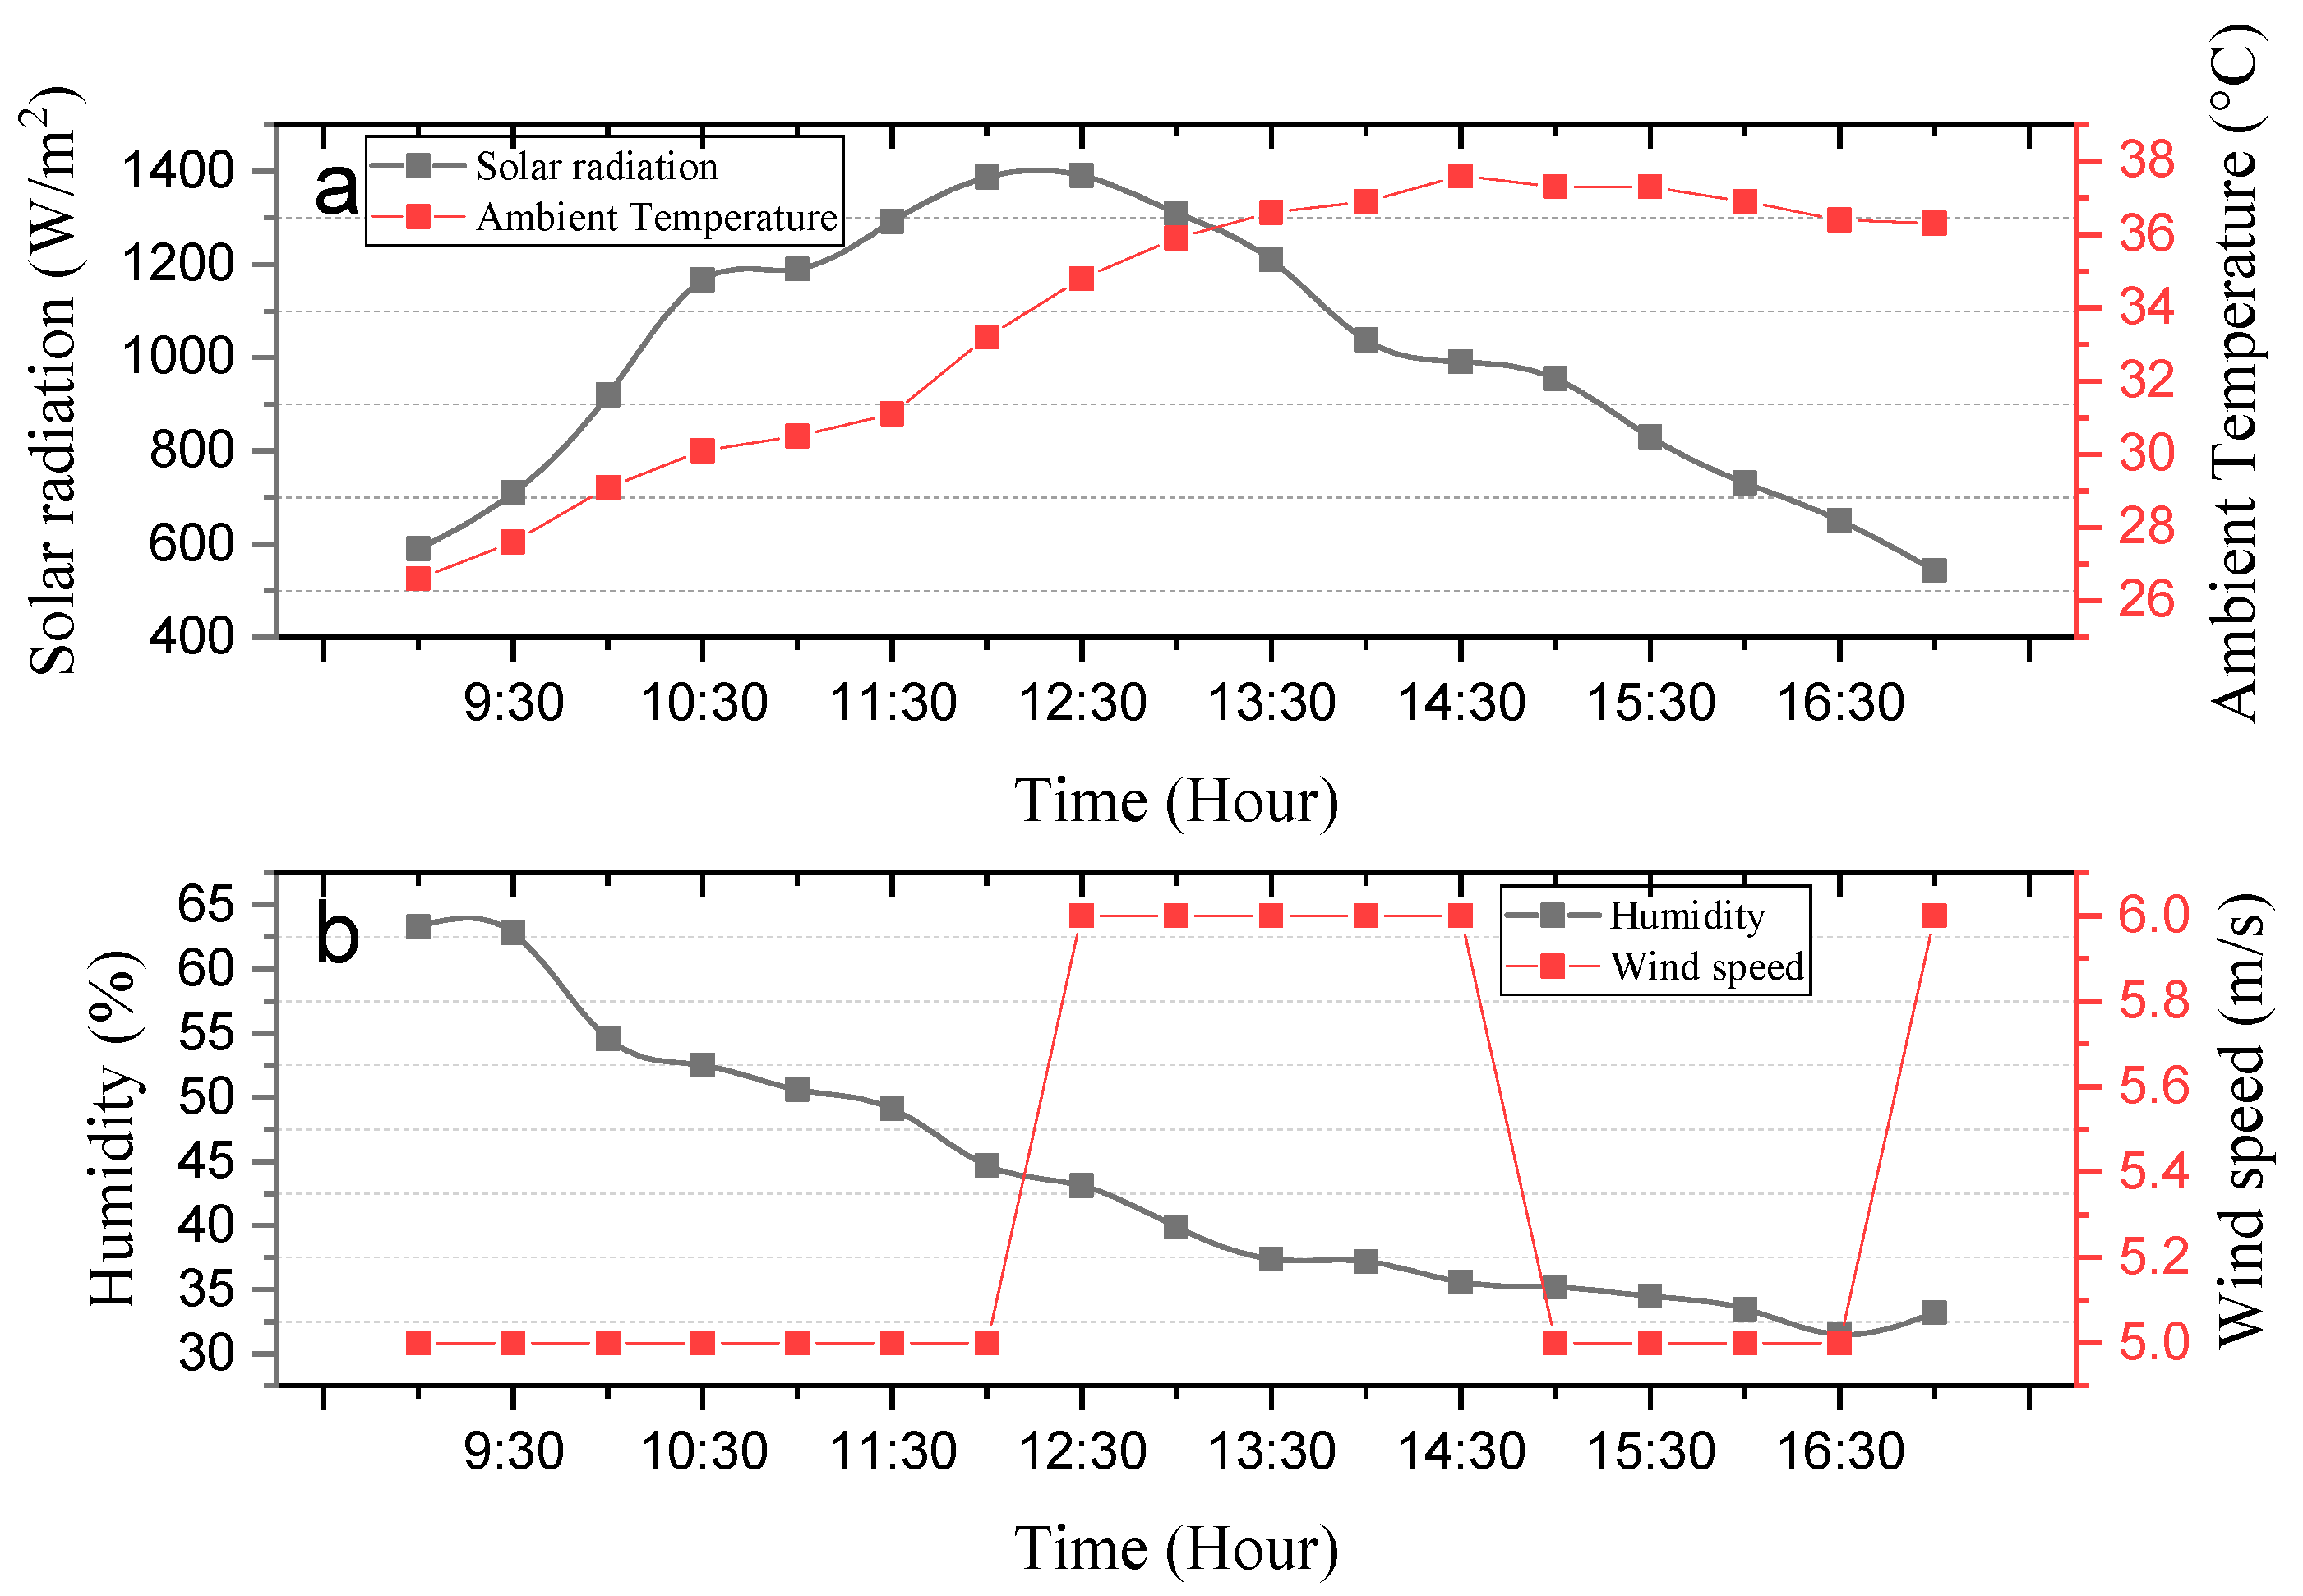
3.1. Weather Characteristics

The details of the weather characteristics on the day of the experiment is presented in Figure 5. According to the results gathered, the highest solar radiation of 1391 W/m2 for the day was recorded at 12:30 pm, while the least solar radiation for the experimental period was recorded at 17:00 pm which is 543 W/m2. The average solar radiation for the experimental period is 994.59 W/m2. The highest ambient temperature of 37.6 °C was recorded at 14:30 pm while the least was recorded in the morning around 9:00 am at the start of the experiment. The average ambient temperature for the day is 33.7 °C. Similarly, the humidity of the day drops with increasing ambient temperature. The experimental day recorded an average humidity and wind speed of 43.45% and 5.35 m/s, respectively.

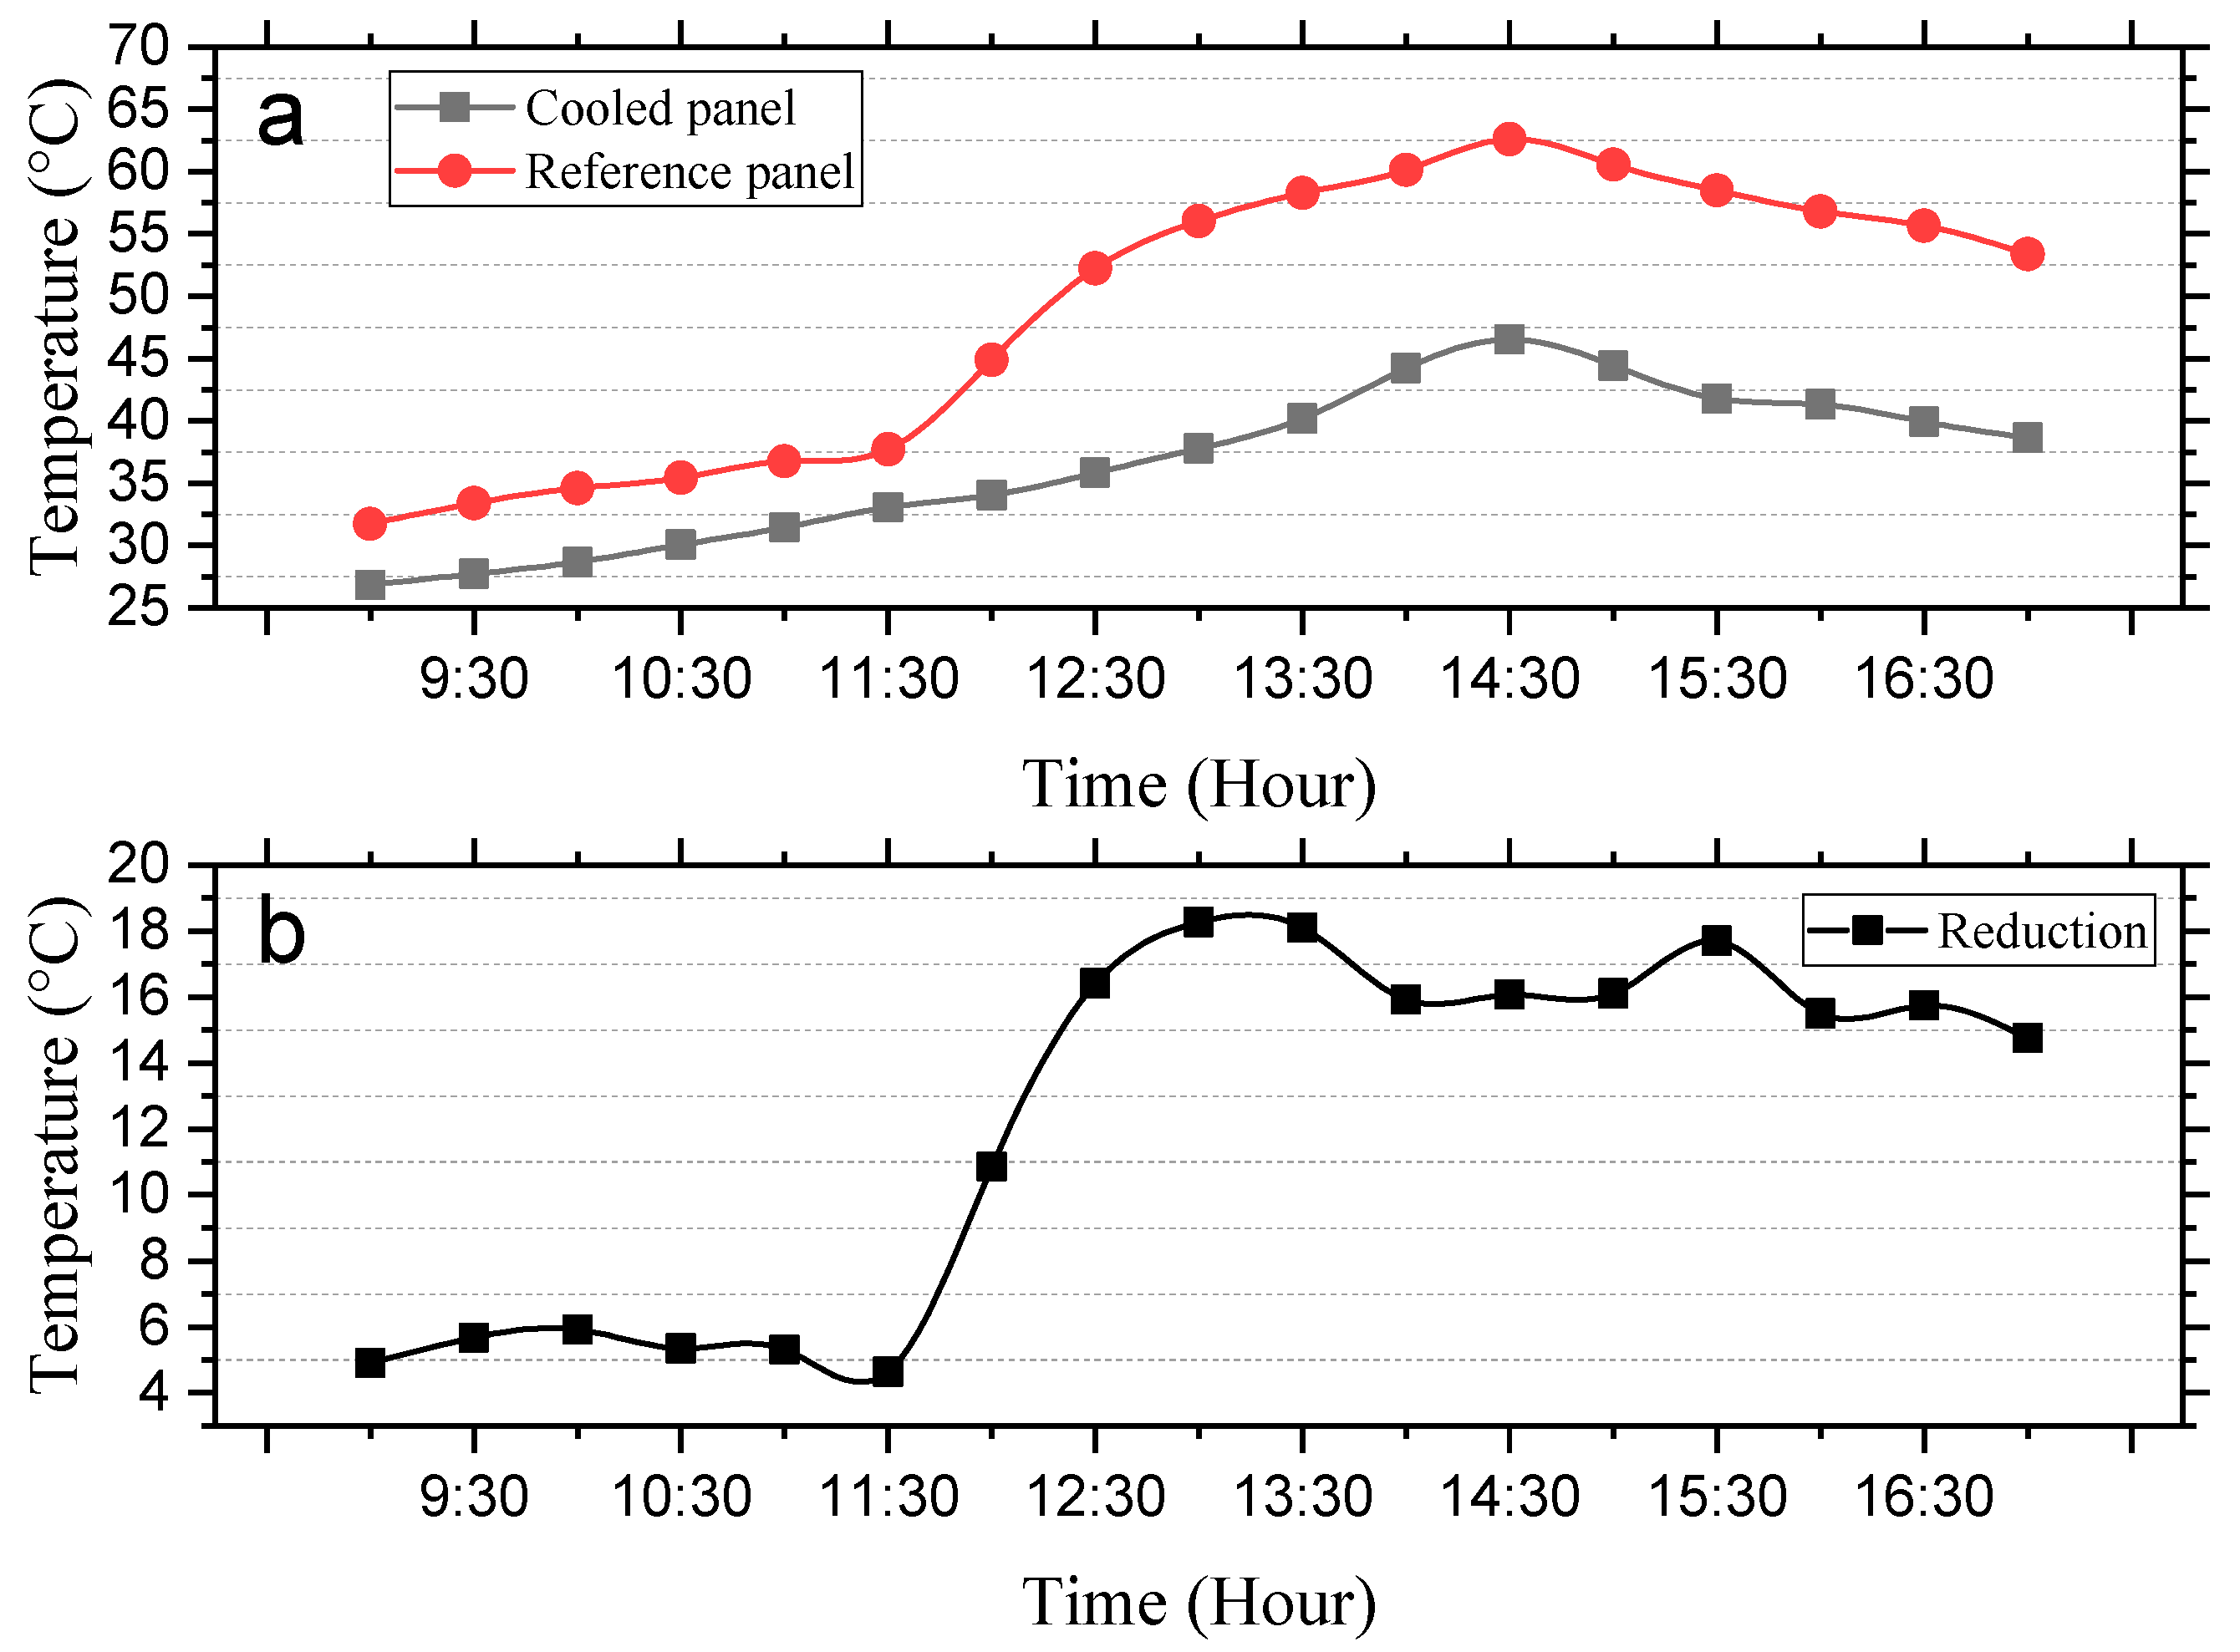
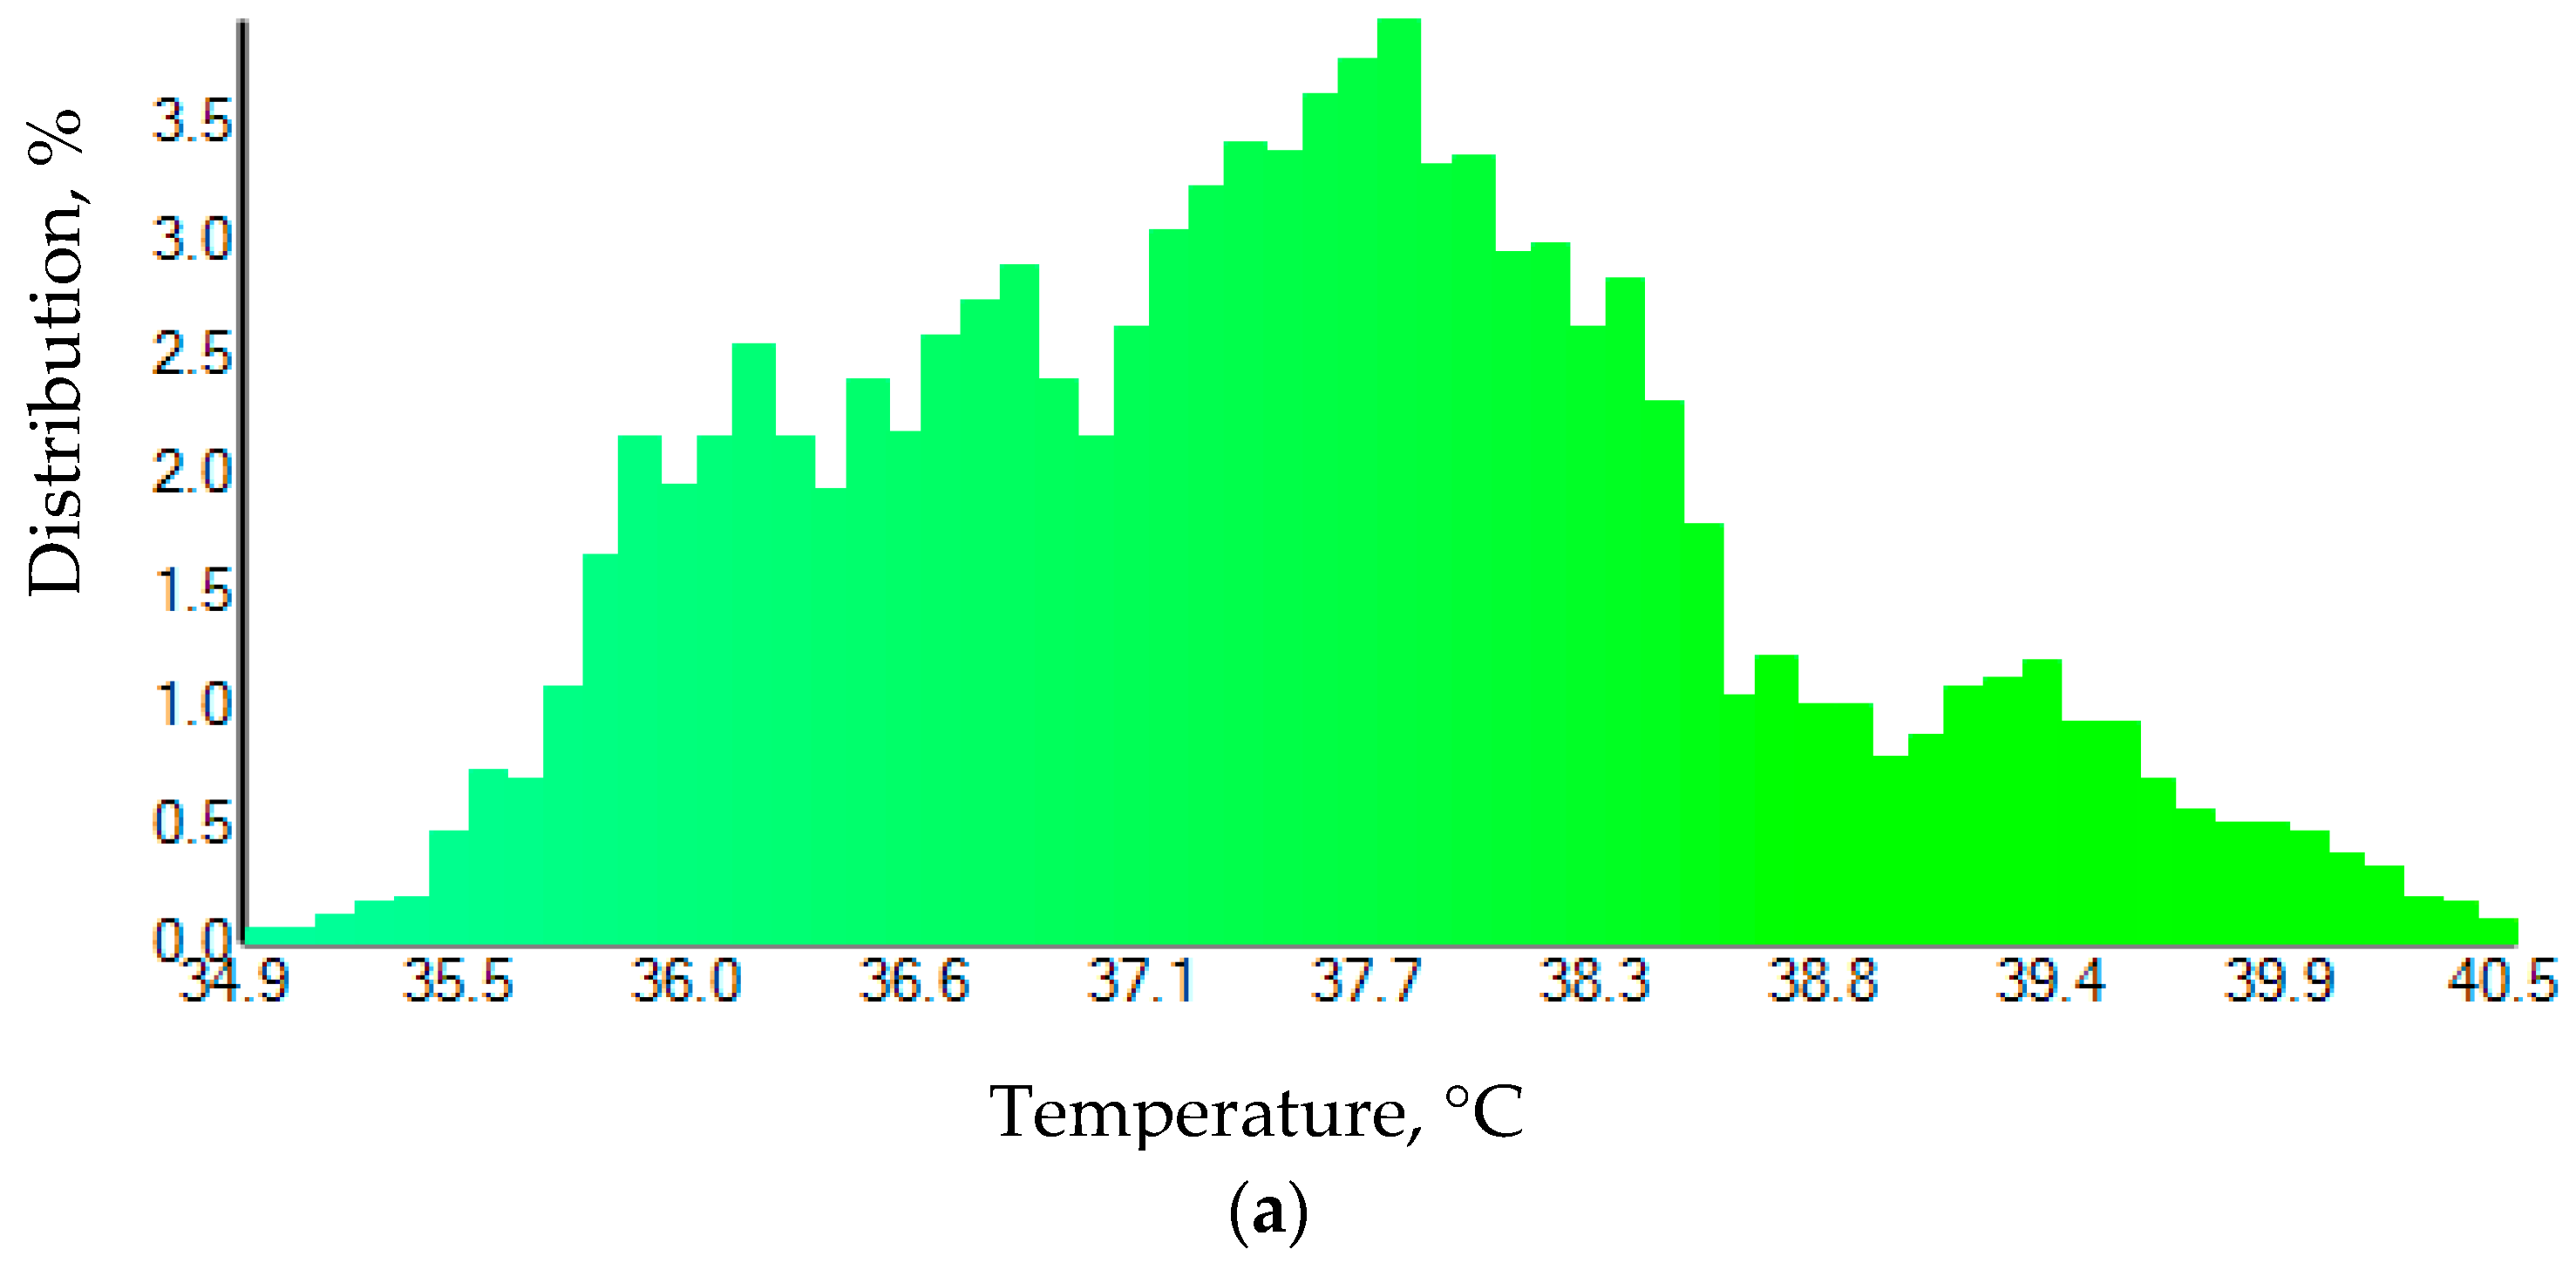
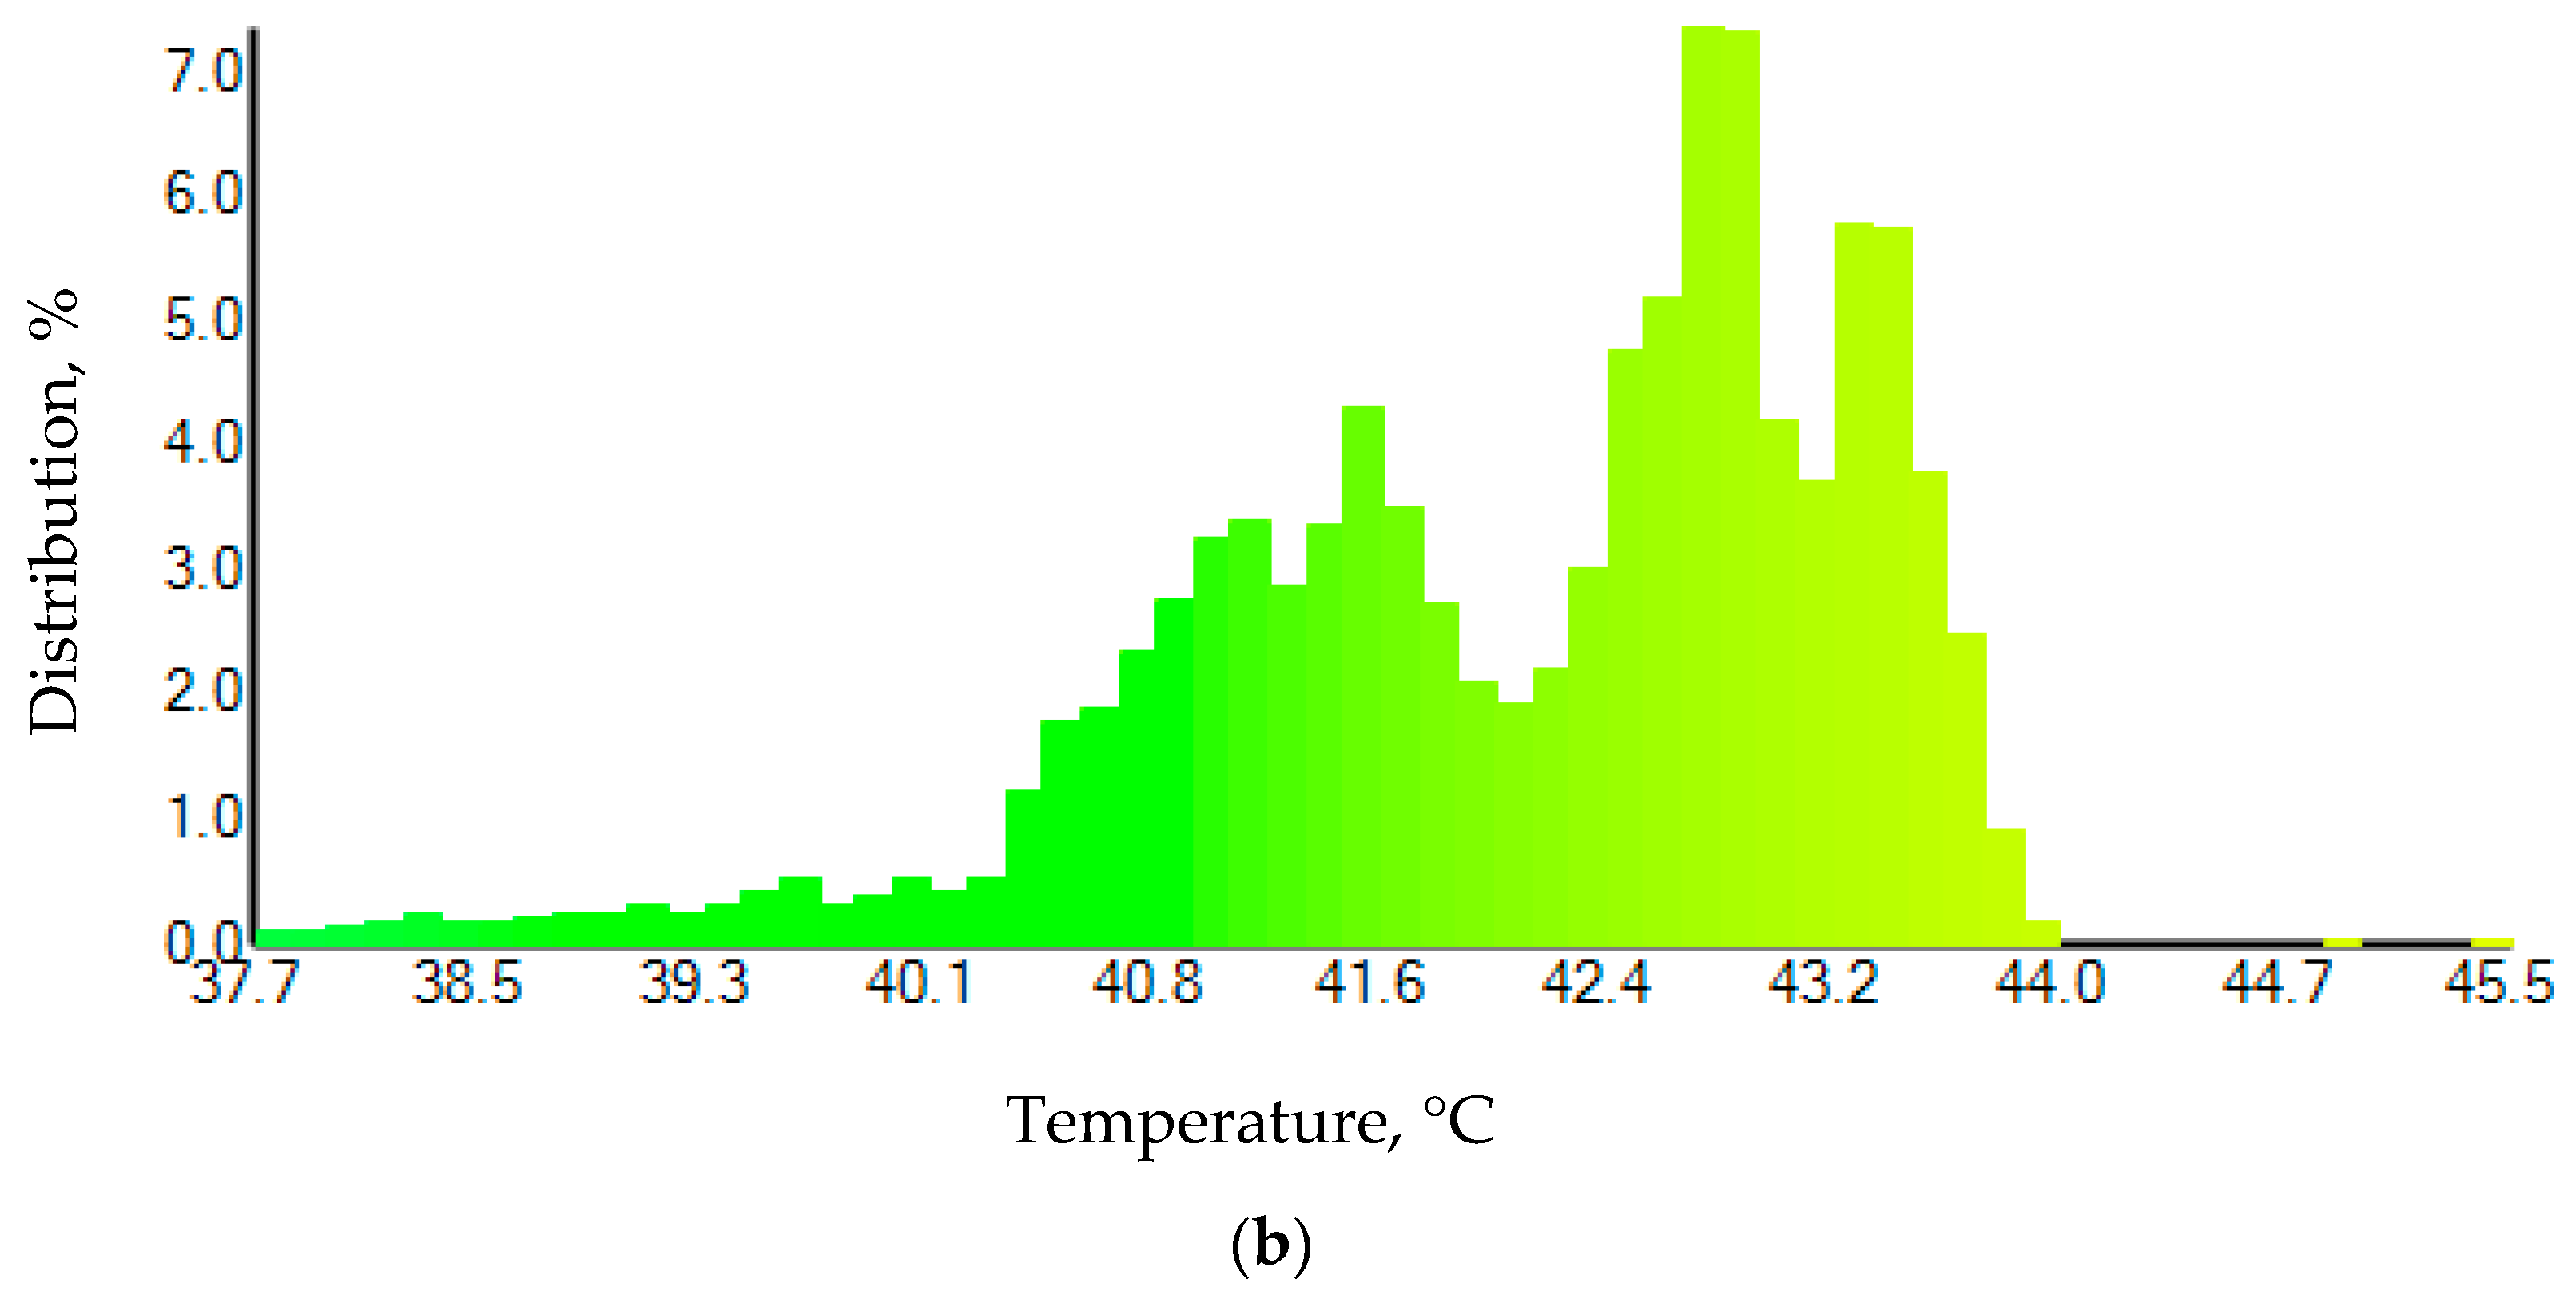
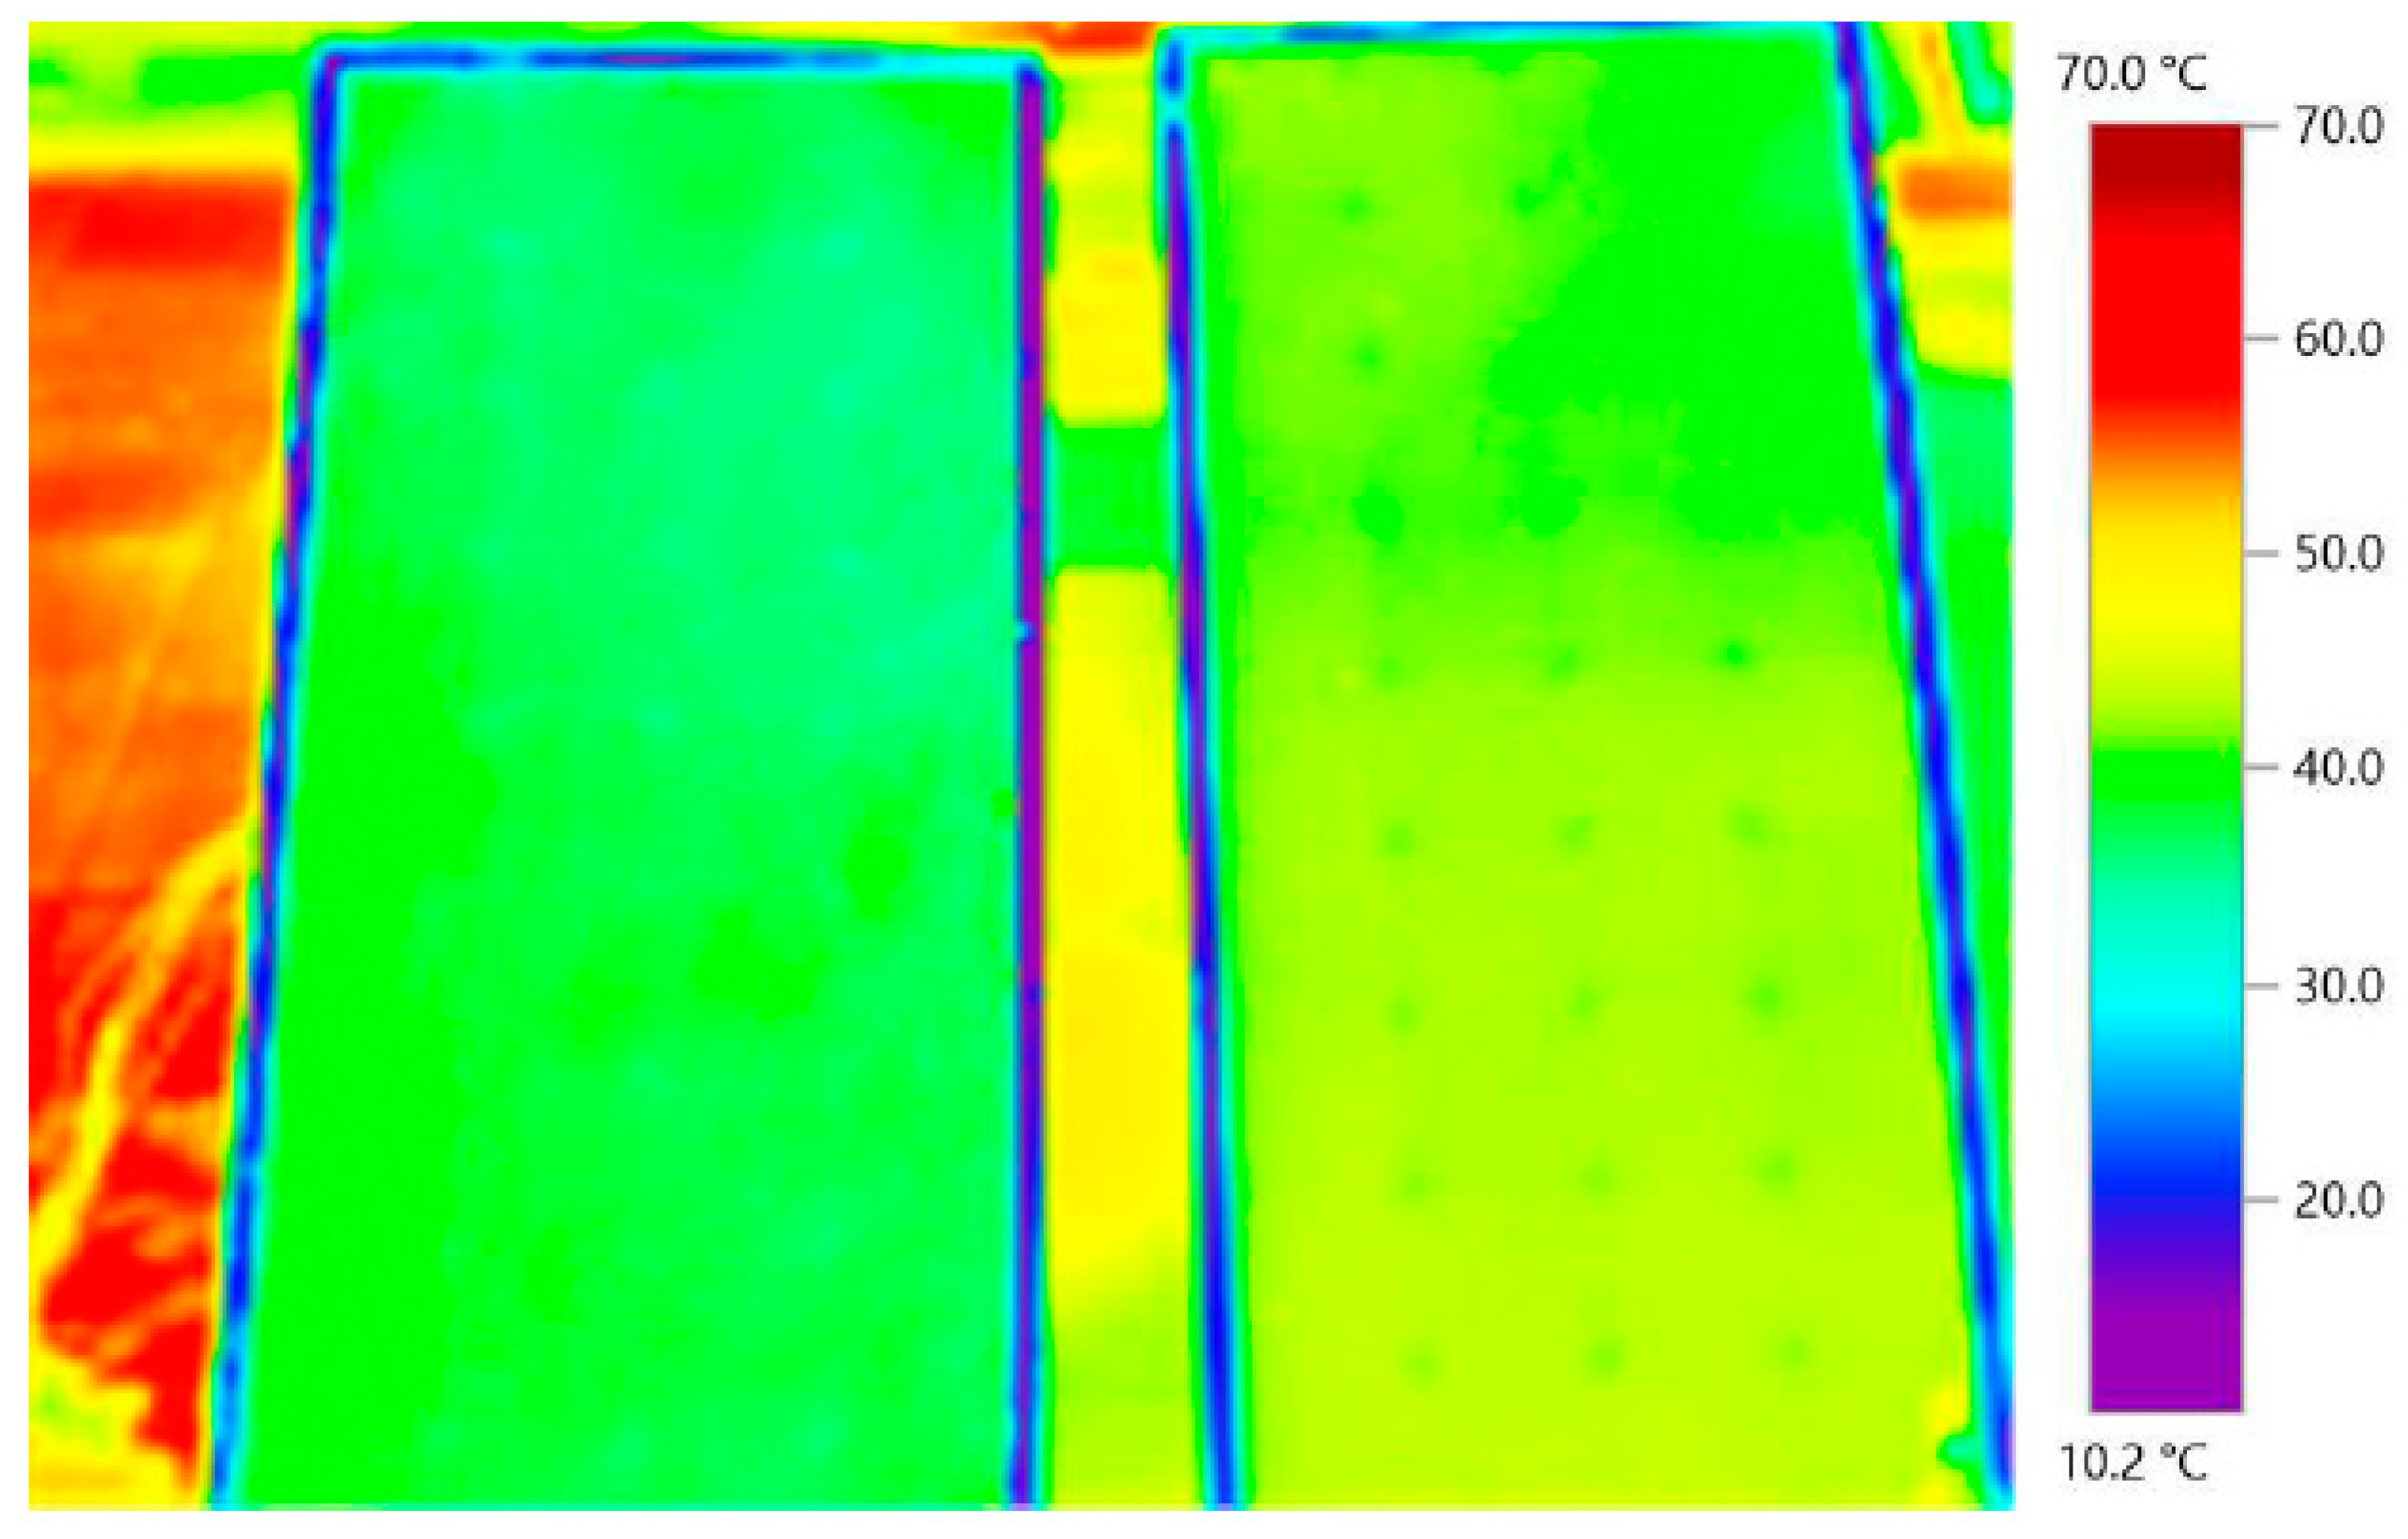
3.2. Effect of Cooling Process on the Temperature of the Panel

The effect of the proposed cooling mechanism on the temperature of the PV model is discussed in this section. The results of the temperature of the modified model, i.e., cooled panel is compared to a reference model without any modification. The temperature results for both panels are presented in Figure 6. The results show that the mechanism proposed in this paper has a positive effect on the thermal management of the cooled panel. As can be seen from the figure, the cooled panel recorded relatively colder temperatures throughout the experimental process. The difference in temperature between the cooled and referenced panel in the early hours of the experiment was relatively insignificant, this is due to the fact that the PCM was still in the solid phase. However, when the temperature of the panel increased with increasing ambient temperature, the temperature of the PCM in the containers also increased which led to their melting. According to the obtained results, the cooled panel recorded its highest temperature of 46.52 °C at 14:30 pm against 62.6 °C for the referenced module during that same period. This is an indication that the combination of the paraffin wax and the aluminum fins worked perfectly even under very high temperature conditions. The average temperature for the cooled panel for the entire period of the experiment is 36.62 °C against 48.75 °C for the referenced PV module. This represents an average reduction of 12.13 °C for the cooled panel. The highest temperature of both cells were recorded after mid-day when the ambient temperature was highest. In other studies, Mays et al. [46] using only aluminum fins obtained a temperature of 49.9 °C for the cooled panel against 56 °C for the referenced module, representing a reduction of 6.1 °C. A study by Mahamudul et al. [47] using RT35 PCM for the temperature management of PV panel obtained a temperature reduction of 10 °C. For Hernandez-Perez et al. [48] they conducted a numerical study on passive cooling mechanism which used discontinuous finned heatsink. Their proposed mechanism resulted in a temperature reduction of 7 °C. In the study of Luo et al. [49], both numerical and experimental studies were conducted on thermal management of a PV module using form-stable paraffin/expanded graphite composite PCM. According to their study, the maximum temperature of the cooled module was 57.0 °C against 61.7 °C for the conventional module. Nada et al. [50] improved the performance of a PV module with the integration of a cooling mechanism using PCM-integrated PV modules using nano particles. They obtained a temperature reduction of 8.1 and 10.6 °C for a PV module integrated with pure PCM and an enhanced PCM using nanoparticles, respectively. Results from the reviewed literature indicate that the proposed cooling mechanism in this paper has been effective as the temperature reduction in the current study is relatively higher than most of the reviewed literature which used similar passive cooling approach.
One positive impact of the PCM and aluminum fins on the temperature distribution of the cooled panel is the stability the cooling mechanism had on the PV module’s temperature. A standard deviation of the temperature readings for the experimental period for the cooled panel is 6.06 °C against 11.27 °C for the referenced module. Similarly, the uncertainty in the results of the cooled panel is 1.46 against 2.73 for the referenced panel. This indicates that the cooling mechanism, i.e., the integration of both PCM and aluminum fins was able to not only improve the rate of heat dissipation from the panel but also helped to bring uniformity in the temperature variation of the PV module.
The testo infrared camera (manufactured by Testo in Germany) was also used to record the temperature profile for the two panels. This helps to pictorially see the effect of the cooling mechanism on the temperature distribution of the panel. The reading was taken at exactly 12.00 pm mid-day at which time the paraffin wax had fully melted, and the solar radiation intensity was high. The minimum temperature for the cooled panel was 34.9 °C and a maximum temperature of 43.9 °C, it however, recorded an average temperature of 37.5 °C. In the case of the referenced panel, a minimum temperature of 38.1 °C and a maximum temperature of 43.9 °C were recorded, it also recorded an average temperature of 42.1 °C. Note that these values are only for the specific time mentioned supra and not for the entire experimental period. These values vary slightly from that recorded using the thermocouples supra because of the fact that the thermocouples have direct contact with the panel and so can give a more accurate result. During that same period, the thermocouples recorded average temperatures of 34.04 °C and 44.9 °C for the cooled and referenced panels, respectively. The histogram for the temperature distribution of the two panels relative to their percentages are presented in Figure 7. The percentage of the various temperatures on the surface of the panel are presented on the y-axis. The thermal image of the two panels is also presented in Figure 8.

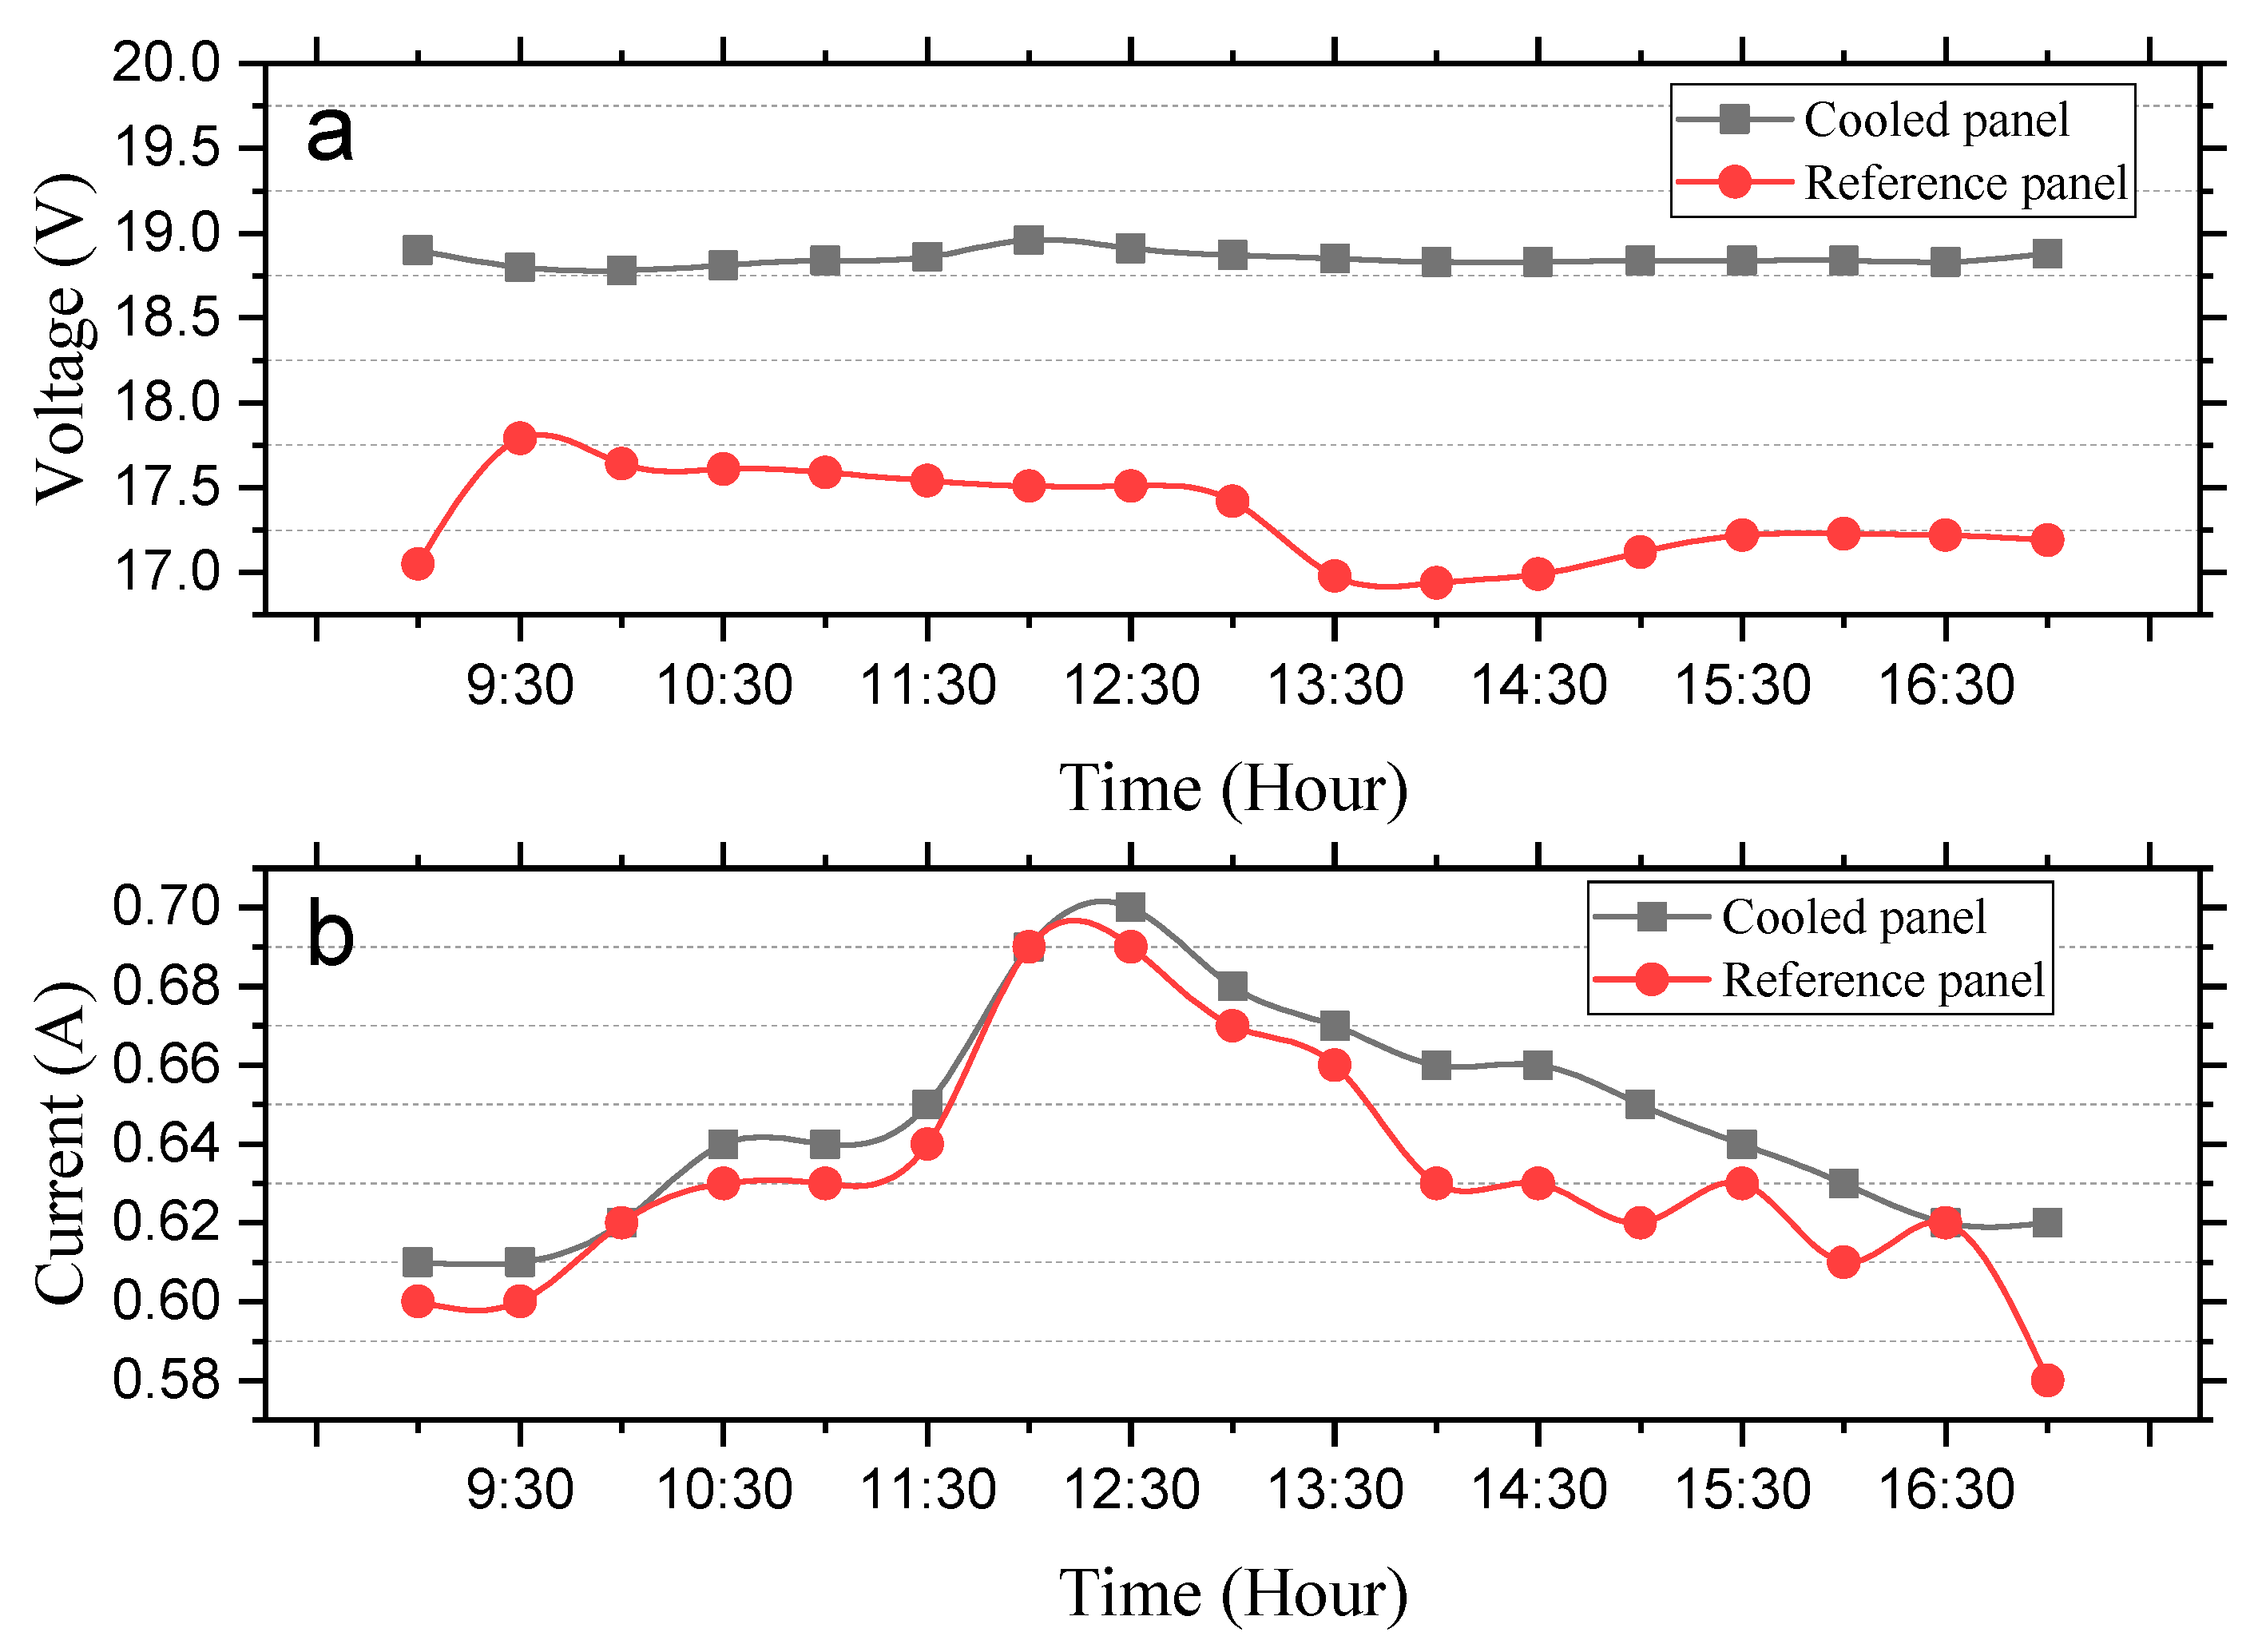
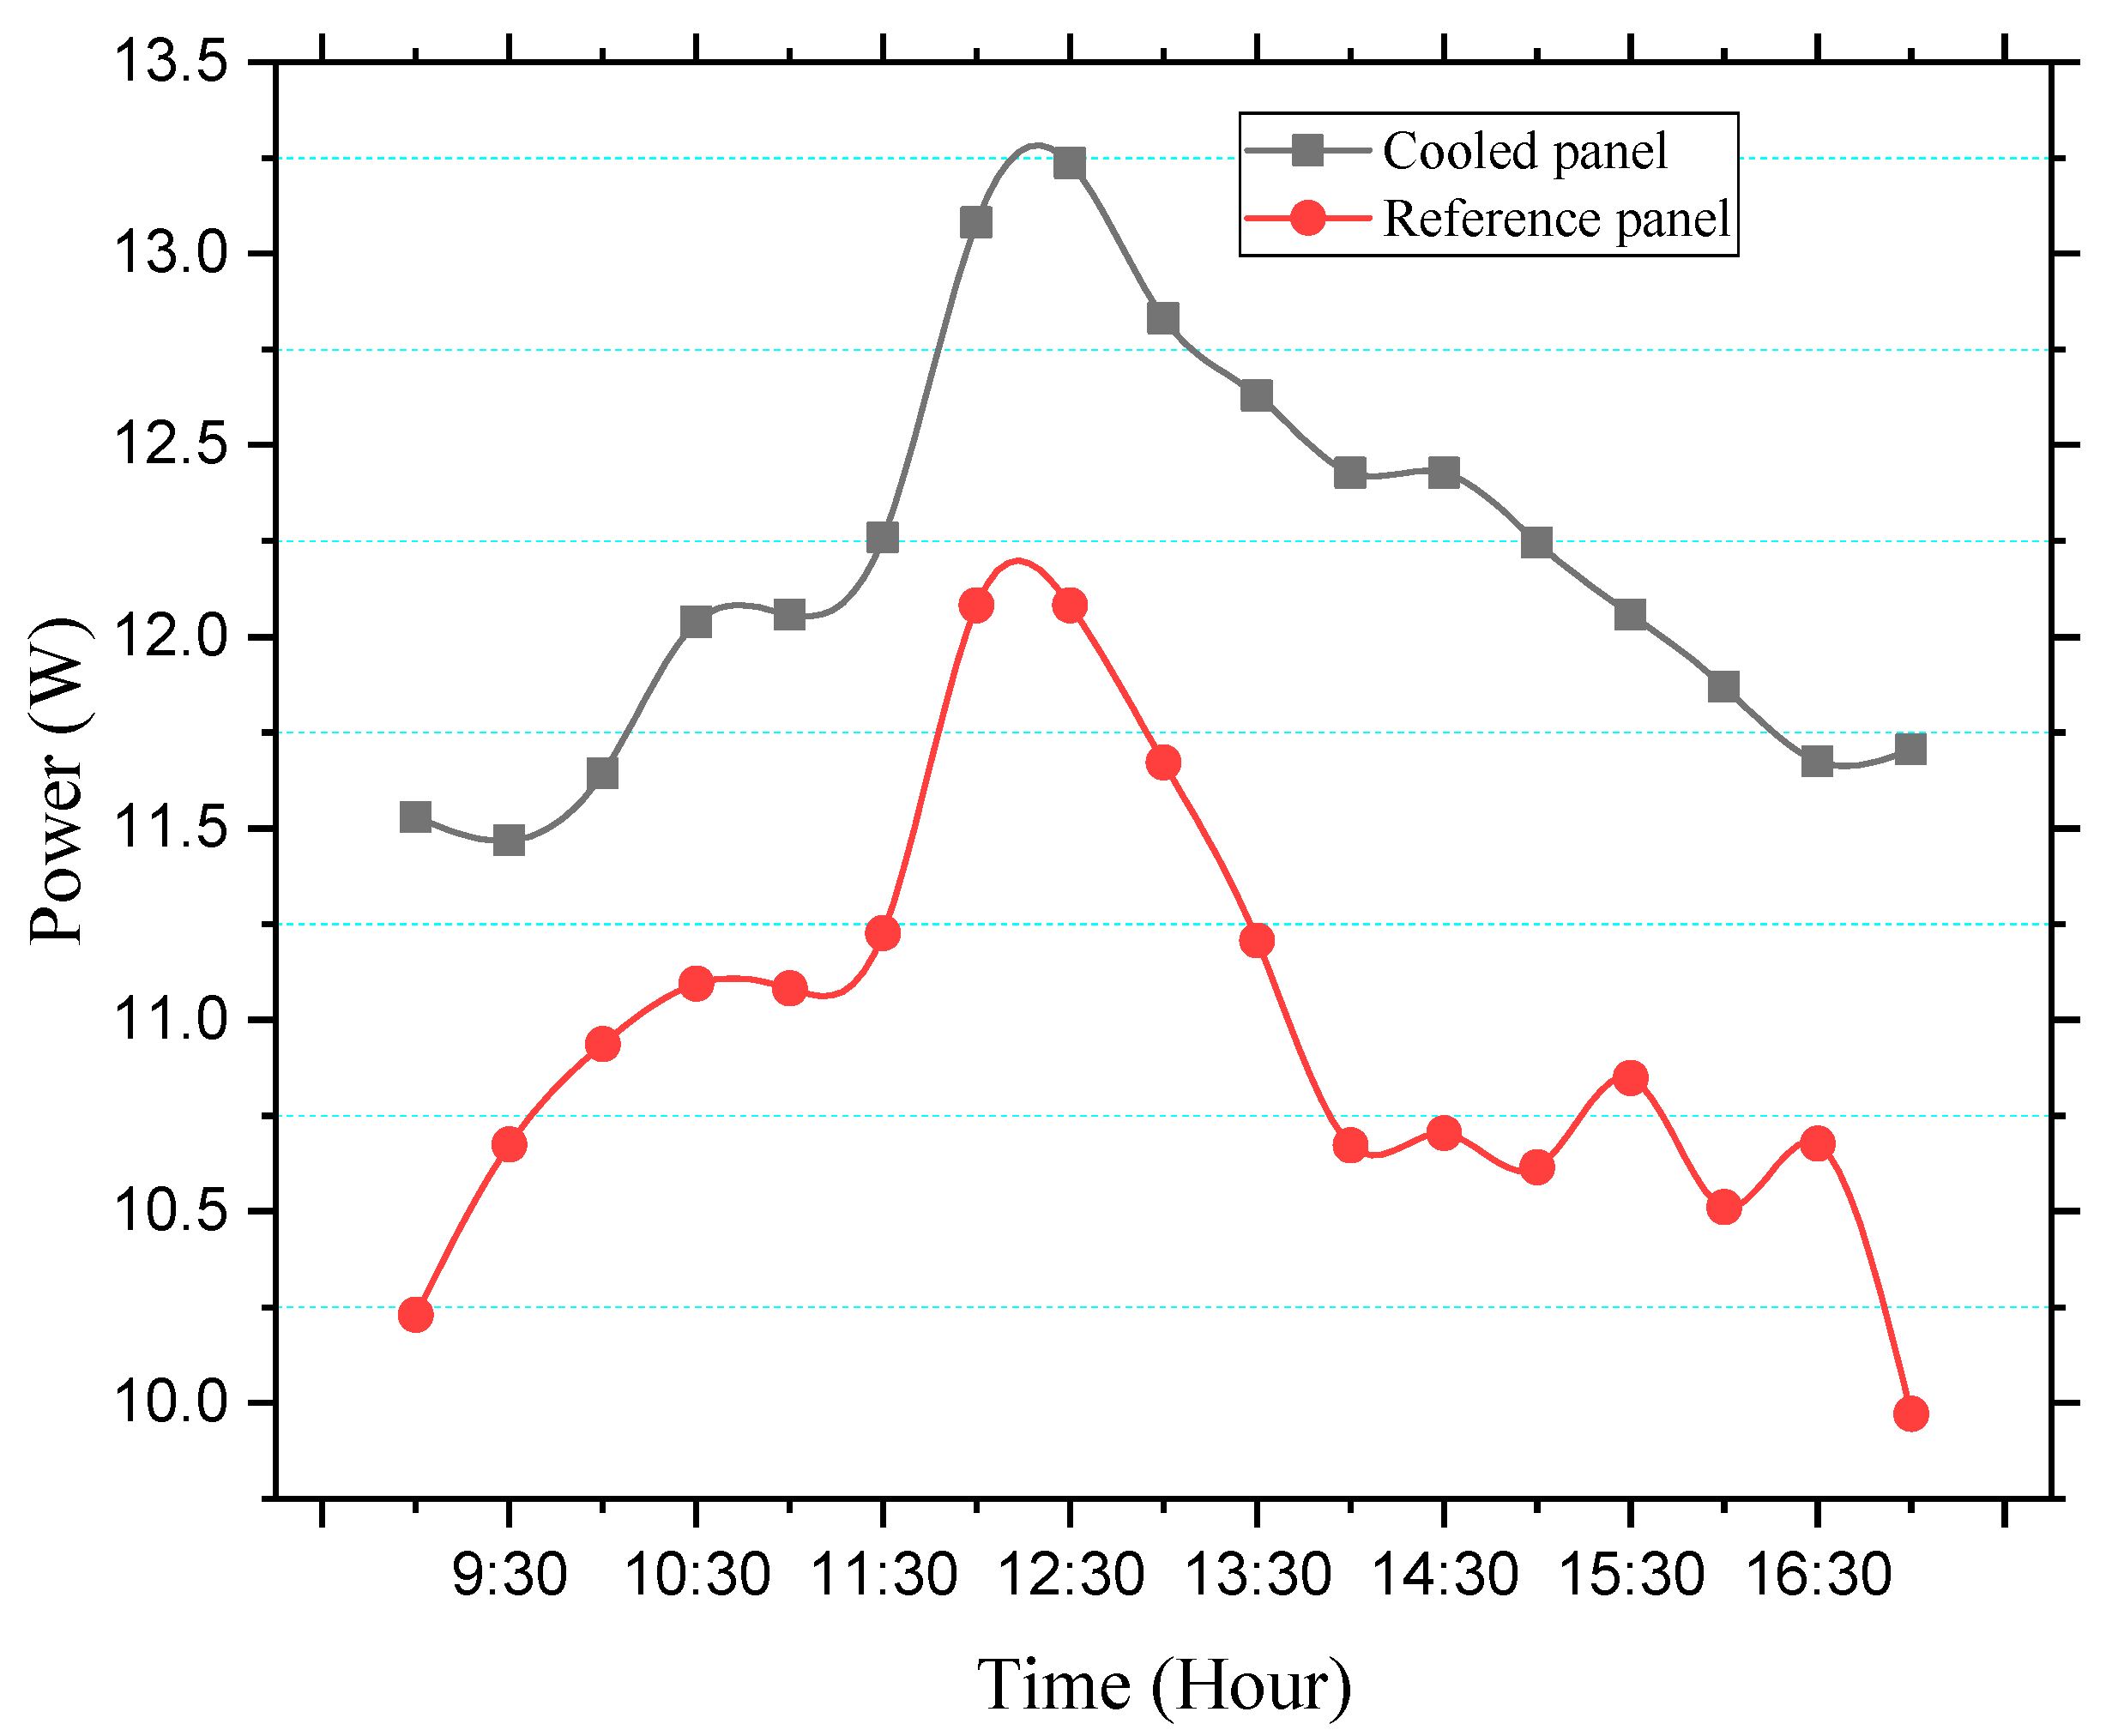
3.3. Electrical Performance of the Module

The effect of the proposed cooling mechanism on the electrical performance of the module is presented in this section. The results for the voltage and current recorded during the experimental period are illustrated in Figure 9. The negative effect of temperature on the voltage of a PV cell is clearly shown in the results. The voltage dropped considerably with increasing PV cell temperature. The average voltage for the cooled panel during the entire experimental period is 18.85 V while the referenced panel recorded 17.33 V. This represents a difference of 1.52 V, which is a significant drop in the voltage of the referenced panel. The proposed cooling mechanism proved its effectiveness during the entire period of the experiment as the voltage of the cooled module remained higher than the referenced PV module.
Similarly, the current of the of the cooled panel was relatively higher than the referenced module but only slightly, this was expected because, temperature affects the short circuit current but only slightly. The cooled module recorded an average current of 0.65 A whiles the reference module recorded 0.63 A. The change is insignificant as the current for both panels remained almost same till after mid-day when the ambient temperature increased sharply which affected the temperature of the PV cell.
The power output for both panels is represented in Figure 10. The output power of the cooled panel was identified to be highest during the entire period of the experiment. The power of both modules increased with increasing solar radiation along the day. Both modules recorded their highest solar radiation after mid-day, precisely at 12:30 pm when the highest solar radiation was recorded. The power however started to decrease after mid-day when the temperature of the cell increased, and the intensity of the solar radiation reduced. The average power for the cooled panel is 12.19 W against 10.95 W for the referenced module. This is 1.24 W difference between both panels, which is 11.33% improvement in the power output due to the temperature reduction of the cooled panel occasioned by the proposed cooling mechanism. In the study of Luo et al. [49] who employed the traditional way of applying paraffin PCM for temperature management of a PV module, they obtained a maximum power of 18.30 W for the PV-PCM panel against 17.85 W for the conventional or referenced module. There is only 0.45 W difference between the two modules.

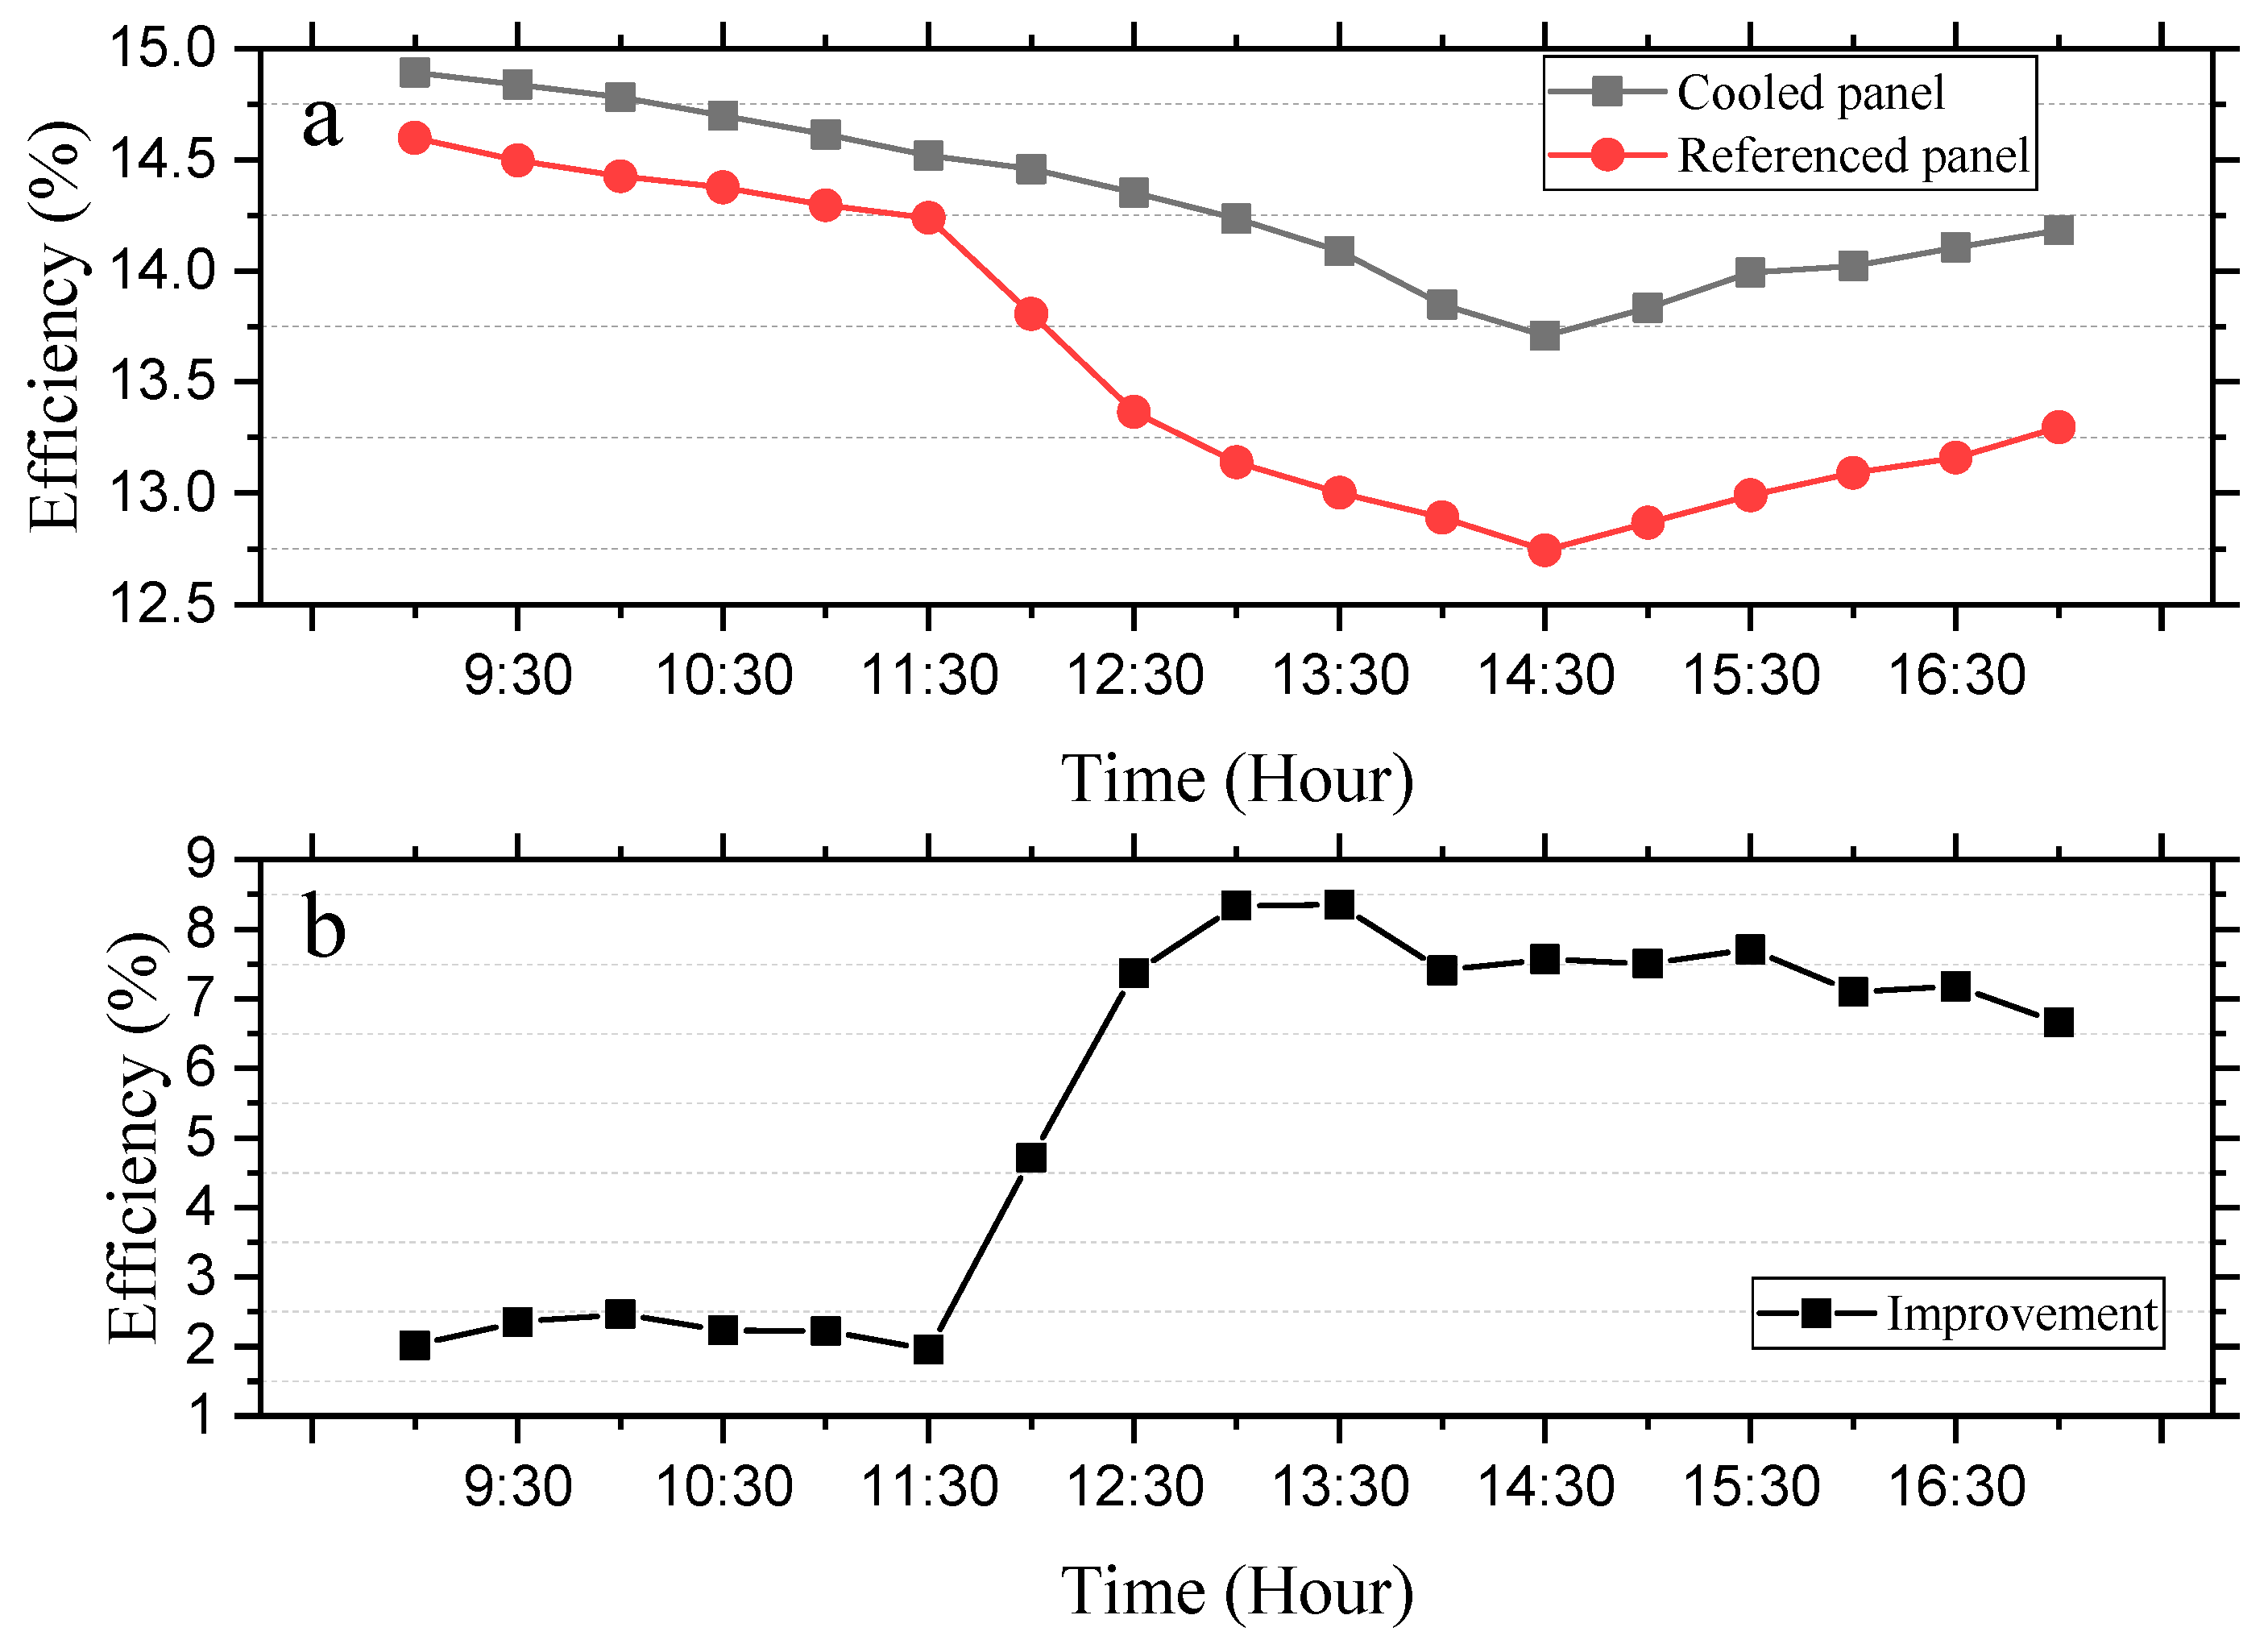
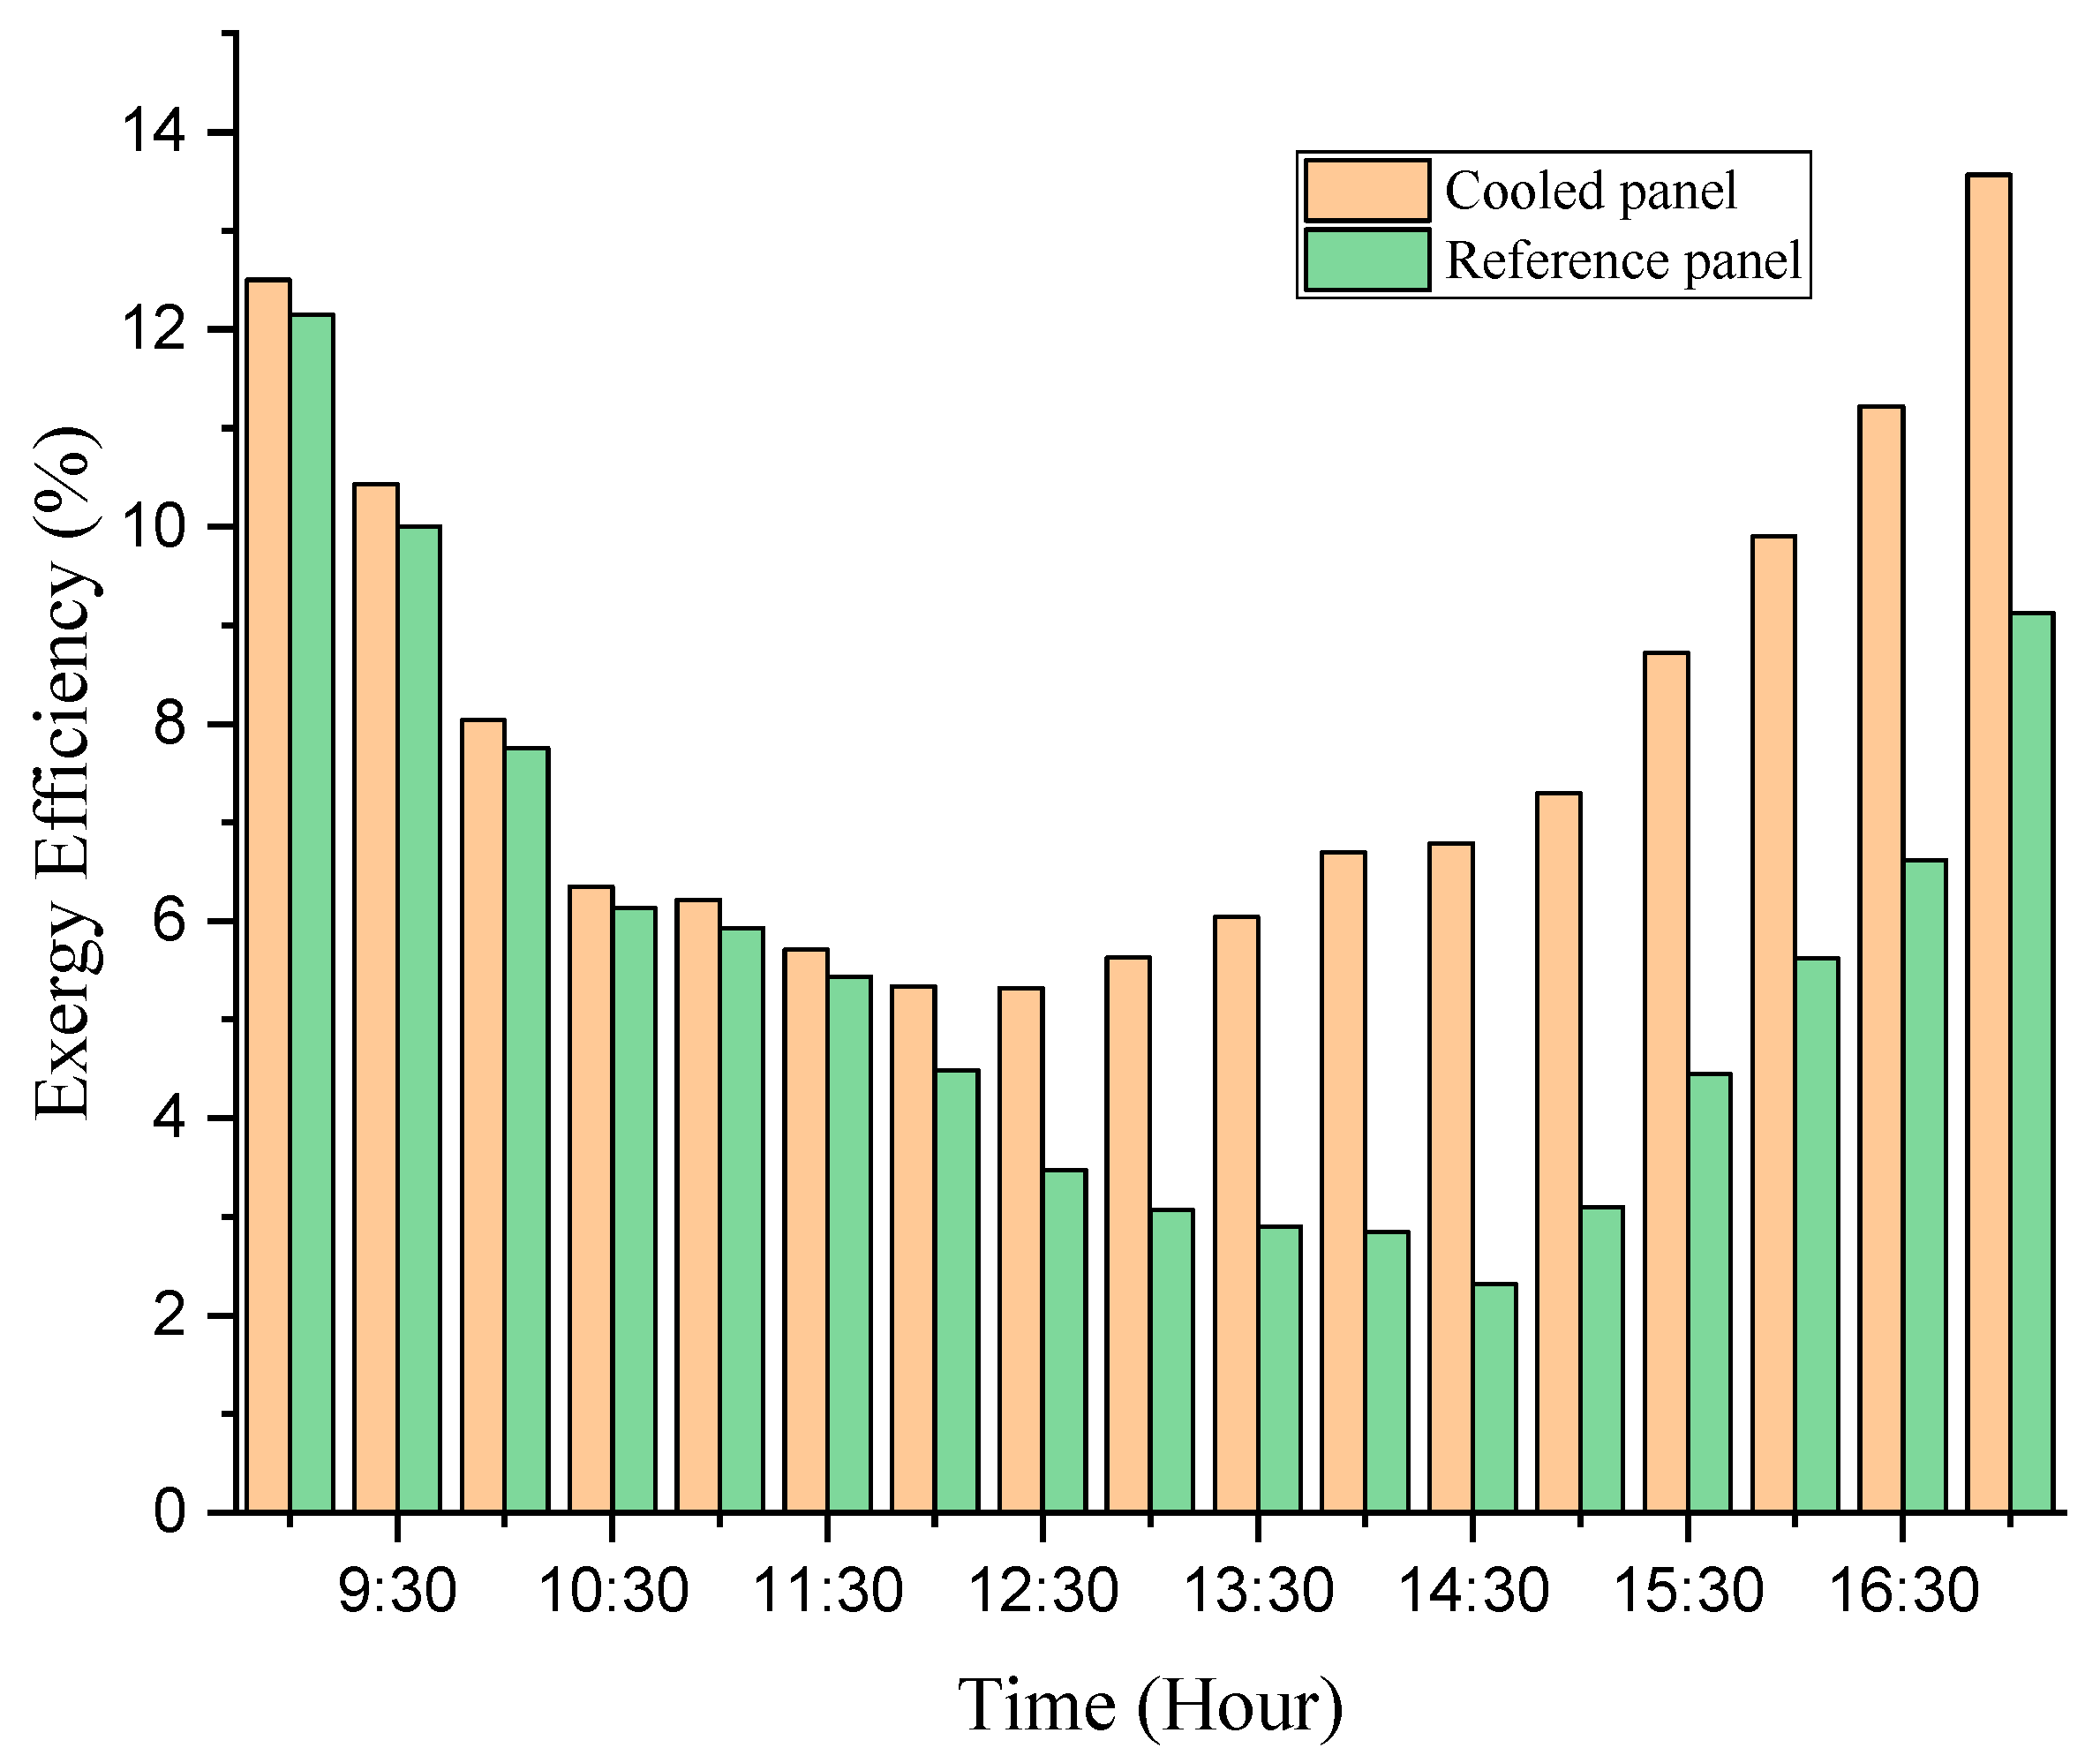
3.4. Electrical and Exergy Efficiency

The conversion efficiency of a PV panel is defined as the ratio of the maximum power that is generated by the photovoltaic module to the received solar radiation on the area of the PV module at a given module surface temperature. The efficiency of the PV modules were calculated using Equation (5) and the results are presented in Figure 11. The efficiency of the referenced module is on the lower side because of the high temperatures it recorded throughout the period of the experiment. The calculated average efficiency for the cooled or modified panel and the referenced modules are 14.30% and 13.60%, respectively. This represents an improvement of 5.15% in the efficiency of the PV module. The highest electrical efficiency improvement of 8.35% occurred at 1:30 pm. This is a significant improvement considering the fact that this proposed mechanism does not utilize any form of active mechanism or water to cool the model. This is also a mechanism that uses a relatively small quantity of PCM i.e., paraffin wax compared to the traditional methods of applying the PCM at the rear side of the panel. Comparing the results obtained by the studies presented in Table 2, it can be found that the proposed mechanism in this study is effective. It produced results that are either better than or competitive to the other mechanisms presented in other published studies.
Exergy assessment is a thermodynamic analysis of processes and systems which combines the first and second thermodynamic laws to find a system’s available energy values and the amount of energy loss [61]. The exergy efficiency for the two PV panels were calculated using data provided by supra and Equation (14). The variations of the exergy efficiency for the two modules are presented in Figure 12. As can be seen from the results, increasing ambient temperature and cell temperature leads to a reduction in the exergy efficiency. The exergy efficiency of the PV modules are however higher when the solar irradiation is lowest. This can be seen from the results presented in Figure 12, the exergy efficiency reduced from the start of the experiment up until mid-day for the cooled panel, it however, started increasing again when the solar radiation started reducing. However, the exergy efficiency of the referenced PV module saw a reduction up until 3:00 pm before it started to increase again. This can be attributed to the fact that the temperature of the referenced module was relatively hotter especially after mid-day when the cell temperature of the module was very high. This is because the rate of increase for input exergy is relatively more than the rate of increase of the output exergy with increasing solar irradiation at constant ambient temperature. The cooled solar PV module recorded an average exergy efficiency of 7.99% against 5.61% for the referenced module.

3.5. Economic Analysis

An analysis of the cost of energy generation for the two panels (i.e., referenced and the cooled modules) were examined using the levelized cost of energy (LCOE) methodology. This method is a widely used approach to assess the economics of renewable power plants. It is a measure of cost that compares varying approaches of electricity generation on comparable basis [62,63]. The LCOE is the evaluation of the average total cost used to construct and operate a power plant over its entire lifetime divided by the whole generated energy output of the entire lifetime of the power plant. It is also defined as the minimum cost at which the generated electricity from the power plant must be sold to be able to get a break-even over the project’s lifetime [64,65]. The LCOE can be mathematically expressed as [66]:
L C O E = L C i n v + L C O & M + L C f u e l E a n n u a l
L C i n v = C R F × C i n v
C R F = i e f f · ( 1 + i e f f ) n ( ( 1 + i e f f ) n ) 1
L C O & M = C O & M × C E L F
C E L F = ( K O & M × 1 K O & M n 1 K O & M ) C R F
K O & M = 1 + r n 1 + i e f f
where the investment cost is denoted by C i n v , n is the plant’s lifetime, the capital recovery factor (%) is represented by C R F , C O & M is the annual cost of operations and maintenance, C E L F is the constant-escalation levelization factor, i e f f is the effective discount rate and r n is the nominal escalation rate (%).
The constituent of the cooling mechanism in this paper includes aluminum fins, containers, and paraffin wax. The cost of a 25 kg paraffin wax is 5000 rubles equivalent to $68.16 using an exchange rate of 1 ruble = $0.0136. However, the total weight of the paraffin wax used for the construction is 2.4 kg, i.e., 0.2 kg for each of the 12 containers. This translates into $6.54 for the cost of the paraffin wax used for the cooling. Similarly, the cost of the aluminum sheet is 640 rubles also equivalent to $8.74, however, only one-third of it was used for the experiment, this also translate into some $2.91. The thermal glue used to help in the conduction of heat from the rear surface of the panel to the aluminum containers and fins costs $4.10. In effect, the total cost of the equipment used for the cooling and a $50 assumed cost for the 30 W PV panel is $63.55.
In terms of the energy generated by the power plant, we took into consideration two scenarios, the first scenario includes a situation whereby the power plant works all year round without any poor weather situations. The second scenario also looks at a situation where there is poor weather conditions such as that of Russia. In the first scenario, all 12 months in a year (i.e., 365 days) were considered and assumed to have same intensity of solar irradiation all year round. For the second scenario we considered only the summer period of 4 months in Russia which is 120 days of effective solar radiation. In all, we assumed that the panel received effective solar radiation for a period of 9 h per day. In effect, the cooled power plant would generate a total of 40.04 kWh and 13.17 kWh of energy for the first and second scenarios, respectively. Similarly, the referenced module would generate 35.97 kWh and 11.83 kWh for the first and second scenarios, respectively. The LCOE of both panels are therefore calculated using the parameters provided in Table 3.
The results from the computations show that in the case of the first scenario (i.e., 365 days) the cooled panel would have an LCOE equivalent to 0.198 $/kWh compared to 0.221 $/kWh for the reference PV module. Moreover, for the second scenario (i.e., 120 days), the cooled PV module recorded an LCOE of 0.603 $/kWh against 0.671 $/kWh for the reference PV module. It is clear from these values that despite the extra cost incurred to cool the panel (i.e., the integration of the aluminum fins and paraffin wax), the cooled panel still performed better in terms of cost under both scenarios. It therefore suggests that the integration of the proposed cooling mechanism to a PV module would not only enhance the electrical and exergy efficiencies but also improve its cost-effectiveness.

4. Conclusions and Future Research Recommendations

This study assessed the effectiveness of a passive cooling mechanism on a PV system’s output performance, this included the electrical and exergy efficiencies, the economics as well as the power output. The study assessed the viability of combining aluminum fins and paraffin wax to cool a PV module. The following are the results attained from the experimental analysis:
  • The cooled panel’s average temperature for the entire experimentation period is 36.62 °C against 48.75 °C for the referenced PV module, this represents an average reduction of 12.13 °C.
  • The average voltage for the cooled panel during the entire experimental period is 18.85 V while the referenced panel recorded 17.33 V. This represents a difference of 1.52 V, which is a significant drop in the voltage of the referenced panel.
  • The cooled module recorded an average current of 0.65 A while the reference module recorded 0.63 A. The change is insignificant as the current for both panels remained almost same till after mid-day when the ambient temperature increased sharply which affected the temperature of the PV cell.
  • The average power for the cooled PV module is 12.19 W against 10.95 W for the referenced module. This is 1.24 W difference between both panels, which is 11.33% improvement in the power output due to the temperature reduction of the cooled panel occasioned by the proposed cooling mechanism.
  • The calculated average efficiency for the cooled or modified panel and the referenced modules are 14.30% and 13.60%, respectively. This represents an enhancement of 5.15% in the efficiency of the PV module.
  • The cooled solar PV module recorded an average exergy efficiency of 7.99% against 5.61% for the referenced module.
  • In terms of the economics, the results from the computations show that in the case of the first scenario (i.e., 365 days) the cooled panel would have an LCOE equivalent to 0.198 $/kWh compared to 0.221 $/kWh for the reference PV module. Furthermore, for the second scenario (i.e., 120 days), the cooled PV module recorded an LCOE of 0.603 $/kWh against 0.671 $/kWh for the reference PV module.
In effect, the proposed mechanism for PV panel cooling has proven to be techno-economically effective. Although the proposed cooling mechanism came with extra cost due to its modification, it still recorded the least LCOE due to its high efficiency. As per the results obtained from this study, it shows that the proposed cooling mechanism can be employed in hot weather conditions to enhance the performance of solar PV panels. Further studies should concentrate on developing an optimal dimension for the aluminum fins used in the study, a study in the future can also assess the effect of rectangular shape containers for the housing of the paraffin wax.

Author Contributions

Conceptualization, E.B.A., S.P., N.T.A.; methodology, E.B.A.; software, E.B.A., T.S.A.; validation, E.B.A., S.P., N.T.A., V.I.V., T.S.A.; formal analysis, E.B.A.; investigation, E.B.A.; resources, E.B.A., S.P., N.T.A.; data curation, E.B.A., S.P.; writing—original draft preparation, E.B.A.; writing—review and editing, E.B.A.; visualization, E.B.A., S.P.; supervision, V.I.V.; project administration, E.B.A.; funding acquisition, E.B.A. All authors have read and agreed to the published version of the manuscript.

Funding

This research received no external funding.

Conflicts of Interest

The authors declare no conflict of interest.

References

  1. Adebayo, T.; Agboola, M.; Rjoub, H.; Adeshola, I.; Agyekum, E.; Kumar, N. Linking Economic Growth, Urbanization, and Environmental Degradation in China: What Is the Role of Hydroelectricity Consumption? Int. J. Environ. Res. Public Health 2021, 18, 6975. [Google Scholar] [CrossRef] [PubMed]
  2. Adebayo, T.; Awosusi, A.; Oladipupo, S.; Agyekum, E.; Jayakumar, A.; Kumar, N. Dominance of Fossil Fuels in Japan’s National Energy Mix and Implications for Environmental Sustainability. Int. J. Environ. Res. Public Health 2021, 18, 7347. [Google Scholar] [CrossRef] [PubMed]
  3. Agyekum, E.; Ali, E.; Kumar, N. Clean Energies for Ghana—An Empirical Study on the Level of Social Acceptance of Renewable Energy Development and Utilization. Sustainability 2021, 13, 3114. [Google Scholar] [CrossRef]
  4. Yaqoob, S.; Obed, A.; Zubo, R.; Al-Yasir, Y.; Fadhel, H.; Mokryani, G.; Abd-Alhameed, R. Flyback Photovoltaic Micro-Inverter with a Low Cost and Simple Digital-Analog Control Scheme. Energies 2021, 14, 4239. [Google Scholar] [CrossRef]
  5. Sudhakar, P.; Santosh, R.; Asthalakshmi, B.; Kumaresan, G.; Velraj, R. Performance augmentation of solar photovoltaic panel through PCM integrated natural water circulation cooling technique. Renew. Energy 2020, 172, 1433–1448. [Google Scholar] [CrossRef]
  6. Agyekum, E.; PraveenKumar, S.; Eliseev, A.; Velkin, V. Design and Construction of a Novel Simple and Low-Cost Test Bench Point-Absorber Wave Energy Converter Emulator System. Inventions 2021, 6, 20. [Google Scholar] [CrossRef]
  7. Alwan, N.T.; Shcheklein, S.; Ali, O.M. Experimental investigation of modified solar still integrated with solar collector. Case Stud. Therm. Eng. 2020, 19, 100614. [Google Scholar] [CrossRef]
  8. Amjad, F.; Shah, L.A. Identification and assessment of sites for solar farms development using GIS and density based clustering technique- A case of Pakistan. Renew. Energy 2020, 155, 761–769. [Google Scholar] [CrossRef]
  9. Yaqoob, S.J.; Saleh, A.L.; Motahhir, S.; Agyekum, E.B.; Nayyar, A.; Qureshi, B. Comparative study with practical validation of photovoltaic monocrystalline module for single and double diode models. Sci. Rep. 2021, 11, 19153. [Google Scholar] [CrossRef]
  10. Deokar, V.H.; Bindu, R.S.; Potdar, S.S. Active cooling system for efficiency improvement of PV panel and utilization of waste-recovered heat for hygienic drying of onion flakes. J. Mater. Sci. Mater. Electron. 2021, 32, 2088–2102. [Google Scholar] [CrossRef]
  11. Solangi, K.H.; Islam, M.R.; Saidur, R.; Rahim, N.A.; Fayaz, H. A review on global solar energy policy. Renew. Sustain. Energy Rev. 2011, 15, 2149–2163. [Google Scholar] [CrossRef]
  12. Mahdi, J.M.; Mohammed, H.I.; Talebizadehsardari, P. A new approach for employing multiple PCMs in the passive thermal management of photovoltaic modules. Sol. Energy 2021, 222, 160–174. [Google Scholar] [CrossRef]
  13. Ahmad, F.F.; Ghenai, C.; Hamid, A.K.; Rejeb, O.; Bettayeb, M. Performance enhancement and infra-red (IR) thermography of solar photovoltaic panel using back cooling from the waste air of building centralized air conditioning system. Case Stud. Therm. Eng. 2021, 24, 100840. [Google Scholar] [CrossRef]
  14. Libra, M.; Petrik, T.; Poulek, V.; Tyukhov, I.I.; Kourim, P. Changes in the Efficiency of Photovoltaic Energy Conversion in Temperature Range With Extreme Limits. IEEE J. Photovolt. 2021, PP, 1–6. [Google Scholar] [CrossRef]
  15. Gordon, J.M.; Moses, G.; Katz, E.A. Boosting silicon photovoltaic efficiency from regasification of liquefied natural gas. Energy 2020, 214, 118907. [Google Scholar] [CrossRef]
  16. Dupeyrat, P.; Ménézo, C.; Wirth, H.; Rommel, M. Improvement of PV module optical properties for PV-thermal hybrid collector application. Sol. Energy Mater. Sol. Cells 2011, 95, 2028–2036. [Google Scholar] [CrossRef]
  17. Ramkumar, R.; Kesavan, M.; Raguraman, C.; Ragupathy, A. Enhancing the performance of photovoltaic module using clay pot evaporative cooling water. In Proceedings of the 2016 International Conference on Energy Efficient Technologies for Sustainability (ICEETS), Nagercoil, India, 7–8 April 2016; pp. 217–222. [Google Scholar] [CrossRef]
  18. Chow, T. A review on photovoltaic/thermal hybrid solar technology. Appl. Energy 2010, 87, 365–379. [Google Scholar] [CrossRef]
  19. Koteswararao, B.; Radha, K.; Vijay, P.; Raja, R.S. Experimental Analysis of solar panel efficiency with different modes of cooling. Int. J. Eng. Technol. 2016, 8, 1451–1456. [Google Scholar]
  20. Nada, S.; El-Nagar, D. Possibility of using PCMs in temperature control and performance enhancements of free stand and building integrated PV modules. Renew. Energy 2018, 127, 630–641. [Google Scholar] [CrossRef]
  21. Duan, J. A novel heat sink for cooling concentrator photovoltaic system using PCM-porous system. Appl. Therm. Eng. 2021, 186, 116522. [Google Scholar] [CrossRef]
  22. Essa, M.A.; Talaat, M.; Amer, A.; Farahat, M. Enhancing the photovoltaic system efficiency using porous metallic media integrated with phase change material. Energy 2021, 225, 120299. [Google Scholar] [CrossRef]
  23. Arefin, A. Analysis of an Integrated Photovoltaic Thermal System by Top Surface Natural Circulation of Water. Front. Energy Res. 2019, 7, 97. [Google Scholar] [CrossRef]
  24. Alizadeh, H.; Ghasempour, R.; Shafii, M.B.; Ahmadi, M.H.; Yan, W.-M.; Nazari, M.A. Numerical simulation of PV cooling by using single turn pulsating heat pipe. Int. J. Heat Mass Transf. 2018, 127, 203–208. [Google Scholar] [CrossRef]
  25. Amr, A.A.-R.; Hassan, A.; Abdel-Salam, M.; El-Sayed, A.M. Enhancement of photovoltaic system performance via passive cooling: Theory versus experiment. Renew. Energy 2019, 140, 88–103. [Google Scholar] [CrossRef]
  26. Shmroukh, A.N. Thermal regulation of photovoltaic panel installed in Upper Egyptian conditions in Qena. Therm. Sci. Eng. Prog. 2019, 14, 100438. [Google Scholar] [CrossRef]
  27. Nižetić, S.; Čabo, F.G.; Marinić-Kragić, I.; Papadopoulos, A. Experimental and numerical investigation of a backside convective cooling mechanism on photovoltaic panels. Energy 2016, 111, 211–225. [Google Scholar] [CrossRef]
  28. Agyekum, E.B.; PraveenKumar, S.; Alwan, N.T.; Velkin, V.I.; Shcheklein, S.E. Effect of dual surface cooling of solar photovoltaic panel on the efficiency of the module: Experimental investigation. Heliyon 2021, 7, e07920. [Google Scholar] [CrossRef]
  29. Bayrak, F.; Oztop, H.F.; Selimefendigil, F. Experimental study for the application of different cooling techniques in photovoltaic (PV) panels. Energy Convers. Manag. 2020, 212, 112789. [Google Scholar] [CrossRef]
  30. Machniewicz, A.; Knera, D.; Heim, D. Effect of Transition Temperature on Efficiency of PV/PCM Panels. Energy Procedia 2015, 78, 1684–1689. [Google Scholar] [CrossRef] [Green Version]
  31. Klugmann-Radziemska, E.; Wcisło-Kucharek, P. Photovoltaic module temperature stabilization with the use of phase change materials. Sol. Energy 2017, 150, 538–545. [Google Scholar] [CrossRef]
  32. Chen, H.; Chen, X.; Li, S.; Ding, H. Comparative study on the performance improvement of photovoltaic panel with passive cooling under natural ventilation. Int. J. Smart Grid Clean Energy 2014, 3, 374–379. [Google Scholar] [CrossRef] [Green Version]
  33. Agyekum, E.B.; PraveenKumar, S.; Alwan, N.T.; Velkin, V.I.; Shcheklein, S.E.; Yaqoob, S.J. Experimental Investigation of the Effect of a Combination of Active and Passive Cooling Mechanism on the Thermal Characteristics and Efficiency of Solar PV Module. Inventions 2021, 6, 63. [Google Scholar] [CrossRef]
  34. Tk, G.; Raj, V. Use of phase change material (PCM) for the improvement of thermal performance of cold storage. MOJ Curr. Res. Rev. 2018, 1, 49–61. [Google Scholar] [CrossRef]
  35. Choubineh, N.; Jannesari, H.; Kasaeian, A. Experimental study of the effect of using phase change materials on the performance of an air-cooled photovoltaic system. Renew. Sustain. Energy Rev. 2018, 101, 103–111. [Google Scholar] [CrossRef]
  36. Huang, M.J. The effect of using two PCMs on the thermal regulation performance of BIPV systems. Sol. Energy Mater. Sol. Cells 2011, 95, 957–963. [Google Scholar] [CrossRef]
  37. Preet, S.; Bhushan, B.; Mahajan, T. Experimental investigation of water based photovoltaic/thermal (PV/T) system with and without phase change material (PCM). Sol. Energy 2017, 155, 1104–1120. [Google Scholar] [CrossRef]
  38. Dubey, S.; Sarvaiya, J.N.; Seshadri, B. Temperature Dependent Photovoltaic (PV) Efficiency and Its Effect on PV Production in the World—A Review. Energy Procedia 2013, 33, 311–321. [Google Scholar] [CrossRef] [Green Version]
  39. Idoko, L.O.; Anaya-Lara, O.; McDonald, A. Enhancing PV modules efficiency and power output using multi-concept cooling technique. Energy Rep. 2018, 4, 357–369. [Google Scholar] [CrossRef]
  40. Agyekum, E.B. Techno-economic comparative analysis of solar photovoltaic power systems with and without storage systems in three different climatic regions, Ghana. Sustain. Energy Technol. Assess. 2020, 43, 100906. [Google Scholar] [CrossRef]
  41. Hachem, F.; Abdulhay, B.; Ramadan, M.; El Hage, H.; El Rab, M.G.; Khaled, M. Improving the performance of photovoltaic cells using pure and combined phase change materials—Experiments and transient energy balance. Renew. Energy 2017, 107, 567–575. [Google Scholar] [CrossRef]
  42. Rezvanpour, M.; Borooghani, D.; Torabi, F.; Pazoki, M. Using CaCl2·6H2O as a phase change material for thermo-regulation and enhancing photovoltaic panels’ conversion efficiency: Experimental study and TRNSYS validation. Renew. Energy 2020, 146, 1907–1921. [Google Scholar] [CrossRef]
  43. Hepbasli, A. A key review on exergetic analysis and assessment of renewable energy resources for a sustainable future. Renew. Sustain. Energy Rev. 2008, 12, 593–661. [Google Scholar] [CrossRef]
  44. Akyuz, E.; Coskun, C.; Oktay, Z.; Dincer, I. A novel approach for estimation of photovoltaic exergy efficiency. Energy 2012, 44, 1059–1066. [Google Scholar] [CrossRef]
  45. Kline, S.J.; McClintock, F.A. Describing Uncertainties in Single-Sample Experiments. Mech. Eng. 1953, 75, 3–8. [Google Scholar]
  46. El Mays, A.; Ammar, R.; Hawa, M.; Akroush, M.A.; Hachem, F.; Khaled, M.; Ramadan, M. Improving Photovoltaic Panel Using Finned Plate of Aluminum. Energy Procedia 2017, 119, 812–817. [Google Scholar] [CrossRef]
  47. Mahamudul, H.; Rahman, M.; Metselaar, H.S.C.; Mekhilef, S.; Shezan, S.A.; Sohel, R.; Bin Abu Karim, S.; Badiuzaman, W.N.I. Temperature Regulation of Photovoltaic Module Using Phase Change Material: A Numerical Analysis and Experimental Investigation. Int. J. Photoenergy 2016, 2016, 5917028. [Google Scholar] [CrossRef]
  48. Hernandez-Perez, J.; Carrillo, J.; Bassam, A.; Flota-Banuelos, M.; Patino-Lopez, L. Thermal performance of a discontinuous finned heatsink profile for PV passive cooling. Appl. Therm. Eng. 2020, 184, 116238. [Google Scholar] [CrossRef]
  49. Luo, Z.; Huang, Z.; Xie, N.; Gao, X.; Xu, T.; Fang, Y.; Zhang, Z. Numerical and experimental study on temperature control of solar panels with form-stable paraffin/expanded graphite composite PCM. Energy Convers. Manag. 2017, 149, 416–423. [Google Scholar] [CrossRef]
  50. Nada, S.; El-Nagar, D.; Hussein, H. Improving the thermal regulation and efficiency enhancement of PCM-Integrated PV modules using nano particles. Energy Convers. Manag. 2018, 166, 735–743. [Google Scholar] [CrossRef]
  51. Stropnik, R.; Stritih, U. Increasing the efficiency of PV panel with the use of PCM. Renew. Energy 2016, 97, 671–679. [Google Scholar] [CrossRef]
  52. Ramkiran, B.; Ck, S.; Sudhakar, K. Sustainable passive cooling strategy for PV module: A comparative analysis. Case Stud. Therm. Eng. 2021, 27, 101317. [Google Scholar] [CrossRef]
  53. Hasan, A.; McCormack, S.J.; Huang, M.J.; Norton, B. Energy and Cost Saving of a Photovoltaic-Phase Change Materials (PV-PCM) System through Temperature Regulation and Performance Enhancement of Photovoltaics. Energies 2014, 7, 1318–1331. [Google Scholar] [CrossRef] [Green Version]
  54. Karthick, A.; Ramanan, P.; Ghosh, A.; Stalin, B.; Kumar, R.V.; Baranilingesan, I. Performance enhancement of copper indium diselenide photovoltaic module using inorganic phase change material. Asia-Pacific J. Chem. Eng. 2020, 15, e2480. [Google Scholar] [CrossRef]
  55. Savvakis, N.; Tsoutsos, T. Theoretical design and experimental evaluation of a PV+PCM system in the mediterranean climate. Energy 2020, 220, 119690. [Google Scholar] [CrossRef]
  56. Kant, K.; Shukla, A.; Sharma, A.; Biwole, P. Heat transfer studies of photovoltaic panel coupled with phase change material. Sol. Energy 2016, 140, 151–161. [Google Scholar] [CrossRef]
  57. Kazemian, A.; Hosseinzadeh, M.; Sardarabadi, M.; Passandideh-Fard, M. Experimental study of using both ethylene glycol and phase change material as coolant in photovoltaic thermal systems (PVT) from energy, exergy and entropy generation viewpoints. Energy 2018, 162, 210–223. [Google Scholar] [CrossRef]
  58. Park, J.; Kim, T.; Leigh, S.-B. Application of a phase-change material to improve the electrical performance of vertical-building-added photovoltaics considering the annual weather conditions. Sol. Energy 2014, 105, 561–574. [Google Scholar] [CrossRef]
  59. Hasan, A.; Sarwar, J.; Alnoman, H.; Abdelbaqi, S. Yearly energy performance of a photovoltaic-phase change material (PV-PCM) system in hot climate. Sol. Energy 2017, 146, 417–429. [Google Scholar] [CrossRef]
  60. Sharma, S.; Micheli, L.; Chang, W.; Tahir, A.; Reddy, K.S.; Mallick, T. Nano-enhanced Phase Change Material for thermal management of BICPV. Appl. Energy 2017, 208, 719–733. [Google Scholar] [CrossRef]
  61. Chahartaghi, M.; Nikzad, A. Exergy, environmental, and performance evaluations of a solar water pump system. Sustain. Energy Technol. Assess. 2021, 43, 100933. [Google Scholar]
  62. Agyekum, E.; Adebayo, T.; Bekun, F.; Kumar, N.; Panjwani, M. Effect of Two Different Heat Transfer Fluids on the Performance of Solar Tower CSP by Comparing Recompression Supercritical CO2 and Rankine Power Cycles, China. Energies 2021, 14, 3426. [Google Scholar] [CrossRef]
  63. Boddapati, V.; Daniel, S.A. Design and Feasibility Analysis of Hybrid Energy-Based Electric Vehicle Charging Station. Distrib. Gener. Altern. Energy J. 2021, 41–72. [Google Scholar] [CrossRef]
  64. Lai, C.S.; McCulloch, M.D. Levelized Cost of Energy for PV and Grid Scale Energy Storage Systems. arXiv 2016, arXiv:1609.06000. [Google Scholar]
  65. Amjad, F.; Agyekum, E.B.; Shah, L.A.; Abbas, A. Site location and allocation decision for onshore wind farms, using spatial multi-criteria analysis and density-based clustering. A techno-economic-environmental assessment, Ghana. Sustain. Energy Technol. Assess. 2021, 47, 101503. [Google Scholar] [CrossRef]
  66. Baloch, A.A.B.; Bahaidarah, H.M.; Gandhidasan, P.; Al-Sulaiman, F.A. Experimental and numerical performance analysis of a converging channel heat exchanger for PV cooling. Energy Convers. Manag. 2015, 103, 14–27. [Google Scholar] [CrossRef]
Figure 1. Experimental setup.
Inventions 06 00069 g001
Figure 2. Rear side of the PV panels: referenced (left) cooled (right).
Inventions 06 00069 g002
Figure 3. Schematic diagram of the experimental set-up.
Inventions 06 00069 g003
Figure 4. Behavior of PCM under varying temperature [37] (Copyright from Elsevier, Licensed number 5147210406326).
Inventions 06 00069 g004
Figure 5. (a) Solar radiation and ambient temperature (b) humidity and wind speed characteristics for the experimental day.
Inventions 06 00069 g005
Figure 6. (a) Temperature (b) change in temperature for the cooled and referenced module.
Inventions 06 00069 g006
Figure 7. Histogram for the temperature distribution of (a) cooled panel (b) referenced panel.
Inventions 06 00069 g007aInventions 06 00069 g007b
Figure 8. Thermal image for the cooled panel (left) referenced panel (right).
Inventions 06 00069 g008
Figure 9. (a) Voltage, (b) current for the cooled and referenced panel.
Inventions 06 00069 g009
Figure 10. Power output for the cooled and referenced modules.
Inventions 06 00069 g010
Figure 11. (a) Efficiency (b) improvement of the two modules with time.
Inventions 06 00069 g011
Figure 12. Exergy efficiency of both modules with time.
Inventions 06 00069 g012
Table 1. Accuracies and uncertainties of various instruments.
InstrumentRangeAccuracyUncertainty, %
GM 1362-EN-01 thermometer, °C−30–70±2%1.15
Clamp meter, V ±1.50.87
Pyranometer, W/m20–2000±5%2.89
Anemometer, m/s0–250.20.12
Thermocouple, °C−200–1370±0.10.06
Table 2. Comparison with other studies.
ReferenceCooling MechanismTPV without Cooling, °CTPV with Cooling, °CTemperature Reduction, °CEfficiency Improvement, %
[51]PCM RT28HC75.257.7181.1–2.8
[52]PCM53.749.24.21.49
[53]PCM RT-225335182.3–4.5
[54]Inorganic PCM6354910.0
[55]PCM RT2732.622.410.25.90
[56]RT35, 35 °C/240 kJ/kg6054.95.15.00
[57]Organic PCM (melting temperature: 46–48 °C)54.8847.587.304.22%
[52]PCM53.749.24.21.49%
[58]Organic PCM (melting temperature 25 °C363153.10
[59]RT425342.510.55.9%
[60]RT42, 38–43 °C/174 kJ/kg, (0.5 wt% CuO added)7262105.35%
[41]Organic PCM (melting temperature: 36–60 °C)56.150.55.6-
[53]Paraffin wax584711-
[31]PV with Praffin71647-
Current studyPCM (paraffin wax) and aluminum fins48.7536.6212.135.15
Table 3. Parameters used for the LCOE calculation.
ParameterCooled PVReferenced PV
Investment cost ( C i n v ), $62.8860.00
Annual operation and maintenance cost ( C O & M ), $3.503.50
Effective discount rate ( i e f f ), %5.005.00
Lifetime of the plant (n), years30.0030.00
Nominal escalation rate ( r n ), %1.001.00
Capital recover factor (CRF), (%)6.506.50
K O & M 0.960.96
Levelized cost of fuel ( L C f u e l ), $/kWh00
Constant-escalation levelization factor O&M, (CELF)1.101.10
Publisher’s Note: MDPI stays neutral with regard to jurisdictional claims in published maps and institutional affiliations.

