1. Introduction
Soil is one of the natural resources which needs to be protected with the utmost attention and care. Although only a meter in depth over the earth’s surface, soil is a key to sustaining life, affecting air and water quality, the growth of plants and crops and the health of the entire planet [
1]. Soil pollution refers to the presence in the soil of a chemical or substance out of place and/or present at a higher than normal concentration that has adverse effects on any non-targeted organism. Soil pollution often cannot be directly assessed or visually perceived. Based on scientific evidence, soil pollution can severely degrade the major ecosystem services provided by soil. Soil pollution reduces food security by both reducing crop yields due to toxic levels of contaminants and by causing crops produced from polluted soils to be unsafe for consumption by animals and humans.
Thus, soil contaminated with petroleum hydrocarbons is a seriously urgent worldwide environmental problem. Soil contamination is commonly caused by the leakage of underground storage tanks and pipes or accidental spills during transportation and disposal. In different countries the sources and polluting activities will vary; in this study leakages from tanks and pipes due to years of corrosion and limited upgrades is the main reason for the soil contaminations being assessed in this research. These contaminated sites pose a threat to human life by causing severe health problems and major environmental and economic effects that must be dealt with to ensure that human health and the environment remain protected.
Petroleum hydrocarbons are complex substances formed from hydrogen and carbon molecules with the presence of other impurities such as oxygen, sulfur, and nitrogen. They consist of alkanes, cycloalkanes, aromatics, polyaromatic hydrocarbons (PAHs) and other compounds [
2]. All these hydrocarbon groups are toxic for the environment, but especially the polyaromatic hydrocarbons and its degradation products known for their carcinogenic properties [
3]. It should be noted that the composition of petroleum hydrocarbons varies slightly by their source, but the toxic properties are consistent. The behavior of a crude oil released into the environment is shaped not only by its chemical composition but also by its physical properties. Its toxicity in the environment depends on the solubility and the bioavailability of the hydrocarbons.
Degradation is a mechanical, chemical, biological or microbiological method to gradually breakdown the components of a material. This conversion can be as a result from natural elements, heat treatment or chemical leaching methods. Alternatively, biodegradation is the process in which organic compounds are degraded or broken down by microorganisms. Biodegradation can either be aerobic or anaerobic and is responsible for converting complex organic substances into carbon dioxide and water. Biodegradation means that a material goes through a chemical reaction in which it uses oxygen and hydrogen from the material itself or from its environment and then dissolves into water and gases such as carbon dioxide and methane or also new biomass.
While biodegradation has been considered an effective and safe mechanism for treating soils contaminated with petroleum hydrocarbons, its environmental factors can be manipulated to increase its efficiency. However, to successfully manage oil spills in a timely manner with reduced environmental and health impact, its biodegradation capabilities can be improved by focusing on the chemical and physical composition of the petroleum hydrocarbon existing in the spill.
The success of oil spill biodegradation depends on one’s ability to establish and maintain conditions that favor enhanced oil biodegradation rates in the contaminated environment. The inherent biodegradability of these petroleum components reflects their chemical structure but is also influenced by the physical state and toxicity of the compounds [
4] Therefore, before considering the degradation of the oil it is first important to focus on the composition of it because various components of crude oil have different sizes, weights and boiling temperatures; therefore, the first step is to separate these components. A method for characterization of oils is fractional distillation, whereby an oil sample is separated into smaller quantities or fractions, with each fraction having a different composition.
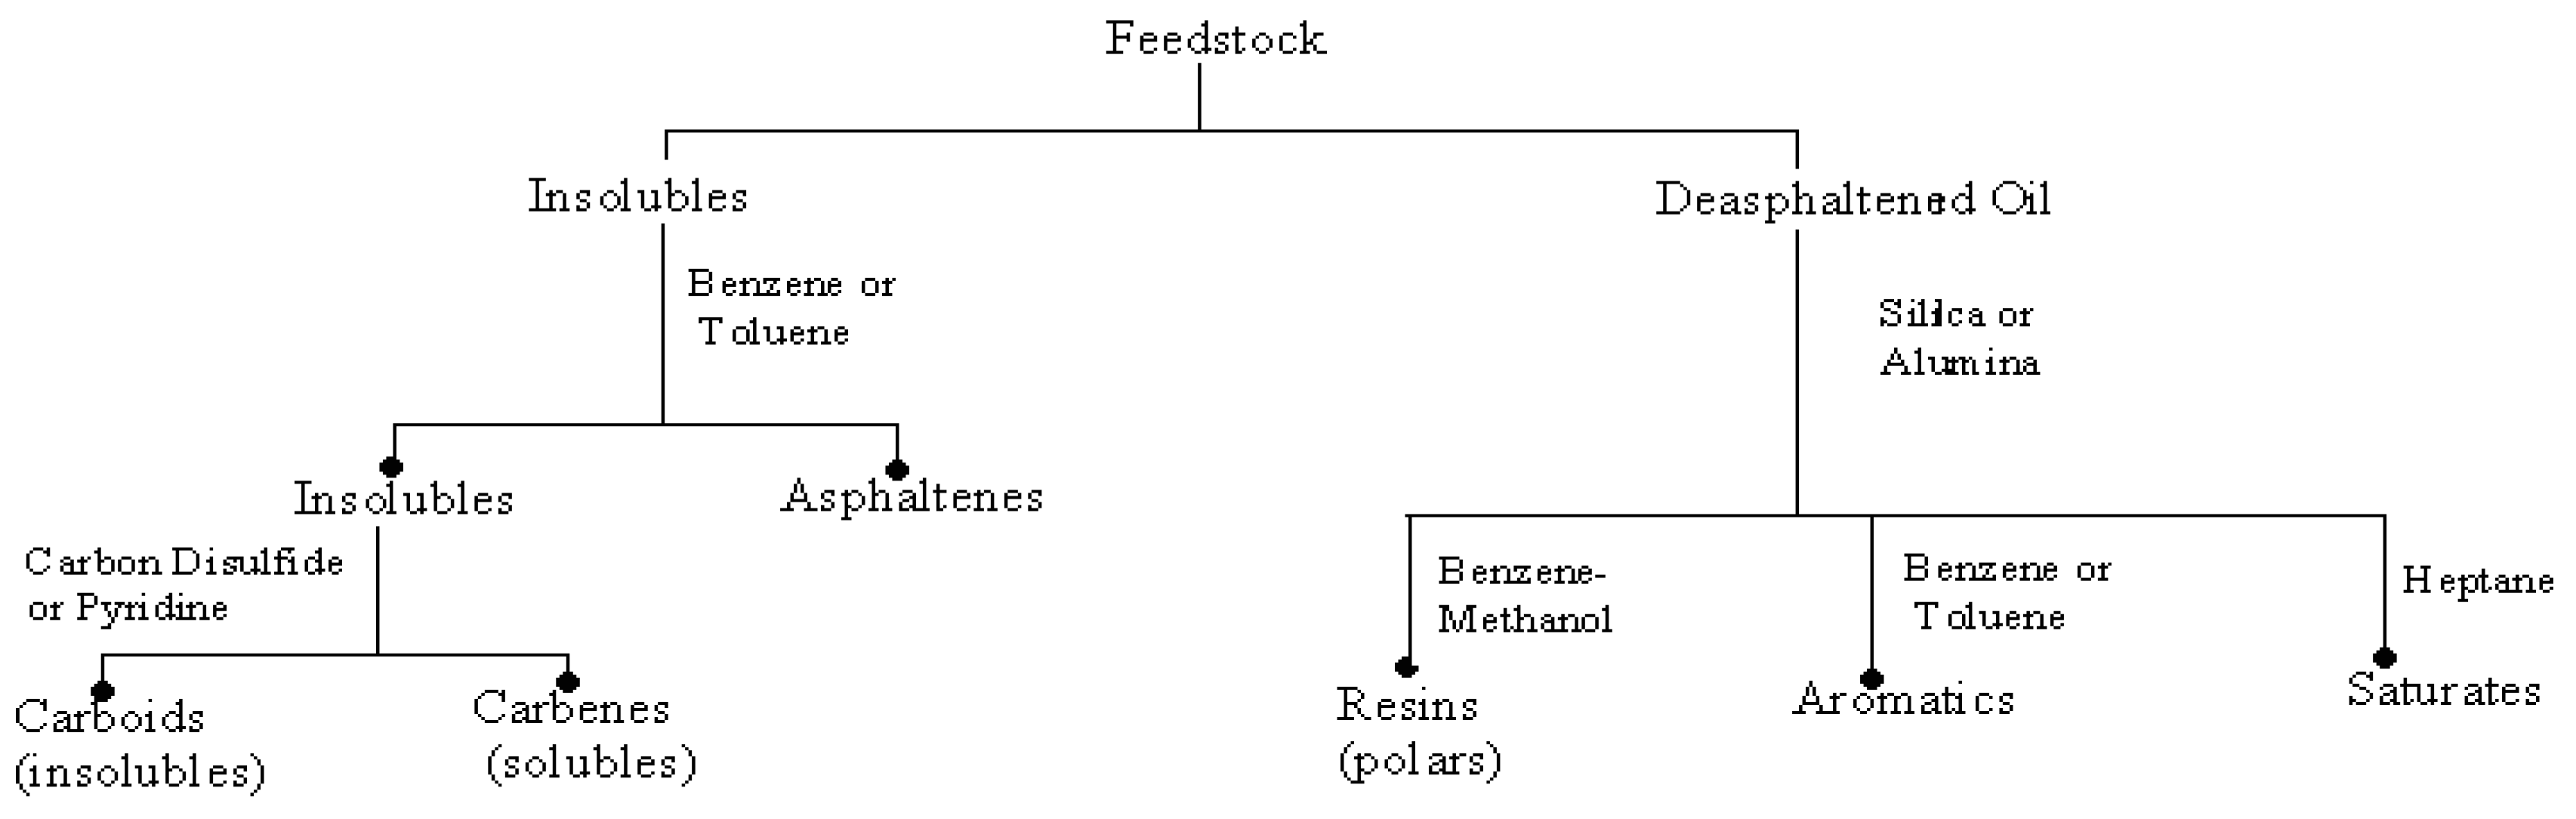
Fractional distillation is the use of distillation to separate a liquid mixture into different parts (fractions) that have different boiling and condensation points. Each fraction is a mixture of liquids (in these case hydrocarbons) with a relatively restricted boiling point range in which molecules have a similar number of carbon atoms and similar physical properties. Hydrocarbon components have been known to belong to the family of carcinogens and neurotoxic organic pollutants. It can be divided into four classes: the saturates, the aromatics, the asphaltenes (phenols, fatty acids, ketones, esters, and porphyrins), and the resins (pyridines, quinolines, carbazoles, sulfoxides, and amides) (
Figure 1) [
5,
6,
7].
Biodegradation of petroleum hydrocarbons is a complex process that depends on the nature and the number of hydrocarbons present. It is a natural process by which organic material in the environment is converted to simpler compounds by microorganisms. There are four biodegradation environments: soil, aquatic, landfill and compost [
8]. Each environment contains different microorganisms and has different conditions for degradation. Biodegradation of petroleum hydrocarbons is a complex process that depends on the nature and on the amount of hydrocarbons present. Its success depends on one’s ability to establish and maintain conditions that favor biodegradation in the contaminated environment.
Biodegradation of soil contaminated with petroleum hydrocarbons provides a flexible, cost-effective, environmentally sustainable treatment strategy that can be tailored to site specific conditions and requirements. The biodegradability of any petroleum constituent is a measure of the ability of that constituent to be metabolized by bacteria. The biodegradability of petroleum and petroleum products is inherently influenced by the composition of the substrate upon which the bacteria are acting [
2]. There are several factors that influence the biodegradation of petroleum hydrocarbons and these factors need to be considered when determining the biodegradability of petroleum and its products. For example, the inherent biodegradability of the constituents of petroleum and its products and the rate for petroleum and its products to degrade depends on the composition of the material. The effect of biodegradation is a change in petroleum composition and is a very effective approach to remove numerous pollutants from many contaminated sites. Some parts are readily degraded by bacteria, and other compounds are degraded very slowly due to them having different susceptibilities to biodegradation. The degradation mechanisms have shown enormous influence not only on degradation but also on physical and chemical properties of hydrocarbons, resulting in changes in partition of the various compartments in the environment. The biodegradation of petroleum typically raises the viscosity and decreases the American Petroleum Institute gravity, which is a measure of how heavy or light a petroleum liquid is compared to water. The higher the American Petroleum Institute (API) gravity, the lighter the compound. Oils with API greater than 30 are termed light, while those between 22 and 30 are considered medium, those below 22 are heavy and those below 10 are extra heavy.
Biodegradation also increases the asphaltene content (relative to the saturated and aromatic hydrocarbon content), the concentration of certain metals, the sulfur content, oil acidity and adds compounds such as carboxylic acids and phenols. Fundamentally, the degradation mechanism works by introducing a more polar reactive group into the molecule. This more reactive group is used for further degradation of the carbon chain. At the end of the pathway the petroleum is totally degraded to CO2 [
9].
Petroleum hydrocarbon biodegradability in soil is influenced by influenced by several factors that include soil characterization, environment, petroleum contaminants, bioavailability and microbial population. Notably, the status of electron acceptor, moisture content, nutrient availability, pH and temperature are amongst the important environmental conditions that need to be suitable for a successful in situ bioremediation to be achieved [
10]. The environmental conditions that are of paramount importance for effective biodegradation are temperature, pH, salinity, nutrients, moisture and redox conditions. The composition and inherent biodegradability of the petroleum hydrocarbon pollutant is the first and most important consideration when a suitable clean up approach is to be evaluated. However, temperature also plays a very important role in biodegradation of petroleum hydrocarbons, firstly by its direct effect on the chemistry of the pollutant, and secondly on its effect on its physiology and diversity of the microbial milieu [
11].
The products of biodegradation may potentially be even more persistent or toxic than the original contaminant. Therefore, the application of bioremediation technologies is customized to be specific site characteristics because microbes can degrade oil much more quickly when environmental conditions are optimal and influential factors like the physical chemical nature of the oil are taken into consideration. Bioremediation is a biological mechanism of recycling wastes into another form that can used and reused by other organisms. It makes use of the activity of naturally occurring microorganisms to eliminate or reduce the concentrations of hazardous wastes at a contaminated site—specifically their ability to biodegrade contaminants. Bioremediation technology involves the use of living organisms like microbes and plants to reduce/degrade, eliminate and transform contaminants present in soils, sediments and water [
12]. The different types of treatment technologies or techniques under bioremediation processes are bio-stimulation, attenuation, augmentation, venting and piles.
2. Materials and Methods
The objective of this study was to monitor the petroleum composition change through natural biodegradation under naturally occurring environmental conditions, while confirming that microorganisms were present at the start and completion of the experiment. Both oil and soil samples were indigenous to Trinidad, giving a proper representation of any oil spill occurrence in this region. The soil samples were collected from flat lands in Central Trinidad that had not been subjected to any chemical or biological alteration for the past twenty-five years while the oil obtained was locally refined.
Since there are a range of international standards, and test methods, developed specifically for petroleum, some were adapted to suit the experimental requirements as shown in
Table 1. These tests were designed to measure properties of petroleum to describe its quality based on certain specifications to allow petroleum refineries, automotive and aviation companies, and other geological and chemical processing plants to appropriately examine and process the product to ensure their quality towards safe and efficient use. Therefore, the analytical methods used must be selected to accurately reflect types and concentrations of substances present or suspected to be present.
The direct measurement of API gravity (Hydrometer method) was completed for the oil samples. A total of 250 mL of the oil sample was placed in a 250 mL measuring cylinder and a Precision Hydrometer was used to measure the API gravity of the sample. The analysis of crude oil in laboratories has long relied on viscosity measurement as a key parameter in determining the condition of oil. An oil sample was placed in a viscometer tube (350, 183 K) and the oil bath of the Cannon CT 500SeriesII was set at 100 °C. When the oil bath temperature equilibrated at 100 °C, the efflux time was measured. The method was repeated for a temperature of 40 °C.
Thermal analysis describes an array of techniques that are essential to the petrochemical industry to characterize the range of different materials produced, from crude oil to gasoline, diesel, liquid petroleum gas and lubricants. The thermal degradation profile for any type of oil-based sample can be identified by thermogravimetric analysis (TGA). Thermogravimetric Analysis (TGA) is a technique in which the mass of a substance is monitored as a function of temperature or time as the sample specimen is subjected to a controlled temperature program in a controlled atmosphere.
The composition of the oil sample was analyzed by nuclear magnetic resonance spectrometry (NMR), UV/visible spectrometry and infrared spectrometry. This was to determine the types of compounds present in the oil before and after biodegradation took place. The Spectrum RX1 from Perkin Elmer was the FTIR spectrometer used in all the infrared analysis. The Spectrum RX1 sample compartment was purged with nitrogen gas to remove water vapor and atmospheric carbon dioxide and before the sample was introduced into the spectrophotometer, a background scan was completed. The sample was scanned, and the resulting spectrum was plotted. UV–vis spectroscopy is an important tool that can be used to characterize crude oil solutions and their asphaltenes fractions. The Lambda EZ210 Spectrophotometer was used to perform the qualitative and quantitative spectral analyses in the ultraviolet and visible regions electronically. The sample is placed in the UV/VIS beam and a graph of the transmittance or absorbance versus the wavelength is obtained. Samples were run in triplicates and the resulting absorbance was recorded. The intensity of light passing through a sample is measured and compared to the intensity of light before it passes through the sample. Ultraviolet–visible spectroscopy gives an indication as to the number of rings present in any polynuclear aromatic system present in the oil sample. Furthermore, it can be used to indicate the presence of chromophores (color producing group) and distinguish between conjugated and non-conjugated carbonyl compounds.
The presence and quantity of microbes were tested by using an adaptation of Pour Plate Method (9215B) from Standard Methods for the Examination of Water and Wastewater 21st Edition. This procedure is used to estimate the number of live heterotrophic bacteria that are present in a sample. A sample is put on a plate that contains nutrients that the bacteria need to survive and grow. The nutrient media for this test is called Agar, which is a gelatin-like substance that is best suited to the needs of soil bacteria. The pour plate method was used with an incubation temperature of 35 °C for 48 h. This was to ensure that there was the occurrence of biodegradation of the oil in the soil samples.
3. Results and Discussion
The temperature of the environment for the trial period was between 29°–32 °C and the Pour Plate Method (9215B) was used to confirm that microorganisms were present in the soil and were available for biodegradation of the oil in the soil sample. While UV/Vis analysis of the soil samples verified the presence of nutrients, ensuring that natural biodegradation would have taken place. The World Petroleum Conference classifies heavy oil as having API gravity below 22.3 °API, which indicates that the oil sample being used in this biodegradation is heavy oil. The crude oil sample used for this work has the following properties: API Gravity of the oil sample = 11.4 °API, and a viscosity index of 339, which was determined using the certificate of calibration constant at 40 °C and 100 °C.
While the viscosity test of the oil sample provided an indication as to the correct grade of oil in use. Kinematic viscosity is measured in centistokes (cSt) and is a measure of a fluid’s resistance to flow or, more simply, its thickness. The Viscosity Index describes the rate of viscosity change as a function of temperature and is defined by American Society for Testing and Materials method D 2270. The viscosity of the oil sample was 21.49 mm2/s at 40 °C and 7.65 mm2/s at 100 °C, which when converted is less than 100 centipoise (cp). The reason for the decrease in viscosity was because viscosity decreases with increasing temperature.
3.1. Thermal Analysis of the Oil Sample
The thermal results as shown in
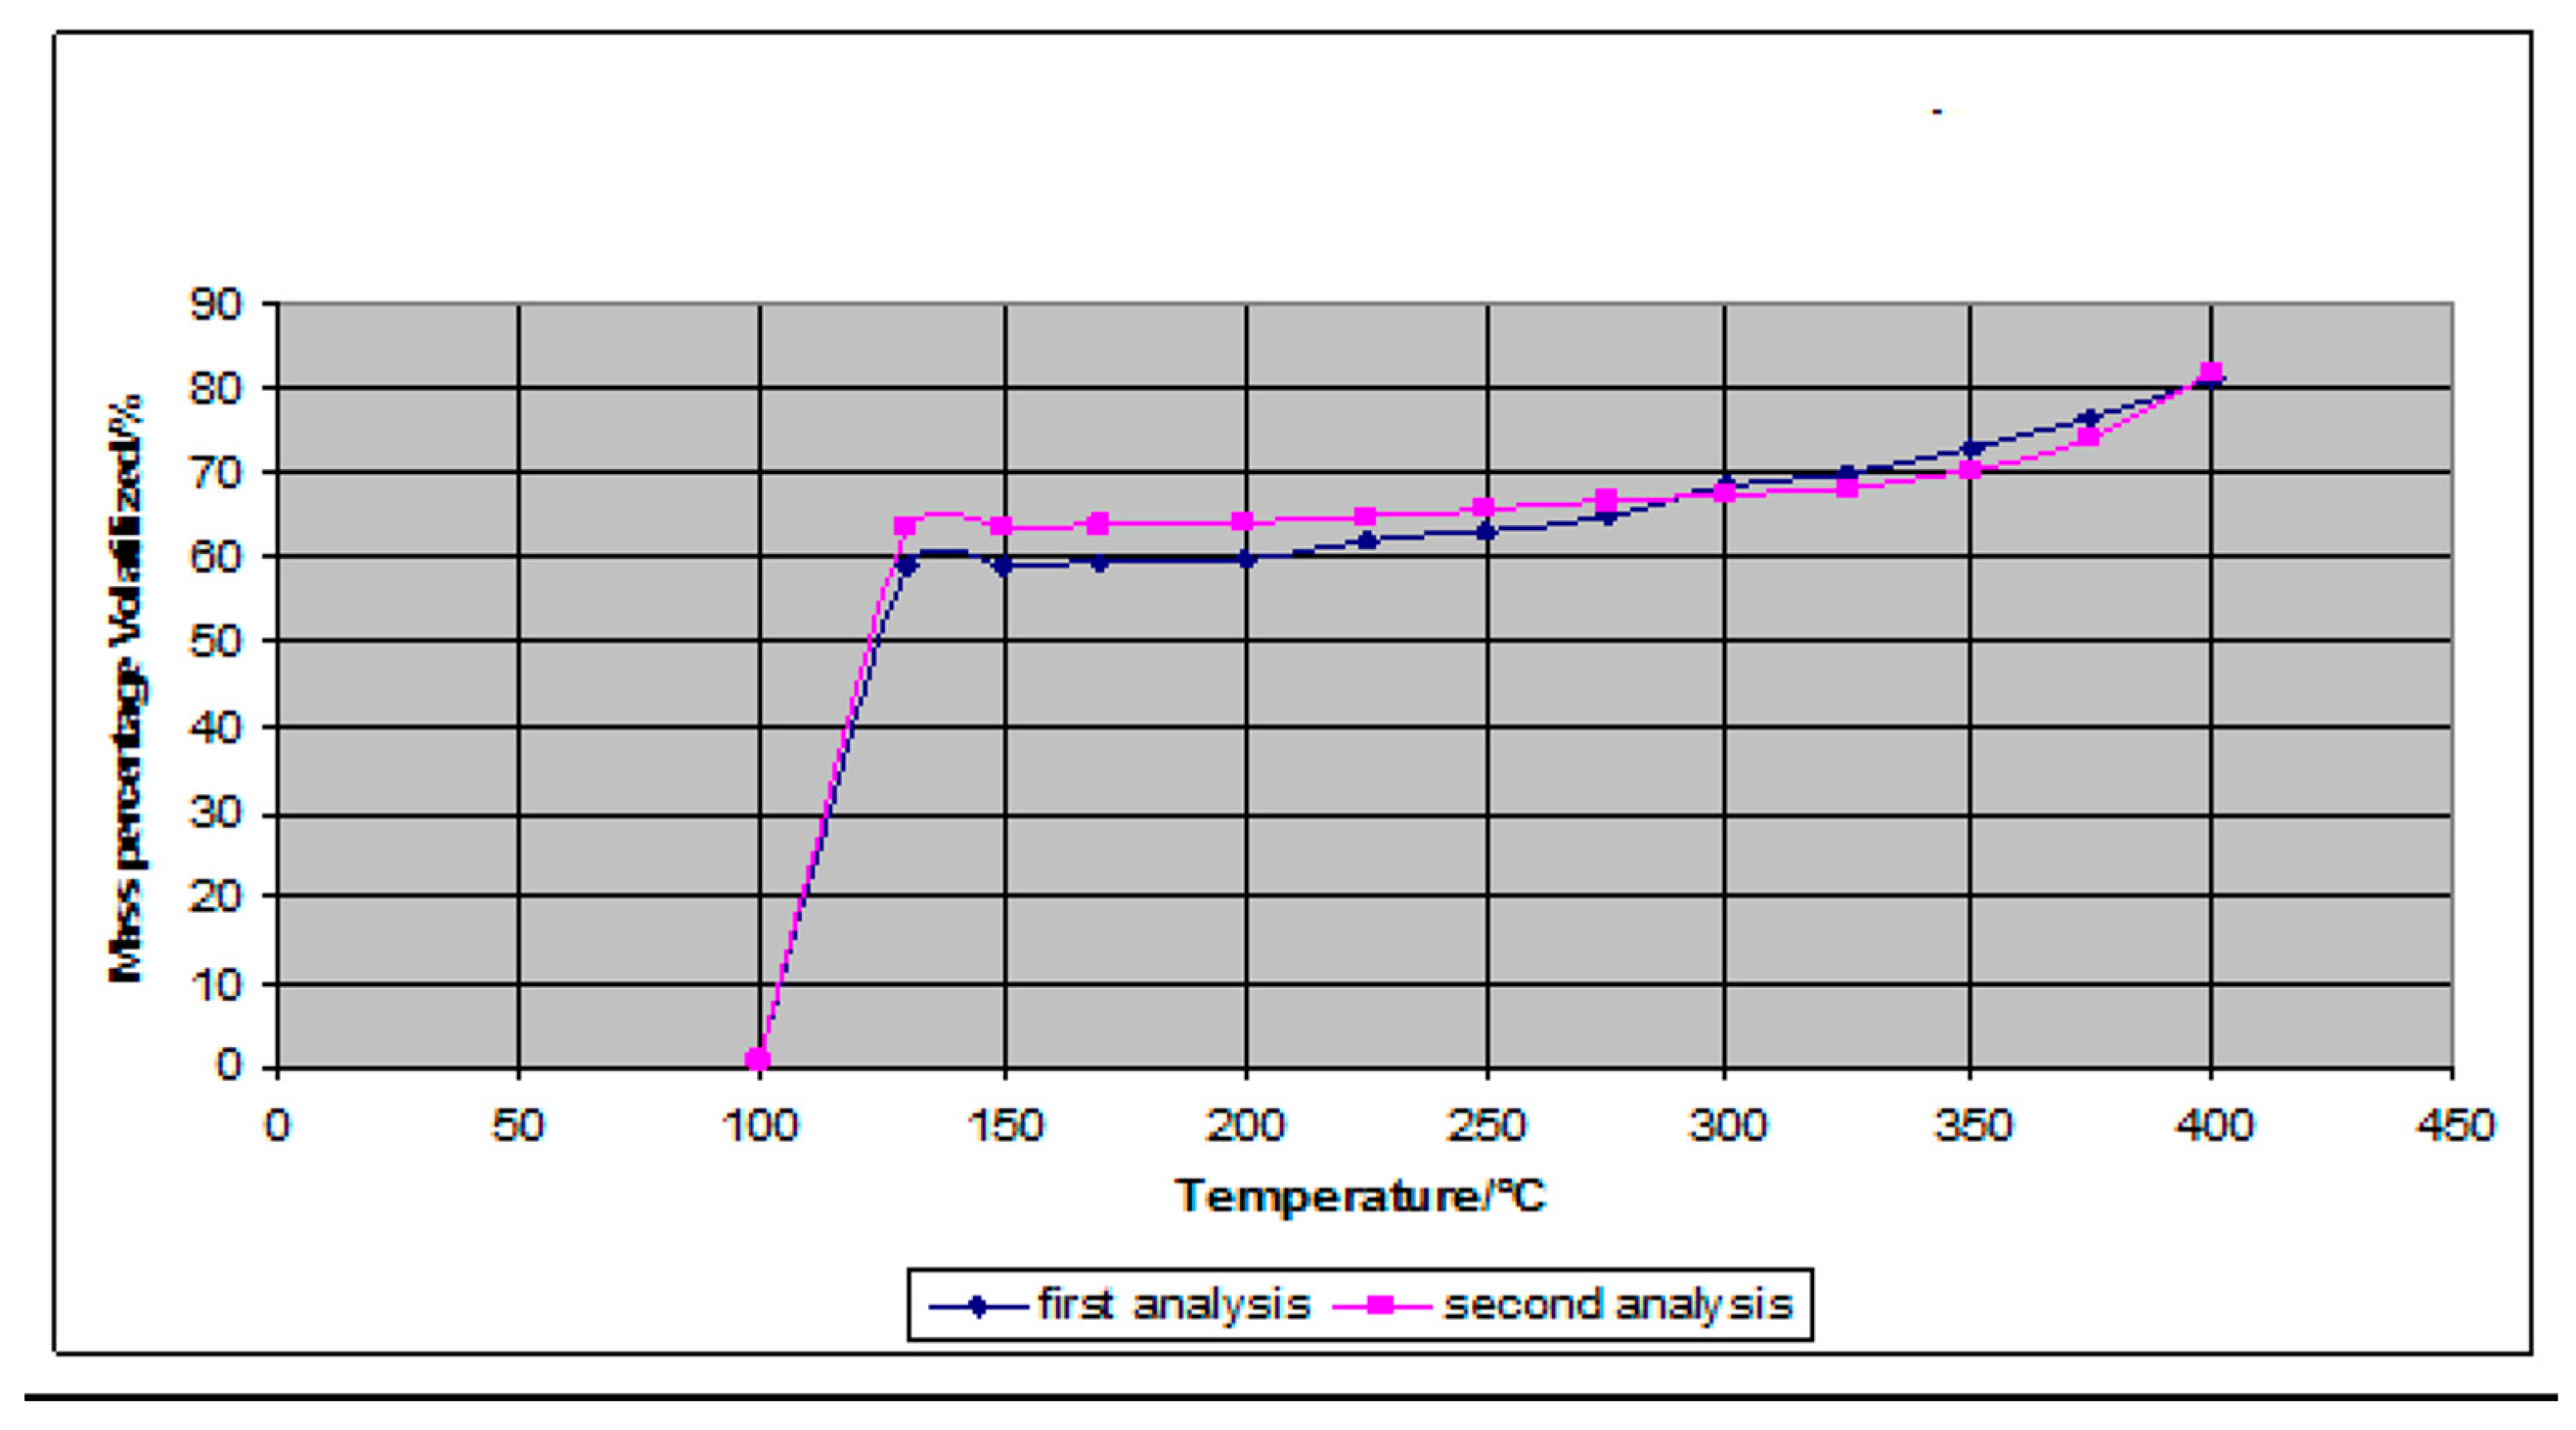
Table 2 were used to determine the petroleum products present in the oil sample. This is because petroleum products comprise mainly of refinery gas, ethane, liquified petroleum gas, aviation gasoline, motor gasoline, jet fuels, kerosene, gas/diesel oil, heavy fuel oil, naphtha, white spirit, lubricants, bitumen, paraffin waxes, petroleum coke and other petroleum products. The temperatures and mass correlation in
Figure 2 assisted in determining the percentage of various petroleum products of which the oil samples are comprised. Boiling ranges and volatility of the oil compound gives an indication as to which petroleum fractions are present in the sample. From the results obtained, it was deduced that the oil sample comprised of constituents that burned from the gasoline range to the 400 °C+ residue.
3.2. Infrared Analysis of the Oil Sample
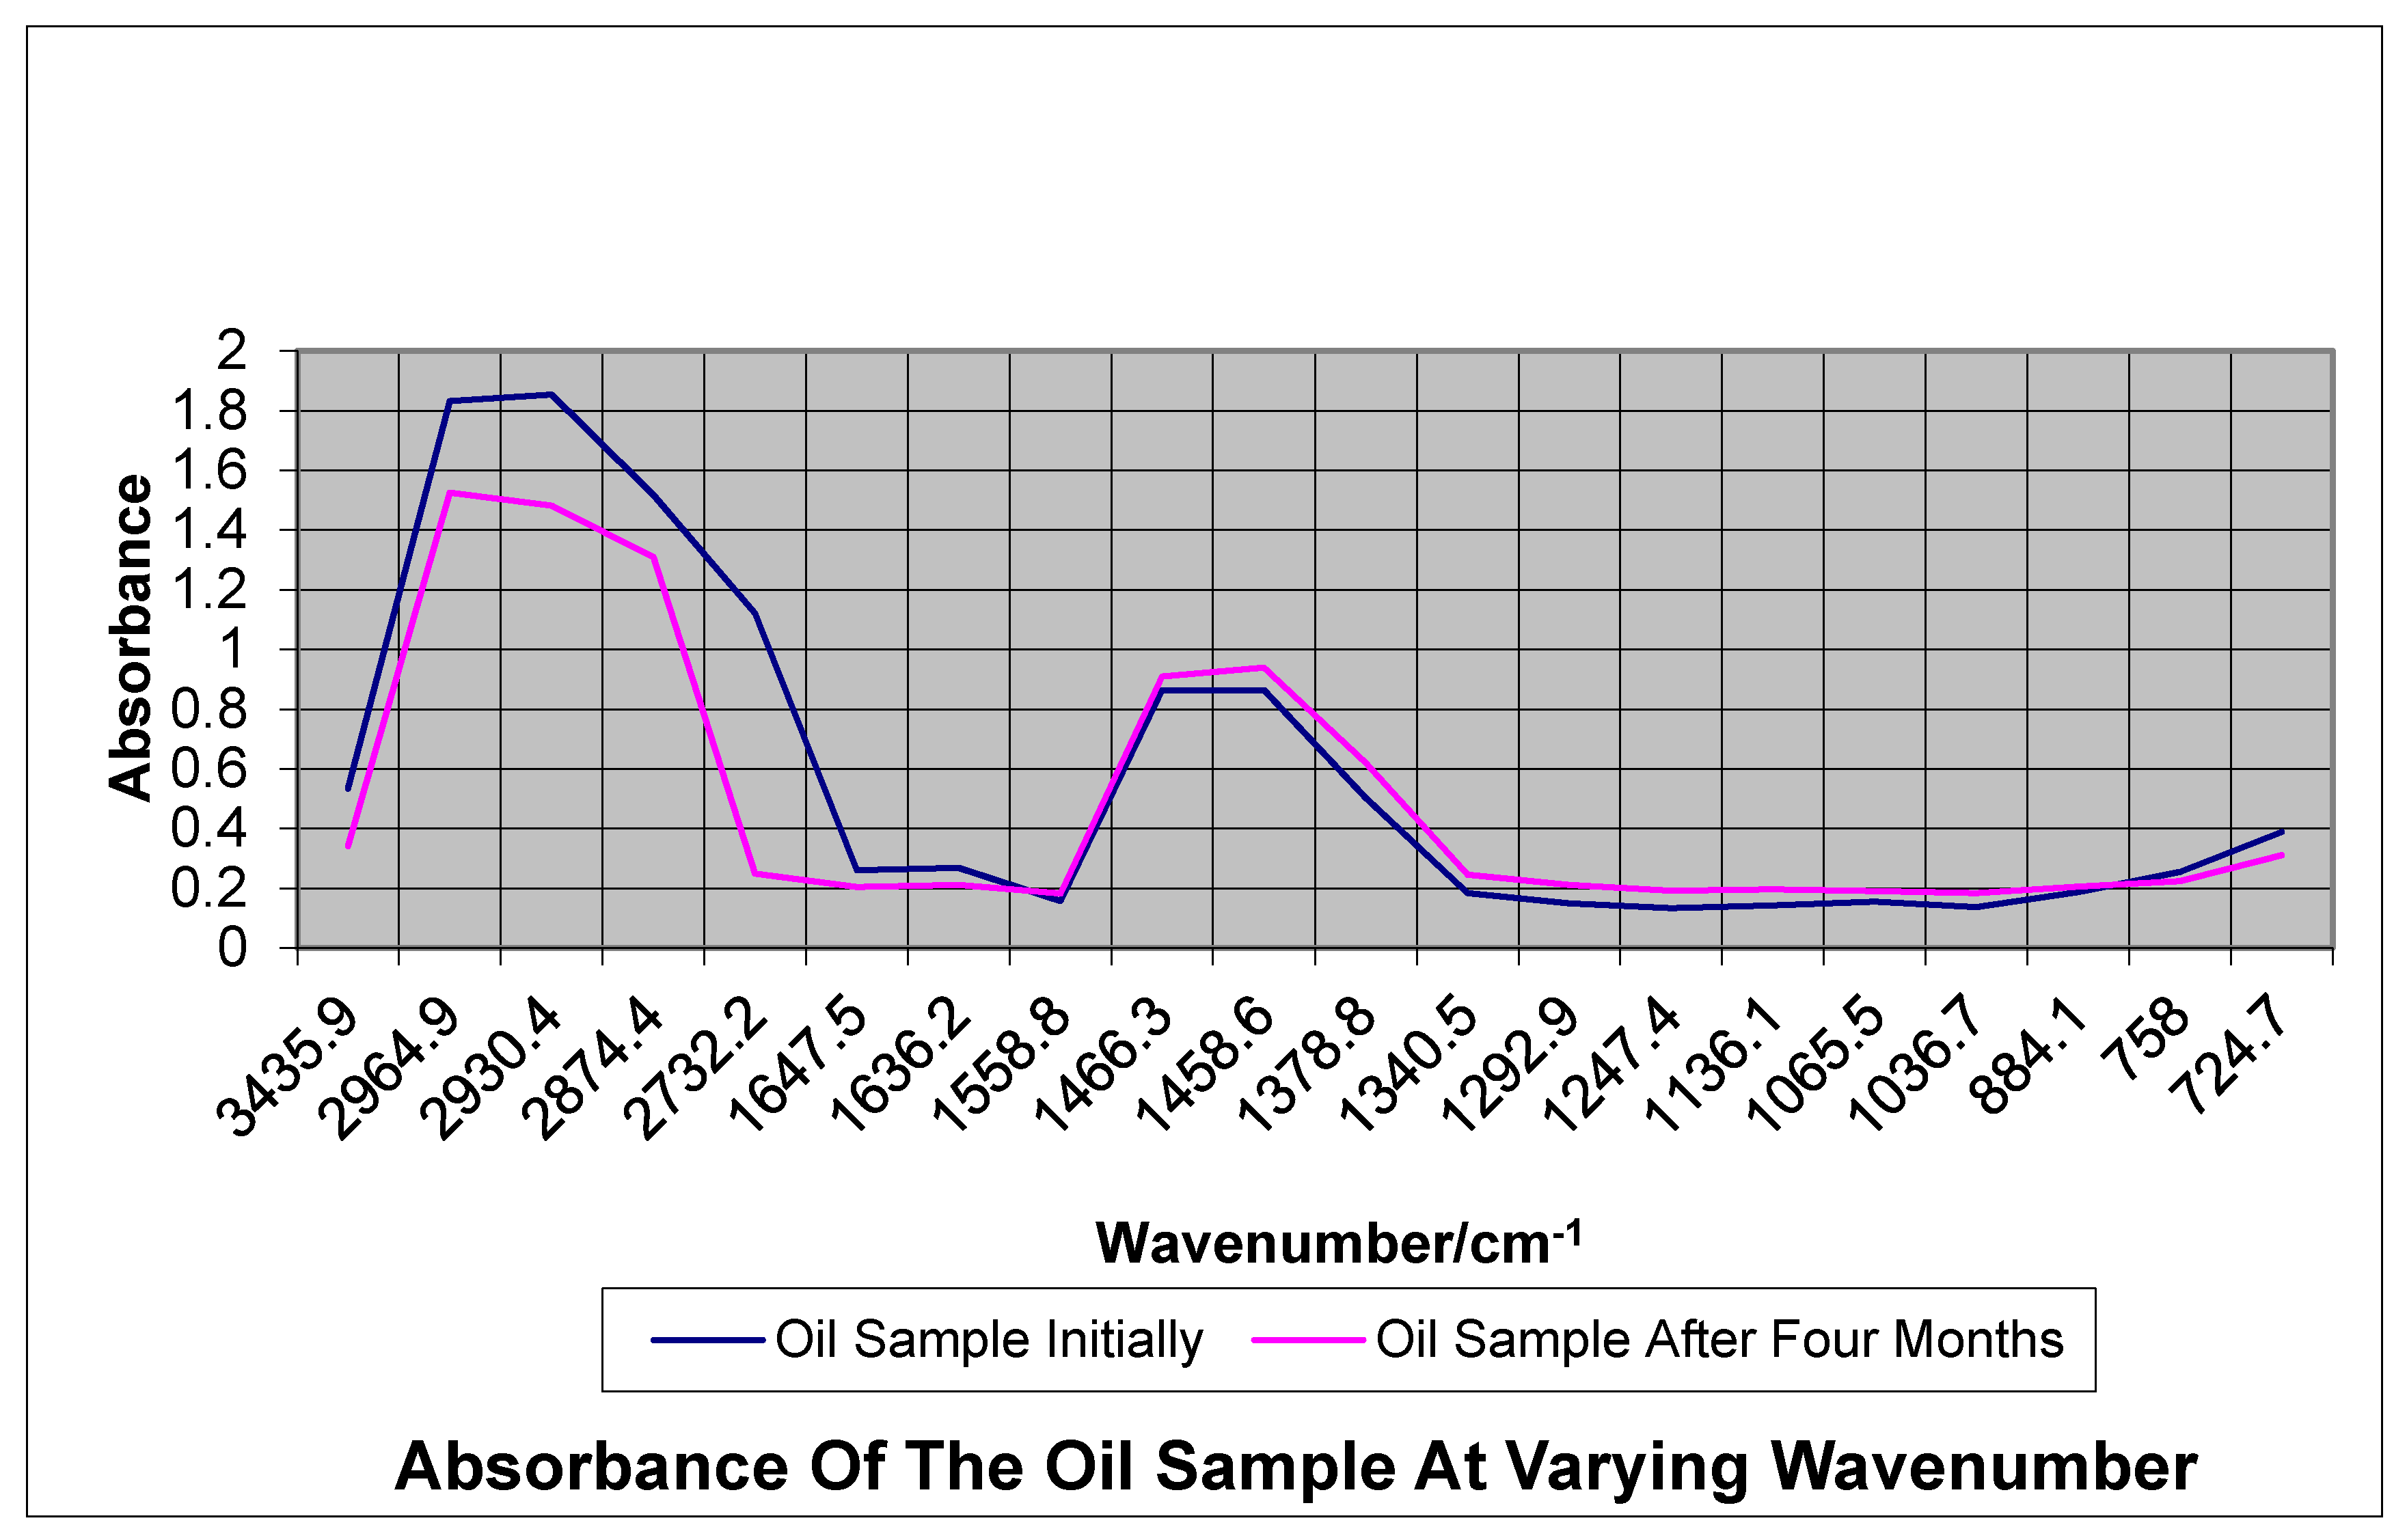
Oil samples are complex mixtures of many different chemical compounds. In fact, because of this complexity, the spectrum of oil initially is of limited value, and it can be compared against the spectrum of the oil after some months to be of significant analytical value. From the infrared analysis done on the oil sample, the presence of C-H, O-H, C=C, S-H and NO
2 bonds were identified. Petroleum is made of hydrocarbons, which are organic compounds of hydrogen and carbon. Sulfur and oxygen are also found in petroleum, but it is usually a smaller amount, from 0.1 to 5%.
Figure 3 shows absorbance spectra from the oil samples initially and at the end of four months that are superimposed on a common spectral grid. In the FTIR analysis, the ratio of the intensities (or areas) of peaks above 3000 cm
−1 (aromatic C-H) and between 2700–3000 cm
−1 (aliphatic C-H) was noted as indicating a decrease in the aromatic and aliphatic C-H bonds present.
3.3. UV/Vis Analysis of the Oil Sample
As the oil sample was diluted as shown in
Table 3, exact location of peaks could be identified. UV/Vis results obtained for oil sample indicated that absorbance occurred at the following wavelengths: 191–340 nm, 345–380 nm, 527–529 nm and 563–565 nm. The absorbance resulting at 191–340 nm indicates the presence of one ring to three ring compounds in the unknown sample. Since absorbance is also seen at 345–380 nm, it indicates that aromatic rings have attachments that have shifted its absorbance to a higher wavelength.
One ring to three ring compounds gave distinctive absorbance results below 300 nm but no signal above 300 nm. Four ring to seven rings systems produce signals above 300 nm and are generally not evident at 365 nm. Therefore, by using the UV/Vis results obtained for the oil sample, it can be deduced that polynuclear aromatics were present and these arranged to form one ring to four ringed compounds. The four-ring compounds were as a result of absorbance in the 500 nm wavelength region. Moreover, functional groups in addition to the polynuclear aromatic compounds would cause an increase in wavelength absorbance, whereby the absorbance would take place in a range. The increase in wavelength is the sum of the base maximum wavelength added to increments resulting from either substitution or addition on the rings.
3.4. NMR Analysis of Oil Sample before and after the Biodegradation Period
By using NMR analysis, the aromaticity index was obtained as the ratio of aromatic carbon to total carbon or aromatic hydrogen to total hydrogen. The integration regions used for 13 °C spectra were 0–70 ppm for aliphatic carbon, 100–170 ppm for aromatic carbon, for 1H spectra, 0–4 ppm for aliphatic hydrogen, and 6–9 ppm for aromatic hydrogen. These indicators support the results that aliphatic carbon, aromatic carbon, aliphatic hydrogen and aromatic hydrogen were present in the oil sample before biodegradation. The end of eight months of biodegradation showed that the presence of aromatic hydrogen and aromatic carbon were not accounted for. This shows that the aromatic compounds present in the oil samples in the soil have been degraded to a certain extent.
From the Proton Nuclear Magnetic Resonance spectrum results, shown in
Table 4 and
Table 5, the presence of both aliphatics and aromatics was identified. The aliphatics were found in the chemical shift range of 0–2.0 ppm while the aromatics occurred at 4.5–8.5 ppm. The two largest peaks were in the 4.5–5.0 ppm region and 6.5–8.5 ppm region. The peaks in the 6.5–8.5 ppm region were a result of chloroform and benzene, where chloroform shows up as a distinctive singlet peak at 7.2 ppm for Proton NMR and a triplet at 77 ppm for Carbon–13 NMR.
The presence of phenols was detected in the beginning using the Proton NMR, but at the end of the biodegradation period, its presence was not detected. The aliphatic grouping showed distinctive peak separation, these peaks were characteristic of those of the saturated alkanes, indicating an increase in the presence of straight chain compounds at the end of the biodegradation period. These deductions were supported by the results obtained from the Carbon-13 NMR data collected. There was a definite increase in the presence of saturated alkanes and a decrease in the aromatics present, especially benzene compounds. It is confirmed that there was a decline in compounds in the oil sample, as the initial oil sample graph compared to the results obtained after four months indicated the decline of certain bonds found in the oil sample.
Soil pollution is an alarming issue; therefore, the remediation of polluted soils is essential. From the results obtained it can be noted that the polycyclic aromatic hydrocarbons present in the soil have limited availability to microorganisms, thus hindering natural attenuation by microbial processes which resulted in the small changes in the compound structure, while allowing positive confirmation that the chemical structures of the oil composition indeed undergo changes.
4. Conclusions
Questions that scientists measuring oil degradation rates usually want answered are “how fast is the oil being consumed?” and “when will the oil be gone?” The majority of oil-biodegradation studies have focused on the environmental effects, while the influence of oil type on biodegradation has not received much attention. Therefore, it has become important to combine environmental factors with the physicochemical properties of oil when studying their effect on oil-biodegradation. Biodegradation rates vary depending on the hydrocarbons that make up the spilled oil. This research tried using various analytical methods to track the chemical changes of the petroleum products over the period of assigned biodegradation.
Different types of oil have different potentials for biodegradation, based primarily on their saturate content, which is the most degradable component. Boiling ranges and volatility of the oil compound gives an indication as to which petroleum fractions are present in the sample. IR spectroscopy confirmed the decline in compounds in the oil sample under national degradation, as the initial oil sample graph compared to the results obtained after four months indicated the decline of certain bonds found in the oil sample. Hence, the success of oil spill biodegradation depends on one’s ability to establish and maintain conditions that favor enhanced oil biodegradation rates in the contaminated environment by first analyzing the oil composition because not every compound is capable of fully degrading quickly.
Therefore, based on the current state of the knowledge reviewed here, there are some investigations (more field and pilot scale trials) that still need to be conducted prior to the successful application of biodegradation for the restoration of this particular type of petroleum contaminated environment. With it, these results will be useful in designing an ex situ soil bioremediation system (e.g., biopile and land farming) for practical application because an effective remediation of a contaminated site depends on the appropriate selection and design of the remediation technique.


