Graph Theory: A Comprehensive Survey about Graph Theory Applications in Computer Science and Social Networks


Abstract
:1. Introduction
1.1. Historical Background of the Graph Theory
1.2. Overview of the Existing Surveys and Applications of Graph Theory in Computer Science and Social Networks
- ▪
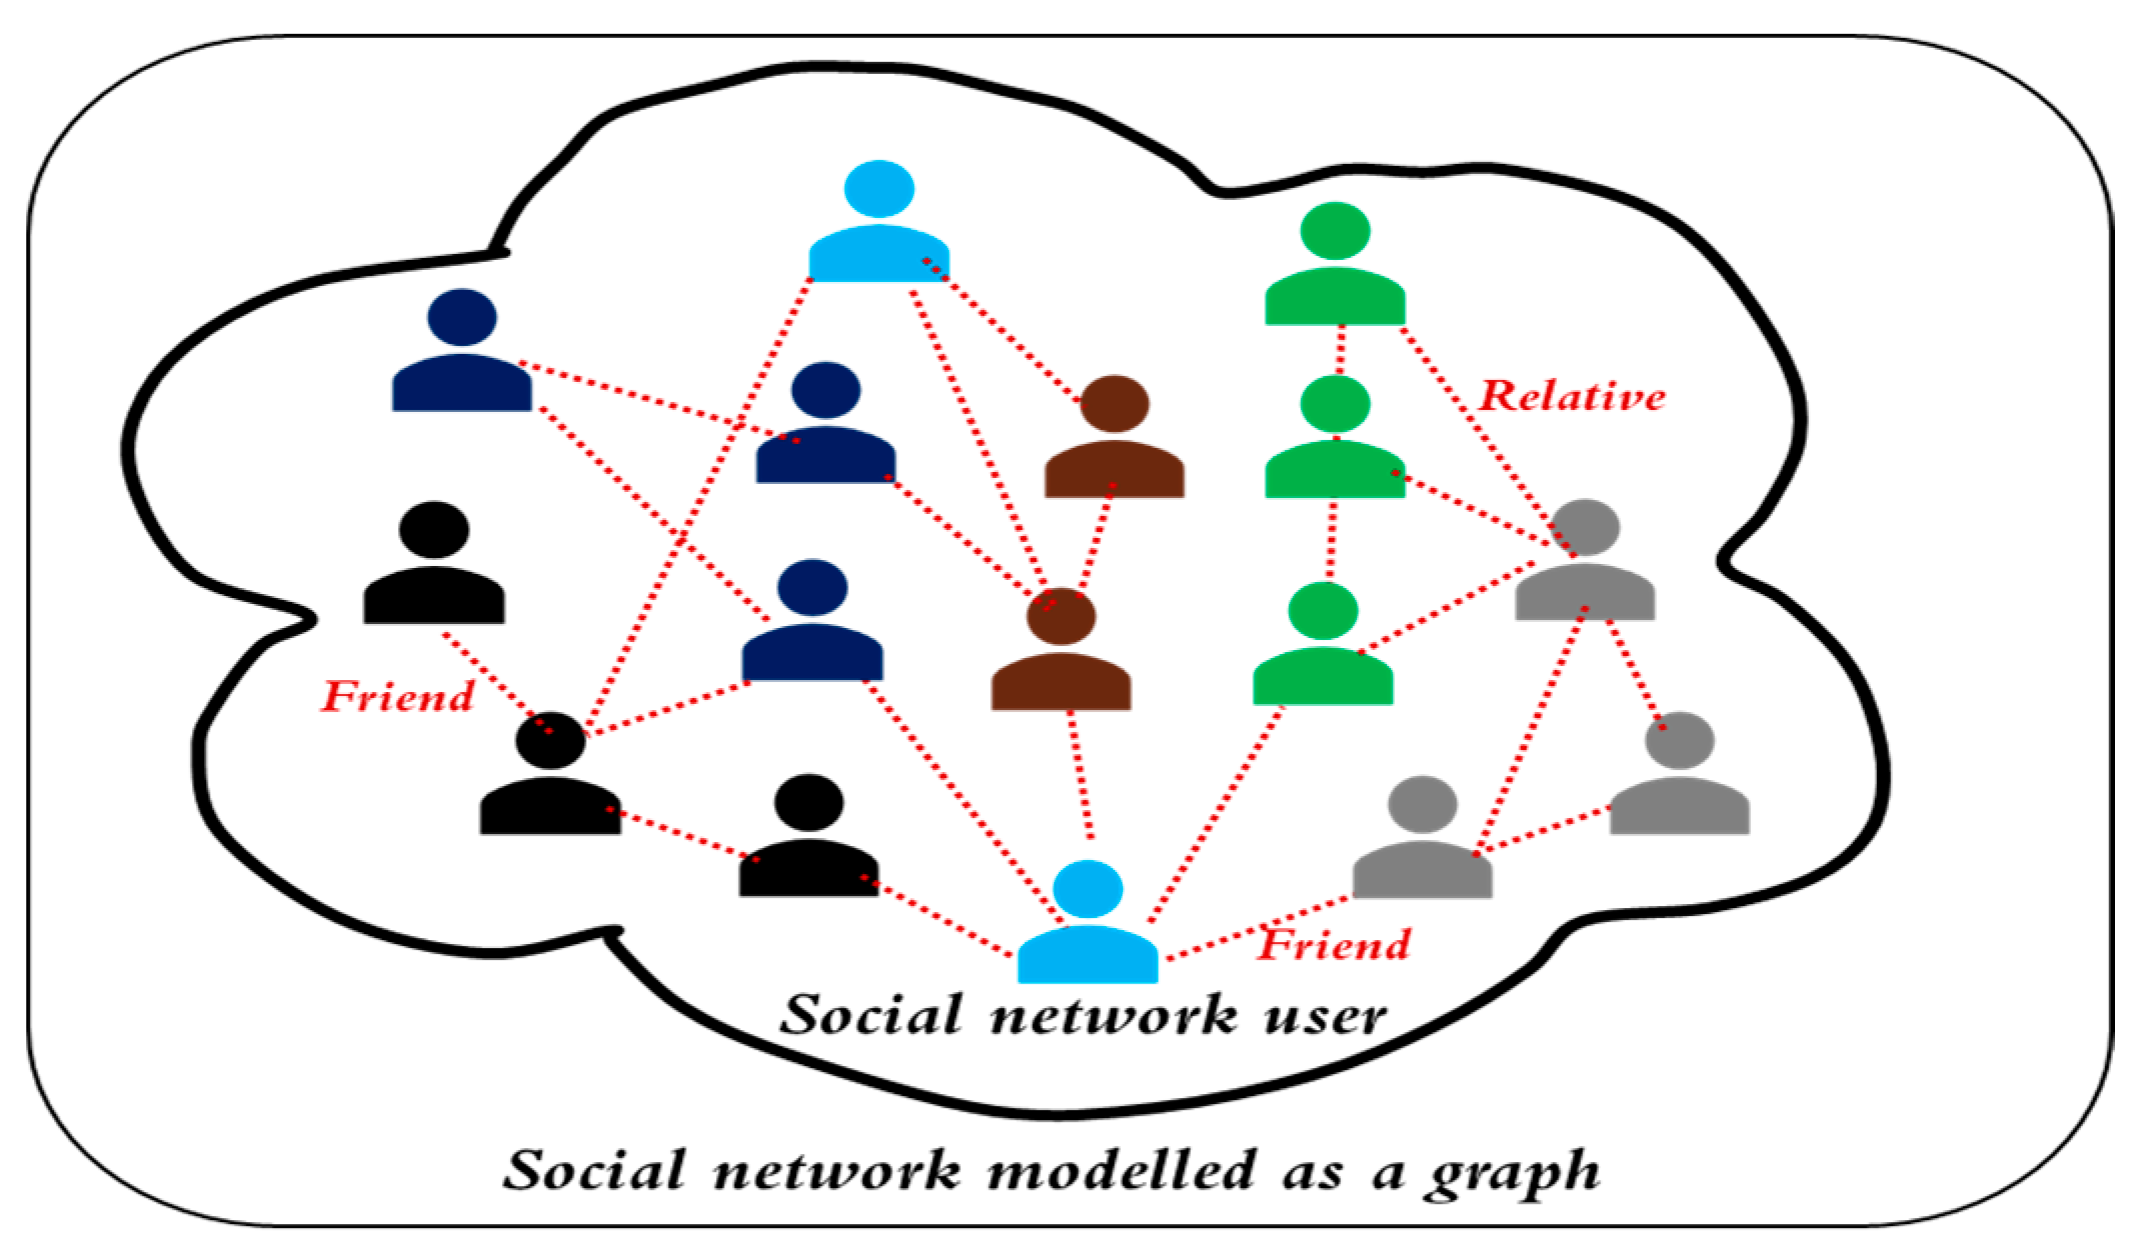
- Social graph: This type of graph is about the connections between people/users. Examples of the social graph include Facebook, Twitter, and the idea of six degrees of separation.
- ▪
- Intent graph: This type of graph deals with reasoning and motivation. For example, on Twitter, a user’s tweets can be analyzed, and intents are mined from the Twitter posts [60]. Later, the intent can be classified into six categories, namely food and drink, travel, career and education, goods and services, event and activities, and trifle.
- ▪
- Consumption graph: The consumption graph is also known as the “payment graph”. It is mainly used in the retail industry. Many e-commerce companies such as eBay, Amazon, and Walmart use this type of graphs to track the consumption of their customers/subscribers. Examples of the consumption graph include credit risk analysis and chargebacks.
- ▪
- Interest graph: Interest graphs models a user’s interests. It has been used for the organizing the web by interest rather than indexing only webpages.
- ▪
- Mobile graph: This type of graph is built from mobile data. The mobile data include browsing data from the web, smart applications, web applications, digital wallets, global positioning systems (GPS), and Internet of Things (IoT) devices.
1.3. Our Contribution
1.4. Paper Organization
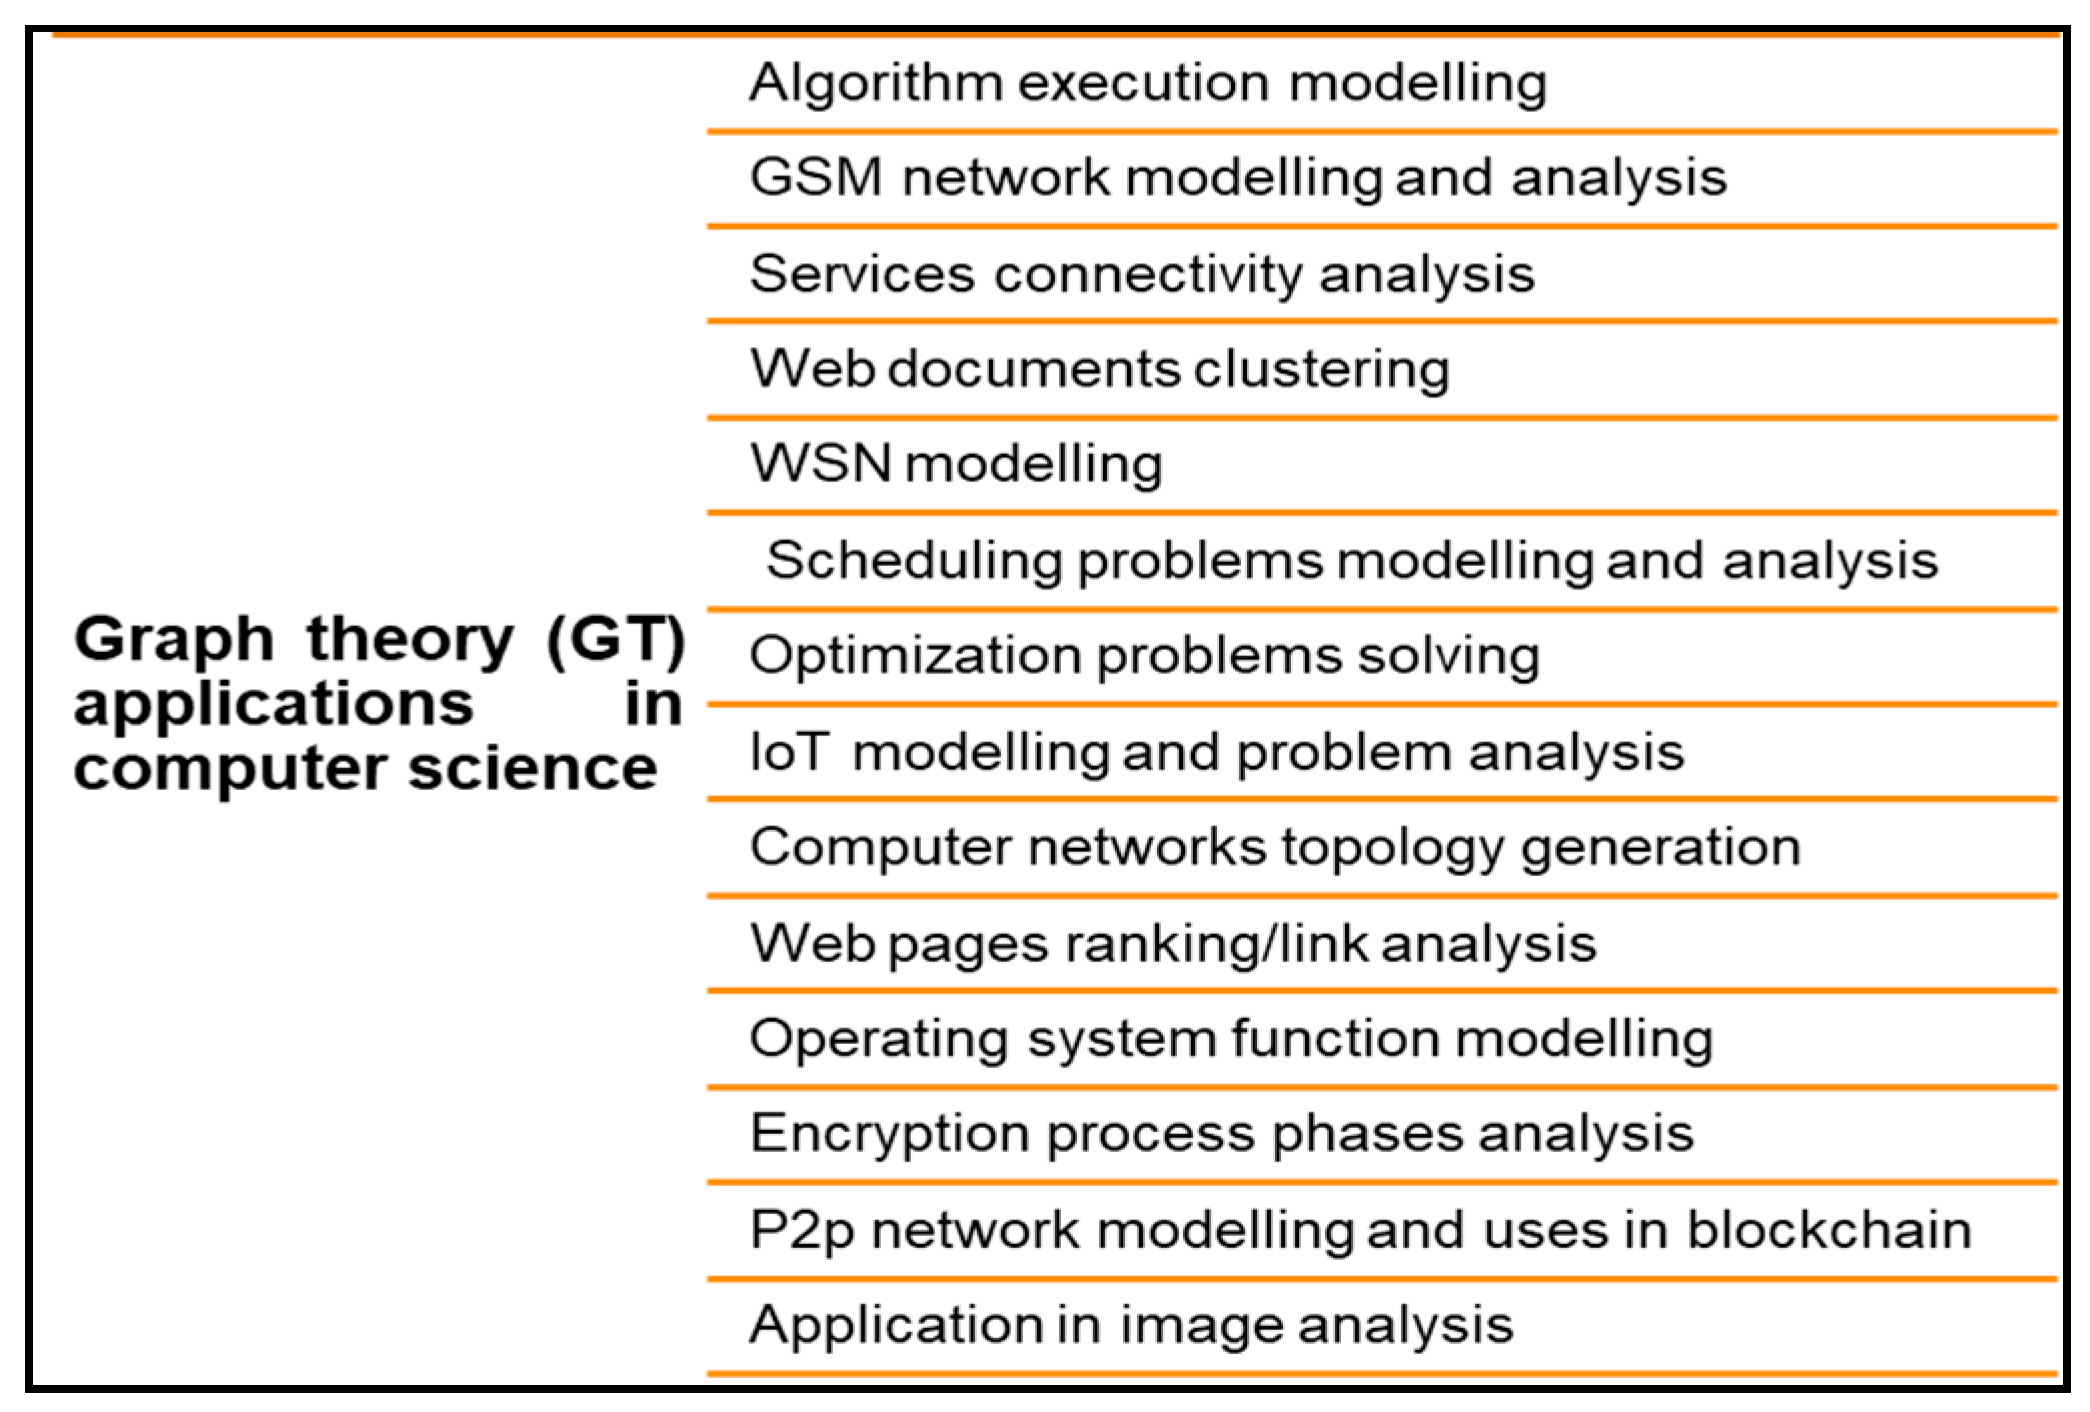
2. Graph Theory Practical Applications in the Computer Science Field
2.1. Uses of Graph Theory in Algorithms
2.1.1. GIRL (Graph Information Retrieval Language)
2.1.2. GASP (Graph Algorithm Software package)
2.1.3. GTPL (Graph Theoretic Programming Language)
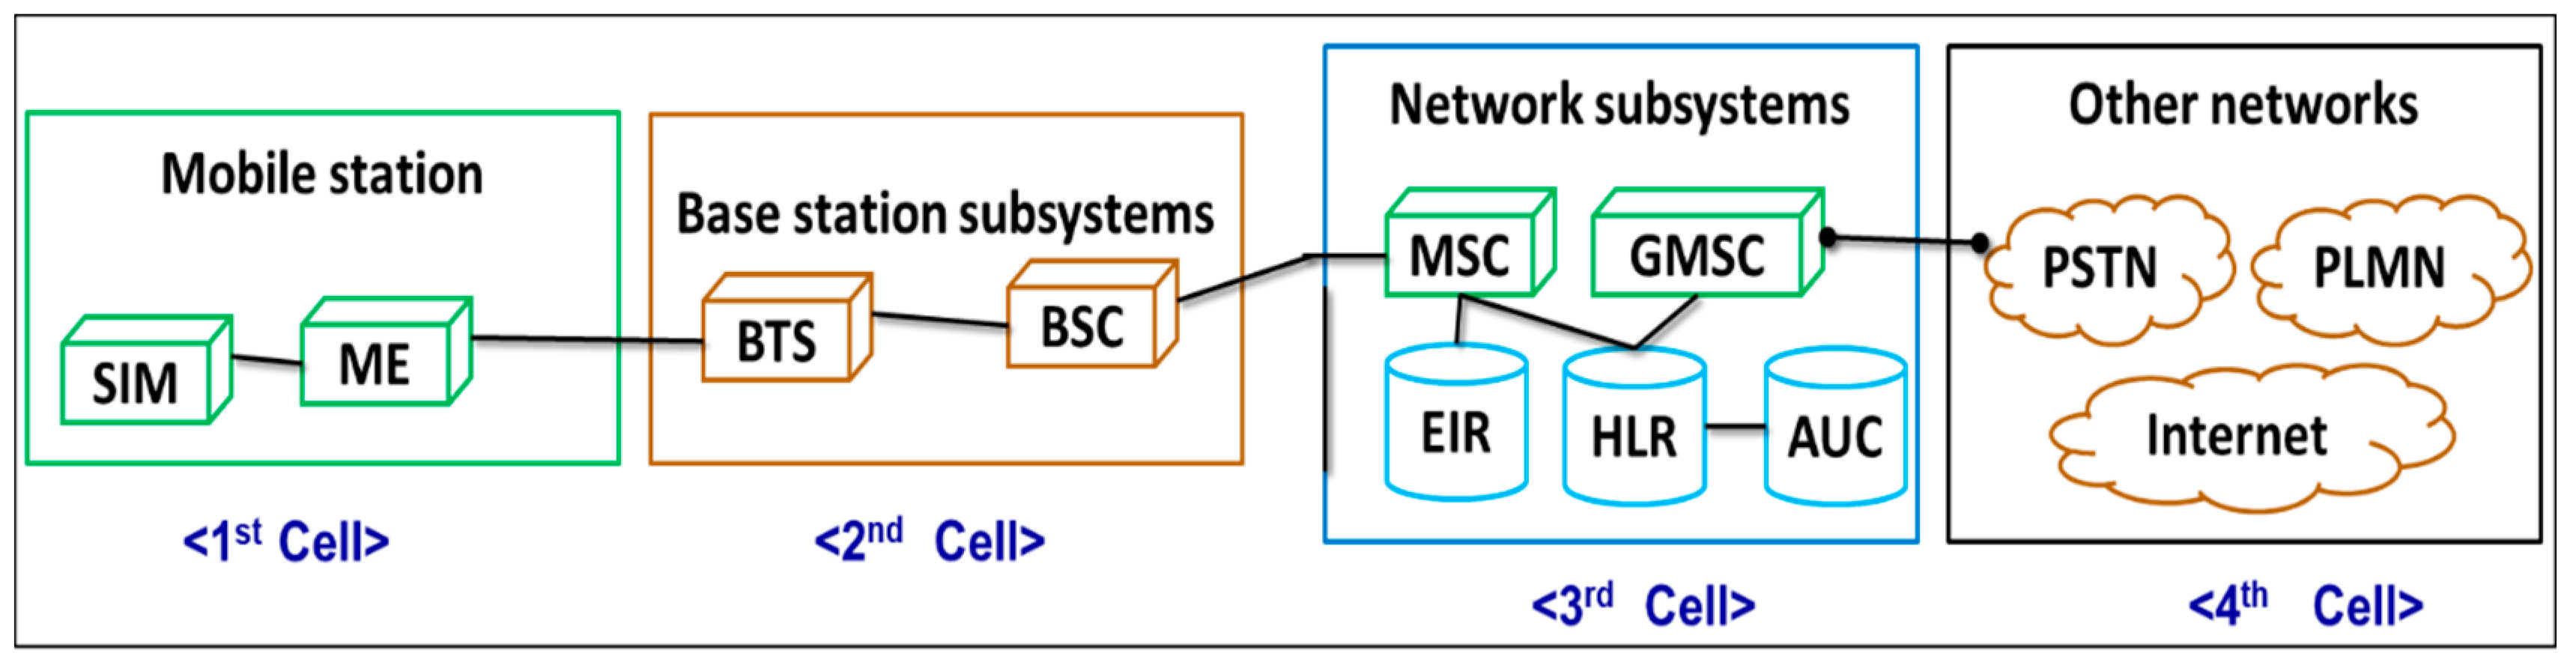
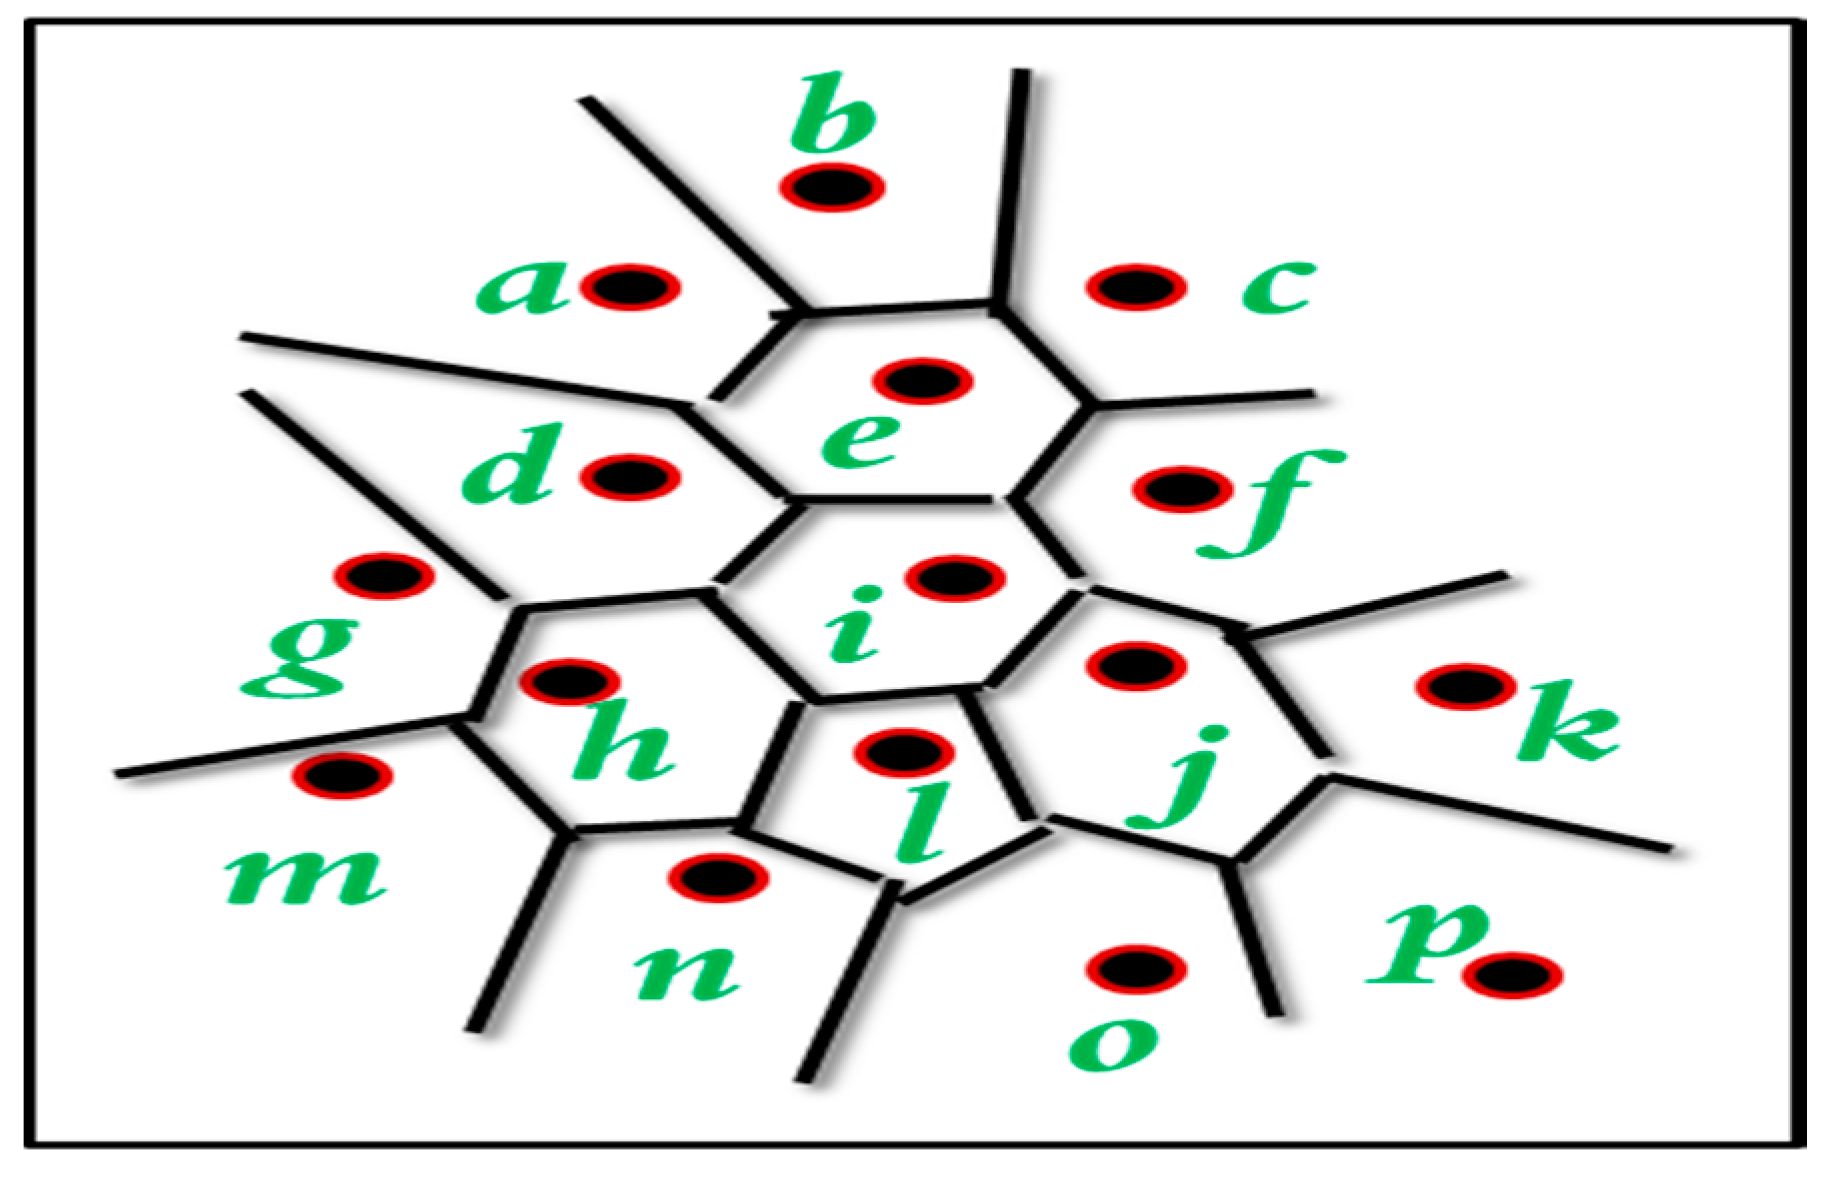
2.2. Group Special Mobile Networks and Maps Coloring using Graphs
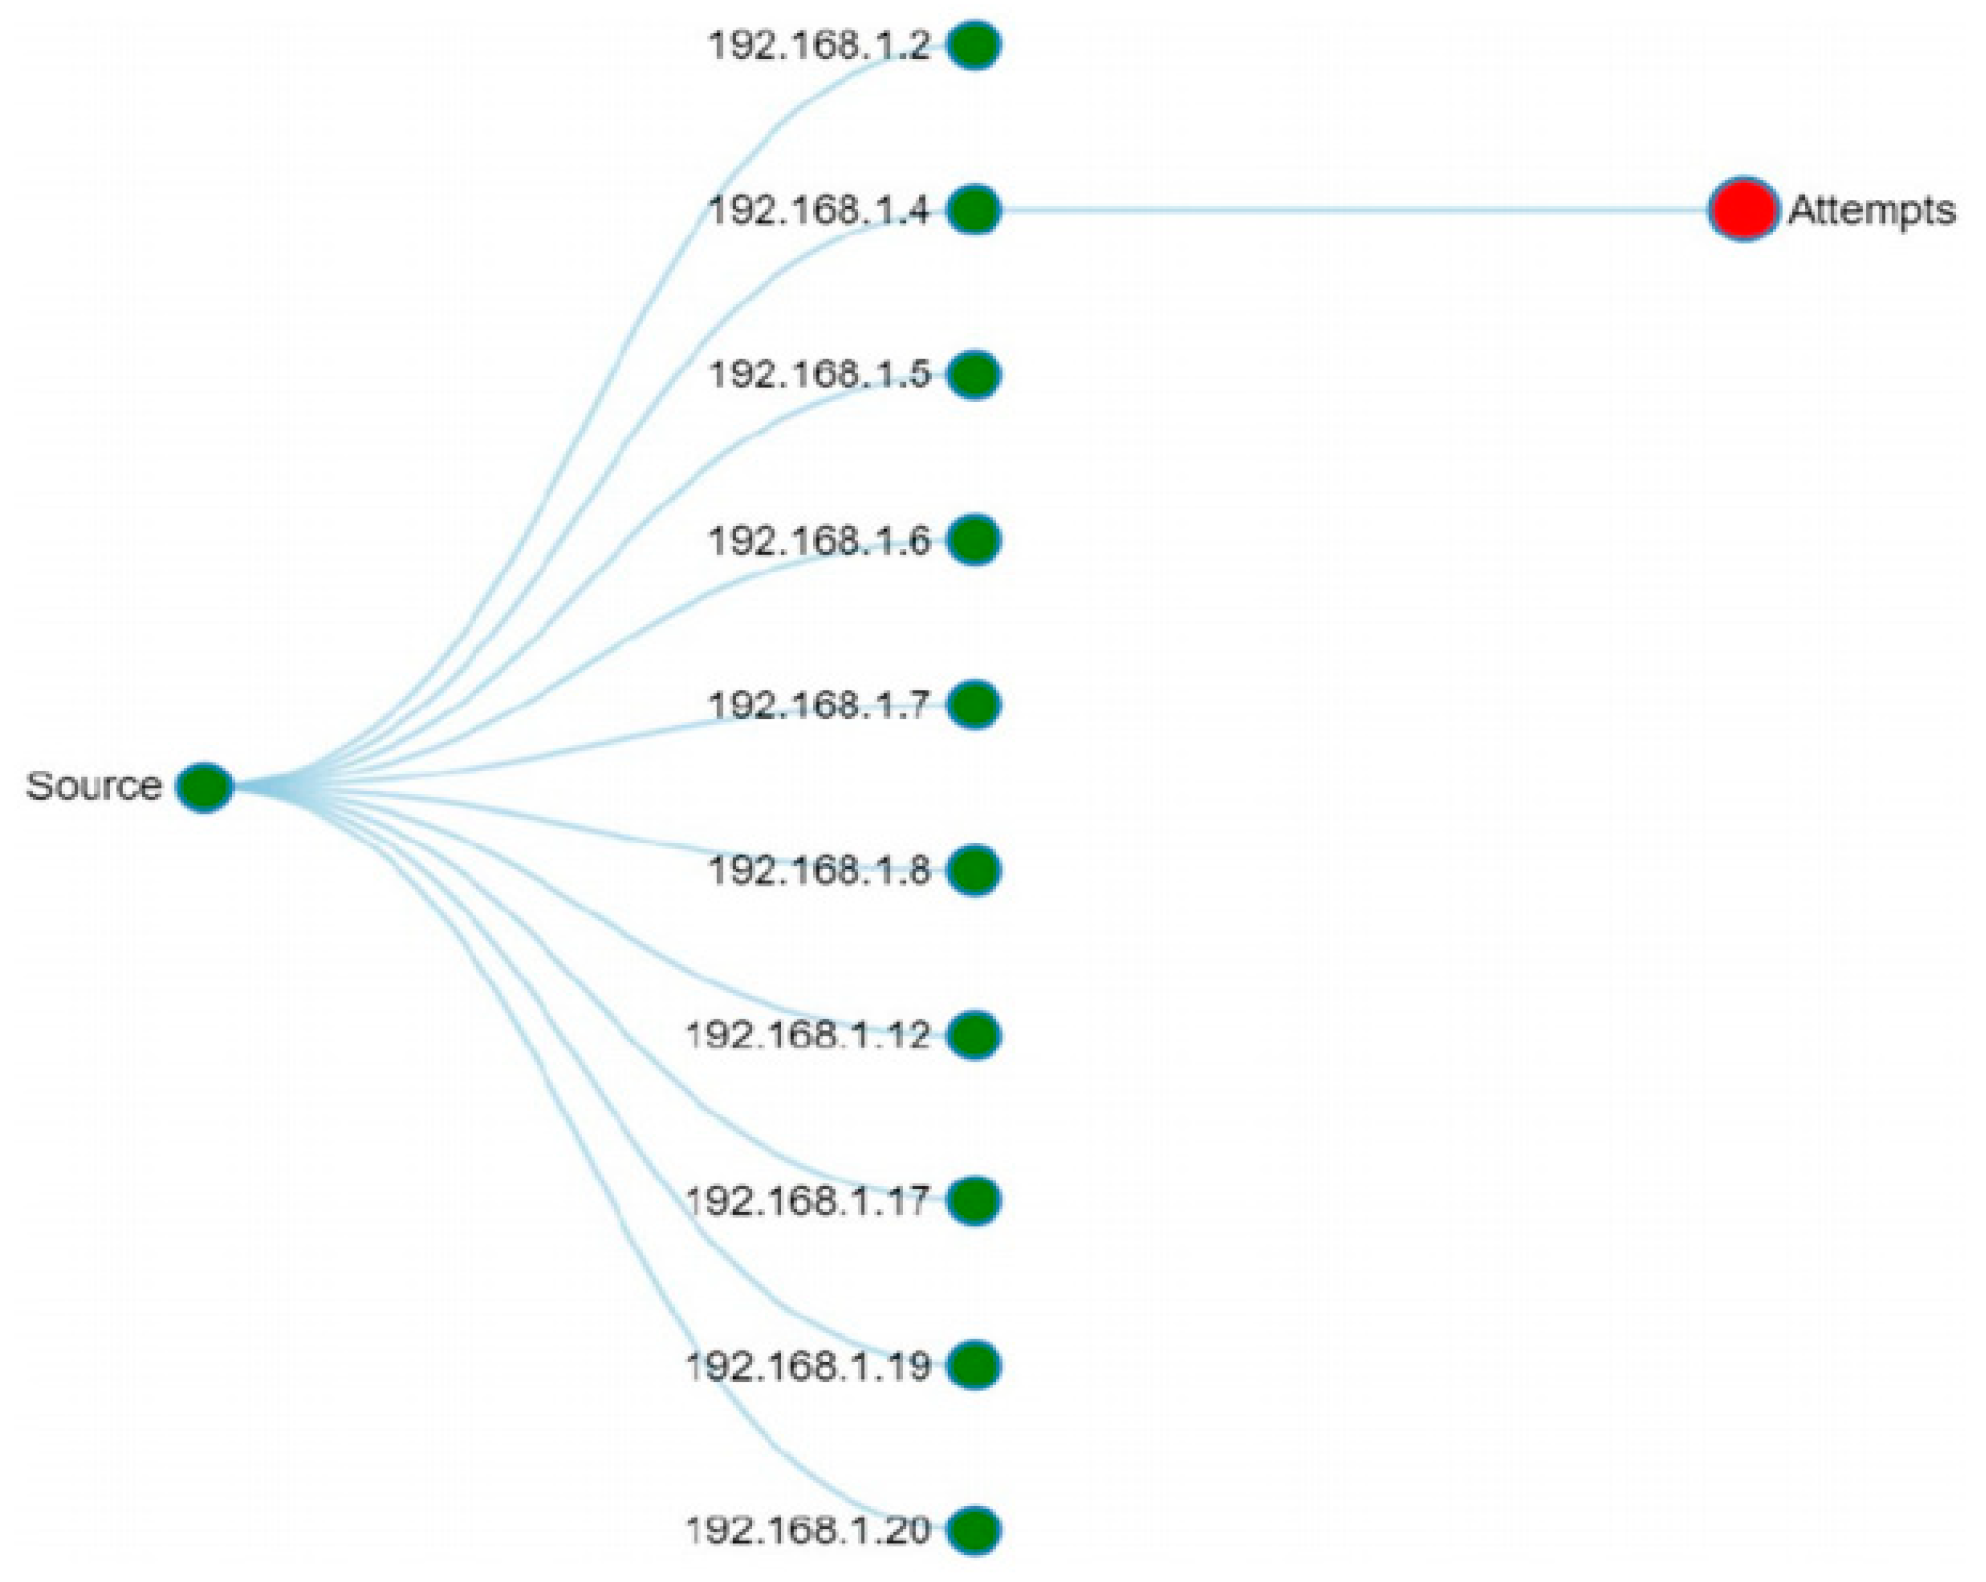
2.3. Uses of Graph Algorithms/Concepts in Network Security Monitoring
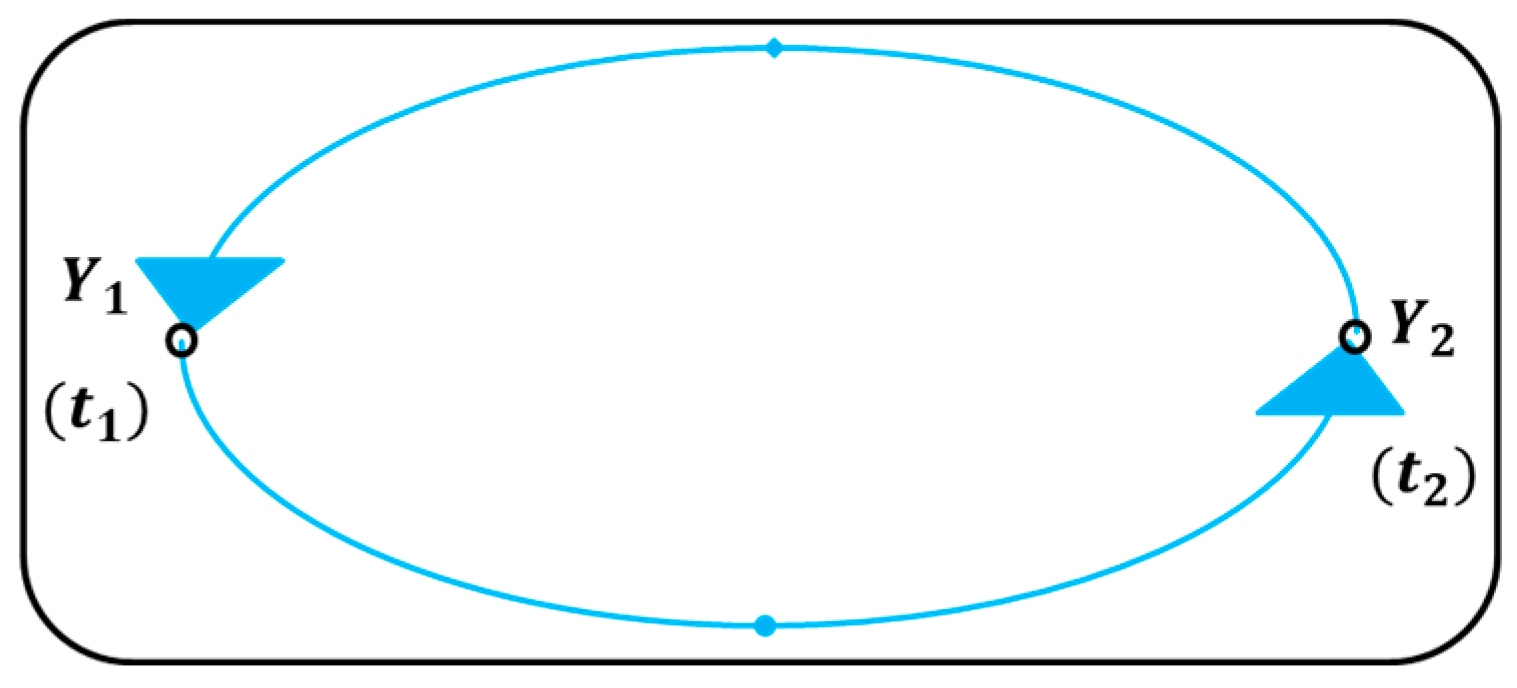
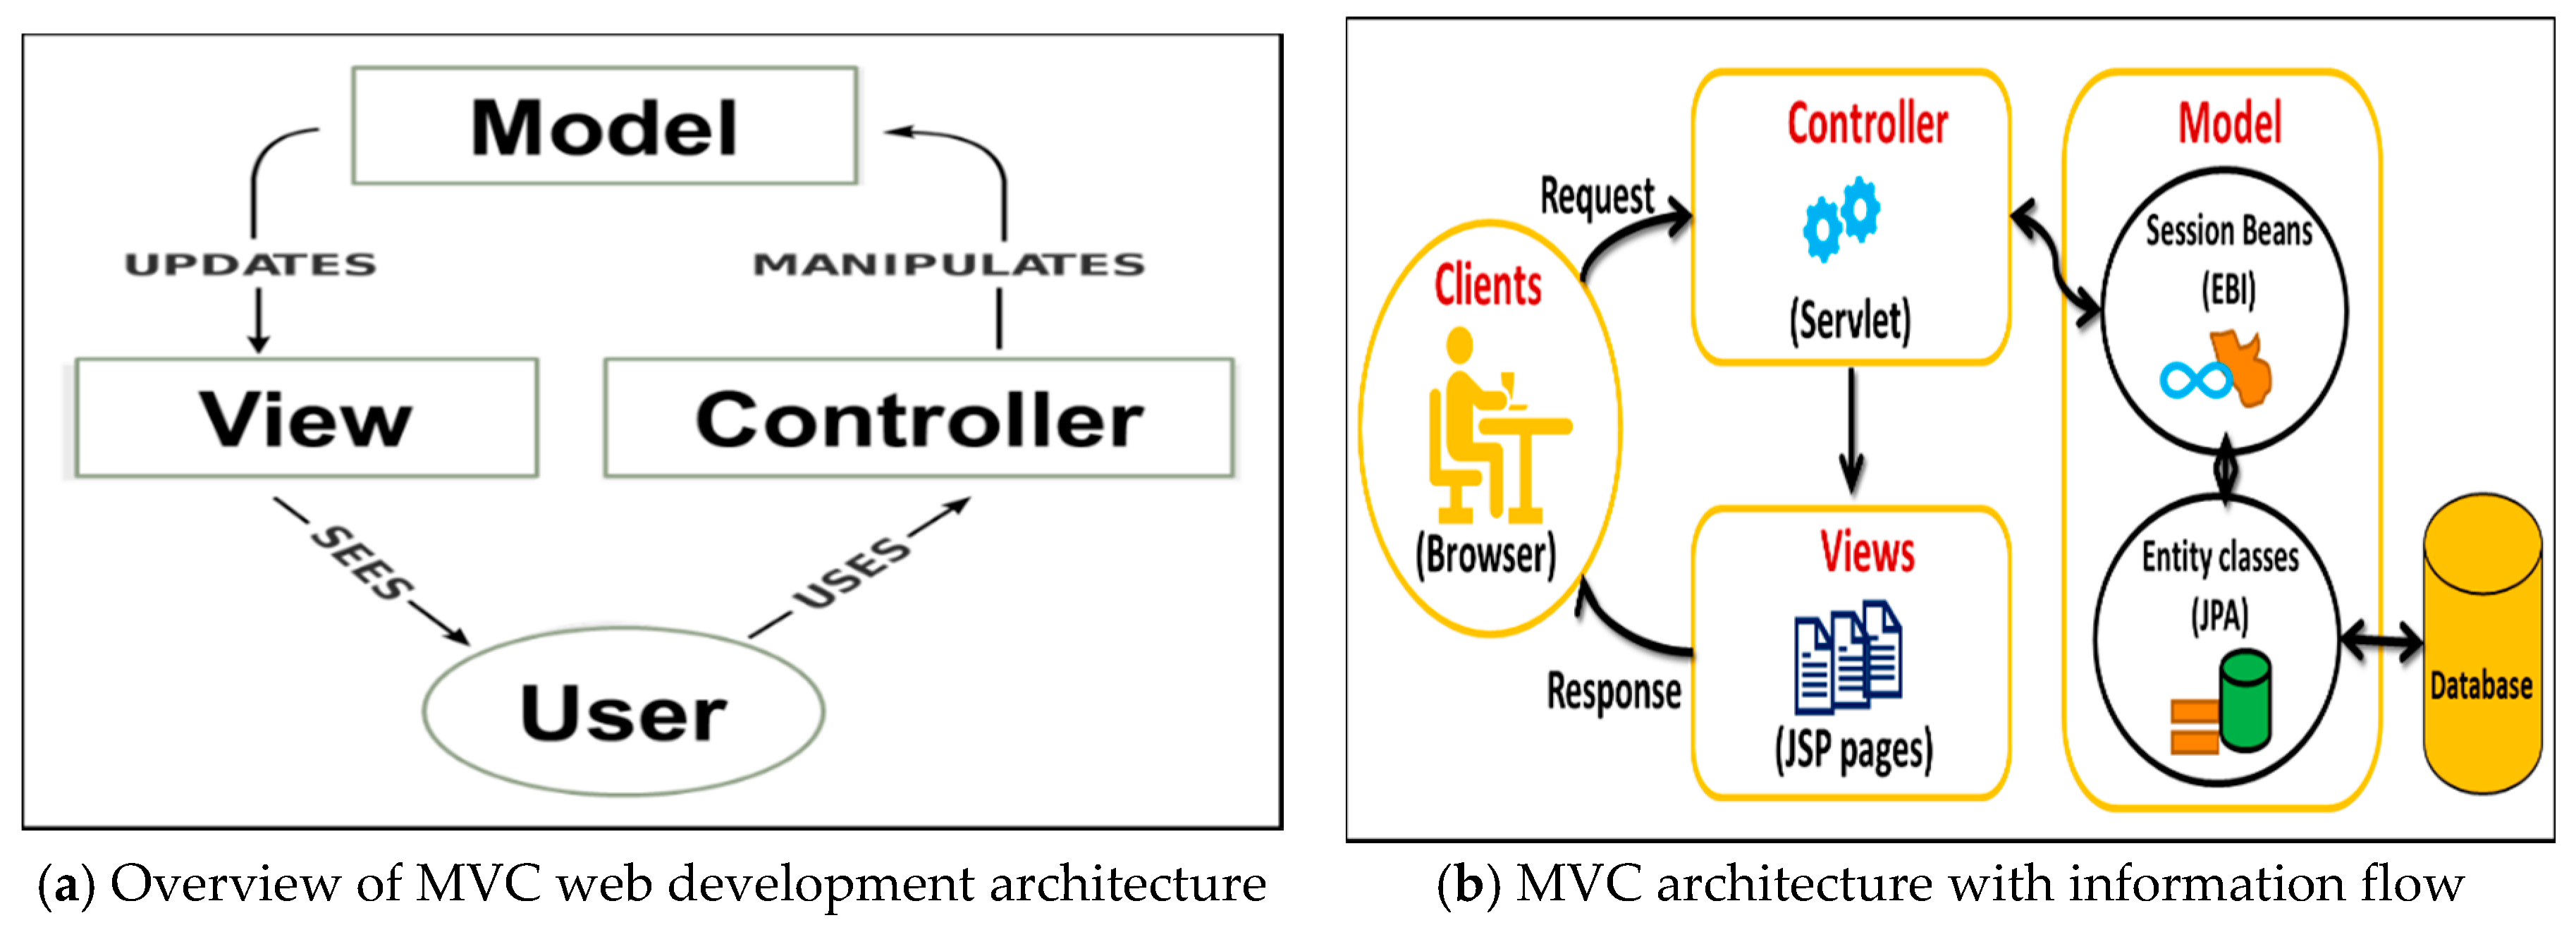
2.4. Services Connectivity Analysis Using Graphs
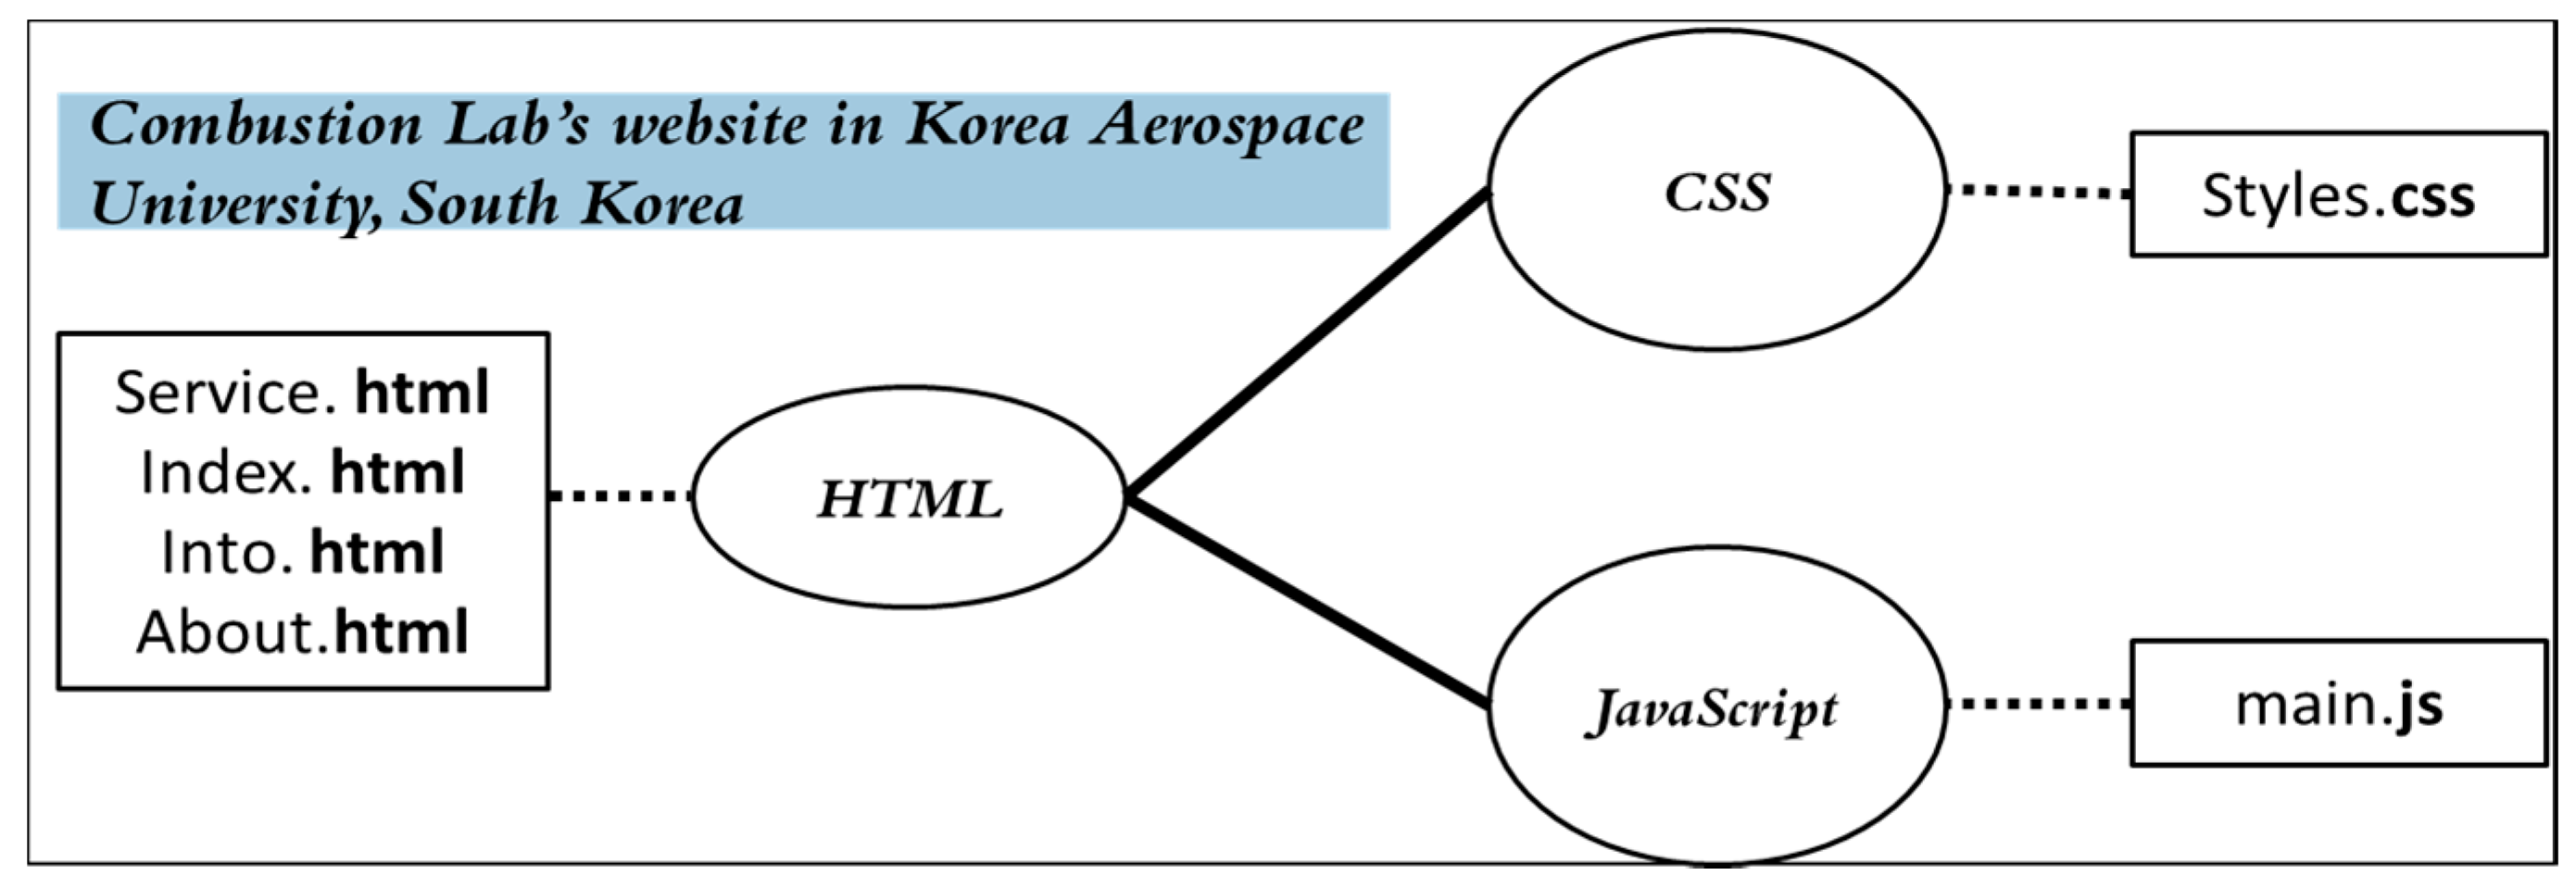
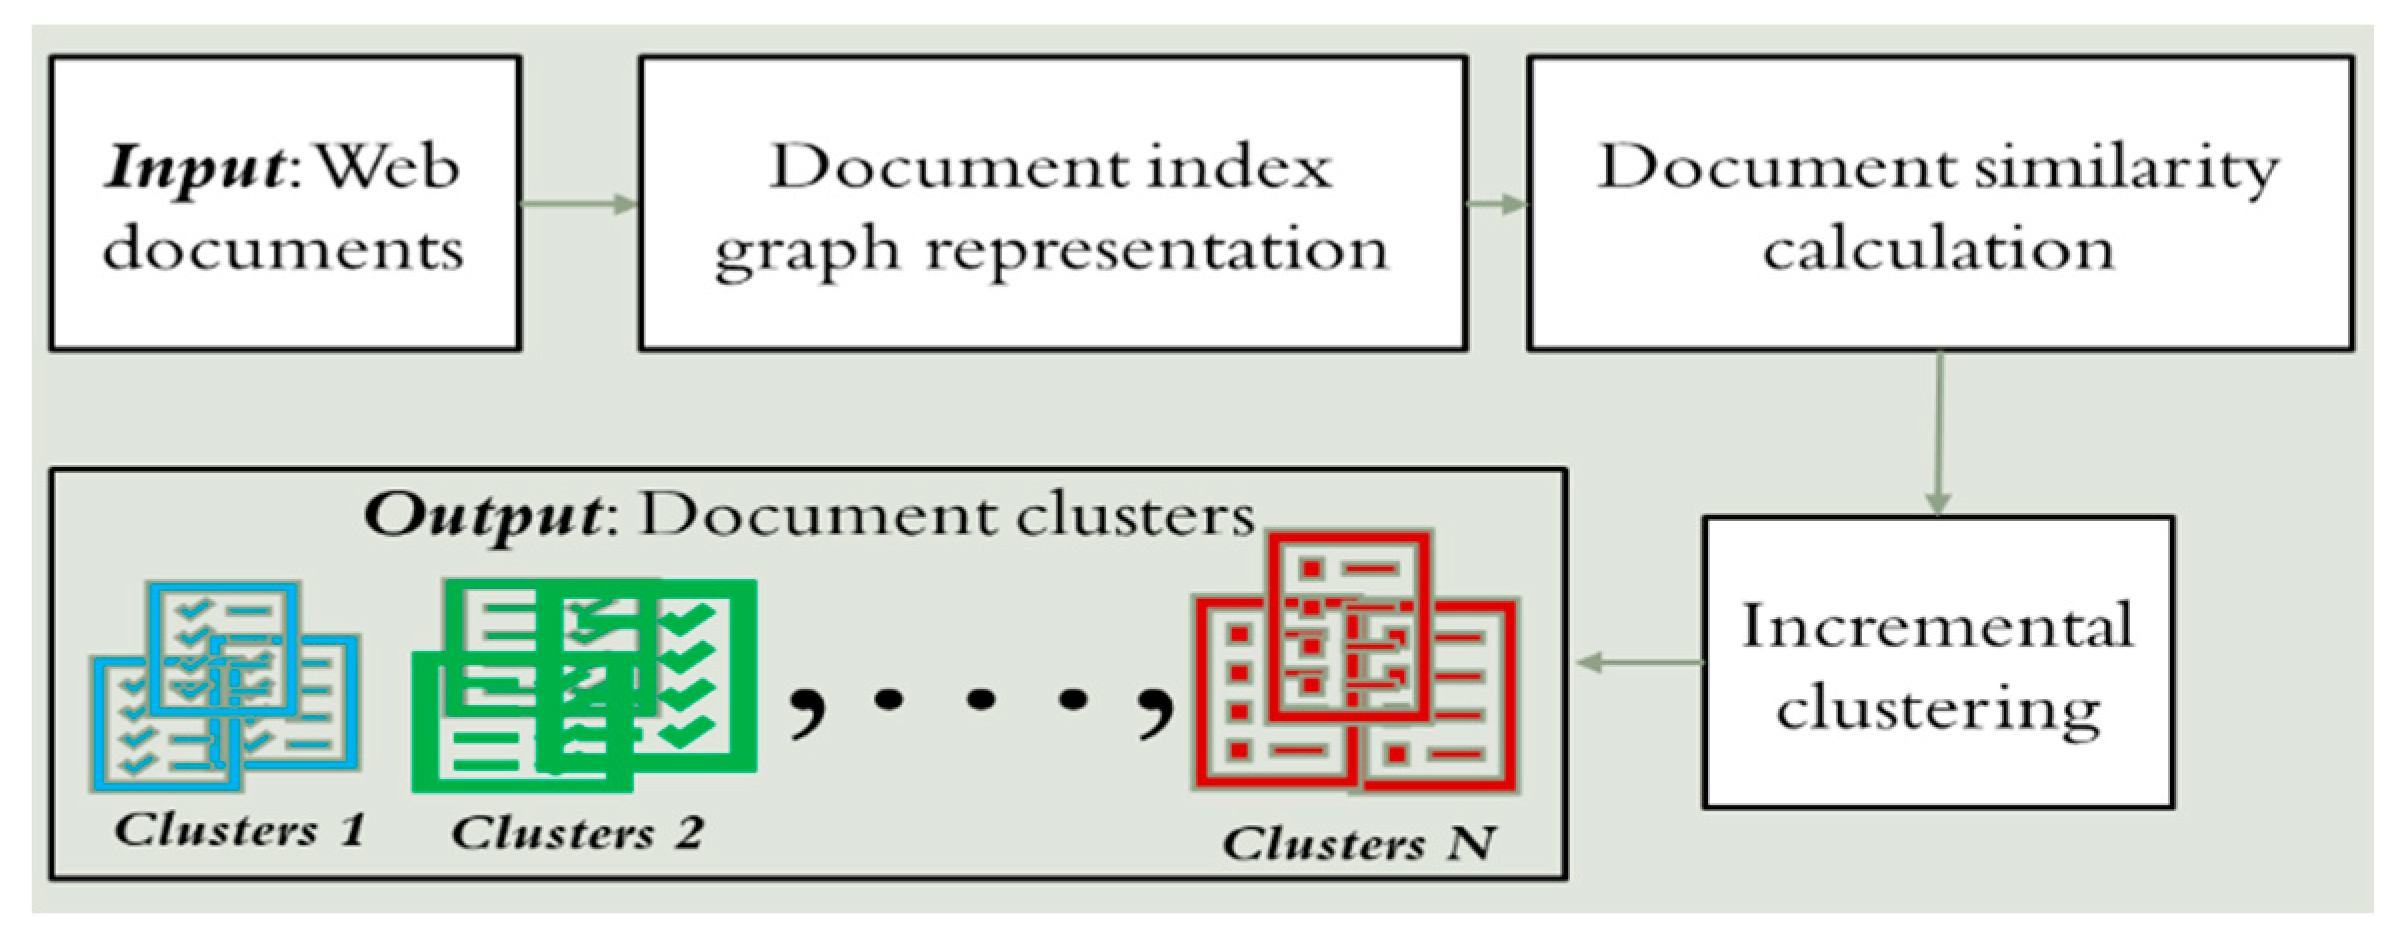
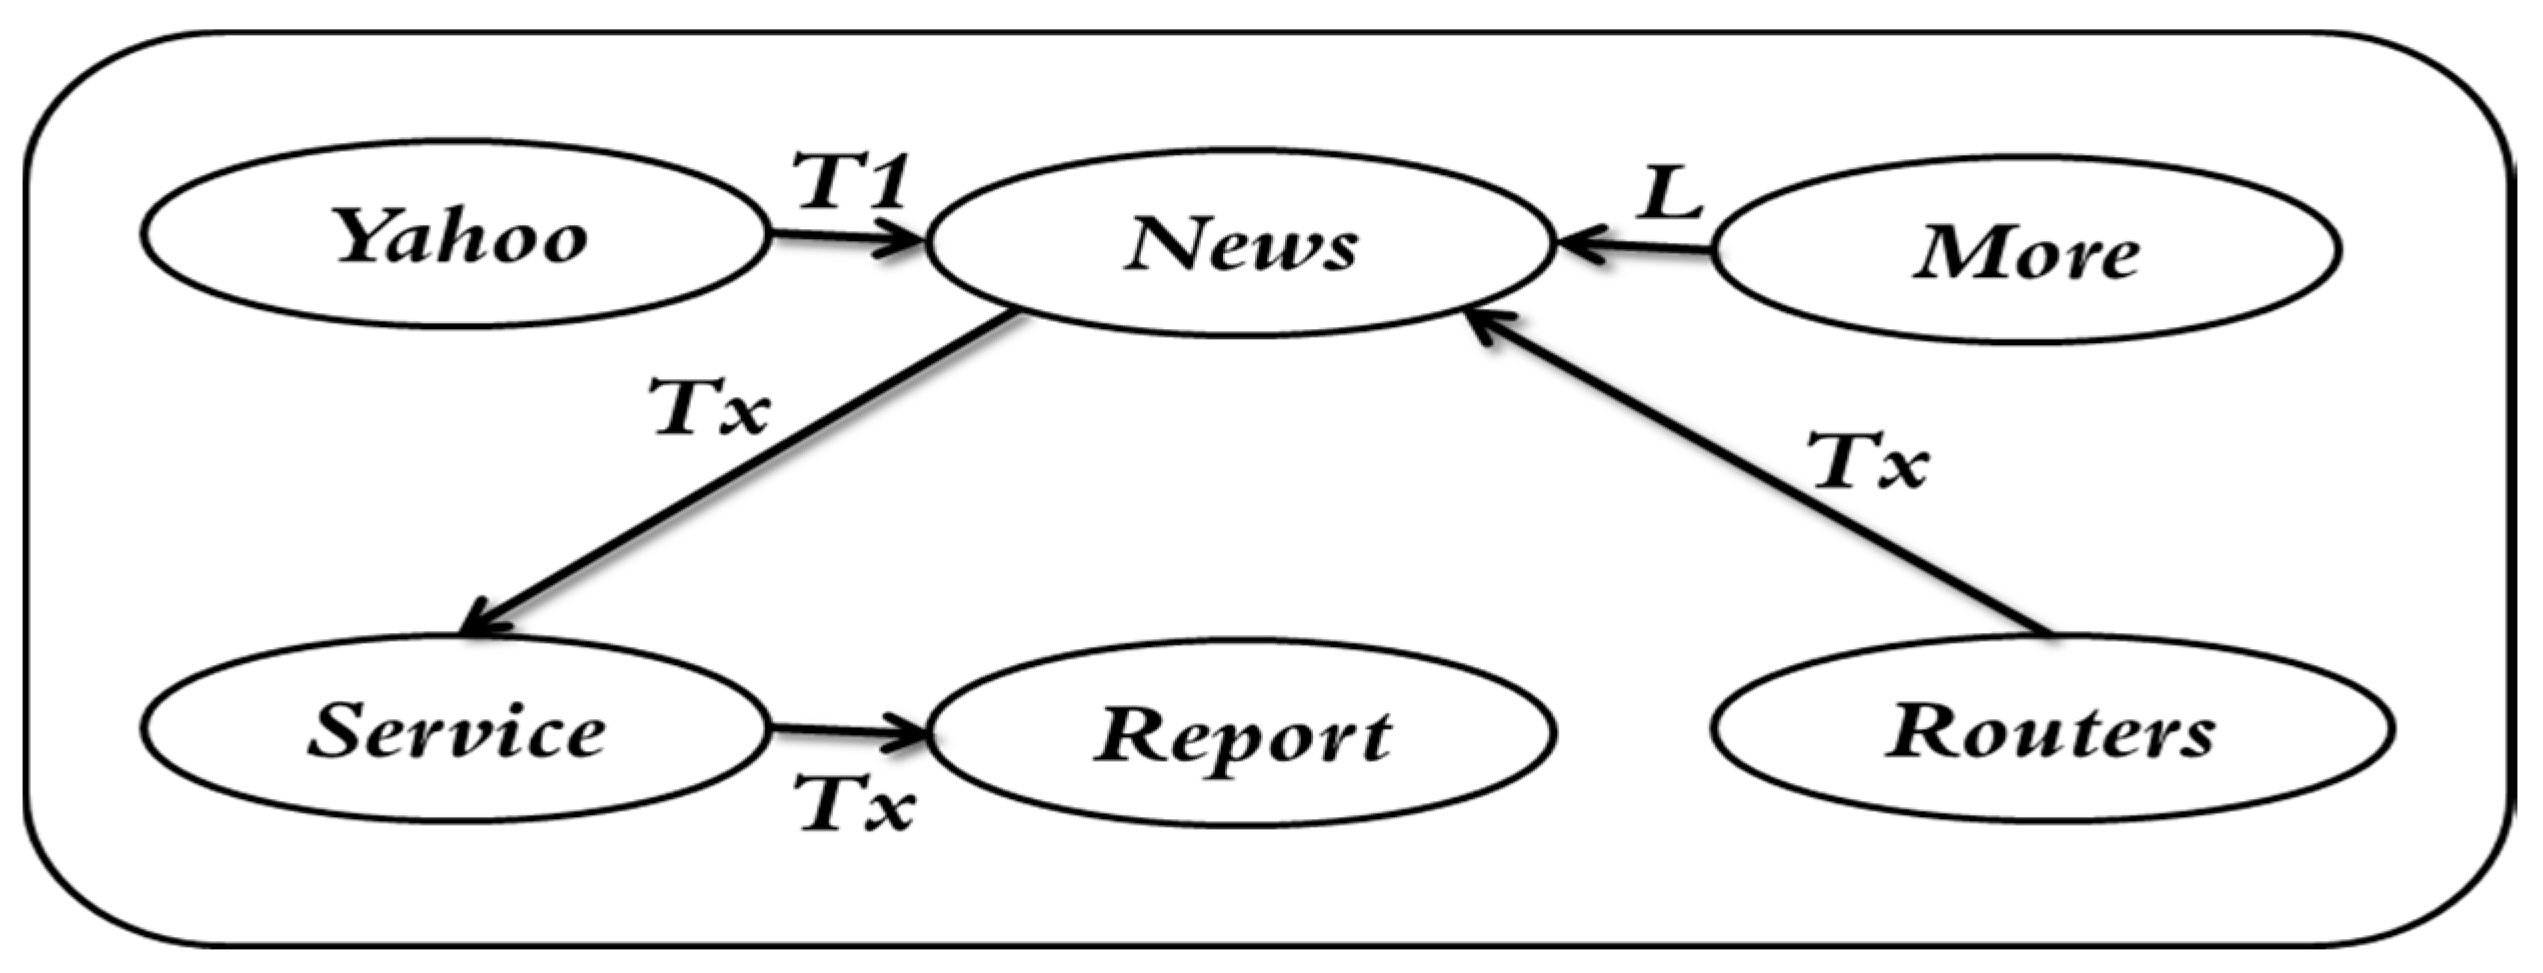
2.5. Web Documents Clustering Using Graph Theory Concepts
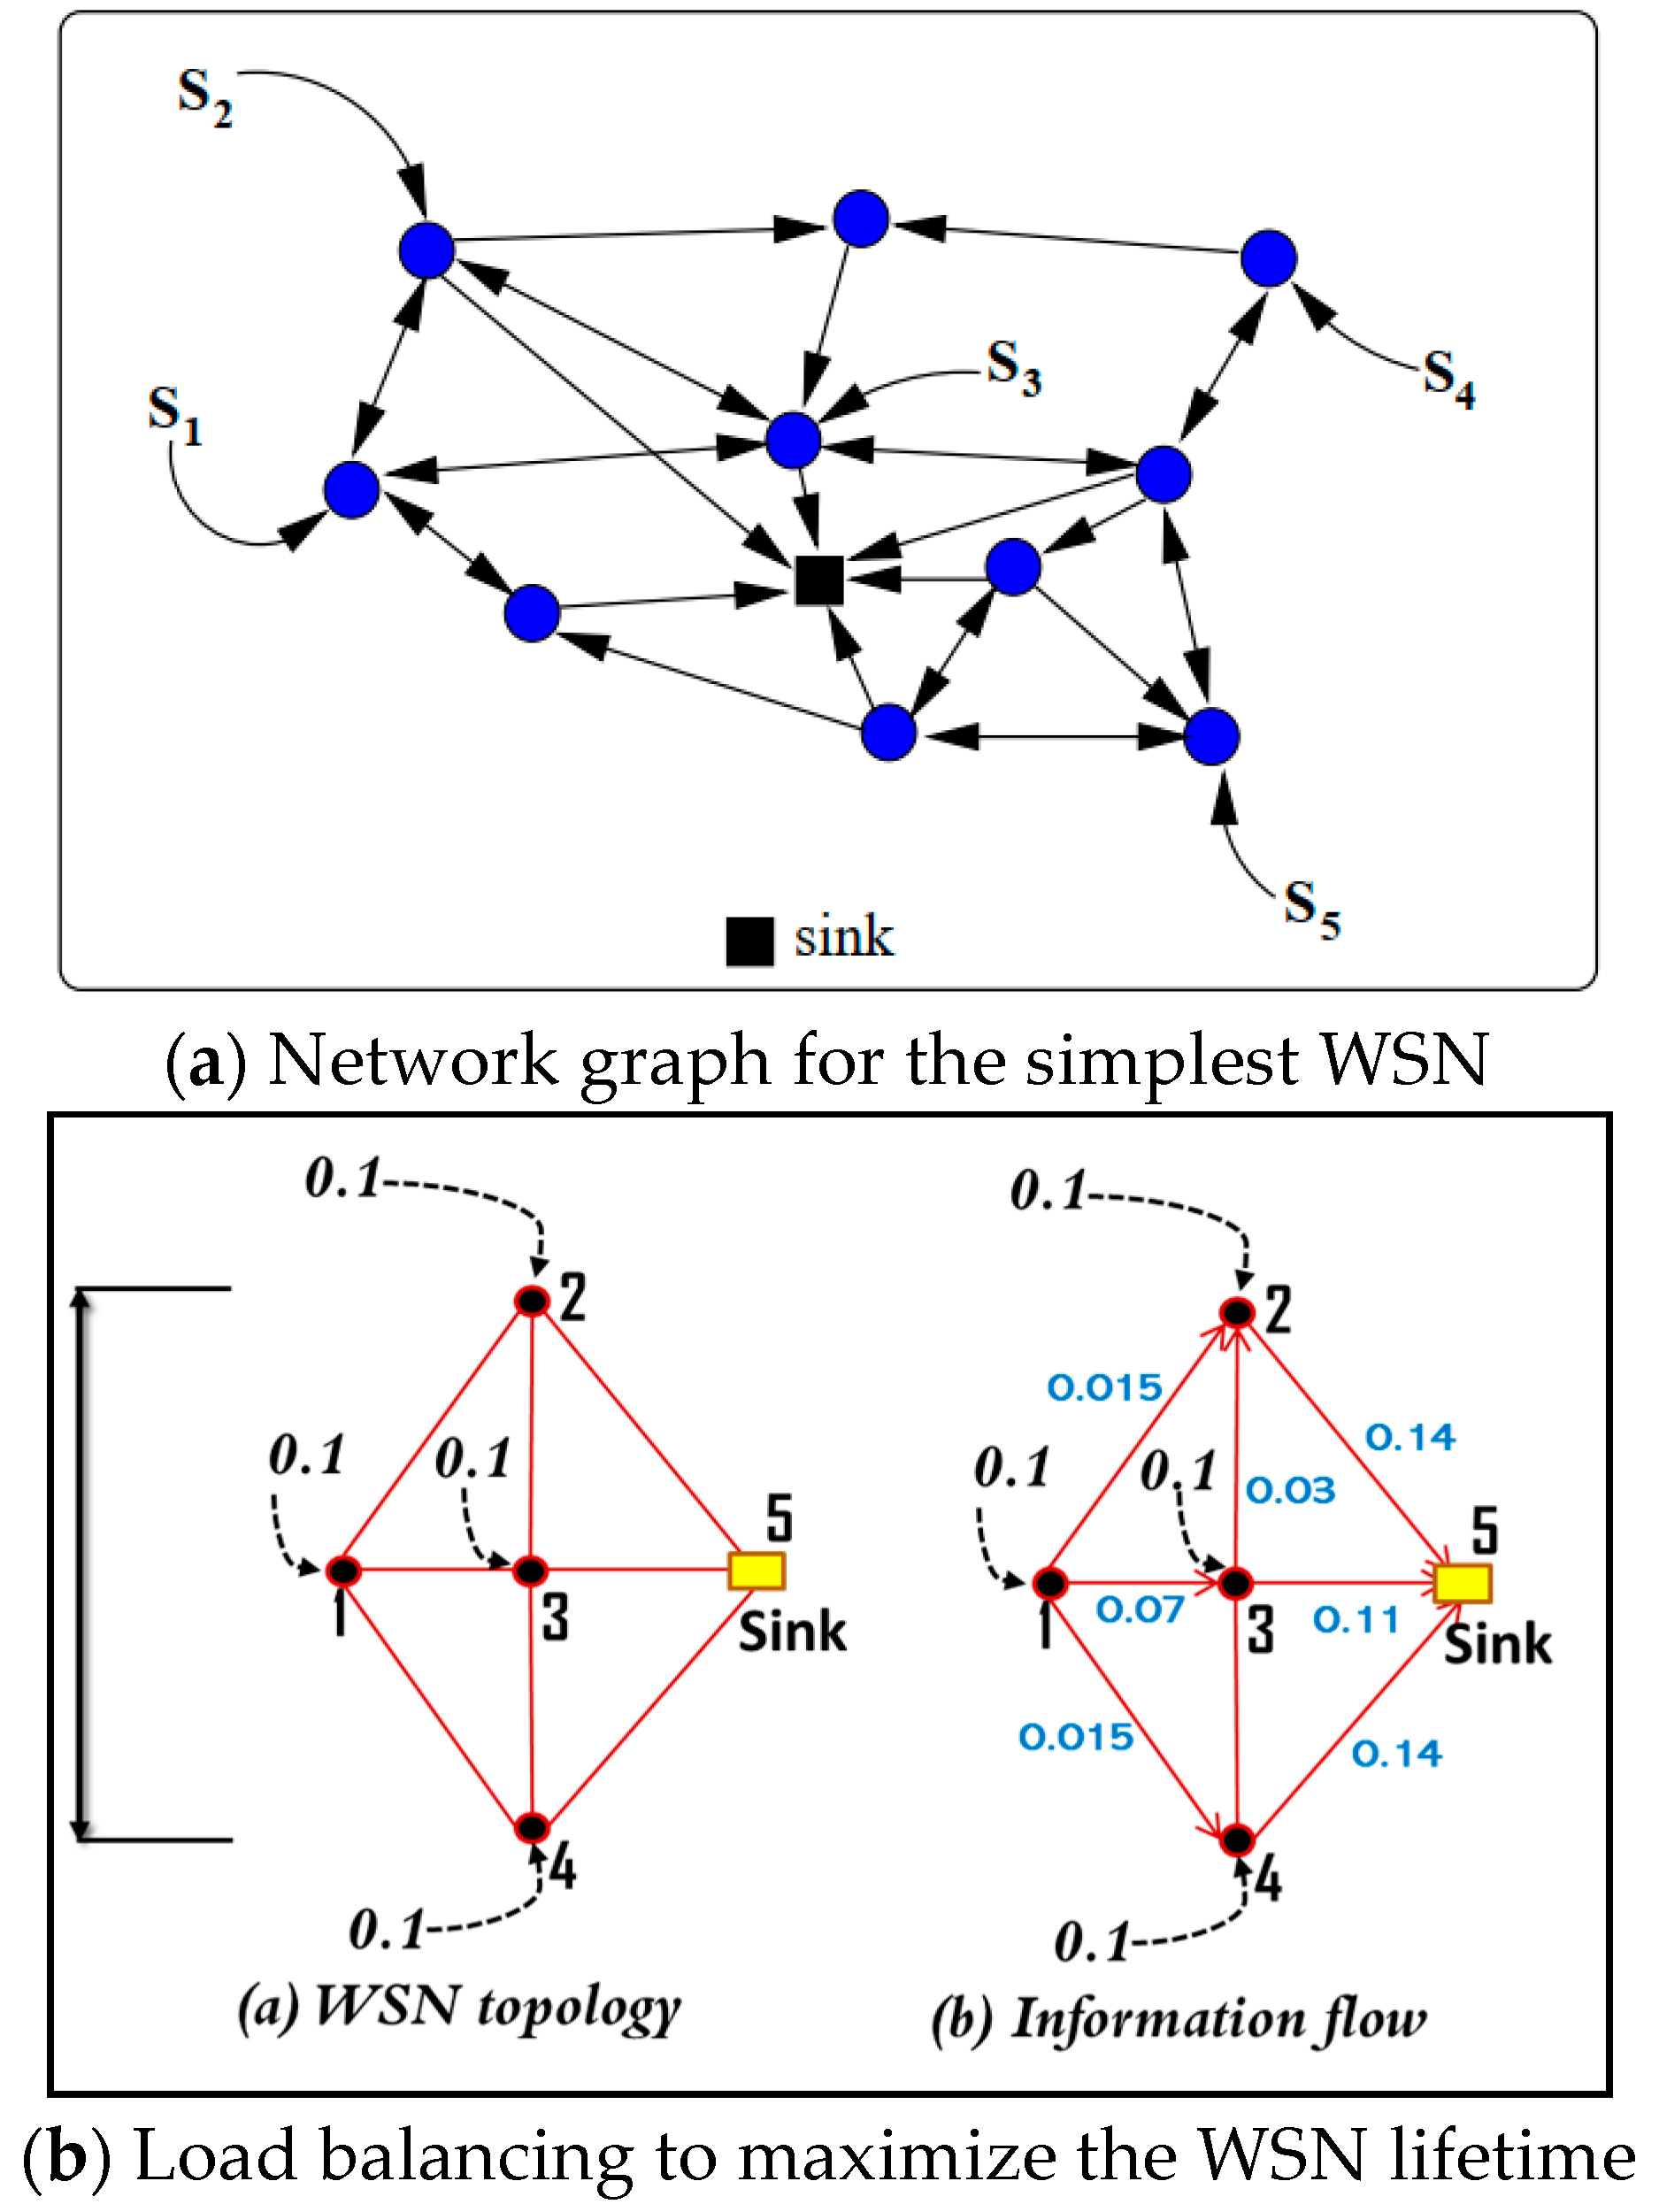
2.6. Representing/Modelling Wireless Sensor Network as a Graph
2.7. Uses of the Graph Theory in Operational Research Problems
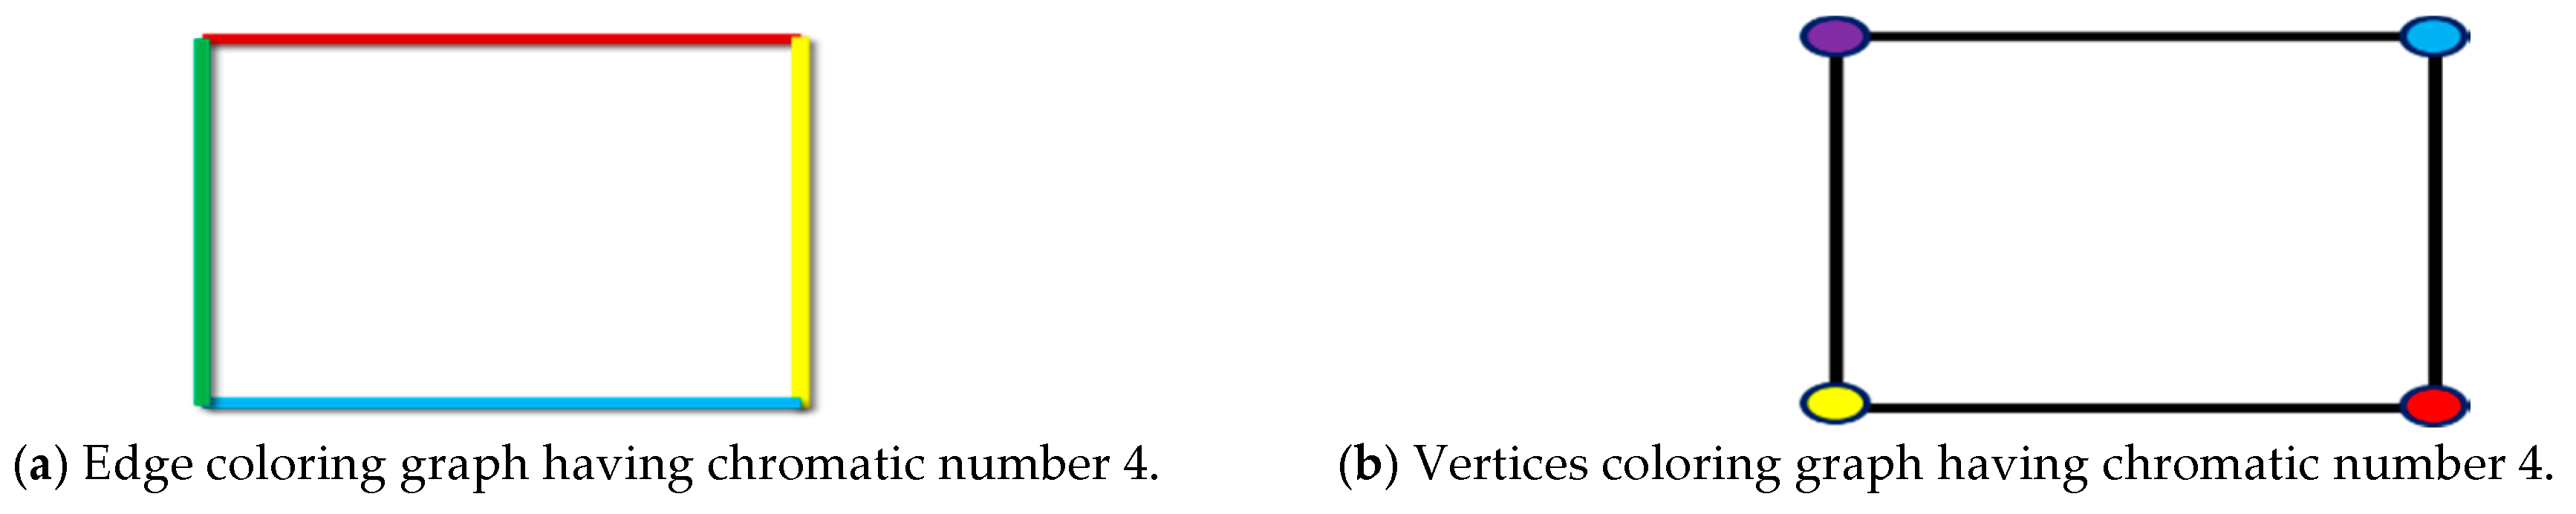
2.7.1. Use of Graph Coloring
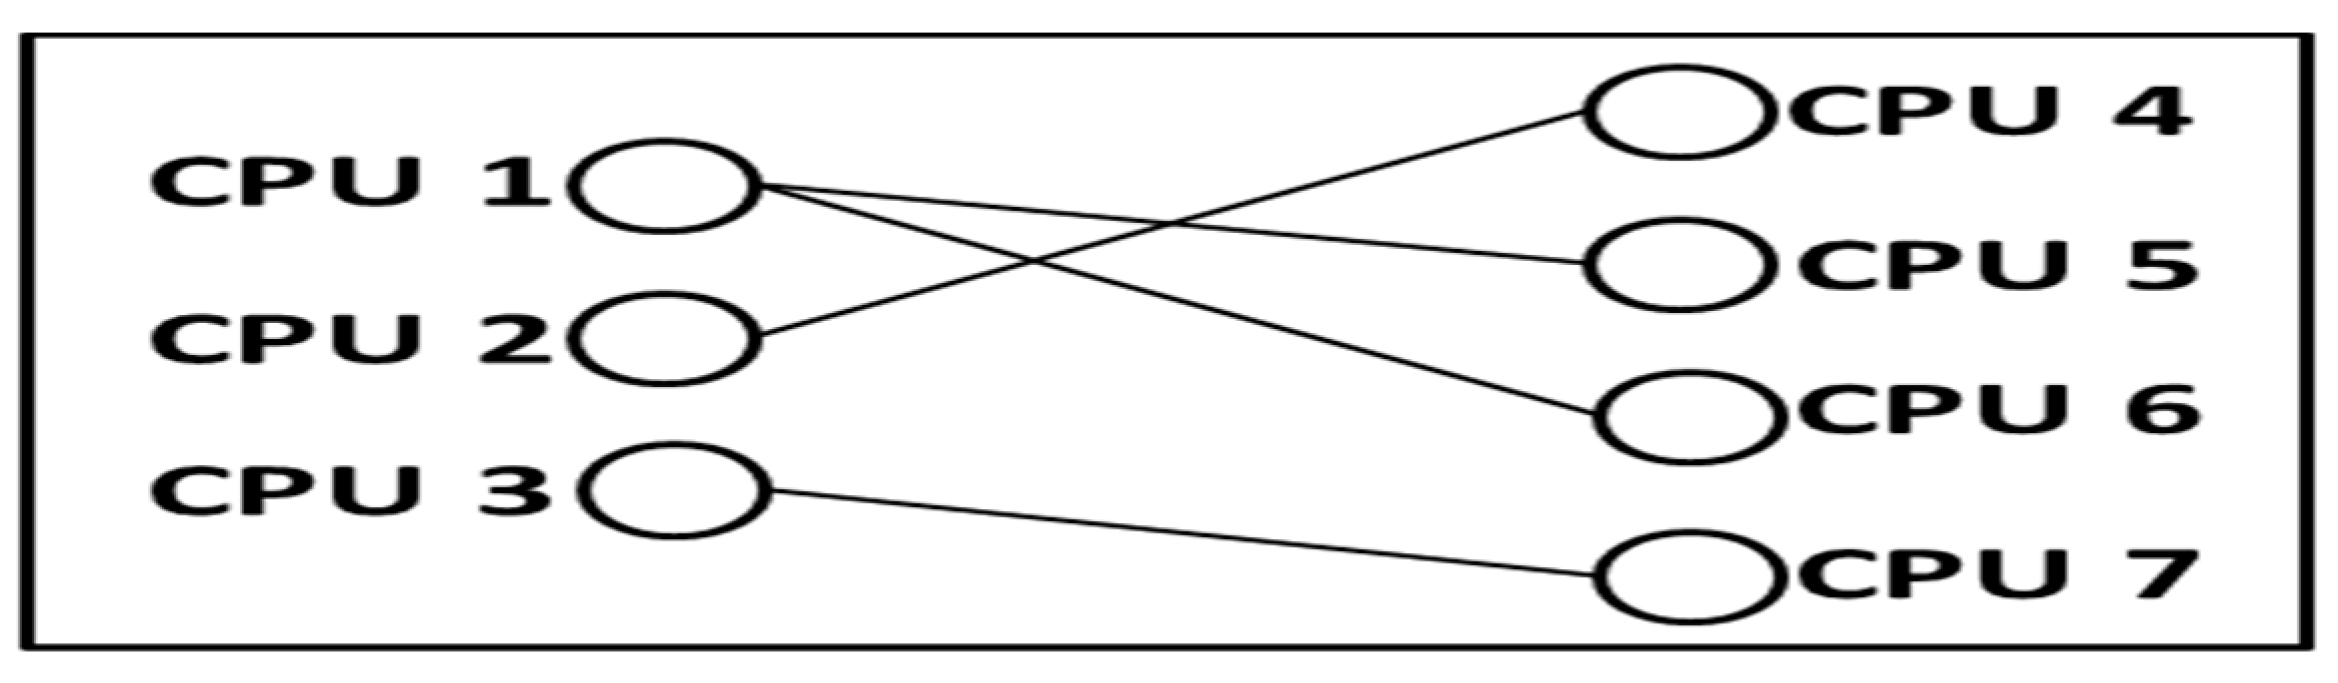
2.7.2. Applications of Graph Theory in Scheduling-Related Problems
2.8. Applications of Graph Theory in the Internet of Things (IoT)
2.9. Uses of Graphs in a Blockchin and Related Technologies
2.10. Uses of Graph Theory in a Computer Vision Domain/Applications
3. Applications of the Graph Theory in Social Networks (SN)
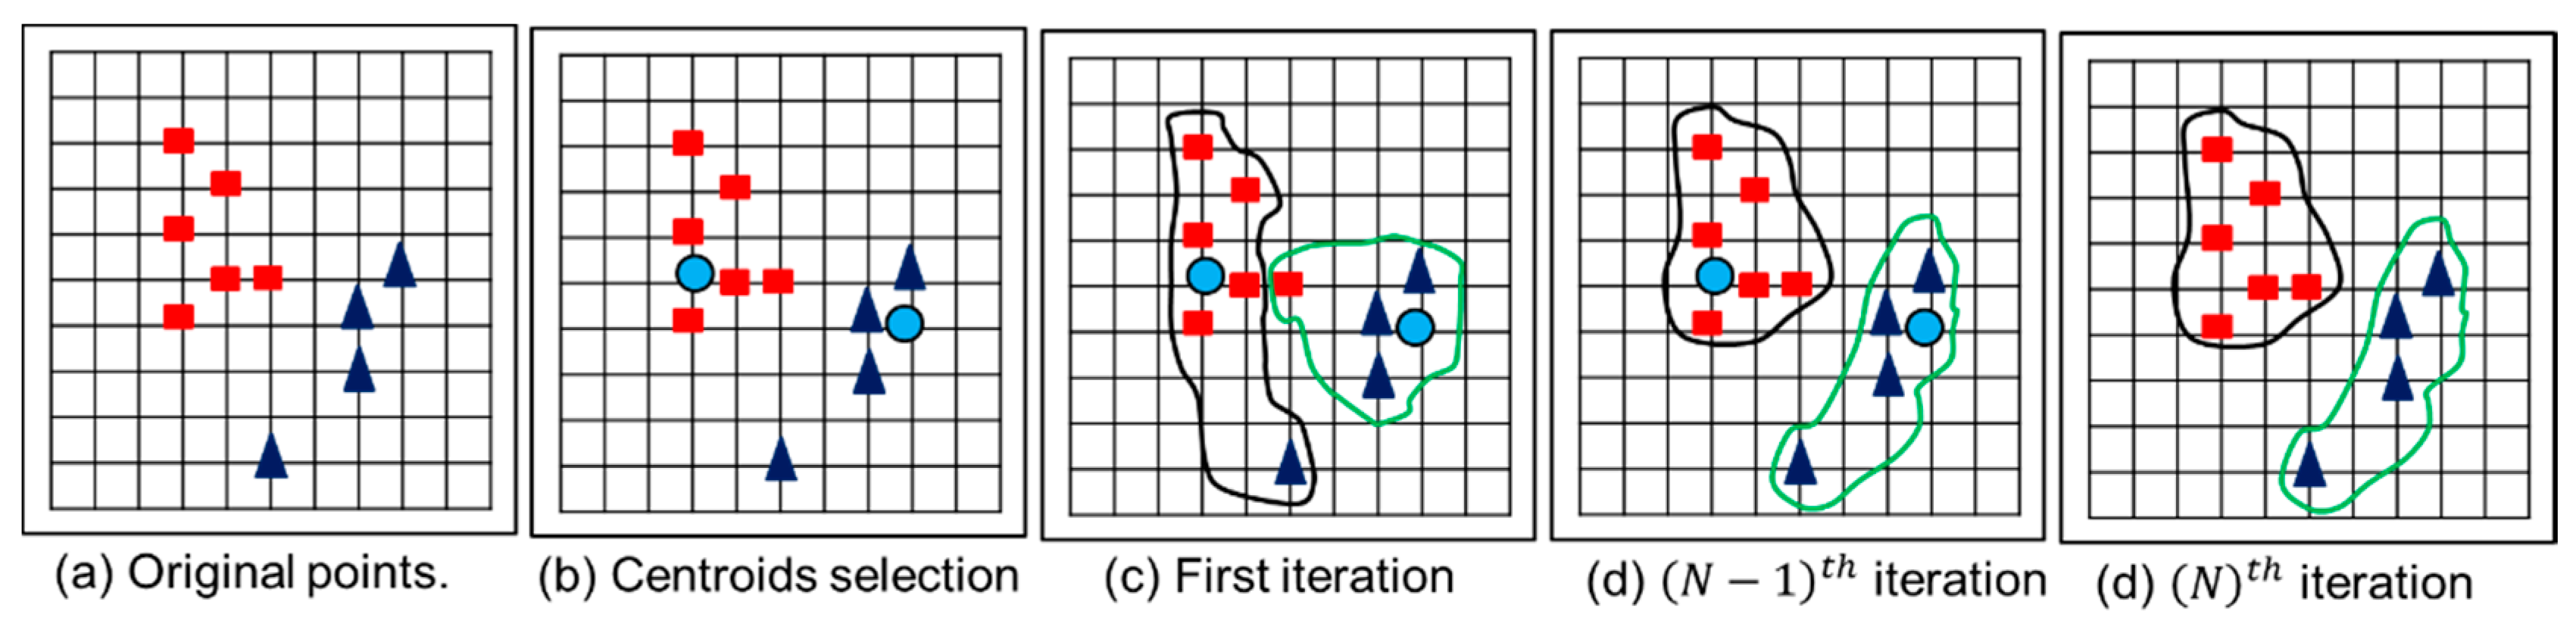
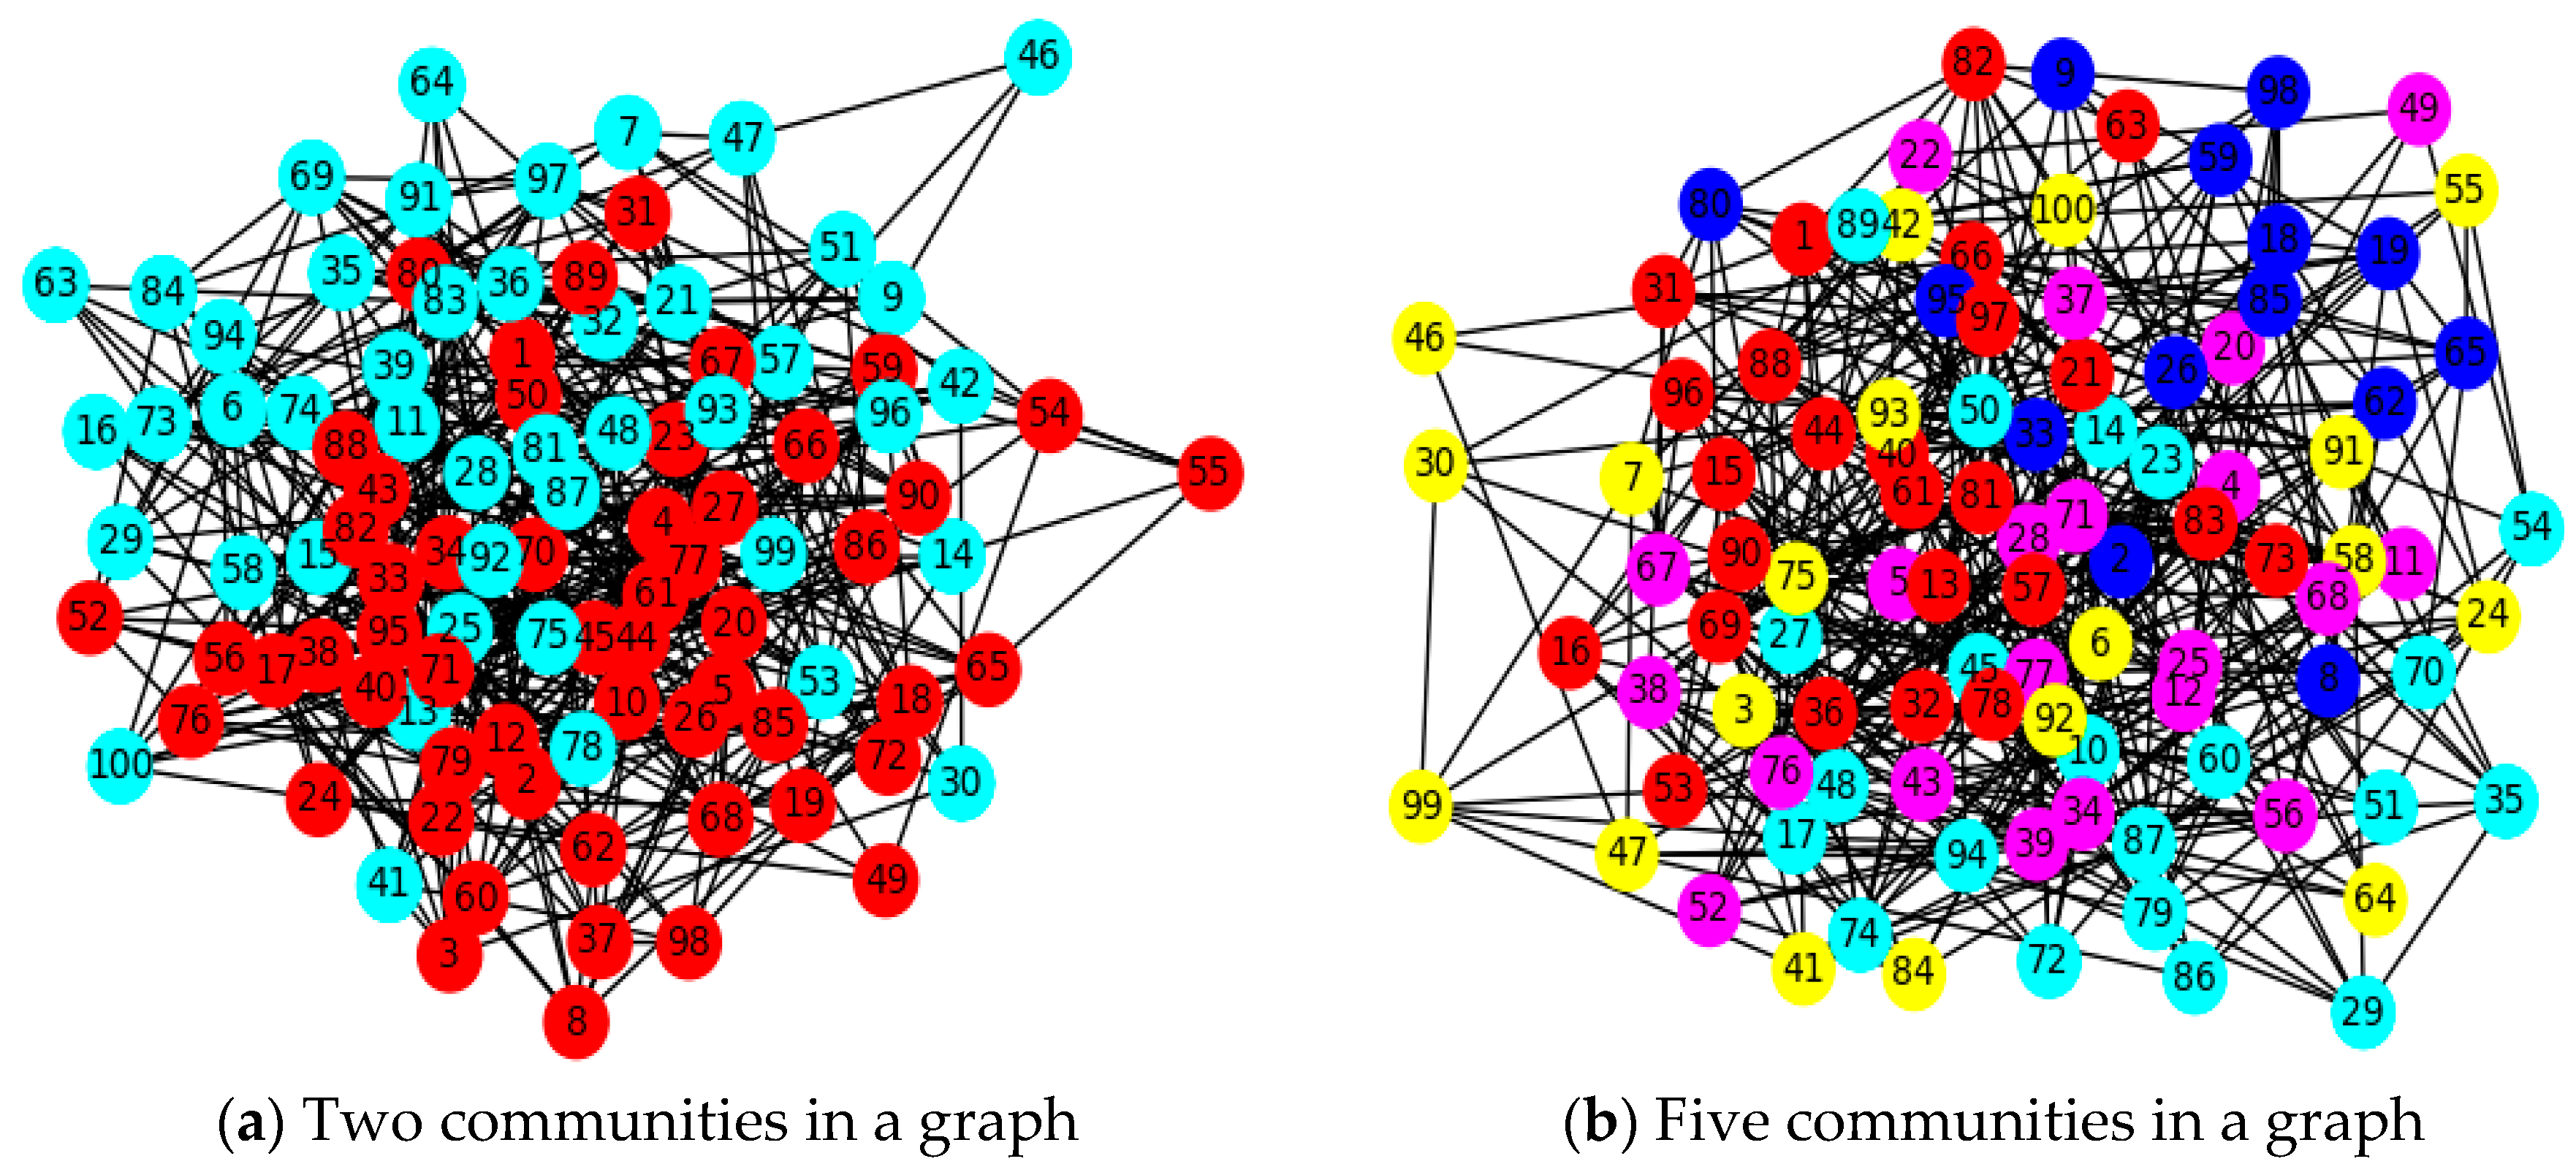
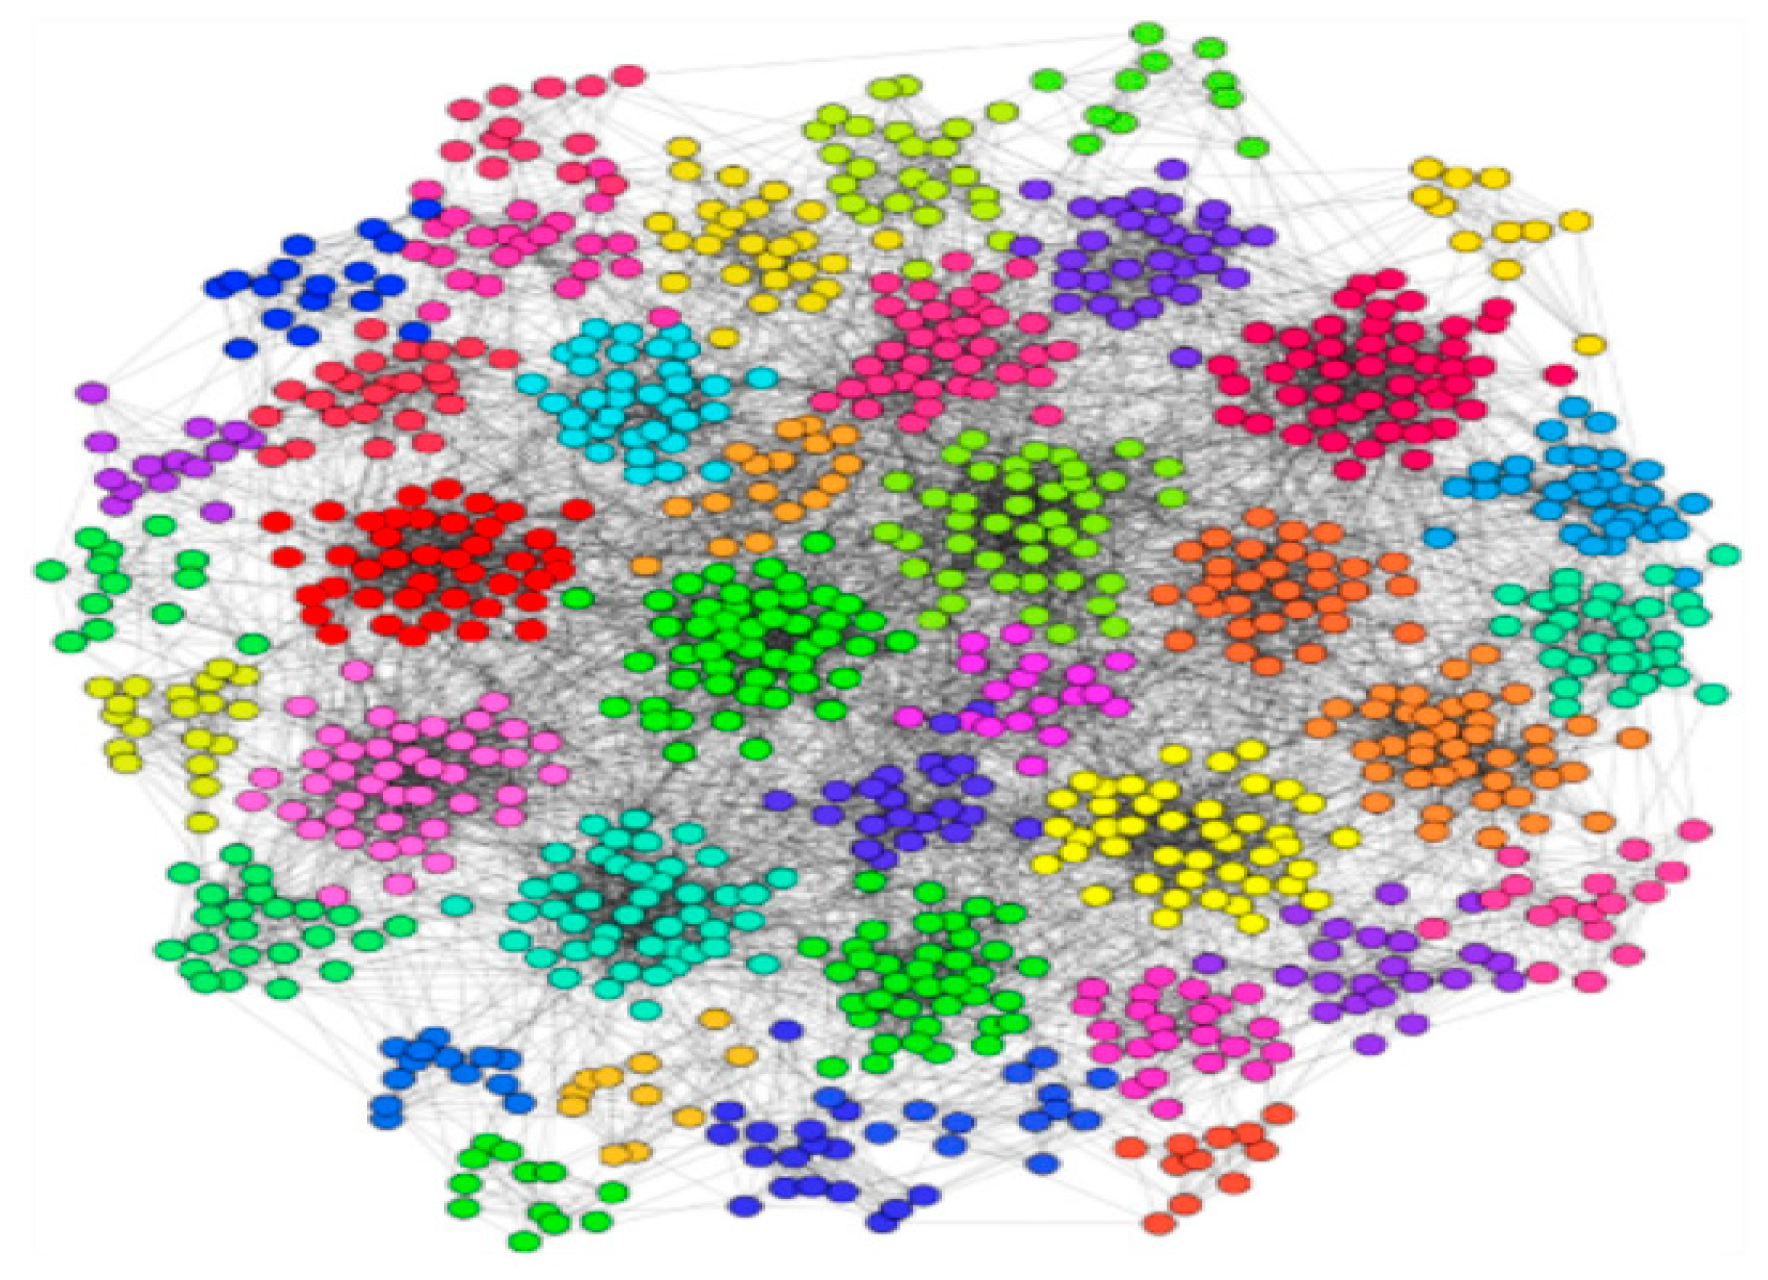
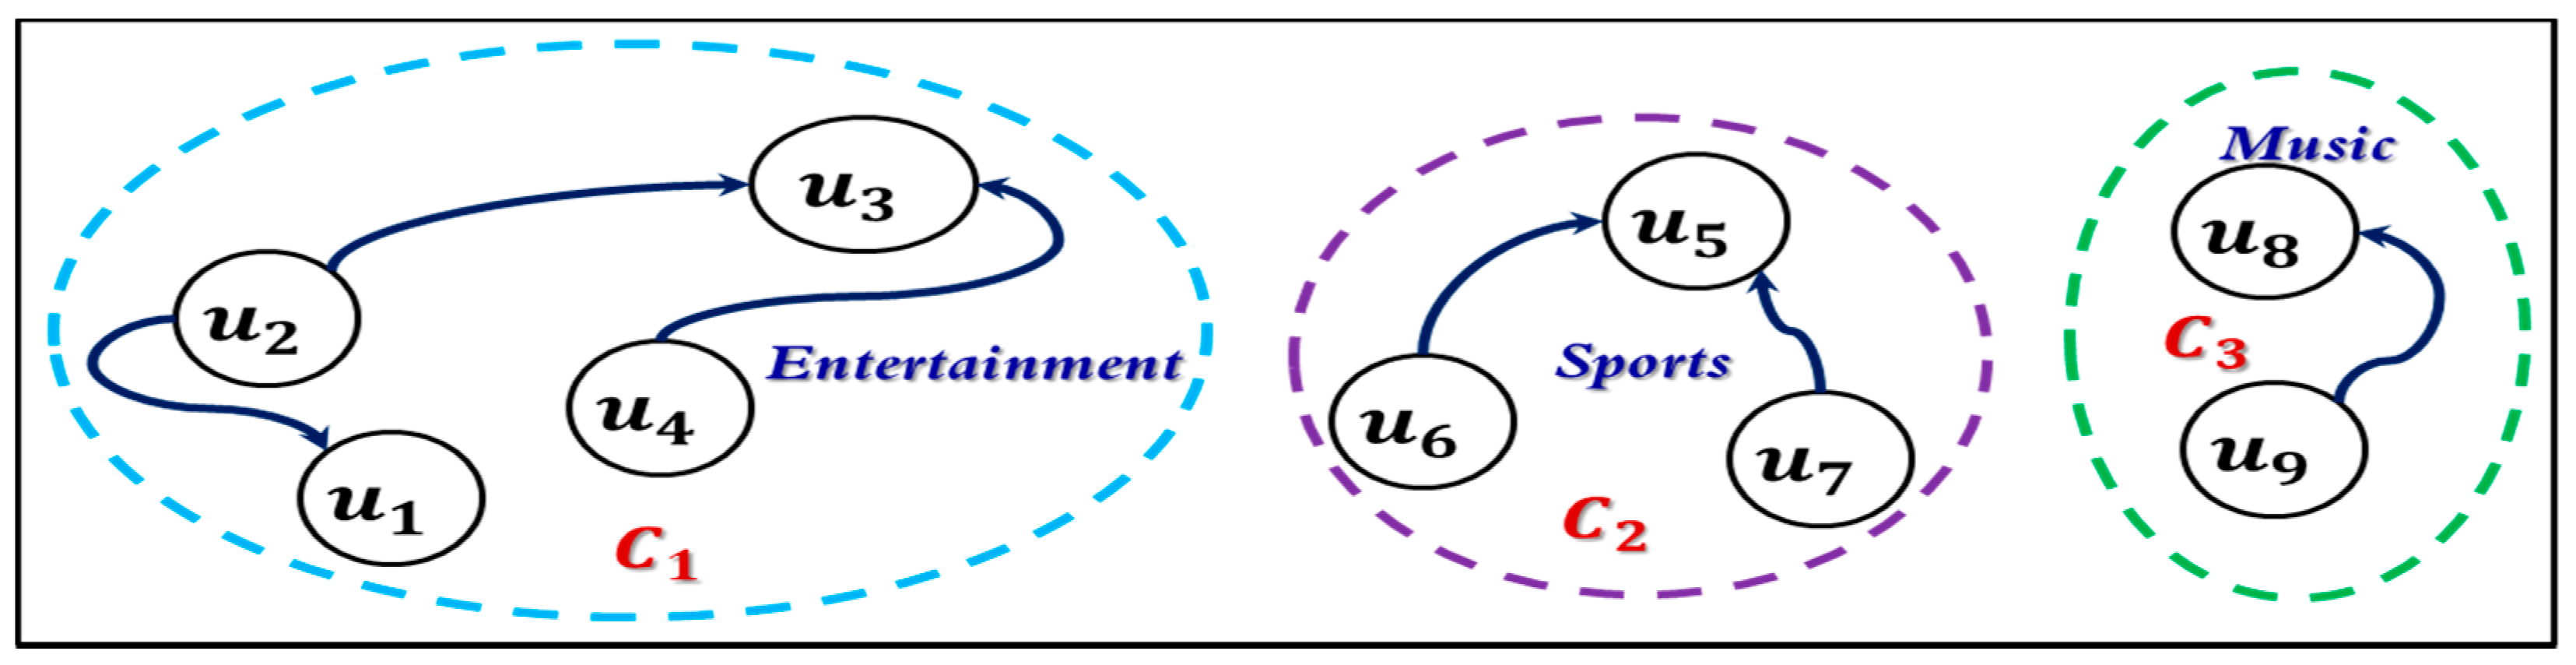
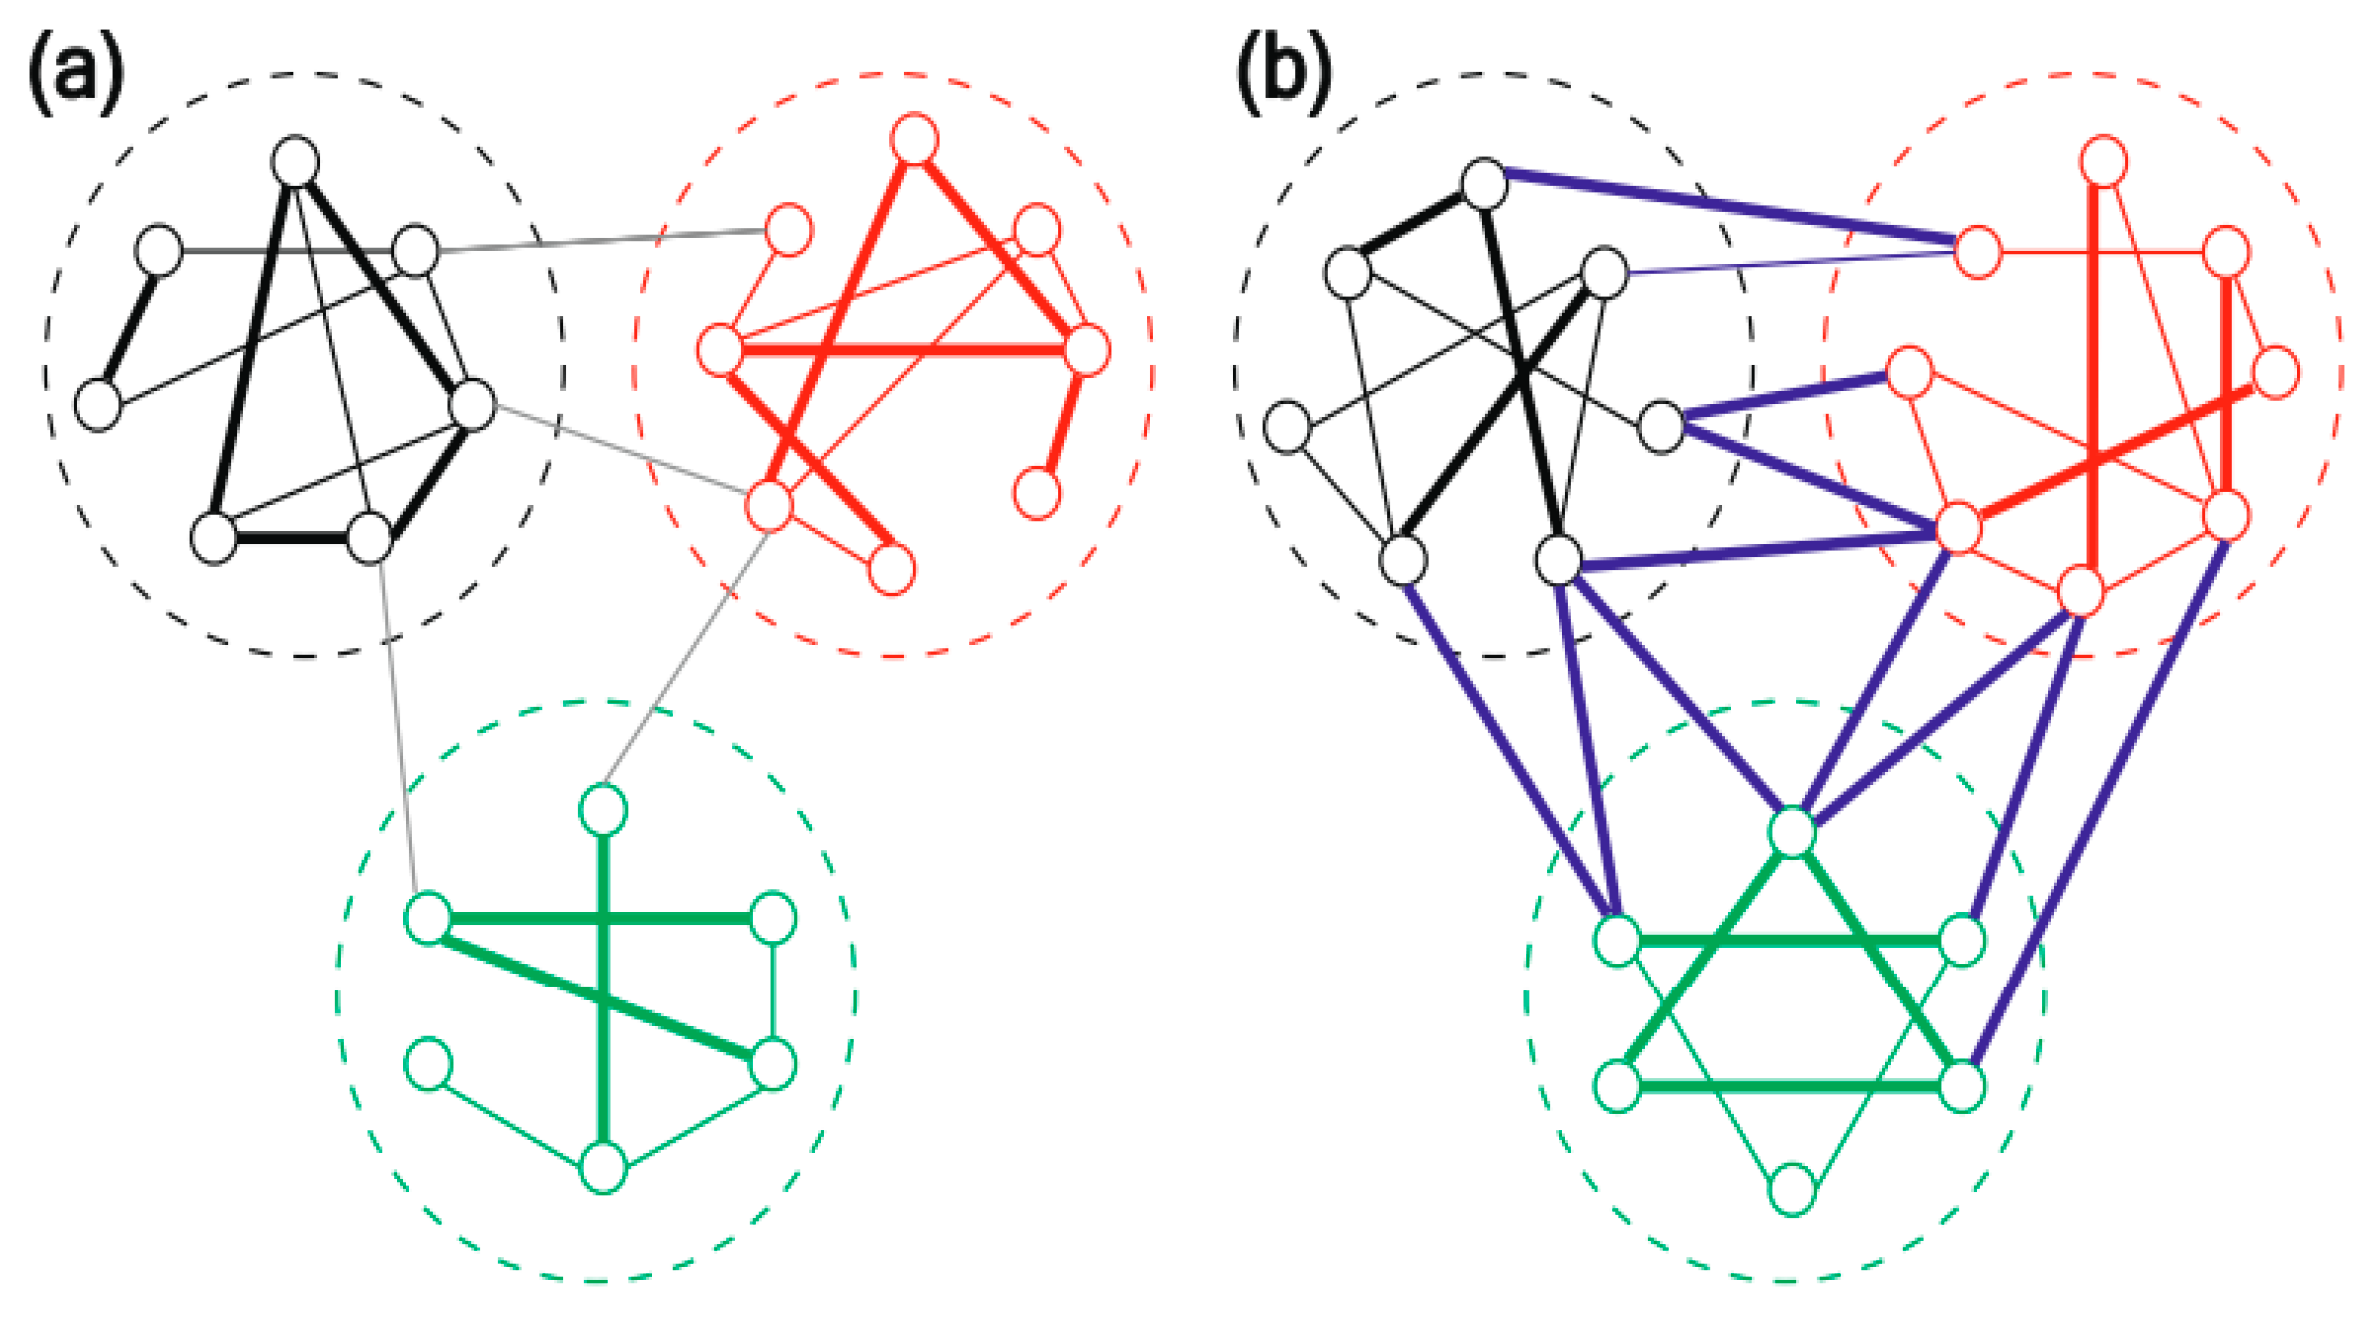
3.1. Use of Graphs for Community Clustering in a SN
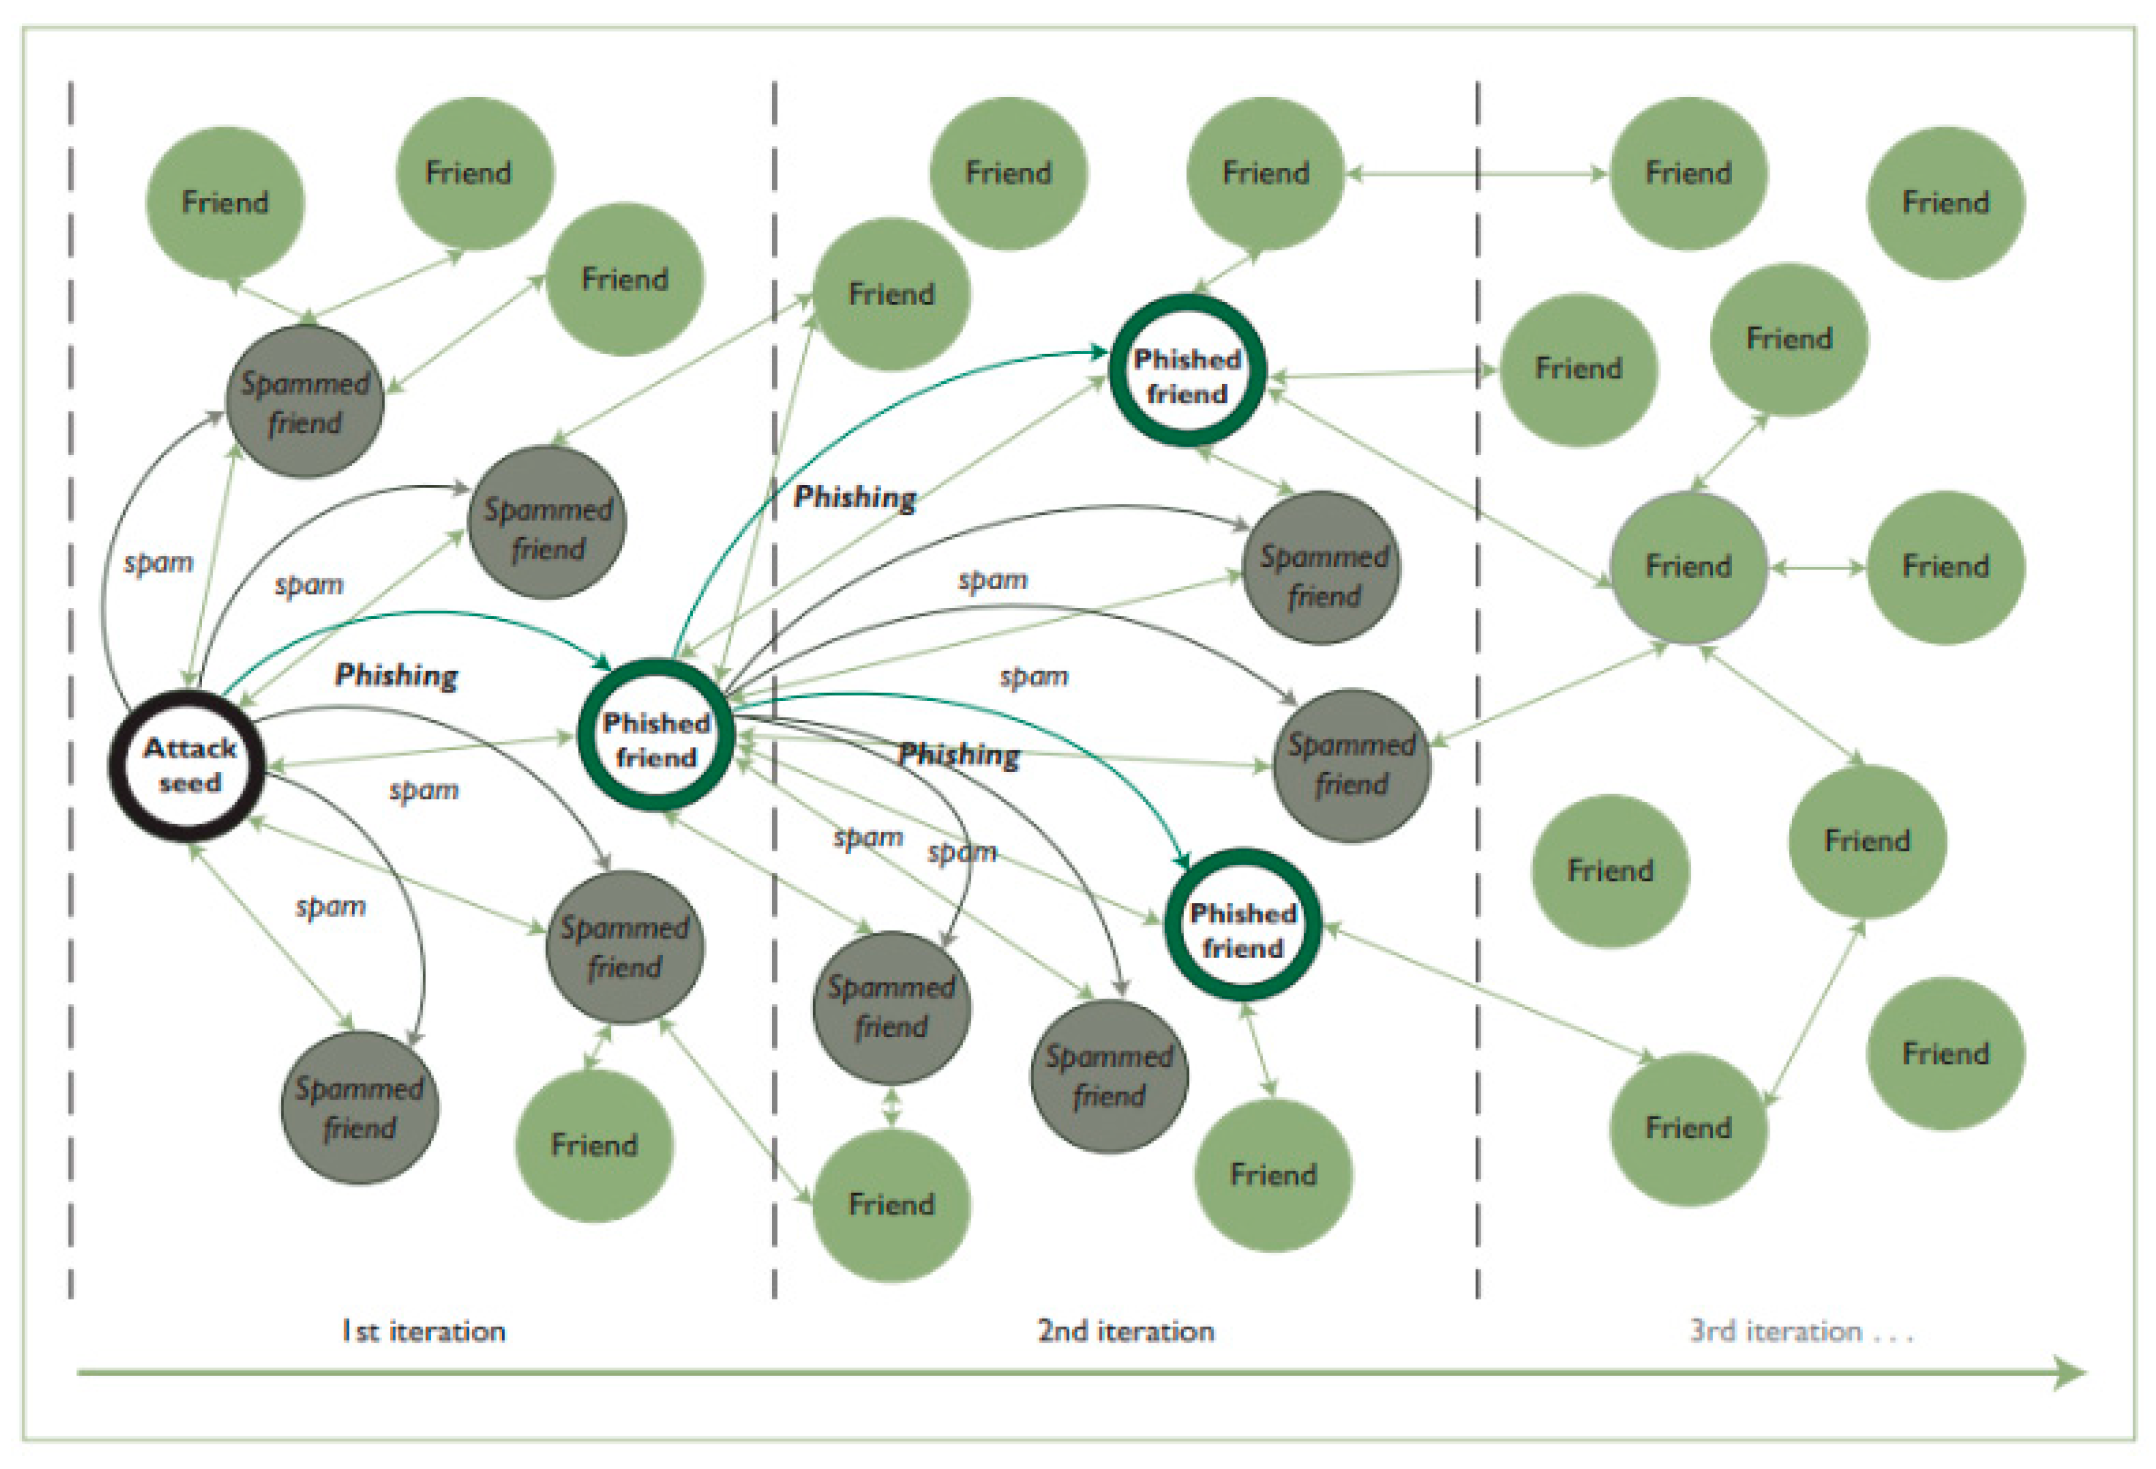
3.2. Use of Graphs for Information Diffusion in Social Networks
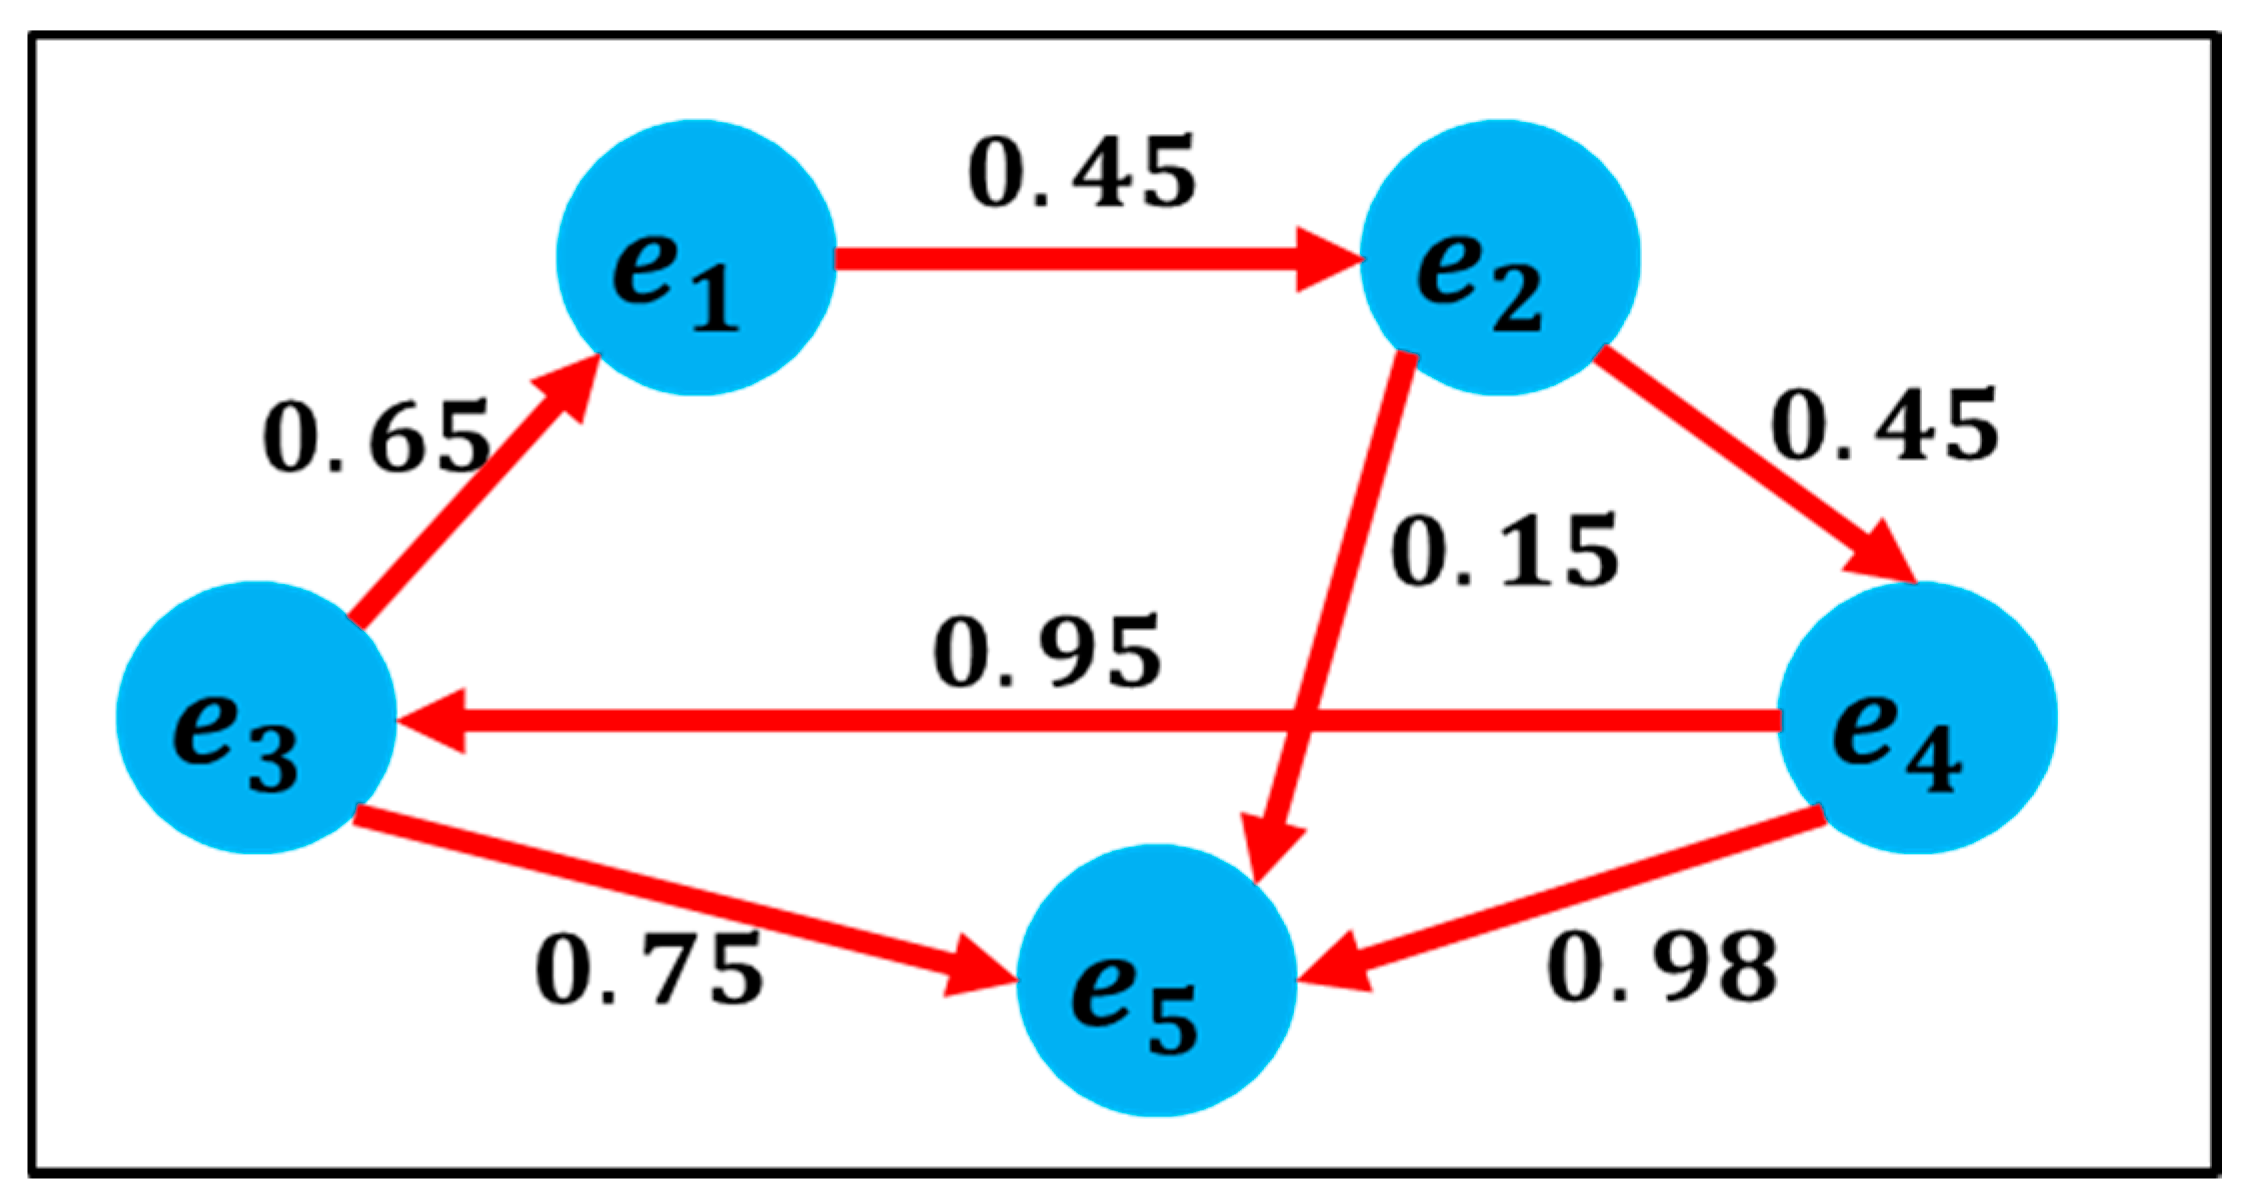
3.3. Users’ Influence/Trust Score Representation in a Social Networks Via Graphs
3.4. Similarity Modeling/Representing between Social Network Users via Graphs
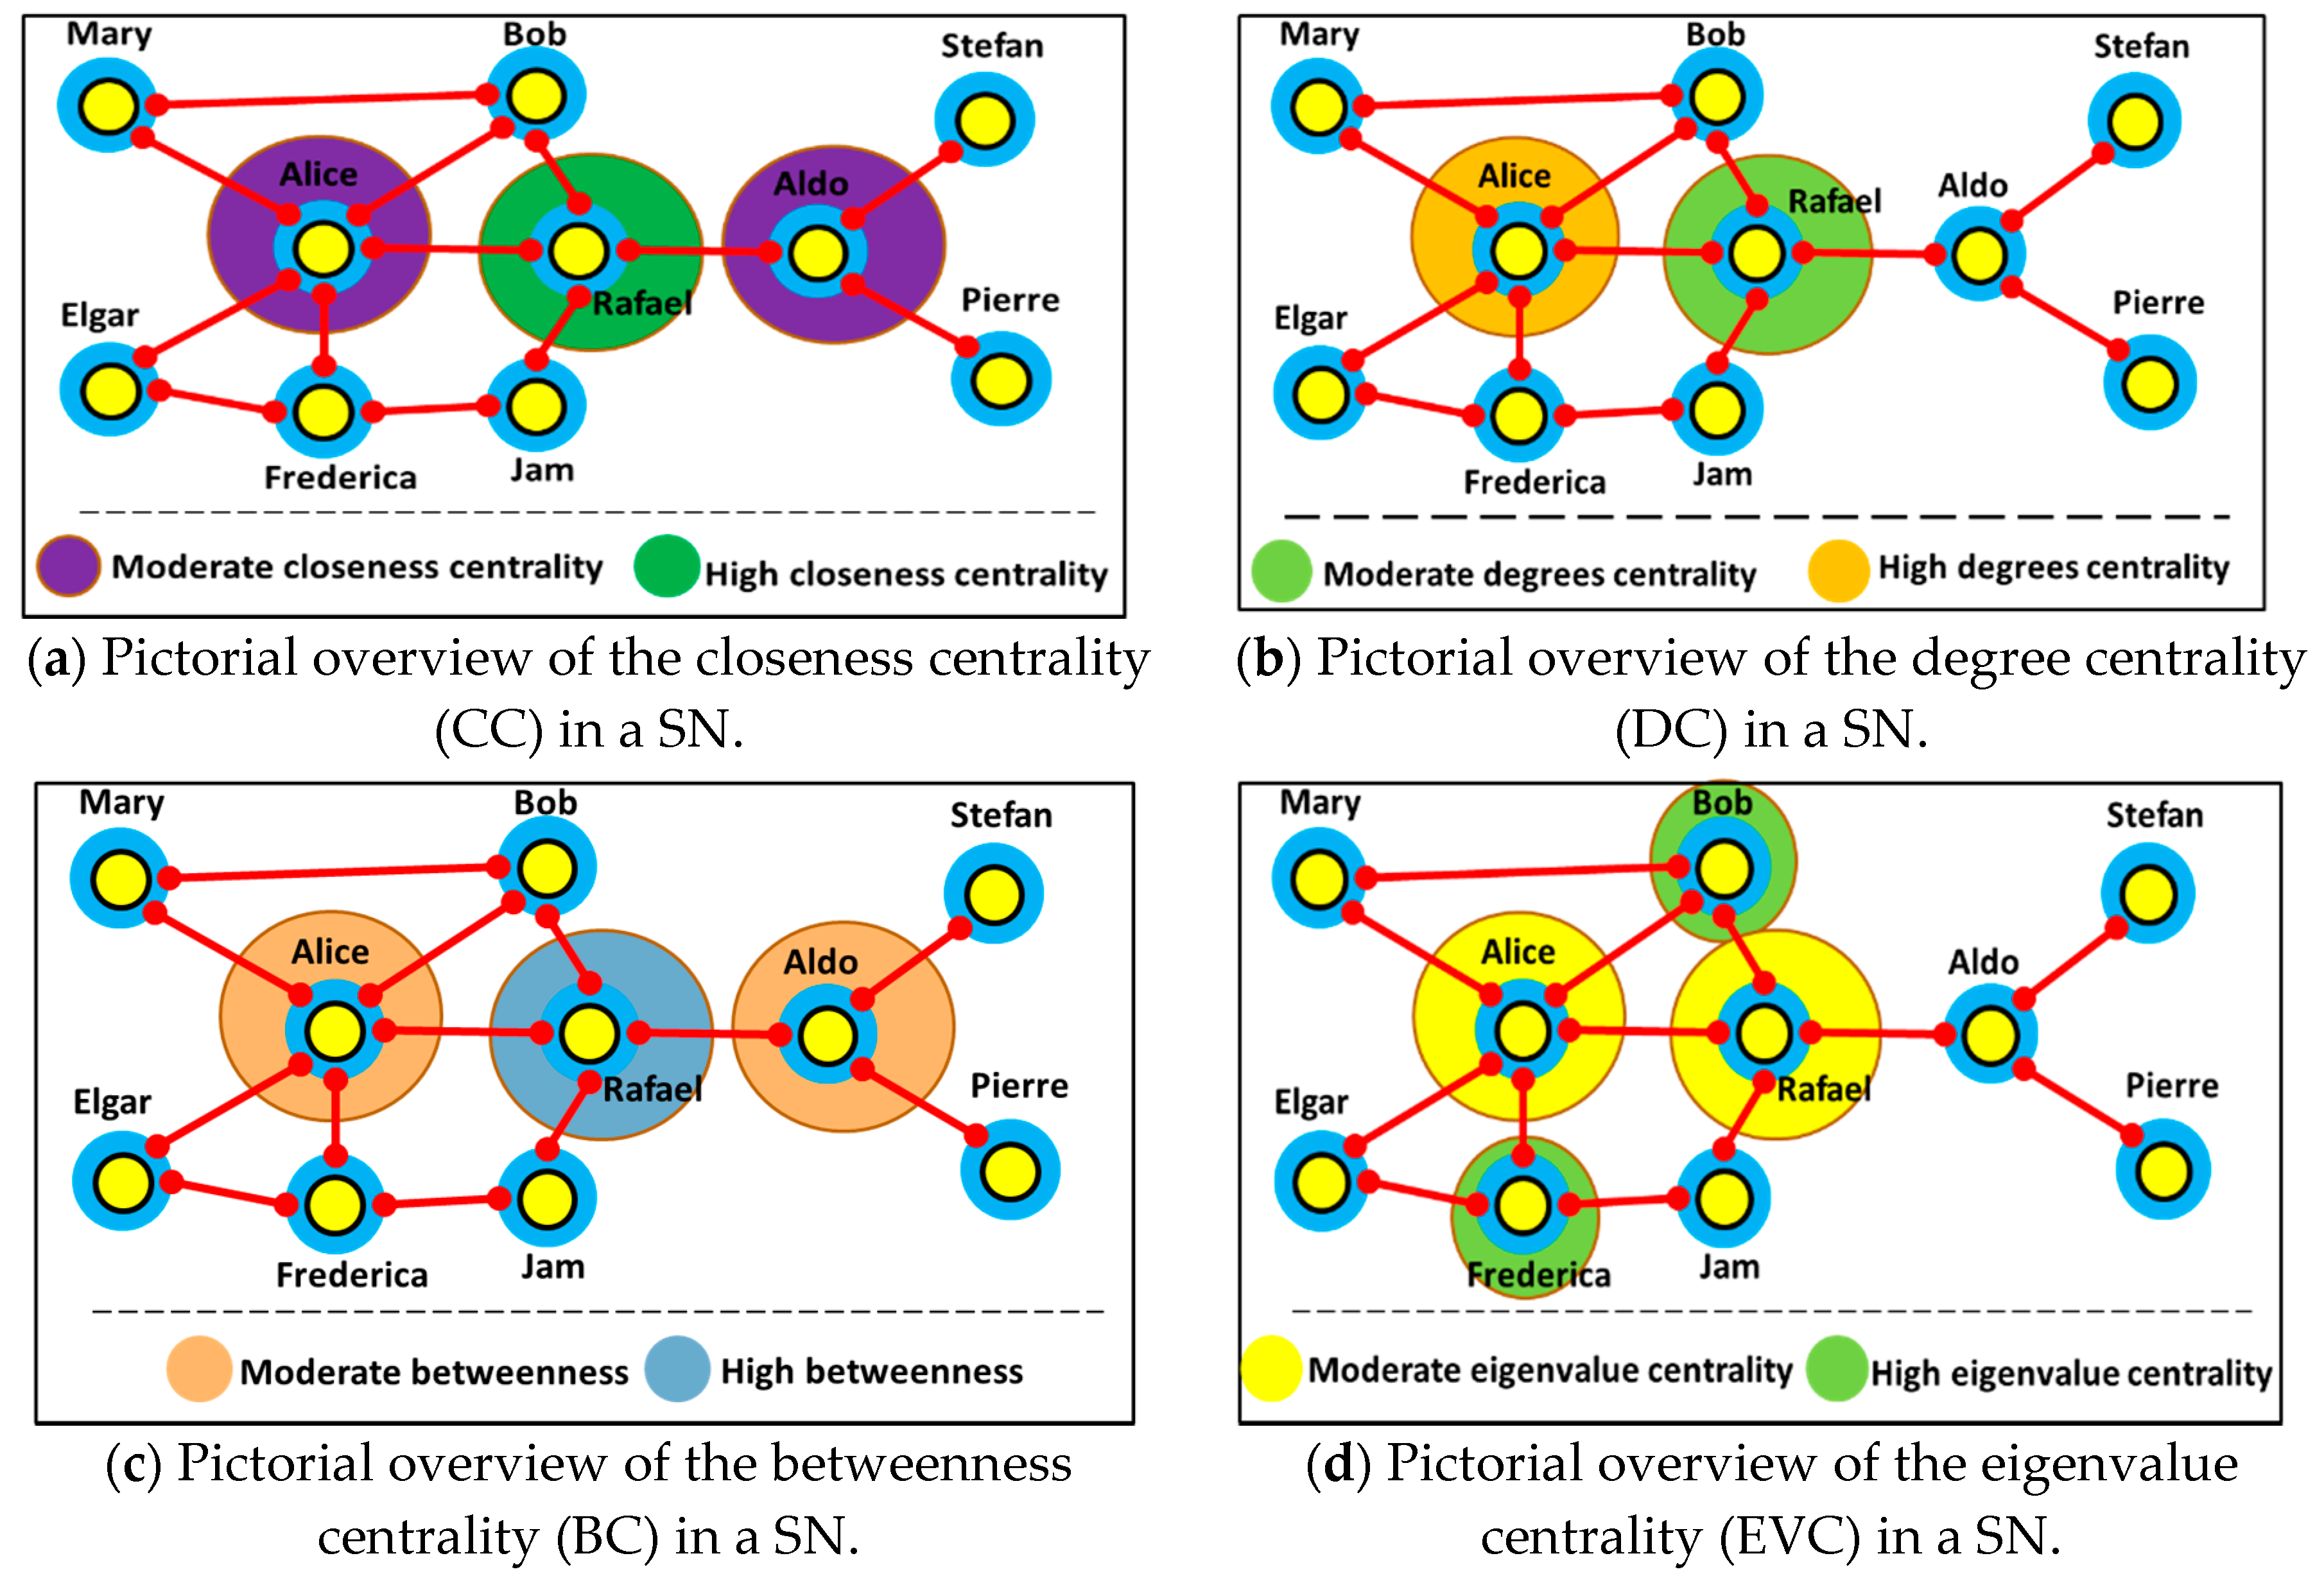
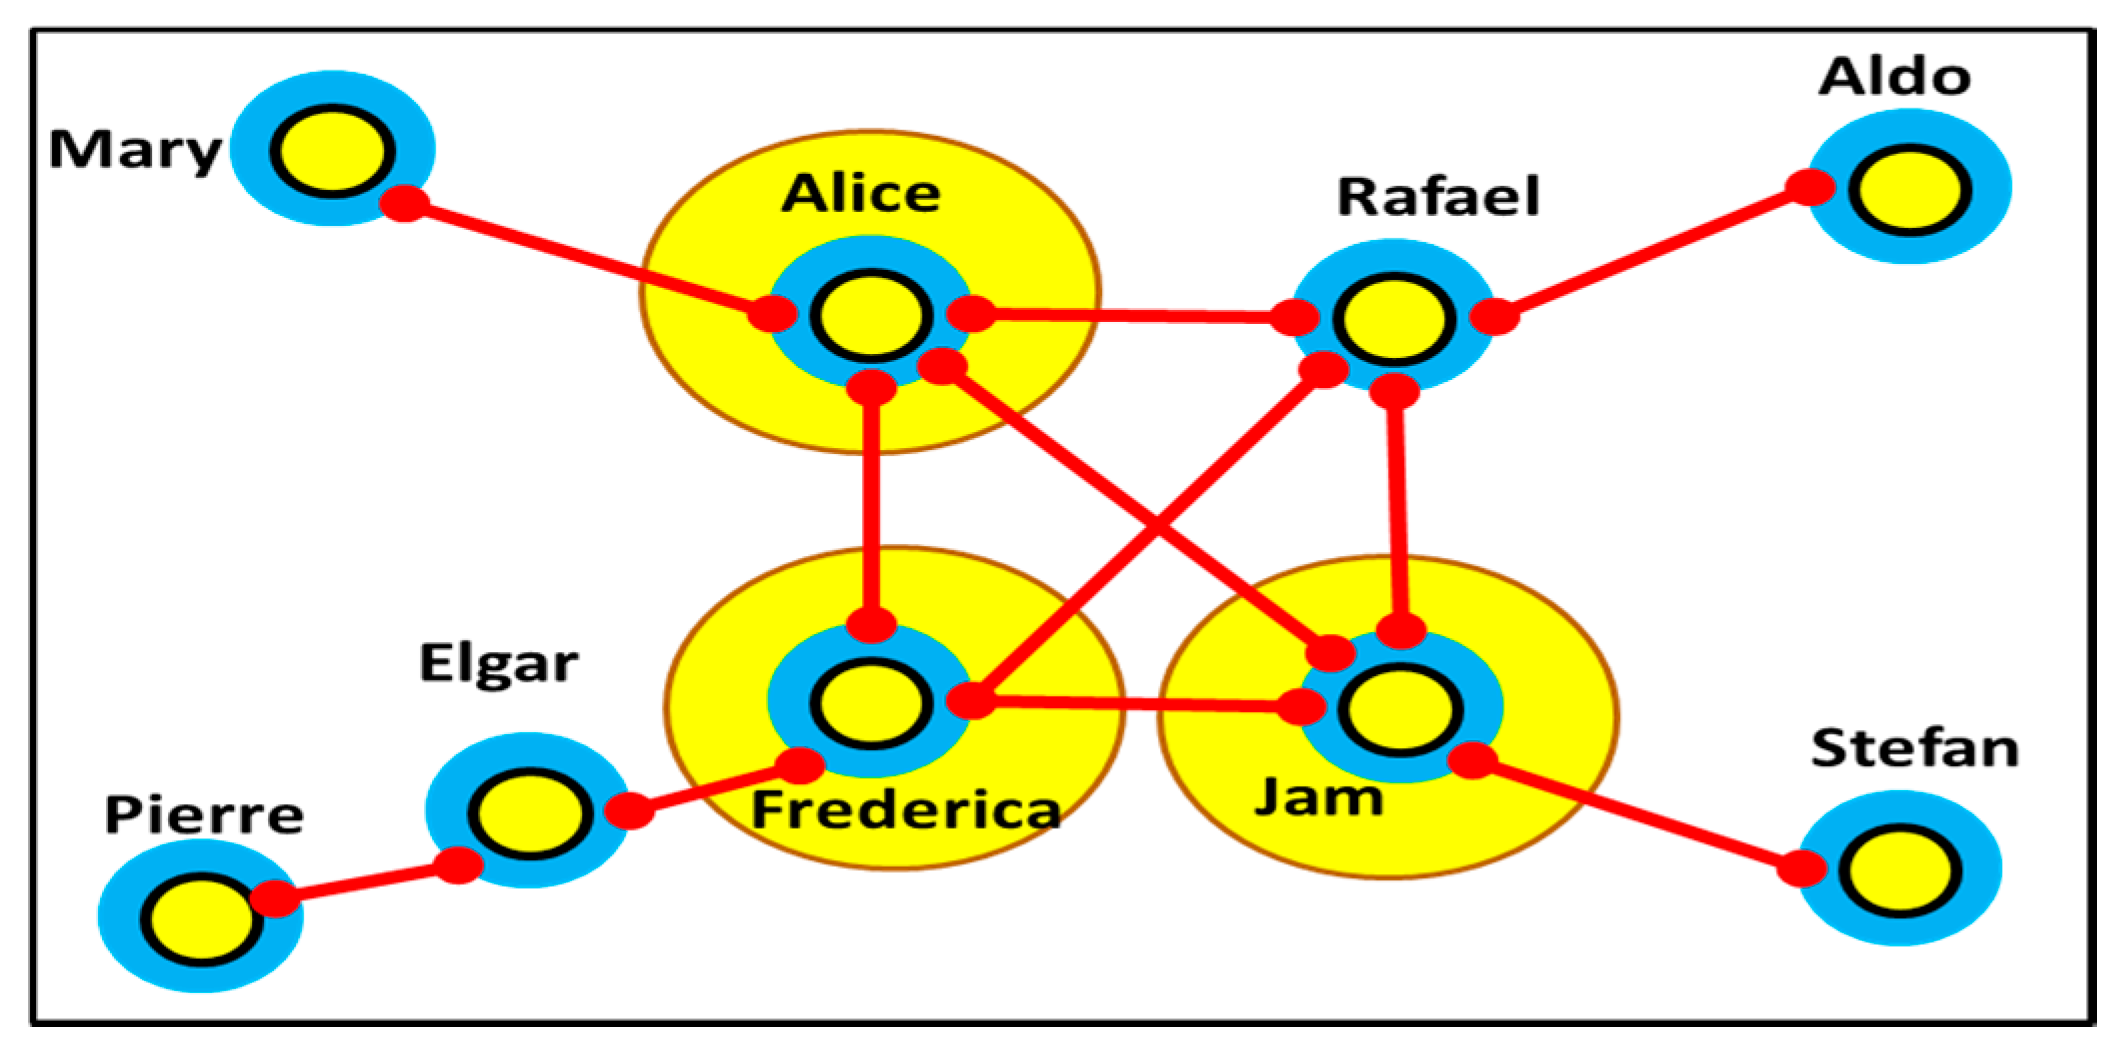
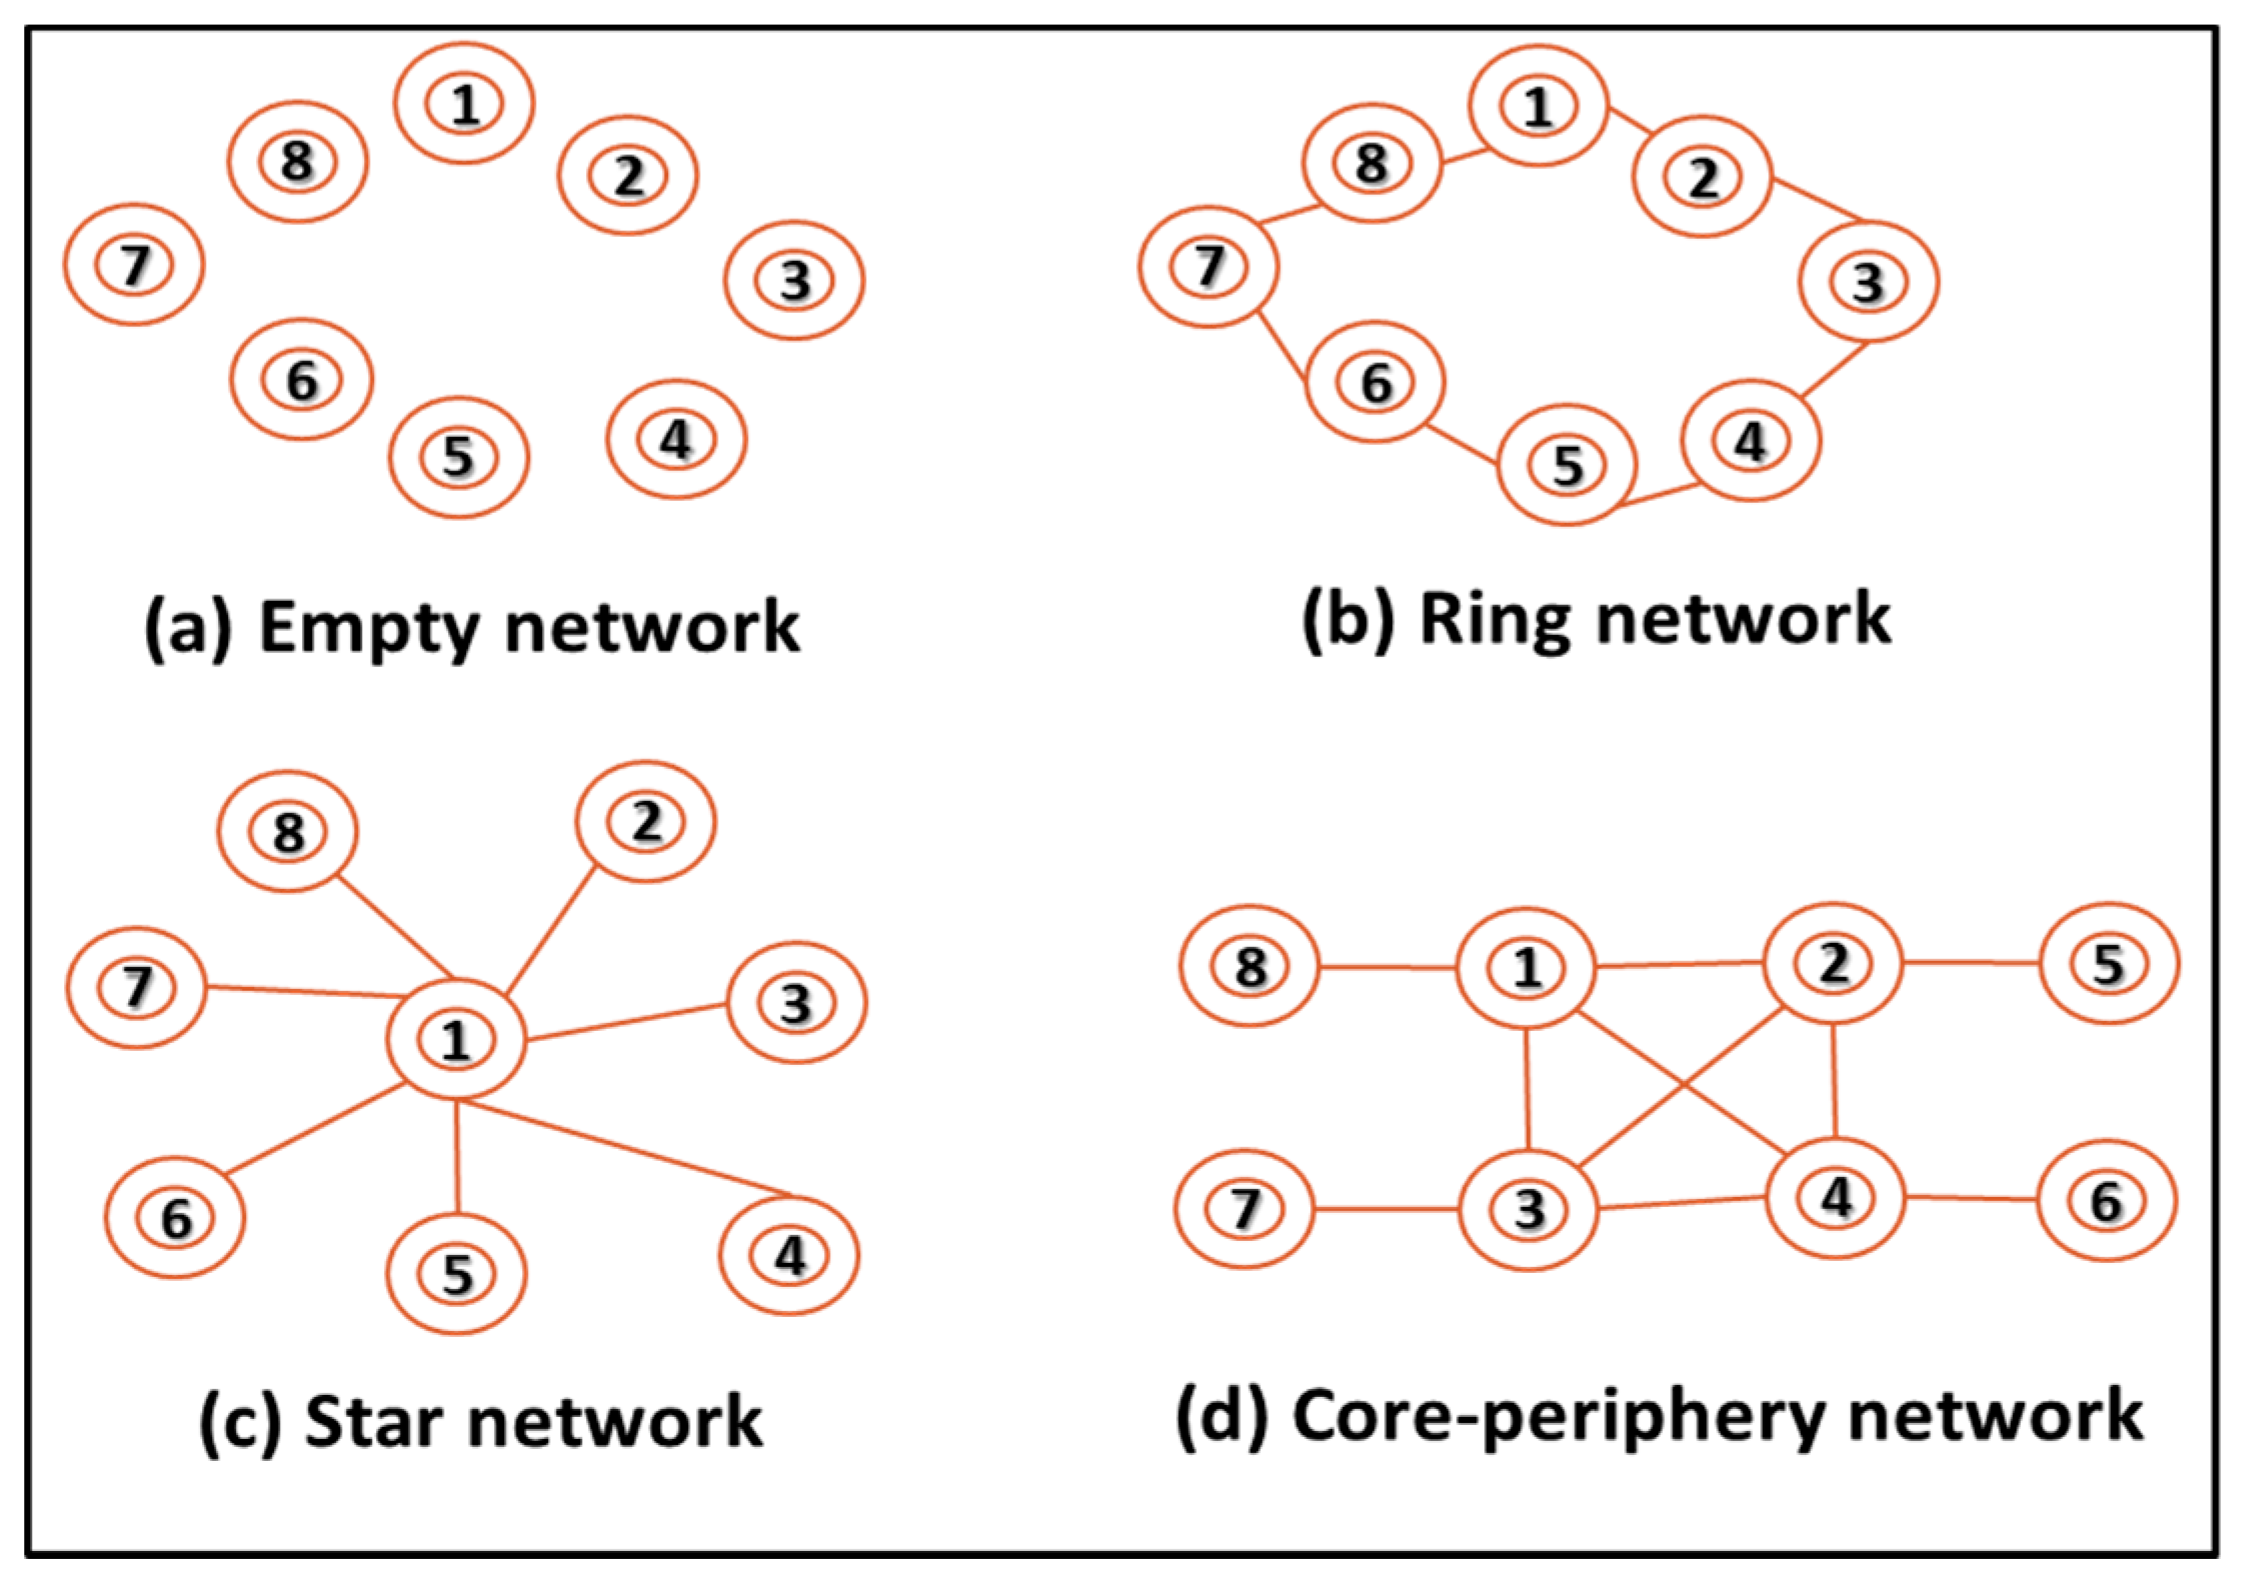
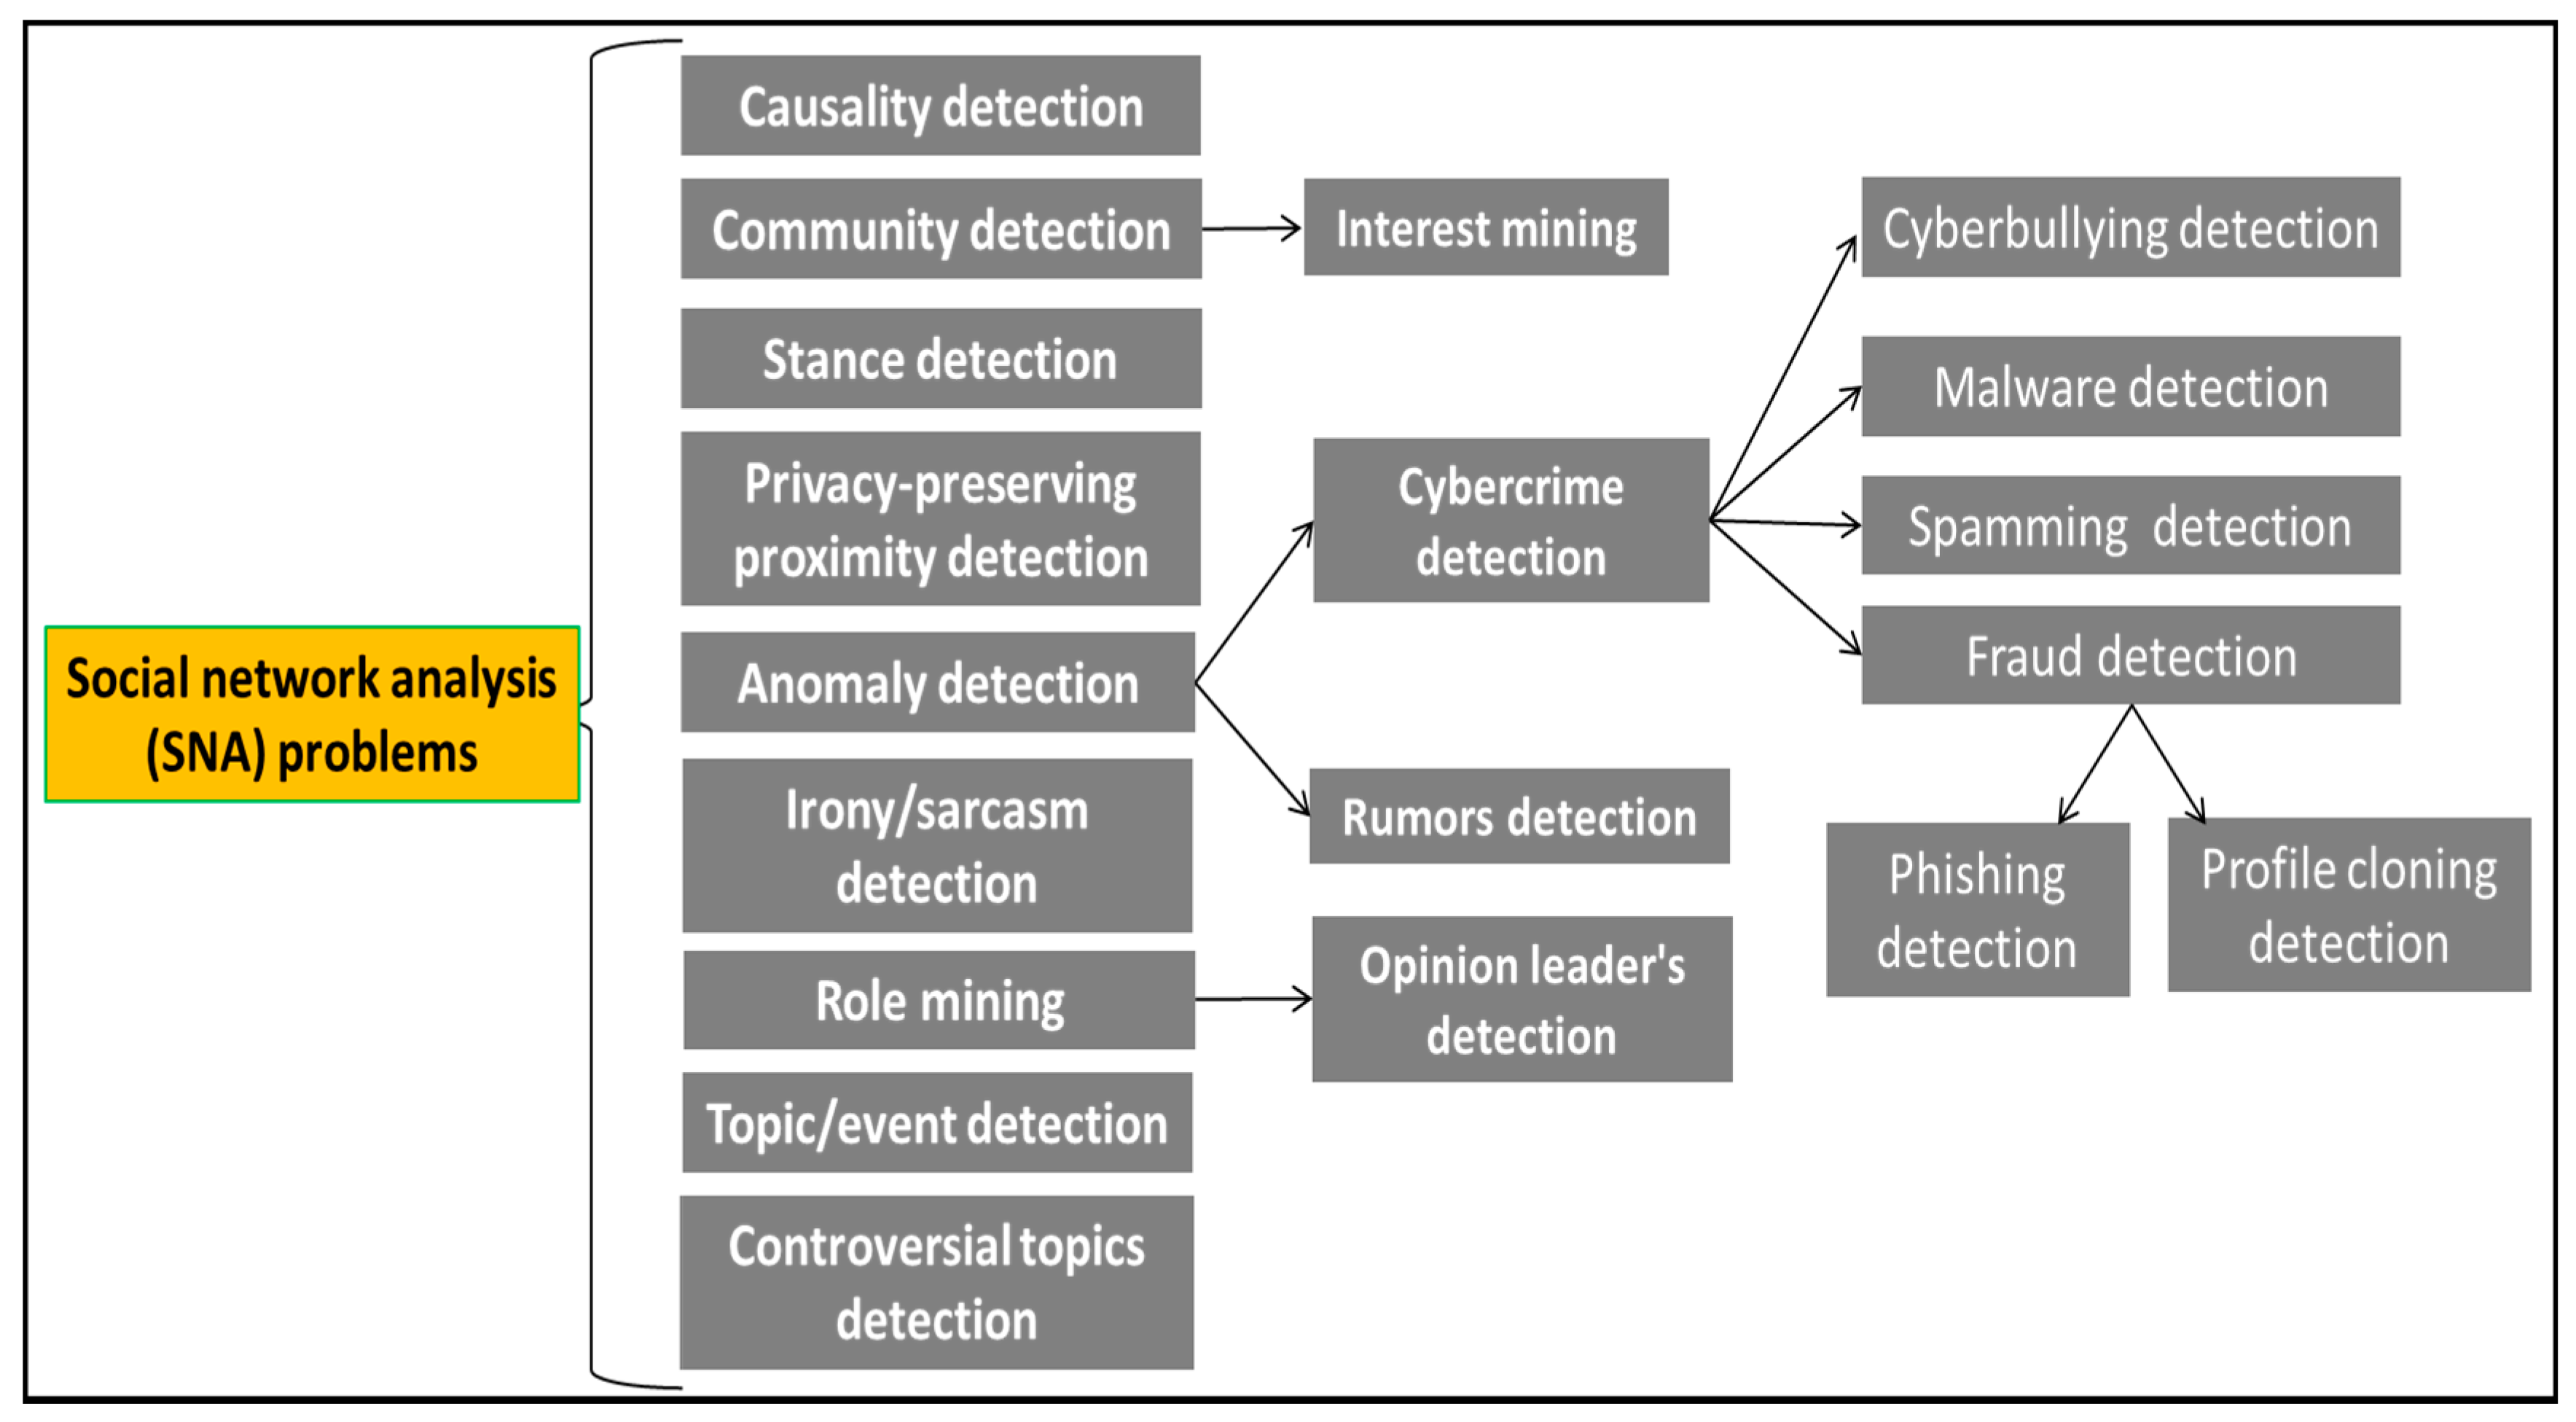
3.5. Social Network Analysis via Graphs
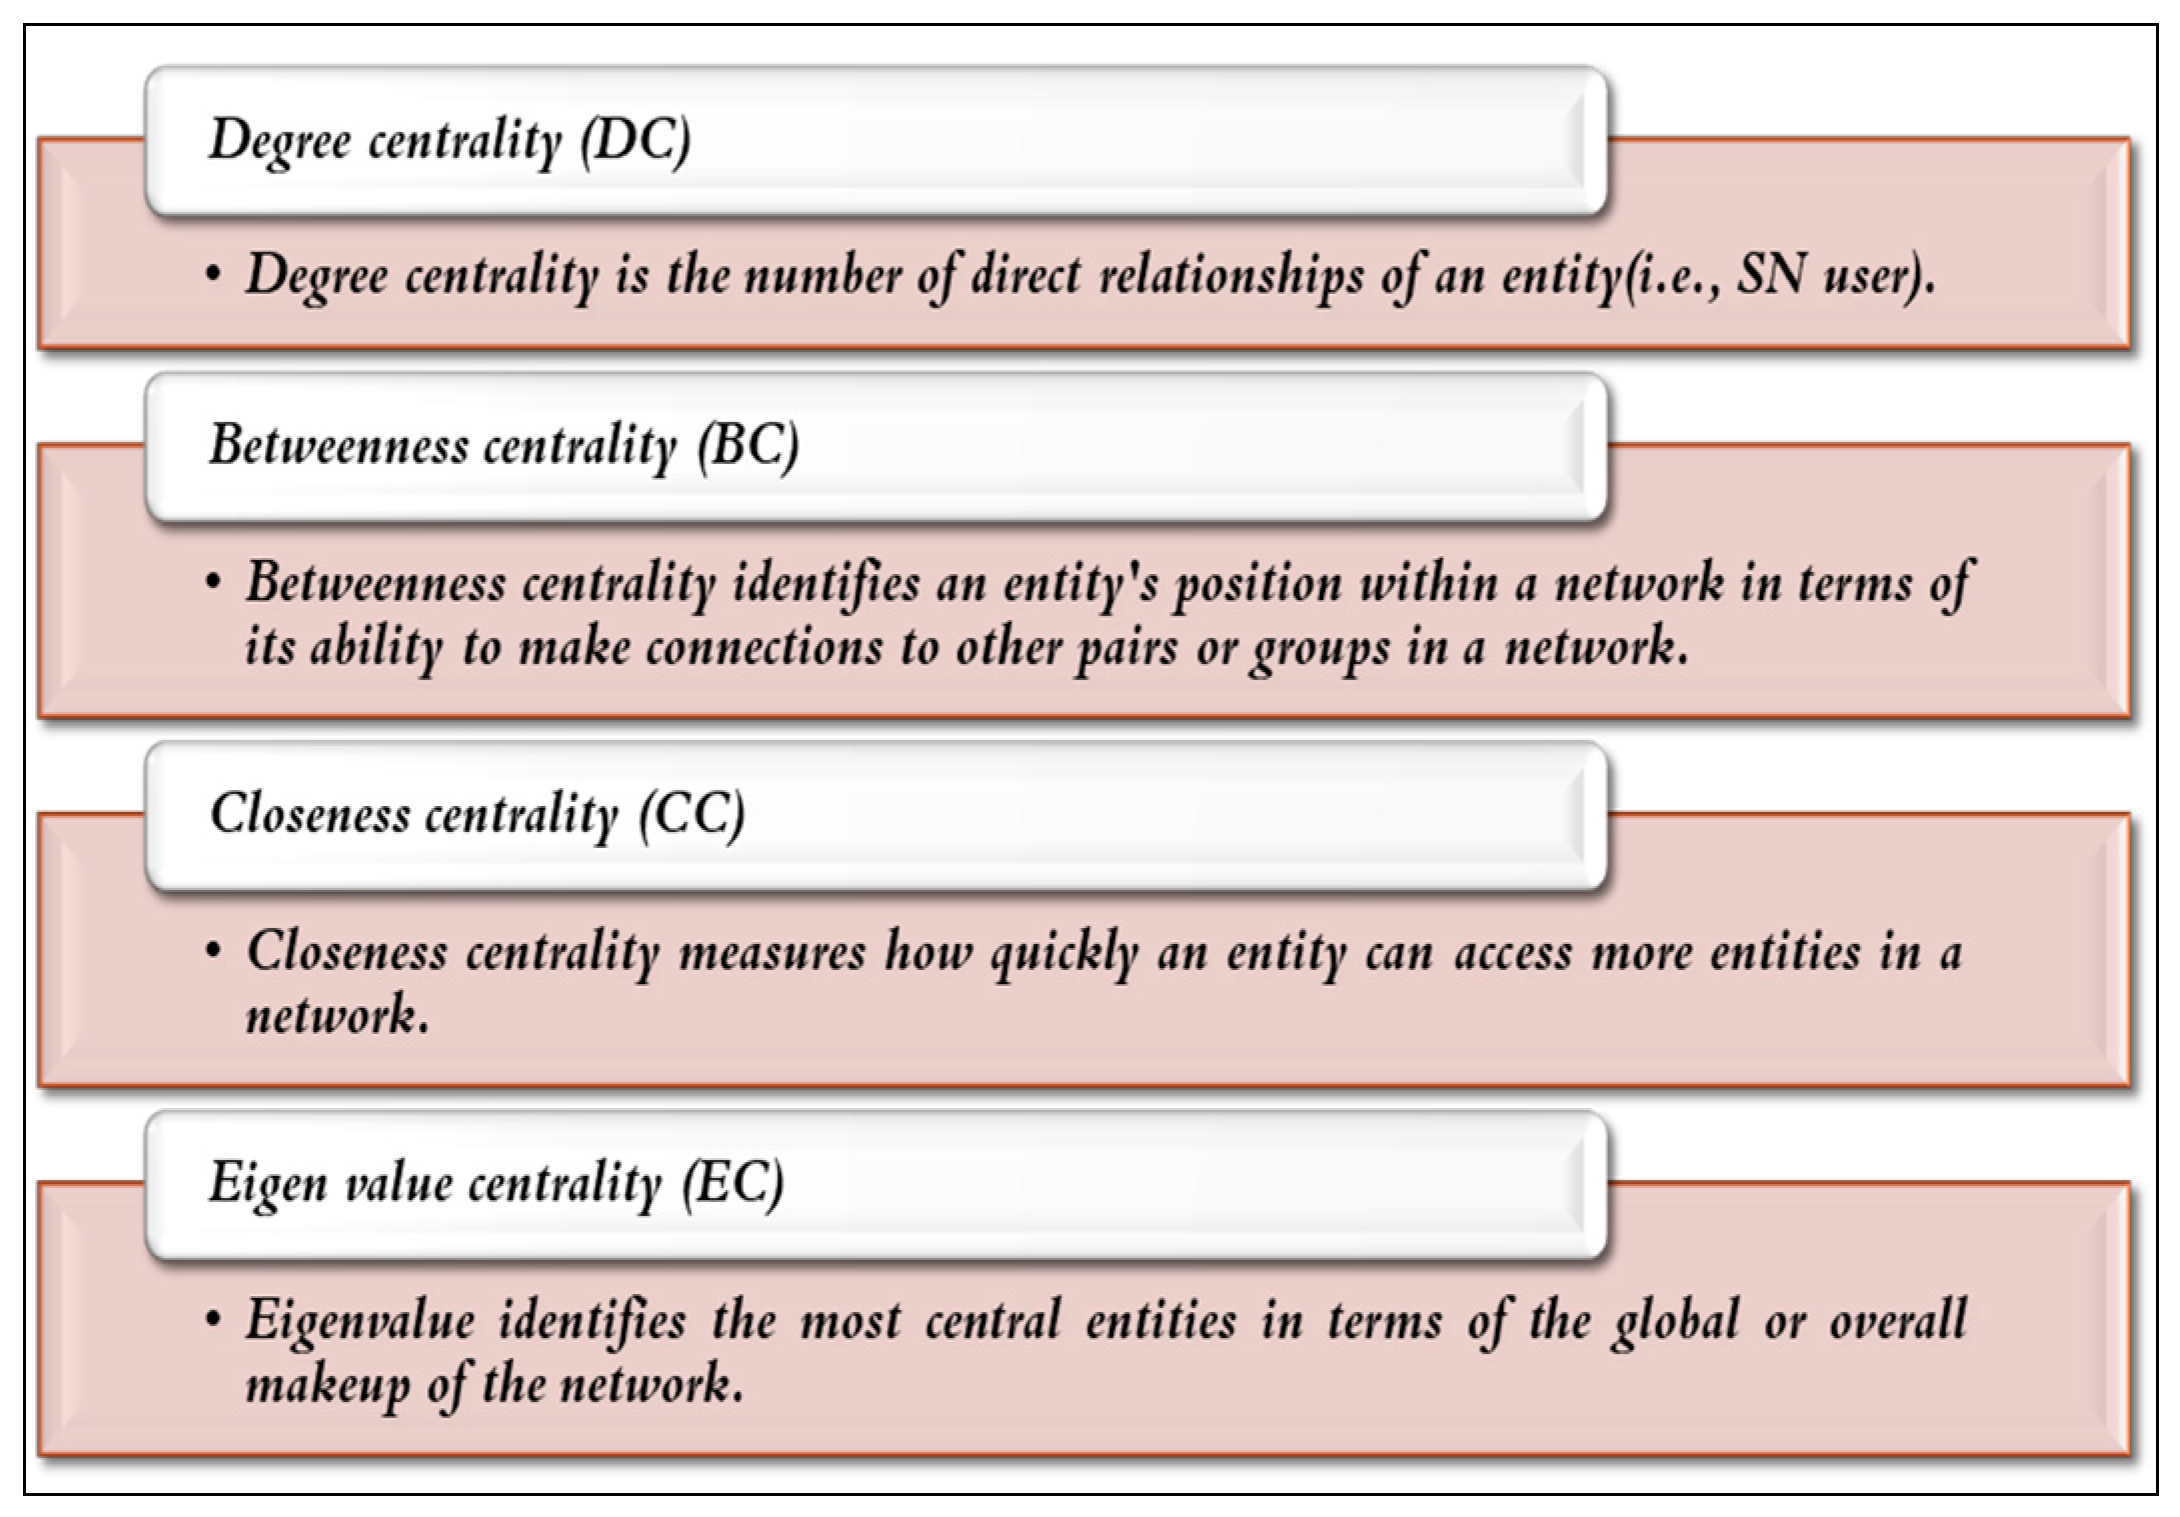
3.5.1. Closeness Centrality
3.5.2. Degree Centrality
3.5.3. Betweenness Centrality
3.5.4. Eigenvalue Centrality
3.5.5. Jordan Centrality
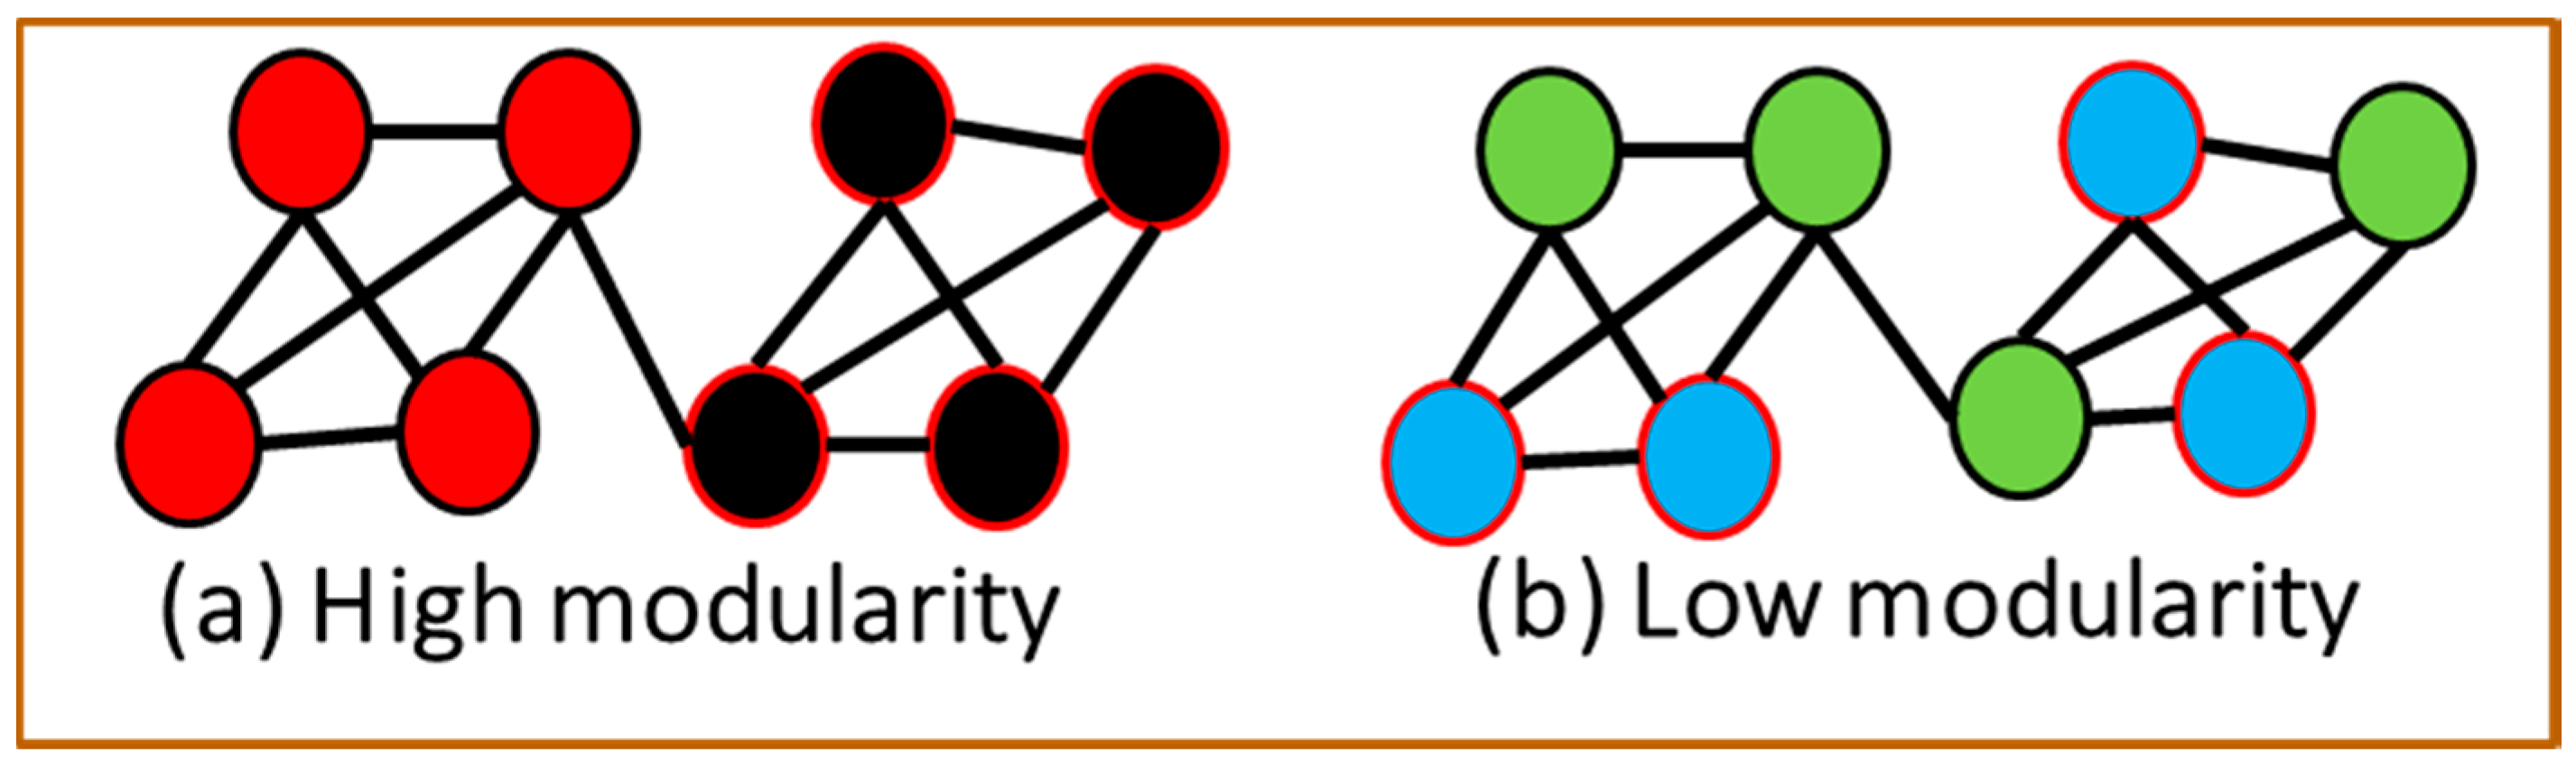
3.6. Analyzing the Modularity in a Social Network Users’ Graph
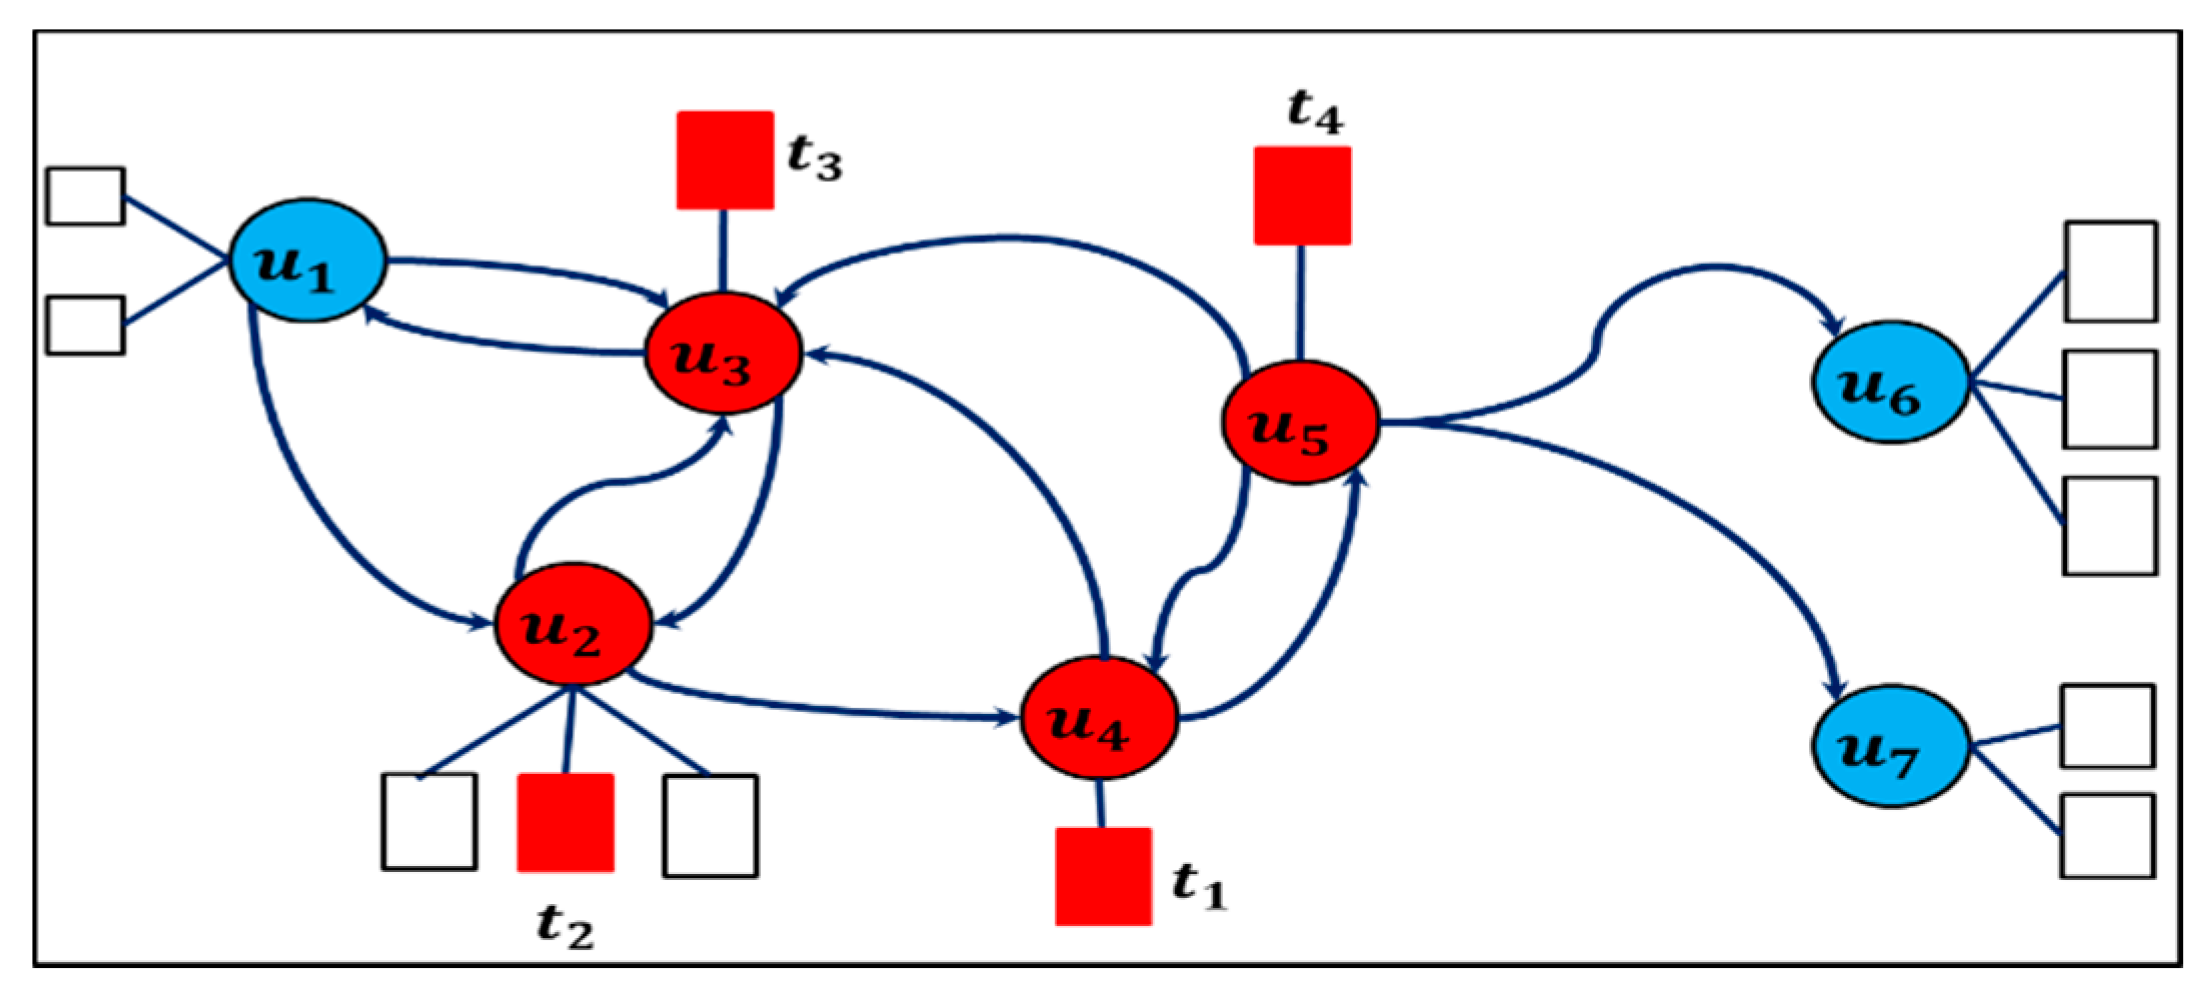
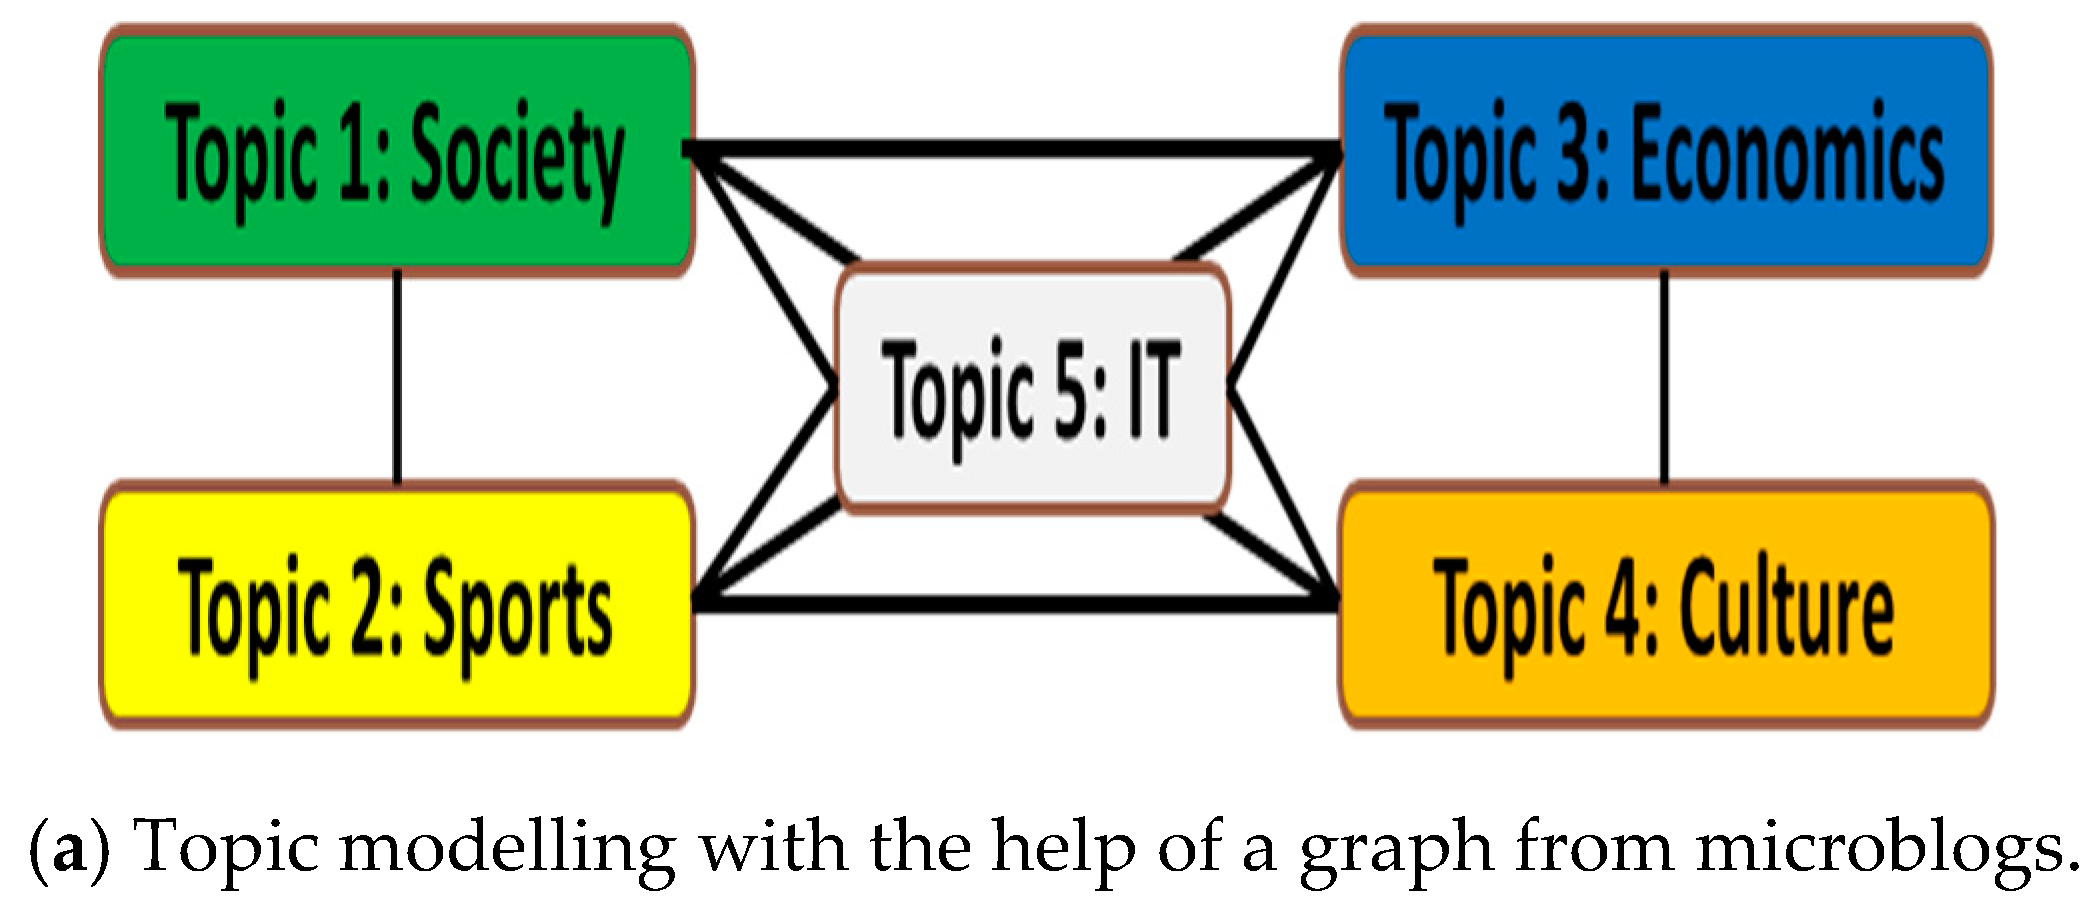
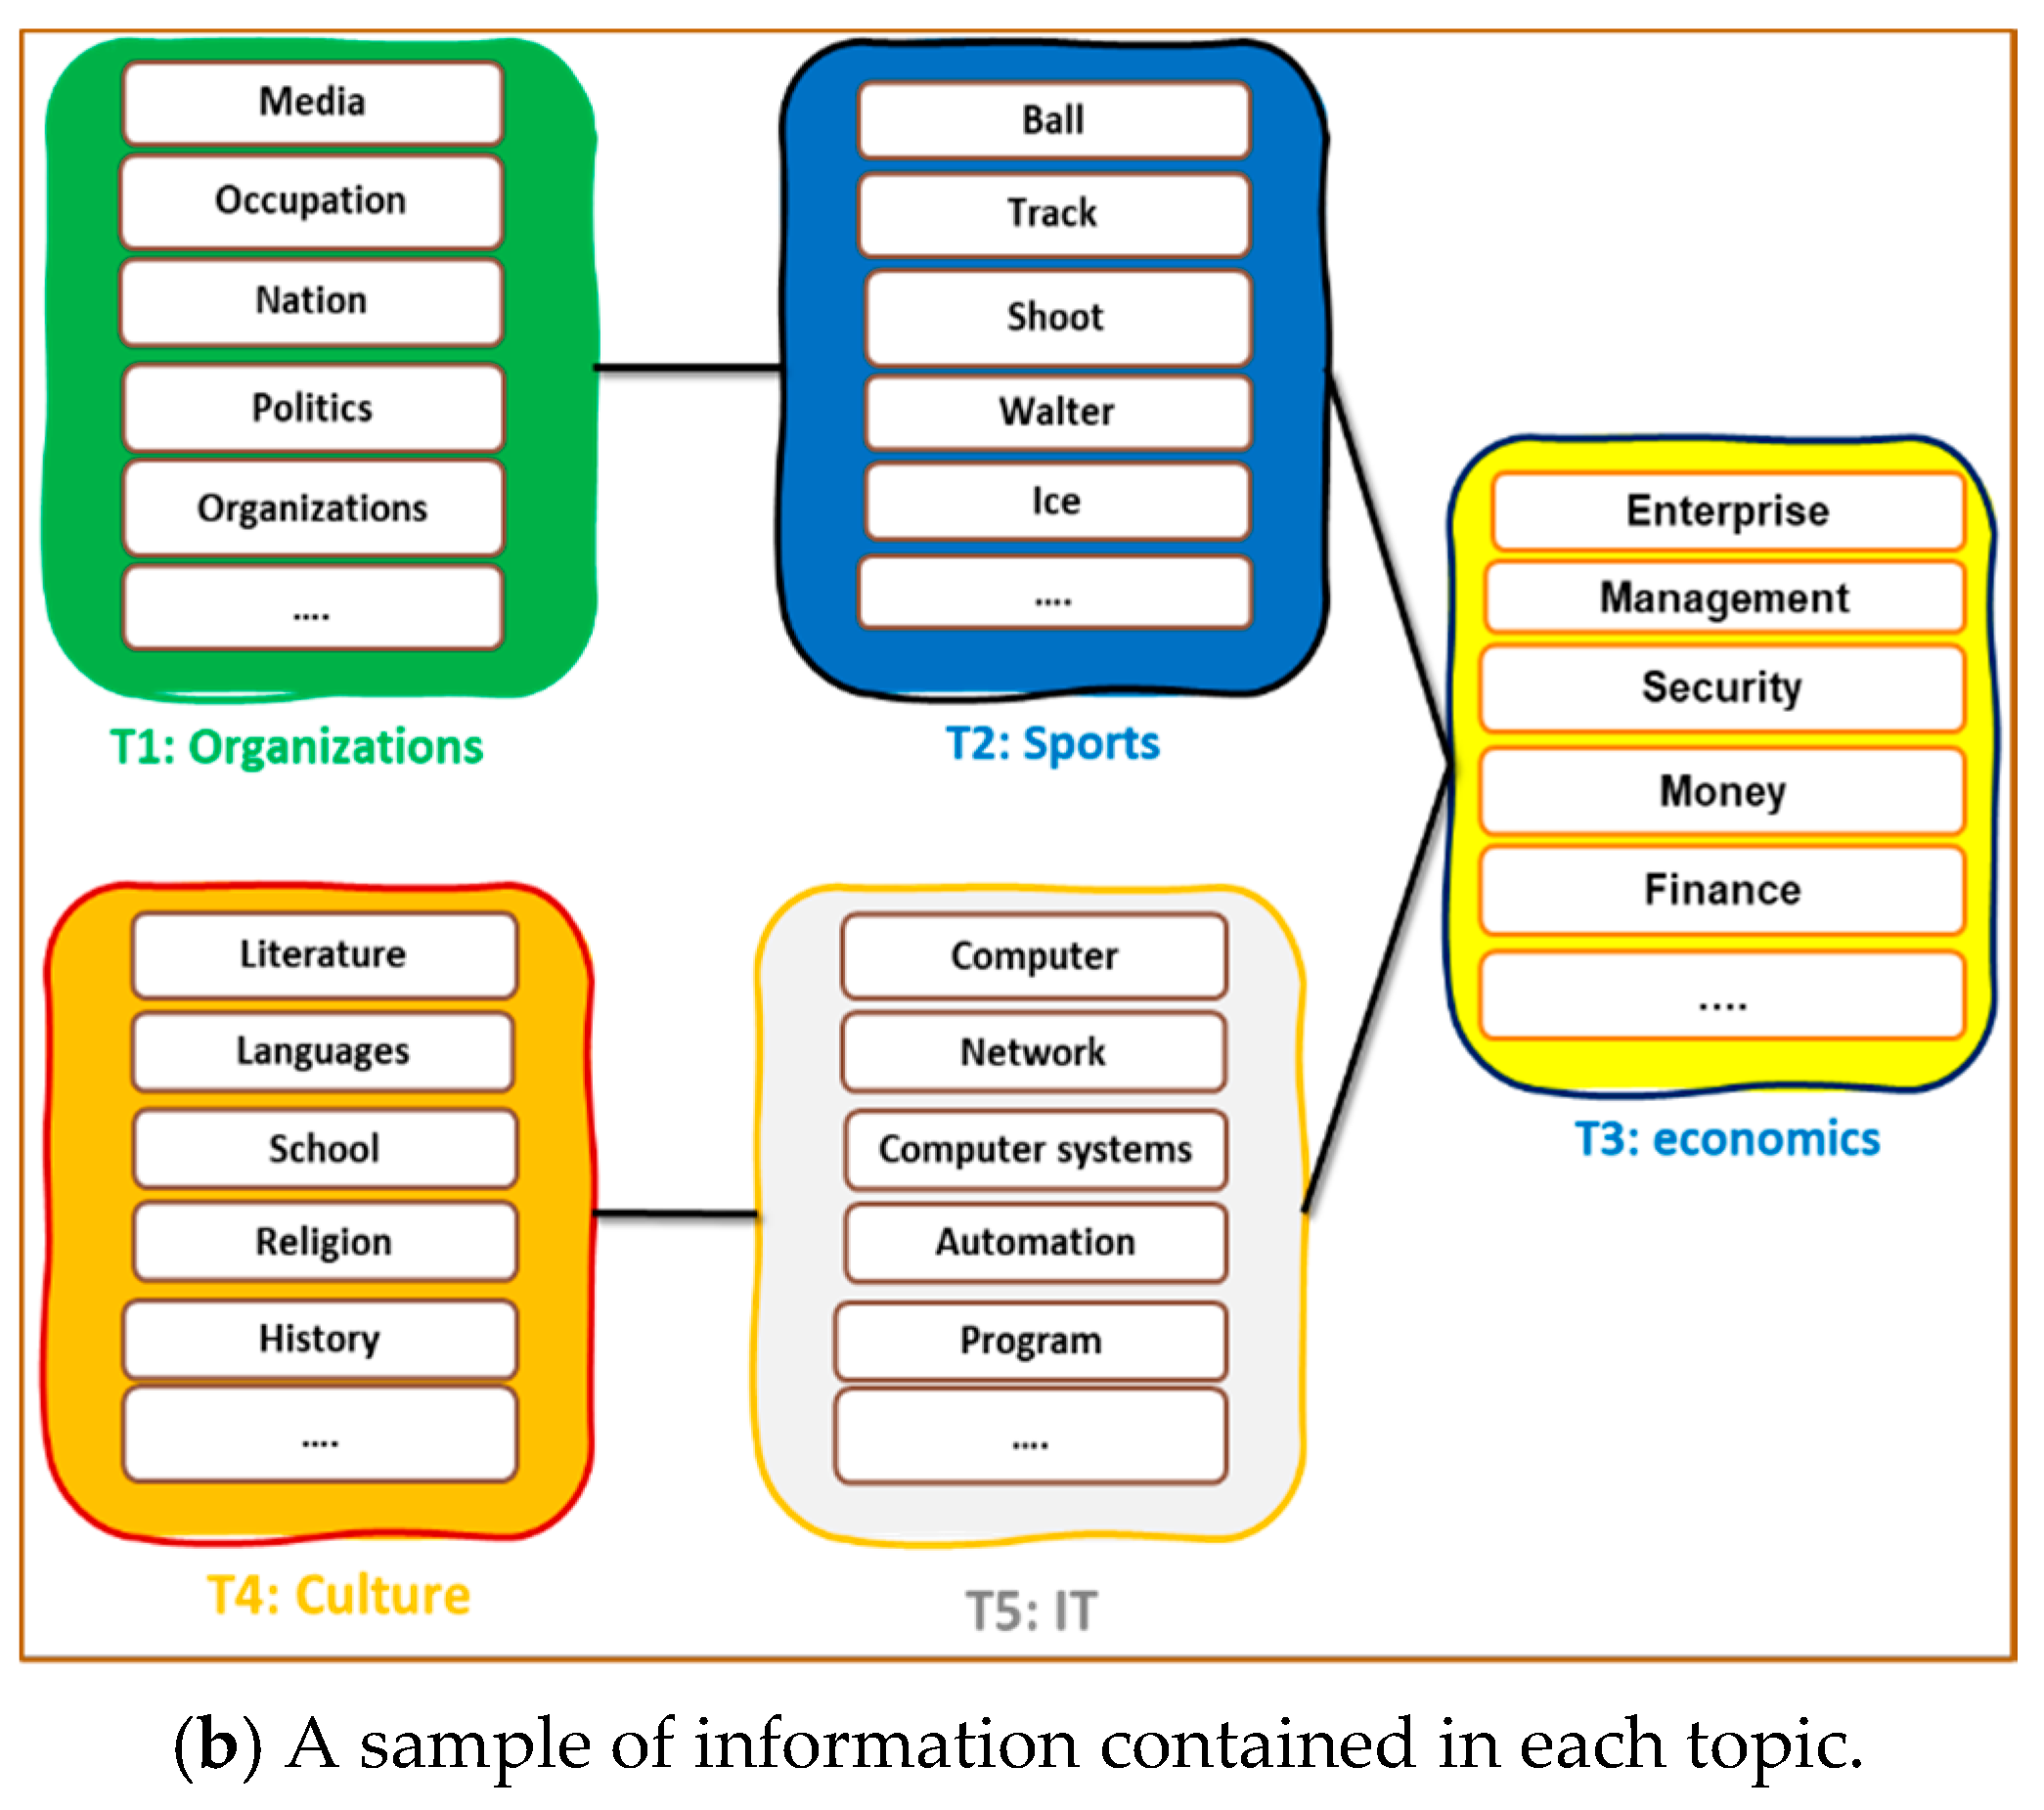
3.7. Topic of Interest Modelling Using Graphs in Social Networks
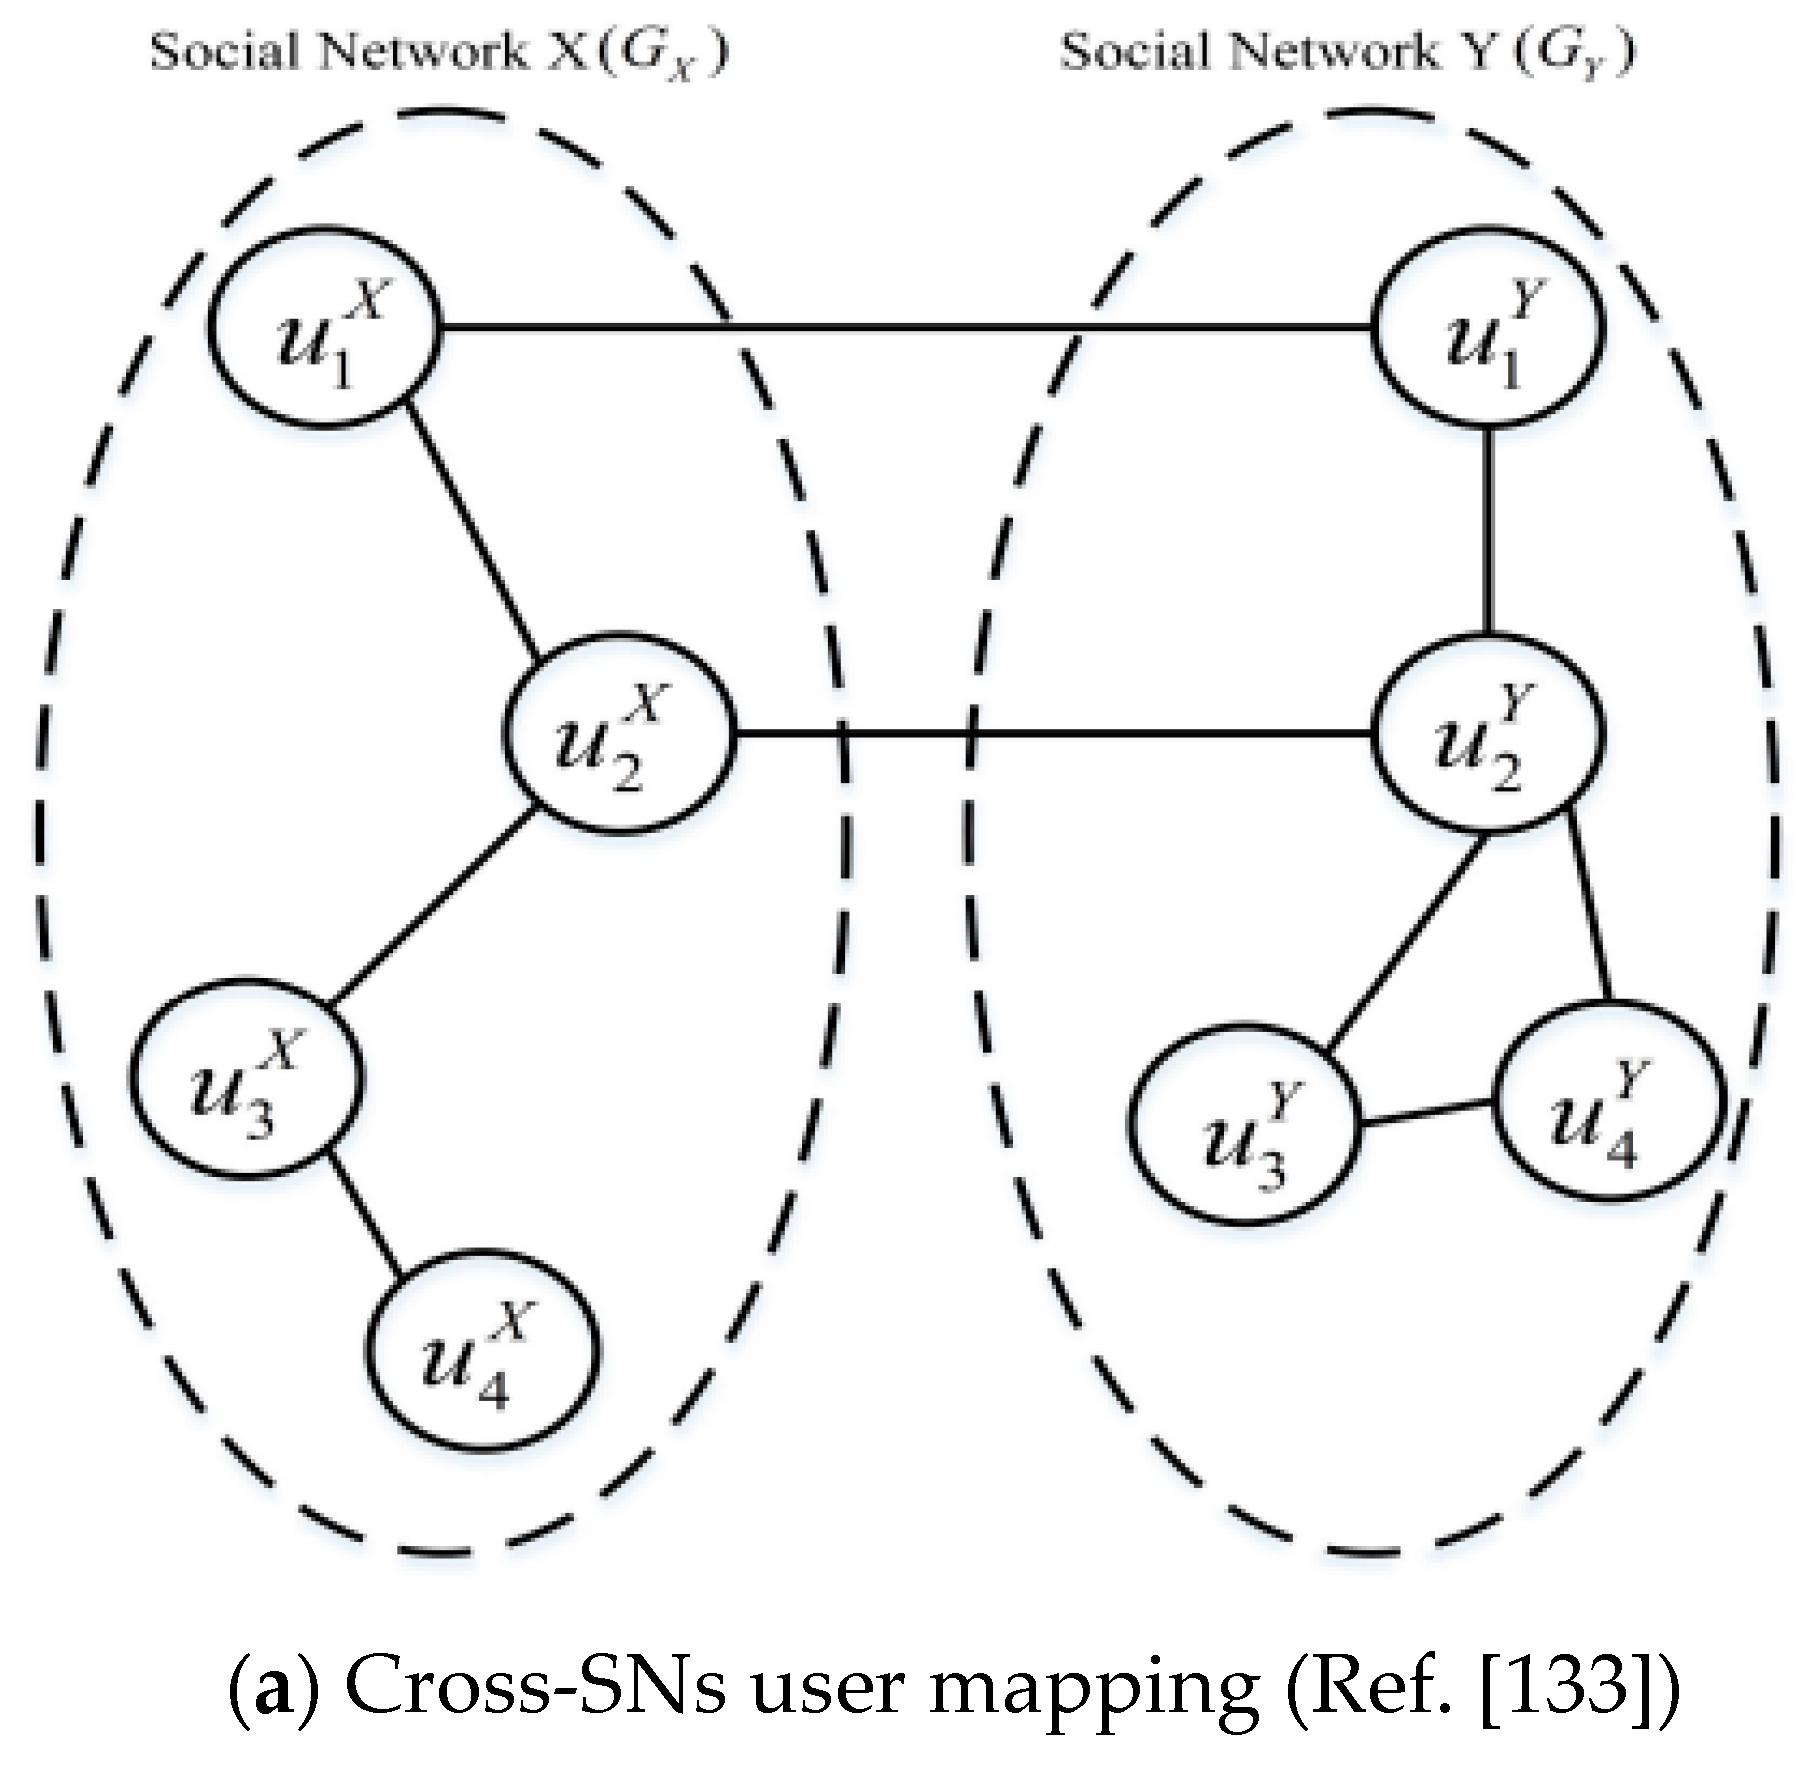
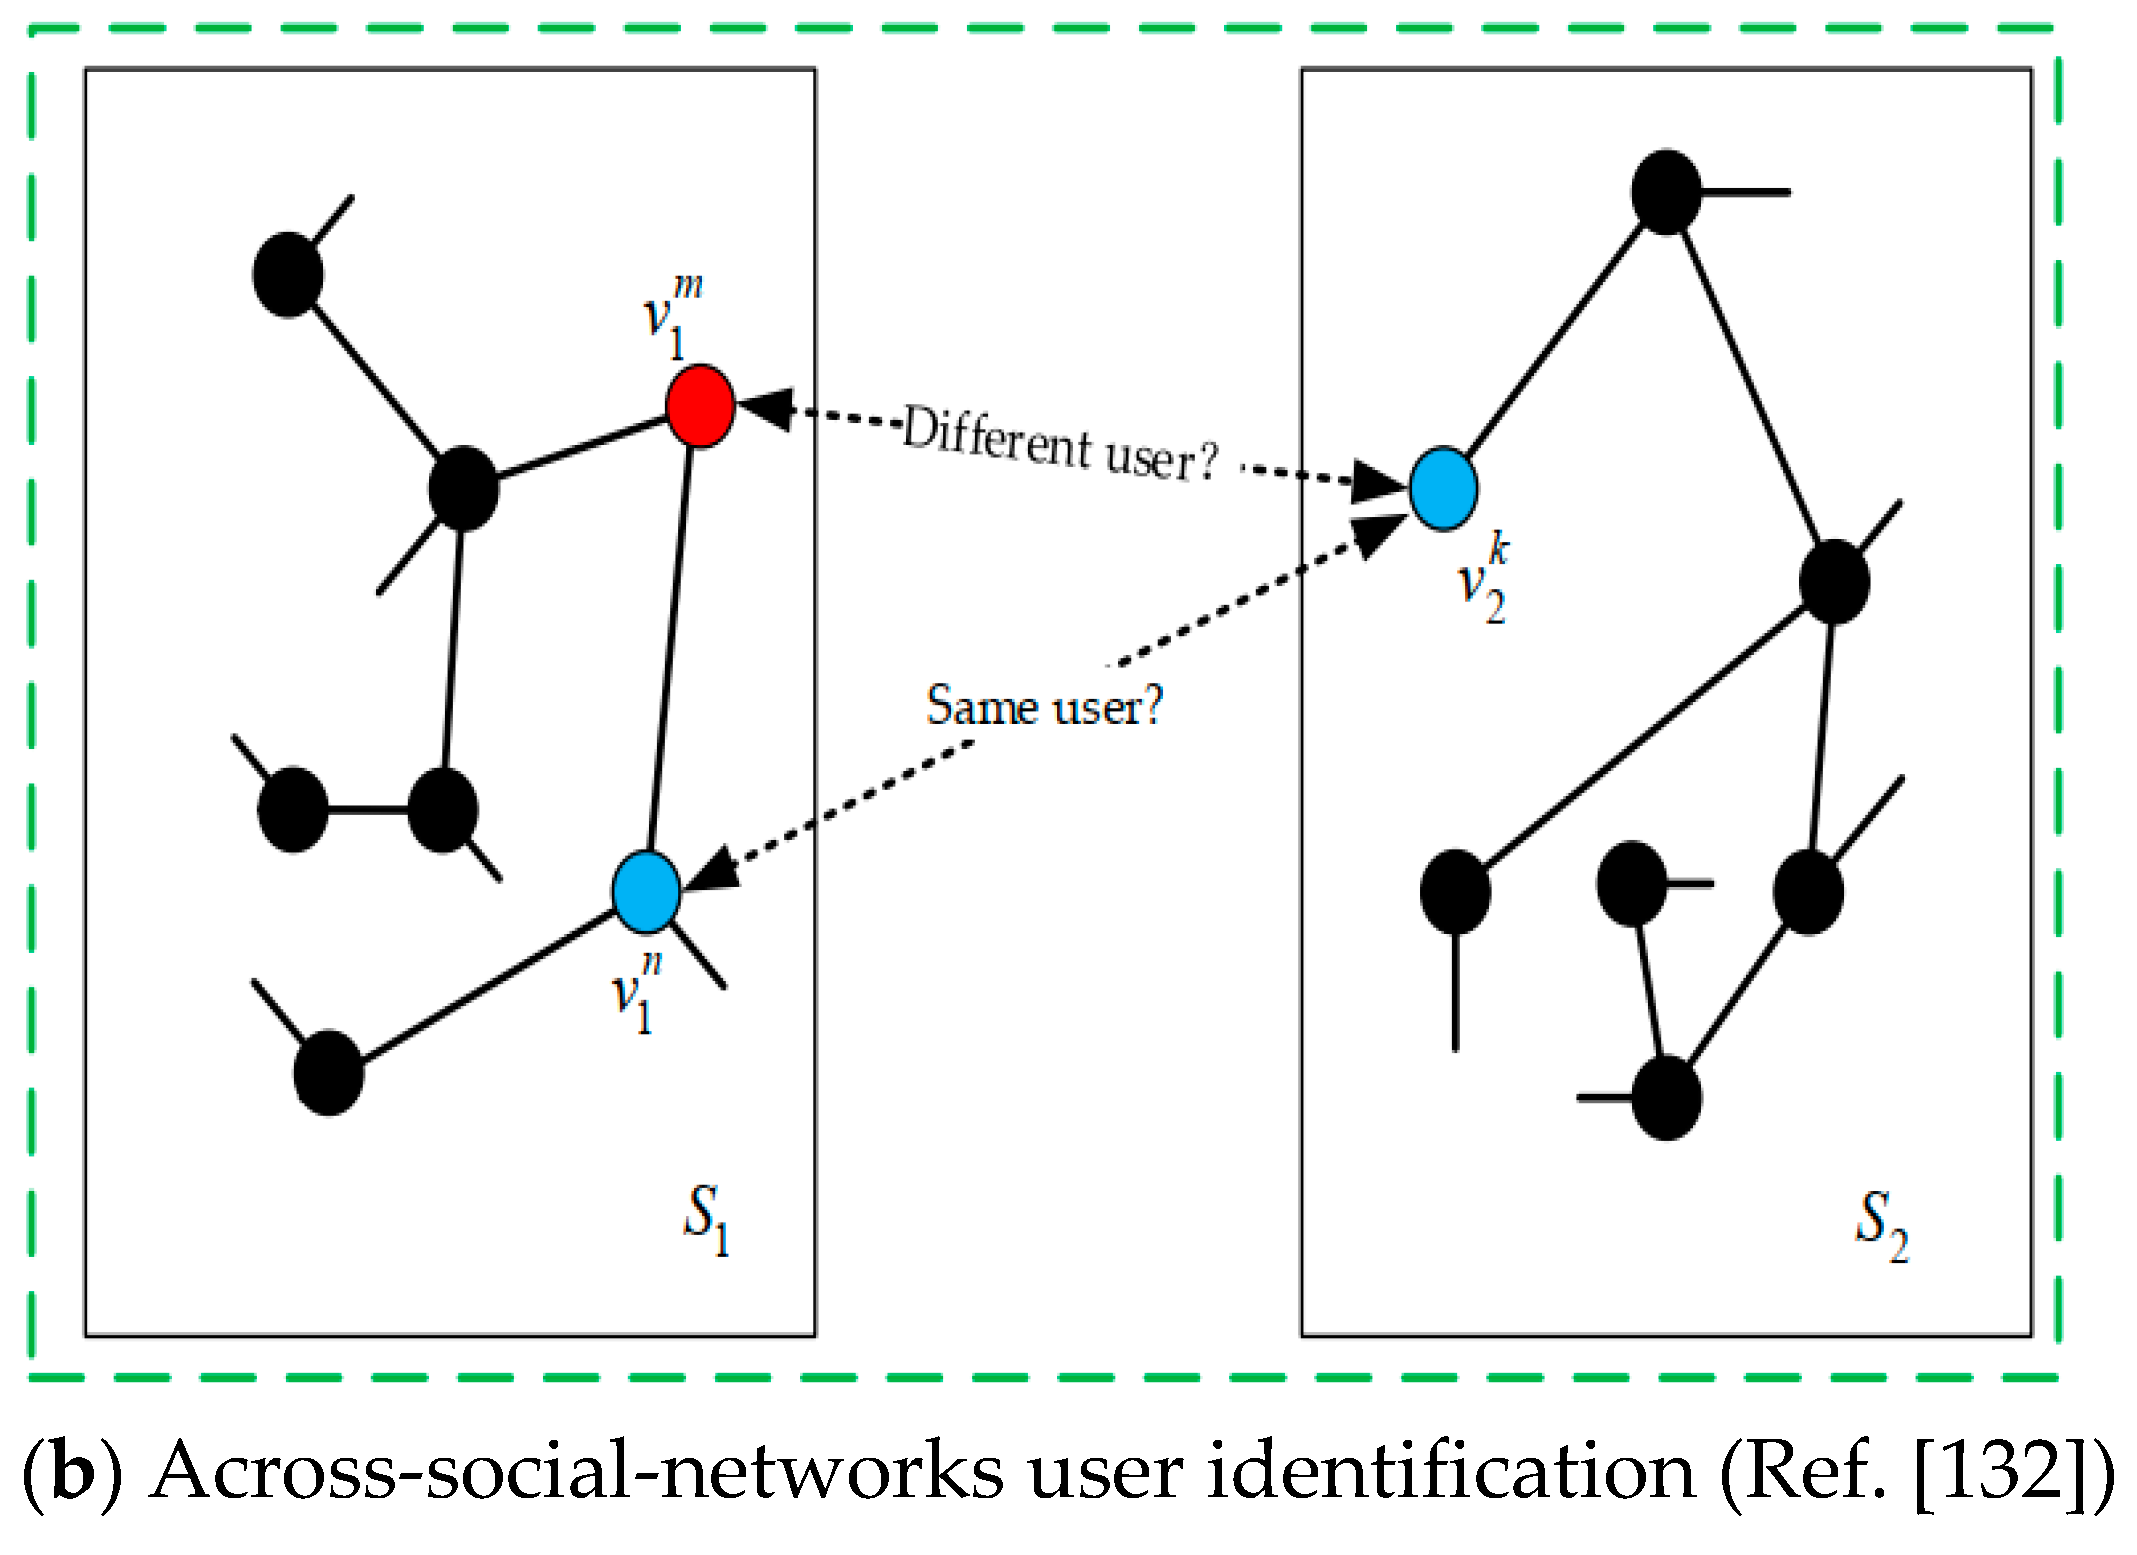
3.8. User Identification across Social Networks by Analyzing Structural Properties of the Graphs
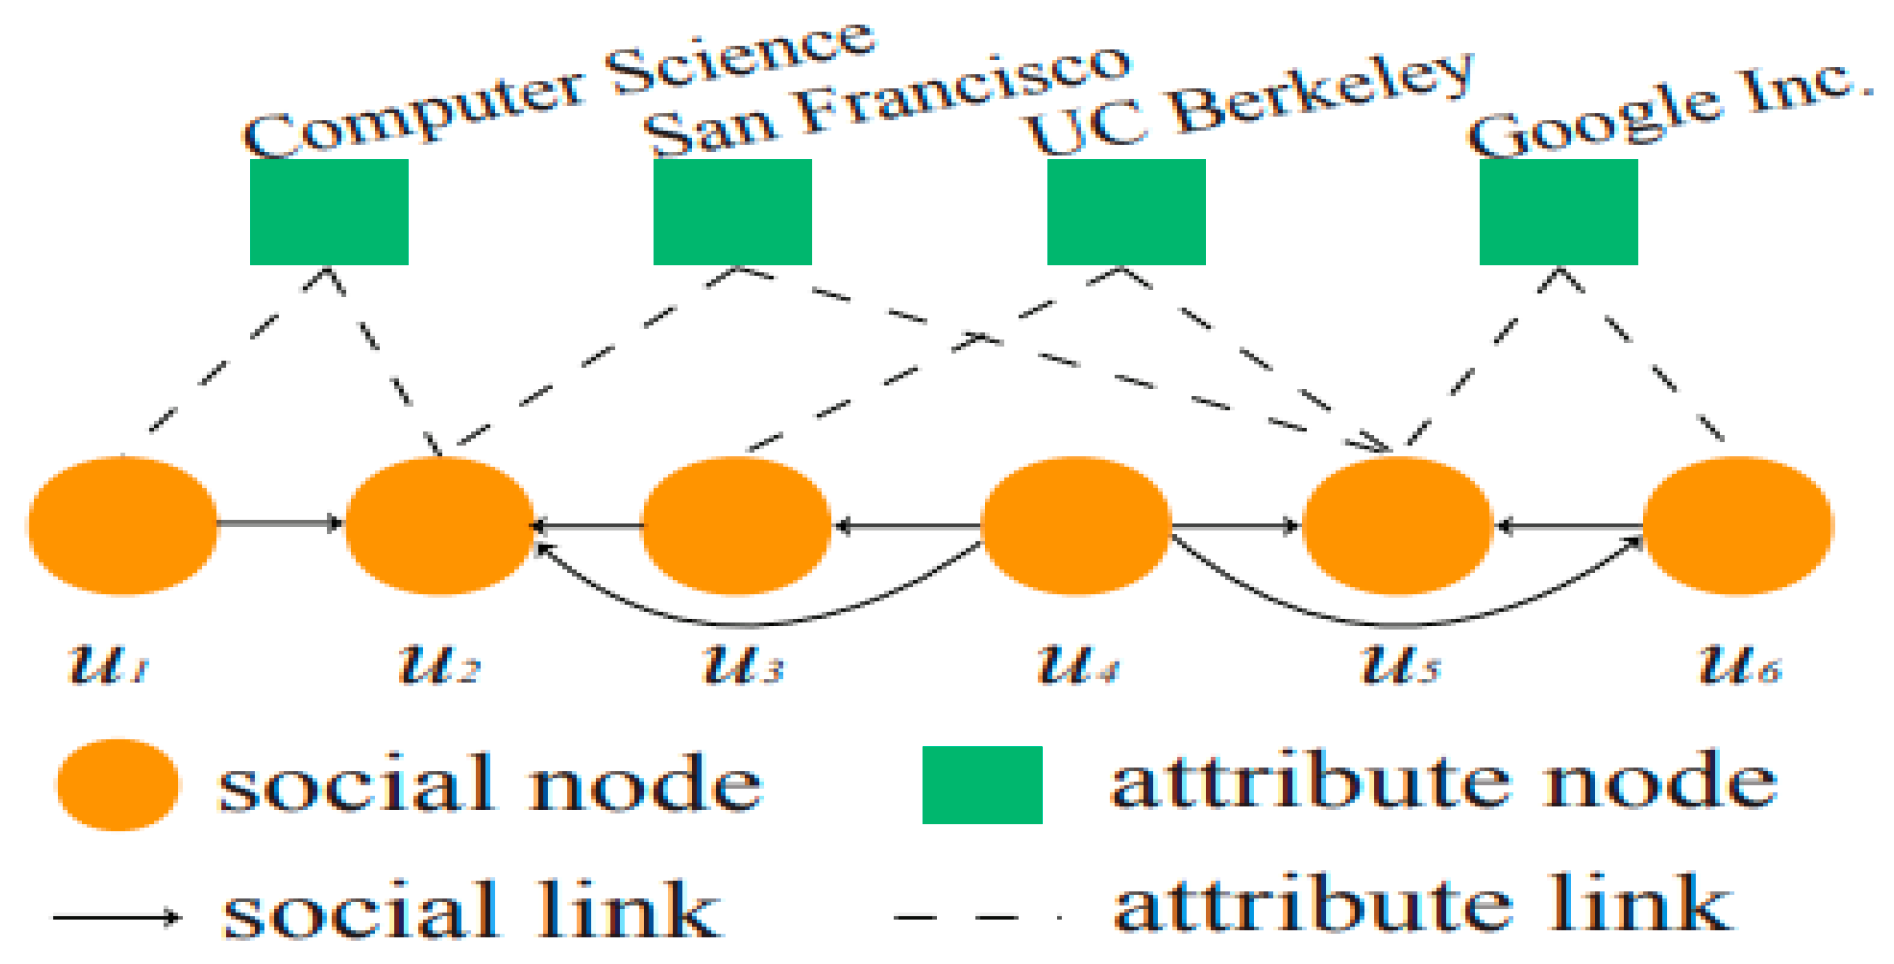
3.9. Social-Attribute Network (SAN) Modelling and Analysis via Graphs
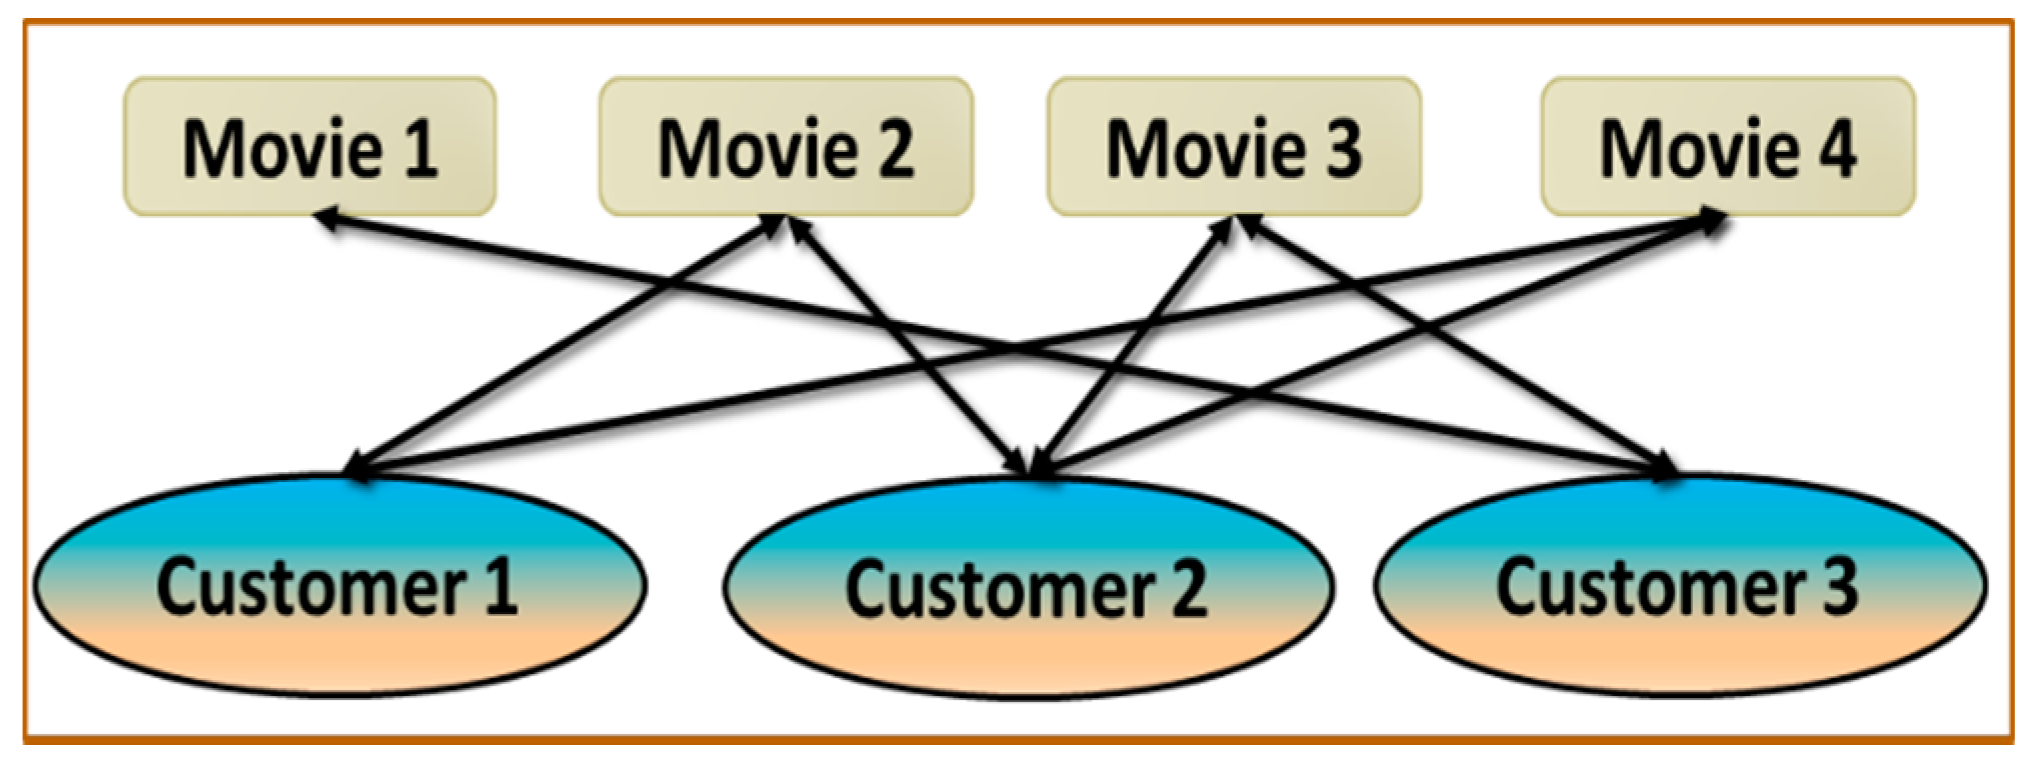
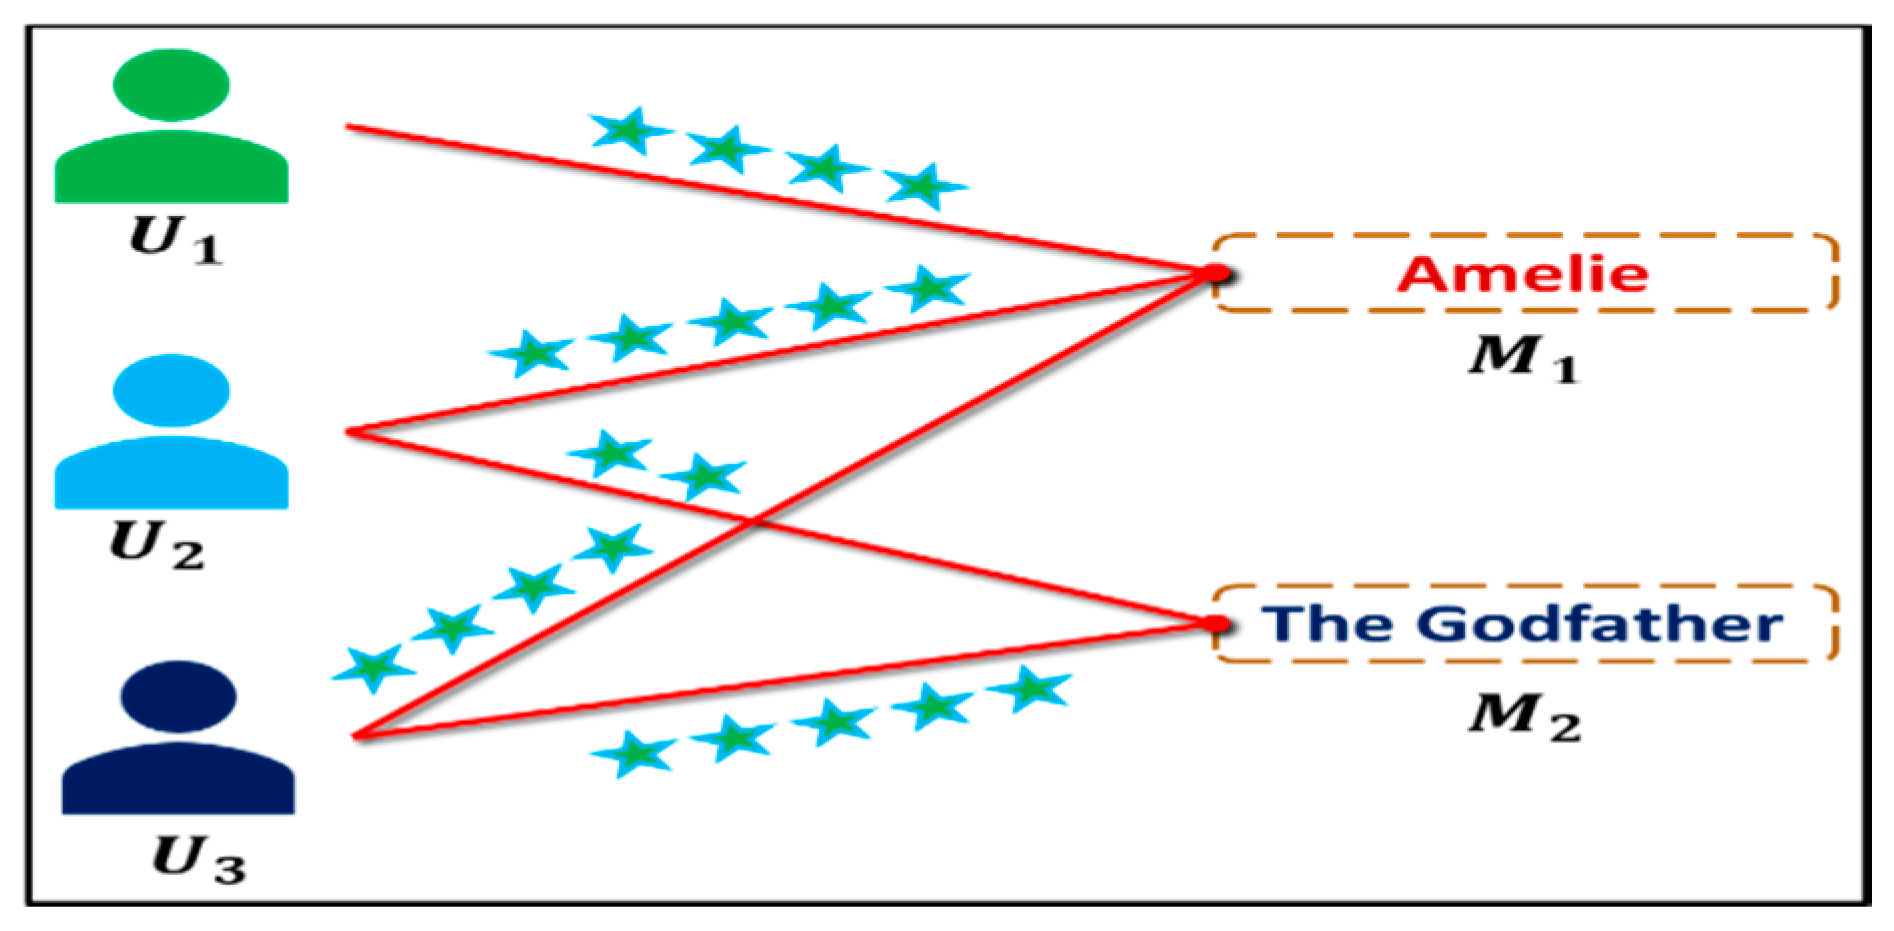
3.10. Graph Theory Applications in Recommendation Systems
3.11. Social Interactions Modelling between Users in Social Networks via Graphs
3.12. Privacy-Preserving Social Network Data Publishing With Researchers/Analysts For Analysis
3.13. Community-Based Event Detection in Temporal Networks via Graph Analysis
3.14. Affiliation Network Modelling Using Graphs in Social Network
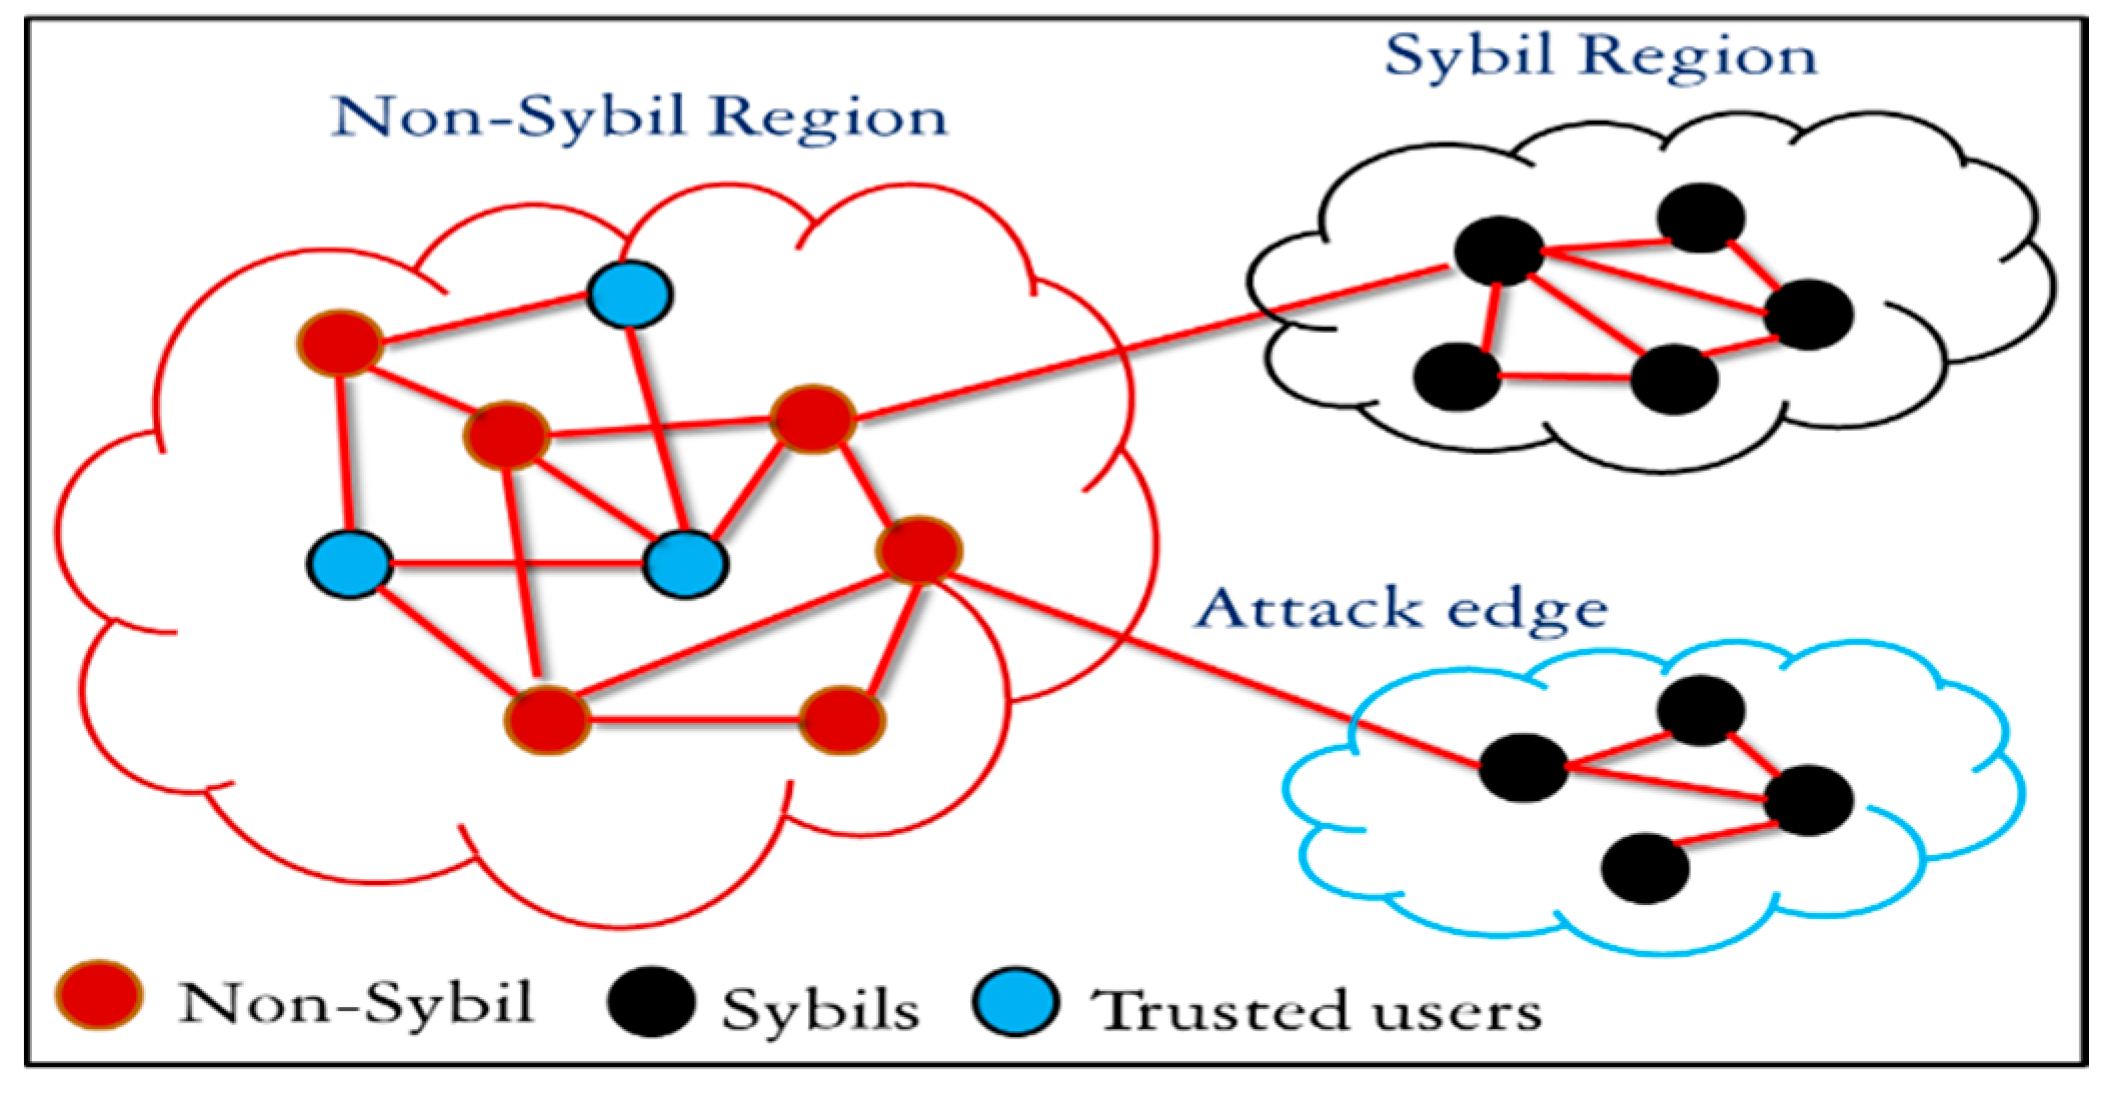
3.15. Modelling of the Sybil Attack in Social Networks Using Graphs
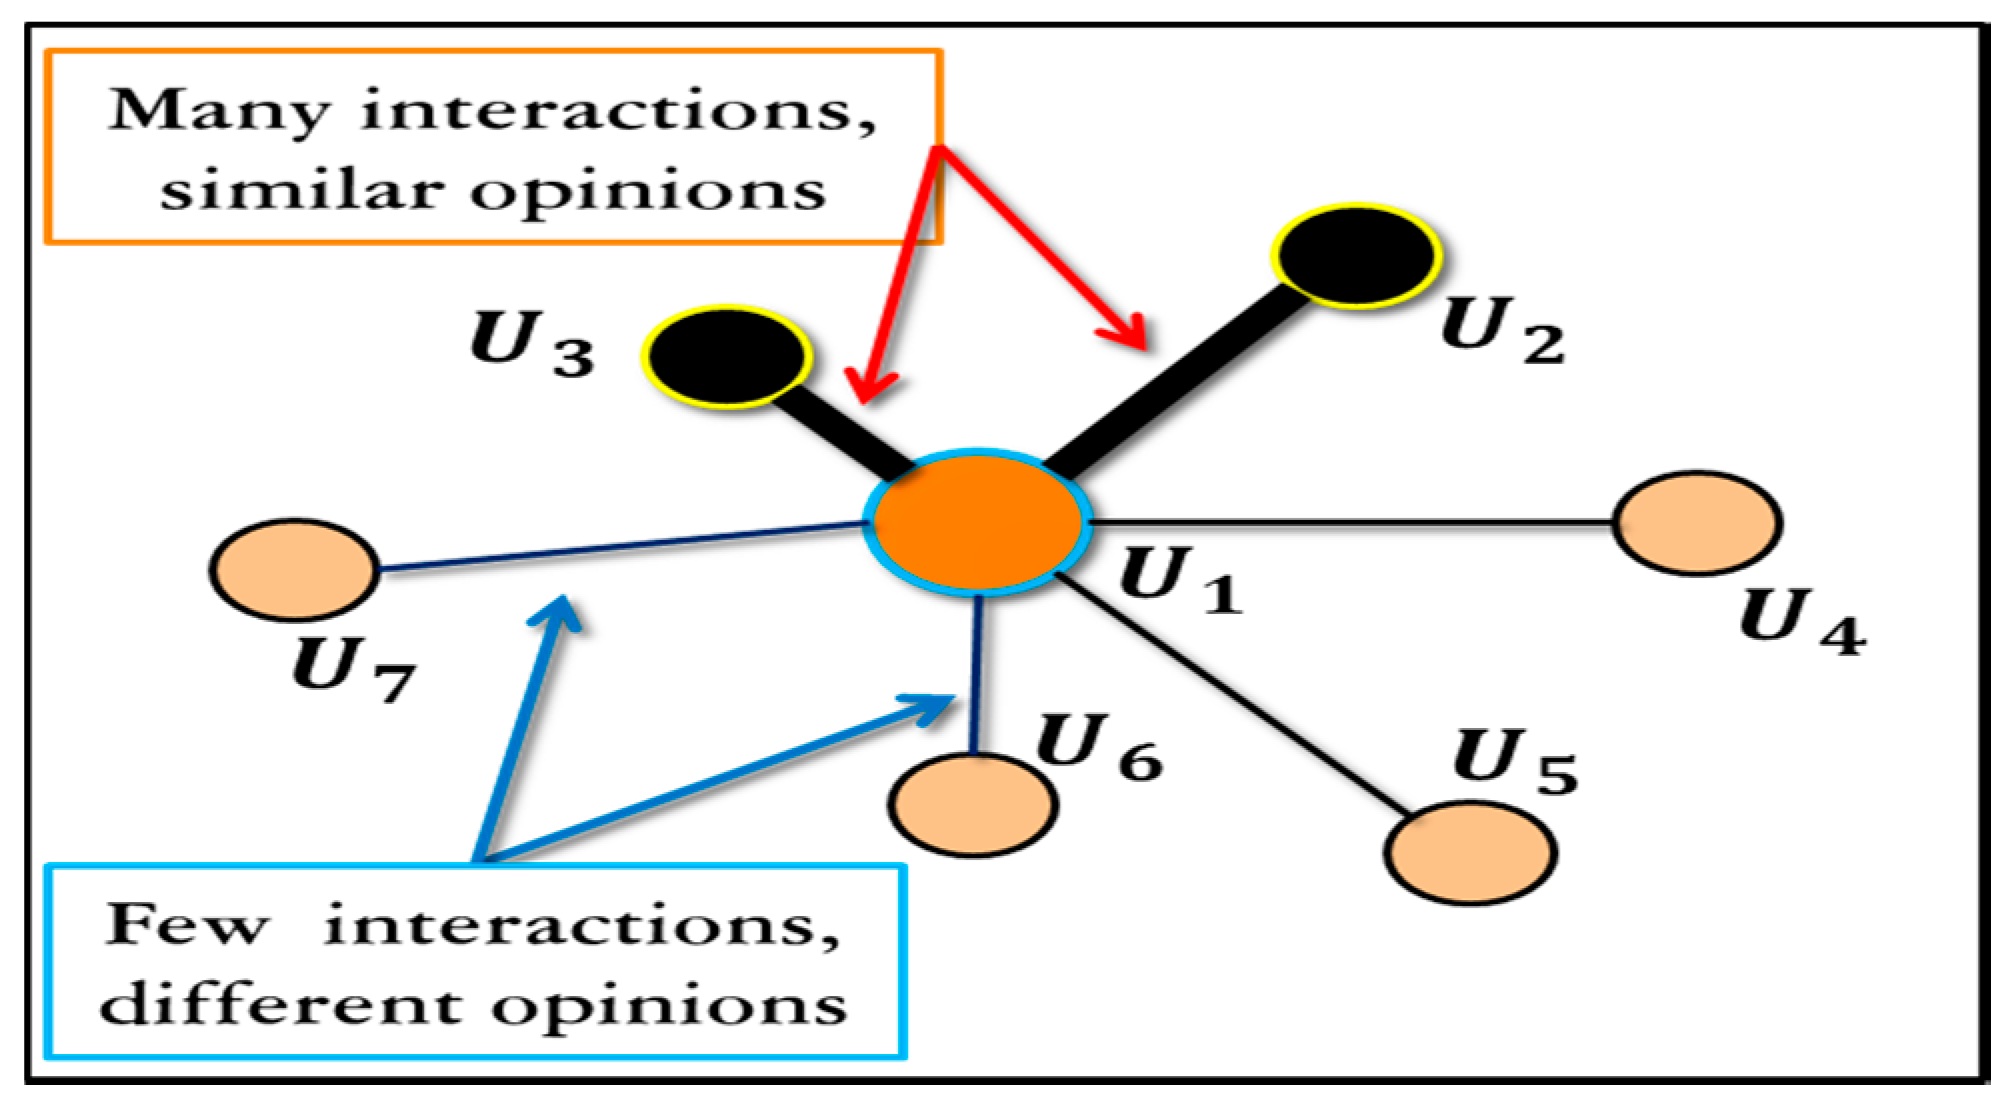
3.16. Estimating and Inferring the Strengths of Social Relations among Different People in SN Using Graphs
4. Summary and Discussion
- ▪
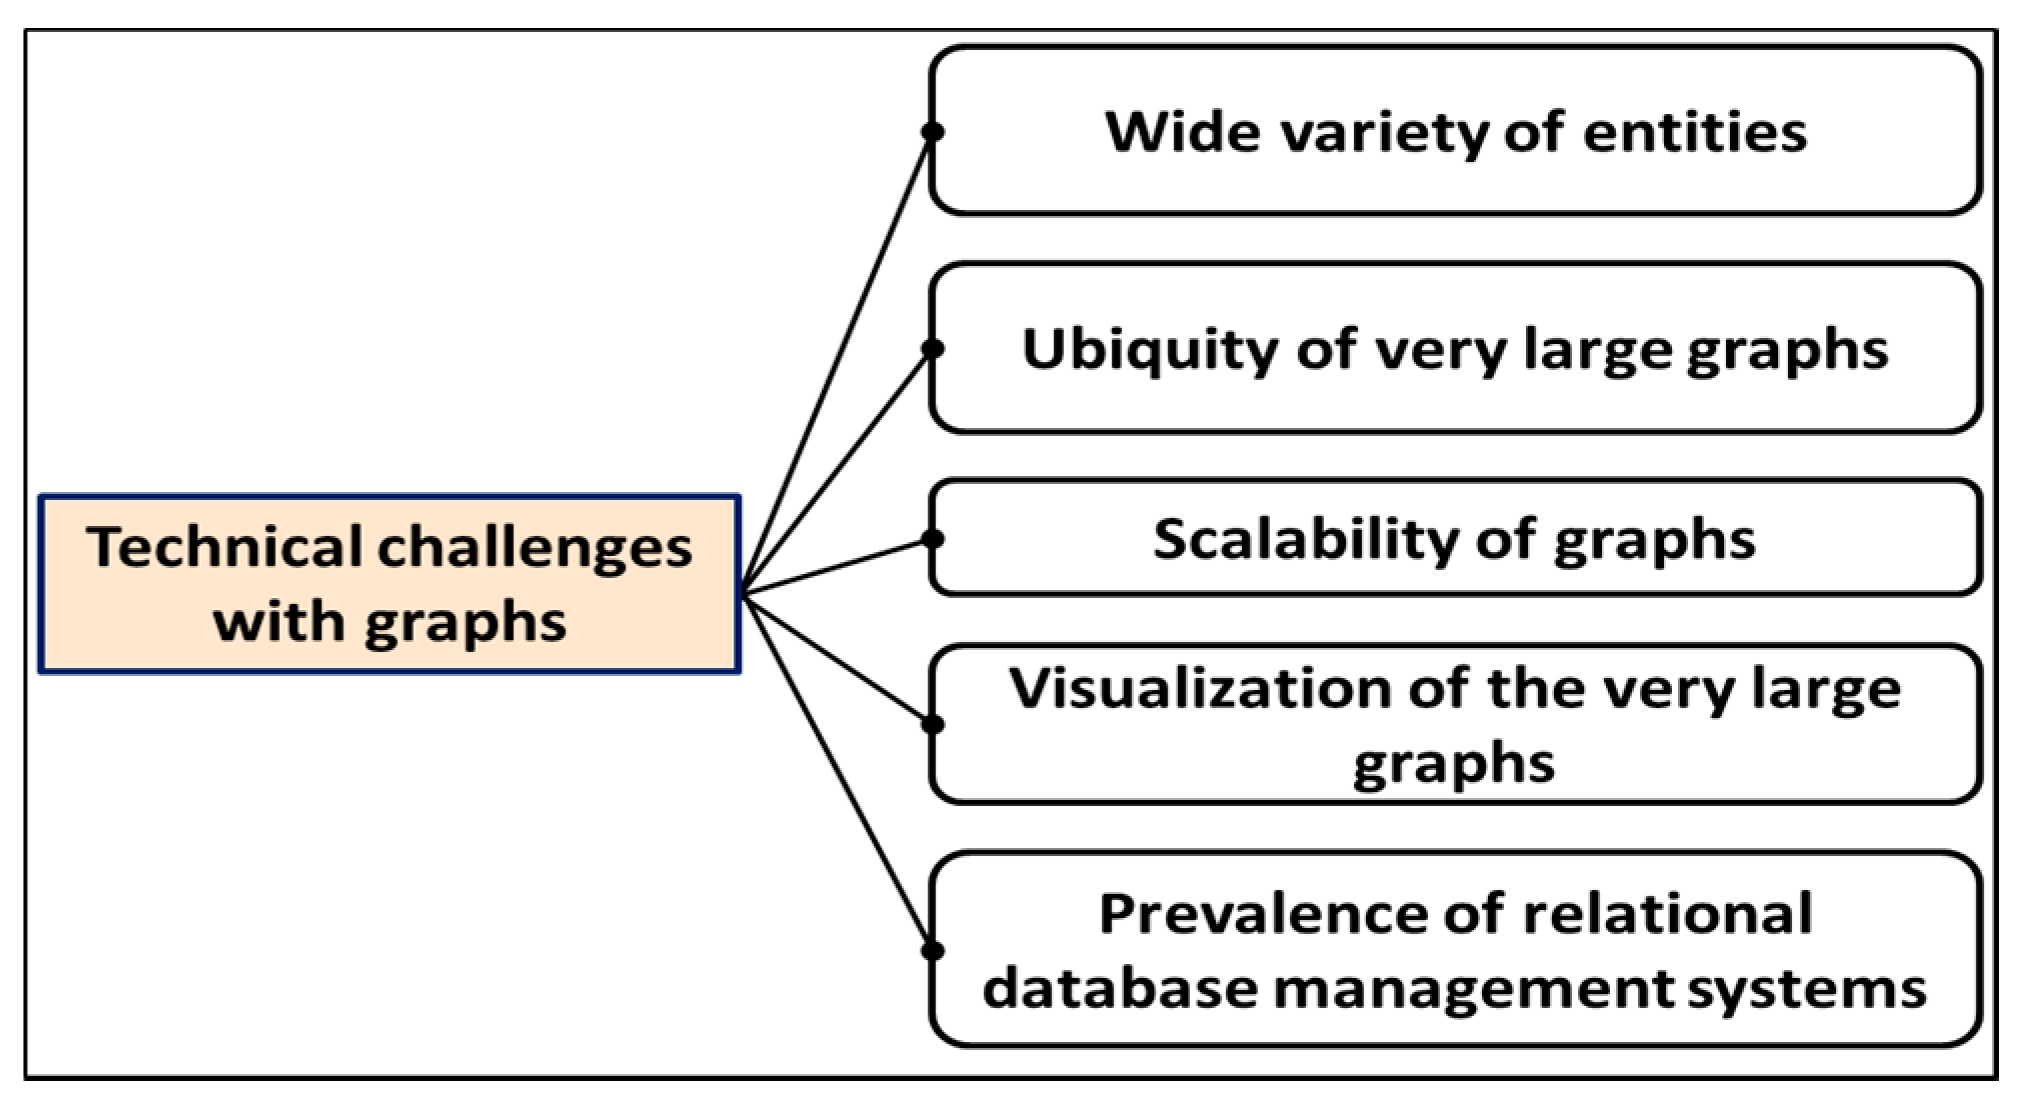
- Variety of entities: Generally, graphs represent a very wide variety of entities. However, many of them are not naturally distinguished to be used as vertices or edges. Interestingly, traditional companies collected data comprised of products, quotes, orders, and transactions, which are stored easily in the relational systems. Meanwhile, the graph rendering, and representation is not straightforward. Hence, it demands a flexible storage and retrieval system in graphical form.
- ▪
- Ubiquity: In many real-world problems, the size of graphs can be very large, often containing over a billion/trillion number of edges and nodes. These large graphs represent the entities and relationships between them. Therefore, their handling and processing is a big challenge. Organizations such as Google, Facebook, and Twitter are facing such problems.
- ▪
- Scalability: The capability to process very large graphs containing many users’ data efficiently is very challenging. Rendering of the large graphs needs extensive computing power and storage.
- ▪
- Data visualization: Visualization is an important task in participants’ graph processing. After scalability, the graph developers/users need appropriate visualization as their second most pressing challenge. The visualization of the large dataset containing many entities is extremely complex and selecting appropriate visualization is very challenging.
- ▪
- Prevalence of relational database management systems (RDBMs): In the presence of RDBMS, sometimes it becomes difficult to choose the task modelling between relational and structural.
- ▪
- Few trusted datasets of relevant scales exist that allow for rigorous evaluation of detection techniques on the graph data. The description of the backgrounds (normal patterns and noise) and foregrounds (target and anomalous patterns) are still being formalized.
- ▪
- Relationships of interest to many applications are highly dynamic. Dealing with large-scale dynamic graphs is an emerging research area, and significant efforts are needed to deal with such large-scale graphs.
- ▪
- In practice, many graphs can be made from a given dataset. However, determining what the graph’s representation will be the most effective for a particular task is a highly complex task.
- ▪
- In some real-world problems, it is necessary to quickly generate multiple different graphs from the same dataset or from multiple datasets. Meanwhile, storage, representation, and data-access techniques are often hard-coded, making this a difficult, error-prone, and time-consuming task.
- ▪
- Many graph algorithms have high computational complexity. Also, the complexity increases exponentially with the increase in number of entities. Many factors contribute to this inefficiency, for example, sparsity of data and poor data locality of operations.
- ▪
- The detection theory concept for graphs is a new area of research, and for the most settings, the performance bounds have not been explored well. Furthermore, for most datasets related to networks, there is no fine-grained manner to specify what type of patterns will be explored (i.e., be detectable), and what type of patterns will be subsumed in the noise.
5. Conclusion and Future Works
Author Contributions
Funding
Acknowledgments
Conflicts of Interest
References
- Sarma, S.V.M. Applications of Graph Theory in Human Life. Int. J. Comput. Appl. 2012, 1, 21–30. [Google Scholar]
- Journal, I.; Core, O.; Ijcem, M. A study of Vertex—Edge Coloring Techniques with Application. Int. J. Core Eng. Manag. 2014, 1, 27–32. [Google Scholar]
- Voloshin, V.I. Introduction to Graph Theory; Nova Science Publishers: New York, NY, USA, 2009; pp. 1–144. [Google Scholar]
- Kocay, W.; Kreher, D.L. Graphs, Algorithms, Optimization; Chapman & Hall/CRC Press: Boca Raton, FL, USA, 2017; pp. 1–483. [Google Scholar]
- Mondal, B.; De, K. Overview Applications of Graph Theory in Real Field. Int. J. Sci. Res. Comput. Sci. Eng. Inf. Technol. 2017, 2, 751–759. [Google Scholar]
- Robertson, N.; Seymour, P.; Thomas, R. Quickly excluding a planar graph. J. Comb. Theory Ser. B 1994, 62, 323–348. [Google Scholar] [CrossRef] [Green Version]
- Kaundal, K. Applications of Graph Theory in Everyday Life and Technology. Imp. J. Interdiscip. Res. 2017, 3, 892–894. [Google Scholar]
- Nagendram, N.V. A Note on Sufficient Cindition on Hamiltonian Path to Complete Graphs (SC-HPCG). IJMA 2011, 2, 1–6. [Google Scholar]
- Gärtner, T.; Flach, P.; Wrobel, S. On graph kernels: Hardness results and efficient alternatives. Lect. Notes Artif. Intell. (Subser. Lect. Notes Comput. Sci. 2003, 2777, 129–143. [Google Scholar]
- Bisen, S.K. Application of Graph Theory in Transportation Networks. Int. J. Sci. Res. Manag. 2017, 5, 10–12. [Google Scholar] [CrossRef]
- Tyagi, S.S. Statical Analysis of Social Network; JUIT (Jaypee university of information technology): Himachal Pradesh, India, 2014; pp. 1–99. [Google Scholar]
- Plummer, M.D. Some covering concepts in graphs. J. Comb. Theory 1970, 8, 91–98. [Google Scholar] [CrossRef] [Green Version]
- Sciences, D.M. A Survey on some Applications of Graph Theory in Cryptography. J. Discret. Math. Sci. Cryptogr. 2015, 18, 209–217. [Google Scholar]
- Ganzha, M.; Maciaszek, L. Position Papers of the 2019 Federated Conference on Computer Science and Information Systems; Springer: Leipzig, Germany, 2019; p. 19. [Google Scholar]
- Polak, M.; Roma, U. On the applications of Extremal Graph Theory to Coding Theory and Cryptography. Electron. Notes Discret. Math. 2013, 43, 329–342. [Google Scholar] [CrossRef]
- Jaromczyk, J.W.; Lonc, Z.; Truszczy, M. Constructions of asymptotically shortest k-radius sequences. J. Comb. Theory Ser. A 2012, 119, 731–746. [Google Scholar] [CrossRef] [Green Version]
- Yuan, M.; Chen, L.; Yu, P.S.; Mei, H. Privacy preserving graph publication in a distributed environment. World Wide Web 2015, 18, 1481–1517. [Google Scholar] [CrossRef]
- Iturria-medina, Y.; Sotero, R.C.; Canales-rodríguez, E.J.; Alemán-gómez, Y.; Melie-garcía, L. Studying the human brain anatomical network via diffusion-weighted MRI and Graph Theory. Neuroimage 2008, 40, 1064–1076. [Google Scholar] [CrossRef] [PubMed]
- Minor, E.S.; Urban, D.L. A Graph-Theory Framework for Evaluating Landscape Connectivity and Conservation Planning. Conserv. Biol. 2008, 22, 297–307. [Google Scholar] [CrossRef] [PubMed]
- Chrysochoos, A.; Louche, H. An infrared image processing to analyse the calorific effects accompanying strain localisation. Int. J. Eng. Sci. 2000, 16, 1759–1788. [Google Scholar]
- Salembier, P.; Garrido, L. Binary Partition Tree as an Efficient Representation for Image Processing, Segmentation, and Information Retrieval. IEEE Trans. Image Process. 2000, 9, 561–576. [Google Scholar] [CrossRef]
- Campbell, W.M.; Dagli, C.K.; Weinstein, C.J. Social network analysis with content and graphs. Linc. Lab. J. 2013, 20, 61–81. [Google Scholar]
- Shuman, D.I.; Narang, S.K.; Frossard, P.; Ortega, A.; Vandergheynst, P. The Emerging Field of Signal Processing. IEEE Signal Process. Mag. 2013, 30, 83–98. [Google Scholar] [CrossRef] [Green Version]
- Cordero, P.; Enciso, M.; Mora, A.; Ojeda-aciego, M.; Rossi, C. Knowledge-Based Systems Knowledge discovery in social networks by using a logic-based treatment of implications. Knowl.-Based Syst. 2015, 87, 16–25. [Google Scholar] [CrossRef]
- Lee, J. Kinematic Analysis of Tendon-Driven Robotic Mechanisms Using Graph Theory. ASME J. Mech. Trans. Automat. DXes. 1989, 111, 59–65. [Google Scholar]
- Demange, M.; Ekim, T.; de Werra, D. Discrete Optimization A tutorial on the use of graph coloring for some problems in robotics. Eur. J. Oper. Res. 2009, 192, 41–55. [Google Scholar] [CrossRef]
- Derrible, S.; Kennedy, C. Network Analysis of World Subway Systems Using Updated Graph Theory. Transp. Res. Rec. 2009, 2112, 17–25. [Google Scholar] [CrossRef]
- De Klerk, E. Exploiting special structure in semidefinite programming: A survey of theory and applications. Eur. J. Oper. Res. 2010, 201, 1–10. [Google Scholar] [CrossRef] [Green Version]
- Man, A.; So, C.; Ye, Y. A Semidefinite Programming Approach to Tensegrity Theory and Realizability of Graphs. In Proceedings of the Seventeenth Annual ACM-SIAM Symposium on Discrete Algorithms, SODA 2006, SMiami, FL, USA, 22–26 January 2006; Volume 6, pp. 1–17. [Google Scholar]
- Saerens, M.; Fouss, F.; Yen, L.; Dupont, P. The Principal Components Analysis of a Graph, and Its Relationships to Spectral Clustering. In Proceedings of the European conference on machine learning, Pisa, Italy, 20–24 September 2004; pp. 371–383. [Google Scholar]
- Qiantt, Y.; Suent, C.Y.; M, Q.H.G. Clustering Combination Method. In Proceedings of the 15th International Conference on Pattern Recognition, Barcelona, Spain, 3–7 September 2000; pp. 732–735. [Google Scholar]
- Brás, H.; Brito, P.; Pinto, J. A partitional clustering algorithm validated by a clustering tendency index based on graph theory. Pattern Recognit. 2006, 39, 776–788. [Google Scholar] [CrossRef]
- Brandes, U.; Gaertler, M.; Wagner, D. Experiments on Graph Clustering Algorithms. In Proceedings of the European Symposium on Algorithms, Copenhagen, Denmark, 7–9 September 2009; pp. 568–579. [Google Scholar]
- Dodel, S.; Herrmann, J.M.; Geisel, T. Functional connectivity by cross-correlation clustering. Neurocomputing 2002, 46, 1065–1070. [Google Scholar] [CrossRef]
- Pavan, M.; Pelillo, M.; Informatica, D.; Torino, V.; Mestre, V. A New Graph-Theoretic Approach to Clustering and Segmentation. In Proceedings of the 2003 IEEE Computer Society Conference on Computer Vision and Pattern Recognition, Madison, WI, USA, 18–20 June 2003. [Google Scholar]
- Durand, G.; Belacel, N.; Laplante, F. Graph theory based model for learning path recommendation. Inf. Sci. 2013, 251, 10–21. [Google Scholar] [CrossRef]
- Graves, M.; Bergeman, E.R.; Lawrence, C.B. A Graph-Theoretic Data Model for Genome Mapping Databases. In Proceedings of the Twenty-Eighth Annual Hawaii International Conference on System Sciences, Wailea, HI, USA, 3–6 January 1995. [Google Scholar]
- Kontokosta, C.E. Big Data + Big Cities: Graph Signals of Urban Air Pollution. IEEE Signal Process. Mag. 2014, 31, 130–136. [Google Scholar]
- Siqueira, S.; Eduardo, C.; Junior, B.; Comfort, W.E.; Rohde, L.A.; Sato, J.R. Abnormal Functional Resting-State Networks in ADHD: Graph Theory and Pattern Recognition Analysis of fMRI Data. BioMed Res. Int. 2014, 2014, 380531. [Google Scholar]
- Riaz, F.; Ali, K.M. Applications of Graph Theory in Computer Science. In Proceedings of the 2011 Third International Conference on Computational Intelligence, Communication Systems and Networks, Bali, Indonesia, 26–28 July 2011; pp. 142–145. [Google Scholar]
- Appel, K. Applications of Graph Theory in Computer Science an Overview. Int. J. Eng. Sci. Technol. 2010, 2, 4610–4621. [Google Scholar]
- Durgaprasad, D.; Snehadivya, M.; Kavitha, S. Applications of Computer Science Based on Graph theory. Int. J. Eng. Sci. 2017, 6, 1116–1122. [Google Scholar]
- Liu, Y.; Safavi, T.; Dighe, A.; Koutra, D. Graph Summarization Methods and Applications: A Survey. ACM Comput. Surv. 2018, 51, 1–34. [Google Scholar] [CrossRef]
- Yu, Q.; Du, Y.; Chen, J.; Sui, J.; Adalē, T.; Pearlson, G.D.; Calhoun, V.D. Application of Graph Theory to Assess Static and Dynamic Brain Connectivity: Approaches for Building Brain Graphs. Proc. IEEE 2018, 106, 886–906. [Google Scholar] [CrossRef] [PubMed]
- Sporns, O. Graph theory methods: Applications in brain networks. Dialogues Clin. Neurosci. 2018, 20, 111. [Google Scholar] [PubMed]
- Goyal, P.; Ferrara, E. Knowle dge-Base d Systems Graph emb e dding techniques, applications, and performance: A survey. Knowledge-Based Syst. 2018, 151, 78–94. [Google Scholar] [CrossRef] [Green Version]
- Bondy, J.A.; Murty, U.S.R. Graph Theory with Applications; Oxford: New York, NY, USA; Amsterdam, The Netherlands; Oxford, UK, 1982. [Google Scholar]
- Farahani, F.V.; Karwowski, W.; Lighthall, N.R. Application of Graph Theory for Identifying Connectivity Patterns in Human Brain Networks: A Systematic Review. Front. Neurosci. 2019, 13, 585. [Google Scholar] [CrossRef]
- Gupta, S.; Singh, M.; Madan, A.K. Application of graph theory: Relationship of eccentric connectivity index and Wiener’s index with anti-inflammatory activity. J. Math. Anal. Appl. 2002, 266, 259–268. [Google Scholar] [CrossRef] [Green Version]
- Pavlopoulos, G.A.; Secrier, M.; Moschopoulos, C.N.; Soldatos, T.G.; Kossida, S.; Aerts, J.; Schneider, R.; Bagos, P.G. Using graph theory to analyze biological networks. BioData Min. 2011, 4, 10. [Google Scholar] [CrossRef] [Green Version]
- Hansen, P.; Mélot, H. Computers and discovery in algebraic graph theory. Linear Algebra Appl. 2002, 356, 211–230. [Google Scholar] [CrossRef] [Green Version]
- Cvetković, D.; Simić, S. Graph spectra in Computer Science. Linear Algebra Appl. 2011, 434, 1545–1562. [Google Scholar] [CrossRef] [Green Version]
- PalSingh, R.; Vandana, V. Application of Graph Theory in Computer Science and Engineering. Int. J. Comput. Appl. 2014, 104, 10–13. [Google Scholar] [CrossRef]
- Spielman, D.A.; Sachs, H.; Theory, A.G.; Godsil, C. Spectral Graph Theory and its Applications. In Proceedings of the 48th Annual IEEE Symposium on Foundations of Computer Science, Providence, RI, USA, 21–23 October 2007; pp. 29–38. [Google Scholar]
- Agarwal, S.; Mehta, S. Social Influence Maximization Using Genetic Algorithm with Dynamic Probabilities. In Proceedings of the 2018 Eleventh International Conference on Contemporary Computing (IC3), Noida, India, 2–4 August 2018; pp. 1–6. [Google Scholar]
- Science, C. Related: An R package for analysing pairwise relatedness from codominant molecular markers. Mol. Ecol. Resour. 2015, 15, 557–561. [Google Scholar]
- Hsiung, P.; Wang, F. A State Graph Manipulator Tool for Real-Time System Specification and Verification. In Proceedings of the Fifth International Conference on Real-Time Computing Systems and Applications, Hiroshima, Japan, 27–29 October 1998. [Google Scholar]
- Hurd, J. Composable Packages for Higher Order Logic Theories. In Proceedings of the Verification Workshop, Edinburgh, UK, 20–21 July 2010; Volume 3, pp. 79–93. [Google Scholar]
- Valdes, R. The Competitive Dynamics of the Consumer Web: Five Graphs Deliver a Sustainable Advantage; Gartner: Stamford, CT, USA, 2012; Available online: https://www.gartner.com/doc/2081316/competitive-dynamics-consumer-web-graphs (accessed on 11 January 2019).
- Wang, J.; Cong, G.; Zhao, W.X.; Li, X. Mining user intents in Twitter: A semi-supervised approach to inferring intent categories for tweets. In Proceedings of the Twenty-Ninth AAAI Conference on Artificial Intelligence, Austin, TX, USA, 25–30 January 2015; pp. 318–324. [Google Scholar]
- Reilly, K.D. The GPSS-GASP Combined (GGC) System. Int. J. Comput. Inf. Sci. 1983, 12, 111–136. [Google Scholar]
- Chell, E.; Mercer, M.R. CADTOOLS: A CAD algorithm development system. In Proceedings of the 22nd ACM/IEEE Design Automation Conference, Las Vegas, NV, USA, 23 June 1985; pp. 658–666. [Google Scholar]
- Rheinboldt, W.C.; Basilli, V.R.; Charles, K. Mesztenyi. On a programming language for graph algorithms. BIT Numer. Math. 1972, 12, 220–241. [Google Scholar] [CrossRef] [Green Version]
- Mokhtari, H.; Dadgar, M. A Flexible Job Shop Scheduling Problem with Controllable Processing Times to Optimize Total Cost of Delay and Processing. Int. J. Supply Oper. Manag. 2015, 2, 871. [Google Scholar]
- Dawood, H.A.; William, R. Graph T Theory and Cyber Security. In Proceedings of the 2014 3rd International Conference on Advanced Computer Science Applications and Technologies, Amman, Jordan, 29–30 December 2014; pp. 90–96. [Google Scholar]
- Majeed, A.; Farooq, R.; Masoom, A.; Nadeem, A. Near—Miss situation based visual analysis of SIEM rules for real time network security monitoring. J. Ambient. Intell. Humaniz. Comput. 2019, 10, 1509–1526. [Google Scholar] [CrossRef]
- Majeed, A.; Rauf, I. MVC Architecture: A Detailed Insight to the Modern Web Applications Development. Peer Rev. J. Solar Photoenergy Syst. 2018, 1, 1–7. [Google Scholar]
- Schenker, A.; Last, M.; Bunke, H.; Kandel, A. Chapter? Clustering of Web Documents Using a Graph Model. In Web Document Analysis: Challenges and Opportunities; World Scientific Publishing Company: Singapore, 2003; pp. 3–18. [Google Scholar]
- Jain, B.J.; Obermayer, K. Graph quantization. Comput. Vis. Image Underst. 2011, 115, 946–961. [Google Scholar] [CrossRef]
- Kalogeratos, A.; Likas, A. Data & Knowledge Engineering Document clustering using synthetic cluster prototypes. Data Knowl. Eng. 2011, 70, 284–306. [Google Scholar]
- Jarvenpaa, S.L.; Todd, P.A. Consumer reactions to electronic shopping on the World Wide Web. Int. J. Electron. Commer. 1996, 1, 59–88. [Google Scholar] [CrossRef]
- Zhao, R.; Grosky, W.I. Narrowing the Semantic Gap—Improved Text-Based Web Document Retrieval Using Visual Features. IEEE Trans. Multimed. 2002, 4, 189–200. [Google Scholar] [CrossRef]
- Zeithaml, V.A.; Parasuraman, A.; Malhotra, A. Service quality delivery through web sites: a critical review of extant knowledge. J. Acad. Mark. Sci. 2002, 30, 362–375. [Google Scholar] [CrossRef] [Green Version]
- Schenker, A.; Last, M.; Bunke, H.; Kandel, A. Graph Representations for Web Document Clustering. In Iberian Conference on Pattern Recognition and Image Analysis; Springer: Berlin/Heidelberg, Germany, 2003; pp. 935–942. [Google Scholar]
- Madan, R.; Cui, S.; Lall, S.; Goldsmith, A. Modeling and Optimization of Transmission Schemes in Energy Constrained Wireless Sensor Networks. IEEE/ACM Trans. Netw. 2007, 15, 1359–1372. [Google Scholar] [CrossRef]
- Du, C.; Shao, S.; Qi, F.; Meng, L. Multi-requests satisfied based on energy optimization for the service composition in wireless sensor network. Int. J. Distrib. Sens. Netw. 2019, 15, 1550147719879049. [Google Scholar] [CrossRef] [Green Version]
- Kumar, J.S.; Zaveri, M.A. Graph based clustering for two-tier architecture in Internet of things. In Proceedings of the 2016 IEEE International Conference on Internet of Things (iThings) and IEEE Green Computing and Communications (GreenCom) and IEEE Cyber, Physical and Social Computing (CPSCom) and IEEE Smart Data (SmartData), Chengdu, China, 15–18 December 2016; pp. 229–233. [Google Scholar]
- Shivraj, V.L.; Rajan, M.A.; Balamuralidhar, P. A Graph theory based Generic Risk Assessment framework for Internet of Things (IoT). In Proceedings of the 2017 IEEE International Conference on Advanced Networks and Telecommunications Systems (ANTS), Bhubaneswar, India, 17–20 December 2017; pp. 1–6. [Google Scholar]
- Yao, B.; Liu, X.; Zhang, W.; Chen, X. Applying Graph Theory To The Internet of Things. In Proceedings of the 2013 IEEE 10th International Conference on High Performance Computing and Communications & 2013 IEEE International Conference on Embedded and Ubiquitous Computing, Zhangjiajie, China, 13–15 November 2013; pp. 2354–2361. [Google Scholar]
- Ning, Z.; Wang, X.; Member, S. A Social-Aware Group Formation Framework for Information Diffusion in Narrowband Internet of Things. IEEE Internet Things J. 2018, 5, 1527–1538. [Google Scholar] [CrossRef]
- Rathore, M.M.; Ahmad, A.; Paul, A. Efficient Graph-Oriented Smart Transportation using Internet of Things generated Big Data. In Proceedings of the 2015 11th International Conference on Signal-Image Technology & Internet-Based Systems (SITIS), Bangkok, Thailand, 23–27 November 2015; pp. 512–519. [Google Scholar]
- Wang, H.; Chen, Z.; Zhao, J.; Di, X.; Liu, D.A.N. A Vulnerability Assessment Method in Industrial Internet of Things Based on Attack Graph and Maximum Flow. IEEE Access 2018, 6, 8599–8609. [Google Scholar] [CrossRef]
- Chen, P.; Member, S.; Cheng, S.; Chen, K. Information Fusion to Defend Intentional Attack in Internet of Things. IEEE Internet Things J. 2014, 1, 337–348. [Google Scholar] [CrossRef]
- Abdellatif, K.; Abdelmouttalib, C. Graph-Based Computing Resource Allocation for Mobile Blockchain. In Proceedings of the 2018 6th International Conference on Wireless Networks and Mobile Communications (WINCOM), Marrakesh, Morocco, 16–19 October 2018; pp. 1–4. [Google Scholar]
- Akcora, C.G.; Gel, Y.R.; Kantarcioglu, M. 1 Blockchain: A Graph Primer. arXiv 2017, arXiv:1708.08749. [Google Scholar]
- Salah, K.; Member, S.; Rehman, M.H.U.R. Blockchain for AI: Review and Open Research Challenges. IEEE Access 2019, 7, 10127–10149. [Google Scholar] [CrossRef]
- Wang, S.; Wang, J.; Wang, X.; Qiu, T.; Yuan, Y.; Ouyang, L.; Guo, Y.; Wang, F.Y. Blockchain-Powered Parallel Healthcare Systems Based on the ACP Approach. IEEE Trans. Comput. Soc. Syst. 2018, 5, 942–950. [Google Scholar] [CrossRef]
- Di, D.; Maesa, F.; Marino, A.; Ricci, L. Uncovering the Bitcoin blockchain: An analysis of the full users graph. In Proceedings of the 2016 IEEE International Conference on Data Science and Advanced Analytics (DSAA), Montreal, QC, Canada, 17–19 October 2016; pp. 537–546. [Google Scholar]
- He, Y.; Gao, C.; Sang, N.; Qu, Z.; Han, J. Neurocomputing Graph coloring based surveillance video synopsis. Neurocomputing 2017, 225, 64–79. [Google Scholar] [CrossRef]
- Feng, P.; Xu, C.; Zhao, Z.; Liu, F.; Yuan, C.; Wang, T. Neurocomputing Sparse representation combined with context information for visual tracking. Neurocomputing 2017, 225, 92–102. [Google Scholar] [CrossRef]
- Malyshev, D.S. The weighted coloring problem for two graph classes characterized by small forbidden induced structures. Discret. Appl. Math. 2018, 247, 423–432. [Google Scholar] [CrossRef]
- Dabrowski, K.K.; Lozin, V.; Raman, R.; Ries, B. Colouring vertices of triangle-free graphs without forests. Discret. Math. 2012, 312, 1372–1385. [Google Scholar] [CrossRef]
- Dickinson, S. Introduction to the Special Section on Graph Algorithms in Computer Vision. IEEE Trans. Pattern Anal. Mach. Intell. 2001, 10, 1049–1052. [Google Scholar] [CrossRef] [Green Version]
- Durst, C.; Durst, C. Online Social Networks, Social Capital and Health- related Behaviors: A State-of-the-art Analysis. Commun. Assoc. Inf. Syst. 2013, 32, 5. [Google Scholar] [CrossRef]
- Jin, R.; Zhang, H.; Zhang, Y. The social negative mood index for social networks. In Proceedings of the 2018 IEEE Third International Conference on Data Science in Cyberspace (DSC), Guangzhou, Chin, 18–21 June 2018; pp. 1–5. [Google Scholar]
- Kolli, N.; Balakrishnan, N. Analysis of e-mail Communication Using a Social Network Framework for Crisis Detection in an Organization Science Direct. Procedia—Soc. Behav. Sci. 2013, 100, 57–67. [Google Scholar] [CrossRef] [Green Version]
- He, C.; Li, H.; Fei, X.; Tang, Y.; Zhu, J. A Topic Community-based Method for Friend Recommendation in Online Social Networks via Joint Nonnegative Matrix Factorization. In Proceedings of the 2015 Third International Conference on Advanced Cloud and Big Data, Yangzhou, China, 30 October–1 November 2015; pp. 28–35. [Google Scholar]
- Wieringa, J.; Kannan, P.K.; Ma, X.; Reutterer, T.; Risselada, H.; Skiera, B. Data analytics in a privacy-concerned world. J. Bus. Res. 2019. [Google Scholar] [CrossRef]
- Liu, F.; Joo, H. Expert Systems with Applications Use of social network information to enhance collaborative filtering performance. Expert Syst. Appl. 2010, 37, 4772–4778. [Google Scholar] [CrossRef]
- Liu, D.; Wang, L.; Zheng, J.; Ning, K.; Zhang, L. Social Network. In Proceedings of the 2013 IEEE International Conference on Services Computing, Santa Clara, CA, USA, 28 June–3 July 2013; pp. 368–375. [Google Scholar]
- Beach, A.; Gartrell, M.; Han, R. Social-K: Real-Time K-Anonymity Guarantees for Social Network Applications. In Proceedings of the 2010 8th IEEE International Conference on Pervasive Computing and Communications Workshops (PERCOM Workshops), Mannheim, Germany, 29 March–2 April 2010; pp. 600–606. [Google Scholar]
- Zin, T.T.; Tin, P.; Hama, H.; Toriu, T. Knowledge based Social Network Applications to Disaster Event Analysis. In Proceedings of the International Multi Conference of Engineers and Computer Scientists, Hong Kong, China, 13–15 March 2013. [Google Scholar]
- Li, Y.; Hsiao, H.; Lee, Y. Infor mation Sciences Recommending social network applications via social filtering mechanisms. Inf. Sci. 2013, 239, 18–30. [Google Scholar] [CrossRef]
- Zhang, N. Preserving Relation Privacy in Online Social Network Data. IEEE Internet Comput. 2011, 15, 35–42. [Google Scholar]
- Izuan, M.; Ninggal, H. Attack Vector Analysis and Privacy-Preserving Social Network Data Publishing. In Proceedings of the 2011 IEEE 10th International Conference on Trust, Security and Privacy in Computing and Communications, Changsha, China, 16–18 November 2011; pp. 847–852. [Google Scholar]
- Chow, W.S.; Chan, L.S. Information & Management Social network, social trust and shared goals in organizational knowledge sharing. Inf. Manag. 2008, 45, 458–465. [Google Scholar]
- Li, P.; Yu, J.; Liu, J.; Zhou, D.; Cao, B. Generating weighted social networks using multigraph. Phys. A Stat. Mech. Its Appl. 2020, 539, 122894. [Google Scholar] [CrossRef]
- Zhou, B. A Brief Survey on Anonymization Techniques for Privacy Preserving Publishing of Social Network Data. ACM Sigkdd Explor. Newsl. 2008, 10, 12–22. [Google Scholar] [CrossRef]
- Li, M.; Wang, X.; Gao, K.; Zhang, S. A Survey on Information Diffusion in Online Social Networks: Models and Methods. Information 2017, 8, 118. [Google Scholar]
- Tabrizi, S.A.; Shakery, A.; Asadpour, M.; Abbasi, M.; Tavallaie, M.A. Personalized PageRank Clustering: A graph clustering algorithm based on random walks. Phys. A Stat. Mech. Appl. 2013, 392, 5772–5785. [Google Scholar] [CrossRef]
- Rehman, A.U.; Jiang, A.; Rehman, A.; Paul, A.; Sadiq, M.T. Identification and role of opinion leaders in information diffusion for online discussion network. J. Ambient. Intell. Humaniz. Comput. 2020, 1–13. [Google Scholar] [CrossRef]
- Guille, A.; Hacid, H.; Zighed, D.A. Information Diffusion in Online Social Networks: A Survey. ACM Sigmod Rec. 2013, 42, 17–28. [Google Scholar] [CrossRef]
- Bian, T.; Deng, Y. Identifying influential nodes in complex networks: A node information dimension approach. Chaos: Interdiscip. J. Nonlinear Sci. 2018, 28, 043109. [Google Scholar] [CrossRef] [PubMed]
- Li, C.; Wang, L.; Sun, S.; Xia, C. Identification of influential spreaders based on classified neighbors in real-world complex networks. Appl. Math. Comput. 2018, 320, 512–523. [Google Scholar] [CrossRef] [Green Version]
- Zeng, A.; Zhang, C. Ranking spreaders by decomposing complex networks. Phys. Lett. A 2013, 377, 1031–1035. [Google Scholar] [CrossRef] [Green Version]
- Mao, C. Research Article A Comprehensive Algorithm for Evaluating Node Influences in Social Networks Based on Preference Analysis and Random Walk. Complexity 2018, 2018, 1528341. [Google Scholar] [CrossRef]
- Zheng, Y.; Xu, J. A trust transitivity model for group decision making in social network with intuitionistic fuzzy information. Filomat 2018, 32, 1937–1945. [Google Scholar] [CrossRef] [Green Version]
- Davies, R.; Ghosh-dastidar, U.; Knisley, J.; Samyono, W. Function: Identifying Biologically Relevant Clusters with Graph Spectral Methods; Elsevier Inc.: Geneva, Switzerland, 2019. [Google Scholar]
- Cacheda, F.; Fernandez, D.; Novoa, F.J.; Carneiro, V. Early Detection of Depression: Social Network Analysis and Random Forest Techniques. J. Med. Internet Res. 2019, 21, e12554. [Google Scholar] [CrossRef] [PubMed]
- Lee, S.; Cha, Y.; Han, S.; Hyun, C. Application of Association Rule Mining and Social Network Analysis for Understanding Causality of Construction Defects. Sustainability 2019, 11, 618. [Google Scholar] [CrossRef] [Green Version]
- Atzmueller, M. Modeling and Mining Feature-Rich Networks. In Companion Proceedings of the 2019 World Wide Web Conference, San Francisco, CA, USA, May 2019; pp. 16–17. [Google Scholar]
- Anufrieva, E.; Borodina, E. Analysis of the social well-being of urban citizens: Gender aspect in the conditions of digital transformation. In Proceedings of the 1st International Scientific Practical Conference the Individual and Society in the Modern Geopolitical Environmentvol; Atlantis Press: Prague, Czech Republic, 2019; pp. 34–39. [Google Scholar]
- Mahmoudi, A.; Ridzwan, M.; Azuraliza, Y.; Bakar, A. A new method to discretize time to identify the milestones of online social networks. Soc. Netw. Anal. Min. 2018, 8, 34. [Google Scholar] [CrossRef]
- Dekker, A. Centrality in social networks: Theoretical and simulation approaches. In Proceedings of the SimTect, Melbourne, Australia, 12–15 May 2008; pp. 33–38. [Google Scholar]
- Shelke, S.; Attar, V. Source detection of rumor in social network—A review. Online Soc. Netw. Media 2019, 9, 30–42. [Google Scholar] [CrossRef]
- Shiokawa, H.; Fujiwara, Y.; Onizuka, M. Fast Algorithm for Modularity-Based Graph Clustering. In Proceedings of the Twenty-Seventh AAAI Conference on Artificial Intelligence, Bellevue, WA, USA, 14–18 July 2013; pp. 1170–1176. [Google Scholar]
- Radley, S.; Sybi, C.J.; Premkumar, K. Multi Information Amount Movement Aware—Routing in FANET: Flying Ad-hoc Networks. In Mobile Networks and Applications; Springer: New York, USA, 2019. [Google Scholar]
- Newman, M.E.J. Modularity and community structure in networks. Proc. Natl. Acad. Sci. USA 2006, 103, 8577–8582. [Google Scholar] [CrossRef] [Green Version]
- Chen, Z.; Liu, B. Mining Topics in Documents: Standing on the Shoulders of Big Data. In Proceedings of the 20th ACM SIGKDD International Conference on Knowledge discovery and Data Mining, New York, NY, USA, 24–27 August 2014; pp. 1116–1125. [Google Scholar]
- Poria, S.; Cambria, E.; Gelbukh, A. Knowle dge-Base d Systems Aspect extraction for opinion mining with a deep convolutional neural network. Knowl.-Based Syst. 2016, 108, 42–49. [Google Scholar] [CrossRef]
- Chen, A.Z.; Mukherjee, M.; Hsu, M. Castellanos, Exploiting Domain Knowledge in Aspect Extraction. In Proceedings of the 2013 Conference on Empirical Methods in Natural Language Processing, Seattle, WA, USA, 18–21 October 2013; pp. 1655–1667. [Google Scholar]
- Xing, L.; Deng, K.; Wu, H.; Xie, P.; Gao, J. Behavioral Habits-Based User Identification across Social Networks. Symmetry 2019, 11, 1134. [Google Scholar] [CrossRef] [Green Version]
- Xing, L.; Deng, K.; Wu, H.; Xie, P.; Zhao, H.V.; Gao, F. A Survey of Across Social Networks User Identification. IEEE Access 2019, 7, 137472–137488. [Google Scholar] [CrossRef]
- Liao, L.; He, X.; Zhang, H.; Chua, T.S. Attributed social network embedding. IEEE Trans. Knowl. Data Eng. 2018, 30, 2257–2270. [Google Scholar] [CrossRef] [Green Version]
- Ok, M.; Lee, J.S.; Kim, Y.B. Recommendation framework combining user interests with fashion trends in apparel online shopping. Appl. Sci. 2019, 9, 2634. [Google Scholar] [CrossRef] [Green Version]
- Type, I.; Dissertation, E. Graph-Based Analysis for E-In the Graduate College; Academic Press: New York, NY, USA, 2019. [Google Scholar]
- Feng, Z.; Lien, J.W.; Zheng, J. Keeping up with the Neighbors: Social Interaction in a Production Economy. Mathematics 2018, 6, 162. [Google Scholar] [CrossRef] [Green Version]
- Shi, C. A Survey of Heterogeneous Information Network Analysis. IEEE Trans. Knowl. Data Eng. 2016, 29, 17–37. [Google Scholar] [CrossRef]
- Yang, D.; Qu, B.; Cudre-mauroux, P. Privacy-Preserving Social Media Data Publishing for Personalized Ranking-Based Recommendation. IEEE Trans. Knowl. Data Eng. 2019, 31, 507–520. [Google Scholar] [CrossRef] [Green Version]
- Abawajy, J.H.; Member, S.; Izuan, M.; Ninggal, H.; Herawan, T. Privacy Preserving Social Network Data Publication. IEEE Commun. Surv. Tutor. 2016, 18, 1974–1997. [Google Scholar] [CrossRef]
- Xu, L.E.I.; Jiang, C.; Wang, J. Information Security in Big Data: Privacy and Data Mining. IEEE Access 2014, 2, 1149–1176. [Google Scholar]
- Zhou, P.; Wang, K.; Guo, L. A Privacy-Preserving Distributed Contextual Federated Online Learning Framework with Big Data Support in Social Recommender Systems. IEEE Trans. Knowl. Data Eng. 2019. [Google Scholar] [CrossRef]
- Majeed, A. Attribute-centric anonymization scheme for improving user privacy and utility of publishing e-health data. J. King Saud Univ.-Comput. Inf. Sci. 2019, 31, 426–435. [Google Scholar] [CrossRef]
- Wang, S.; Tsai, Z.; Hong, T.; Ting, I.; Engineering, I. A Nonymizing Shortest Paths on Social Network Graphs 1 Introduction. In Proceedings of the Asian Conference on Intelligent Information and Database Systems, Daegu, Korea, 20–22 April 2011. [Google Scholar]
- Kiabod, M.; Dehkordi, M.N.; Barekatain, B. TSRAM: A time-saving k-degree anonymization method in social network. Expert Syst. Appl. 2019, 125, 378–396. [Google Scholar] [CrossRef]
- Herrera-joancomartí, J.C.J. A survey of graph-modification techniques for privacy-preserving on networks. Artif. Intell. Rev. 2017, 47, 341–366. [Google Scholar]
- Bhattacharya, M. Preserving Privacy in Social Network Graph with K-anonymize Degree Sequence Generation. In Proceedings of the 2015 9th International Conference on Software, Knowledge, Information Management and Applications (SKIMA), Kathmandu, Nepal, 15–17 December 2015. [Google Scholar]
- Liu, P.; Li, X. An Improved Privacy Preserving Algorithm for Publishing Social Network Data. In Proceedings of the 2013 IEEE 10th International Conference on High Performance Computing and Communications & 2013 IEEE International Conference on Embedded and Ubiquitous Computing, Zhangjiajie, China, 13–15 November 2013; pp. 888–895. [Google Scholar]
- Madan, S. A Privacy Preserving Scheme for Big data Publishing in the Cloud using k-Anonymization and Hybridized Optimization Algorithm. In Proceedings of the 2018 International Conference on Circuits and Systems in Digital Enterprise Technology (ICCSDET), Kottayam, India, 21–22 December 2018; pp. 1–7. [Google Scholar]
- Chakraborty, S.; Ambooken, J.G.; Tripathy, B.K.; Purushotham, S. Analysis and performance enhancement to achieve recursive (c, l) diversity anonymization in social networks. Trans. Data Priv. 2015, 8, 173–215. [Google Scholar]
- Casas-Roma, J. An evaluation of vertex and edge modification techniques for privacy-preserving on graphs. J. Ambient. Intell. Humaniz. Comput. 2019, 11, 1–17. [Google Scholar] [CrossRef]
- Moriano, P.; Finke, J.; Ahn, Y.Y. Community-Based Event Detection in Temporal Networks. Sci. Rep. 2019, 9, 1–9. [Google Scholar] [CrossRef]
- Zheleva, E.; Getoor, L. Social Network Data Analytics. Soc. Netw. Data Anal. 2011, 196–210. Available online: https://link.springer.com/chapter/10.1007/978-1-4419-8462-3_10 (accessed on 20 February 2020).
- Kayes, I.; Iamnitchi, A. Privacy and security in online social networks: A survey. Online Soc. Netw. Media 2017, 3, 1–21. [Google Scholar] [CrossRef] [Green Version]
- Huber, M.; Mulazzani, M.; Weippl, E.; Kitzler, G.; Goluch, S. Friend-in-the-middle attacks: Exploiting social networking sites for spam. IEEE Internet Comput. 2011, 15, 28–34. [Google Scholar] [CrossRef]
- Yeung, A.C.M.A.; Iwata, T. Research on social network mining and its future development. NTT Technol. Rev. 2011, 9, 1–4. [Google Scholar]
- Can, U.; Alatas, B. A new direction in social network analysis: Online social network analysis problems and applications. Phys. A Stat. Mech. Appl. 2019, 535, 122372. [Google Scholar] [CrossRef]
- Sahu, S.; Mhedhbi, A.; Salihoglu, S.; Lin, J.; Özsu, M.T. The ubiquity of large graphs and surprising challenges of graph processing: Extended survey. VLDB J. 2019, 29, 1–24. [Google Scholar] [CrossRef] [Green Version]
- Bliss, N.T.; Schmidt, M.C. Confronting the Challenges of Graphs and Networks. Linc. Lab. J. 2013, 20, 4–9. [Google Scholar]
- Ren, X.; Wang, Y.; Yu, X.; Yan, J.; Chen, Z.; Han, J. Heterogeneous graph-based intent learning with queries, web pages and Wikipedia concepts. In Proceedings of the 7th ACM International Conference on Web Search and Data Mining, New York, NY, USA, 24–28 February 2014; pp. 23–32. [Google Scholar]


| ADVANCE | GENERATE | PRIORITY | SEIZE |
| ALTER | JOIN | QUEUE | SPLIT |
| ASSIGN | LEAVE | RELEASE | TABULATE |
| BUFFER | LINK | REMOVE | TERMINATE |
| DEPART | MARK | RETURN | TEST |
| ENTER | MSA VEVALUE | SAVE VALUE | TANSFER |
| EXAMINE | PREEMPT | SCAN | UNLINK |
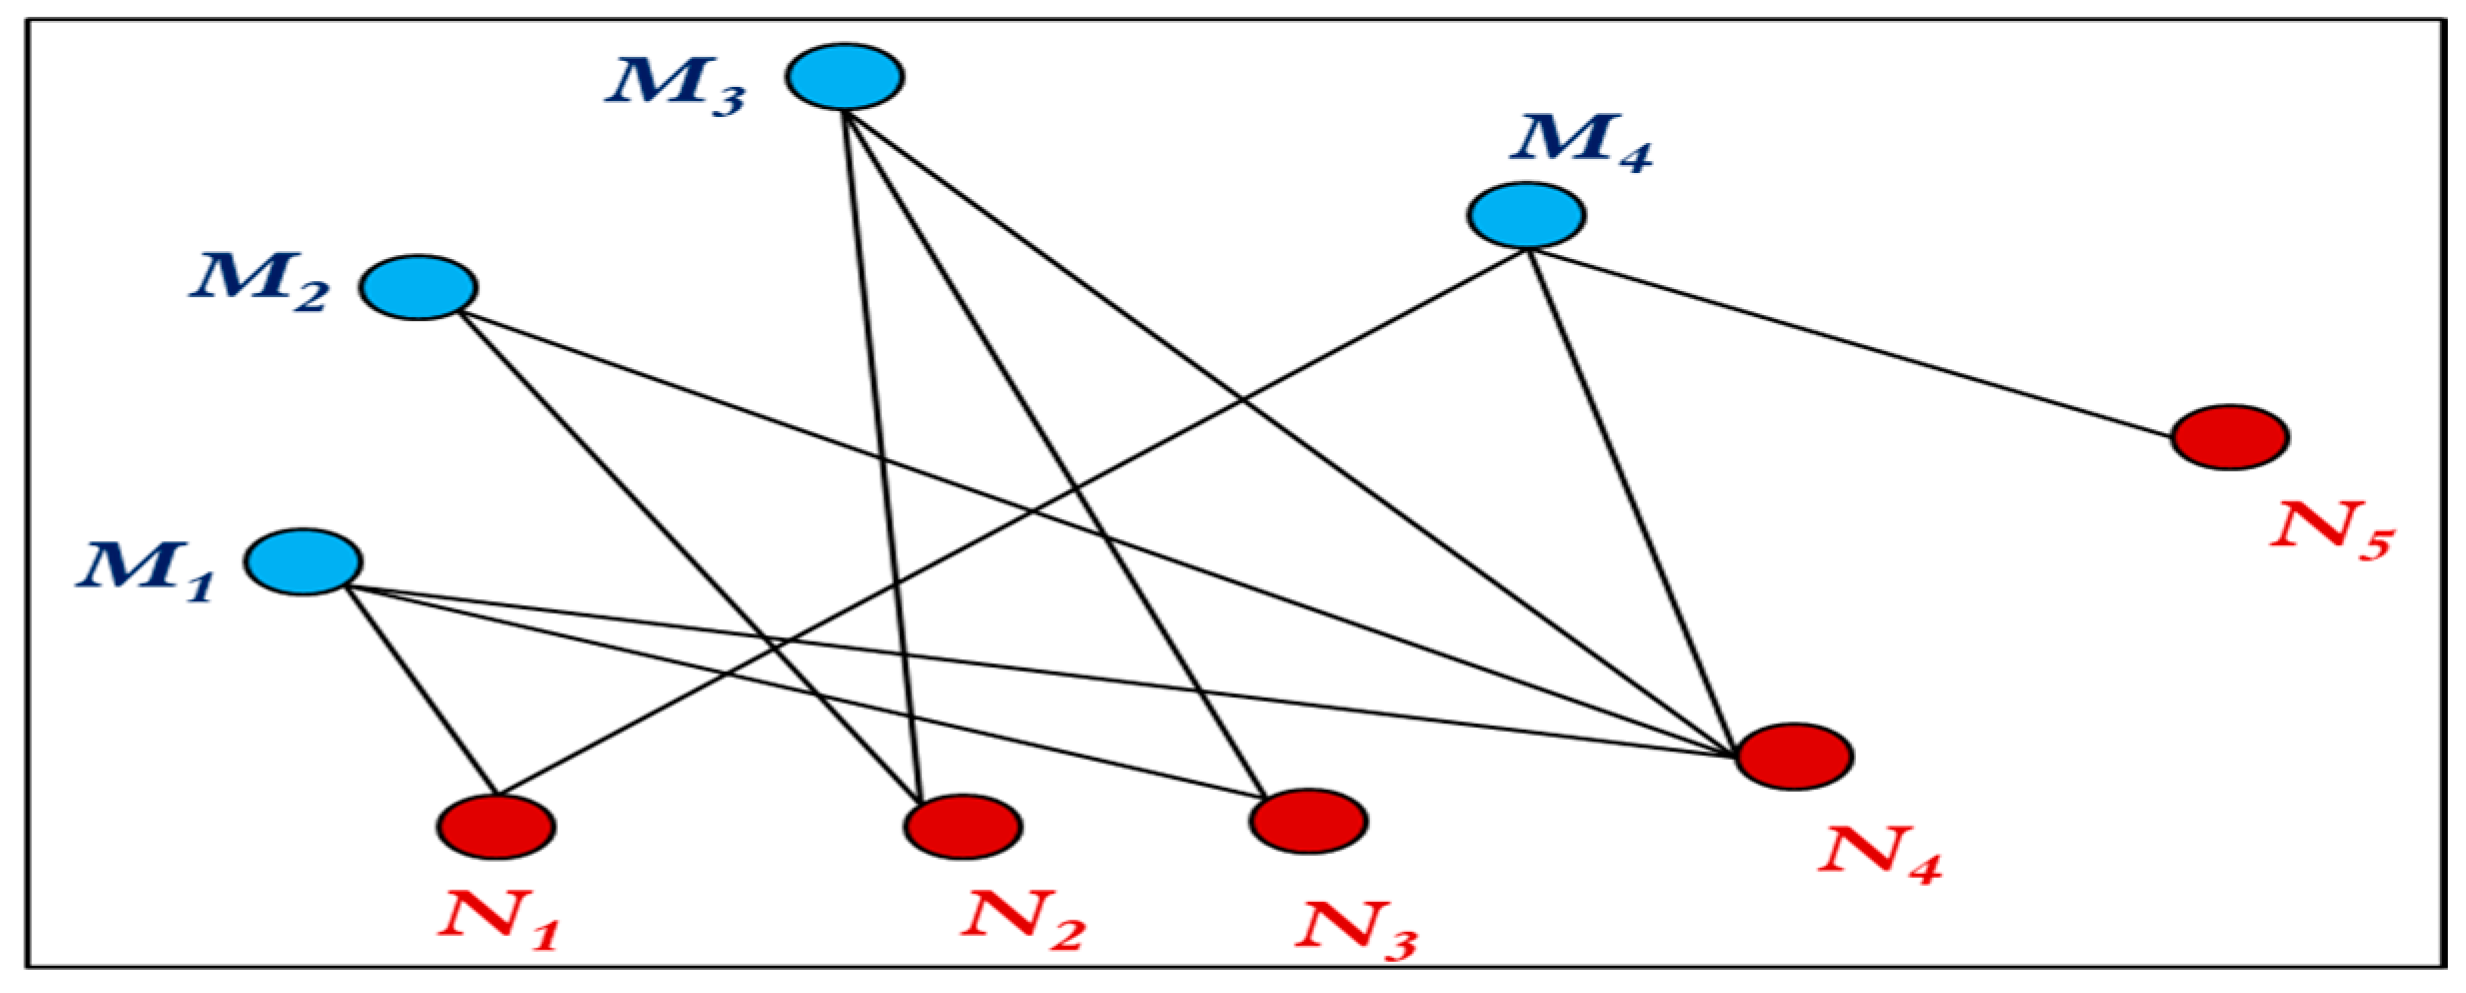
| Professor\Subjects | N1 | N2 | N3 | N4 | N5 |
|---|---|---|---|---|---|
| M1 | 1 | 0 | 1 | 1 | 0 |
| M2 | 0 | 1 | 0 | 1 | 0 |
| M3 | 0 | 1 | 1 | 1 | 0 |
| M4 | 1 | 0 | 0 | 1 | 1 |
| Professor\Subjects | 1 | 2 | 3 |
|---|---|---|---|
| M4 | N1 | N4 | N5 |
| Customer/Movie | Movie 1 | Movie 2 | Movie 3 | Movie 4 |
|---|---|---|---|---|
| Customer 1 | 0 | 1 | 0 | 1 |
| Customer 2 | 0 | 1 | 1 | 1 |
| Customer 3 | 1 | 0 | 1 | 0 |
© 2020 by the authors. Licensee MDPI, Basel, Switzerland. This article is an open access article distributed under the terms and conditions of the Creative Commons Attribution (CC BY) license (http://creativecommons.org/licenses/by/4.0/).
Share and Cite
Majeed, A.; Rauf, I. Graph Theory: A Comprehensive Survey about Graph Theory Applications in Computer Science and Social Networks. Inventions 2020, 5, 10. https://doi.org/10.3390/inventions5010010
Majeed A, Rauf I. Graph Theory: A Comprehensive Survey about Graph Theory Applications in Computer Science and Social Networks. Inventions. 2020; 5(1):10. https://doi.org/10.3390/inventions5010010
Chicago/Turabian StyleMajeed, Abdul, and Ibtisam Rauf. 2020. "Graph Theory: A Comprehensive Survey about Graph Theory Applications in Computer Science and Social Networks" Inventions 5, no. 1: 10. https://doi.org/10.3390/inventions5010010