Article

Comparison of Lithium-Ion Battery Models for Simulating Storage Systems in Distributed Power Generation

Faculty of Computer Science and Engineering, Frankfurt University of Applied Sciences, 60318 Frankfurt/Main, Germany
Inventions 2019, 4(3), 41; https://doi.org/10.3390/inventions4030041
Submission received: 9 June 2019 / Revised: 1 August 2019 / Accepted: 2 August 2019 / Published: 6 August 2019
(This article belongs to the Special Issue Innovative Battery Systems and Energy Storage)

Abstract

:
Lithium-ion batteries are well known in numerous commercial applications. Using accurate and efficient models, system designers can predict the behavior of batteries and optimize the associated performance management. Model-based development comprises the investigation of electrical, electro-chemical, thermal, and aging characteristics. This paper focuses on the analysis of models describing the electrical behavior. In particular, it investigates how cell voltage and state of charge can be determined with sufficient accuracy for a given load profile. For this purpose, the Thevenin-based, the Rint, and the Shepherd’s models, as well as a generic library model of an electronic circuit simulation software package, are compared. The procedure for determining model parameters is discussed in detail. All models are evaluated for the application in the analysis of distributed power generation. The validation is carried out by comparing simulation and measurement results with the help of a case study.

1. Introduction

Forecasts indicate that the global energy demand will continue to rise through 2040 [1]. At the same time, global greenhouse gas emissions need to be reduced by the mid-century to less than half of the level of 1990 [2]. For this reason, fossil fuels cannot meet the rising demand for energy under these claims in the long-term. Consequently, the expansion of renewables has continued to gain in significance due to the 2015 United Nations Climate Change Conference in Paris [3]. The key outcome is to limit global warming to less than 2 °C, at least 1.5 °C, compared to pre-industrial levels. In this context, grid-connected distributed power generation (DG) plays a crucial role in achieving this objective [4]. Architectures of DG can be found in a wide diversity of scenarios such as household applications, in supply systems of residential areas, or in microgrids. The power range extends from a few kilowatts to several megawatts [4]. Depending on the installed capacity, the DG is connected either to the low-voltage or to the medium-voltage grid [4,5,6]. In addition to the advantage of generating energy locally at the point of consumption, DG also enables the flexible integration of renewable energies such as wind, micro hydropower, and biomass, as well as photovoltaics. The most common DG with renewables is the installation of a photovoltaic system (PV) [7]. When using renewables with fluctuating power generation such as a PV, electrical energy storage must be taken into account [8].
Decentralized electrochemical storage is of particular interest due to its flexible use in the expansion of fluctuating renewable energies, and lithium-based storage still has enormous technical and cost reduction potential [9]. The major design criteria of this technology are a high volumetric energy density, a high round trip efficiency, a high cycle lifetime, and not least the investment costs. Most common are lead-acid batteries with a high efficiency (75–90%), an energy density between 30 to 50 Wh/kg, and a cycle lifetime up to 1500. This type is used in numerous applications, e.g., in uninterruptable power supply for large data center up to 1200 kVA [10]. A promising technology for grid applications is the lithium-ion battery which is characterized by a high cell voltage (3.6 V), energy density (up to 200 Wh/kg), efficiency (85–95%), and cycle lifetime (1000–15,000 cycles) [9,11]. Despite the high investment and low energy density (50 Wh/kg), vanadium redox-flow batteries are used in grid applications. They offer a flexible and modular design, high efficiency (>75%) and cycle lifetime (>10,000), deep discharge, and low self-discharge [12]. Furthermore molten-salt batteries (Sodium-sulfur, Sodium-nickel chloride) are under investigation. Although these two types of batteries require complex constructions and high operating temperatures (300–350 °C), they offer a potential for grid applications due to their high efficiency (80–90%), cycle lifetime (up to 4500), and energy density (up to 200 Wh/kg). Commercial availability is expected beyond 2020 [13,14]. Advanced technologies like zinc-air, lithium-sulphur, and lithium-air batteries are currently in the research phase [9]. Market availability is expected from 2030. Considering that certain battery types are used for short-term (<1 h), intermediate (<1 day), and long-term (>1 day) storage, a size class breakdown can be performed as summarized in Table 1 [9]. Technologies which are expected to be launched between 2020 and 2030 or from 2030 are listed in italics.
As reported in [14,15,16], lithium-ion batteries are increasingly utilized in DG applications. For this reason, the use of suitable models for simulating the operating performance of this type of electrical energy storage system will receive more attention in the future. Examples of the use of battery models in power and grid applications can be found in publications [17,18,19,20,21,22]. The aim of this research is to evaluate battery models that are appropriate for predicting the current and voltage characteristics, as well as the state of charge, of a battery used in a DG. The DG under discussion in this article comprises a cogeneration (CG), a lithium-ion battery, and a PV system as a renewable source. Thermal and electrical energy is supplied for a residential area with 180 town houses [23].
Typically, when dimensioning the DG, the nominal power of the CG, the installed PV power, and the battery capacity are designed according to the load profile of the consumers. On the basis of the nominal data, however, only the basic quality of the energy supply can be evaluated. The operating strategy of an implemented battery management can be established while the system is running. A simulation-based approach, on the other hand, allows the system designer to investigate various dynamic and steady-state operating modes on the basis of suitable models, and thus to optimize the battery management already in the development phase. In order to support this simulation-based method, models must be introduced that fulfill the following requirements:
  • As simple as possible;
  • As accurately as necessary; and
  • Easy to implement in an electronic circuit simulator.
It seems that these demands cannot be met together. For this reason, the following objectives must be taken into account:
  • Which goals are achieved with the models?
  • Which parameterization options are available?
  • Which simulation environment is provided for implementation?
The objective of this study is not to provide a model for optimizing the design of a battery module or for optimizing the thermal behavior of the entire storage system. Therefore, it does not have to be as accurate as possible. In fact, the goals described above should be achieved with sufficient accuracy. In addition, fast and easy access to parameterization must be ensured. Last but not least, the model should be structured in such a way that it can be integrated into an existing overall model of the DG plant. Consequently, the aim of this study is not to present a new battery model. Rather, from a practical point of view, the task is to select a suitable model for a battery that is already installed in a DG. Furthermore, it should be noted that no laboratory samples of the battery are available to carry out measurements for parameterization. Only data sheets of the completed battery type are available.
For this reason, various lithium-ion battery models suitable for DG applications are investigated in this work. First, the Thevenin-based, the Rint and the Shepherd’s model are investigated. Second, a generic library model of the electrical circuit simulation software package PSIM is explored for its suitability in the mentioned DG.
The article is organized as follows. In the next section, the most important battery models reported in the literature are discussed first. In Section 3, a case study is considered in which the suggested models are parameterized and implemented in a simulation environment. Subsequently, all models are validated with regard to the prediction of the current and voltage performance on the basis of measurement results of the described DG. Afterwards the models are examined with regard to the prediction of the state of charge. For this purpose, the case study presents a method that allows an effective validation of the models on the basis of 24 h load profiles. Section 4 and Section 5 summarize the main findings of the research and give an outlook on further aspects.

2. Overview of Battery Models

There is a variety of battery models with different objectives and complexity that have been published in technical literature in recent years [24,25,26,27,28,29]. Basically, a classification into mathematical and electrochemical, thermal, and electrical models can be made.

2.1. Mathematical and Electrochemical Models

These models have essentially been developed to describe fundamental mechanisms. The first models were published by Fuller, Doyle and Newman [30,31]. They represent an important contribution to physical cell design and the quantification of macroscopic variables such as battery voltage and current, as well as microscopic such as concentration distribution and galvanostatic charge or discharge. These models require a variety of cell parameters and complex numerical computational methods. Regardless of the accuracy achievable with these models, they are unsuitable in a simulation environment in which the electrical terminal behavior of the battery and the state of charge are to be determined with reasonable computing times.

2.2. Thermal Models

The first studies on thermal models were presented by Newman and Pals [32,33]. Thermal models have gained in importance in recent years, not least due to the increasing use of lithium-ion batteries in hybrid and electric vehicles [34]. These models are also characterized by many parameters and complex calculations. The battery system under investigation is installed in an air-conditioned room in which the ambient temperature is controlled to a constant level. However, an evaluation of the cell temperature cannot be conducted in this manner. Nevertheless, it is assumed in this study that the cell temperature has no affect on the model behavior. For this reason, only electrical models will be examined in more detail in the following paragraphs.

2.3. Electrical Models

In contrast to mathematical, electrochemical, or thermal models, electrical models are intuitive and easy to use. Common to all electrical models is that they consist of equivalent circuits composed of passive components such as resistors and capacitors, possibly inductors and a voltage source. Therefore, they are particularly suitable for use in circuit simulators. The accuracy achievable with these models with regard to voltage and current characteristics, as well as state of charge, is sufficient for many applications. In the following, a brief description of the common models will be given, from which models suitable for the analysis of a battery in DG applications can be selected.

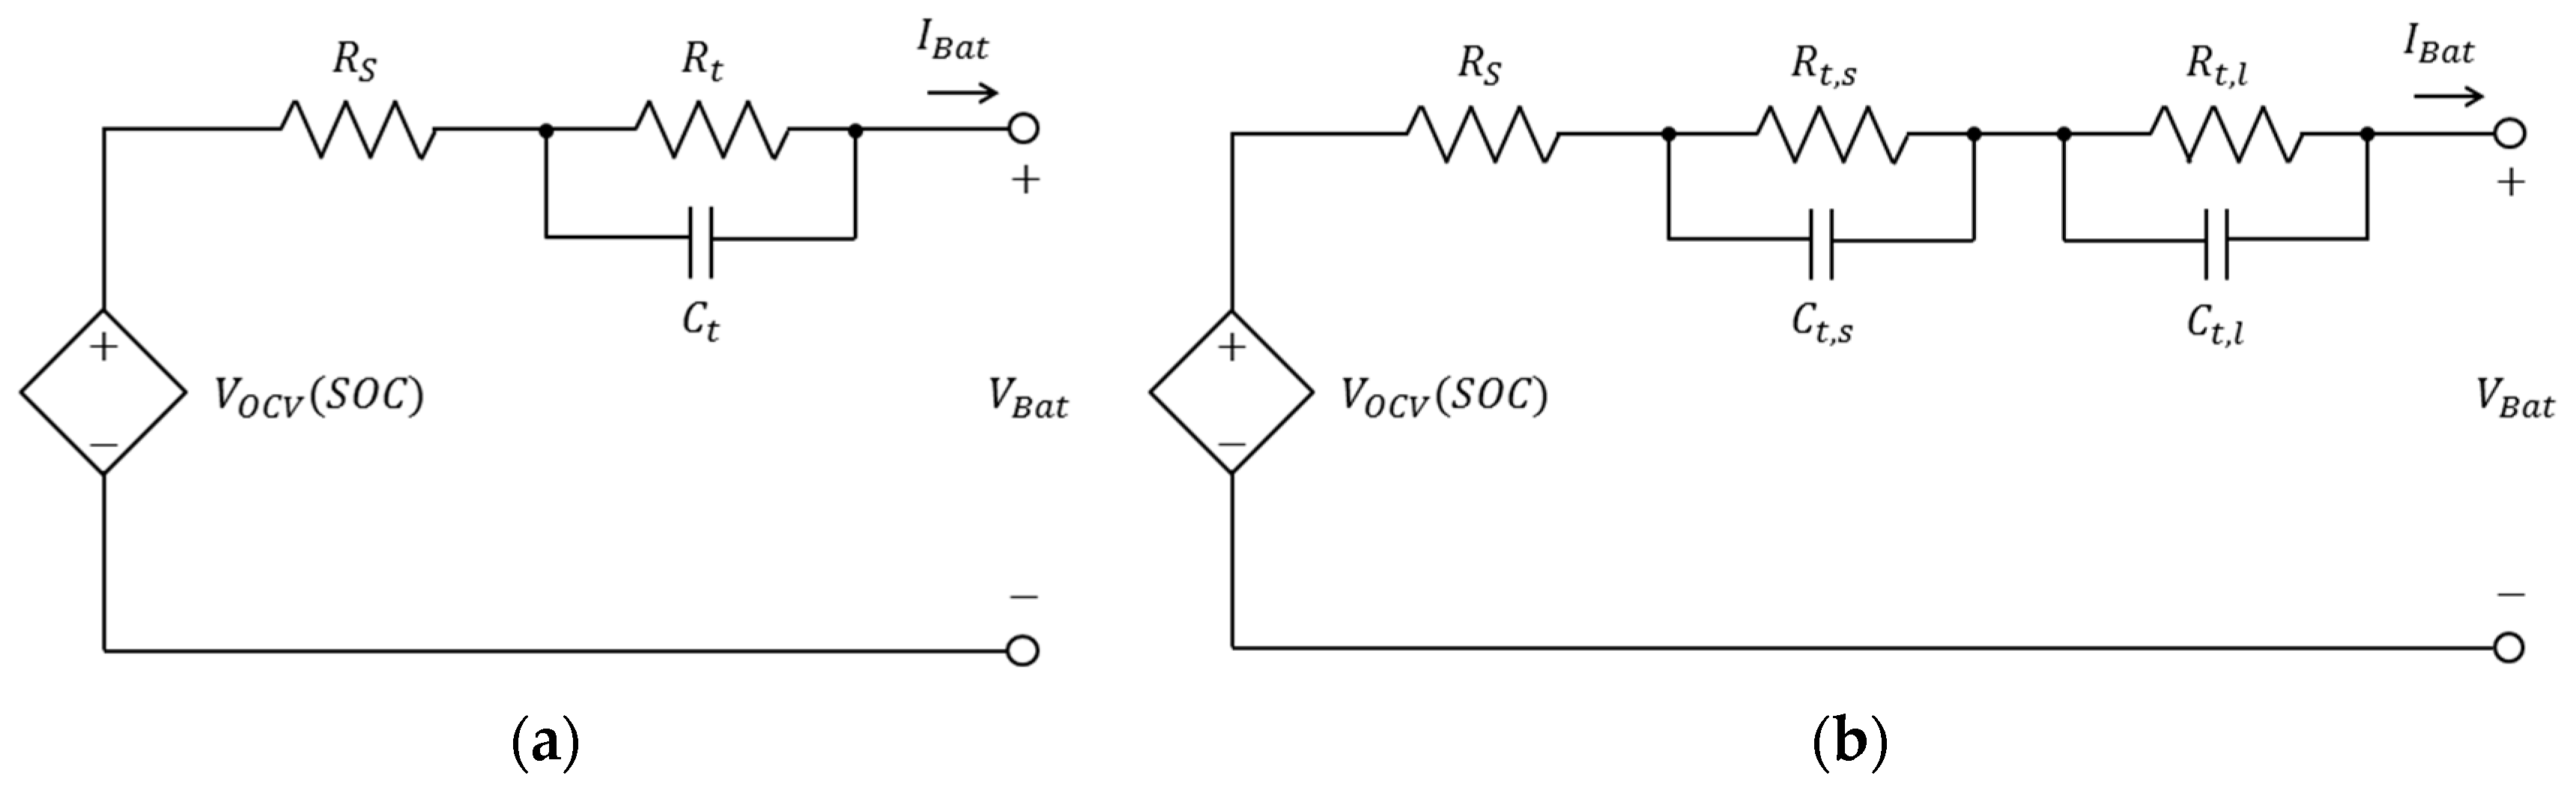
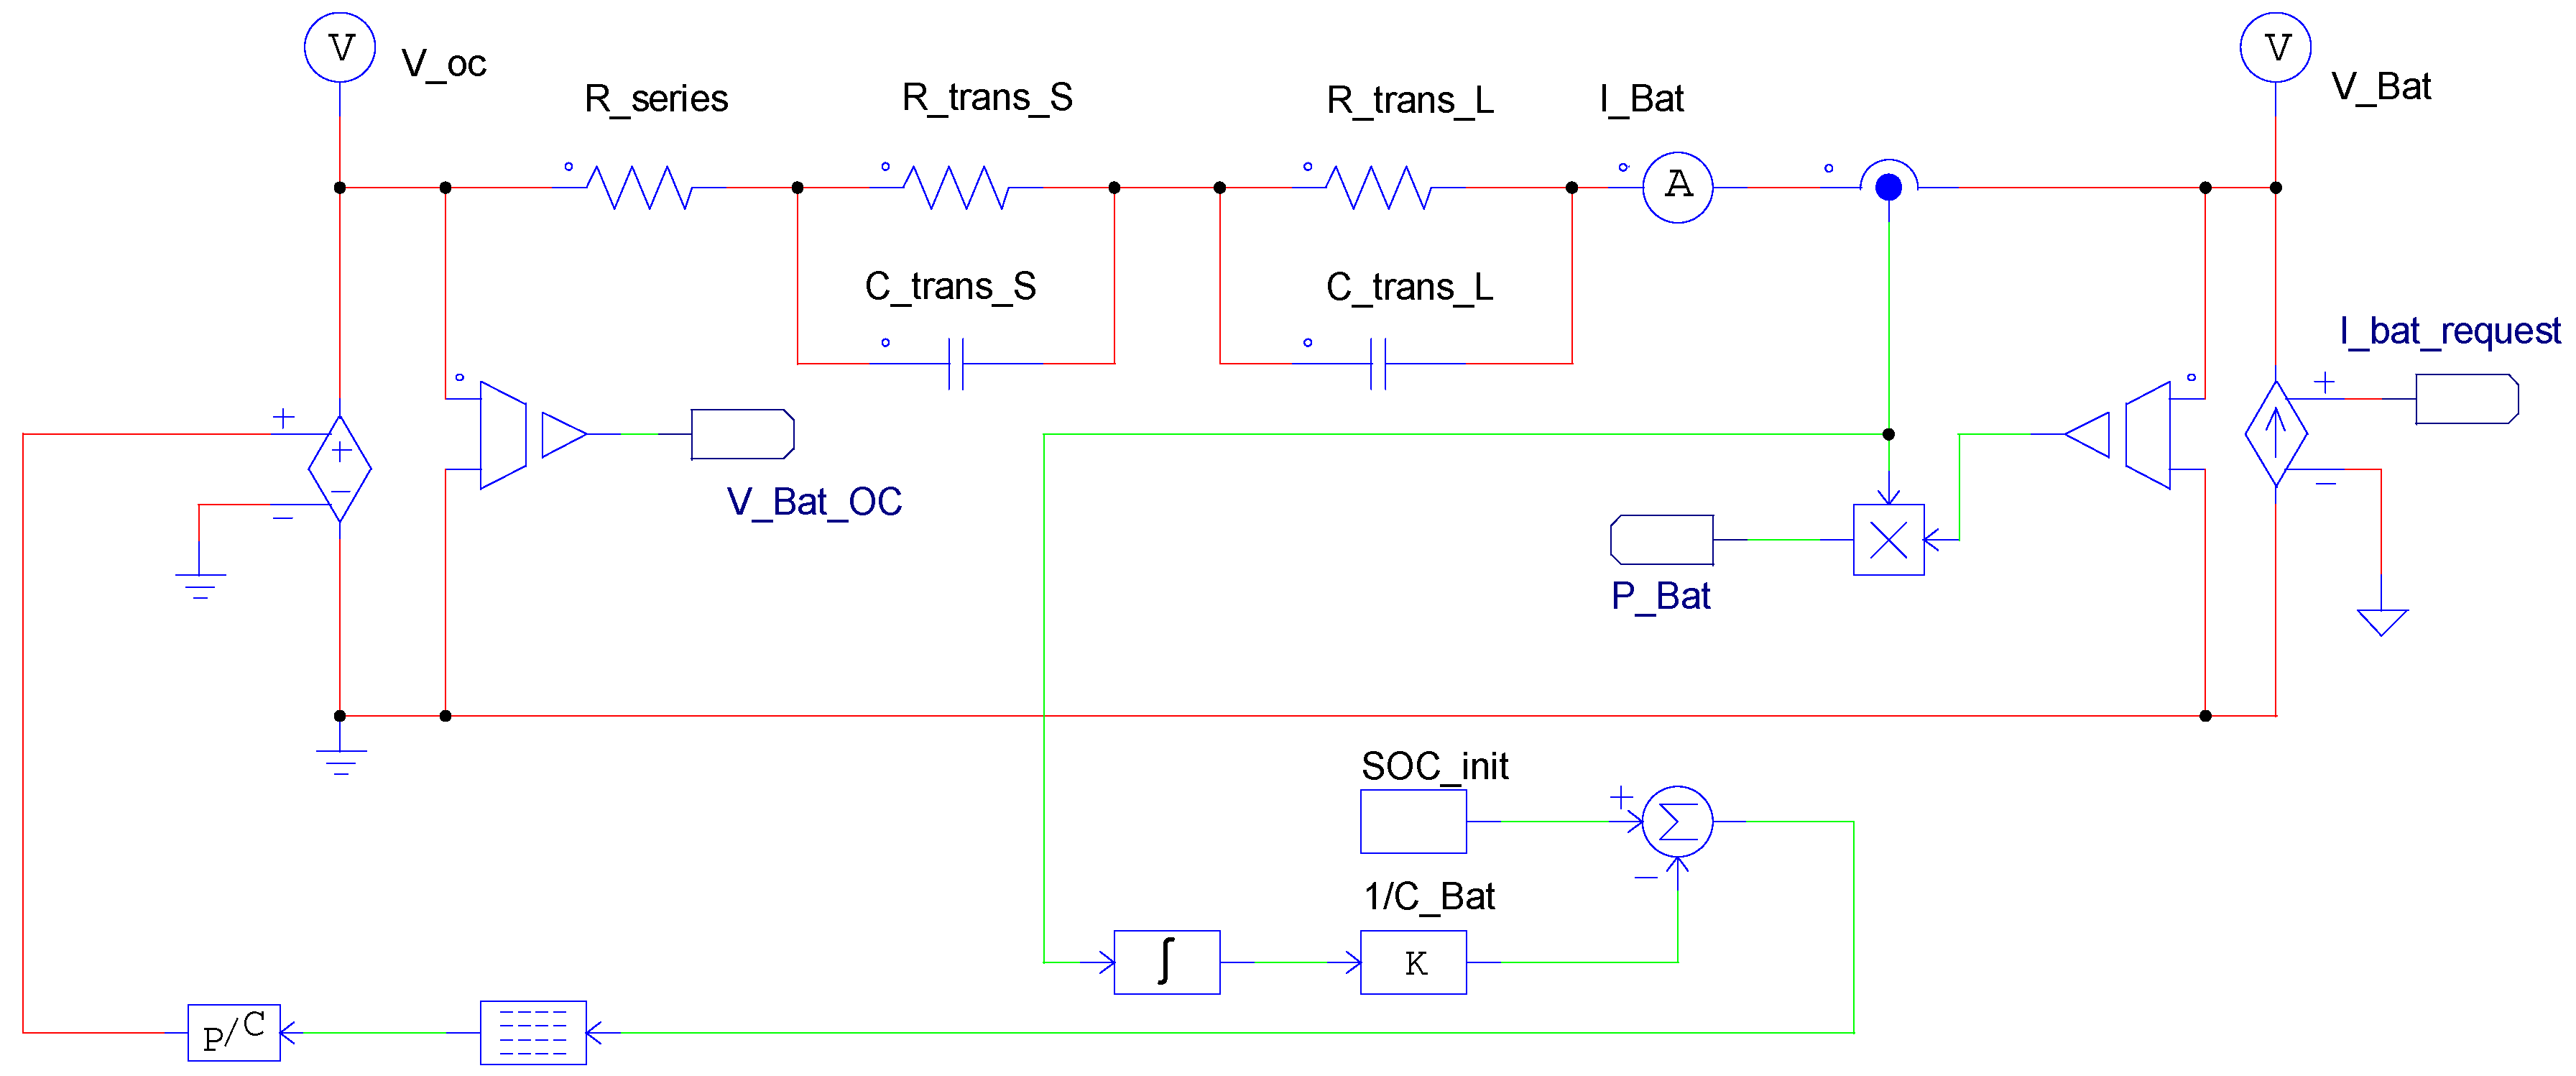
2.3.1. Thevenin-Based Electrical Model

The most simple model, as shown in Figure 1a, consists of a series resistor R S , an RC network ( R t , C t ) to describe basic charge transfer phenomenon, and an open circuit voltage dependent on the SOC V O C V ( S O C ) [26]. However, the simple model has limited accuracy. An improvement for the simulation of lithium-ion batteries can be achieved by a modification using a second RC network (Figure 1b) [35,36]. The first RC network represents short-term transient behavior ( R t , s , C t , s ), and the second, long-term transient behavior ( R t , l , C t , l ). In [37,38,39,40], a dependence of the network elements on the SOC was further proposed to achieve higher accuracy. In detail, the dependence on the SOC is described by the listed set of equations:
V O C V ( S O C ) = k 0 + k 1 · S O C + k 2 · S O C 2 + k 3 · S O C 3 + k 4 · e k 5 · S O C
R S ( S O C ) = R s 0 + k 5 · e k 6 · S O C
R t , s ( S O C ) = R t , s 0 + k 7 · e k 8 · S O C
C t , s ( S O C ) = C t , s 0 + k 9 · e k 10 · S O C
R t , l ( S O C ) = R t , l 0 + k 11 · e k 12 · S O C
C t , l ( S O C ) = C t , l 0 + k 13 · e k 14 · S O C
The coefficients k i , i = 1 14 depend on the respective cell type and are subjects of measurements. In [41] an extension by another RC network is proposed, in order to describe finally short-term, mid-term, and long-term transient behavior. However, this makes the calculation of the associated resistances and capacities ( R x , C x ) much more complex. In [18], it was reported that the Thevenin-based model achieves good results in simulations of electrical power grids. Therefore, this model is used in the subsequent case study.

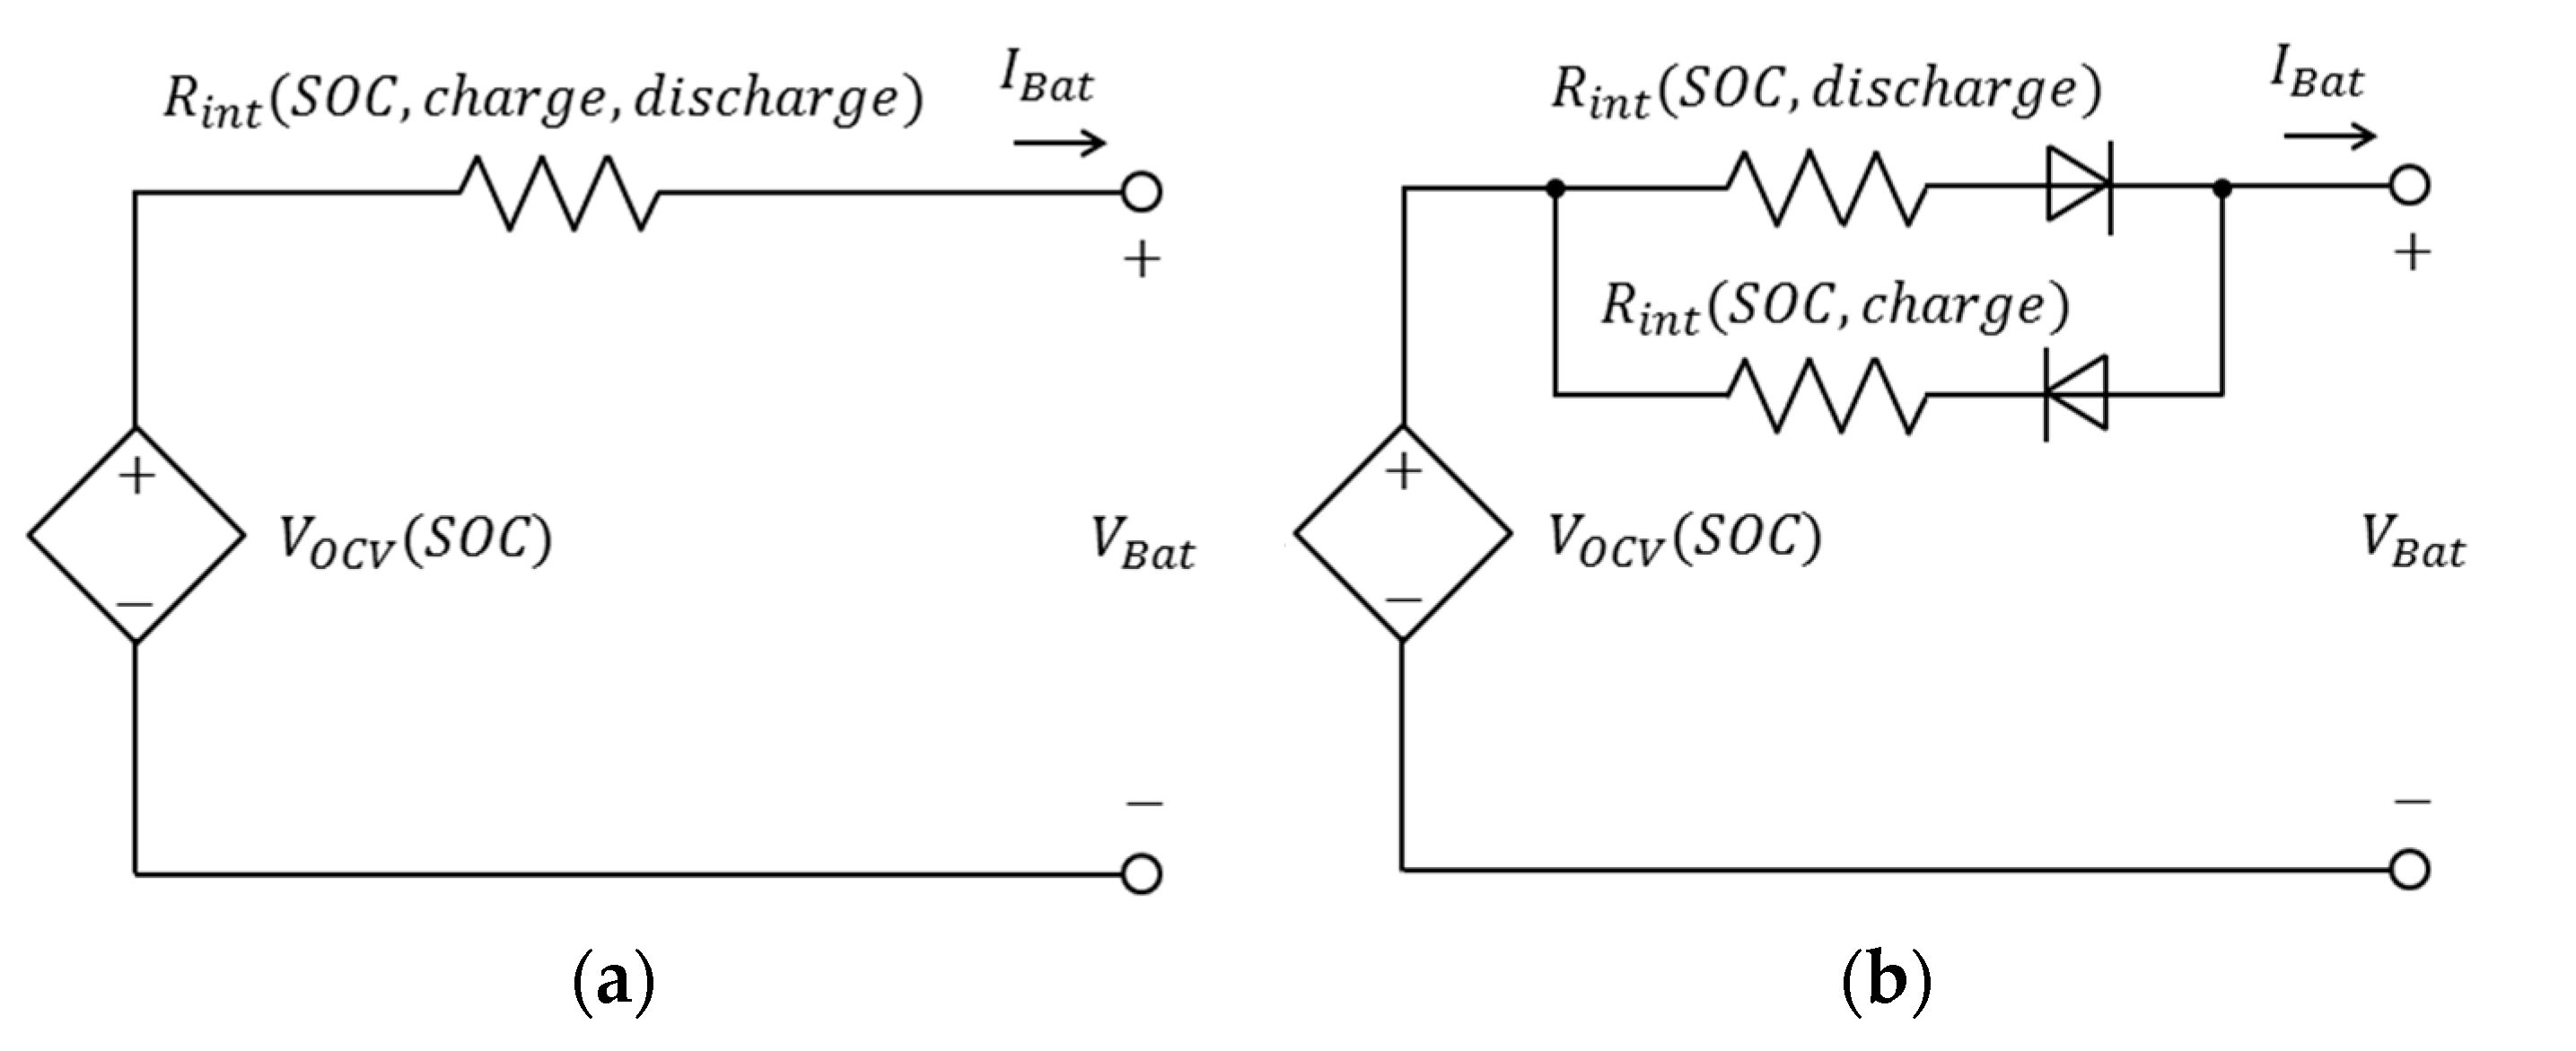
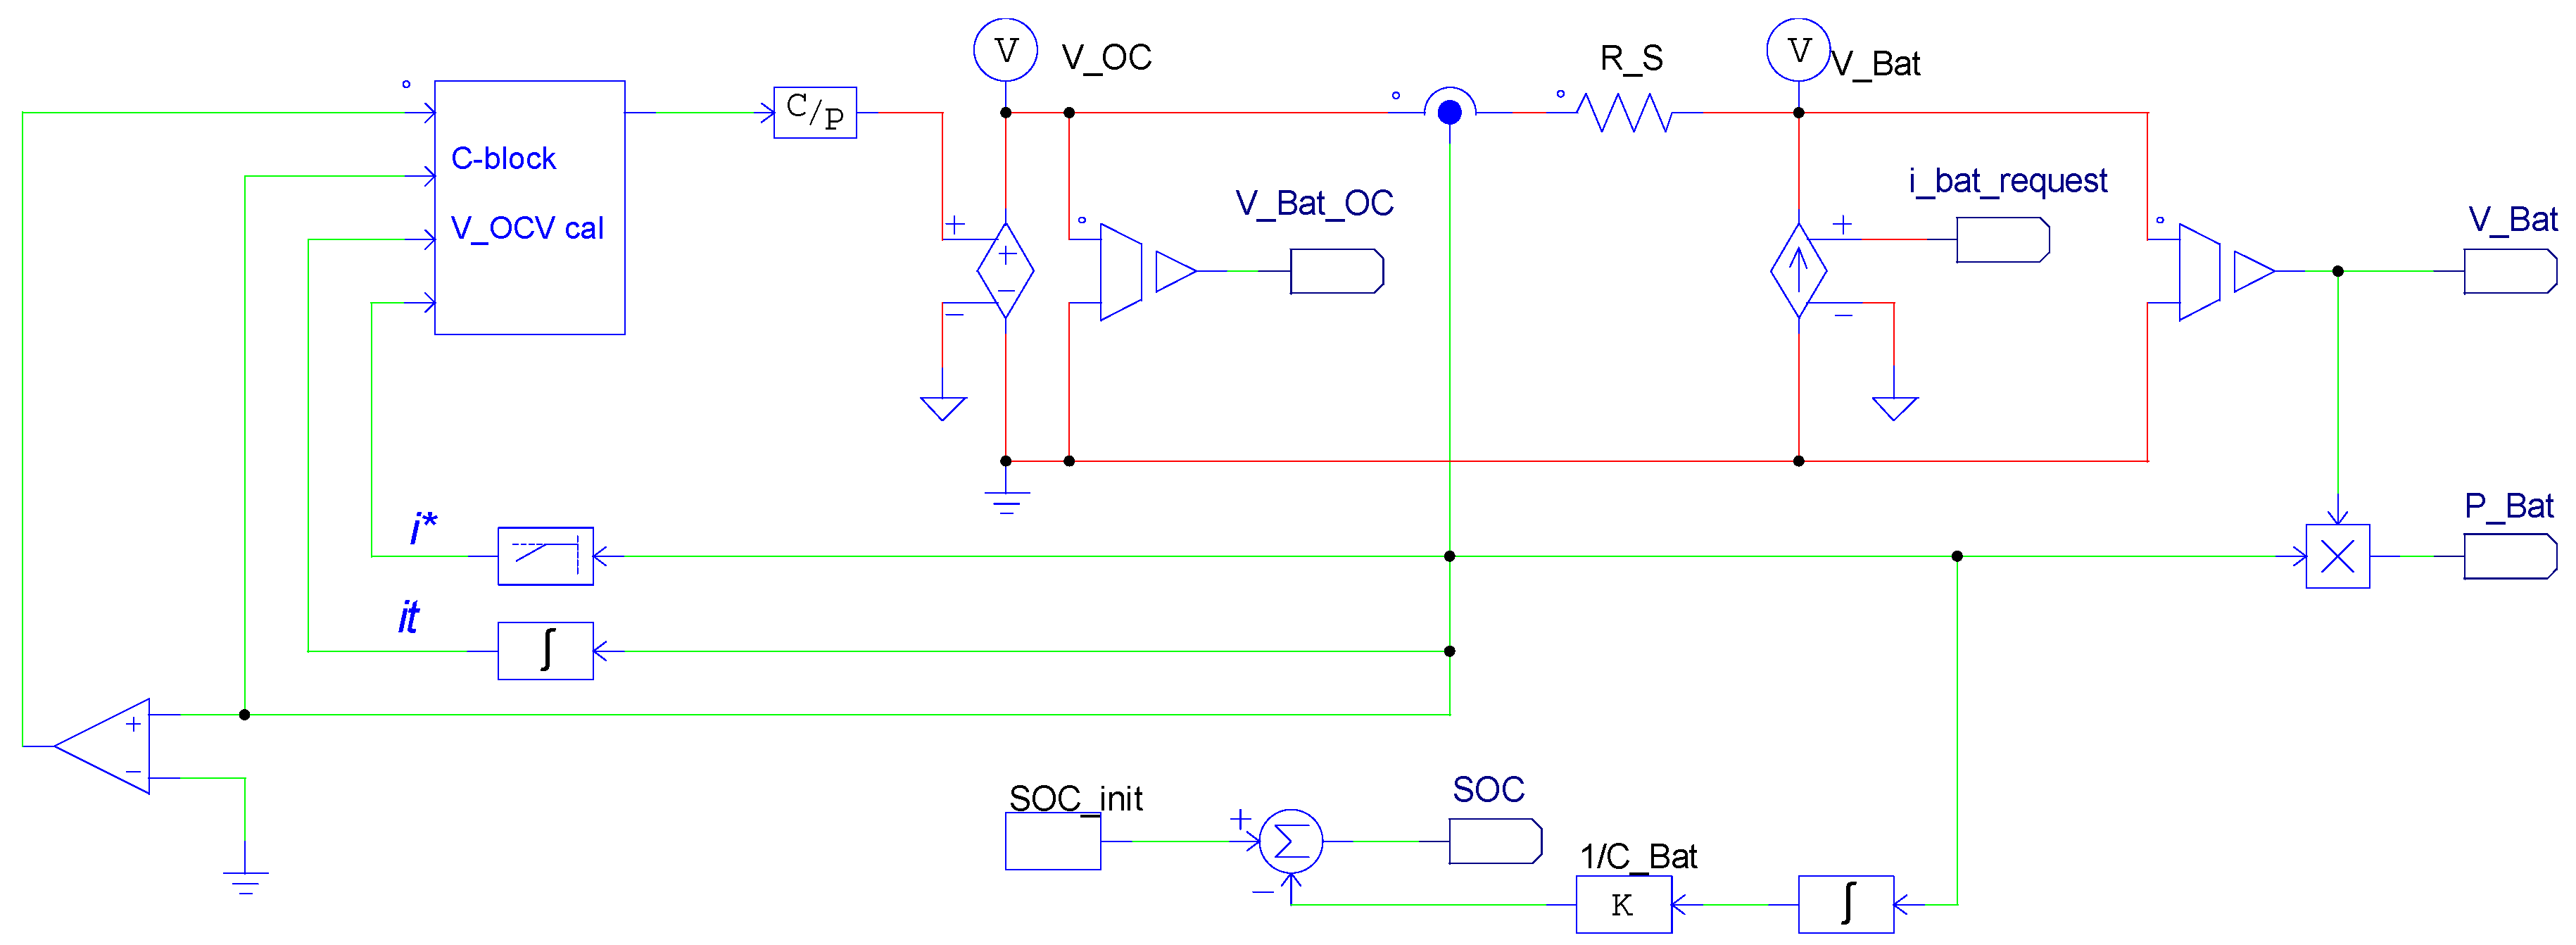
2.3.2. Rint Electrical Model

As shown in Figure 2a, the Rint model consists of a voltage source V O C V representing the open circuit voltage and an internal resistor R i n t . Both network elements depend on the SOC. Furthermore, the internal resistor can depend on the two operating modes charging/discharging. This enables the model depicted in Figure 2b to be specified with V O C V ( S O C ) , R i n t ( S O C , c h a r g e ) , and R i n t ( S O C , d i s c h a r g e ) . Since the model convinces by its basic topology, it is chosen for the following case study.

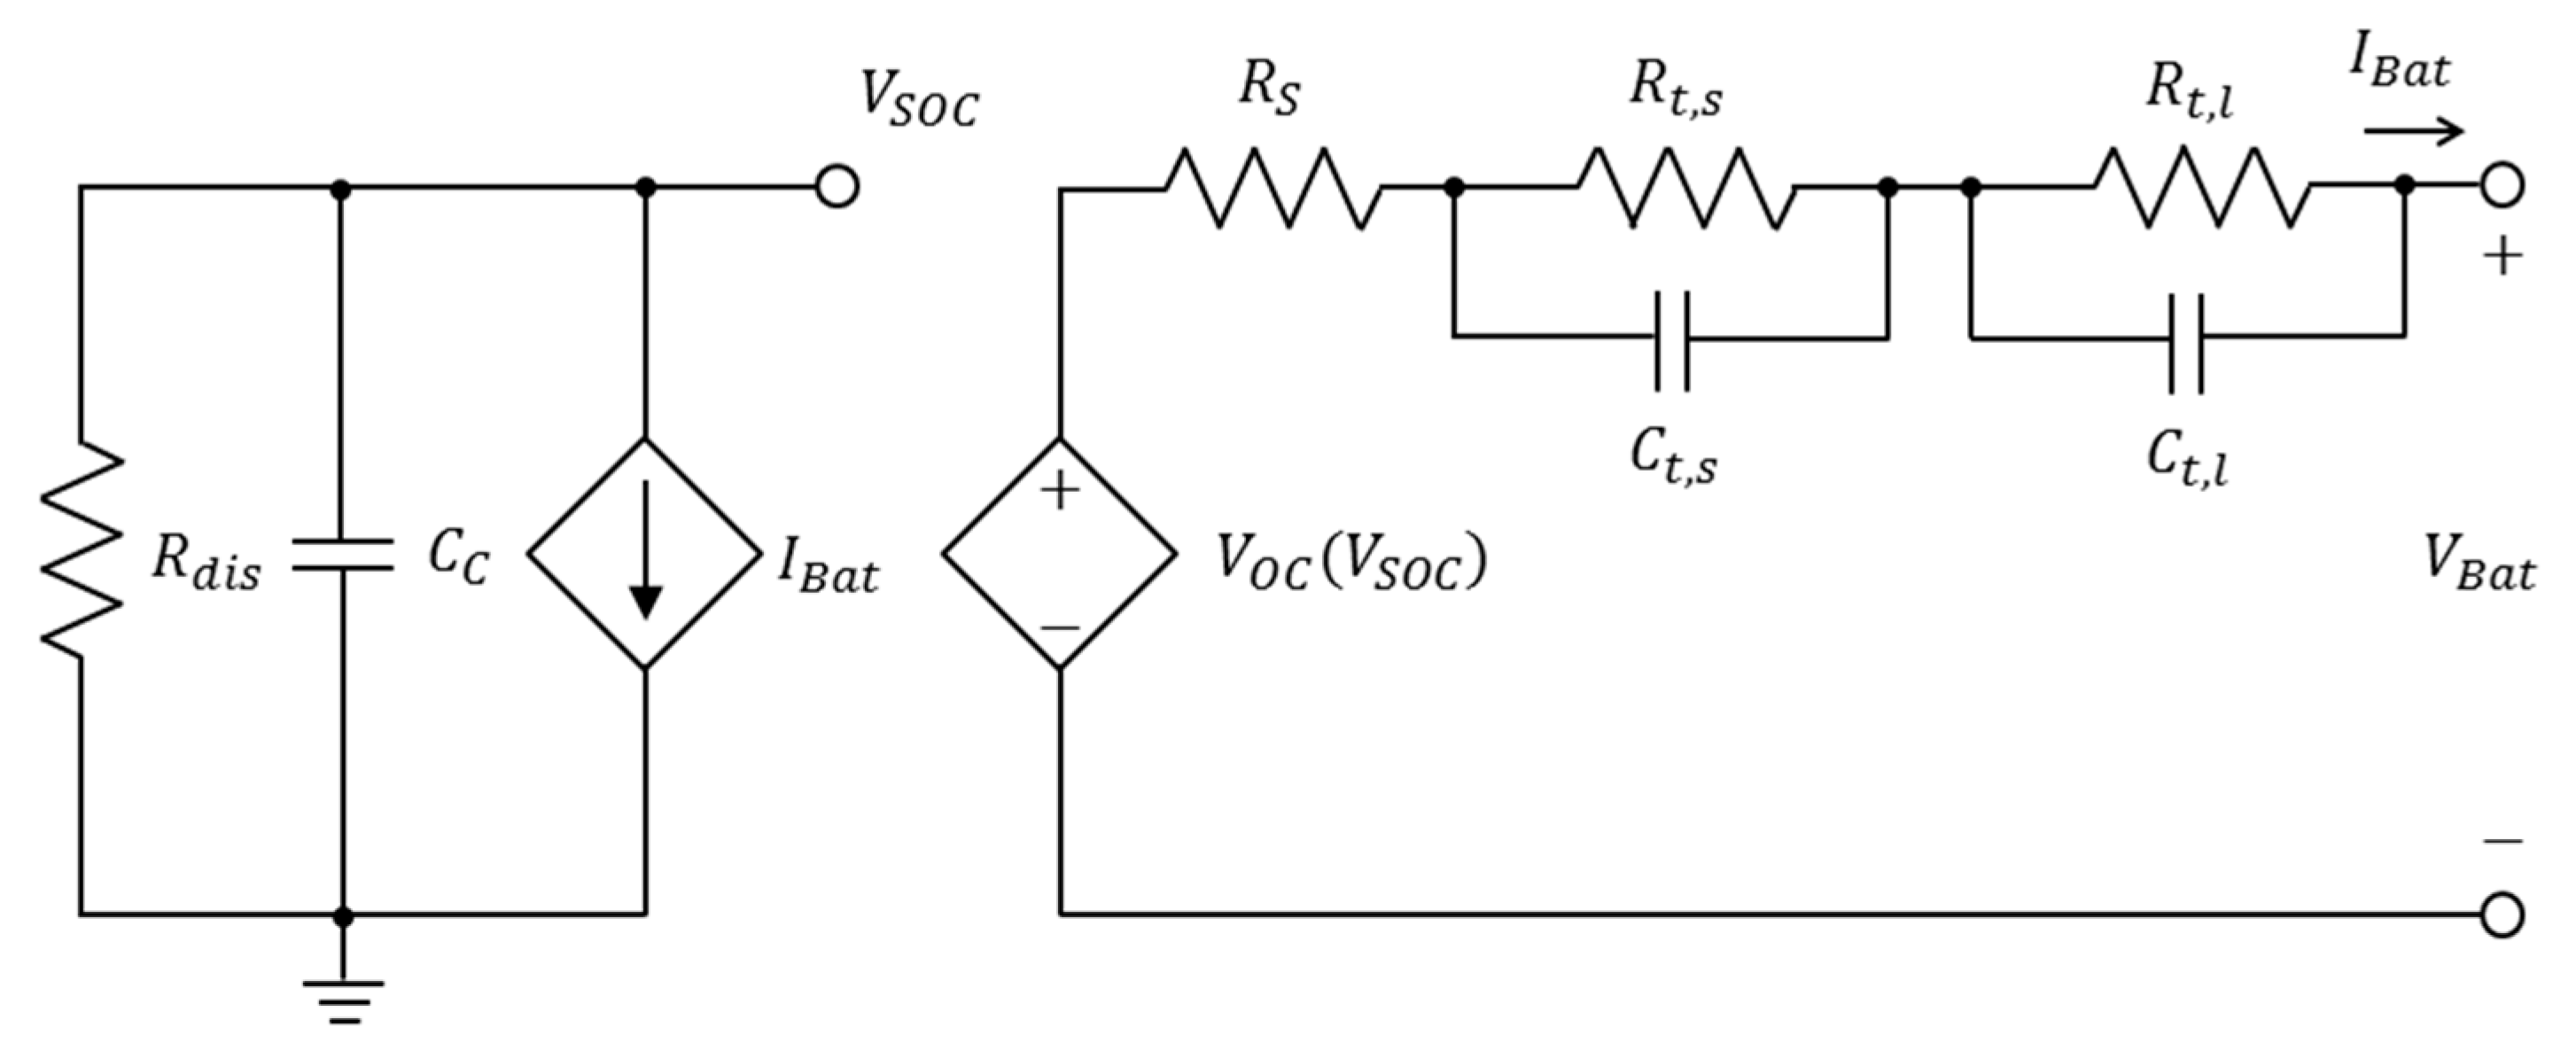
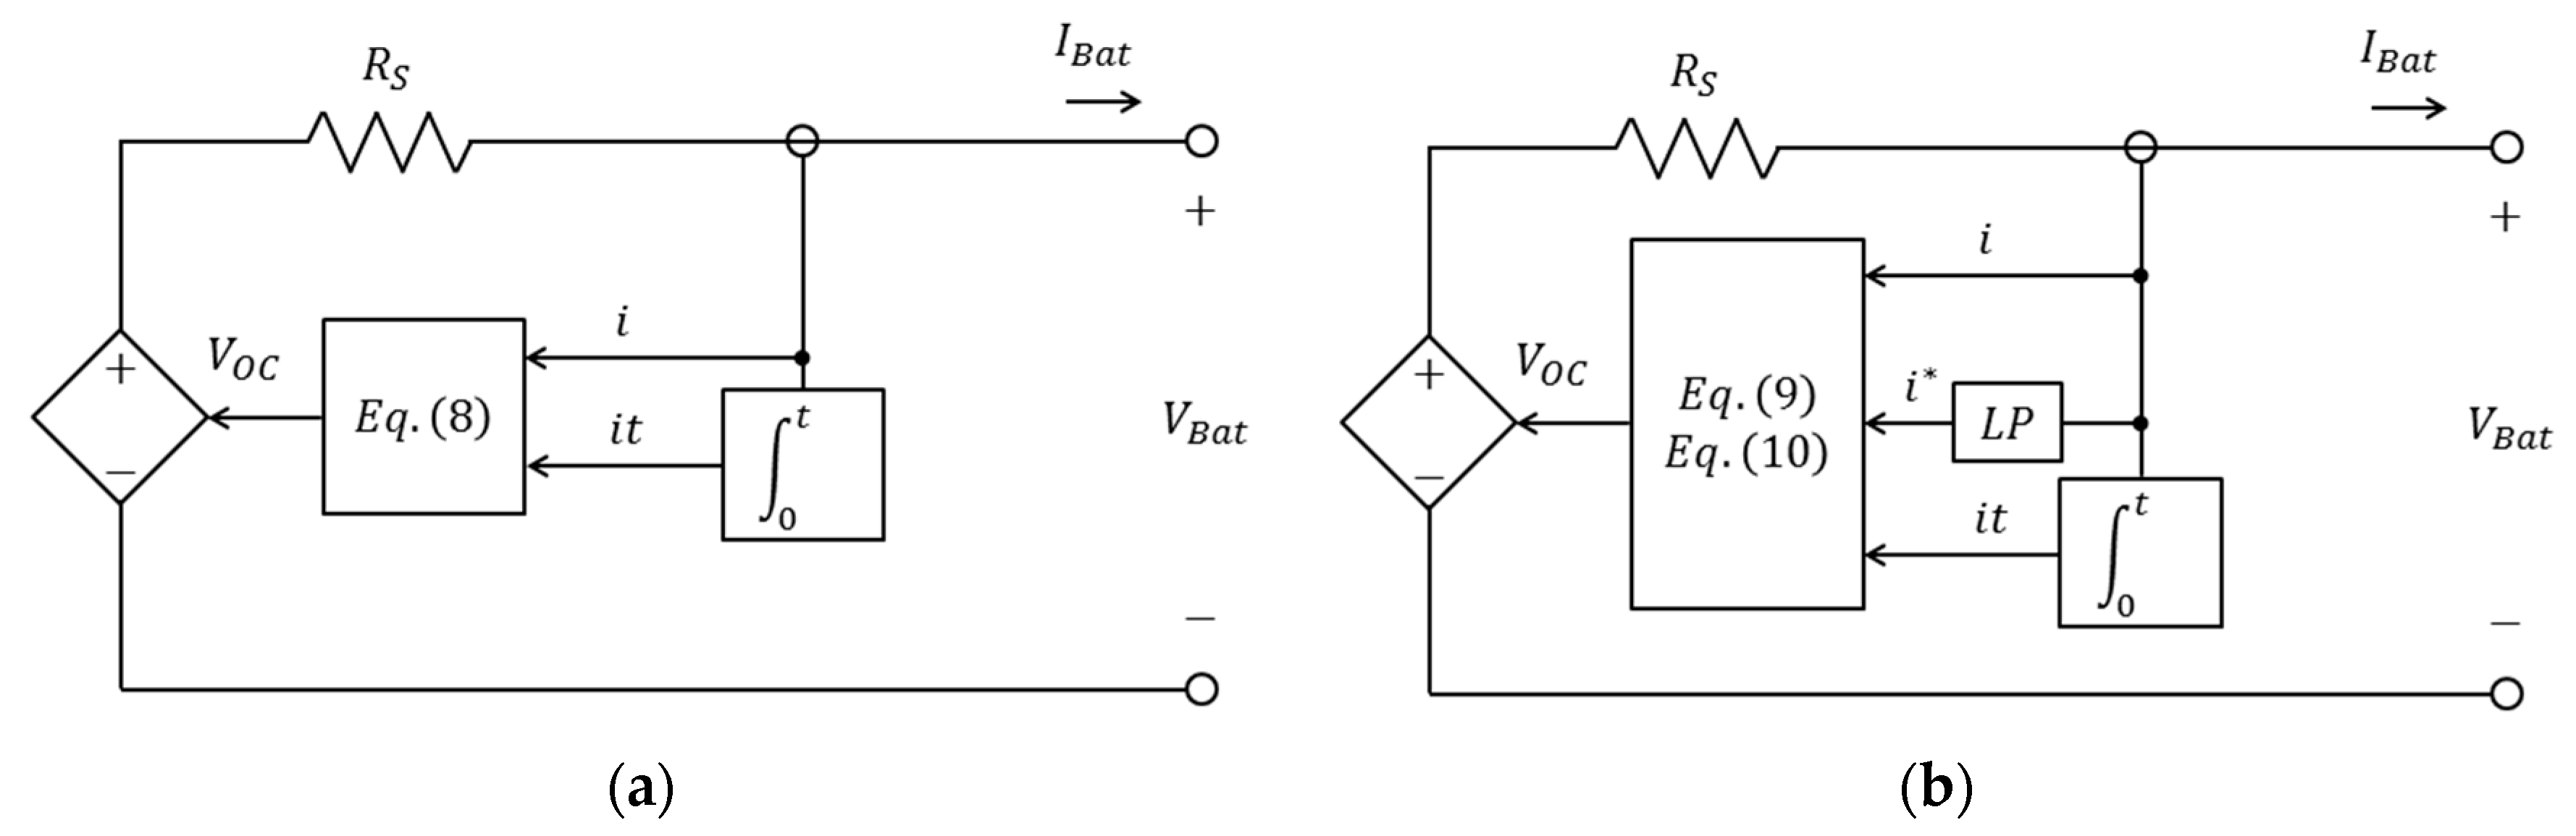
2.3.3. Runtime-Based Electrical Model

Figure 3 shows a runtime-based model presented in [37]. It consists of an expansion of the original model introduced in [42] by an electrical network based on the Thevenin model. The left part of the network contains the capacitor C C , the self-discharge resistor R d i s , and the current-controlled current source I b a t , inherent to the original runtime model. This part models the capacity, the SOC, and the lifetime of the battery, while the right part simulates the transient response described above. A voltage-regulated voltage source V O C ( V S O C ) is used to bridge the SOC to the open circuit voltage. The so-called full capacity capacitor C C is introduced to describe the whole charge stored in the battery; C C is defined as a function of the nominal capacity of the battery Q n o m and the correction factors f 1 ( C y c l e ) and f 2 ( T e m p ) , which depend on the cycle number and the cell temperature:
C C = Q n o m · f 1 ( C y c l e ) · f 2 ( T e m p )
With the aid of this model, influences of runtime and battery lifetime can be simulated. Since this study does not investigate runtime effects, the model is not considered for the case study.

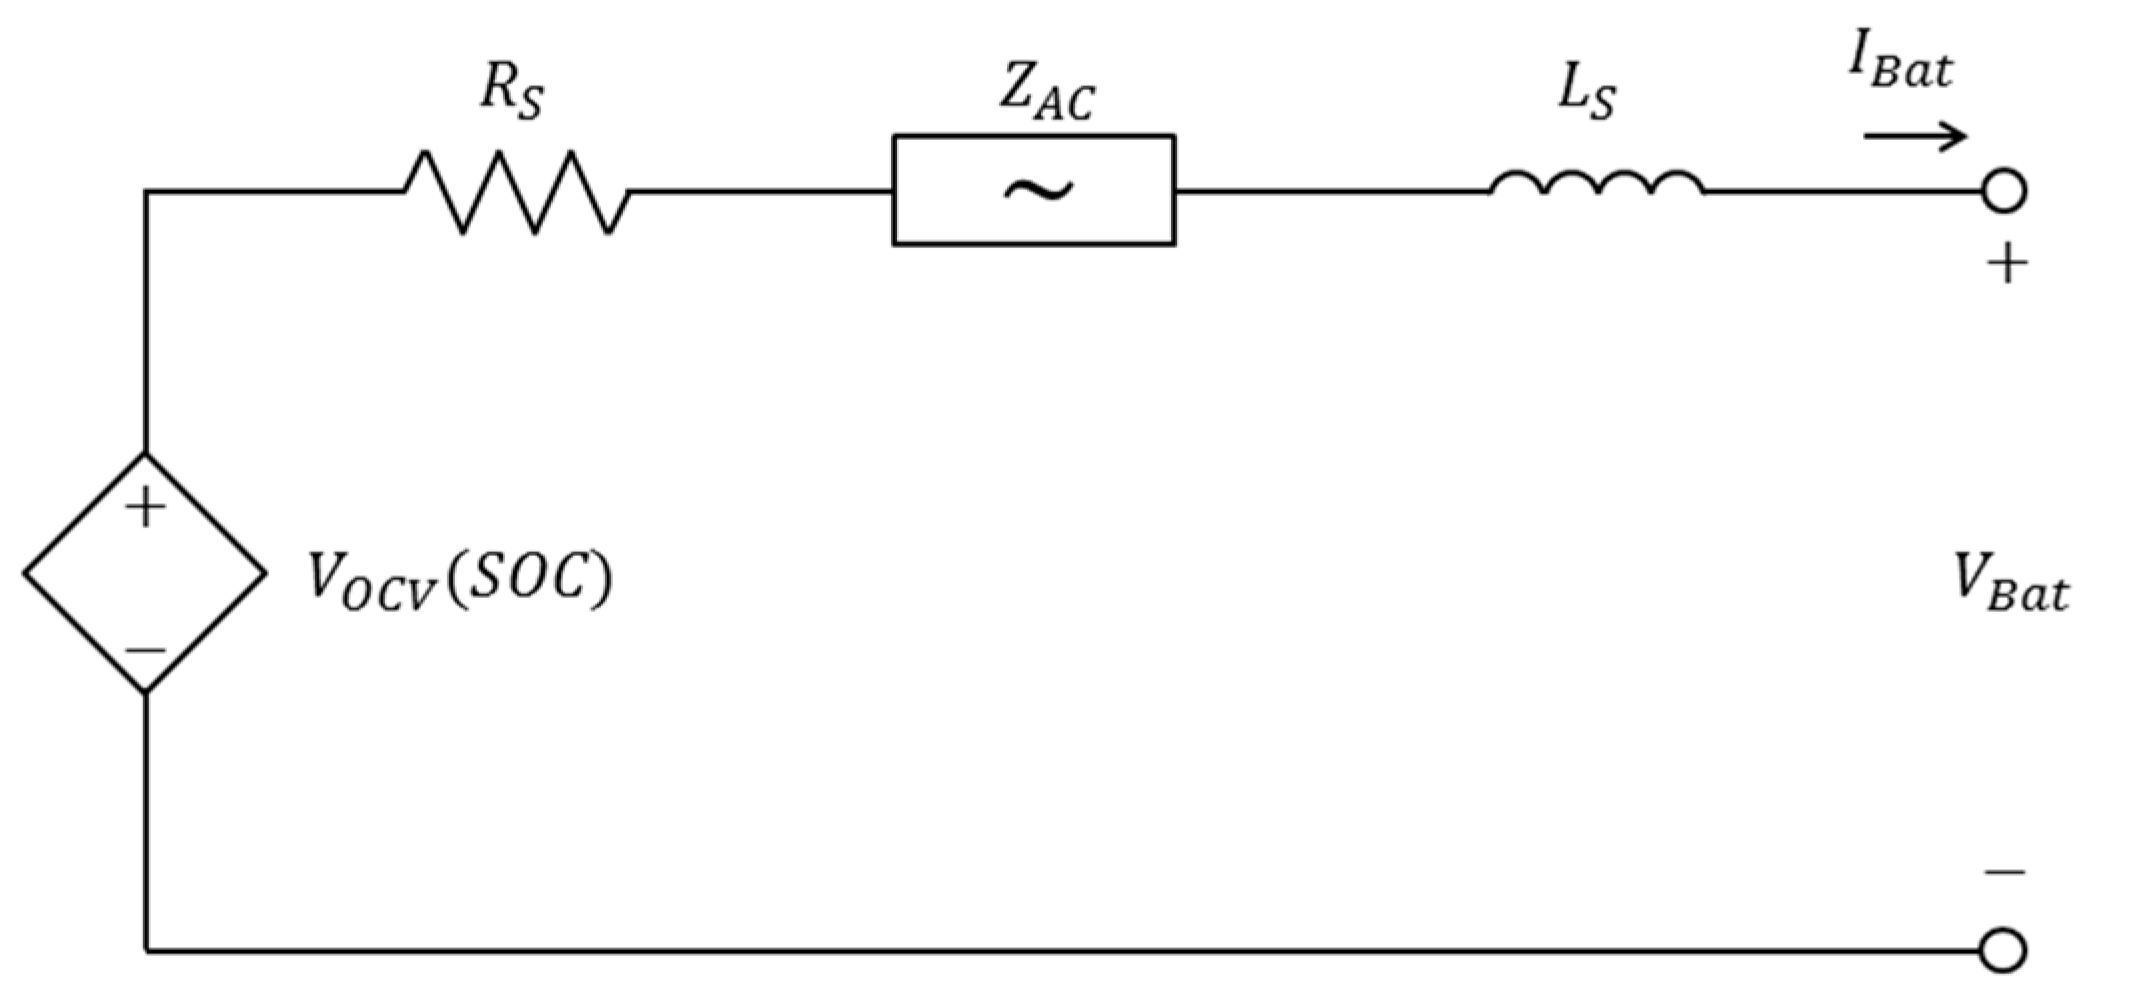
2.3.4. Impedance-Based Electrical Model

The impedance model depicted in Figure 4 is based on an electrochemical impedance spectroscopy to model an AC-equivalent impedance Z A C in the frequency domain [43,44]. However, fitting Z A C to the impedance spectrum is very difficult and challenging. A comprehensive discussion of the method can be found in [45]. Due to its complexity, this model is unsuitable for investigations in this work.

2.3.5. Shepherd’s Model

The electrical circuit network in Figure 5a is known as the Shepherd’s Model, which was first referenced in [46] and improved by subsequent work, e.g., [47,48]. In the original Shepherd’s model, the open circuit voltage V O C is determined according to Equation (8):
V O C = V 0 + K Q Q i t · i
where V 0 is the constant battery voltage, K is the polarization resistance coefficient, Q is the battery capacity, i is the dynamic battery current at the time t , and i t is the discharge capacity. The commonly used modified model is illustrated in Figure 5b [34,49]. Here the battery current is additionally filtered by a low-pass ( L P ). Furthermore, for the calculation of the open circuit voltage, a distinction is made between charging and discharging:
V O C , c h a r g e = V 0 K Q i t 0.1 · Q · i * K Q Q i t · i t + A · e B · i t
V O C , d i s = V 0 K Q Q i t · ( i t + i * ) + A · e B · i t
The coefficient A represents the voltage amplitude in the exponential zone of the discharge curve of the battery, while the coefficient B specifies the time constant inverse in this zone, and K is the polarization voltage. For a better understanding, Figure 6 illustrates the simulated discharge curve of a lithium-ion cell (US26650). As indicated, the curve can be divided into three subintervals: Region ① consists of the exponential zone starting at the full voltage V f u l l , region ② describes the linear zone, and region ③ finally includes the nonlinear zone up to the cut-off voltage V c u t o f f . With the help of this curve, the coefficients A , B , and K in Equations (9) and (10) can be determined:
A = V f u l l V t o p
Assuming that the end-value in the exponential zone is reached after about three time constants, the coefficient B can be calculated as follows:
B = 3 Q t o p
The coefficient K can be calculated by Equation (10) for any point on the discharge curve [48]. It should be noted that the coefficient K in Equations (9) and (10) is multiplied by both the filtered battery current i * ( A ) and the discharge capacity i t ( A h ). The units of K must be Ω or V / A h . Therefore, the representation of the open circuit voltage using one polarization coefficient is unfavorable. Section 3.3 discusses this problem in more detail.
Since all necessary model parameters can be derived from the data sheet of the cell type used, the model is further investigated in the case study. An example of an implementation of the Shepherd’s model in the Simulink Simscape environment can be found in [51]. In this generic model, either lead-acid, lithium-ion, nickel-cadmium, or nickel-metal-hydride batteries can be simulated.

2.3.6. Generic Library Model
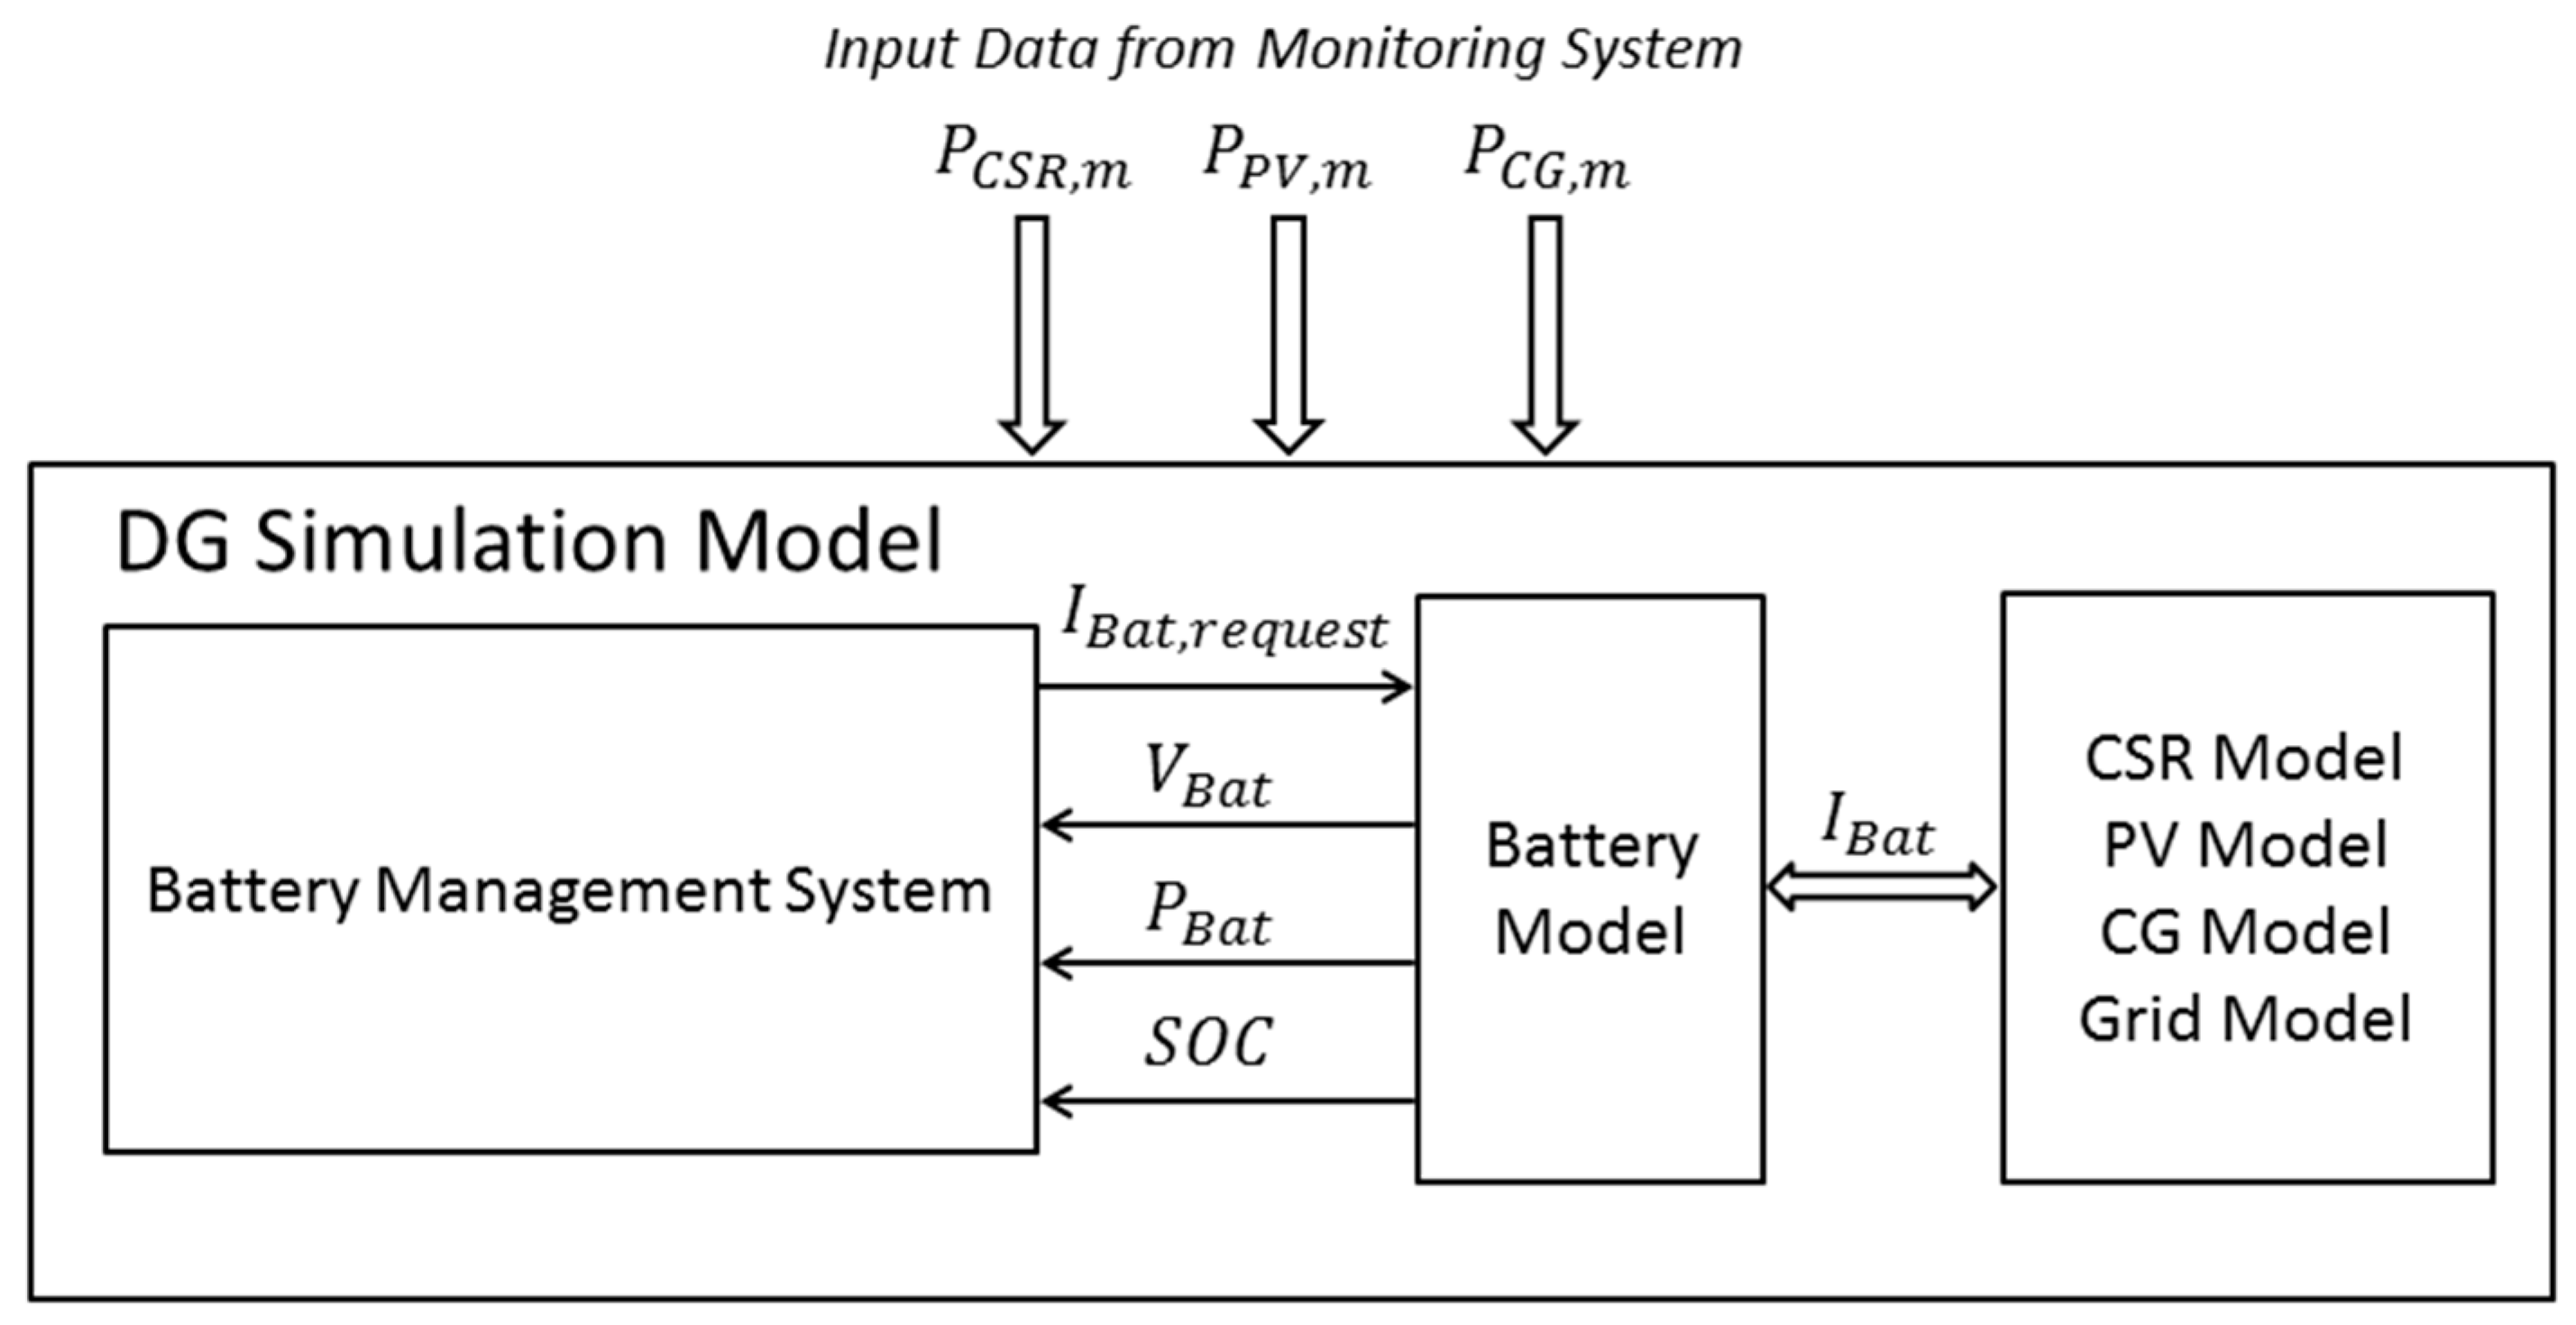
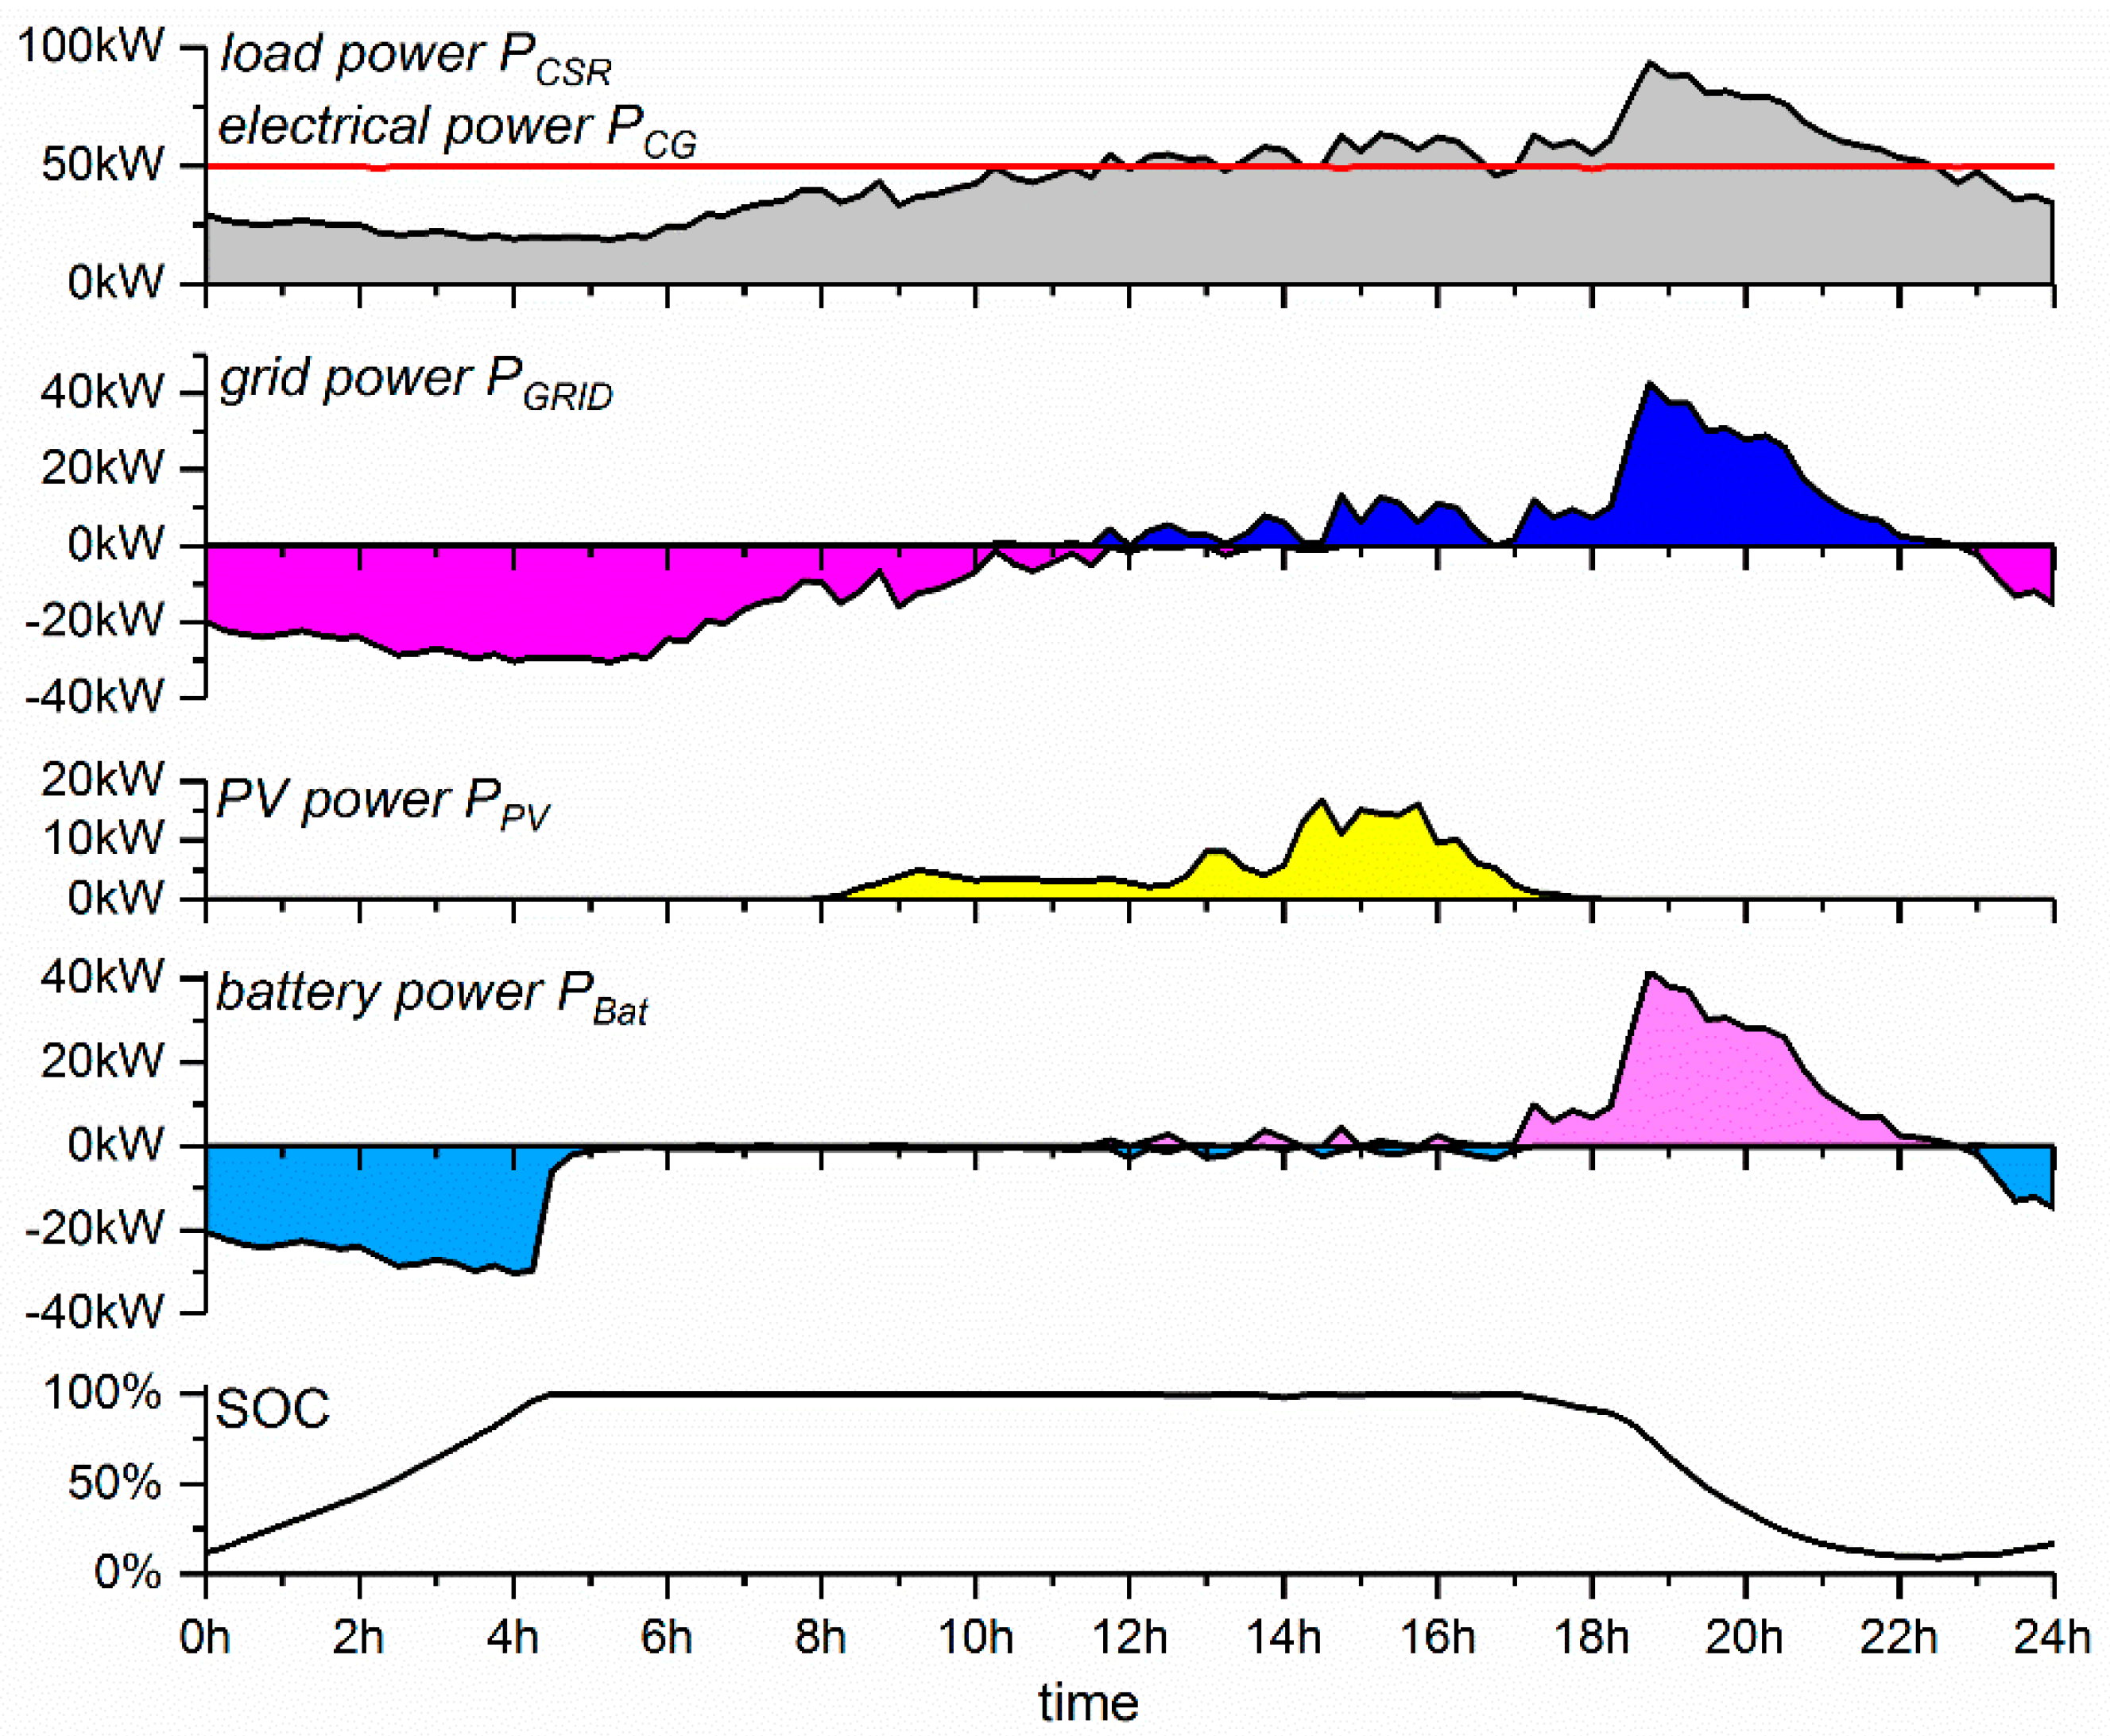
In order to meet the demand for a model that can describe dynamic phenomena with sufficient accuracy, and that can also be implemented as easily as possible in an electronic circuit simulator, this study examines the generic lithium-ion model from the library of the software package PSIM. Figure 7 depicts a schematic of the model. The load is connected to the positive and negative pin, while the upper pin gives the actual SOC during simulation. For the user, the model appears as a mask sub-circuit, which is parameterized by the cell characteristics [52]. The required cell voltage points ( V f u l l , V e x p , V n o m   a n d   V c u t o f f ) and capacities ( Q f u l l ,   Q e x p , Q n o m   a n d   Q m a x ) can be taken from the discharge curve shown in Figure 6. The series resistance R S can be derived from the corresponding data sheet. Furthermore, a voltage derating factor and a capacity derating factor are available to adapt simulated curves. The default value of both factors is set to one. When a cell is parameterized, a battery can be defined by the number of cells connected in series and in parallel. Due to these properties, this model is used for the following case study.

3. Case Study

The models described above (Thevenin-based, Rint, Shepherd’s, and library models) are validated by means of a case study. Figure 8 depicts the architecture of the investigated DG, which was developed to supply a residential area with 180 town houses (load, consumers) [23]. The CG has a rated thermal power of 81   k W t h and an electrical of 50 k W e l . Thermal power is distributed via a district heating network (dashed line). As shown in Figure 8, a heat store is used to cover thermal load peaks. Additional electrical power is provided by the PV with an installed peak power of P P V = 65   k W p k . A lithium-ion battery with a maximum discharge power of P d i s , m a x = 50   kW and a rated energy of E r a t e d = 135   kWh (capacity Q r a t e d = 2688   Ah ) is integrated. The electrical systems operate on the low voltage grid (solid line). All measured performance values of the plant are transmitted to the monitoring system for data acquisition (dotted box).
In this application, iron phosphate ( L i F e P O 4 ) batteries are used. In particular, energy storage modules with the characteristics listed in Table 2 are utilized. One module consists of 16 cell clusters connected in series, whereby one cluster consists of eight cells (US26650) connected in parallel [53].
The storage modules are installed in battery cabinets with the following arrangement. First n m , P = 2 modules are connected in parallel, and then n S = 8 of these parallel-connected modules are connected in series in one cabinet (Figure 9a). Finally, n P = 7 battery strings are connected in parallel. Thus, the entire storage system consists of seven battery cabinets, plus one control cabinet, as shown in Figure 9b [54].
The battery system is installed in an air-conditioned operating room, in which the ambient temperature is constantly controlled to 20 °C.

3.1. Implementation of the Thevenin-Based Model

The determination of the model parameters V O C (open circuit voltage), short-term transient resistor R t , s and capacitor C t , s , and long-term transient resistor R t , l and capacitor C t , l according to Equations (1)–(6) requires an experimental setup with laboratory samples of the battery cell type used. Since such a sample is not available, the parameters cannot be identified experimentally in this study. A detailed description of the experimental procedure is described in [37,38]. Therefore, it considered to neglect the dependence of the RC network elements on the SOC. The results published in [37,38] indicate that the RC network elements are almost independent of the SOC for the operating range S O C > 10 % , with the exception of the long-term capacity C t , l . In the application under investigation, the battery is only operated in a range of 15 % < S O C < 95 % . For this reason, the Thevenin model for constant RC network elements is examined in this study. Since no measurements could be carried out, model parameters of lithium-ion batteries published in [37,38,55] are used as a reference for the RC network elements for the purpose of simplicity. A parameter fitting leads to the following values for the RC network elements of one module: R t , s = 50 Ω, C t , s = 500   F ,   R t , l = 46   m Ω ,   C t , l = 5000   F . Due to the cell type and structure of the storage module, these values deviate from published ones, but acceptable accuracy can be achieved.
As it was not possible in the present case to measure the open-circuit voltage V O C V ( S O C ) as a function of the SOC while the system was running, the open-circuit voltage of a L i F e P O 4 battery as depicted in Figure 10 is used in the model [56]. Although this parameterization does not follow a strictly scientific methodology, it represents the main problem of integrating the Thevenin-based model into practical work. Nevertheless, the next subsection shows that this simple approach leads to quite accurate results.
Figure 11 illustrates the implementation of the model of one storage module in PSIM. The open circuit voltage V O C V ( S O C ) is given by a look-up table; the SOC is calculated from the battery current I B a t and the usable capacity C B a t of one battery module, as well as the initial S O C i n i t [57]:
S O C = S O C i n i t 1 C B a t I B a t d t
In order to validate the model, the battery current I B a t is controlled by a voltage-controlled current source. The input of this source is a current-proportional control signal I B a t , r e q u e s t that corresponds to the actual battery current of the DG. The control variable I B a t , r e q u e s t is generated from the measured power values of the system. A detailed description of the validation process will be given in Section 3.3. The complete storage system is assembled by connecting the individual modules in series ( n S ) and in parallel ( n m , P , n P ).

3.2. Implementation of the Rint Model

In the Rint model, the open circuit voltage V O C V ( S O C ) is simulated exactly as described in the Thevenin-based model. The internal resistors R i n t ( S O C , c h a r g e ) and R i n t ( S O C , d i s c h a r g e ) in Figure 2 are determined from the open circuit voltage V O C V (Figure 10), the measured battery voltage V B a t , m , and measured battery current I B a t , m of the storage system according to Equation (14):
R i n t ( S O C , c h a r g e / d i s c h a r g e ) = V O C V V B a t , m I B a t , m
Figure 12 illustrates the dependence of the resistors of one storage module on the SOC with R i n t ( S O C , d i s c h a r g e ) = R d i s and R i n t ( S O C , c h a r g e ) = R c h a r .
Since the resistance of R c h a r changes only slightly with the SOC, a constant value of R c h a r = 17   m Ω is used for the simulation. In order to be able to simulate the dependence of R d i s on the SOC, the impact of R d i s is modeled using a look-up table. Instead of applying a variable resistor, the model determines the voltage drop across the resistor:
V R , d i s = R d i s · I B a t
This is realized with the help of a controlled voltage source. Figure 13 shows the implementation in PSIM. The actual battery current I B a t is sensed and multiplied by the SOC-dependent resistance R d i s from the look-up table. The battery current I B a t is again generated by a controlled source with the control signal I B a t , r e q u e s t . The complete storage system is assembled considering the individual modules connected in series ( n S ) and in parallel ( n m , P , n P ).

3.3. Implementation of the Shepherd’s Model

The parameters for the Shepherd’s model are specified for one storage module (see Table 2). The three required pairs of voltage and capacity for the 1C rate based on the data sheet of one cell (Figure 6) and the number of cell connected in series in one module are given as follows:
V f u l l , Q f u l l = 54.4   V ,   24   A h
V e x p , Q e x p = 52.8   V ,   1.6   A h
V n o m , Q n o m = 51.2   V ,   22.8   A h
According Equation (11), the coefficient A is calculated as follows:
A = V f u l l V t o p = 54.4   V 52.8   V = 1.6   V
According Equation (12), the coefficient B is calculated as follows:
B = 3 Q t o p = 3 1.6   A h = 1.875 1 A h
Finally, the coefficient K is calculated according to:
K = ( V f u l l V n o m + A · ( e B · Q n o m ) 1 ) Q f u l l Q n o m Q n o m = 0.084   V
In [49], scalar factors were introduced to improve the fit to the investigated battery. As already mentioned in Section 2.3.5, the unit of the coefficient must be modified. Taking into account scalar factors ( 0.95 and 0.175 ) found in the optimization of the model in this study and coefficients with the correct units, Equations (9) and (10) for determining the open circuit voltages for charging and discharge can now be written in the following form:
V O C , c h a r g e = V 0 K 1 Q i t 0.1 · Q · i * K 2 Q Q i t · i t + A · e B · i t
V O C , d i s = V 0 K 1 Q Q i t · i * K 2 Q Q i t · i t + A · e B · i t
K 1 = 0.95 Ω V K = 0.0798   Ω
K 2 = 0.175 1 A h · K = 0.0147   V A h
Figure 14 depicts the implementation of the model in PSIM. The equations for computing the open circuit voltages V O C , c h a r g e and V O C , d i s are programmed in a C-block. The output variable of the C-block is used to set a controlled voltage source according to the open circuit voltage. The series resistance R S = 36   m Ω is calculated from the resistance of a single cell ( R S , c e l l = 18 m Ω AC impedance of one US26650 cell at 1 kHz [58]). Again, the complete storage system is assembled considering the individual modules connected in series ( n S ) and in parallel ( n m , P , n P ). As described in Section 3.1 and Section 3.2, the battery current I B a t is generated by a controlled source with the control signal I B a t , r e q u e s t .

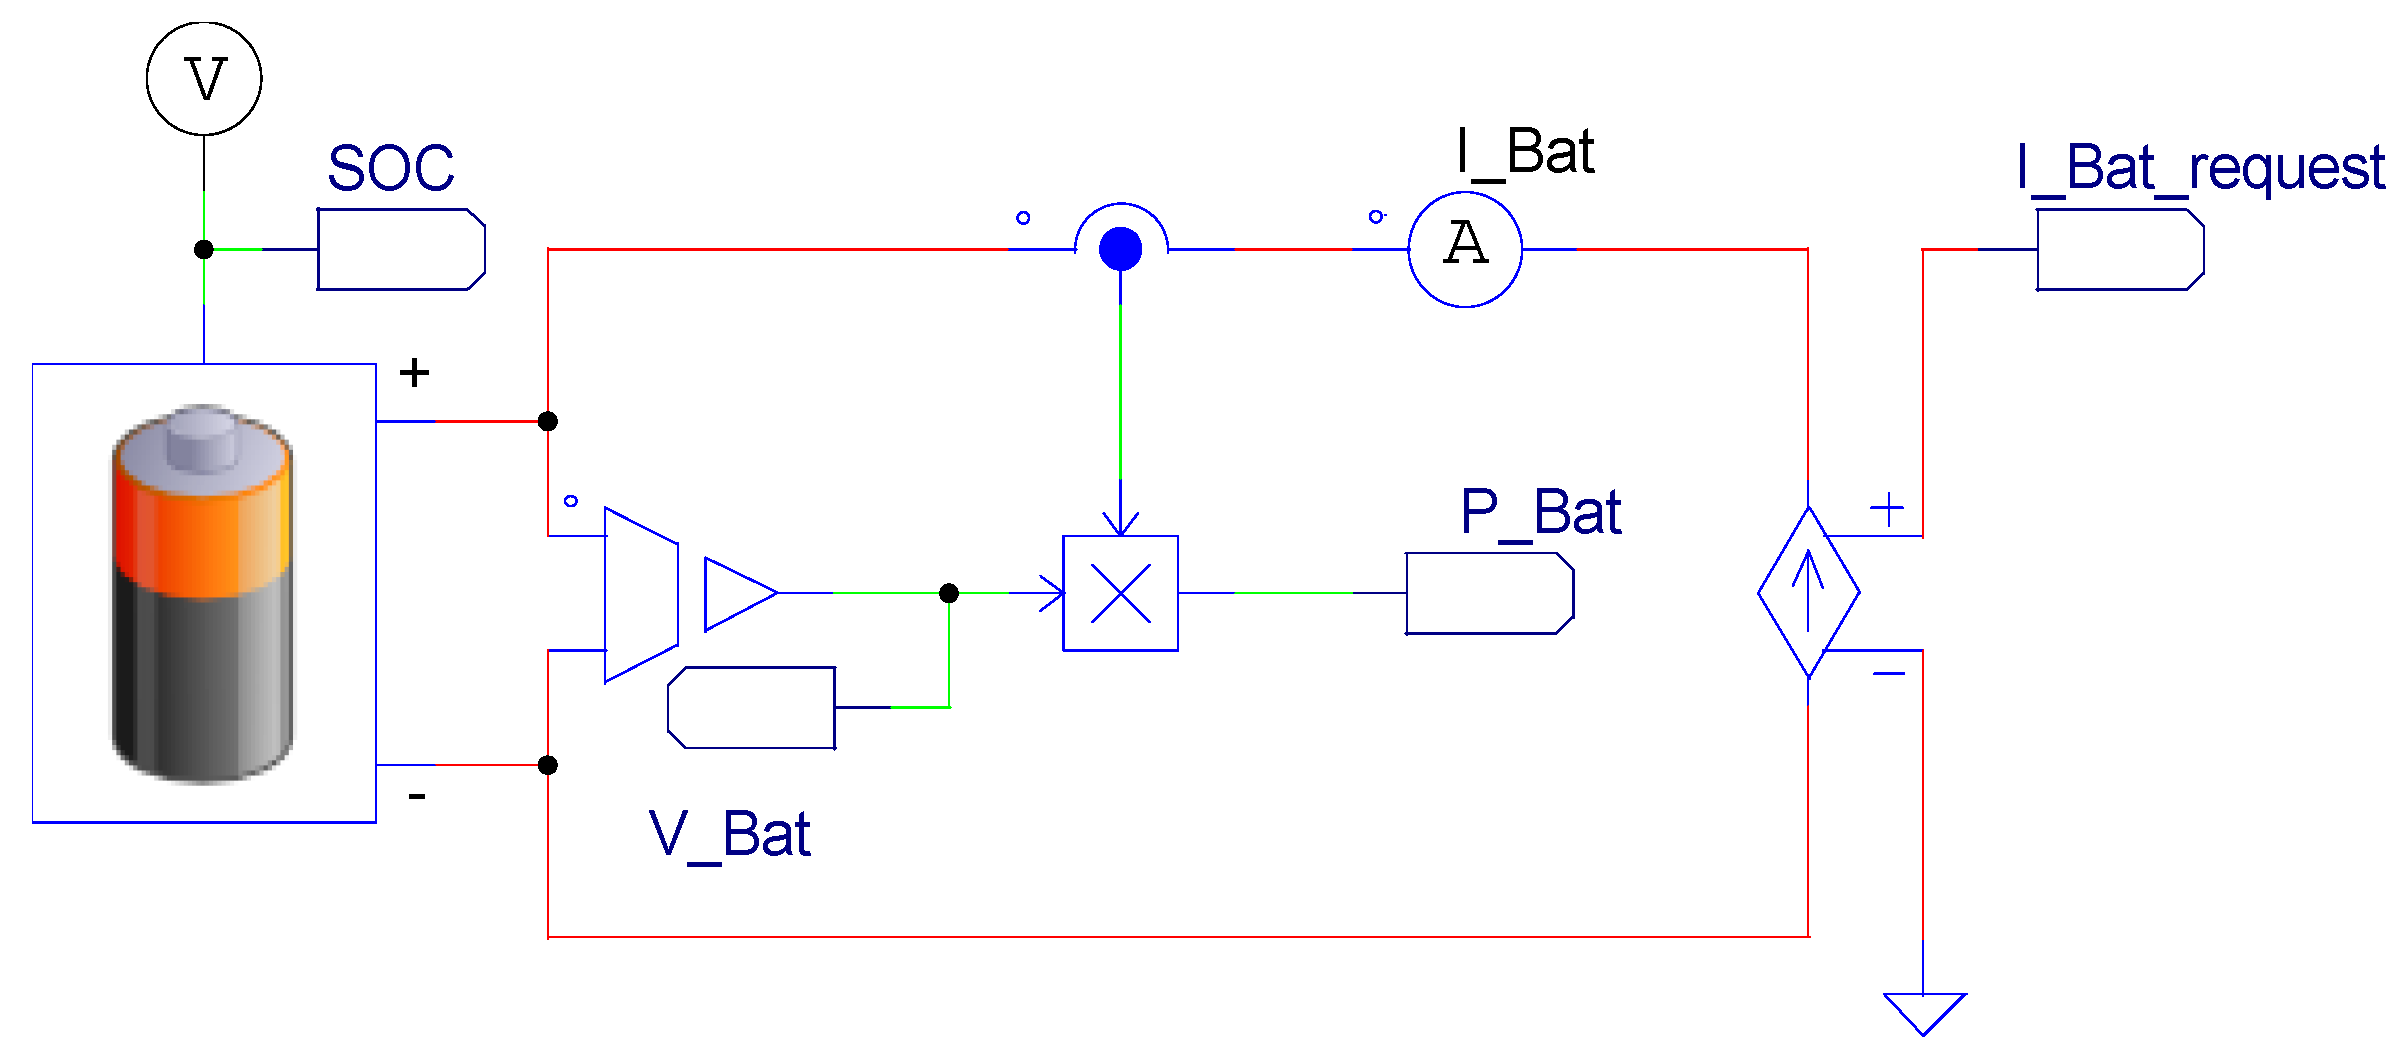
3.4. Implementation of the Generic Library Model

As explained with the Shepherd’s model, the library model is also specified for one storage module. The three required pairs of voltage and capacity ( V f u l l , Q f u l l ), ( V e x p ,   Q e x p ) and ( V n o m , Q n o m ) are given according Equations (15)–(17). The cut-off voltage and the maximum capacity are set to V c u t o f f = 32   V and Q m a x = 24.8   Ah . Like the Shepherd’s model, the internal resistor is set to R S = 36   m Ω. As described in the previous subsections, the complete storage system is assembled considering the individual modules connected in series ( n S ) and in parallel ( n m , P , n P ). Figure 15 depicts the arrangement in the PSIM schematic. The battery current I B a t is again generated by a controlled source with the control signal I B a t , r e q u e s t .

3.5. Model Validation

In order to validate the presented models, it is necessary to determine the precise load profile, i.e., the exact battery current in the simulation. Since no currents are measured in the monitoring system (see Figure 8), the current associated with the load distribution must be determined in a battery management system. The battery power P B a t in the model is calculated from the difference between the measured power of the load (consumer P C S R , m ) and the sources ( P P V , m and P C G , m ):
P B a t = P C S R , m ( P P V , m + P C G , m )
The signal I B a t , r e q u e s t , which is the control variable of the voltage-regulated current source (see Figure 11, Figure 13, Figure 14 and Figure 15), can be calculated in the model from the power P B a t and voltage V B a t :
I B a t , r e q u e s t = P B a t V b a t
In this calculation, it is necessary to ensure that the maximum charge and discharge power is not exceeded ( P d i s , m a x = P c h a r , m a x = 50   kW ). Furthermore, it must be noted that the maximum and minimum SOC is taken into account. As long as the SOC is within the specified limits ( 15 % < S O C < 95 % ), I B a t , r e q u e s t is calculated according to Equation (27), otherwise I B a t , r e q u e s t is zero ;   I B a t , r e q u e s t = 0   A . The arrangement of the DG simulation model for validation implemented in PSIM is depicted in Figure 16.
The input data are the power curves of the consumers P C S R , m , the PV system P P V , m , and the CG P C G , m measured over one day in the monitoring system. The battery model itself is linked to the sub-models CSR, PV, CG, and GRID that determine the power flow according to the input data in the simulation. With the help of this management system, the exact profile of the battery current can be generated. The output values are the current I B a t , voltage V B a t , power P B a t , and SOC. In this way, it can be verified whether the models are suitable for a prediction of the current and voltage characteristics, as well as the SOC, in the described grid application.

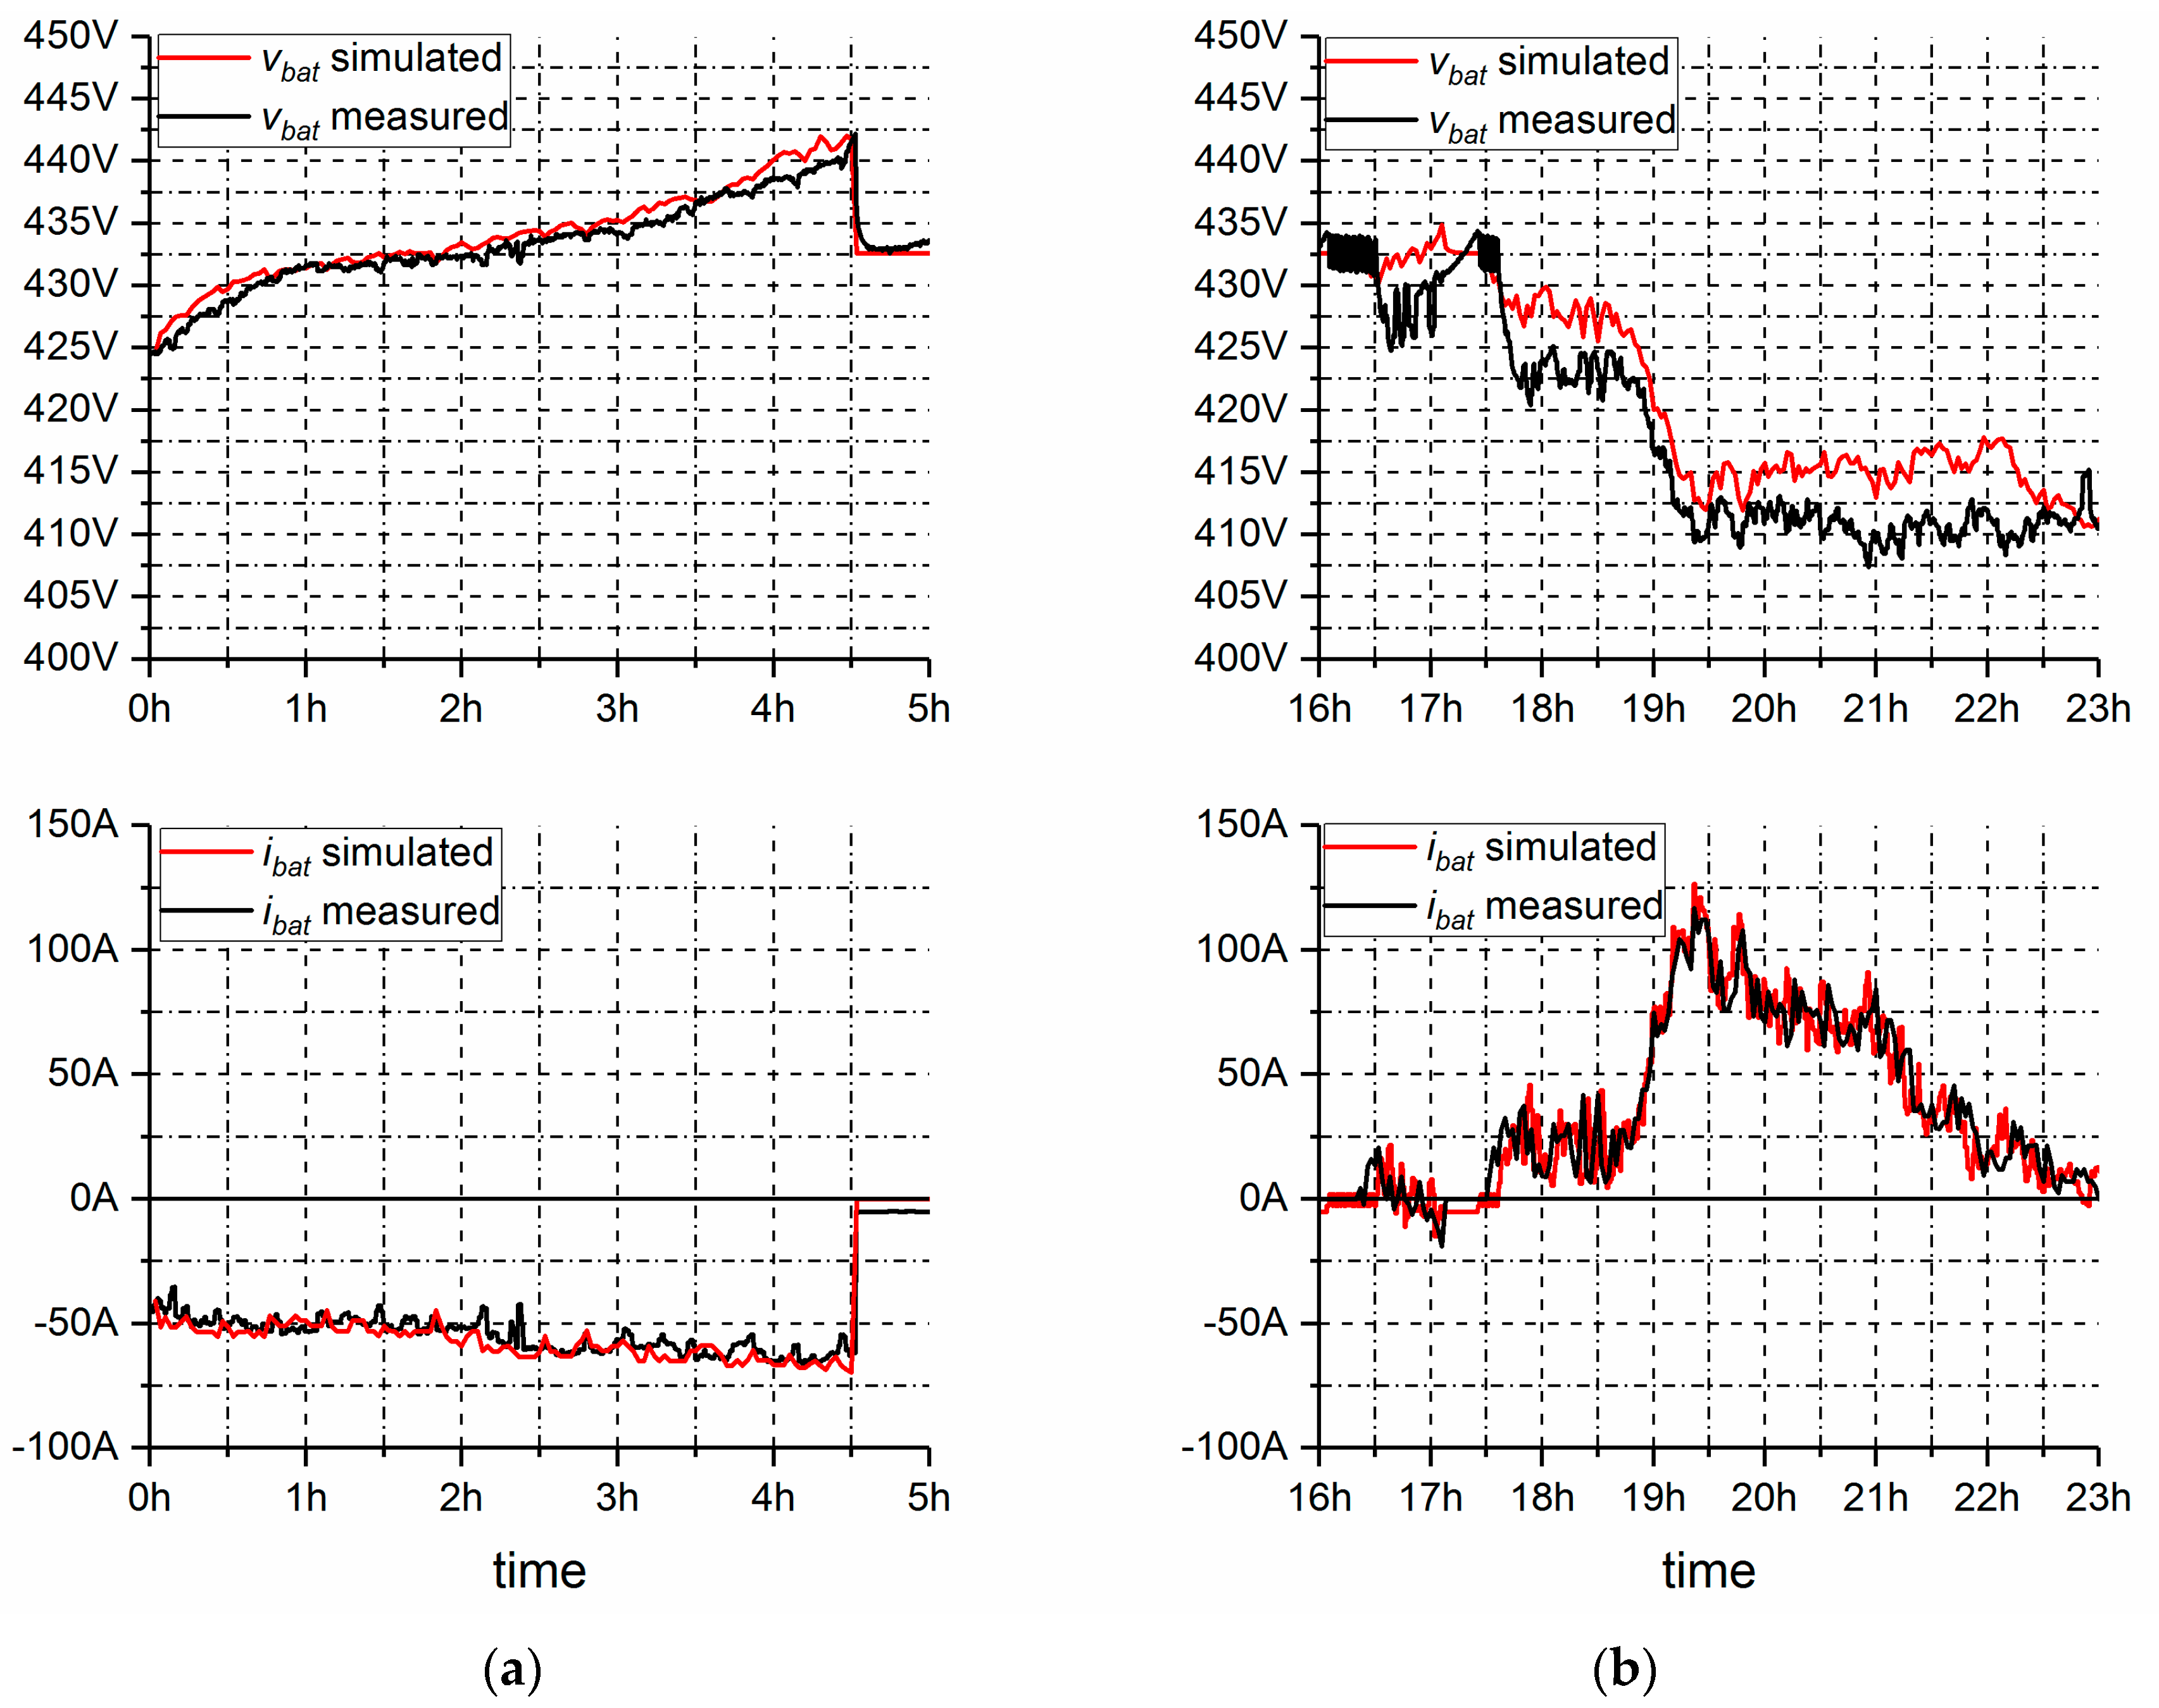
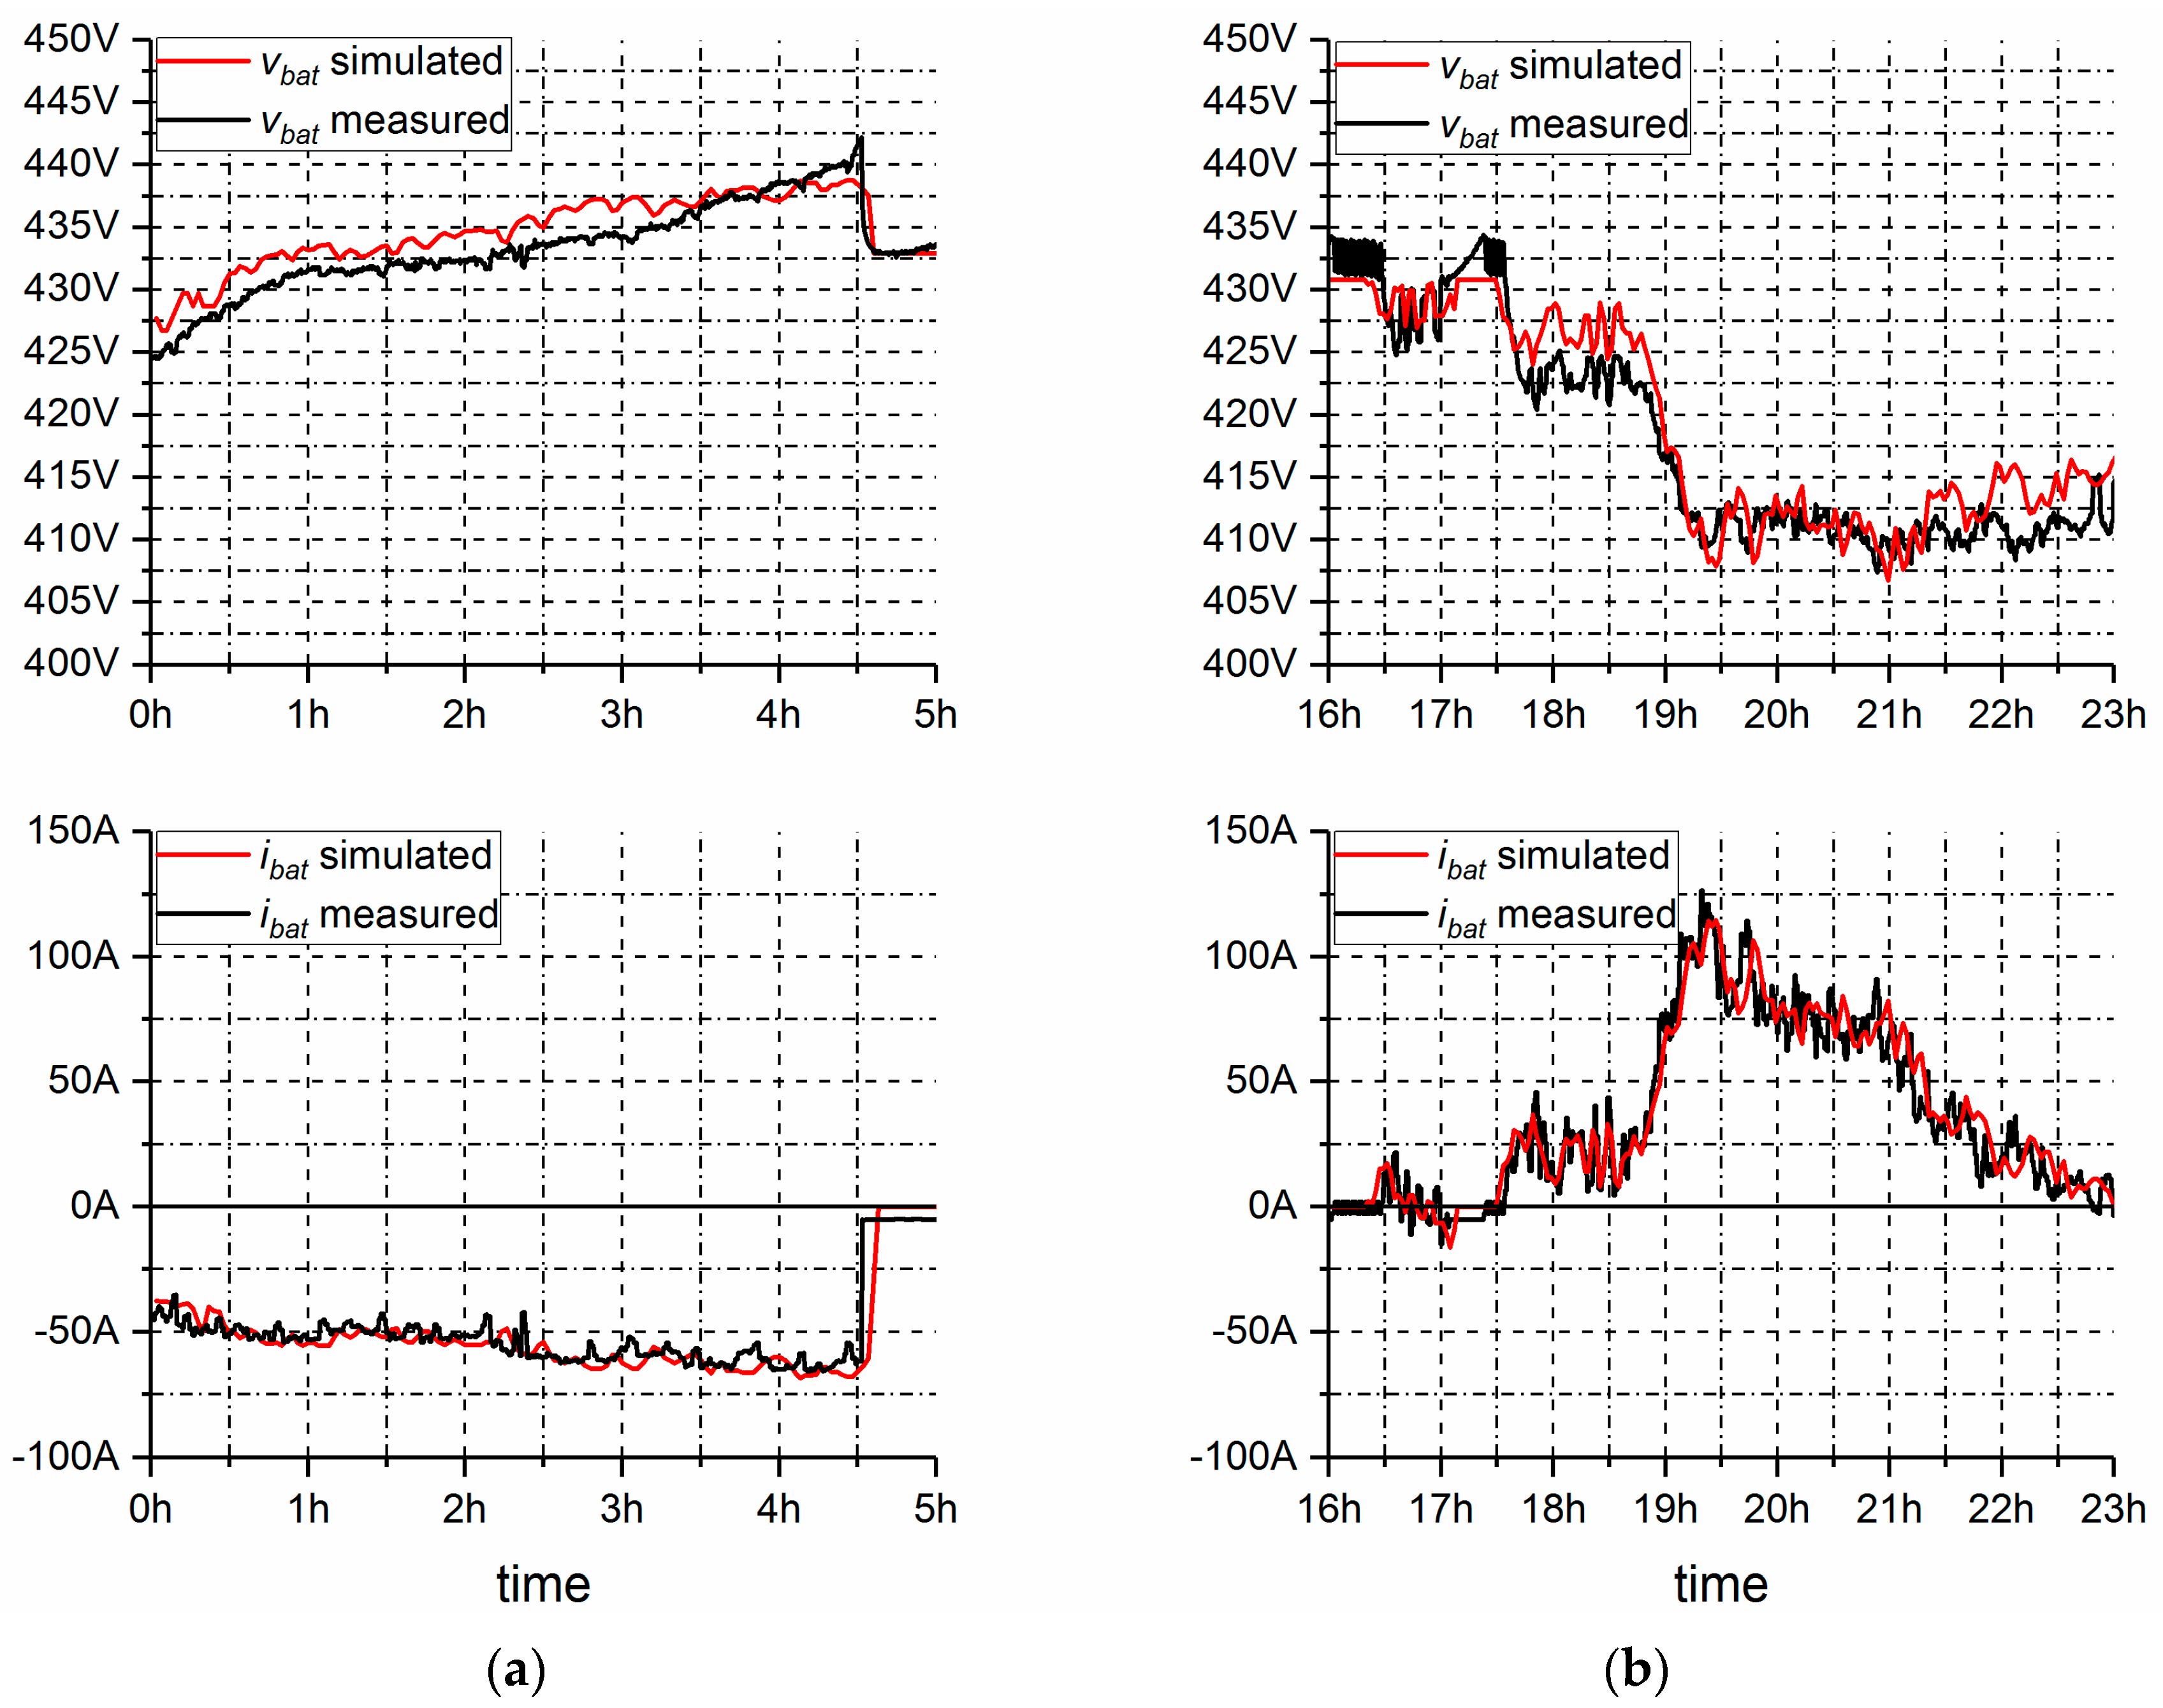
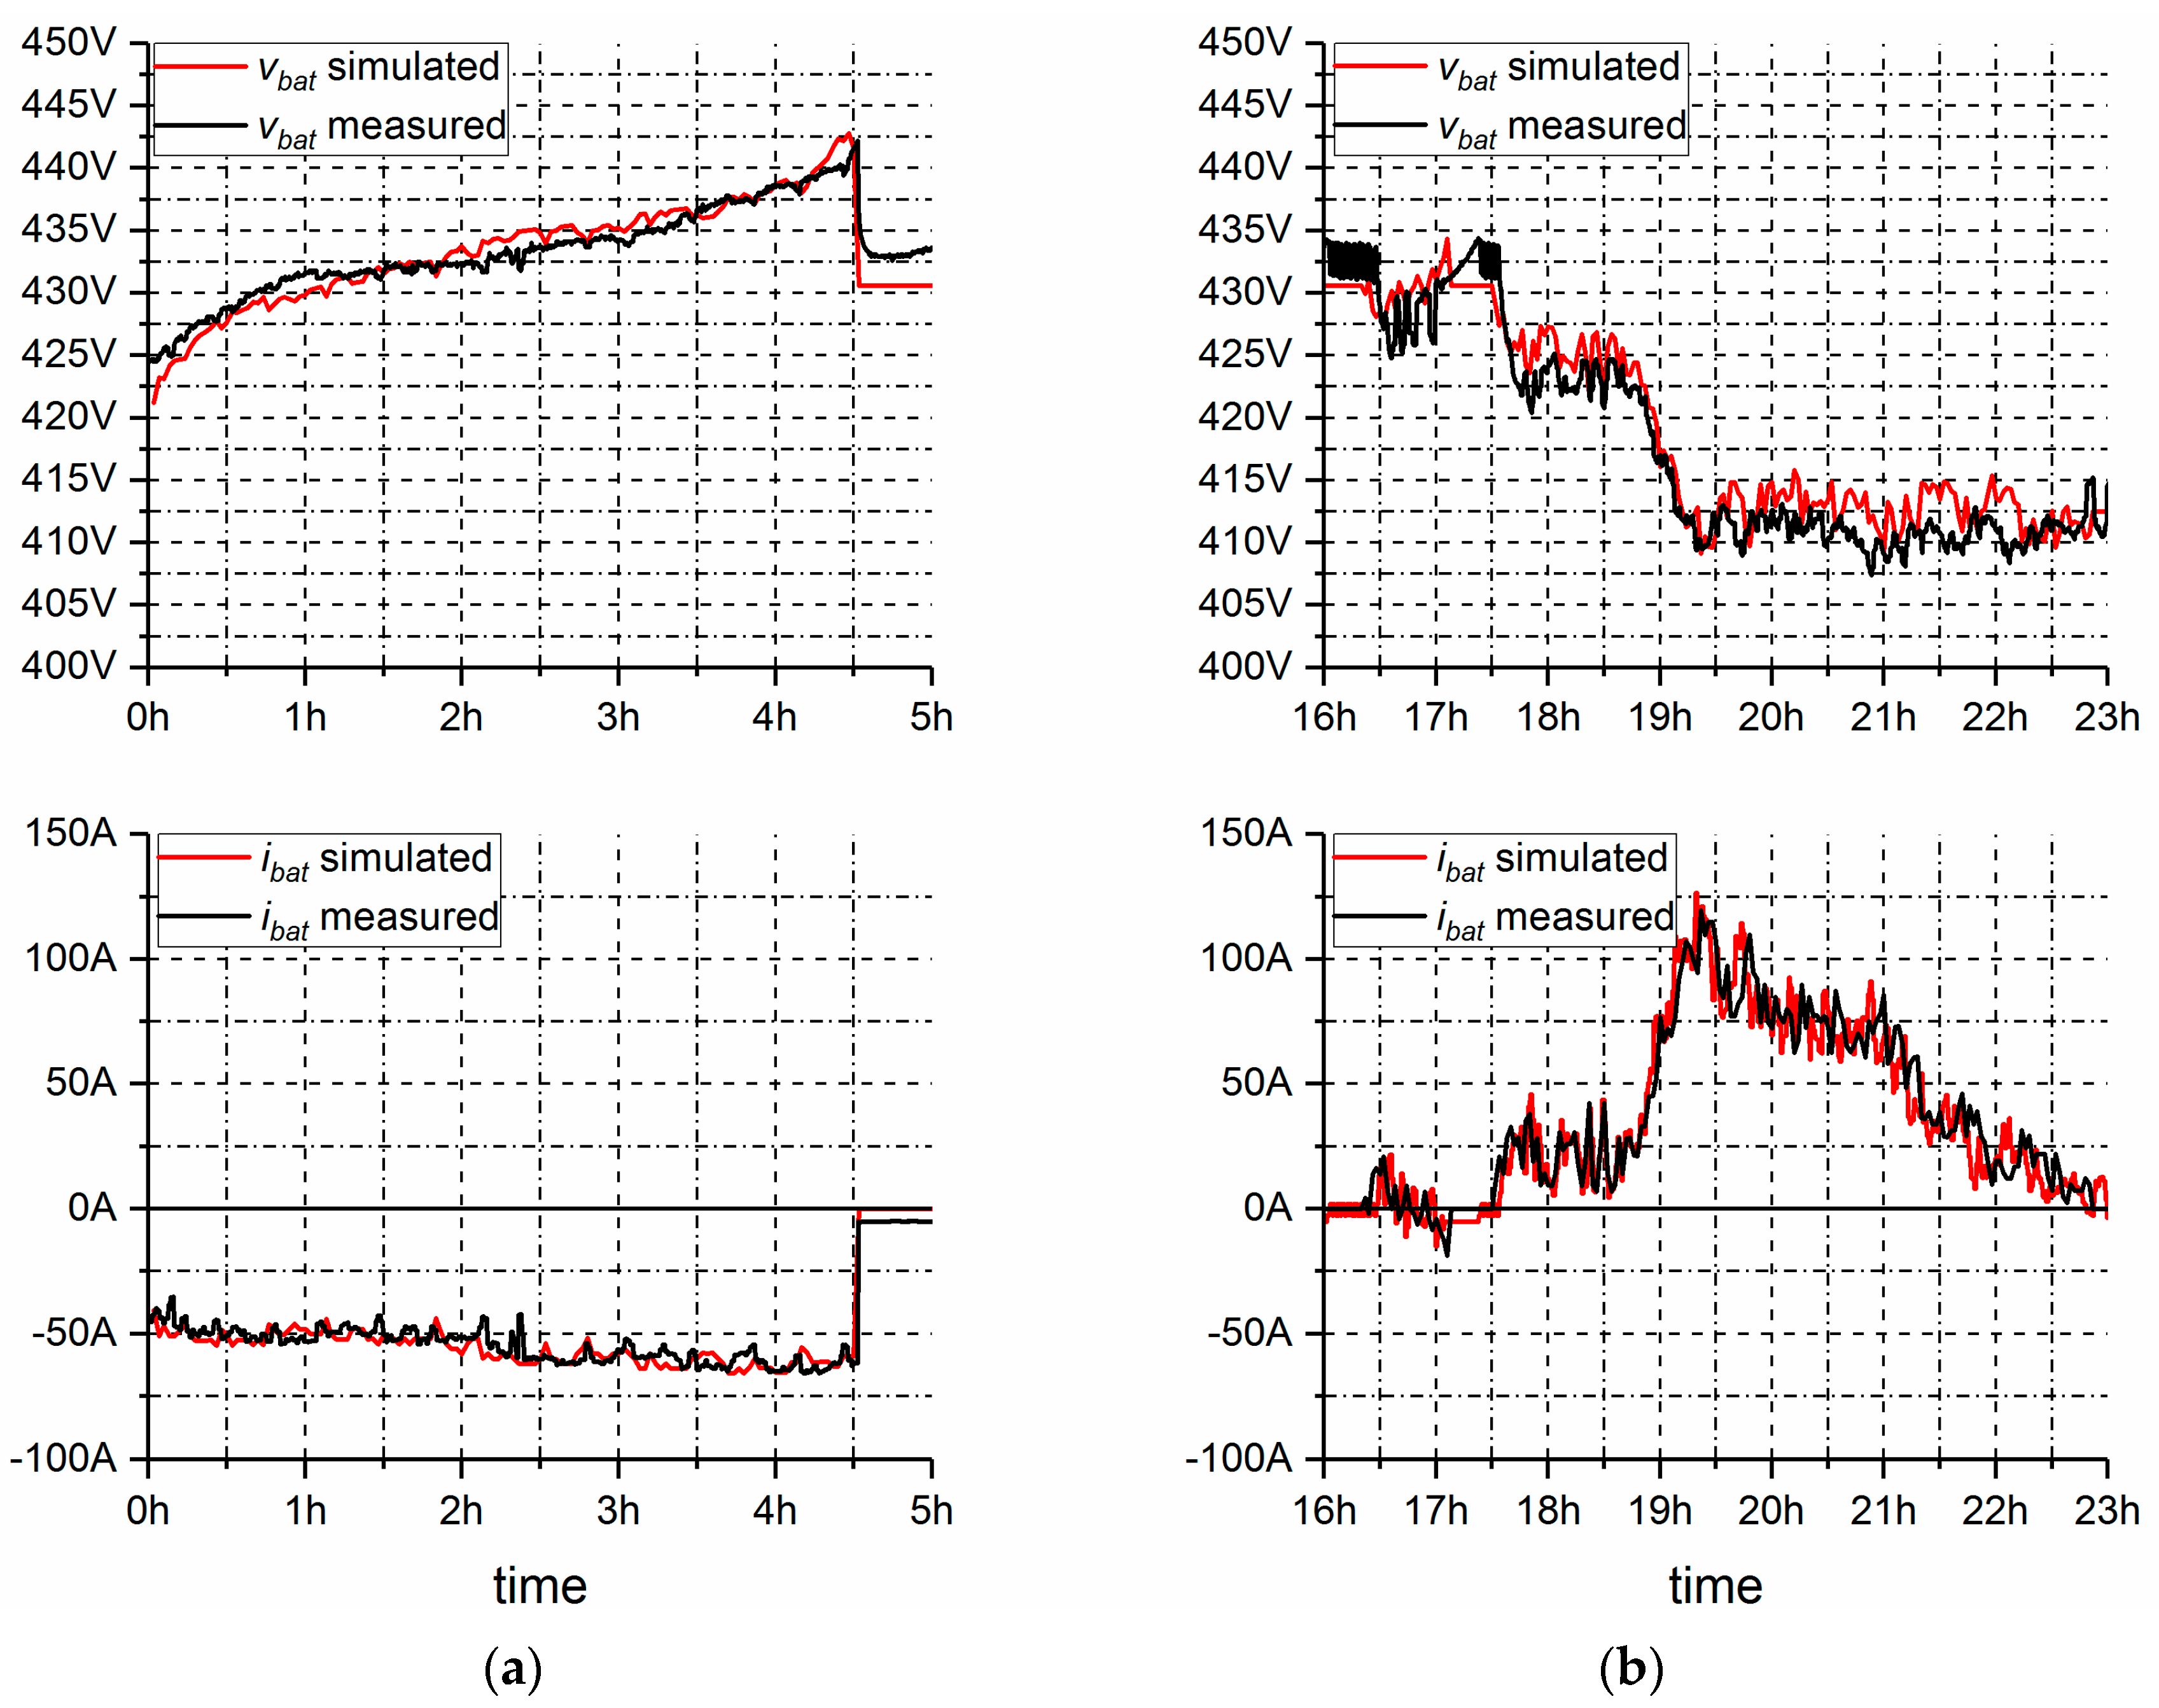
3.5.1. Predicting I–V Performance

In a first validation step, the discussed models are investigated with regard to their suitability for predicting the current and voltage characteristics. For this purpose, one 24-h operating day with the system quantities illustrated in Figure 17 is analyzed. The top layer shows the load power P C S R (grey curve) and the electrical power of the CG P C G (red line) (for variable assignment see Figure 8). The subsequent layer show the grid power P G R I D (positive power is drawn from the grid, negative power is fed-into the grid), the PV power P P V , and the battery power P B a t (positive power indicates discharge, negative power charge). Finally the bottom layer displays the SOC.
All power values are measured and recorded with a sampling time of 1 min in the monitoring system and assigned to the simulation model as input data. As described in Section 3.5, the load profile of the battery can thus be specified. The output voltage V B a t and current I B a t of the installed battery are recorded by means of an oscillographical measurement for the same day with a sampling time of 200   ms . In the course of the validation, the battery charging from 0 to 5   h and discharge from 16 to 23   h are considered as follows. Figure 18a,b shows the simulated and measured current and voltage curves for the Thevenin-based model. The maximum absolute error is below 2.5   V (relative error related to the full voltage 432.5   V is 0.6 % ) during charging. However, the simulation results during discharge are quite inaccurate due to the coarse parameterization (error 7.5   V , 1.8 % ). The model cannot follow dynamic load changes. Figure 19a,b illustrates the comparison of simulated and measured current and voltage for the Rint model. In both cases, battery charging and discharge, the maximum absolute error is below 2.5   V ( 0.6 % ). Figure 20a,b gives the corresponding results for the Shepherd’s model. It achieves a good accuracy in both cases, the maximum absolute error is below 3.8   V ( 0.8 % ). Finally, Figure 21a,b provides the related comparisons for the PSIM library model. A good accuracy of the simulation results can also be observed herewith. For battery charging and discharge, the maximum absolute error is below 2.5   V ( 0.6 % ).

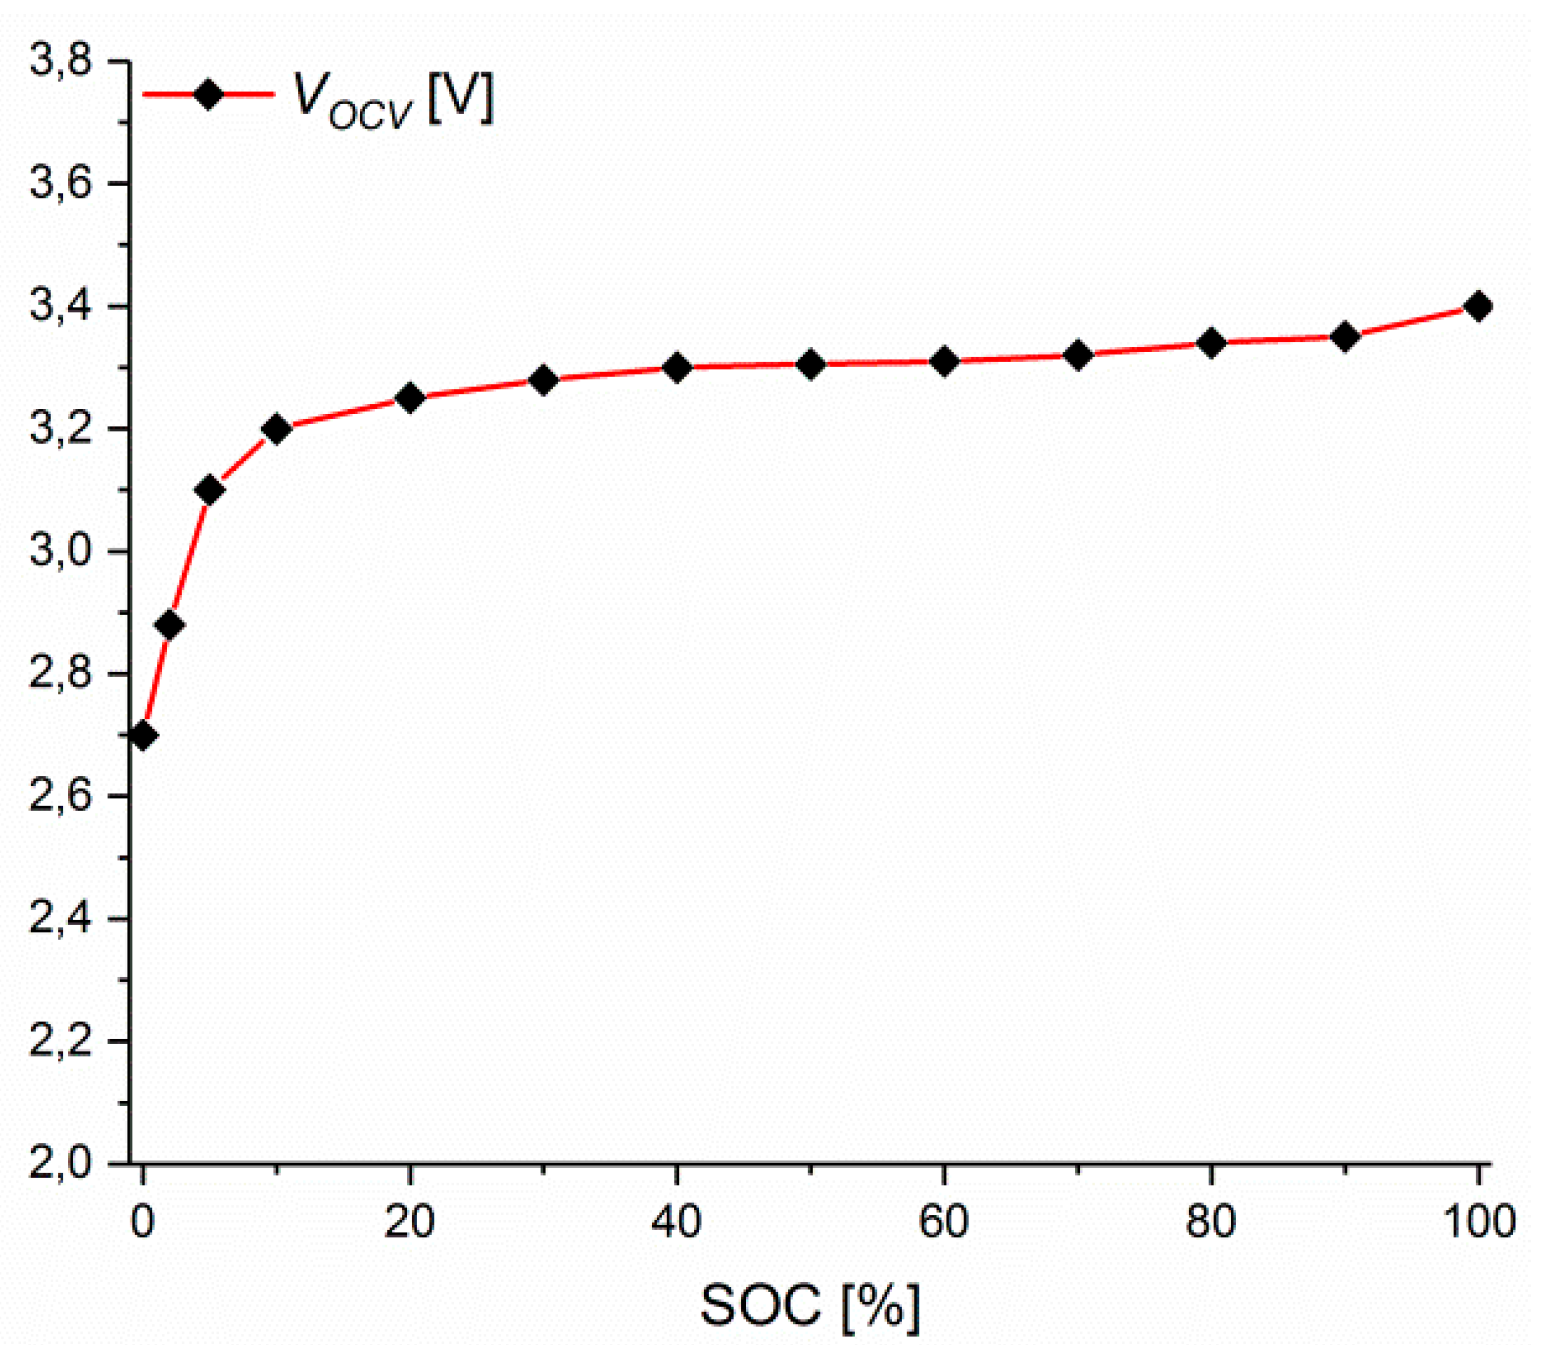
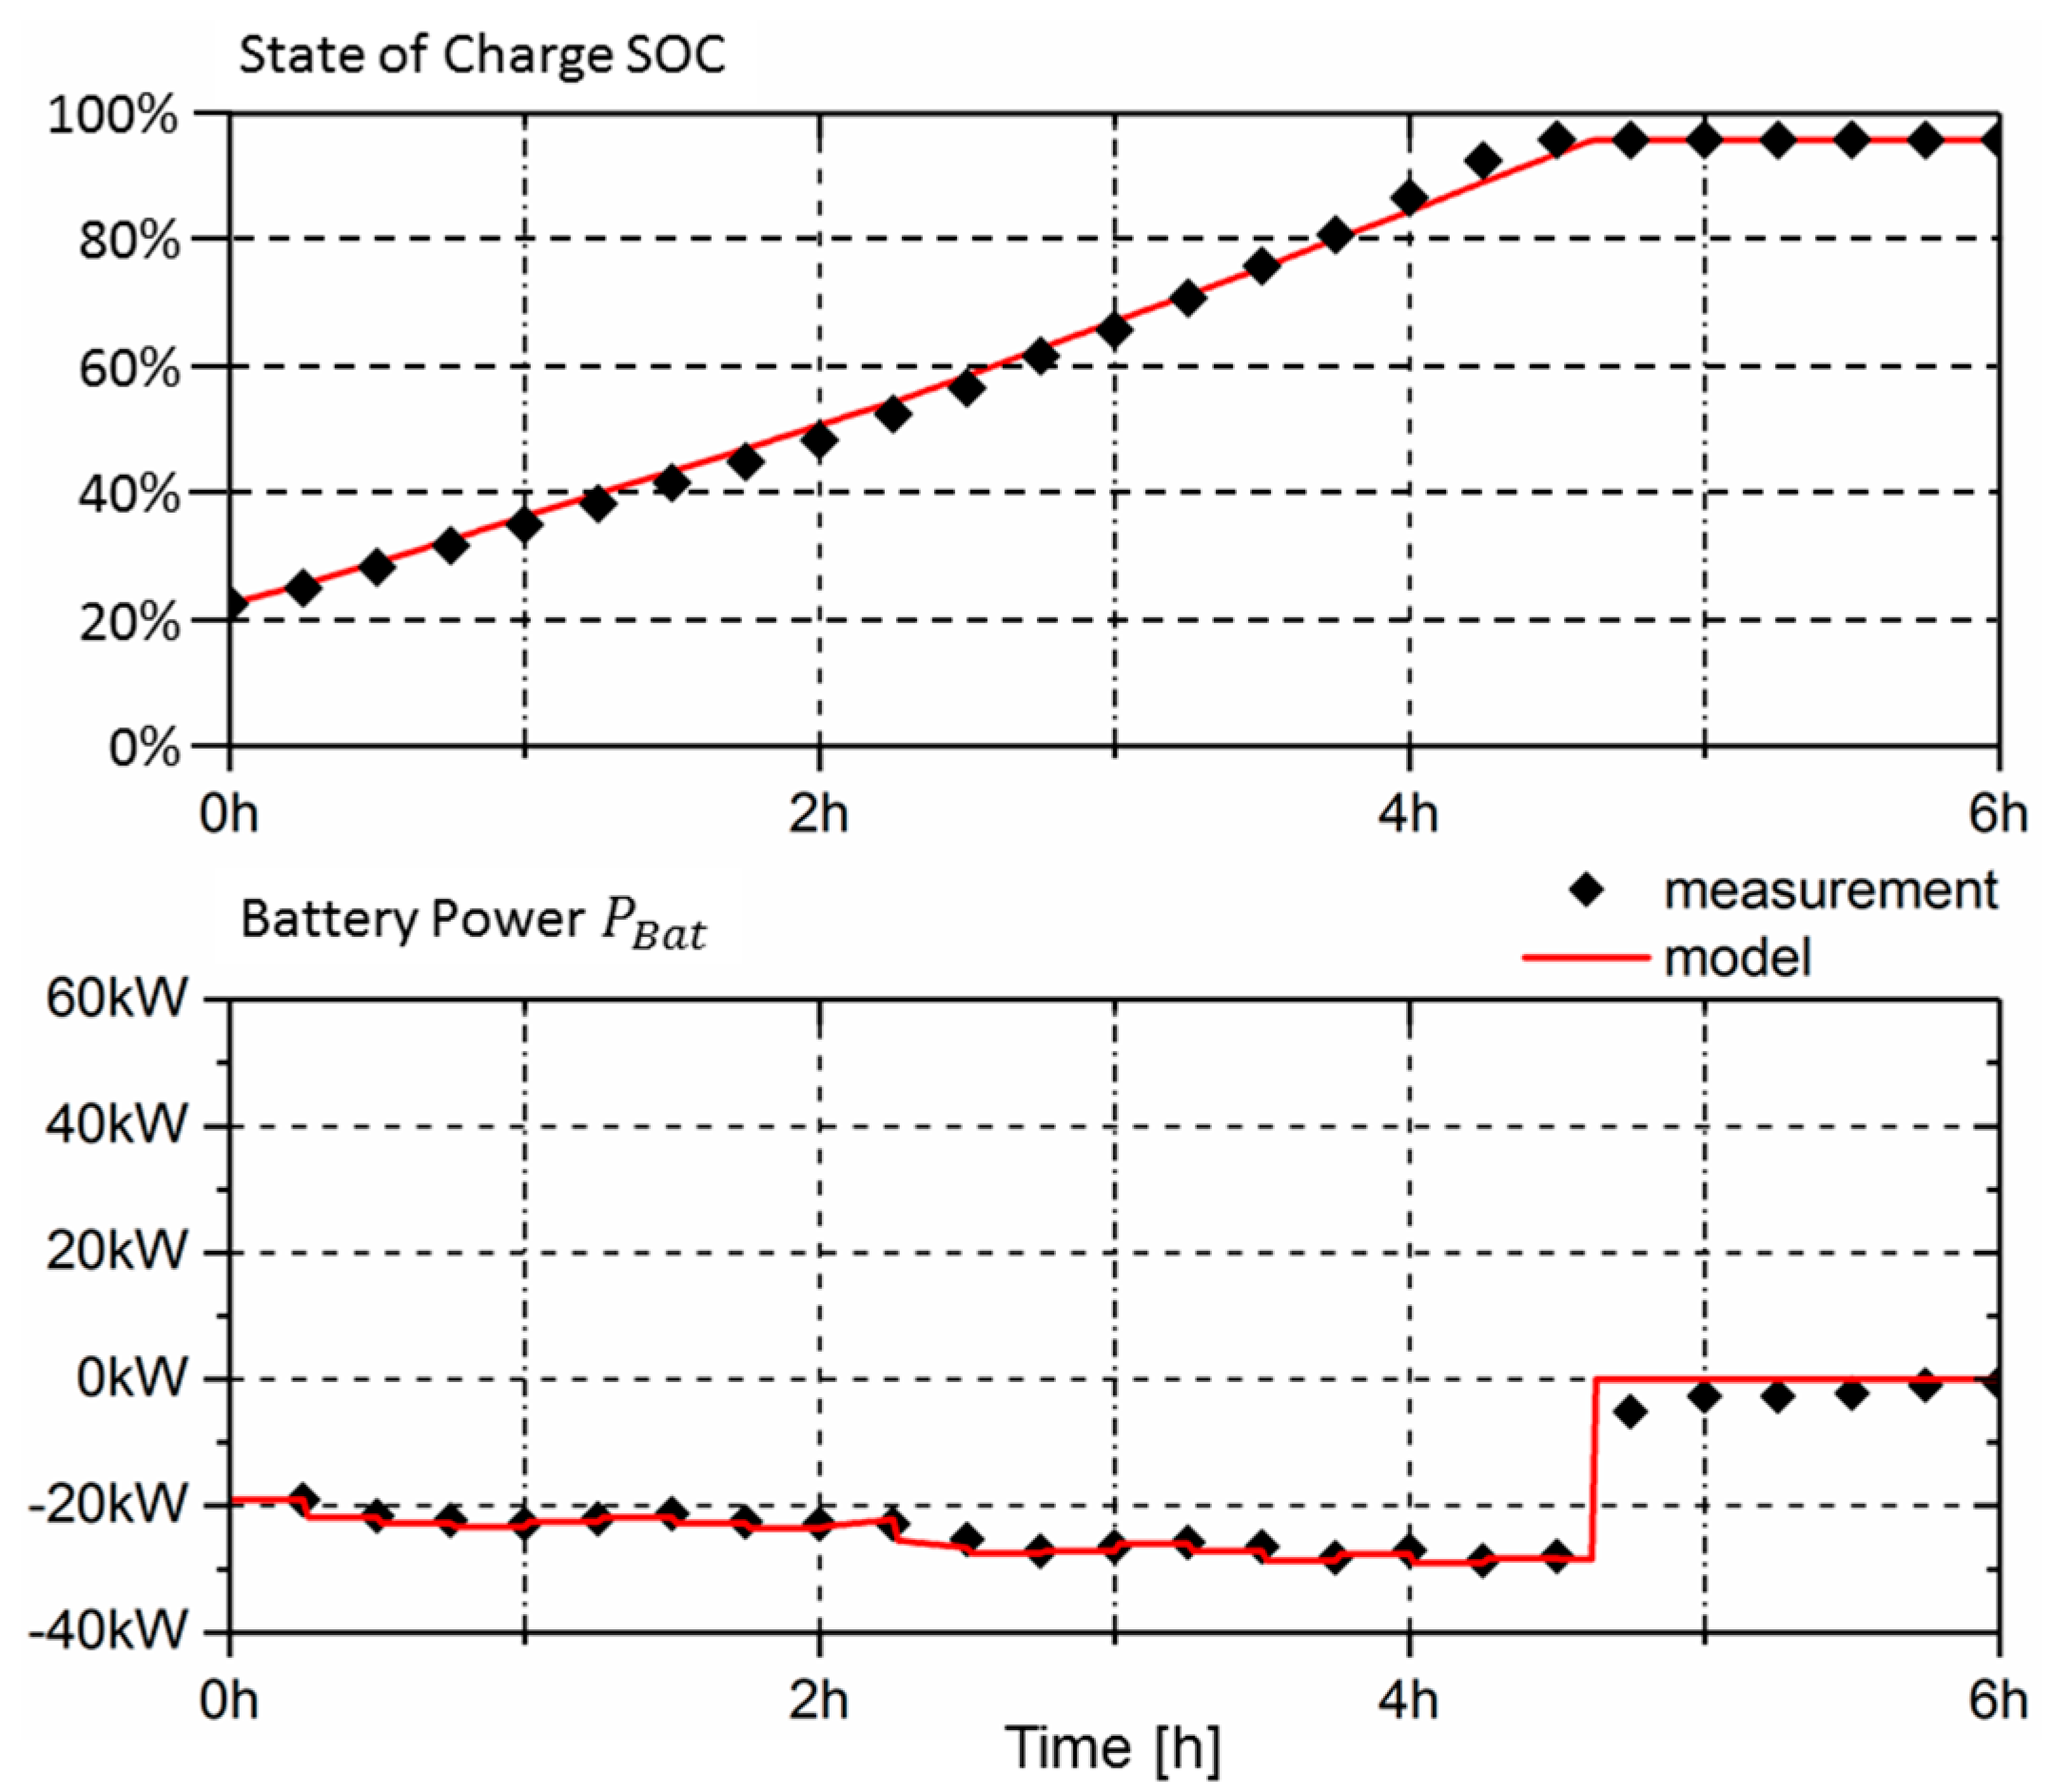
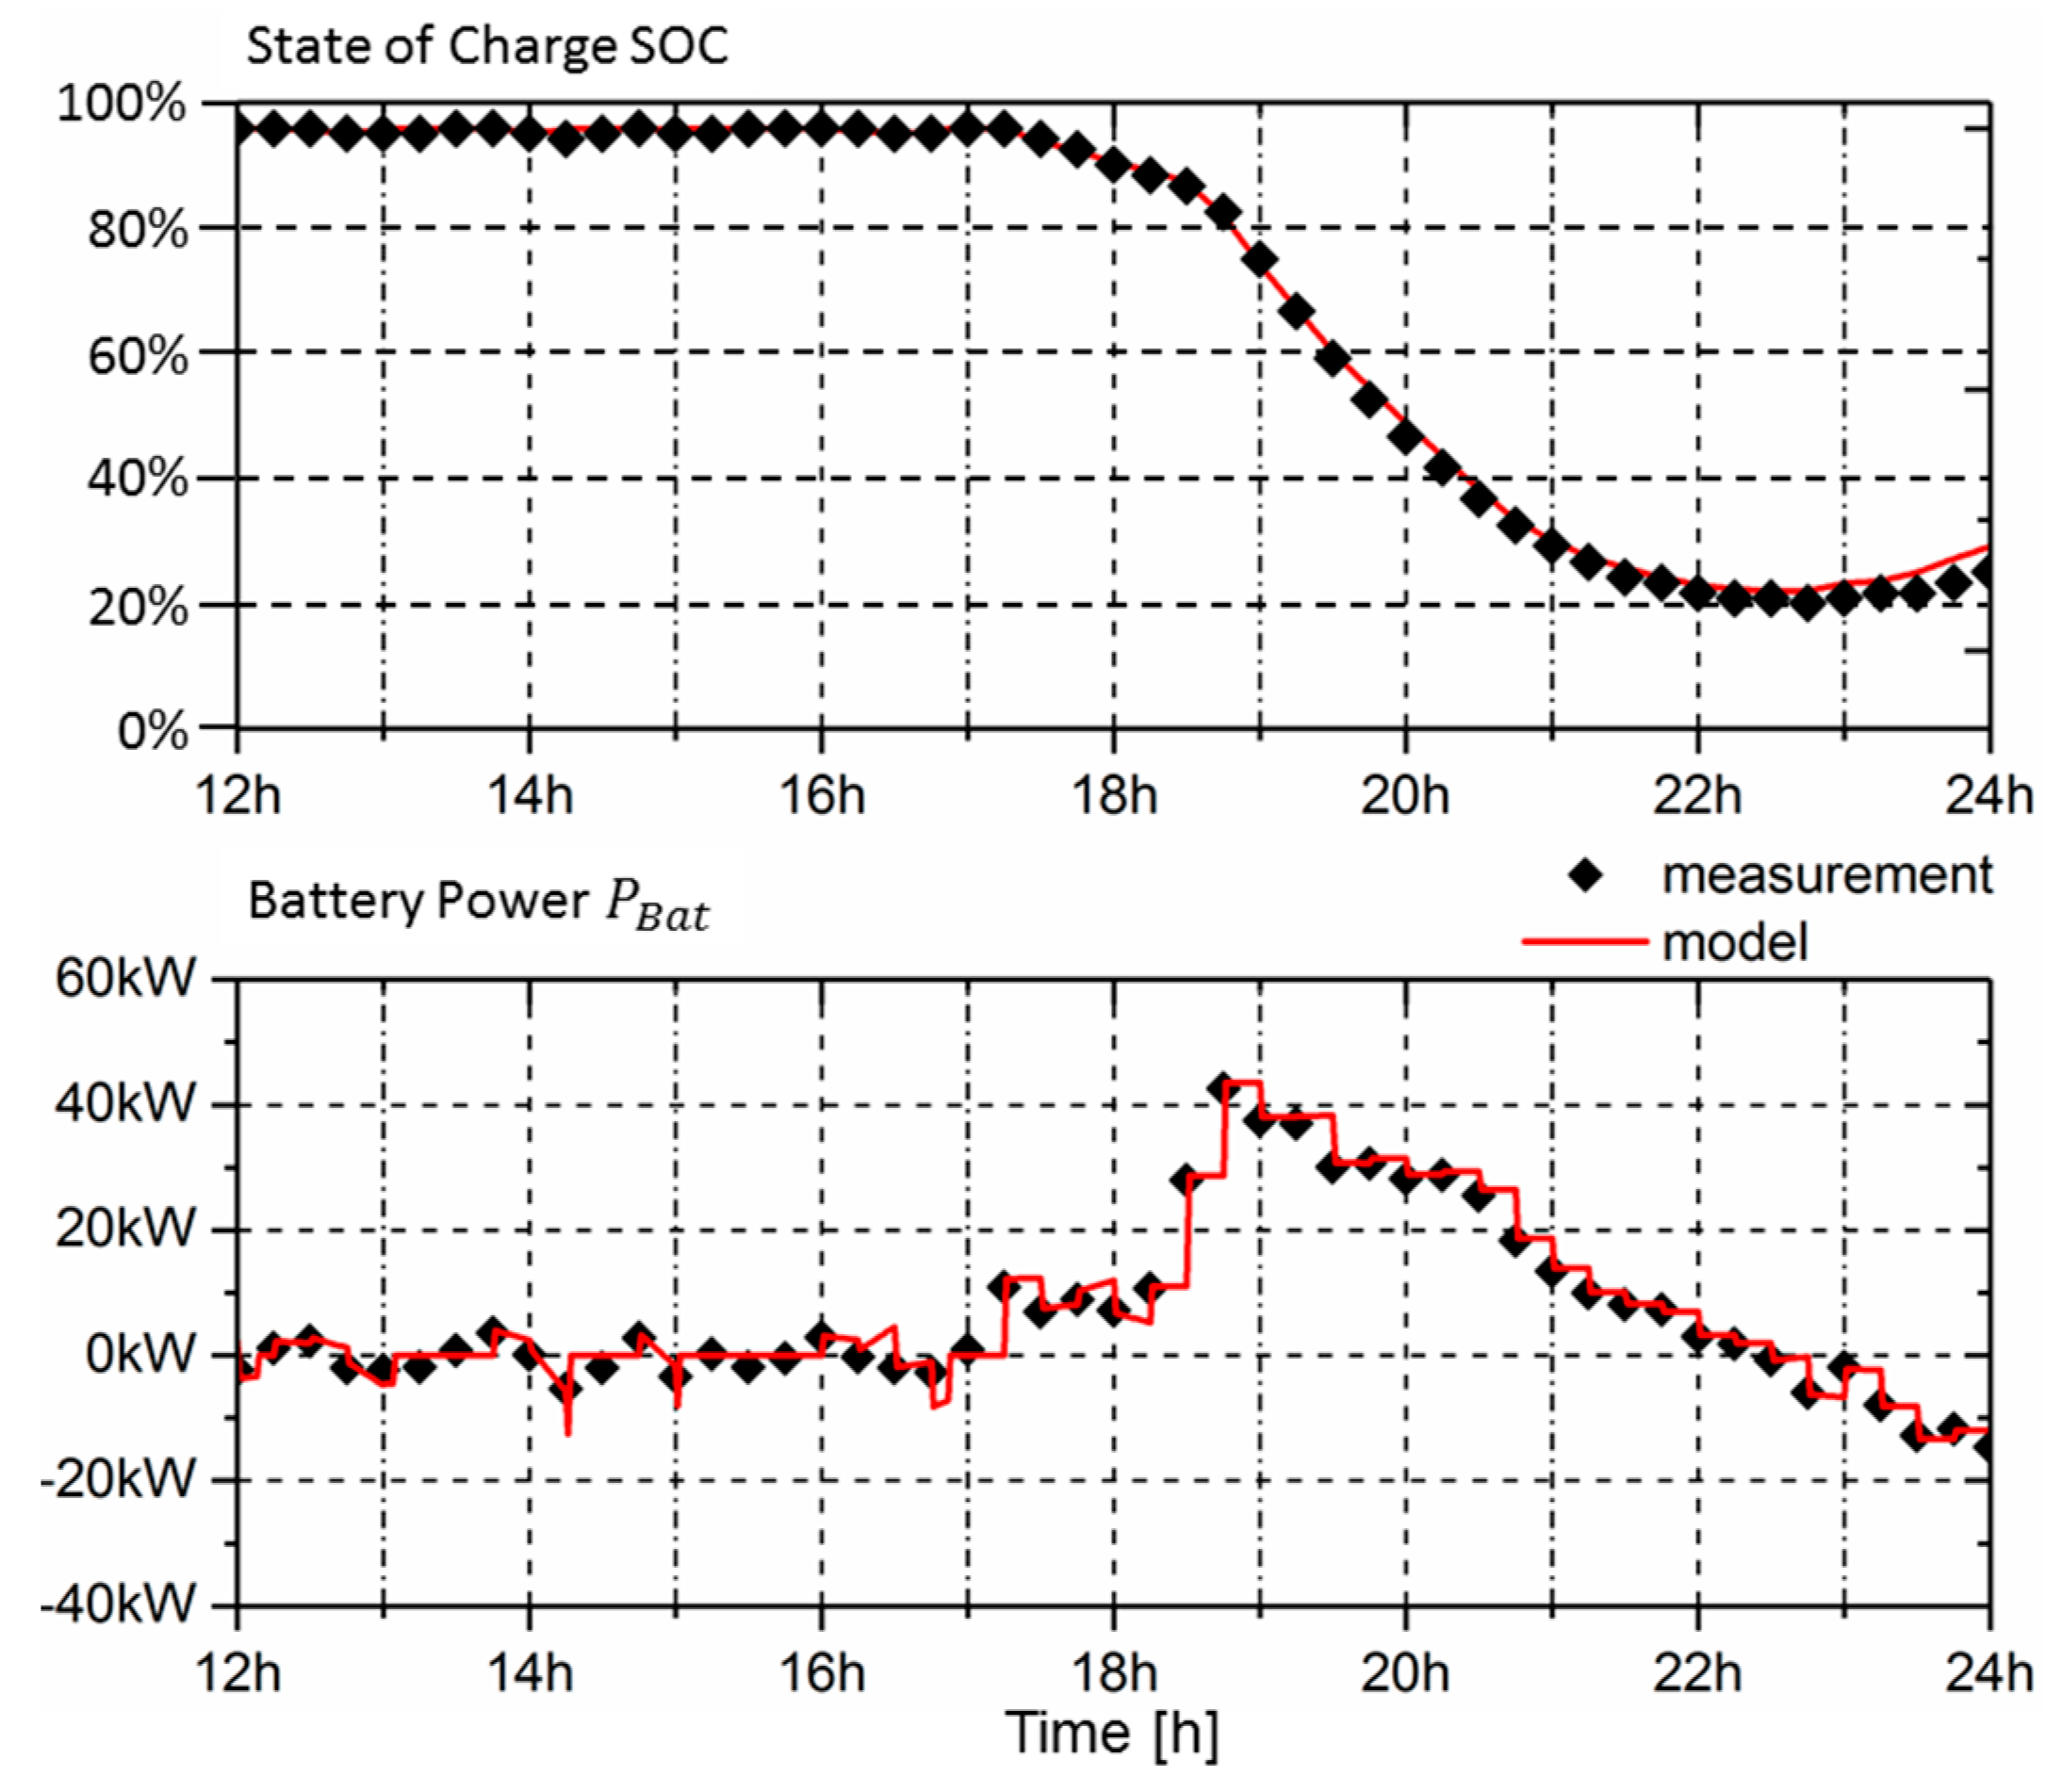
3.5.2. Predicting SOC Performance

For the development of an advanced power management in grid applications, e.g., dynamic control of loads and load shifting for demand side management, accurate knowledge of the state of charge is necessary. Therefore, the simulated and the measured SOC for a 24-h operating day of the DG are now compared. For this purpose, the SOC is measured and recorded with a sampling time of 15 min in the monitoring system (a sampling time of 1 min could not be set when recording the SOC). Since the simulated SOC and battery power P B a t is identical for all four models examined, only one curve for the results of the model is shown below. Figure 22 depicts the simulated and the measured SOC and battery power P B a t for charging, and Figure 23 for discharge. As mentioned in Section 3.5.1, the battery is charged with negative power ( P B a t < 0 ) and discharged with positive power ( P B a t > 0 ). The comparison in both cases shows a reasonable accuracy of the model results. These findings reveal that the investigated models are suitable for SOC evaluation, in addition to adequate current and voltage performance prediction.

4. Discussion

From consideration of the variety of models for batteries, in particular for lithium-ion batteries, the discussion focuses on the problems of parameterization and implementation in a simulation environment. In principle, the Thevenin-based, the Rint, and the Shepherd’s models, as well as the PSIM model, are suitable for the simulation-based development of power supply networks, smart grids, and distributed power generation. The determination of the network elements of the Thevenin-based model demands a parameter extraction based on a measurement procedure of the used battery. Similarly, the internal resistance of the Rint model must be obtained from measurements. Both models require knowledge of the open circuit voltage as a function of the SOC. It was shown how these models can be parameterized, even without available laboratory samples, with the help of the presented case study. The parameterization of the Shepherd’s and PSIM models is rather uncomplicated, since all necessary parameters can be taken from the data sheet of the cell type utilized. The validation carried out shows that all four models provide adequate simulation results.

5. Conclusions

In this study, it was discussed that distributed energy generation represents a significant contribution to the use of renewable energies. By utilizing lithium-ion batteries to store electrical energy in these systems, there is a need to provide appropriate battery models for the design of advanced power managements in the future. It was pointed out which requirements are demanded of suitable models. For this purpose, a brief review of the most important models was given first, followed by a discussion of electrical equivalent circuit models. In this context, the advantages and disadvantages of the individual models were outlined. Subsequently, the parameterization and implementation of three commonly known models and one library model in an electrical circuit simulator was presented. Finally, all four models were validated using a case study. Here it could be shown that very good simulation results can be achieved with regard to voltage and current characteristics. With regard to the prediction of the state of charge, adequate results were achieved.
In this work, no temperature effects on the cell behavior were considered. In addition, it was assumed that the battery capacity does not change with the current amplitude. Therefore, in continuing work, models will be identified taking into account the Peukert effect in order to improve the prediction of the state of charge.

Funding

This research received no external funding.

Acknowledgments

The author would like to thank Jonas Kilz and Robert Klemmer from Süwag Grüne Energien GmbH in Frankfurt, Germany for their support in this study.

Conflicts of Interest

The author declares no conflict of interest.

References

  1. Exxon Mobil 2018 Outlook for Energy: A View to 2040. Report 2017. Available online: https://corporate.exxonmobil.com/energy-and-environment/energy-resources/outlook-for-energy/2018-outlook-for-energy-a-view-to-2040 (accessed on 2 August 2019).
  2. Schaeffer, M.; Rogelj, J.; Roming, J.; Sferra, F.; Hare, B.; Serdeczny, O. Feasibility of Limiting Warming to 1.5 and 2 °C. Climate Analytics Report 2015. Available online: https://climateanalytics.org/briefings/feasibility-of-limiting-warming-to-below-15c/ (accessed on 2 August 2019).
  3. Dröge, S. The Paris Agreement 2015, Turning Point for the International Climate Regime. SWP Research Paper, German Institute for International and Security Affairs 2016. Available online: https://www.ssoar.info/ssoar/handle/document/46462 (accessed on 2 August 2019).
  4. Cox, S.; Gagnon, P.; Stout, S.; Zinman, O.; Watson, A.; Hotchkiss, E. Distributed Generation to Support Development-Focused Climate Action. National Renewable Energy Laboratory 2016. Available online: https://www.climatelinks.org/resources/distributed-generation-support-development-focused-climate-action (accessed on 2 August 2019).
  5. Matvoz, D.; Leskovec, R.; Maksić, M. Optimized reactive power characteristics for distributed generation sources in the low voltage network. In Proceedings of the IEEE Manchester PowerTech, Manchester, UK, 18–22 June 2017. [Google Scholar]
  6. Jedrychwski, R.; Sereja, K. Control system for distributed generation in low voltage network systems. Przegląd Elektrotechniczny 2018, 94, 50–53. [Google Scholar] [CrossRef]
  7. Anaya, K.L.; Pollitt, M.G. Integrating Distributed Generation: Regulation and Trends in Three Leading Countries. Energy Policy 2015, 85, 475–486. [Google Scholar] [CrossRef]
  8. Lowder, T.; Zhou, E.; Tian, T. Evolving Distributed Generation Support Mechanisms: Case Studies from United States, Germany, United Kingdom, and Australia; National Renewable Energy Laboratory, Technical Report 2017; National Renewable Energy Laboratory: Lakewood, CO, USA, 2017.
  9. Thielmann, A.; Sauerand, A.; Wietschel, M. Overall Roadmap Stationary Energy Storage 2030 (Original German Title: Gesamt-Roadmap Stationäre Energiespeicher 2030); Fraunhofer Institute for Systems and Innovation Research ISI, Karlsruhe Germany: Karlsruhe, Germany, 2015. [Google Scholar]
  10. Eaton Powerquality Power Xpert 9395P UPS 250–1200 kVA. Datasheet 2015. Available online: https://www.eaton.com/us/en-us/products/backup-power-ups-surge-it-power-distribution/backup-power-ups.html (accessed on 9 June 2019).
  11. Electrotechnical Commission. White Paper—Electrical Energy Storage, International; Electrotechnical Commission: Geneva, Switzerland, 2011. [Google Scholar]
  12. Ding, C.; Zhang, H.; Li, X.; Liu, T.; Xing, F. Vanadium Flow Battery for Energy Storage: Prospects and Challenges. J. Phys. Chem. Lett. 2013, 4, 1281–1294. [Google Scholar] [CrossRef] [PubMed]
  13. Coote, N.; Milne, G. 1 MW Battery, Shetland; Scottish and Southern Energy Power Distribution: Perth, UK, 2013. [Google Scholar]
  14. Lemmon, J.P. Planar ZEBRA battery for renewable integration and grid applications. In Proceedings of the IBA Meeting, Cape Town, South Africa, 12–14 April 2011. [Google Scholar]
  15. Vasconcelos, J. Electricity storage: How to facilitate its deployment and operation in the EU, THINK. In Proceedings of the 7th EU Framework Program, Final Report, 21–22 June 2012. Available online: https://www.eui.eu/Projects/THINK/Documents/Thinktopic/THINKTopic8online.pdf (accessed on 9 June 2019).
  16. Hesse, H.C.; Schimpe, M.; Kucevic, D.; Jossen, A. Lithium-Ion Battery Storage for the Grid—A Review of Stationary Battery Storage System Design Tailored for Applications in Modern Power Grids. Energies 2017, 10, 2107. [Google Scholar] [CrossRef]
  17. Li, K.; Tseng, K.J. An electrical model capable of estimating the state of energy for lithium-ion batteries used in energy storage systems. In Proceedings of the IEEE 2nd Annual Southern Power Electronics Conference (SPEC), Auckland, New Zealand, 5–8 December 2016. [Google Scholar]
  18. Rodrigues, E.M.G.; Godina, R.; Osório, G.J.; Lujano-Rojas, J.M.; Matias, J.C.O.; Catalão, J.P.S. Comparison of Battery Models for Energy Storage Applications on Insular Grids. In Proceedings of the Australasian Universities Power Engineering Conference, Wollongong, Australia, 27–30 September 2015. [Google Scholar]
  19. Xia, T.; Li, M.; Zi, P.; Tian, L.; Qin, X.; An, N. Modeling and Simulation of Battery Energy Storage System (BESS) Used in Power System. In Proceedings of the 5th International Conference on Electric Utility Deregulation and Restructuring and Power Technologies, Changsha, China, 26–29 November 2015. [Google Scholar]
  20. Fortenbacher, P.; Mathieu, J.L.; Andersson, G. Modeling, Identification, and Optimal Control of Batteries for Power System Applications. In Proceedings of the Power Systems Computation Conference, Wroclaw, Poland, 18–22 August 2014. [Google Scholar]
  21. Fortenbacher, P.; Mathieu, J.L.; Andersson, G. Modeling and Optimal Operation of Distributed Battery Storage in Low Voltage Grids. IEEE Trans. Power Syst. 2017, 32, 4340–4350. [Google Scholar] [CrossRef] [Green Version]
  22. Smith, K.; Saxon, A.; Keyser, M.; Lundstrom, B. Life Prediction Model for Grid-Connected Li-ion Battery Energy Storage System. In Proceedings of the American Control Conference (ACC), Seattle, WA, USA, 24–26 May 2017. [Google Scholar]
  23. Hinz, H.; Stefanov, Y.; Kilz, J. Integration of a Photovoltaic and Battery System into a Decentralized Power Generation. In Proceedings of the PCIM Asia; International Exhibition and Conference for Power Electronics, Intelligent Motion, Renewable Energy and Energy Management, Shanghai, China, 24–26 June 2015. [Google Scholar]
  24. Hussein, A.A.H.; Batarseh, I. An Overview of Generic Battery Models. In Proceedings of the IEEE Power and Energy Society General Meeting, San Diego, CA, USA, 24–29 July 2011. [Google Scholar]
  25. Sun, K.; Shu, Q. Overview of the Types of Battery Models. In Proceedings of the 30th Chinese Control Conference, Yantai, China, 22–24 July 2011. [Google Scholar]
  26. Mousavi, G.; Nikdel, N. Various battery models for various simulation studies and applications. Renew. Sustain. Energy Rev. 2014, 32, 477–485. [Google Scholar] [CrossRef]
  27. Fotouhi, A.; Auger, D.J.; Propp, K.; Longo, S.; Wild, W. A Review on Electric Vehicle Battery Modelling: From Lithium-ion toward Lithium-Sulfur. Renew. Sustain. Energy Rev. 2016, 56, 1008–1021. [Google Scholar] [CrossRef]
  28. Nejad, S.; Gladwin, D.T.; Stone, D.A. A systematic review of lumped-parameter equivalent circuit models for real-time estimation of lithium-ion battery states. J. Power Sources 2016, 316, 183–196. [Google Scholar] [CrossRef] [Green Version]
  29. Meng, J.; Luo, G.; Ricco, M.; Swierczynski, M.; Stroe, D.-I.; Teodorescu, R. Overview of Lithium-Ion Battery Modeling Methods for State-of-Charge Estimation in Electrical Vehicles. Appl. Sci. 2018, 8, 659. [Google Scholar] [CrossRef]
  30. Doyle, M.; Fuller, T.F.; Newman, J. Modeling of galvanostatic charge and discharge of the lithium/polymer/insertion cell. J. Electrochem. Soc. 1993, 140, 1526–1533. [Google Scholar] [CrossRef]
  31. Doyle, M.; Fuller, T.F.; Newman, J. Simulation and optimization of the dual lithium ion insertion cell. J. Electrochem. Soc. 1994, 141, 1–10. [Google Scholar]
  32. Pals, C.R.; Newman, J. Thermal modeling of the lithium/polymer battery I. Discharge behavior of a single cell. J. Electrochem. Soc. 1995, 142, 3274–3281. [Google Scholar] [CrossRef]
  33. Pals, C.R.; Newman, J. Thermal modeling of the lithium/polymer battery II. Temperature profiles in a cell stack. J. Electrochem. Soc. 1995, 142, 3282–3288. [Google Scholar] [CrossRef]
  34. Alhanouti, M.; Gießler, M.; Blank, T.; Gauterin, F. New Electro-Thermal Battery Pack Model of an Electric Vehicle. Energies 2016, 9, 563. [Google Scholar] [CrossRef]
  35. Tong, S.; Klein, M.O.; Park, J.W. A Comprehensive Battery Equivalent Circuit Based Model for Battery Management Application. In Proceedings of the ASME Dynamic Systems and Control Conference, Palo Alto, CA, USA, 21–23 October 2013; pp. 1520–1529. [Google Scholar]
  36. He, H.; Xiong, R.; Fan, J. Evaluation of Lithium-Ion Battery Equivalent Circuit Models for State of Charge Estimation by an Experimental Approach. Energies 2011, 4, 582–598. [Google Scholar] [CrossRef]
  37. Chen, M.; Rincón-Mora, G.A. An Accurate Electrical Battery Model Capable of Predicting Runtime and I–V Performance. IEEE Trans. Energy Convers. 2006, 21, 504–511. [Google Scholar] [CrossRef]
  38. Hentunen, A.; Lehmuspelto, T.; Suomela, J. Time-Domain Parameter Extraction Method for Thevenin-Equivalent Circuit Battery Models. IEEE Trans. Energy Convers. 2014, 29, 558–566. [Google Scholar] [CrossRef]
  39. Rahmoun, A.; Biechl, H. Modelling of Li-Ion Batteries Using Equivalent Circuit Diagrams. Available online: http://www.red.pe.org.pl/articles/2012/7b/40.pdf (accessed on 7 June 2019).
  40. He, Z.; Yang, G.; Lu, L. A Parameter Identification Method for Dynamics of Lithium Iron Phosphate Batteries Based on Step-Change Current Curves and Constant Current Curves. Energies 2016, 9, 444. [Google Scholar] [CrossRef]
  41. Hsieh, V.-C.; Lin, T.-D.; Chen, R.-J.; Lin, H.-Y. Electric circuit modelling for lithium-ion batteries by intermittent discharging. IET Power Electron. 2014, 7, 2672–2677. [Google Scholar] [CrossRef]
  42. Hagemann, S.C. Simple pspice models let you simulate common battery types. Electron. Design. News 1993, 38, 117–129. [Google Scholar]
  43. Bohlen, O.; Buller, S.; De Doncker, R.W.; Glbke, M.; Naumann, R. Impedance Based Battery Diagnosis for Automotive Applications. In Proceedings of the 35th Annual IEEE Power Electronics Specialists Conference, Aachen, Germany, 20–25 June 2004; pp. 2792–2797. [Google Scholar]
  44. Buller, B.; Thele, M.; De Doncker, R.W.; Karden, E. Impedance-Based Simulation Models of Supercapacitors and Li-Ion Batteries for Power Electronic Applications. IEEE Trans. Ind. Appl. 2005, 41, 742–774. [Google Scholar] [CrossRef]
  45. Westerhoff, U.; Kurbach, K.; Lienesch, F.; Kurrat, M. Analysis of Lithium-Ion Battery Models Based on Electrochemical Impedance Spectroscopy. Energy Technol. 2016, 4, 1620–1630. [Google Scholar] [CrossRef] [Green Version]
  46. Shepherd, C.M. Design of Primary and Secondary Cells—Part 2. An equation describing battery discharge. J. Electrochem. Soc. 1965, 112, 657–664. [Google Scholar] [CrossRef]
  47. Tremblay, O.; Dessaint, L.-A. Experimental Validation of a Battery Dynamic Model for EV Applications. World Electr. Veh. J. 2009, 3, 289–298. [Google Scholar] [CrossRef] [Green Version]
  48. Tremblay, O.; Dessaint, L.-A.; Dekkiche, A.-I. A Generic Battery Model for the Dynamic Simulation of Hybrid Electric Vehicles. In Proceedings of the IEEE Vehicle Power and Propulsion Conference, Arlington, TX, USA, 9–12 September 2007. [Google Scholar]
  49. Raszmann, E.; Baker, K.; Shi, Y.; Christensen, D. Modeling Stationary Lithium-Ion Batteries for Optimization and Predictive Control. In Proceedings of the IEEE Power and Energy Conference, Champaign, IL, USA, 23–24 February 2017. [Google Scholar]
  50. Yasuda, M. Sony Energy Storage System Using Olivine Type Battery. Product Presentation Sony Energy Devices, 13 March 2013. [Google Scholar]
  51. Battery: Implement Generic Batter Model. Available online: https://www.mathworks.com/help/physmod/sps/powersys/ref/battery.html (accessed on 7 June 2019).
  52. PSIM Tutorial Lithium-Ion Battery Model. POWERSIM, October 2016.
  53. Sony’s Energy Storage System—The Sony Lithium Ion Iron Phosphate (LFP) Advantage, Product Description 2013. Available online: https://docplayer.net/21498677-Sony-s-energy-storage-system-the-sony-lithium- ion-iron-phosphate-lfp-advantage.html (accessed on 30 July 2019).
  54. Hekert, J. Regionalverband FrankfurtRheinMain—Deutsches Institut für Urbanistik (German Institute of Urban Affairs). Press Release June 2015. Available online: www.region-frankfurt.de/media/custom/2005_1683_1.PDF?1436270389 (accessed on 30 July 2019).
  55. Zhang, L.; Peng, H.; Ning, Z.; Mu, Z.; Sun, C. Comparative Research on RC Equivalent Circuit Models for Lithium-Ion Batteries of Electric Vehicles. Appl. Sci. 2017, 7, 1002. [Google Scholar] [CrossRef]
  56. Safaria, M.; Delacourta, C. Modeling of a Commercial Graphite/LiFePO4 Cell. J. Electrochem. Soc. 2011, 158, 562–571. [Google Scholar] [CrossRef]
  57. Kin, T.; Qiao, W. A Hybrid Battery Model Capable of Capturing Dynamic Circuit Characteristics and Nonlinear Capacity Effects. IEEE Trans. Energy Convers. 2011, 26, 1172–1180. [Google Scholar]
  58. Naumann, M. Techno-Economic Evaluation of Stationary Battery Energy Storage Systems with Special Consideration of Aging. Ph.D. Thesis, Technical University of Munich, Munich, Germany, 2018. [Google Scholar]
Figure 1. (a) Thevenin-based model, 1 RC network. (b) Thevenin-based model, 2 RC networks.
Inventions 04 00041 g001
Figure 2. (a) Rint model. (b) Rint model with individual internal resistors.
Inventions 04 00041 g002
Figure 3. Runtime-based model.
Inventions 04 00041 g003
Figure 4. Impedance-based model.
Inventions 04 00041 g004
Figure 5. (a) Original Shepherd’s model. (b) Modified Shepherd’s model.
Inventions 04 00041 g005
Figure 6. Simulated discharge curve of one lithium-ion cell, 1C rate (US26659) based on data sheet specifications [50].
Inventions 04 00041 g006
Figure 7. PSIM battery model.
Inventions 04 00041 g007
Figure 8. Architecture of the distributed power generation (DG).
Inventions 04 00041 g008
Figure 9. (a) Connection of power modules in a cabinet. (b) Energy storage system with seven battery cabinets.
Inventions 04 00041 g009
Figure 10. Open circuit voltage V O C V ( S O C ) .
Inventions 04 00041 g010
Figure 11. Thevenin-based model of one energy storage module.
Inventions 04 00041 g011
Figure 12. Rint model, charge and discharge resistors in dependence on SOC.
Inventions 04 00041 g012
Figure 13. Implementation of the Rint model.
Inventions 04 00041 g013
Figure 14. Implementation of the Sherpherd’s model.
Inventions 04 00041 g014
Figure 15. Arrangement of the PSIM battery model.
Inventions 04 00041 g015
Figure 16. Block diagram DG simulation model.
Inventions 04 00041 g016
Figure 17. DG system quantities for a 24-h operating day.
Inventions 04 00041 g017
Figure 18. Simulation and measurement results for Thevenin-based model (a) charging and (b) discharge.
Inventions 04 00041 g018
Figure 19. Simulation and measurement results for Rint model (a) charging and (b) discharge.
Inventions 04 00041 g019
Figure 20. Simulation and measurement results for Shepherd’s model (a) charging and (b) discharge.
Inventions 04 00041 g020
Figure 21. Simulation and measurement results for PSIM model (a) charging and (b) discharge.
Inventions 04 00041 g021
Figure 22. SOC and power P B a t during charging.
Inventions 04 00041 g022
Figure 23. SOC and power P B a t during discharge.
Inventions 04 00041 g023
Table 1. Battery storage portfolio.
<100 kWh0.1–1 MWh1 MWh–1 GWh
<1 hlead-acid
lithium-ion
lithium-air
lead-acid
lithium-ion
lithium-sulphur
lead-acid
lithium-ion
<1 daylead-acid
lithium-ion
vanadium-redox
sodium-sulphur
sodium-nickel-chloride
lithium-sulphur
lead-acid
lithium-ion
vanadium-redox
sodium-sulphur
sodium-nickel-chloride
zinc-air
lithium-air
lead-acid
vanadium-redox
sodium-sulphur
sodium-nickel-chloride
>1 daylead-acid
lithium-ion
vanadium-redox
sodium-sulphur
sodium-nickel-chloride
zinc-air
lithium-sulphur
vanadium-redox
sodium-sulphur
sodium-nickel-chloride
vanadium-redox
Table 2. Specification energy storage module.
Energy/CapacityNominal VoltageMaximum Discharge Current/Power
1.2   kWh / 24   Ah 51.2   V 50   A / 2.5   kW

