
Fast Timing Detectors and Applications in Cosmic Ray Physics and Medical Science

Abstract
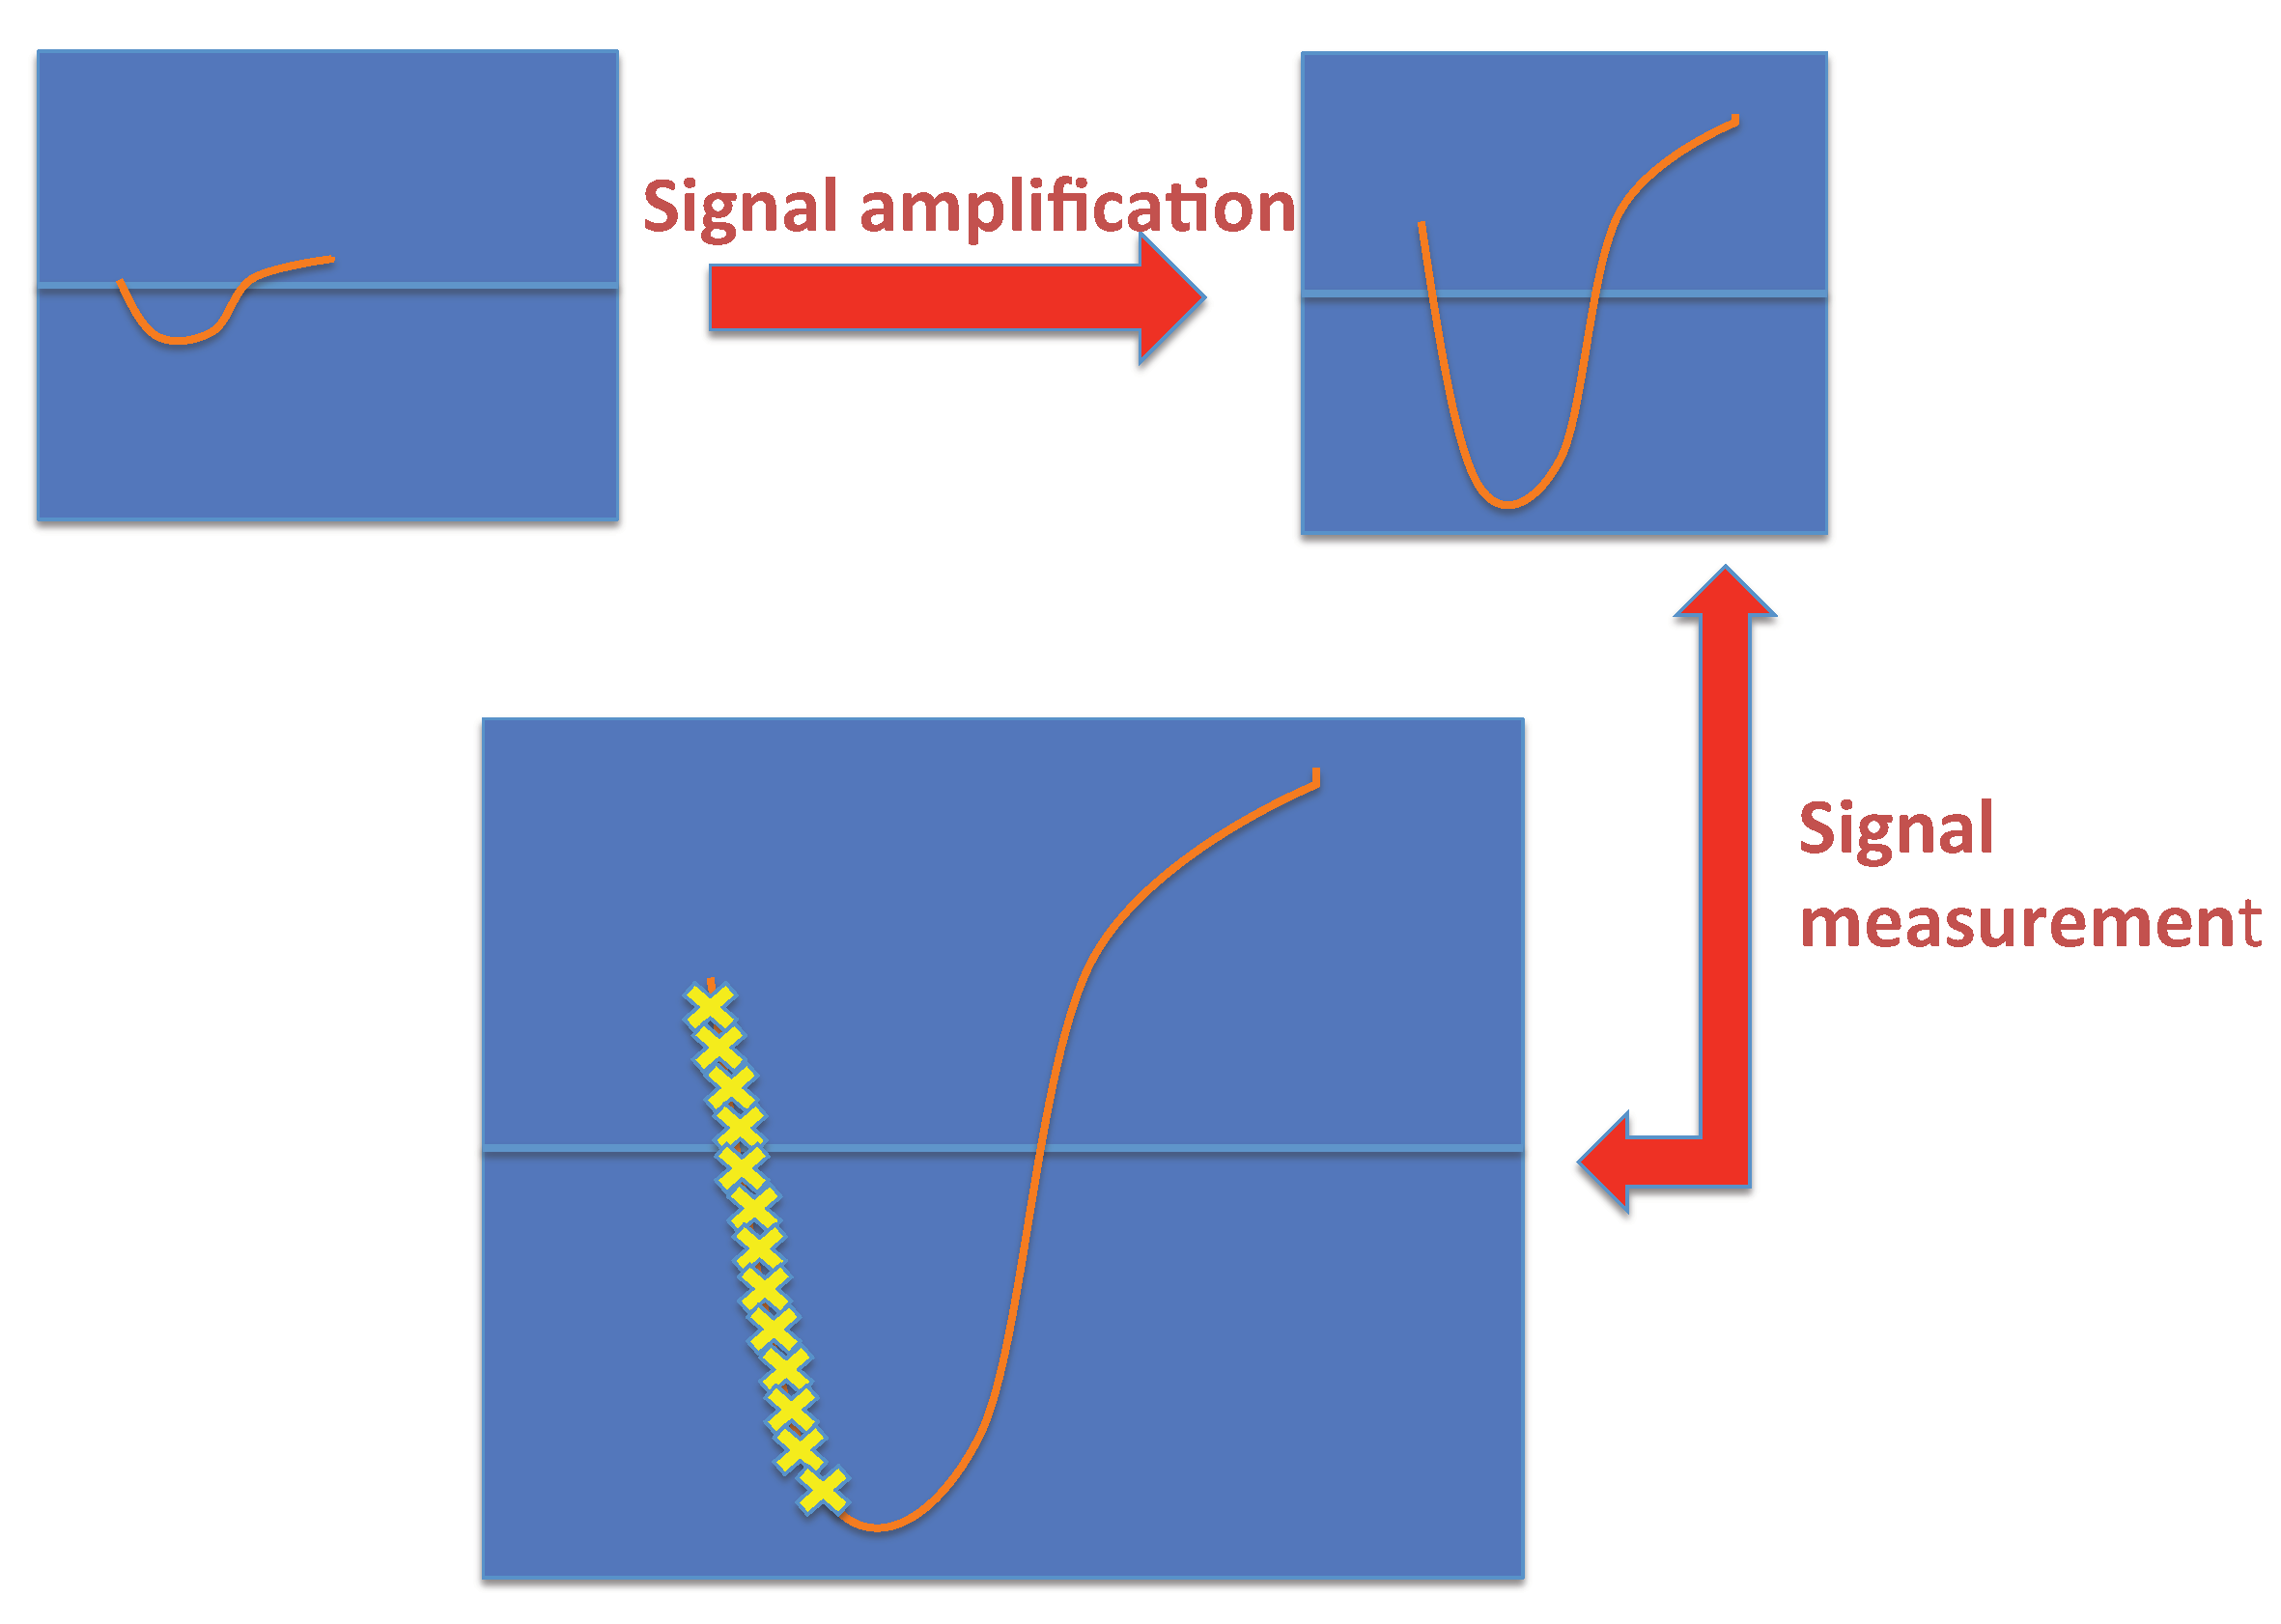
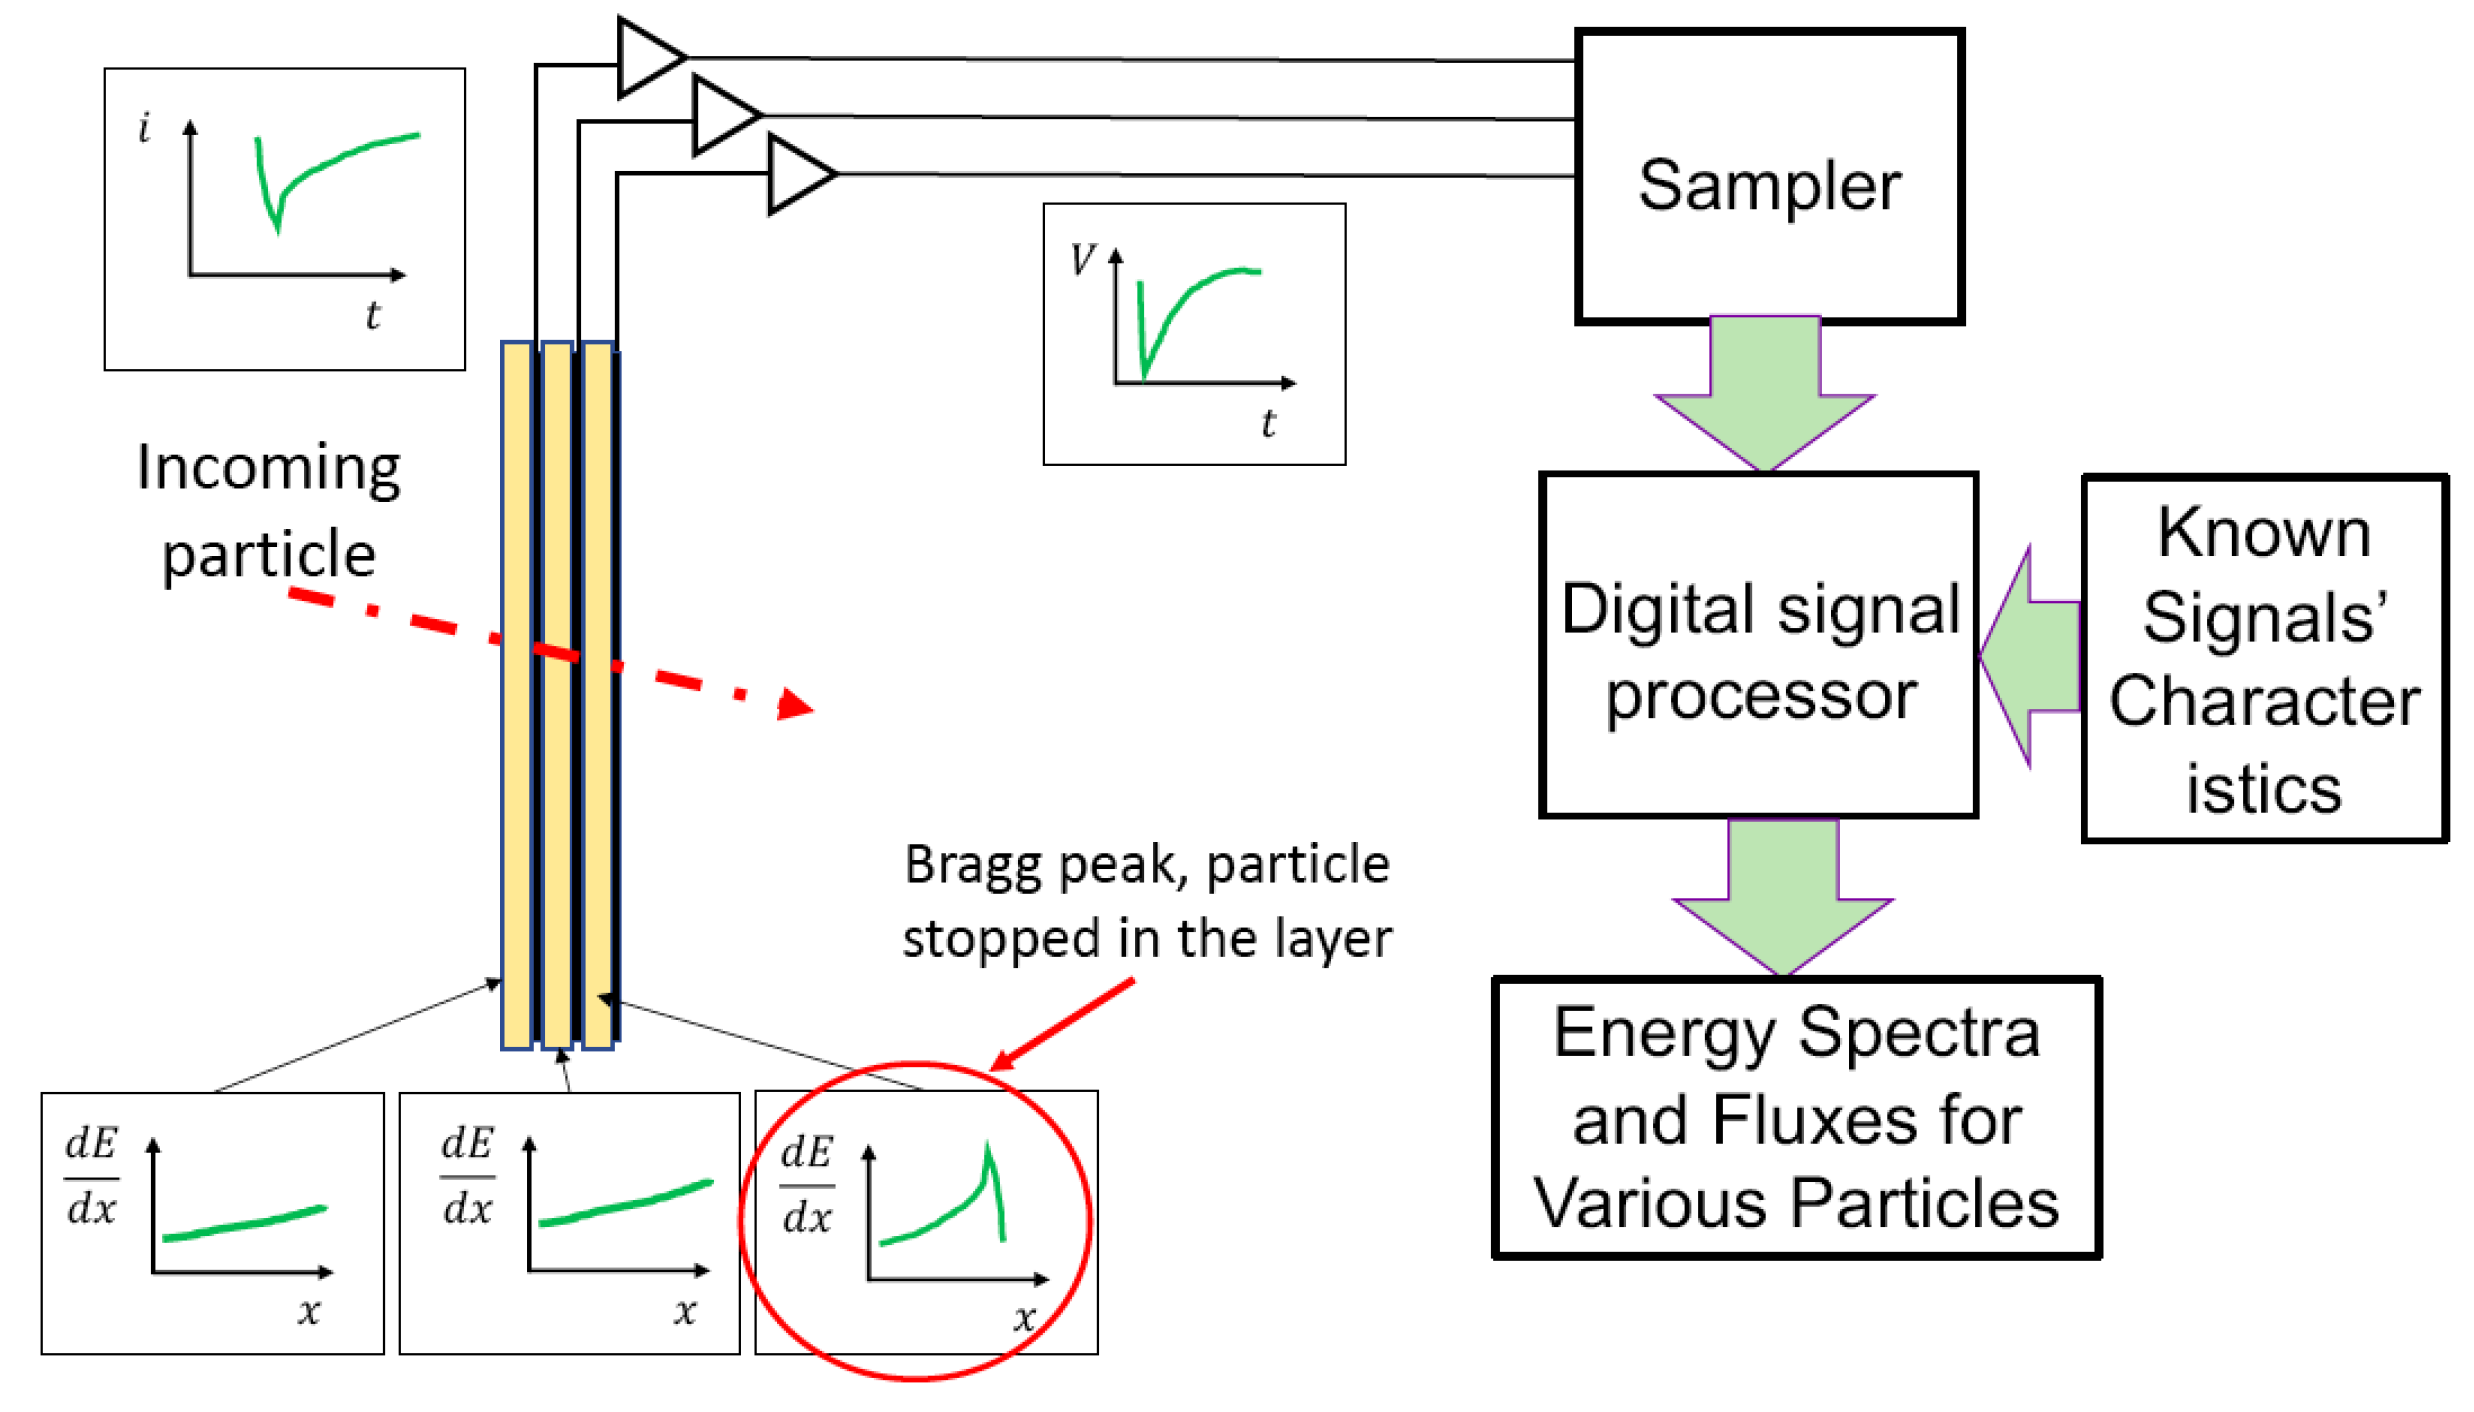
:1. Introduction: Signal Amplification and Measurement
2. Measuring Cosmic Rays in Space: The AGILE Project
3. Measuring Radiation in Cancer Treatment
Author Contributions
Funding
Data Availability Statement
Acknowledgments
Conflicts of Interest
References
- Apresyan, A.; Xie, S.; Pena, C.; Arcidiacono, R.; Cartiglia, N.; Carulla, M.; Derylo, G.; Ferrero, M.; Flores, D.; Freeman, P.; et al. Studies of uniformity of 50 μm low-gain avalanche detectors at the Fermilab test beam. Nucl. Instrum. Meth. A 2018, 895, 158–172. [Google Scholar] [CrossRef]
- Minafra, N.; Al Ghoul, H.; Arcidiacono, R.; Cartiglia, N.; Forthomme, L.; Mulargia, R.; Obertino, M.; Royon, C. Test of ultra-fast silicon detectors for picosecond time measurements with a new multipurpose read-out board. Nucl. Instrum. Meth. A 2017, 867, 88–92. [Google Scholar] [CrossRef] [Green Version]
- Breton, D.; De Cacqueray, V.; Delagnes, E.; Grabas, H.; Maalmi, J.; Minafra, N.; Royon, C.; Saimpert, M. Measurements of timing resolution of ultra-fast Silicon detectors with the SAMPIC waveform digitizer. Nucl. Instrum. Meth. A 2016, 835, 51–60. [Google Scholar] [CrossRef]
- Gautier, F.; Greeley, A.; Kanekal, S.G.; Isidori, T.; Legras, G.; Minafra, N.; Novikov, A.; Royon, C.; Schiller, Q. A novel technique for real-time ion identification and energy measurement for in situ space instrumentation. Nucl. Instrum. Methods Phys. Res. Sect. A Accel. Spectrom. Detect. Assoc. Equip. 2021, 1012, 165599. [Google Scholar] [CrossRef]
- Oberla, E.; Genat, J.F.; Grabas, H.; Frisch, H.; Nishimura, K.; Varner, G. A 15 GSa/s, 1.5 GHz bandwidth waveform digitizing ASIC. Nucl. Instrum. Meth. A 2014, 735, 452–461. [Google Scholar] [CrossRef] [Green Version]
- GEANT Collaboration; Agostinelli, S. GEANT4—A simulation toolkit. Nucl. Instrum. Meth. A 2003, 506, 250–303. [Google Scholar] [CrossRef] [Green Version]
- Cenna, F.; Cartiglia, N.; Friedl, M.; Kolbinger, B.; Sadrozinski, H.W.; Seiden, A.; Zatserklyaniy, A.; Zatserklyaniy, A. Weightfield2: A fast simulator for silicon and diamond solid state detector. Nucl. Instrum. Methods Phys. Res. Sect. A Accel. Spectrom. Detect. Assoc. Equip. 2015, 796, 149–153. [Google Scholar] [CrossRef]
- Brocard, G. The LTspice IV Simulator: Manual, Methods and Applications; Würth Elektronik: Niedernhall, Germany, 2013. [Google Scholar]
- Isidori, T.; McCavana, P.; McClean, B.; McNulty, R.; Minafra, N.; Raab, N.; Rock, L.; Royon, C. Performance of a low gain avalanche detector in a medical characterization of the beam profile. Phys. Med. Biol. 2021, 66, 135002. [Google Scholar] [CrossRef] [PubMed]


Disclaimer/Publisher’s Note: The statements, opinions and data contained in all publications are solely those of the individual author(s) and contributor(s) and not of MDPI and/or the editor(s). MDPI and/or the editor(s) disclaim responsibility for any injury to people or property resulting from any ideas, methods, instructions or products referred to in the content. |
© 2023 by the authors. Licensee MDPI, Basel, Switzerland. This article is an open access article distributed under the terms and conditions of the Creative Commons Attribution (CC BY) license (https://creativecommons.org/licenses/by/4.0/).
Share and Cite
Royon, C.; d’Assignies D., W.; Gautier, F.; Isidori, T.; Minafra, N.; Novikov, A. Fast Timing Detectors and Applications in Cosmic Ray Physics and Medical Science. Instruments 2023, 7, 14. https://doi.org/10.3390/instruments7020014
Royon C, d’Assignies D. W, Gautier F, Isidori T, Minafra N, Novikov A. Fast Timing Detectors and Applications in Cosmic Ray Physics and Medical Science. Instruments. 2023; 7(2):14. https://doi.org/10.3390/instruments7020014
Chicago/Turabian StyleRoyon, Christophe, William d’Assignies D., Florian Gautier, Tommaso Isidori, Nicola Minafra, and Alexander Novikov. 2023. "Fast Timing Detectors and Applications in Cosmic Ray Physics and Medical Science" Instruments 7, no. 2: 14. https://doi.org/10.3390/instruments7020014