1. Introduction
Muography is a non-invasive technique for imaging anthropic and geologic structures [
1,
2,
3,
4,
5,
6,
7,
8,
9,
10,
11,
12] by measuring the crossing muon flux using sensitive hodoscopes made of nuclear emulsions [
2,
13], gaseous chambers [
14,
15,
16,
17] and scintillators [
4,
8,
11,
18,
19,
20]. Scintillation hodoscopes provide flexibility in the implementation, low cost, and robustness against environmental variables such as humidity, temperature, and atmospheric pressure [
21]. When an ionizing particle interacts with the scintillator crystal lattice, it knocks electrons out from the valence band to bound states called excitons. These excitons emit photons in the near-ultraviolet spectrum due to recombination by de-excitation. Some dopants are added to the primary scintillation material so as to obtain a light in a longer wavelength, with the view that the absorption length of the ultraviolet light is relatively short. The resultant emission range of the scintillator mismatches the sensitivity of the majority of the photosensors necessary for adding a wavelength-shifting fibre [
22].
Silicon photomultipliers (SiPMs) offer a solution for high granularity hodoscopes to be deployed in volcanic areas because of their small dimensions, robustness, and low power consumption [
23]. SiPMs contain a dense array of small photon avalanche diodes operating in Geiger mode. When a photon interacts with a SiPM microcell, an avalanche process starts generating a photocurrent flowing through a quenching resistor, which causes a dropoff of the diode bias below the breakdown value preventing further Geiger-mode avalanches. The electrical pulses generated by the SiPM are directly related to the number of incident photons.
SiPMs are used in medical imaging, particle physics, and high-energy astrophysics. SiPM characterization includes gain, overvoltage, and noise parameterization in darkness, using LED or radioactive sources [
24,
25]. In muography, SiPMs have replaced multianode photomultipliers due to their low noise and electromagnetic field robustness. The main drawback of SiPMs is that performance parameters such as gain, photodetection efficiency, and breakdown voltage are susceptible to temperature variations. Muon telescopes operate outdoors under uncontrolled temperature conditions, unlike applications where detectors work under well established temperatures. Thermo-electric cells can control temperature of muon telescope SiPMs, but this methodology carries an increase in power consumption, which reduces the powering efficiency of autonomous muon telescopes [
23].
This paper analyses the characterization of the Muon Telescope (MuTe) SiPMs breakdown voltage, gain, dark count, crosstalk, and afterpulsing depending on temperature and over-voltage.
Section 2 shows a technical description of the MuTe.
Section 3 describes the experimental setup and the data acquisition system for the SiPM characterization measurements.
Section 4 shows the breakdown voltage, gain, and noise parameterization results.
Section 5 presents the temperature conditions at the Cerro Machín volcano and their effect on the MuTe mechanical structure, and
Section 6 exhibits the dependence between the flux and the temperature of the MuTe tracking system operating outdoors.
Section 7 summarizes conclusions and remarks.
2. The Muon Telescope
The MuTe is a hybrid detector composed of a hodoscope and a Water Cherenkov Detector (WCD), which will be installed in one of the most dangerous volcanoes in Colombia, the Cerro Machín, located at 2750 m.a.s.l. on the Cordillera Central near to the municipality of Cajamarca [
26,
27]. The MuTe hodoscope consists of two scintillation panels, each of 30 × 30 strips 120 cm length, and 4 cm wide. Each strip has a 1.8 mm hole for a multi-cladding wavelength shifting (WLS) fibre (Saint-Gobain BCF-92) with 1.2 mm diameter, an absorption peak at 410 nm and an emission peak of 492 nm [
28]. The WLS fibre is coupled to a silicon photomultiplier (SiPM, Hamamatsu S13360-1350CS) [
29]. The SiPM has a photosensitive area of
, 667 pixels, a fill factor of
, a gain from
to
and a photon-detection efficiency of
at 450 nm.
3. Experimental Setup
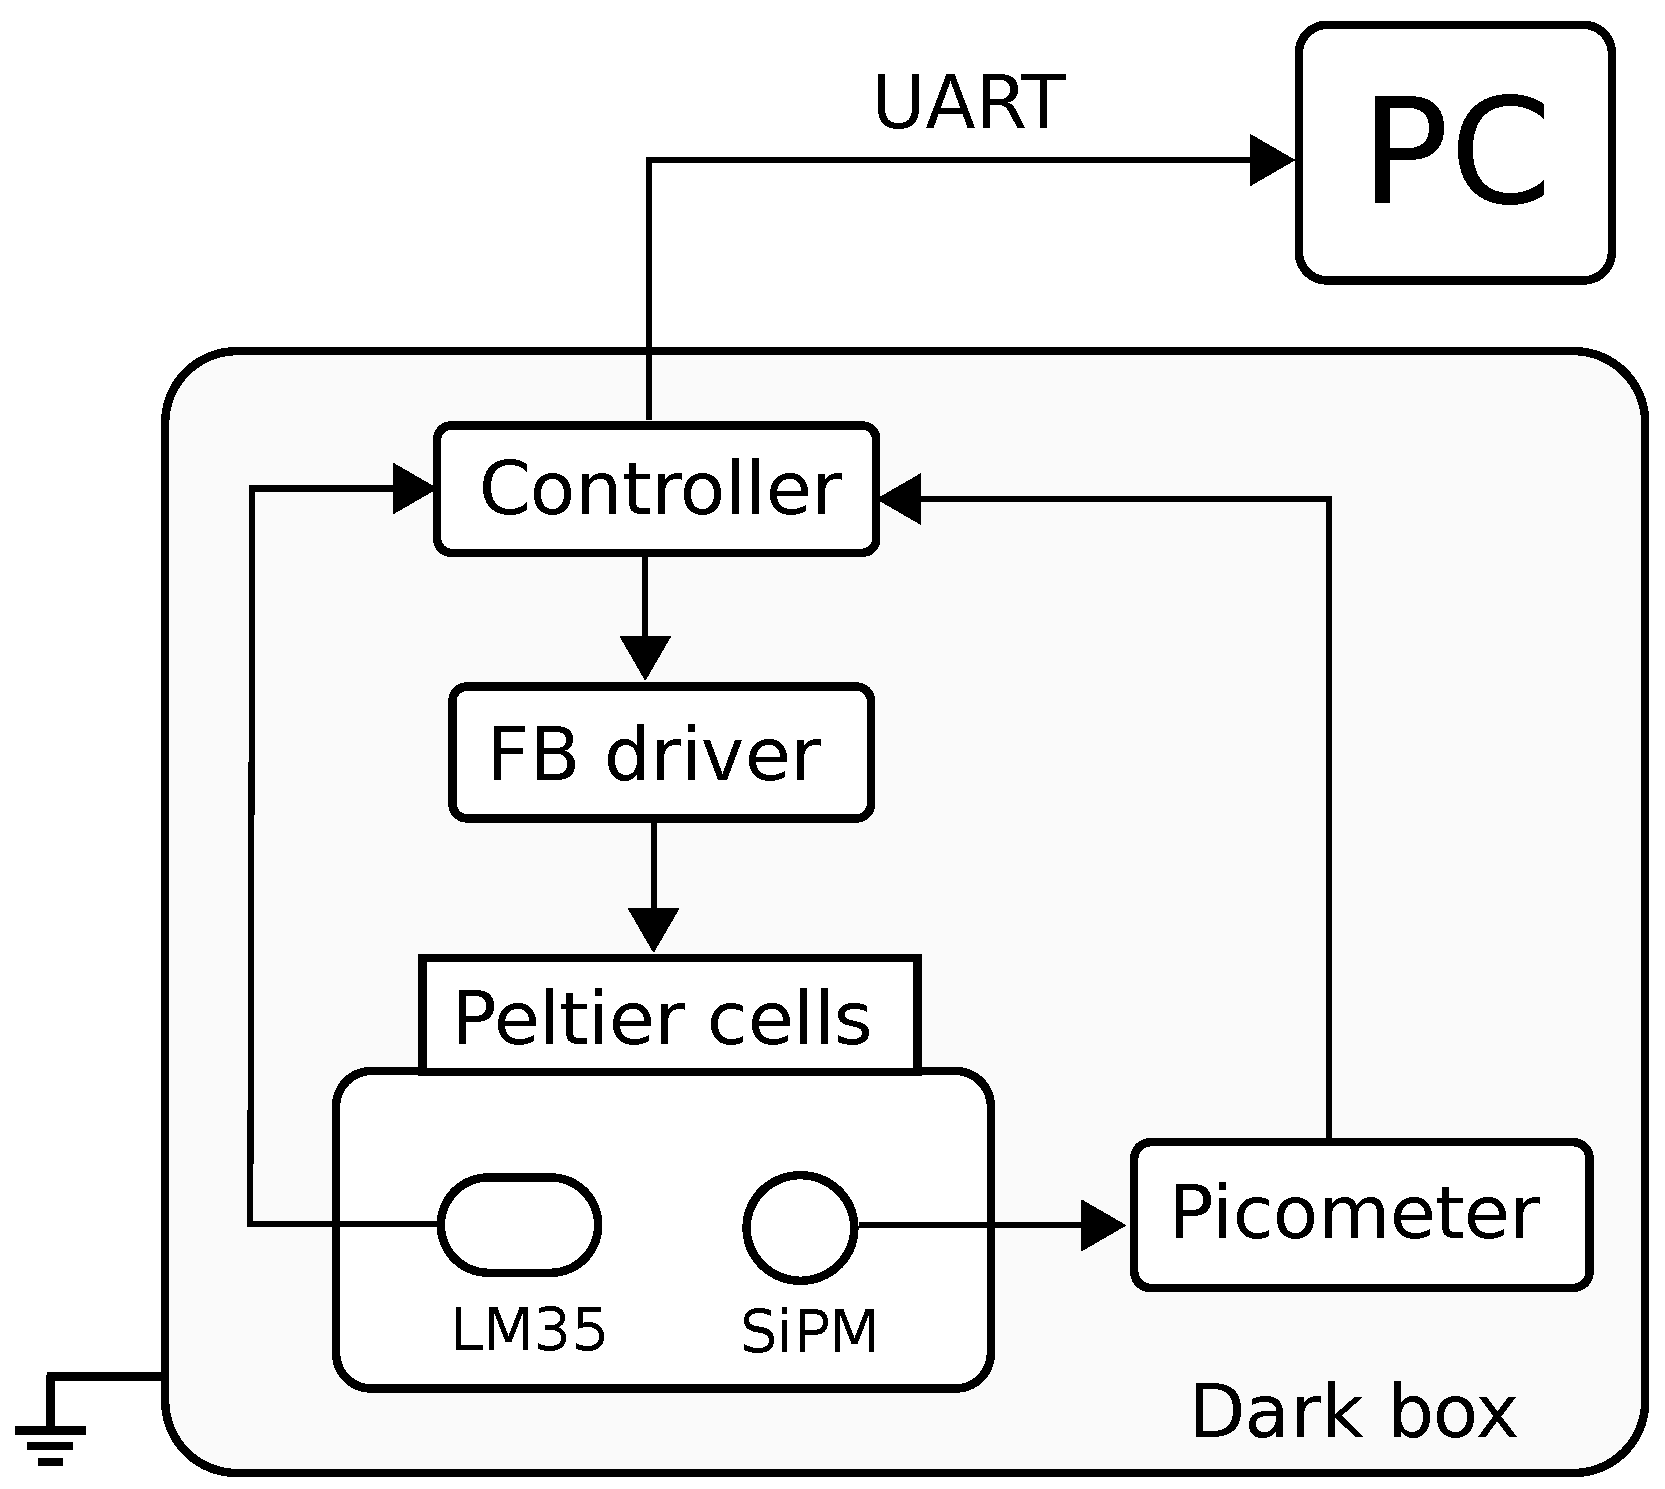
3.1. Dark Current
The experimental setup to measure the SiPM dark current as function of temperature is indicated in
Figure 1. The SiPM is placed on an isolated aluminium holder whose temperature is controlled by two Peltier cells (TEC1-12706 from Hebei I.T.) and measured using an LM35 sensor (linear 10 mV/ °C scale factor and −55 °C to 150 °C range). A proportional–integral–derivative (PID) control (implemented in a microcontroller Atmega328) generates two pulse-width-modulated signals whose duty cycle depends on the control error. The error is the difference between the measured temperature and the pre-established set-point. The control signals drive the direction (cooling or heating) and amplitude (fast or slow) of the current flowing through the Peltier cells using an H-bridge with an optically coupled isolator circuit.
A C11204 power module biases the SiPM ranging in voltage from 40 V to 60 V. The dark current is measured by a 2 nA accuracy picoammeter. The SiPM bias voltage and temperature are recorded individually by a 10-bit analogue-to-digital converter (ADC) with a sampling rate of 1 Hz. All the setup components are placed inside a grounded dark box to avoid external light contamination and electromagnetic interference.
3.2. Gain and Noise
A second experimental setup is used to estimate the SiPM gain and noise at several temperatures and voltages with pulse light stimulating. The light source must fulfil two features: a wavelength matching the SiPM spectral sensitivity and a pulse width of the order of a few ns [
30,
31].
The light pulser generates an ultra-short (<10 ns) 480 nm pulse with a frequency of 500 Hz. A 50 cm WLS fibre (Saint-Gobain BCF-92) transports the light towards the SiPM; simultaneously, a square signal triggers the DAQ system. The signals generated by the SiPM are amplified 94 times using a low noise current feedback operational amplifier (OPA691 from Texas Instruments) and digitized by a Red Pitaya ADC channel with a sampling frequency of 125 MHz and 14-bit resolution. A diagram of the setup is shown in
Figure 2.
4. SiPM Calibration
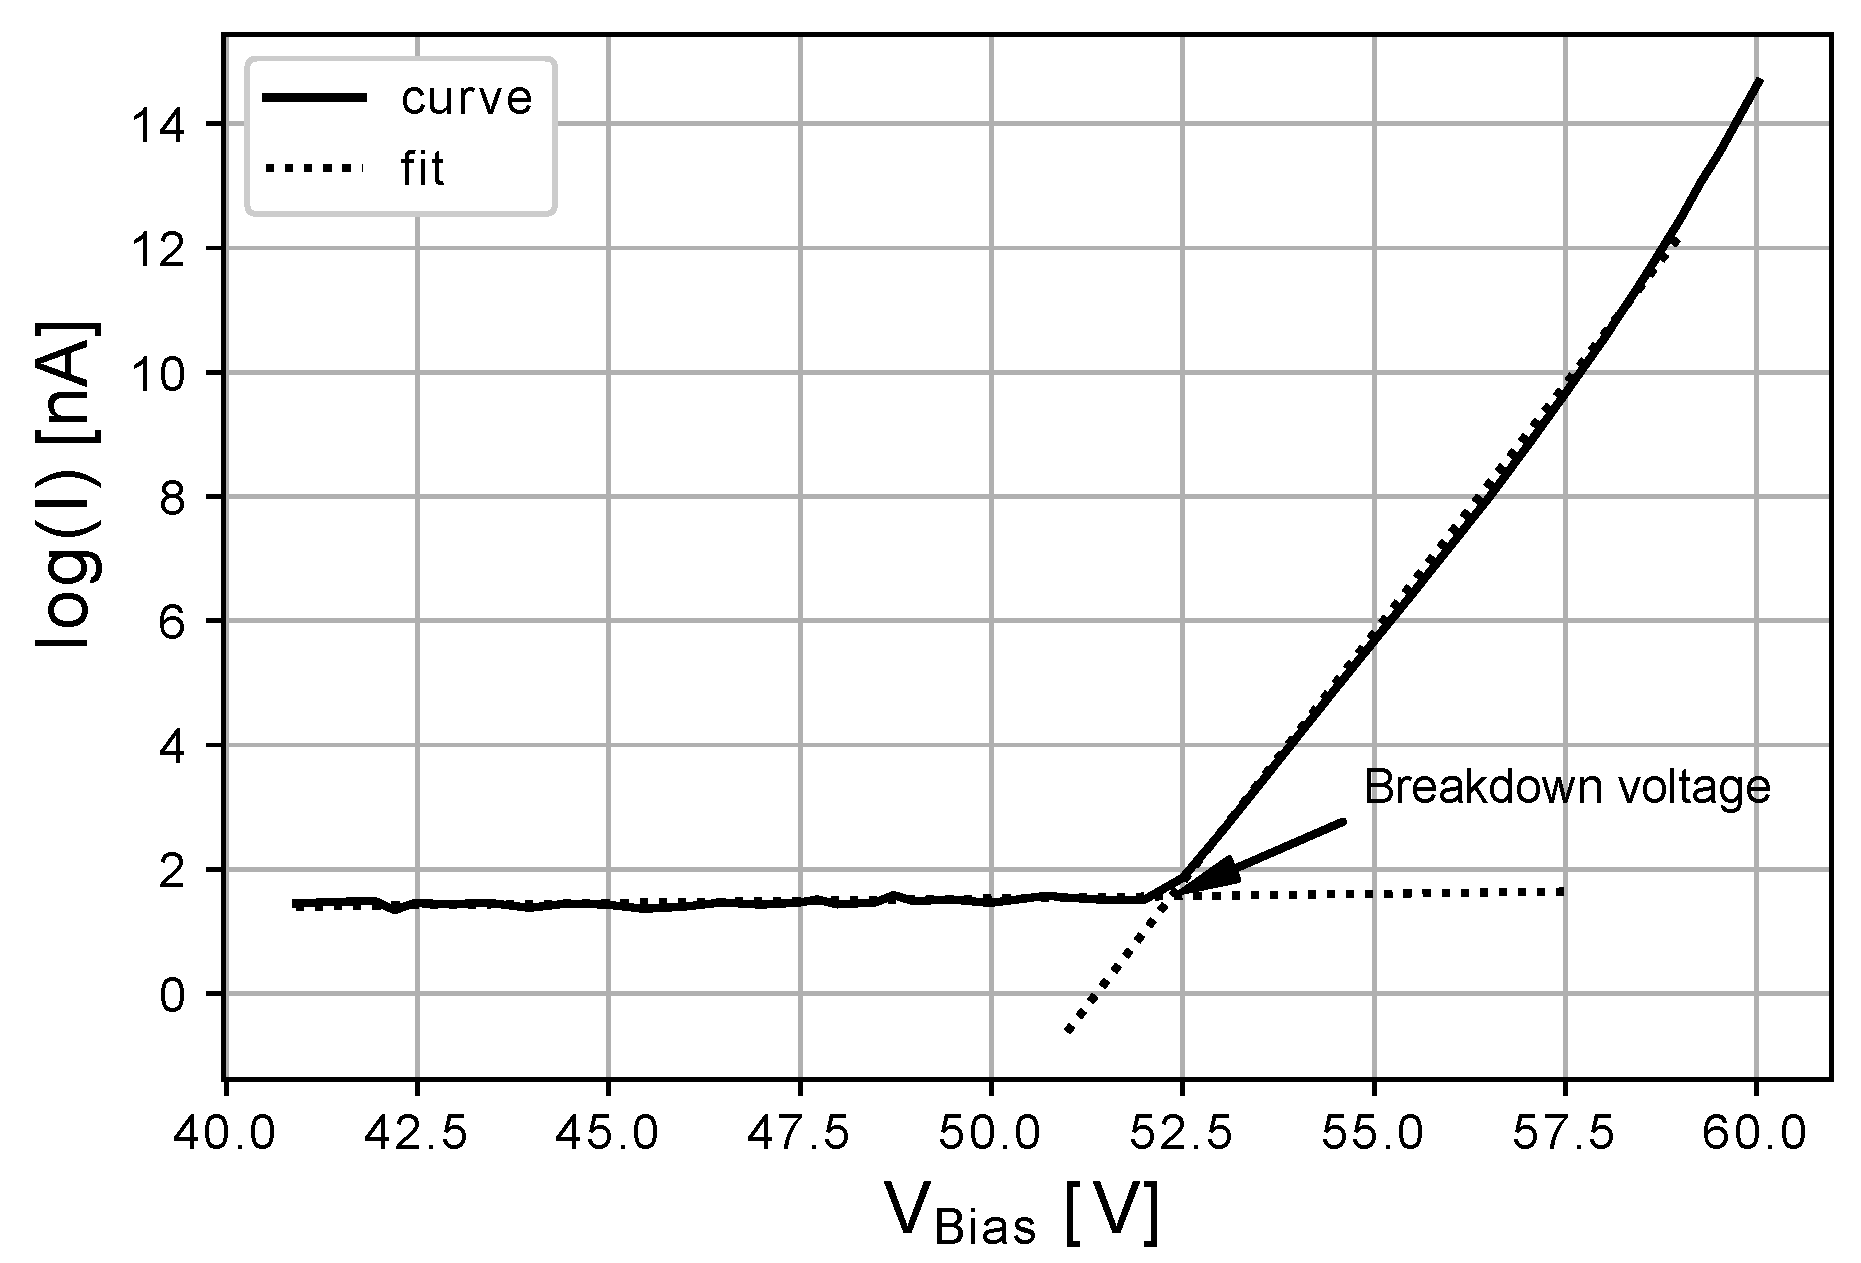
4.1. Breakdown Voltage
The breakdown voltage (
) is the point where the SiPM enters Geiger mode. Such a point can be established using several methods [
32]. In this case, we use the tangent method, which consists of finding the interception between a tangent line fit to the IV (dark current vs bias voltage) curve and the baseline.
Figure 3 shows the SiPM IV curve at 25 °C where the
was at ∼52.3 V.
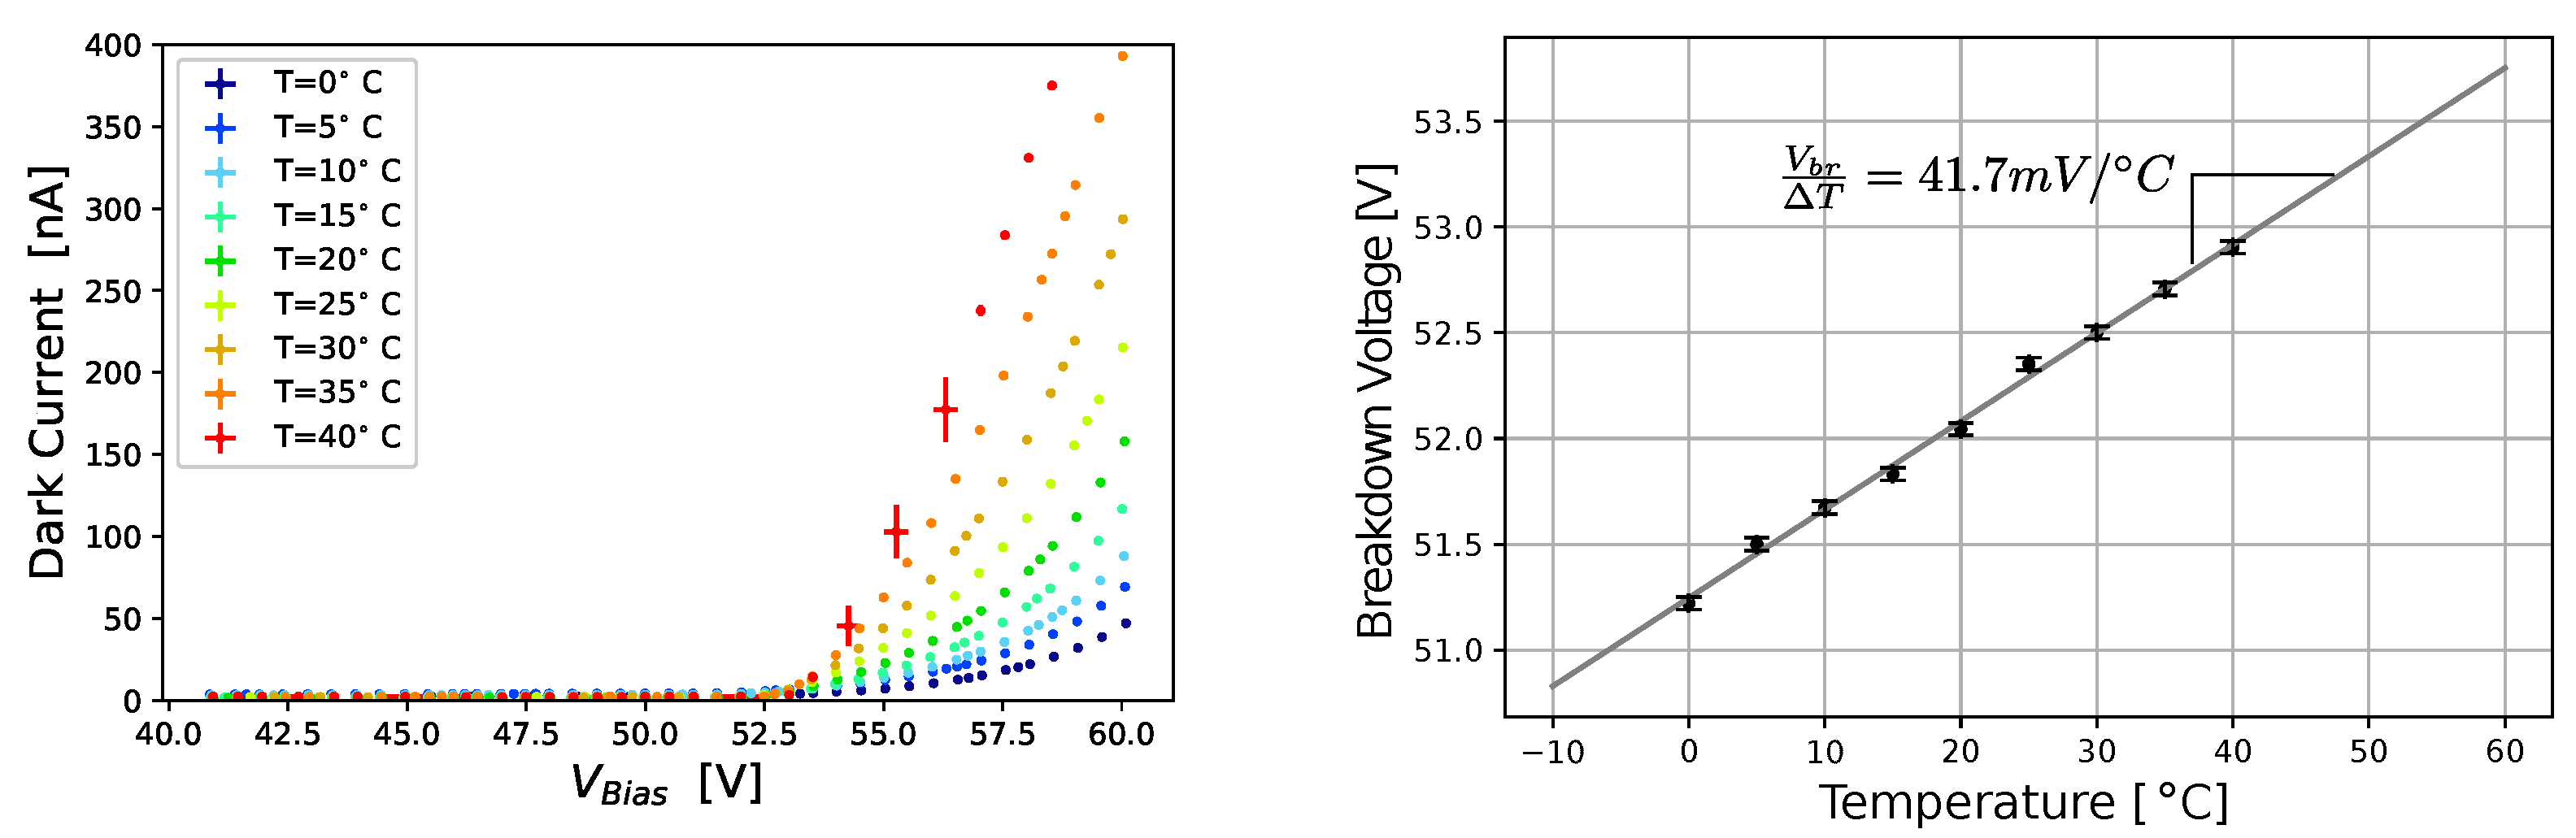
We measured the IV curves from 40 V to 60 V for temperatures between
C and
C with
C step as shown in
Figure 4 (left panel) using the breakdown voltage experimental setup. In the Geiger region, the IV slope increases with the temperature reaching a dark current above 400 nA at
C. The breakdown voltage has a linear relation with temperature decreasing with a ratio of
mV/
C as is shown in
Figure 4 (right panel). In on-field applications, an adaptive bias voltage to compensate for temperature changes in the SiPM could be taken into account to guarantee a stable gain and low noise levels [
31].
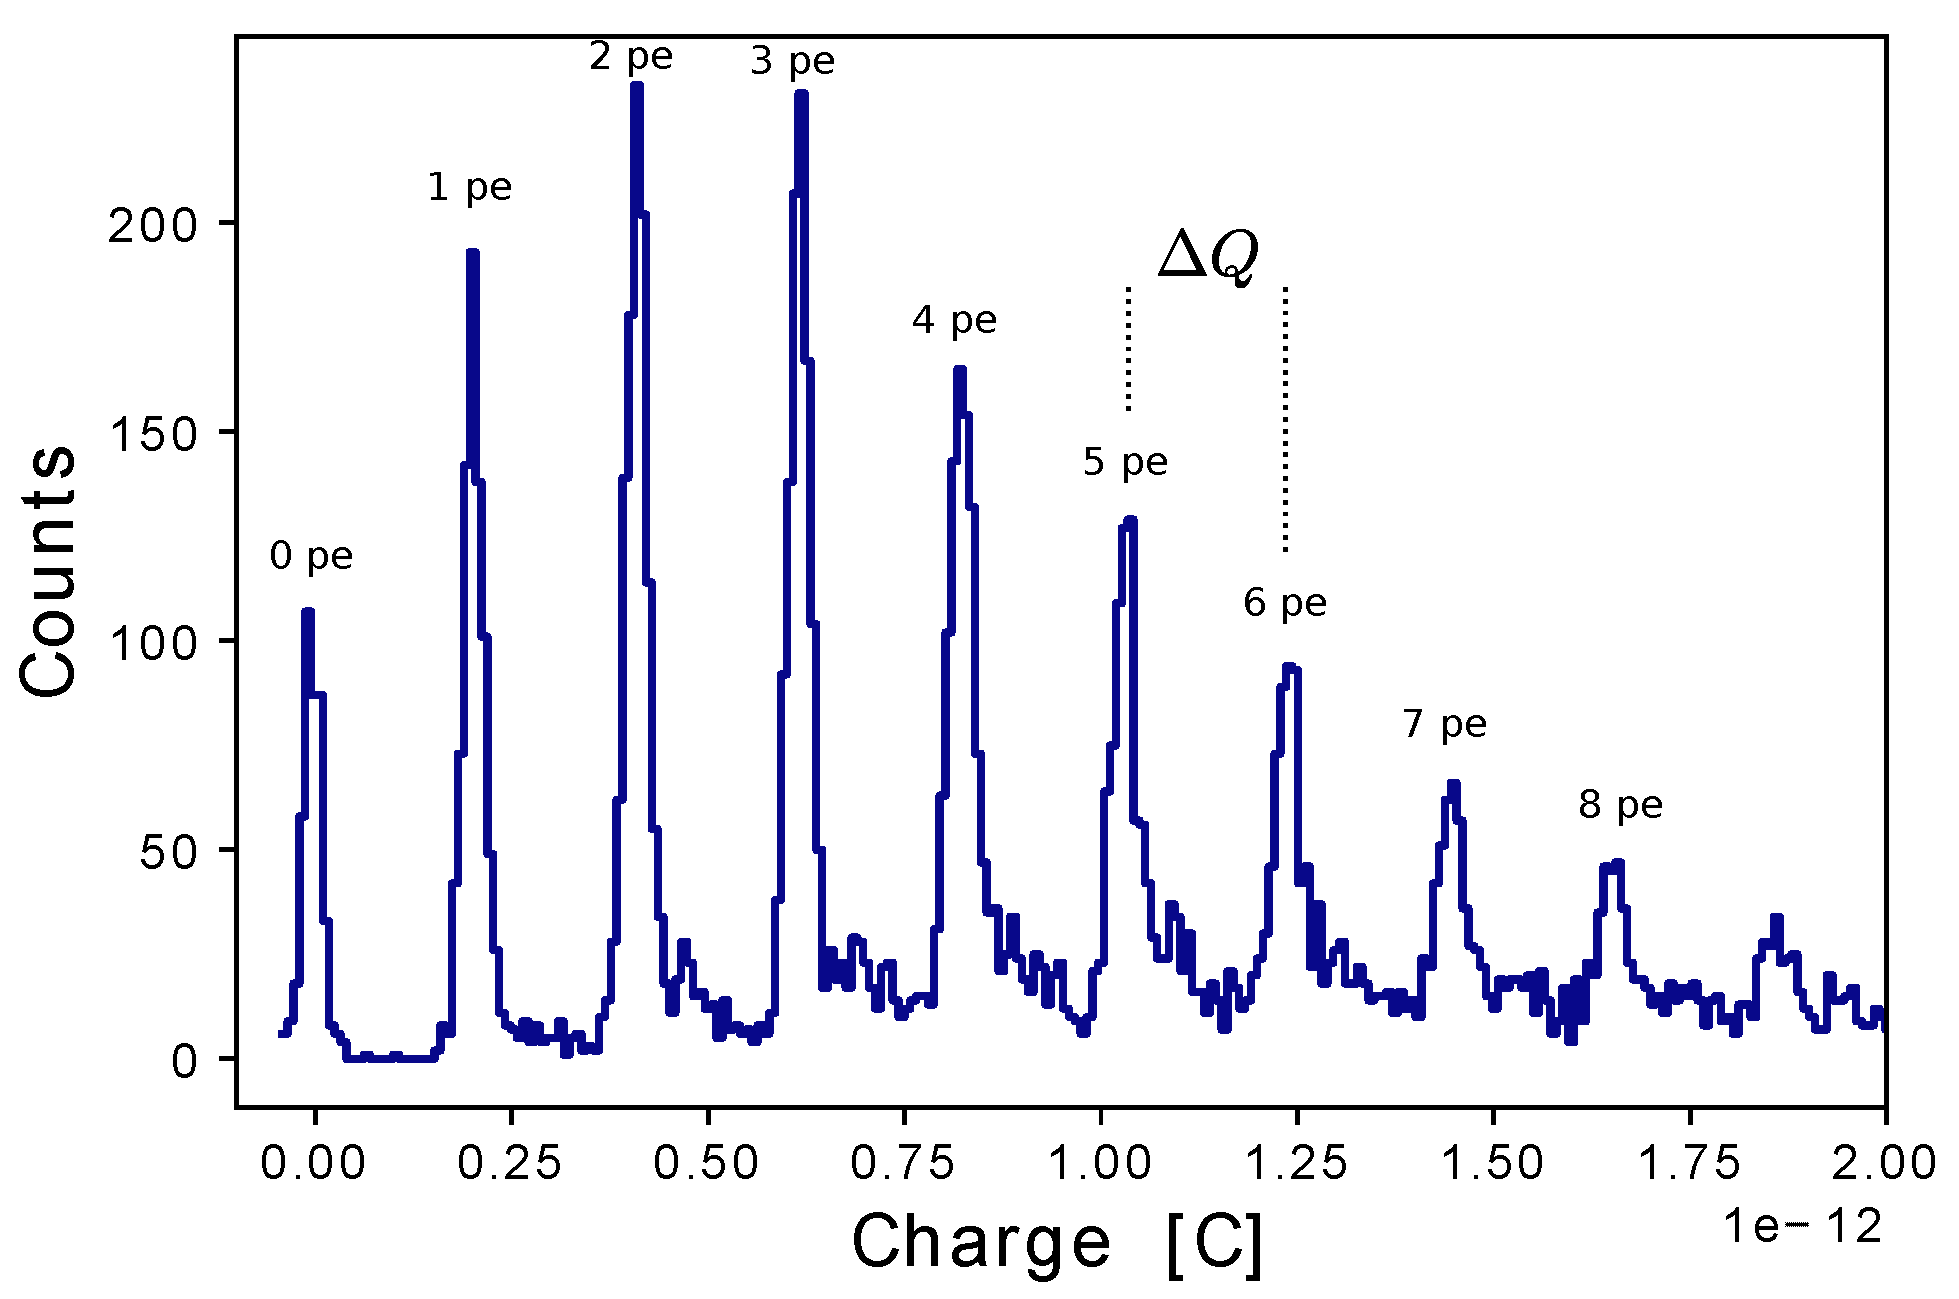
4.2. Charge Spectrum and Gain
The gain of a SiPM microcell is defined as the ratio of the output charge to the charge of an electron
e [
33]. The output charge can be calculated as,
where
is the digitized area under the pulse,
is the equivalent voltage for one ADC unit,
is the digitization time step,
R is the input resistor and
the gain of the electronics front-end. In
Figure 5, the charge spectrum of the SiPM operating at 56 V and 25 °C is shown.
The average separation between two adjacent peaks,
, in the charge histogram corresponds to the charge from a single Geiger discharge. This can be used to accurately calculate the gain
G as follows:
The SiPM gain depends on the bias voltage (
V), the higher the bias voltage, the higher the gain. To estimate the gain dependence on the over-voltage (
) in the SiPM S13360-1350CS, we measured three charge spectra for
V =
V,
V, and
V at 25 °C.
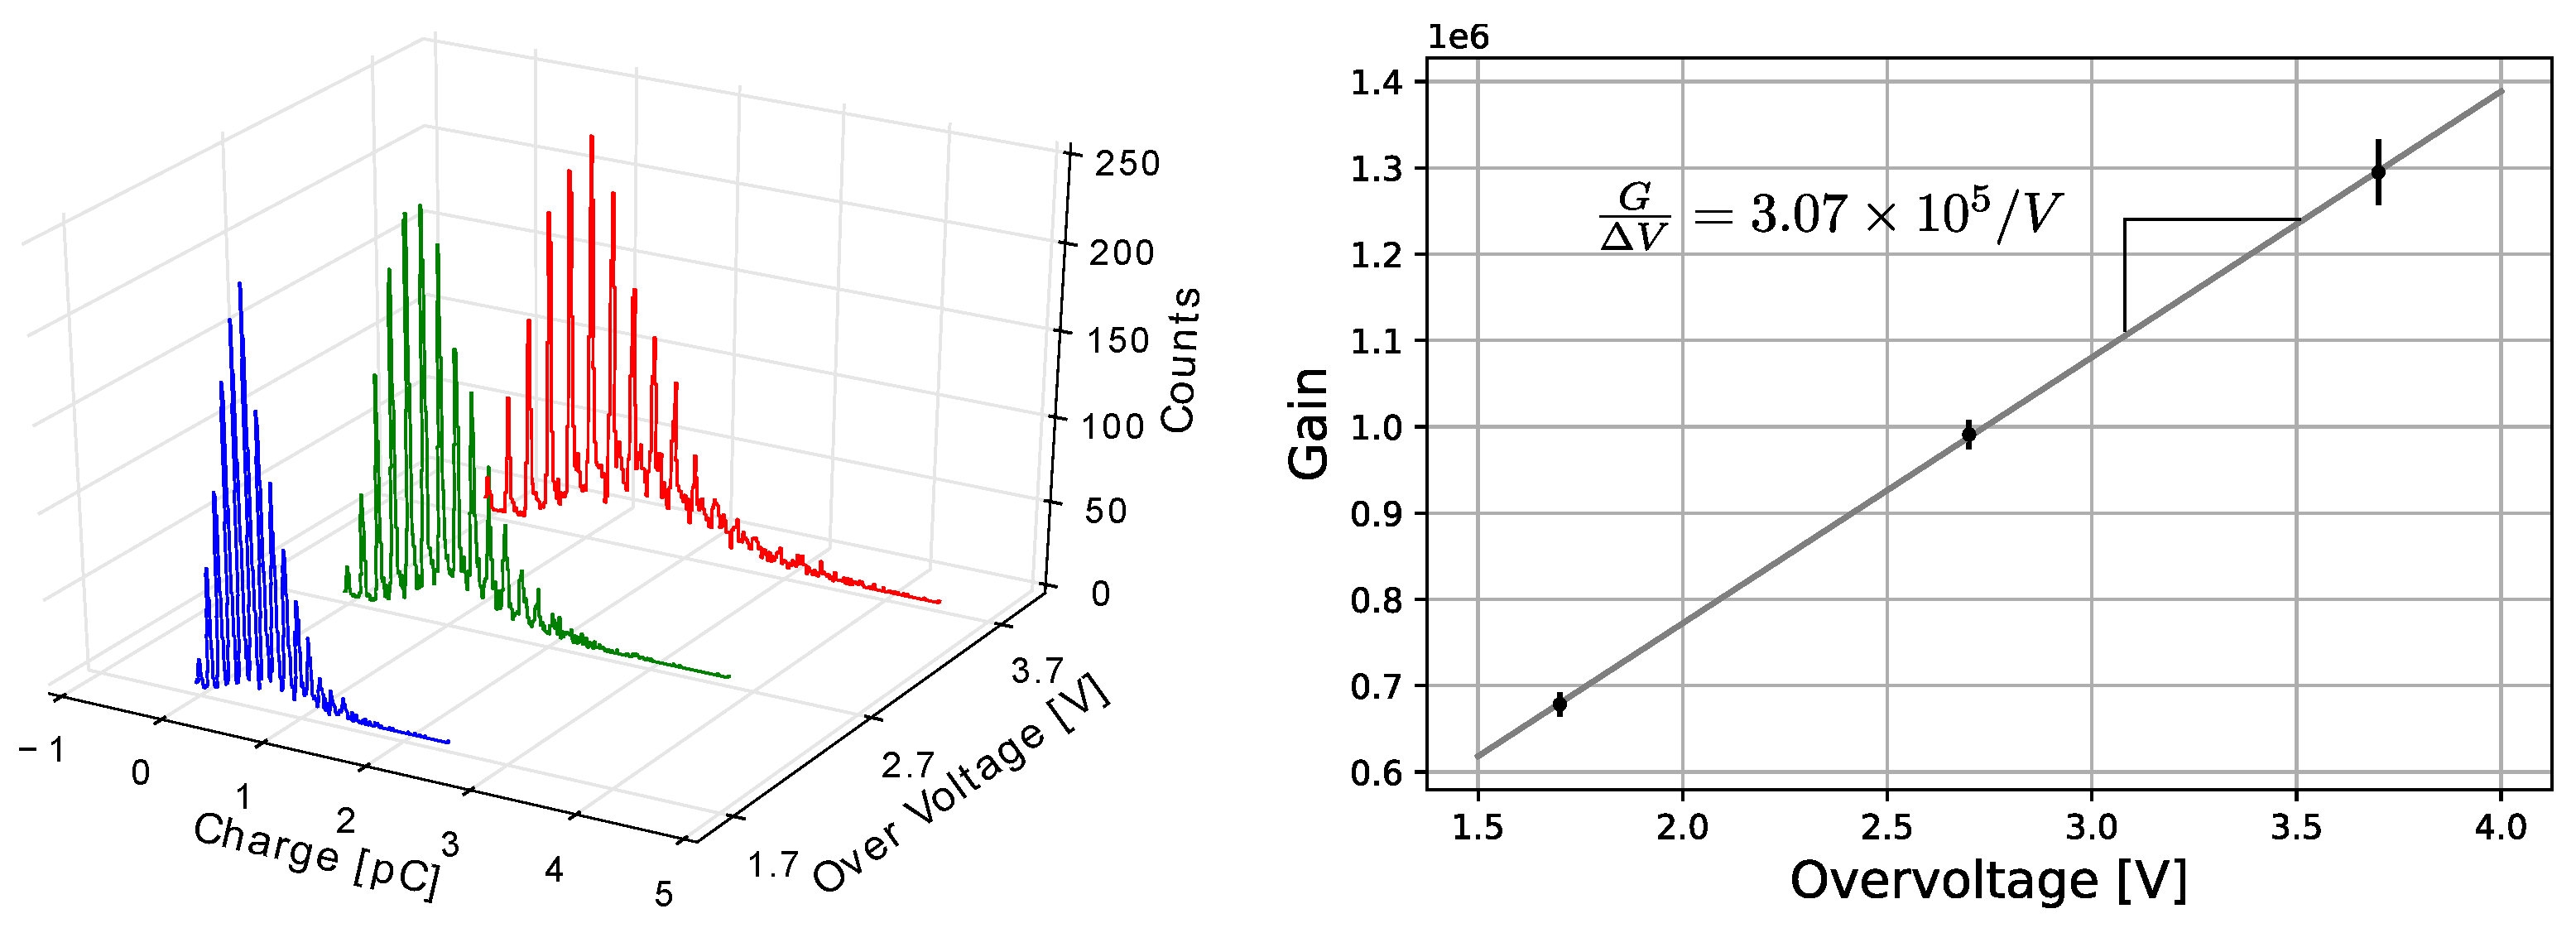
Figure 6 shows the charge spectra (left panel) and the estimated gain (right panel) for these cases.
The separation between charge peaks grows as the over-voltage increases—indicating an increment in gain. The gain change ratio was estimated ∼/V, i.e., for V = V ( V) the gain is roughly and for V = V ( V) the gain is .
4.3. Photo-Electron Spectrum
The output pulse amplitude from SiPMs is proportional to the number of incident photons based on the fact they are made of an array of APDs connected in parallel. The photo-electron (pe) spectrum determines the equivalent value (voltage or current) of a photon interacting with the active area of the SiPM. This value establishes the threshold for measuring dark count rate (DCR), crosstalk and afterpulsing noise.
In
Figure 7, the persistence histogram (left-panel) of the pulse shape and the peak histogram (right-panel) for
pulses at 56 V/25 °C are shown.
The histograms reveal that pulses of 1 pe and 2 pe have more probability of occurrence than others. These pulses are mainly generated by the SiPM noise [
33]. The resulting equivalent voltage for 1 pe is ∼
mV, therefore the threshold for measuring the SiPM DCR must be set below
mV and for the cross-talk below 27 mV.
4.4. Noise
SiPMs are affected by correlated noise (crosstalk and afterpulsing) and non-correlated noise (DCR) [
34]. These noise sources impose a lower measurement limit in SiPM-based experiments. We performed a noise analysis of the MuTe SiPMs taking into account their temperature and over-voltage dependency.
4.4.1. Dark Count Rate
The main source of noise in SiPMs is the DCR. It appears as a consequence of avalanches processes fired by electrons thermally generated in the silicon crystal. Signals generated by thermal electrons and single photons are identical. The DCR is measured under dark conditions by counting events above a pe threshold.
The DCR is calculated as follows,
where
is the number of events above 0.5 pe before stimulation and
is the total number of recorded events.
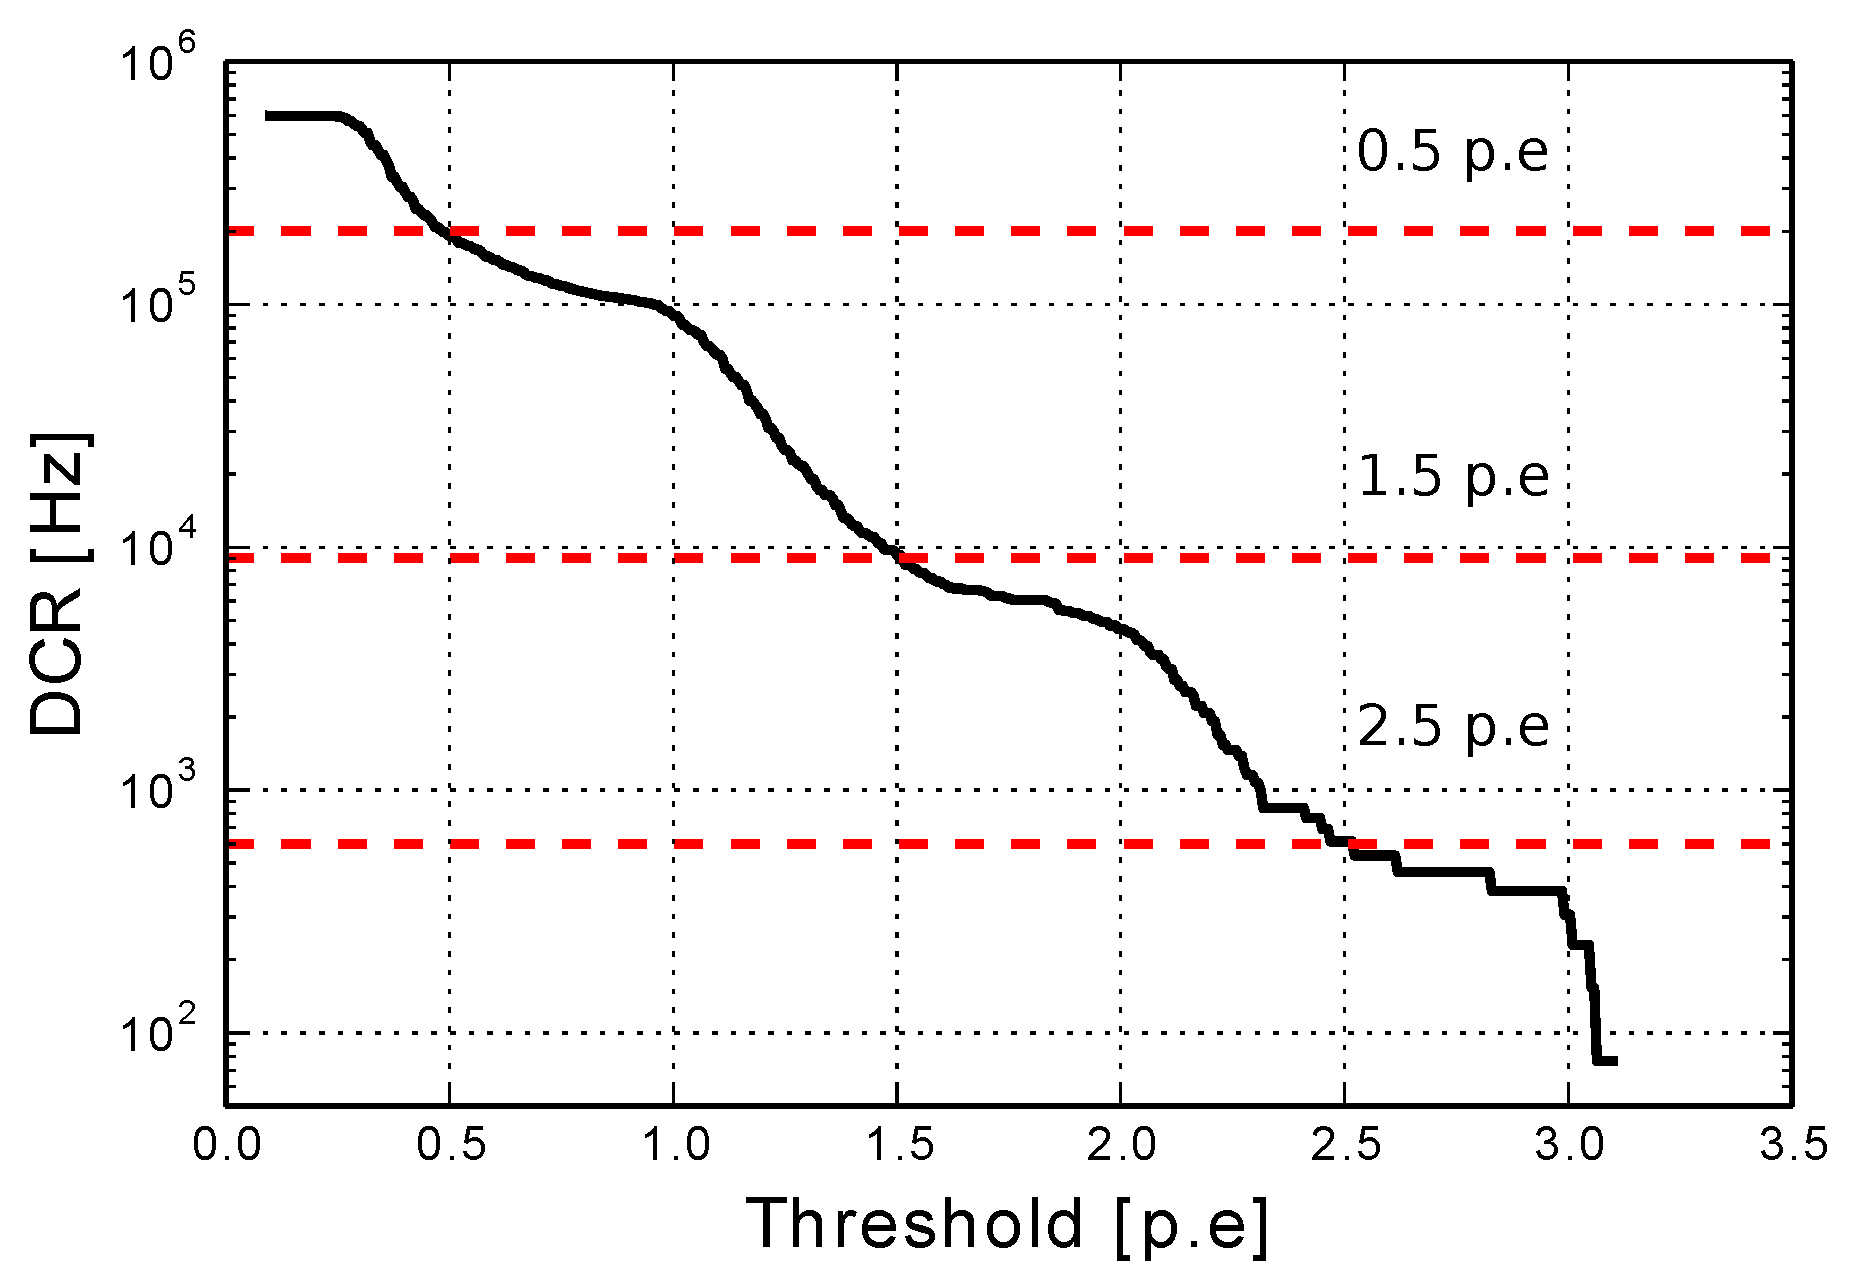
We measured the DCR for different thresholds spanning from
pe to
pe at 56 V/25 °C as shown in
Figure 8. The resulting curve has a stepped shape because of the amplitude discretization of the SiPM pulses. At
pe, the DCR is ∼
Hz in agreement to the expected value provided by the SiPM S13360-1350CS datasheet which range between
Hz and
Hz.
The DCR drastically decreases while the measurement threshold increases. We found a DCR of Hz at pe, Hz at pe, and <10 Hz at pe.
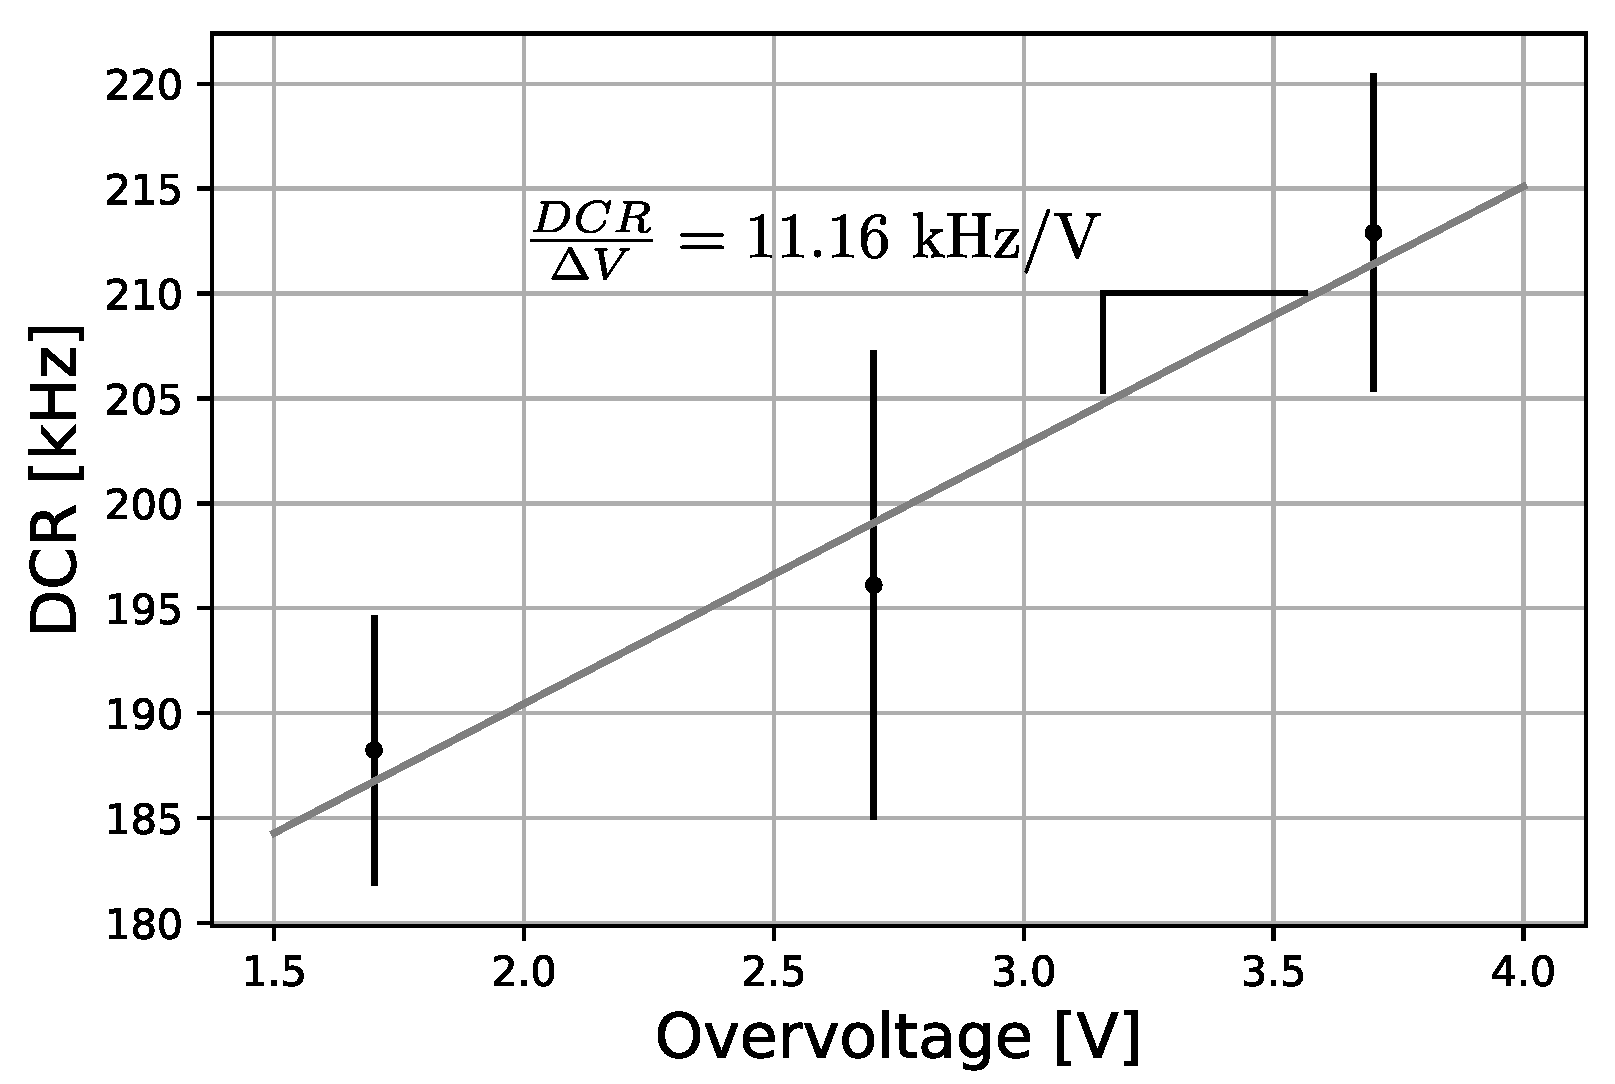
To characterize the DCR as a function of the over-voltage, we carried out DCR measurements for three cases (
V,
V and
V) at
C.
Figure 9 shows that the DCR increases with a slope ∼
kHz/V.
The DCR correlation with the SiPM temperature was also evaluated. We estimated a ratio 0.85 kHz/°C after analyzing DRC measurements from 0 °C to 40 °C at 56 V.
4.4.2. Afterpulsing and Crosstalk
Afterpulsing is generated by trapped electrons in silicon impurities during an avalanche process. These electrons are released a few nanoseconds later, creating new avalanches—i.e., consecutive pulses [
35]. The amplitude of afterpulses increases with the retention time of the trapped electron.
The afterpulsing probability
is calculated as follows
where
and
are the number of events with amplitude > 0.5 pe after and before stimulation with the light pulser.
Crosstalk occurs when charge carriers (inside the avalanche) emit photons that interact with neighboring cells triggering secondary avalanches.
The crosstalk probability [
36,
37] is defined as
where
is the number of events with amplitude >
pe before stimulation.
In
Figure 10, the afterpulsing and crosstalk versus the SiPM over-voltage are shown. Both increase exponentially with the over-voltage, with the crosstalk greater than the afterpulsing, which reaches
at 56 V/25 °C with the crosstalk reaching
.
The correlated noise dependency on temperature was analyzed by performing afterpulsing and crosstalk measurements from 0 °C to 40 °C at 56 V. At 0 °C, the probability of afterpulsing is below and of crosstalk is below . The afterpulsing increases faster than crosstalk with temperature, rising up almost at 40 °C while crosstalk reaches .
To reduce the noise caused by dark count, crosstalk, and afterpulsing, we concluded that the minimum discrimination threshold for the MuTe scintillator hodoscope must be above 5 pe. The breakdown voltage shifting due to temperature variations will cause a modulation of the detection rate. This can be solved using closed-loop control of the SiPMs bias voltage or corrected latter in the offline data analysis.
5. Operating Temperature Conditions of MuTe
5.1. Weather at the Cerro Machín Volcano
The Cerro Machín volcano has the typical weather conditions of the Andean mountains in Colombia. According to the Colombian Hydrology, Meteorology and Environmental Studies Institute (IDEAM), the average temperature at Cerro Machín is C, the relative humidity , and the maximum wind speed 30 m/s. During the rainy season, the temperature drops to C and during the dry season it rises to C. The rainy season occurs between April to May and October to November, and the dry season is usually from December to January and July to August. The day–night temperature gradient at the Cerro Machín volcano is around C along the dry and rainy seasons.
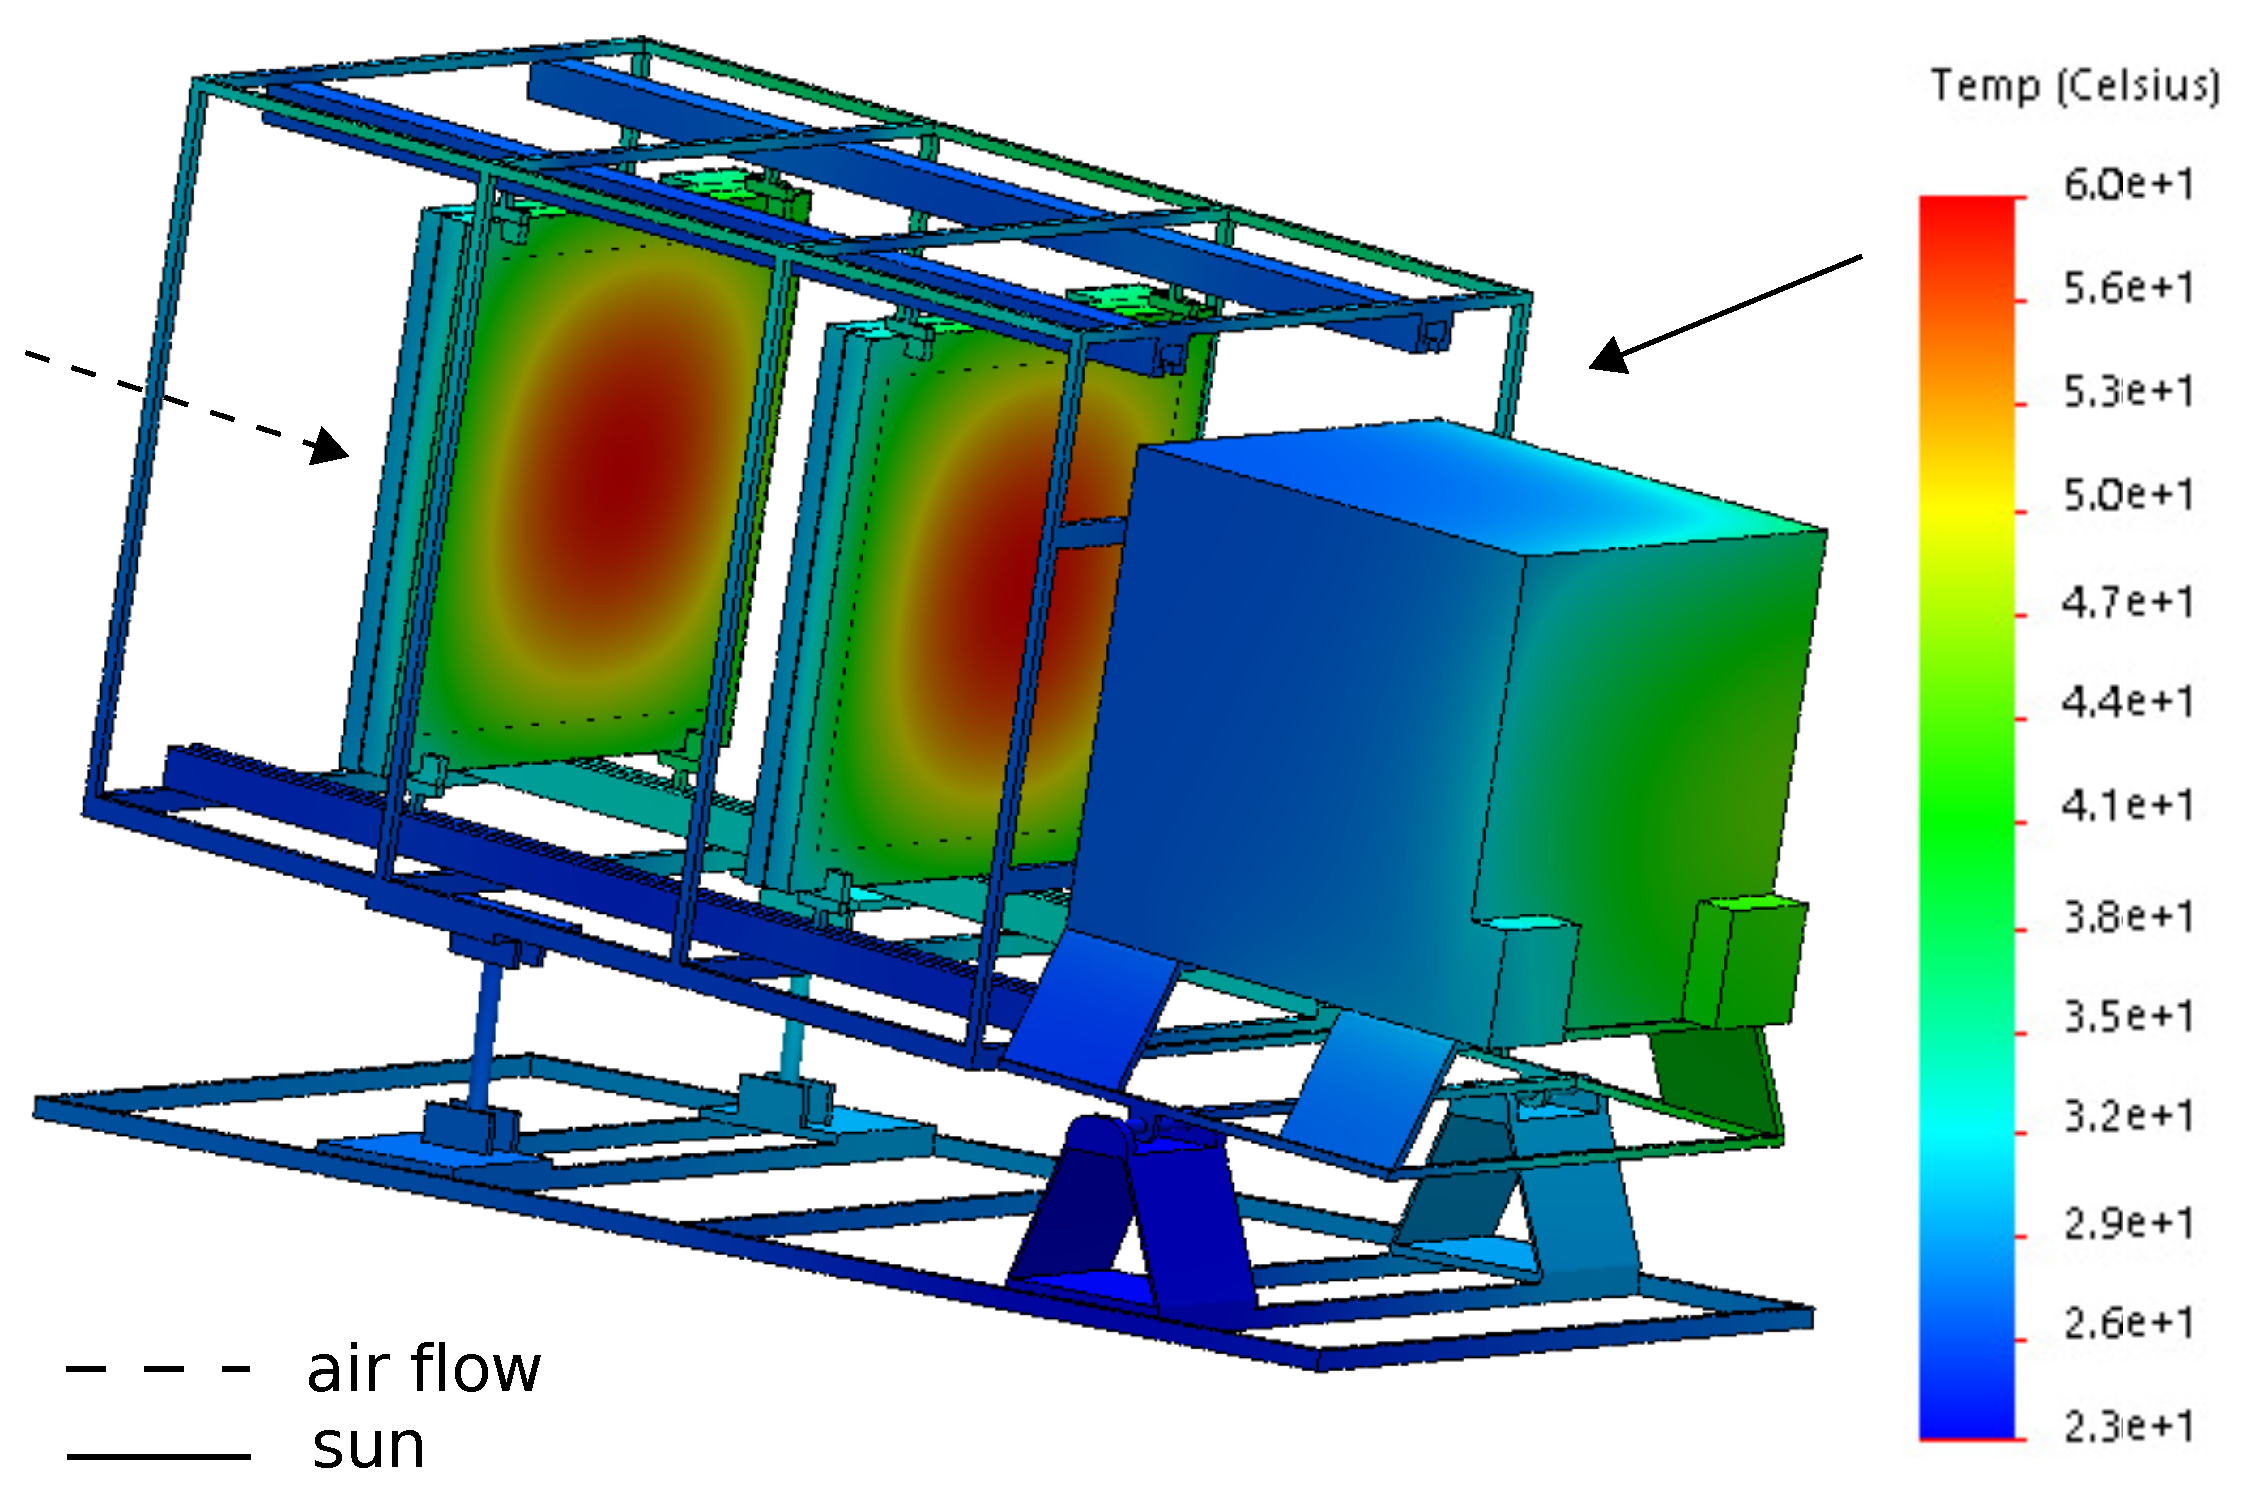
5.2. Heat Transfer in the MuTe Structure
We computed a thermal analysis of the MuTe mechanical structure using the
Solidworks CAD Software. The heat sources were: the environmental temperature (16 °C), solar radiation (4.5 kWh m
−1 day
−1), cooling by wind (30 m/s), and heating by the electronics power consumption (12.5 W). We also inputted the thermal features of the metallic chassis supporting the WCD and the hodoscope [
27].
In
Figure 11, the temperature distribution on the MuTe structure resulting from the thermal simulation is shown. The direct incidence of the solar radiation (solid arrow) causes a maximum temperature of 60 °C in the middle of the scintillation panels, but this drops to 26 °C due to the convection created by the frontal wind (dashed arrow). The water volume inside the WCD dissipates the heat of the stainless steel cube. The maximum temperature on the WCD is ∼40 °C.
6. Temperature Influence on the MuTe-SiPMs
In this section, we analyze how temperature affects the SiPM parameters under real observational conditions. This procedure uses the characterization ratios presented in
Section 4 and temperature measurements.
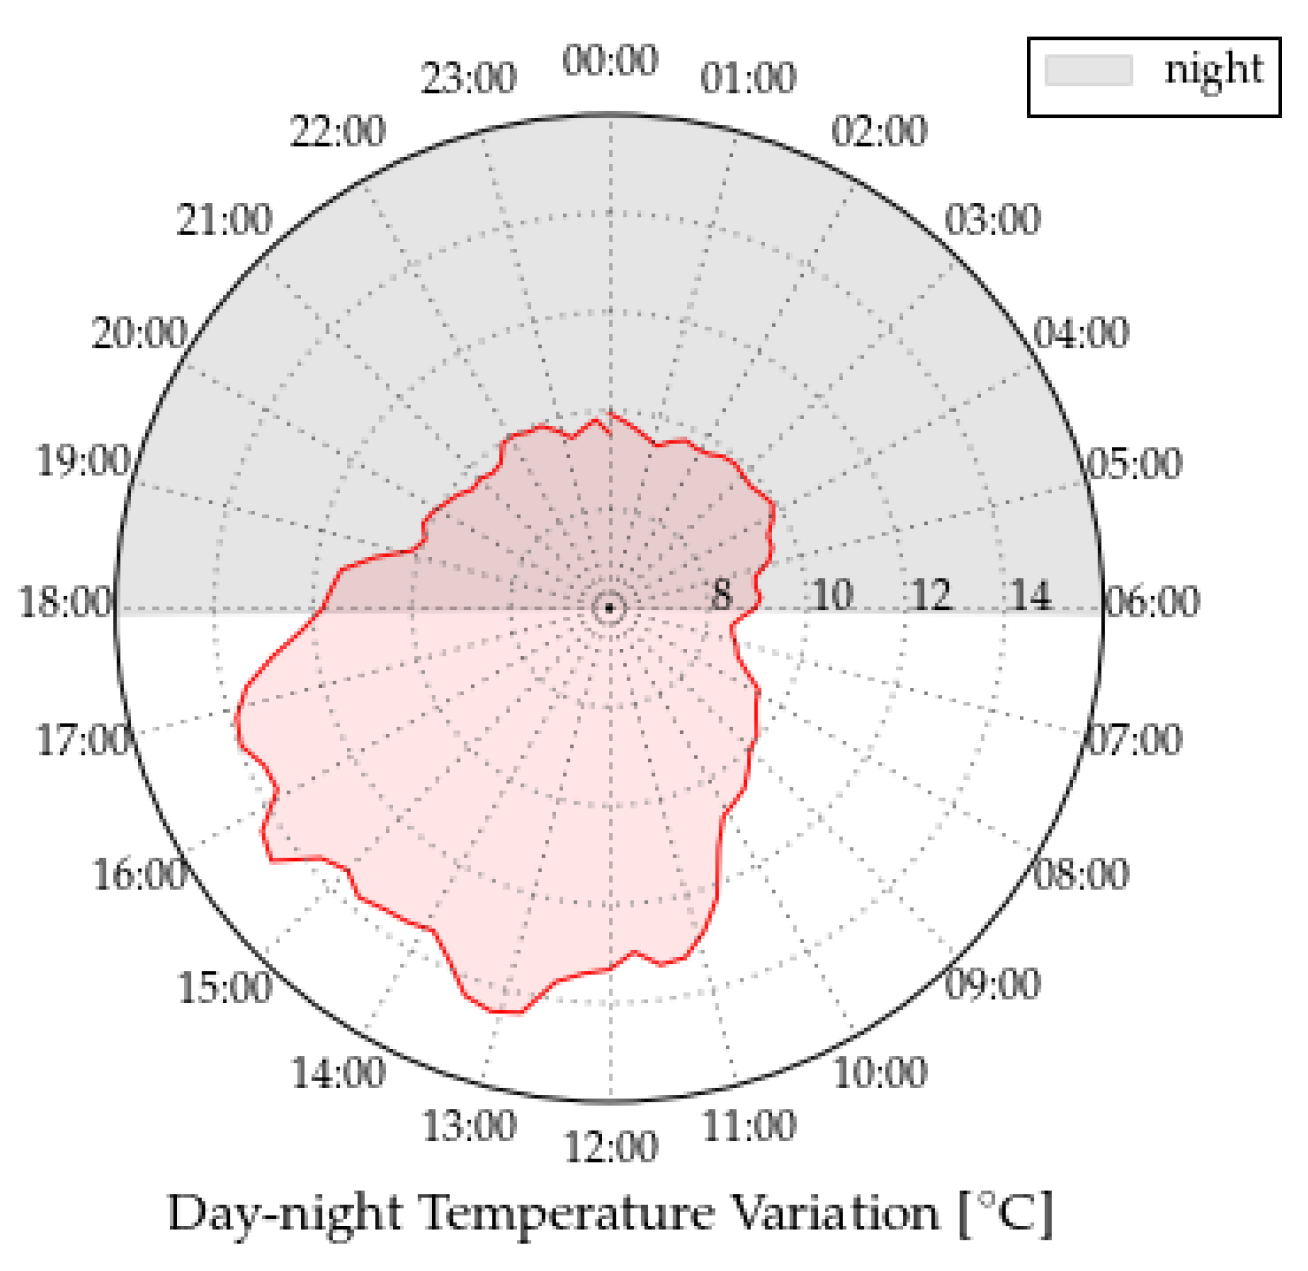
We use temperature data recorded at the Cerro Machín volcano during the 2017 rainy season between 22–23 November. The day–night temperature cycle starts/ends at 00:00 h with ∼10 °C. The temperature drops to a minimum value of ∼8.5 °C at 06:30 h and rises to a maximum of ∼14.5 °C at 13:00 h, as shown
Figure 12.
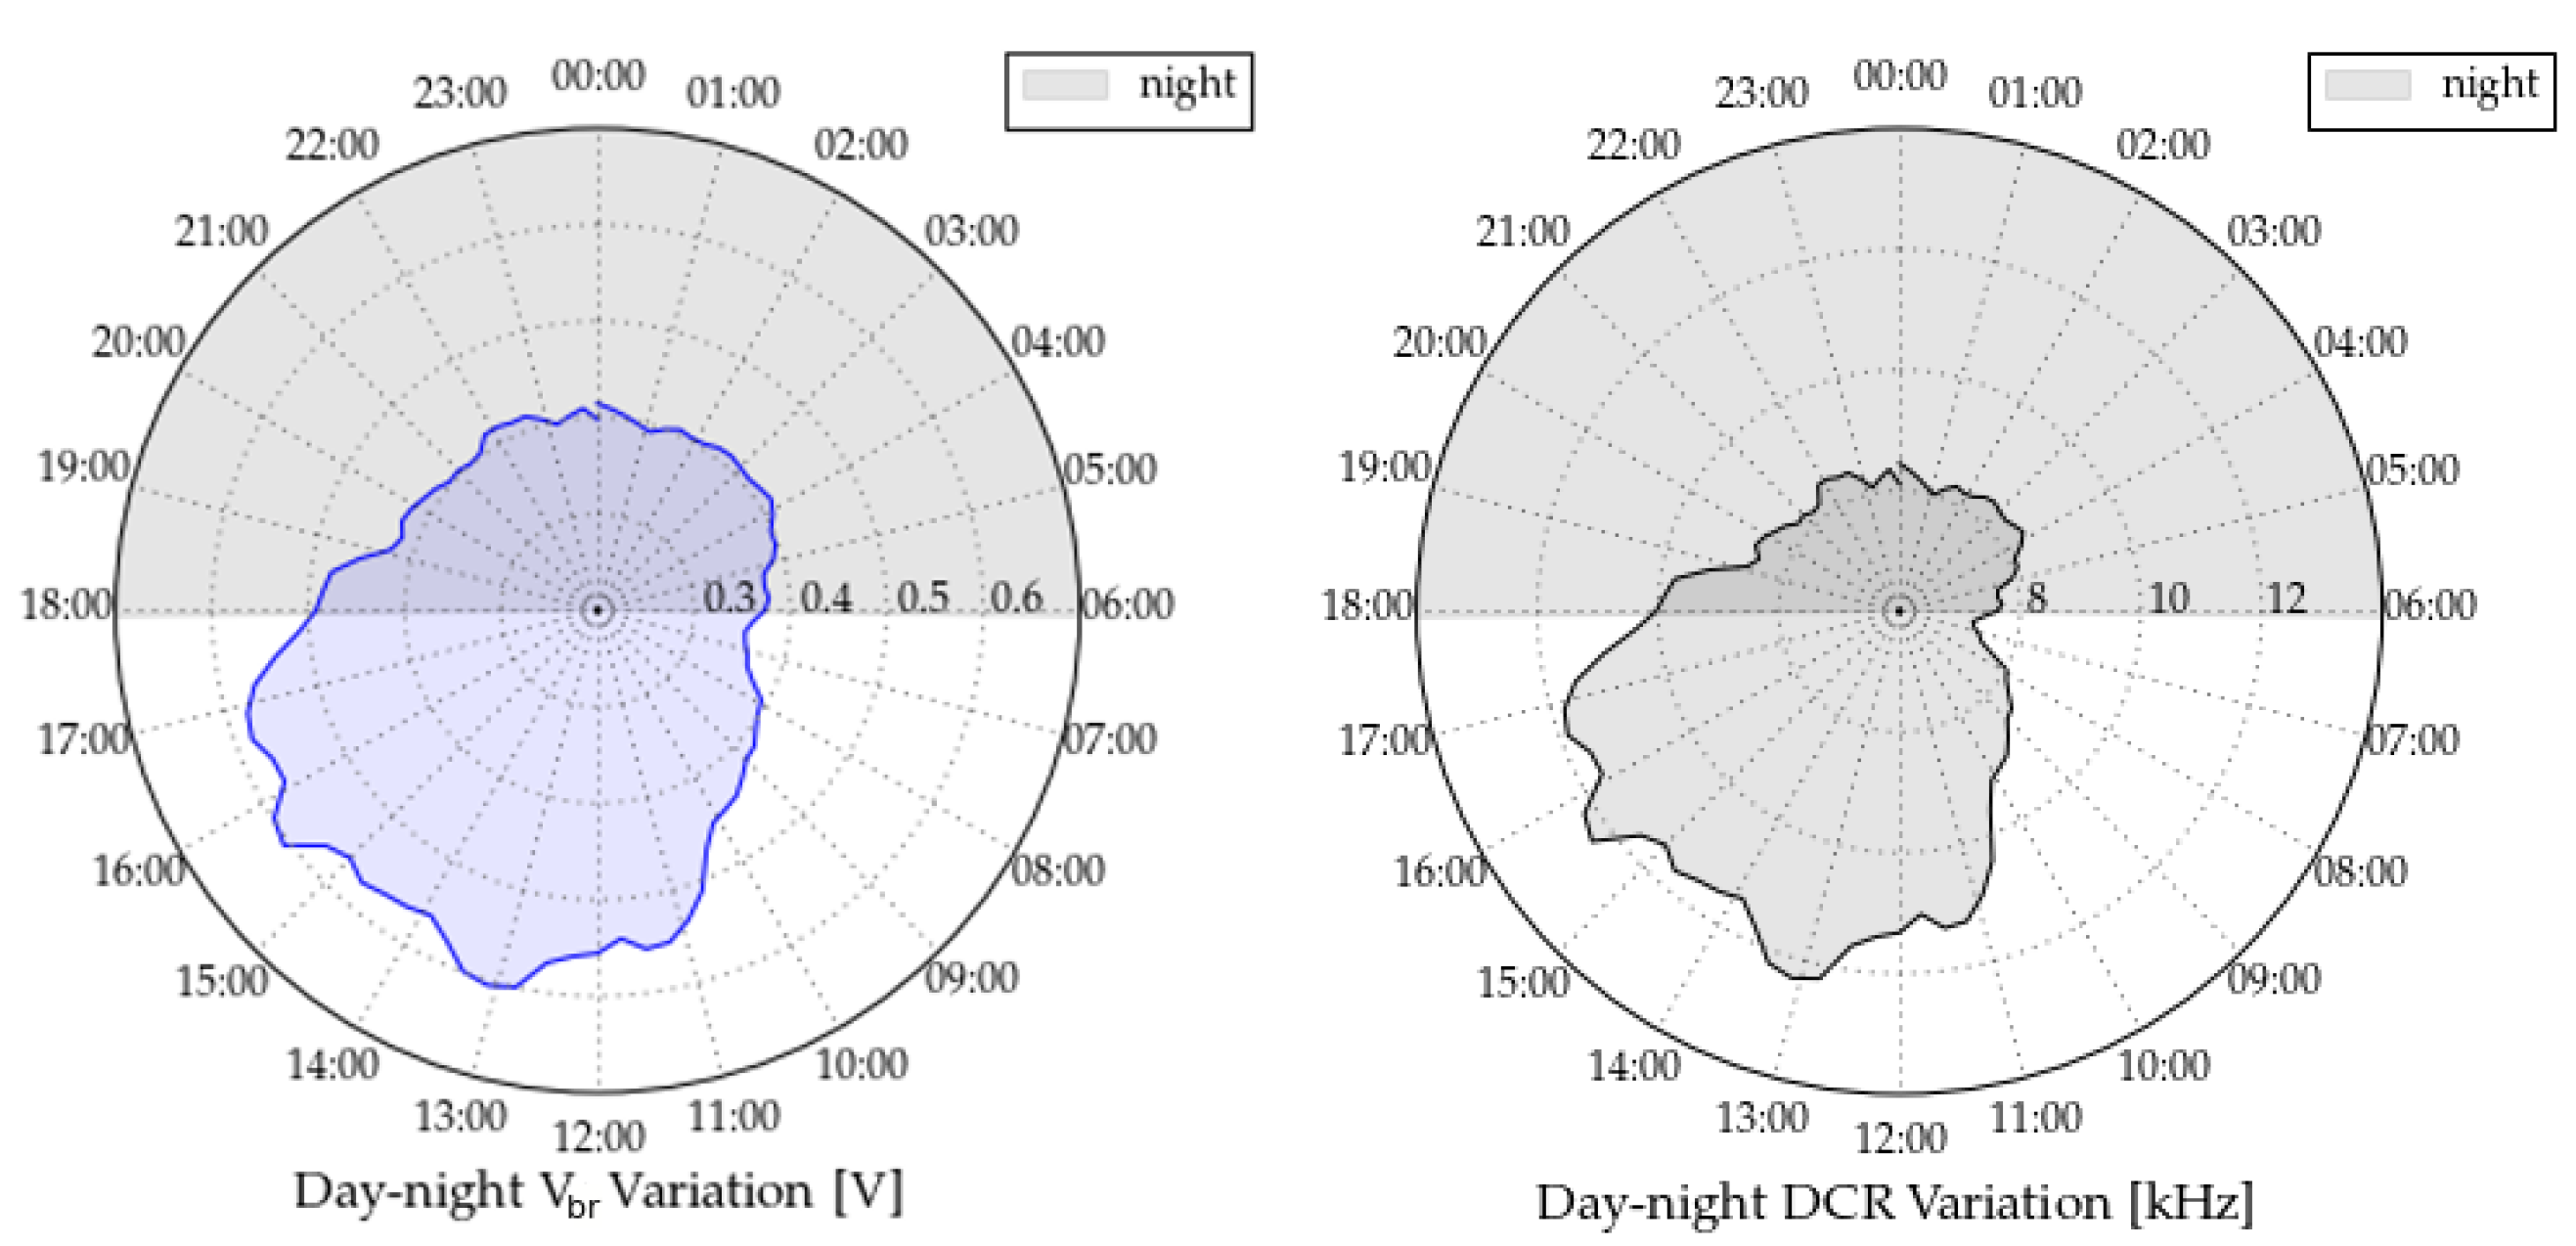
The estimated SiPM breakdown voltage and DCR along the day–night cycle are presented in
Figure 13. The maximum temperature gradient is ∼6.1 °C which represents a breakdown voltage (41.7 mV/°C) deviation of ±126 mV from the nominal value (53.2 V). This breakdown shift affects the SiPM gain (
/V) causing a deviation ∼
.
As the temperature of the SiPM increases, the number of thermally generated electrons on the silicon material also increases. The DCR absolute variation is ∼5.2 kHz. We can expect the DCR to vary between 207 kHz and 212.2 kHz, assuming the SiPM operates at 56 V where the nominal DCR is approximately 210 kHz.
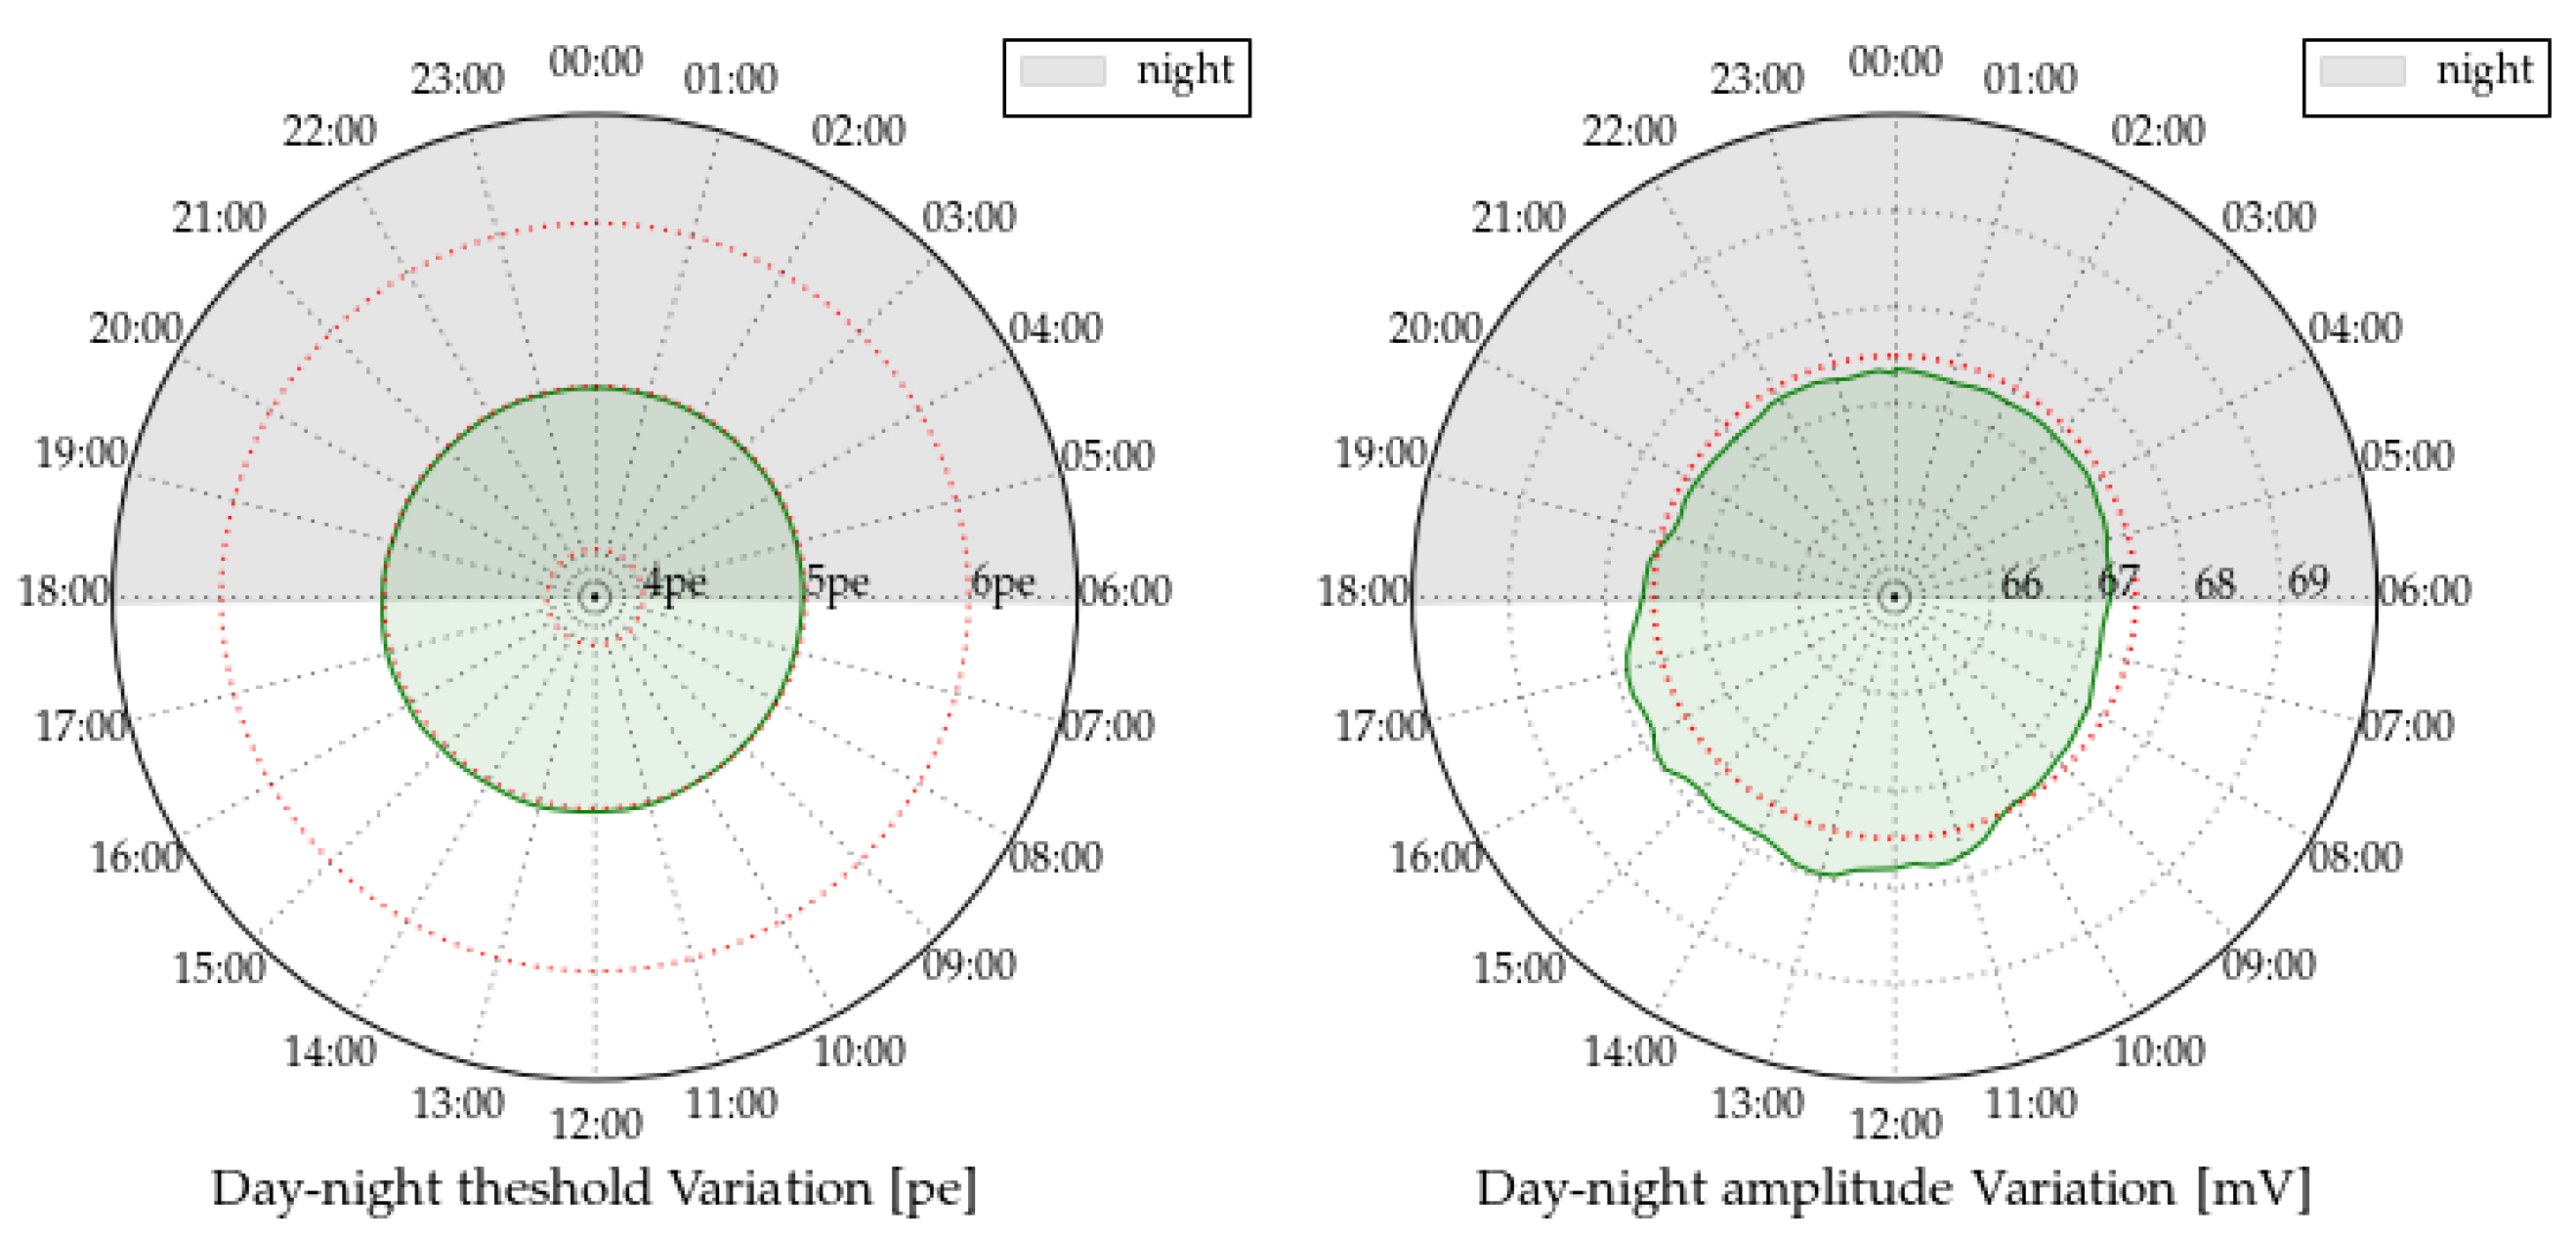
The maximum variance of the pulse amplitude is about 0.8 mV for a
∼6.1 °C which represents roughly
of the voltage separation between two consecutive photoelectrons (∼13.5 mV at 56 V).
Figure 14 shows the resulting variance around the threshold voltage (right) and its respective photoelectron equivalent (left).
We analyzed four days of data from 20 December 2019 to 24 December 2019 in order to evaluate the MuTe-SiPMs behaviour in field conditions. We set a hodoscope discrimination threshold of 8 pe (108.5 mV) so as to suppress the noise contributions due to DCR, afterpulsing, and crosstalk (<
Hz) and allowing the signals from minimum ionizing muons (∼12 pe for a distance SiPM-WLS fibre of 0.5 mm) [
38].
Figure 15 shows the in-coincidence detection rate, and temperatures of the rear (
) and frontal (
) panels. For this measurement, MuTe was set pointing towards the horizon, with an angular aperture of 52
, and an inter-panel separation of 2.5 m.
The panel temperature oscillates from 20
C to 30
C, representing a gradient of 10
C. A 10
C gradient represents a variation in the pulse amplitude around 14.8%. However, this variation increases the breakdown voltage ∼417 mV, reducing the overvoltage and the SiPM gain causing a reduction of the detected rate. The measured average flux is ∼3.1 events/s varying roughly 11.2% between the maximum and minimum temperatures. We estimated the temperature dependency (−0.057 Hz/°C) of the muon flux recorded by the telescope. The muon flux correction is carried out by subtracting the product between the instantaneous temperature and the dependency coefficient from the instantaneous muon flux [
39].
7. Discussion and Conclusions
We evaluated the SiPM S13360-1350CS breakdown voltage, gain, and noise depending on the over-voltage and temperature. Temperature tests ranged from 0 °C to 40 °C covering the temperature spectrum of the observation site at Cerro Machín Volcano, Colombia. The SiPM breakdown voltage variation ratio was about 41.7 mV/°C, indicating a pulse amplitude shift of 14.8%, which is not indicative of jumping between photoelectron levels. We also estimated a gain increase ratio of about 3.07/V for over-voltage changes on the SiPM.
With the noise characterization, we found that dark count rate decreases by several orders of magnitude (<100 Hz) at a threshold above 3 pe and DCR increases with a ratio of 11.16 kHz/V as a function of the SiPM over-voltage. The afterpulsing and crosstalk probabilities show a non-linear growth with the temperature reaching up to 3% and 5%, respectively, for an over-voltage of 3.7 V. We recommend a minimum discrimination threshold of 5 pe so as to reduce correlated and non-correlated noises in the SiPMs of MuTe.
Environmental temperatures modulate the hodoscope rate in the field test, reaching a maximum deviation of 11.2%. The modulation shows an inverse correlation with SiPM’s temperature (−0.057 Hz/C) due to the increase in the breakdown voltage and the SiPM gain reduction.
Author Contributions
Conceptualization, J.P.-R.; methodology, J.S.-V. and J.P.-R.; investigation, J.S.-V. and J.P.-R.; supervision, H.A. and L.A.N.; writing—review and editing, J.S.-V., J.P.-R., H.A. and L.A.N. All authors have read and agreed to the published version of the manuscript.
Funding
This work was supported by the Departamento Administrativo de Ciencia, Tecnología e Innovación of Colombia (ColCiencias) under contract FP44842-082-2015 and to the Programa de Cooperación Nivel II (PCB-II) MINCYT-CONICET-COLCIENCIAS 2015, under project CO/15/02.
Data Availability Statement
Not applicable.
Acknowledgments
The authors acknowledge the Grupo Halley Laboratory and Universidad Industrial de Santander where SiPM measurements and the Muon Telescope installation were Tperformed.
Conflicts of Interest
The authors declare no conflict of interest.
References
- Blanpied, G.; Kumar, S.; Dorroh, D.; Morgan, C.; Blanpied, I.; Sossong, M.; McKenney, S.; Nelson, B. Material discrimination using scattering and stopping of cosmic ray muons and electrons: Differentiating heavier from lighter metals as well as low-atomic weight materials. Nucl. Instrum. Methods Phys. Res. Sect. A Accel. Spectrometers Detect. Assoc. Equip. 2015, 784, 352–358. [Google Scholar] [CrossRef]
- Morishima, K.; Kuno, M.; Nishio, A.; Kitagawa, N.; Manabe, Y.; Moto, M.; Takasaki, F.; Fujii, H.; Satoh, K.; Kodama, H.; et al. Discovery of a big void in Khufu Pyramid by observation of cosmic-ray muons. Nature 2017, 552, 386. [Google Scholar] [CrossRef] [PubMed] [Green Version]
- Gómez, H.; Carloganu, C.; Gibert, D.; Jacquemier, J.; Karyotakis, Y.; Marteau, J.; Niess, V.; Katsanevas, S.; Tonazzo, A. Studies on muon tomography for archaeological internal structures scanning. J. Phys. Conf. Ser. 2016, 718, 052016. [Google Scholar] [CrossRef] [Green Version]
- Fujii, H.; Hara, K.; Hashimoto, S.; Ito, F.; Kakuno, H.; Kim, S.H.; Kochiyama, M.; Nagamine, K.; Suzuki, A.; Takada, Y.; et al. Performance of a remotely located muon radiography system to identify the inner structure of a nuclear plant. Prog. Theor. Exp. Phys. 2013, 2013, 073C01. [Google Scholar] [CrossRef] [Green Version]
- Saracino, G.; Amato, L.; Ambrosino, F.; Antonucci, G.; Bonechi, L.; Cimmino, L.; Consiglio, L.; Alessandro, R.D.; Luzio, E.D.; Minin, G.; et al. Imaging of underground cavities with cosmic-ray muons from observations at Mt. Echia (Naples). Sci. Rep. 2017, 7, 1181. [Google Scholar] [CrossRef] [Green Version]
- Thompson, L.F.; Stowell, J.P.; Fargher, S.J.; Steer, C.A.; Loughney, K.L.; O’Sullivan, E.M.; Gluyas, J.G.; Blaney, S.W.; Pidcock, R.J. The application of muon tomography to the imaging of railway tunnels. arXiv 2019, arXiv:1906.05814. [Google Scholar]
- Nagamine, K.; Tanaka, H.; Nakamura, S.; Ishida, K.; Hashimoto, M.; Shinotake, A.; Naito, M.; Hatanaka, A. Probing the inner structure of blast furnaces by cosmic-ray muon radiography. Proc. Jpn. Acad. Ser. B 2005, 81, 257–260. [Google Scholar] [CrossRef] [Green Version]
- Tanaka, H.K.; Uchida, T.; Tanaka, M.; Shinohara, H.; Taira, H. Cosmic-ray muon imaging of magma in a conduit: Degassing process of Satsuma-Iwojima Volcano, Japan. Geophys. Res. Lett. 2009, 36. [Google Scholar] [CrossRef]
- Lesparre, N.; Gibert, D.; Marteau, J.; Déclais, Y.; Carbone, D.; Galichet, E. Geophysical muon imaging: Feasibility and limits. Geophys. J. Int. 2010, 183, 1348–1361. [Google Scholar] [CrossRef] [Green Version]
- Lesparre, N.; Gibert, D.; Marteau, J. Bayesian dual inversion of experimental telescope acceptance and integrated flux for geophysical muon tomography. Geophys. J. Int. 2011, 188, 490–497. [Google Scholar] [CrossRef] [Green Version]
- Lesparre, N.; Marteau, J.; Déclais, Y.; Gibert, D.; Carlus, B.; Nicollin, F.; Kergosien, B. Design and operation of a field telescope for cosmic ray geophysical tomography. Geosci. Instrum. Methods Data Syst. 2012, 1, 33–42. [Google Scholar] [CrossRef] [Green Version]
- Tanaka, H.K.M.; Oláh, L. Overview of muographers. Philos. Trans. R. Soc. A Math. Phys. Eng. Sci. 2019, 377, 20180143. [Google Scholar] [CrossRef] [Green Version]
- Nagamine, K. Radiography with cosmic-ray and compact accelerator muons: Exploring inner-structure of large-scale objects and landforms. Proc. Jpn. Acad. Ser. B 2016, 92, 265–289. [Google Scholar] [CrossRef] [Green Version]
- Sehgal, R. Simulations and Track Reconstruction for Muon Tomography using Resistive Plate Chambers. Dae Symp. Nucl. Phys. 2016, 61, 1034–1035. [Google Scholar]
- Fehr, F.; TOMUVOL Collaboration. Density imaging of volcanos with atmospheric muons. J. Phys. Conf. Ser. 2012, 375, 052019. [Google Scholar] [CrossRef] [Green Version]
- Bouteille, S.; Attie, D.; Baron, P.; Calvet, D.; Magnier, P.; Mandjavidze, I.; Procureur, S.; Riallot, M.; Winkler, M. A Micromegas-based telescope for muon tomography: The WatTo experiment. Nucl. Instrum. Methods Phys. Res. Sect. A Accel. Spectrometers Detect. Assoc. Equip. 2016, 834, 223–228. [Google Scholar] [CrossRef] [Green Version]
- Oláh, L.; Tanaka, H.K.M.; Ohminato, T.; Varga, D. High-definition and low-noise muography of the Sakurajima volcano with gaseous tracking detectors. Sci. Rep. 2018, 8, 3207. [Google Scholar] [CrossRef] [Green Version]
- Nagamine, K.; Iwasaki, M.; Shimomura, K.; Ishida, K. Method of probing inner-structure of geophysical substance with the horizontal cosmic-ray muons and possible application to volcanic eruption prediction. Nucl. Instrum. Methods Phys. Res. Sect. A Accel. Spectrometers Detect. Assoc. Equip. 1995, 356, 585–595. [Google Scholar] [CrossRef]
- Aguiar, P.; Casarejos, E.; Vilan, J.A.; Iglesias, A. Geant4-GATE Simulation of a Large Plastic Scintillator for Muon Radiography. IEEE Trans. Nucl. Sci. 2015, 62, 1233–1238. [Google Scholar] [CrossRef]
- Tang, S.; Yu, Y.; Zhou, Y.; Sun, Z.; Zhang, X.; Wang, S.; Yue, K.; Liu, L.; Fang, F.; Yan, D. A large area plastic scintillation detector with 4-corner-readout. Chin. Phys. C 2016, 40, 056001. [Google Scholar] [CrossRef] [Green Version]
- Procureur, S. Muon imaging: Principles, technologies and applications. Nucl. Instrum. Methods Phys. Res. Sect. A Accel. Spectrometers Detect. Assoc. Equip. 2018, 878, 169–179. [Google Scholar] [CrossRef]
- Grupen, C.; Shwartz, B. Particle Detectors (Cambridge Monographs on Particle Physics, Nuclear Physics and Cosmology); Cambridge University Press: Cambridge, UK, 2008. [Google Scholar]
- Ambrosino, F.; Anastasio, A.; Basta, D.; Bonechi, L.; Brianzi, M.; Bross, A.; Callier, S.; Caputo, A.; Ciaranfi, R.; Cimmino, L.; et al. The MU-RAY project: Detector technology and first data from Mt. Vesuvius. J. Instrum. 2014, 9, C02029. [Google Scholar] [CrossRef]
- Nakamura, Y.; Okumura, A.; Tajima, H.; Yamane, N.; Zenin, A. Characterization of SiPM Optical Crosstalk and Its Dependence on the Protection-Window Thickness. In Proceedings of the 5th International Workshop on New Photon-Detectors (PD18), Tokyo, Japan, 27–29 November 2018. [Google Scholar] [CrossRef] [Green Version]
- Jangra, M.; Saraf, M.N.; Datar, V.M.; Majumder, G.; Pathaleswar; Satyanarayana, B.; Upadhya, S.S. Characterization of Hamamatsu SiPM for Cosmic Muon Veto Detector at IICHEP. In Springer Proceedings in Physics; Springer: Singapore, 2022; pp. 815–819. [Google Scholar] [CrossRef]
- Vesga-Ramírez, A.; Sierra-Porta, D.; Pena-Rodriguez, J.; Sanabria-Gomez, J.D.; Valencia-Otero, M.; Sarmiento-Cano, C.; Suarez-Duran, M.; Asorey, H.; Nunez, L.A. Muon Tomography sites for Colombian volcanoes. Ann. Geophys. 2020, 63. [Google Scholar] [CrossRef]
- Peña-Rodríguez, J.; Pisco-Guabave, J.; Sierra-Porta, D.; Suárez-Durán, M.; Arenas-Flórez, M.; Pérez-Archila, L.M.; Sanabria-Gómez, J.D.; Asorey, H.; Núñez, L.A. Design and construction of MuTe: A hybrid Muon Telescope to study Colombian volcanoes. J. Instrum. 2020, 15, P09006. [Google Scholar] [CrossRef]
- Saint-Gobain Ceramics and Plastics. Plastic Scintillating Fibers. 2017. Available online: https://www.phys.hawaii.edu/~idlab/taskAndSchedule/HMBv3/fiber-product-sheet.pdf (accessed on 13 January 2023).
- Hamamatsu. MPPCs for Precision Measurement. 2018. Available online: https://www.hamamatsu.com/content/dam/hamamatsu-photonics/sites/documents/99_SALES_LIBRARY/ssd/s13360_series_kapd1052e.pdf (accessed on 13 January 2023).
- Georgiev, G.; Kozhuharov, V.; Tsankov, L. Design and performance of a low intensity LED driver for detector study purposes. In Proceedings of the RAD Conference Proceedings. RAD Association, Niš, Serbia, 23–27 May 2016. [Google Scholar] [CrossRef] [Green Version]
- Eigen, G. Gain Stabilization of SiPMs and Afterpulsing. J. Phys. Conf. Ser. 2019, 1162, 012013. [Google Scholar] [CrossRef]
- Nagy, F.; Hegyesi, G.; Kalinka, G.; Molnar, J. A model based DC analysis of SiPM breakdown voltages. Nucl. Instrum. Methods Phys. Res. Sect. A Accel. Spectrometers Detect. Assoc. Equip. 2017, 849, 55–59. [Google Scholar] [CrossRef] [Green Version]
- Acerbi, F.; Gundacker, S. Understanding and simulating SiPMs. Nucl. Instrum. Methods Phys. Res. Sect. A Accel. Spectrometers Detect. Assoc. Equip. 2019, 926, 16–35. [Google Scholar] [CrossRef]
- Baudis, L.; Galloway, M.; Kish, A.; Marentini, C.; Wulf, J. Characterisation of Silicon Photomultipliers for liquid xenon detectors. J. Instrum. 2018, 13, P10022. [Google Scholar] [CrossRef] [Green Version]
- Xu, H.; Pancheri, L.; Betta, G.D.; Stoppa, D. Design and characterization of a p+/n-well SPAD array in 150 nm CMOS process. Opt. Express 2017, 25, 12765. [Google Scholar] [CrossRef] [PubMed]
- Ramilli, M. Characterization of SiPM: Temperature dependencies. In Proceedings of the 2008 IEEE Nuclear Science Symposium Conference Record, Dresden, Germany, 19–25 October 2008. [Google Scholar] [CrossRef]
- Hampel, M.; Fuster, A.; Varela, C.; Platino, M.; Almela, A.; Lucero, A.; Wundheiler, B.; Etchegoyen, A. Optical crosstalk in SiPMs. Nucl. Instrum. Methods Phys. Res. Sect. A Accel. Spectrometers Detect. Assoc. Equip. 2020, 976, 164262. [Google Scholar] [CrossRef]
- Vásquez-Ramírez, A.; Suárez-Durán, M.; Jaimes-Motta, A.; Calderón-Ardila, R.; Peña-Rodríguez, J.; Sánchez-Villafrades, J.; Sanabria-Gómez, J.D.; Asorey, H.; Núñez, L.A. Simulated response of MuTe, a hybrid Muon Telescope. J. Instrum. 2020, 15, P08004. [Google Scholar] [CrossRef]
- Pena-Rodriguez, J. Diseño y Calibración de un Telescopio de Muones Híbrido para Estudios Vulcanológicos. Ph.D. Thesis, Universidad Industrial de Santander, Santander, Colombia, 2021. [Google Scholar]
Figure 1.
Experimental setup for measuring the SiPM dark current in darkness conditions. The SiPM is positioned in the aluminium holder inside the dark box. A PID controller sets the holder temperature via two Peltier cells with a full bridge (FB) driver. The controller sends the data to a computer via a UART (universal asynchronous receiver–transmitter) port.
Figure 2.
Experimental setup for measuring the gain and noise of the SiPM under stimulated conditions. The SiPM is stimulated by a 480 nm pulsed light of ∼10 ns width at 500 Hz. The SiPM signal is digitized by the Red Pitaya at 14-bit/125 MHz.
Figure 2.
Experimental setup for measuring the gain and noise of the SiPM under stimulated conditions. The SiPM is stimulated by a 480 nm pulsed light of ∼10 ns width at 500 Hz. The SiPM signal is digitized by the Red Pitaya at 14-bit/125 MHz.
Figure 3.
Breakdown voltage value found using the tangent method for the IV curve of SiPM operating at 25 °C. The ( V) is located at the intersection between the fit and the baseline.
Figure 3.
Breakdown voltage value found using the tangent method for the IV curve of SiPM operating at 25 °C. The ( V) is located at the intersection between the fit and the baseline.
Figure 4.
Temperature dependence of the SiPM breakdown voltage. (Left): IV curves ranging from 0 °C to 40 °C. (Right): Variation of the breakdown voltage with temperature.
Figure 4.
Temperature dependence of the SiPM breakdown voltage. (Left): IV curves ranging from 0 °C to 40 °C. (Right): Variation of the breakdown voltage with temperature.
Figure 5.
Charge spectrum of the SiPM operating at 56 V/25 °C. The first peak is the pedestal and the following represent the photoelectron equivalents. The inter-peak charge determines the SiPM gain.
Figure 5.
Charge spectrum of the SiPM operating at 56 V/25 °C. The first peak is the pedestal and the following represent the photoelectron equivalents. The inter-peak charge determines the SiPM gain.
Figure 6.
(Left): Charge spectrum for V (blue), V (green), and V (red). (Right): Measured gain variation ratio depending on the over-voltage.
Figure 6.
(Left): Charge spectrum for V (blue), V (green), and V (red). (Right): Measured gain variation ratio depending on the over-voltage.
Figure 7.
(Left): Waveform of the Hamamatsu S13360-1350CS under stimulation. (Right) Photo-electron spectrum resulting from integrating the area under pulse over a time window of 300 ns.
Figure 7.
(Left): Waveform of the Hamamatsu S13360-1350CS under stimulation. (Right) Photo-electron spectrum resulting from integrating the area under pulse over a time window of 300 ns.
Figure 8.
Dark count rate as a function of the detection threshold. The curve shape presents three breaks at 1 pe, 2 pe and 3 pe because of the discretization effect on the pulse amplitude.
Figure 8.
Dark count rate as a function of the detection threshold. The curve shape presents three breaks at 1 pe, 2 pe and 3 pe because of the discretization effect on the pulse amplitude.
Figure 9.
Dark count rate as a function of the over-voltage ranging from ( V to V) at 25 °C.
Figure 9.
Dark count rate as a function of the over-voltage ranging from ( V to V) at 25 °C.
Figure 10.
SiPM crosstalk (black line) and afterpulsing (blue line) depending on the over-voltage.
Figure 10.
SiPM crosstalk (black line) and afterpulsing (blue line) depending on the over-voltage.
Figure 11.
Heat distribution of the MuTe structure under the environmental conditions at the Cerro Machín volcano. The solid arrow represents the incident solar radiation while the dashed arrow indicates the wind direction. The maximum temperature at the centre of the scintillation panels reaches C.
Figure 12.
Day–night temperature cycle at the Cerro-Machín volcano during the rainy season (22–23 November). The gray shadow indicates the night period starting at 18:00 and ending at 06:00. The minimum temperature (∼C) is recorded at 06:30 and the maximum (∼C) at 13:00.
Figure 12.
Day–night temperature cycle at the Cerro-Machín volcano during the rainy season (22–23 November). The gray shadow indicates the night period starting at 18:00 and ending at 06:00. The minimum temperature (∼C) is recorded at 06:30 and the maximum (∼C) at 13:00.
Figure 13.
MuTe SiPM breakdown voltage (left) and DCR (right) variation as a function of the temperature values at the Cerro Machín volcano.
Figure 13.
MuTe SiPM breakdown voltage (left) and DCR (right) variation as a function of the temperature values at the Cerro Machín volcano.
Figure 14.
Photo-electron (left) and pulse amplitude (right) variation of the MuTe-SiPM with temperature values at the Cerro Machín volcano.
Figure 14.
Photo-electron (left) and pulse amplitude (right) variation of the MuTe-SiPM with temperature values at the Cerro Machín volcano.
Figure 15.
In-coincidence hodoscope rate modulation depending on the environmental temperature of the MuTe recorded from 20 December 2019 to 25 December 2019. The green line displays the rear panel rate under temperature and the blue line the frontal panel rate under temperature .
Figure 15.
In-coincidence hodoscope rate modulation depending on the environmental temperature of the MuTe recorded from 20 December 2019 to 25 December 2019. The green line displays the rear panel rate under temperature and the blue line the frontal panel rate under temperature .
| Disclaimer/Publisher’s Note: The statements, opinions and data contained in all publications are solely those of the individual author(s) and contributor(s) and not of MDPI and/or the editor(s). MDPI and/or the editor(s) disclaim responsibility for any injury to people or property resulting from any ideas, methods, instructions or products referred to in the content. |
© 2023 by the authors. Licensee MDPI, Basel, Switzerland. This article is an open access article distributed under the terms and conditions of the Creative Commons Attribution (CC BY) license (https://creativecommons.org/licenses/by/4.0/).


