

6LiF Converters for Neutron Detection: Production Procedures and Detector Tests

 , , ,
, , ,  , ,
, , 
Abstract
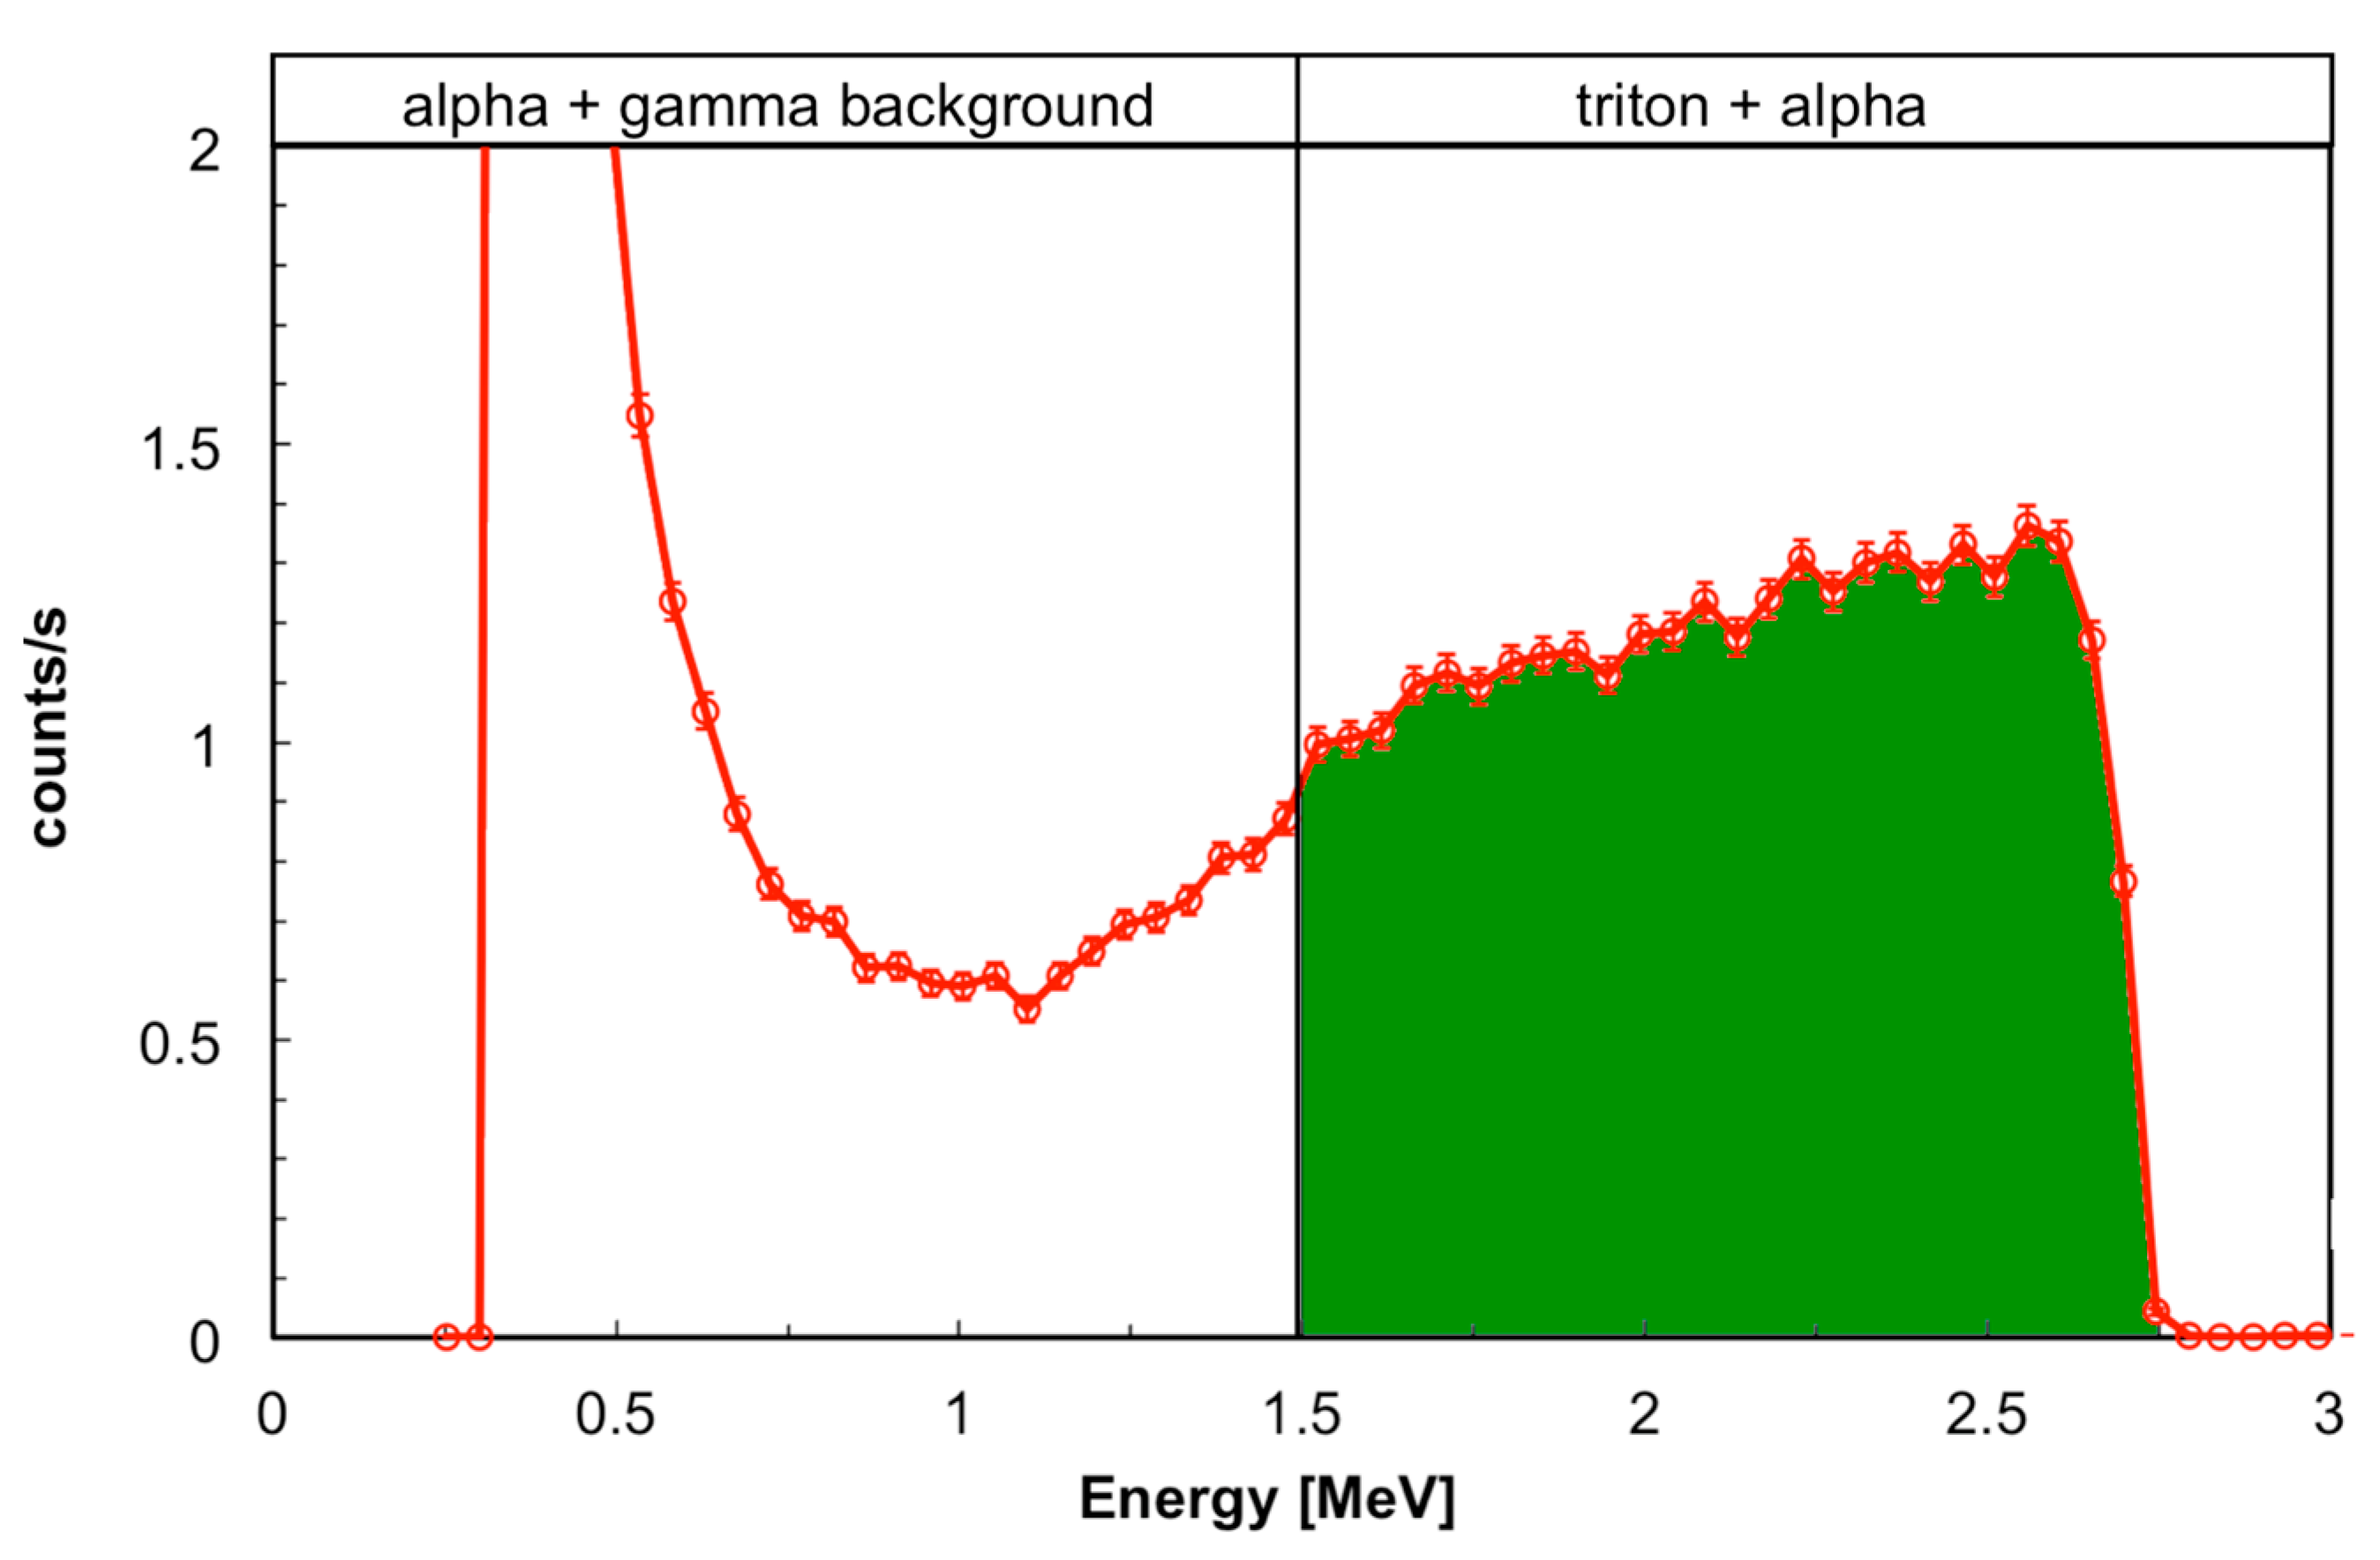
:1. Introduction
2. The Evaporation Technique
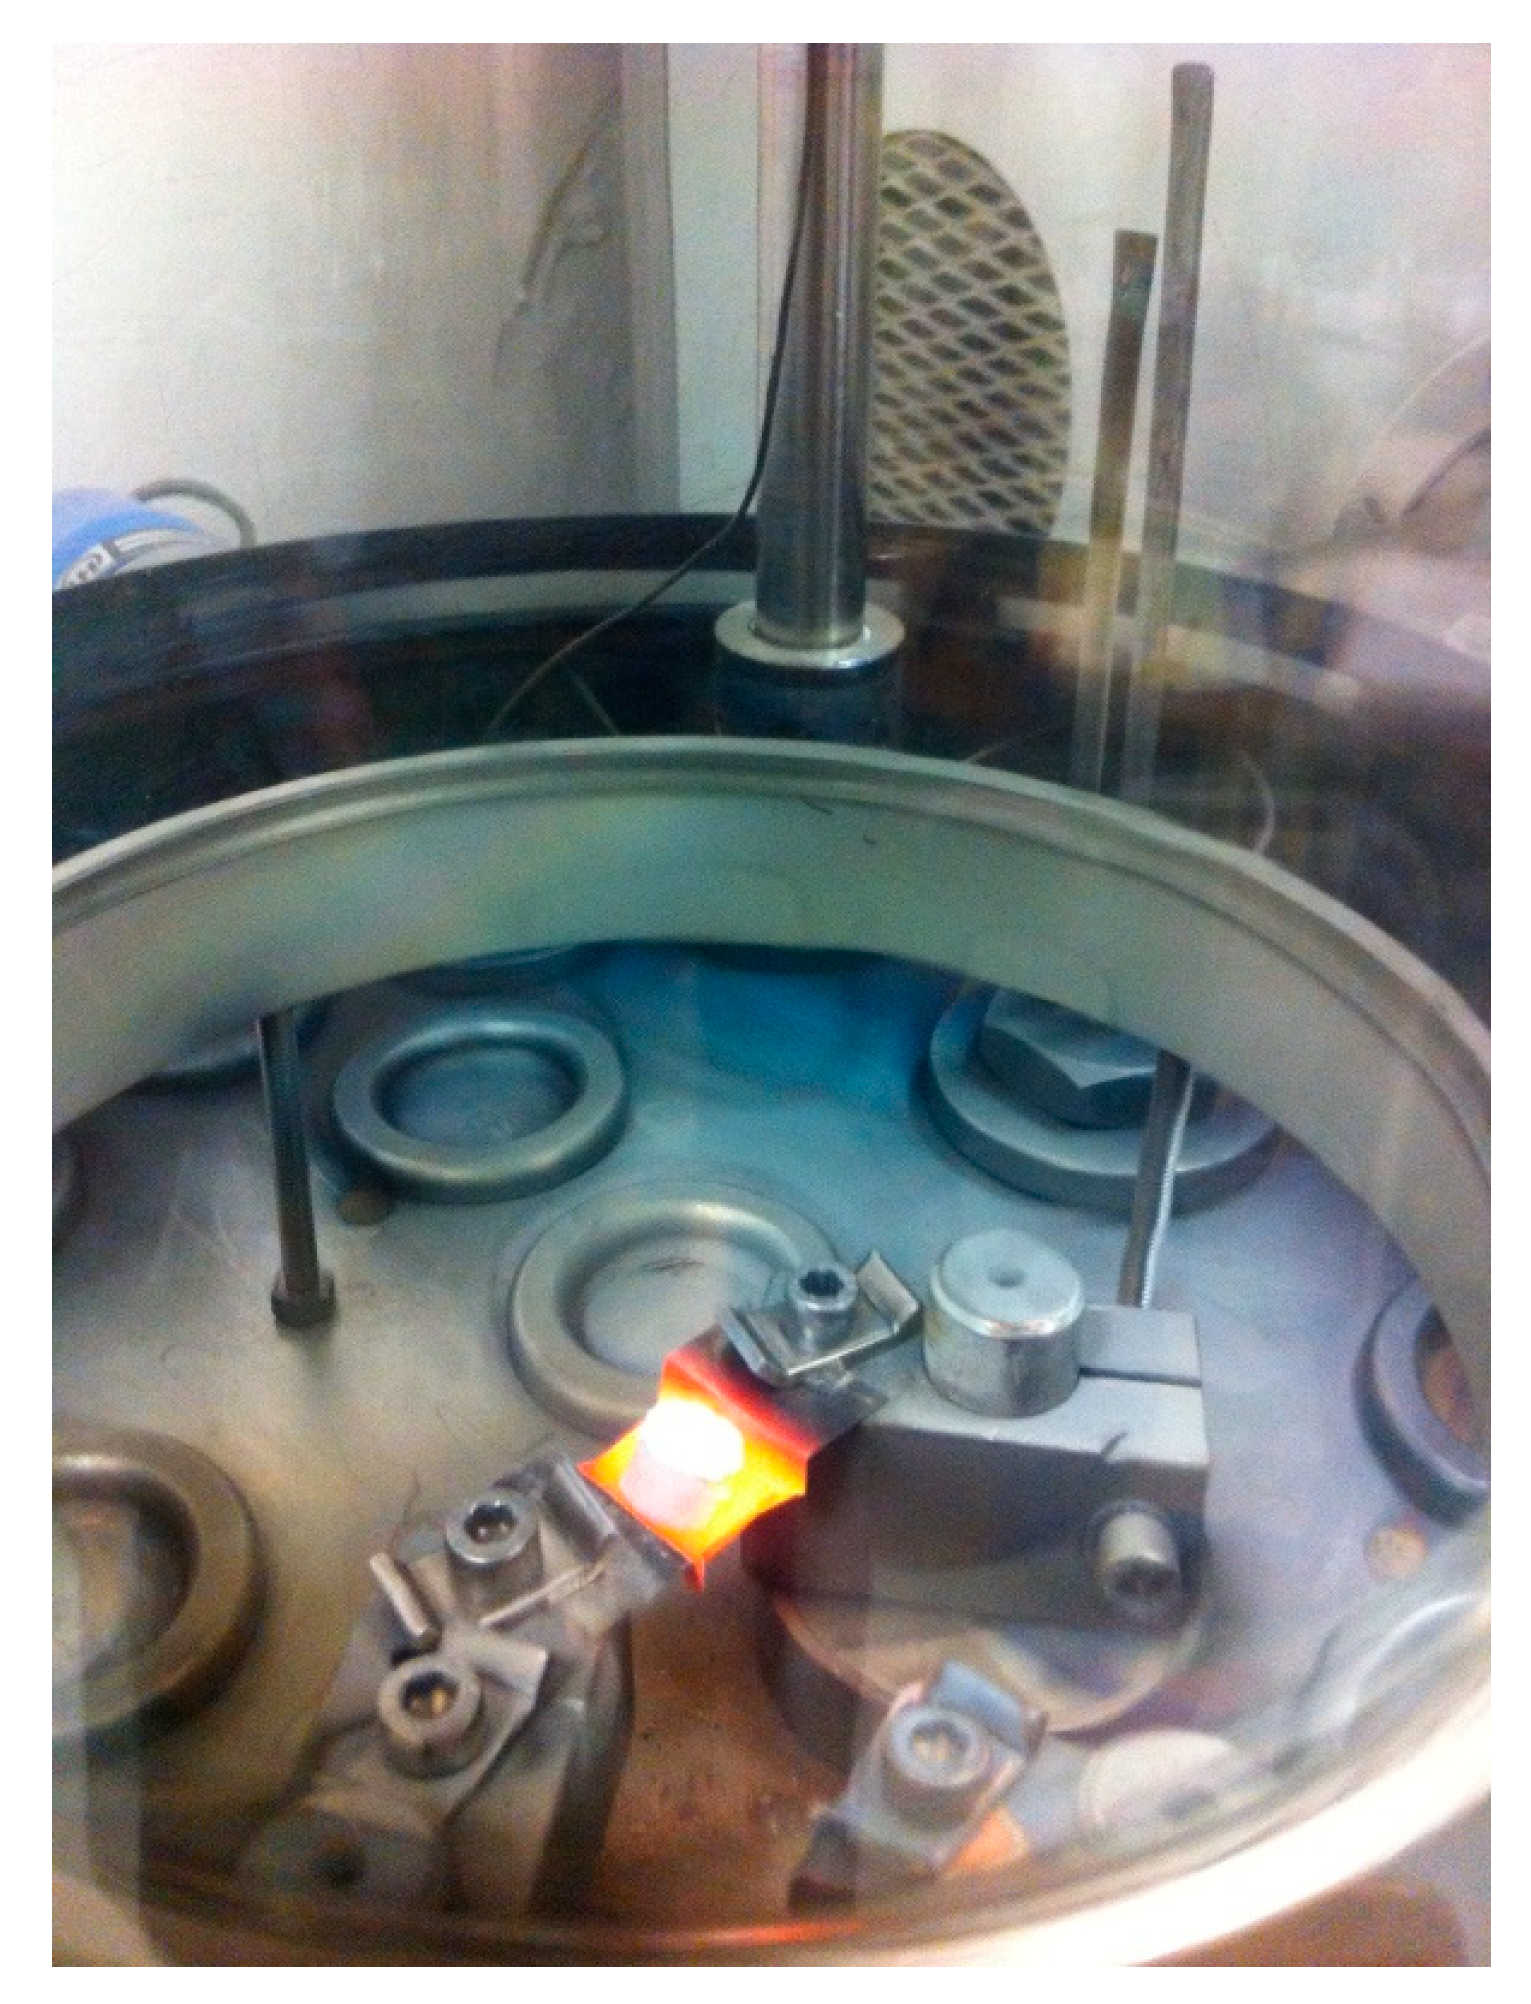
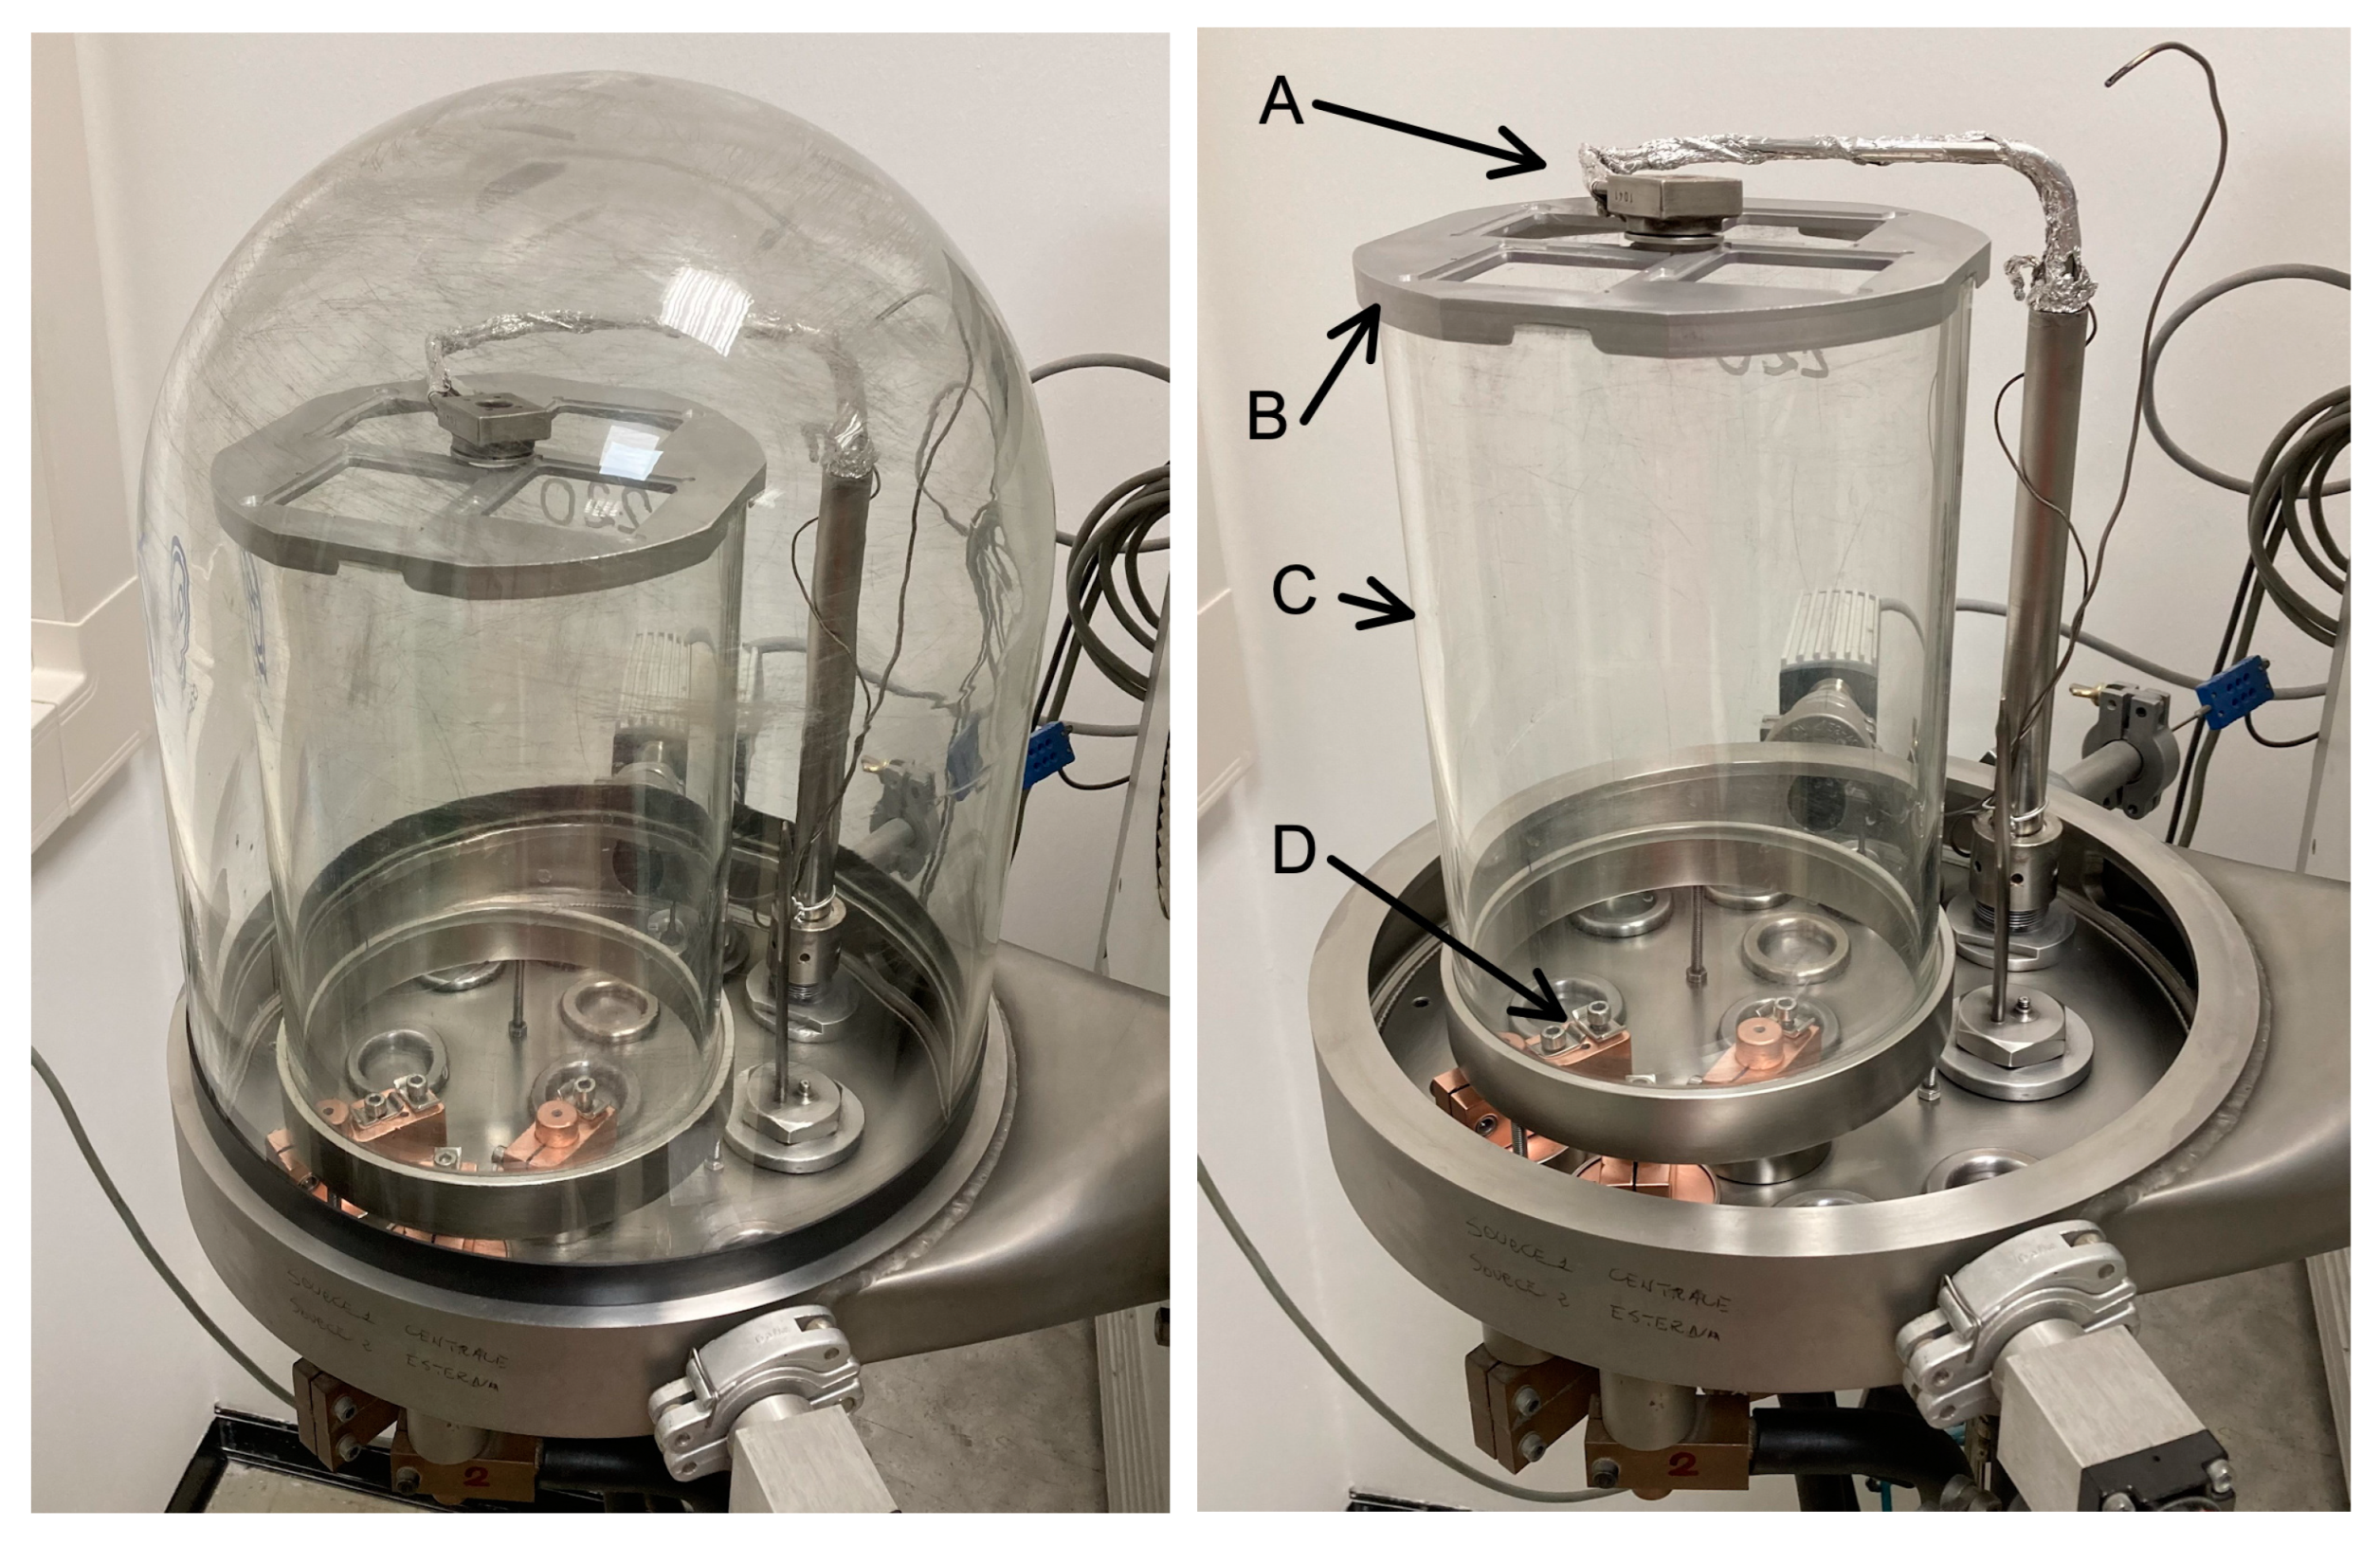
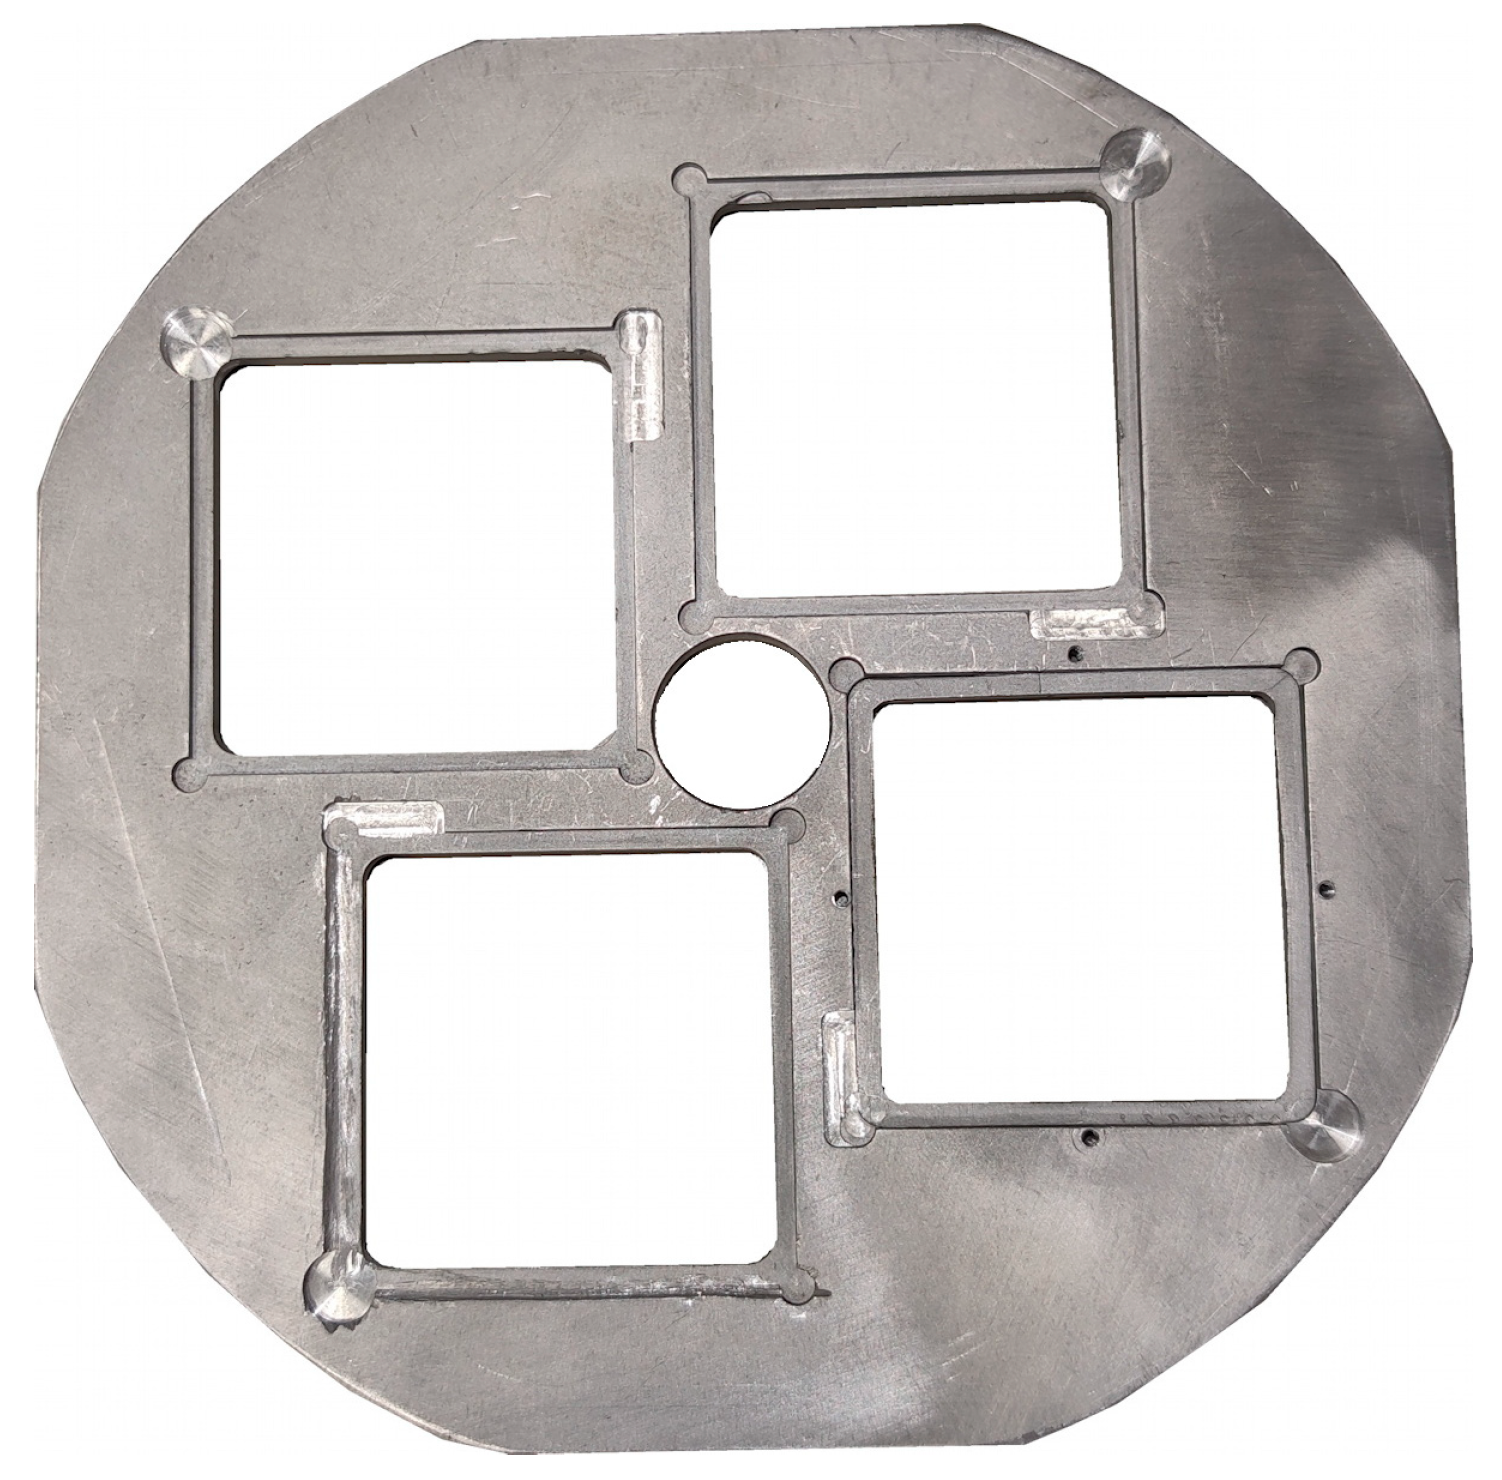
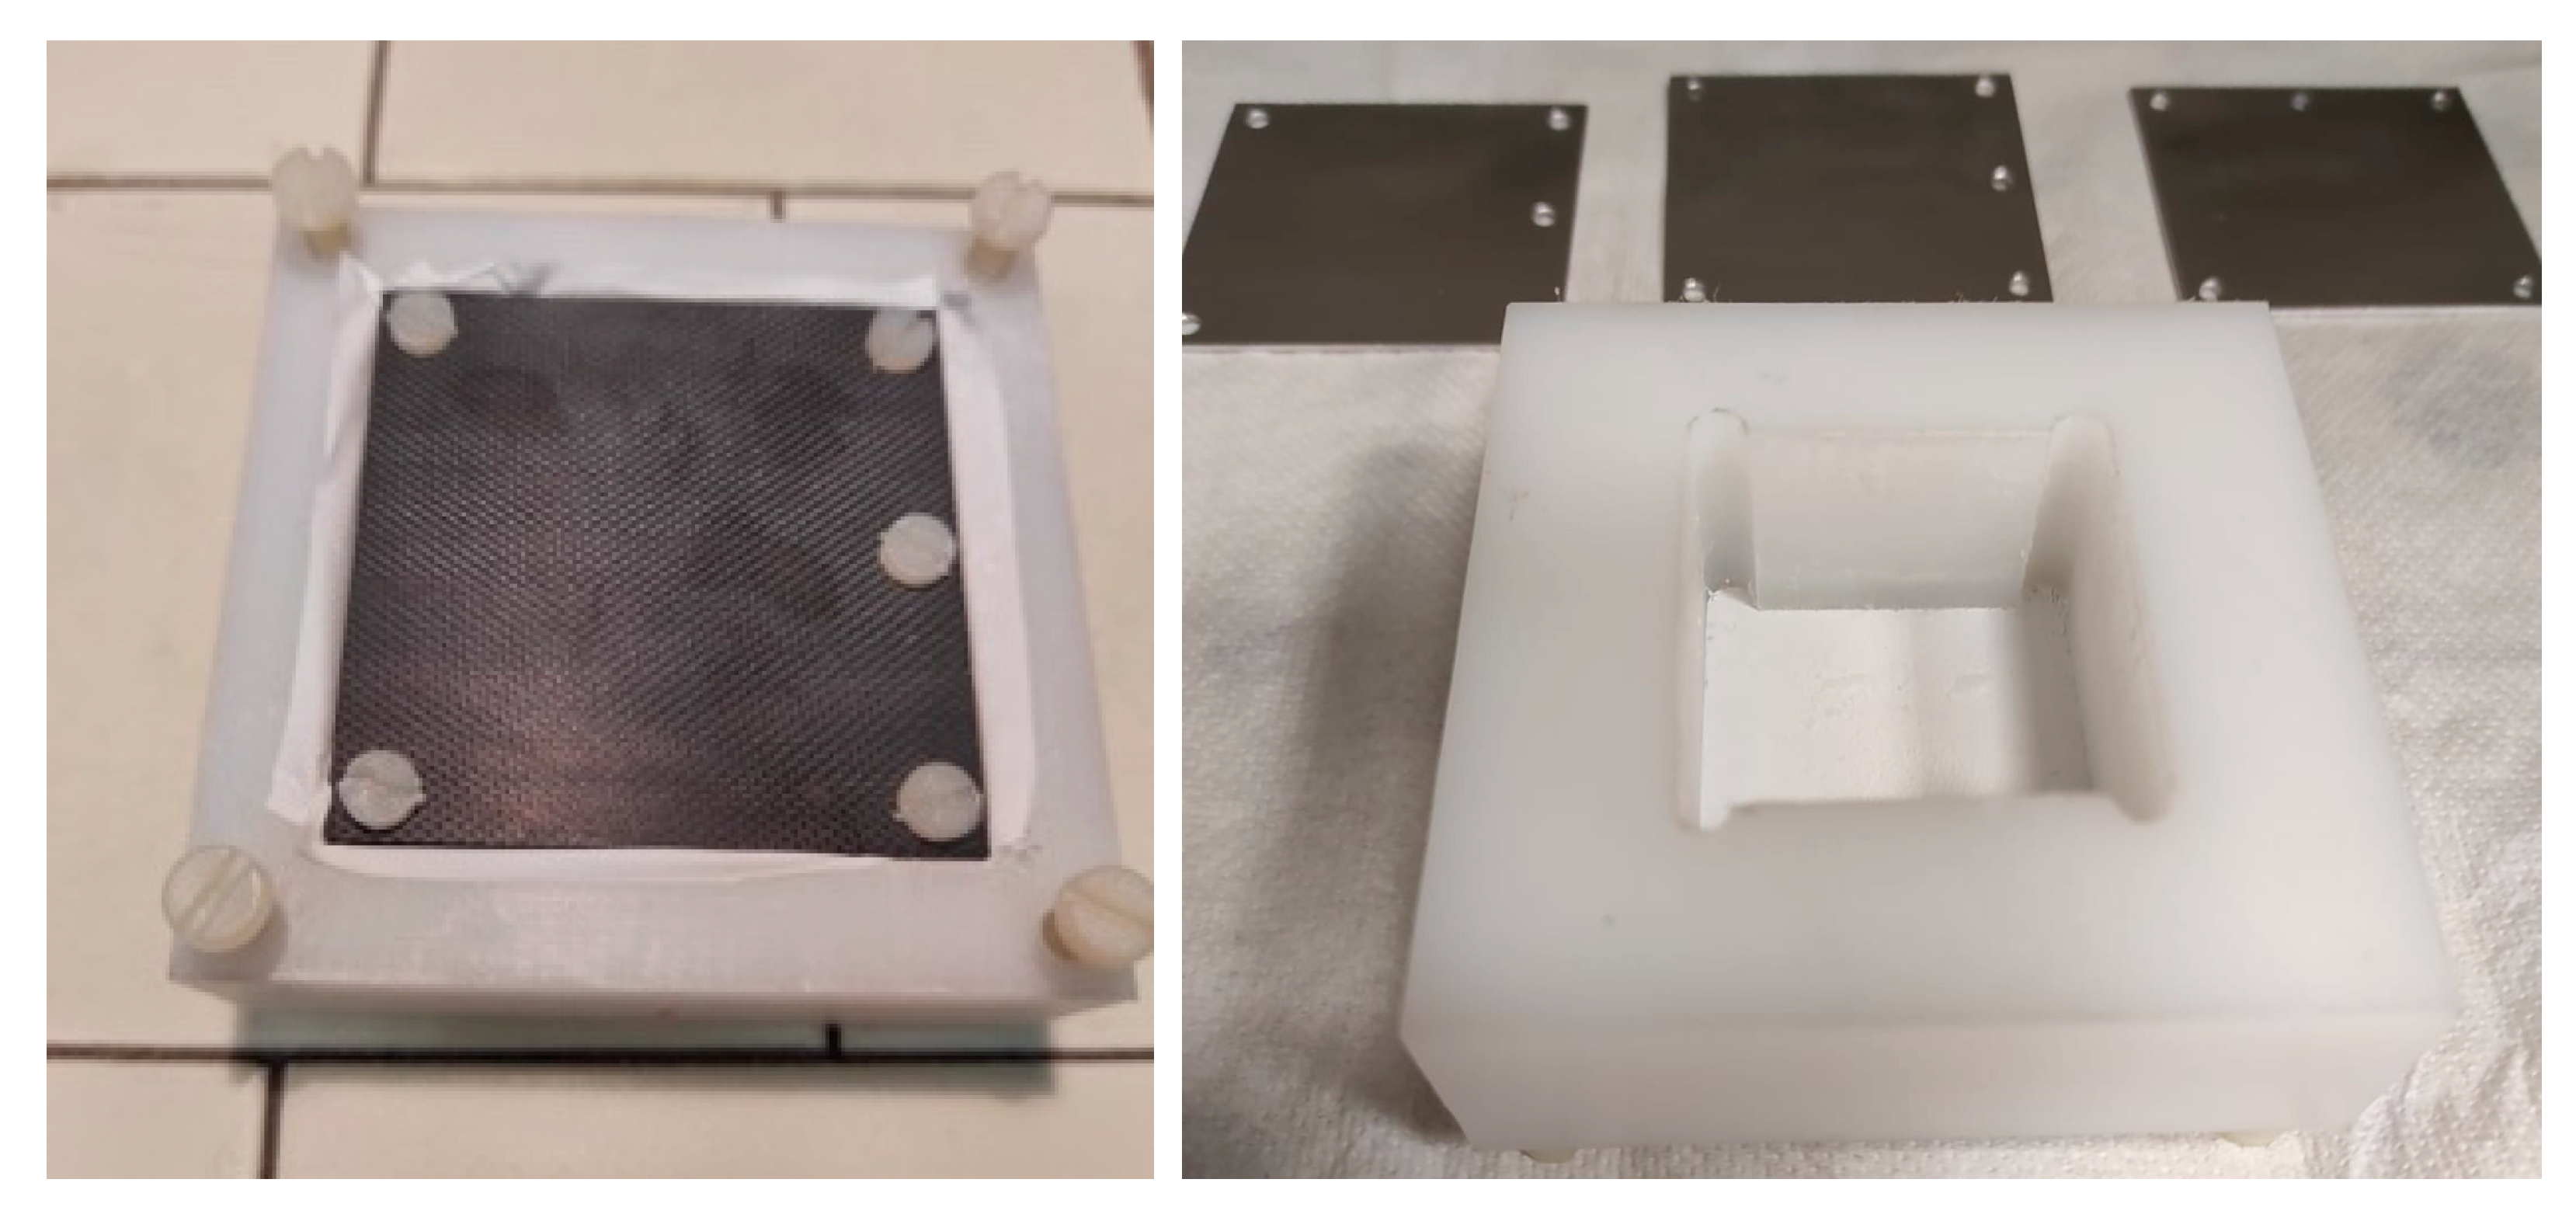
2.1. Converter Production with the Smaller Evaporator
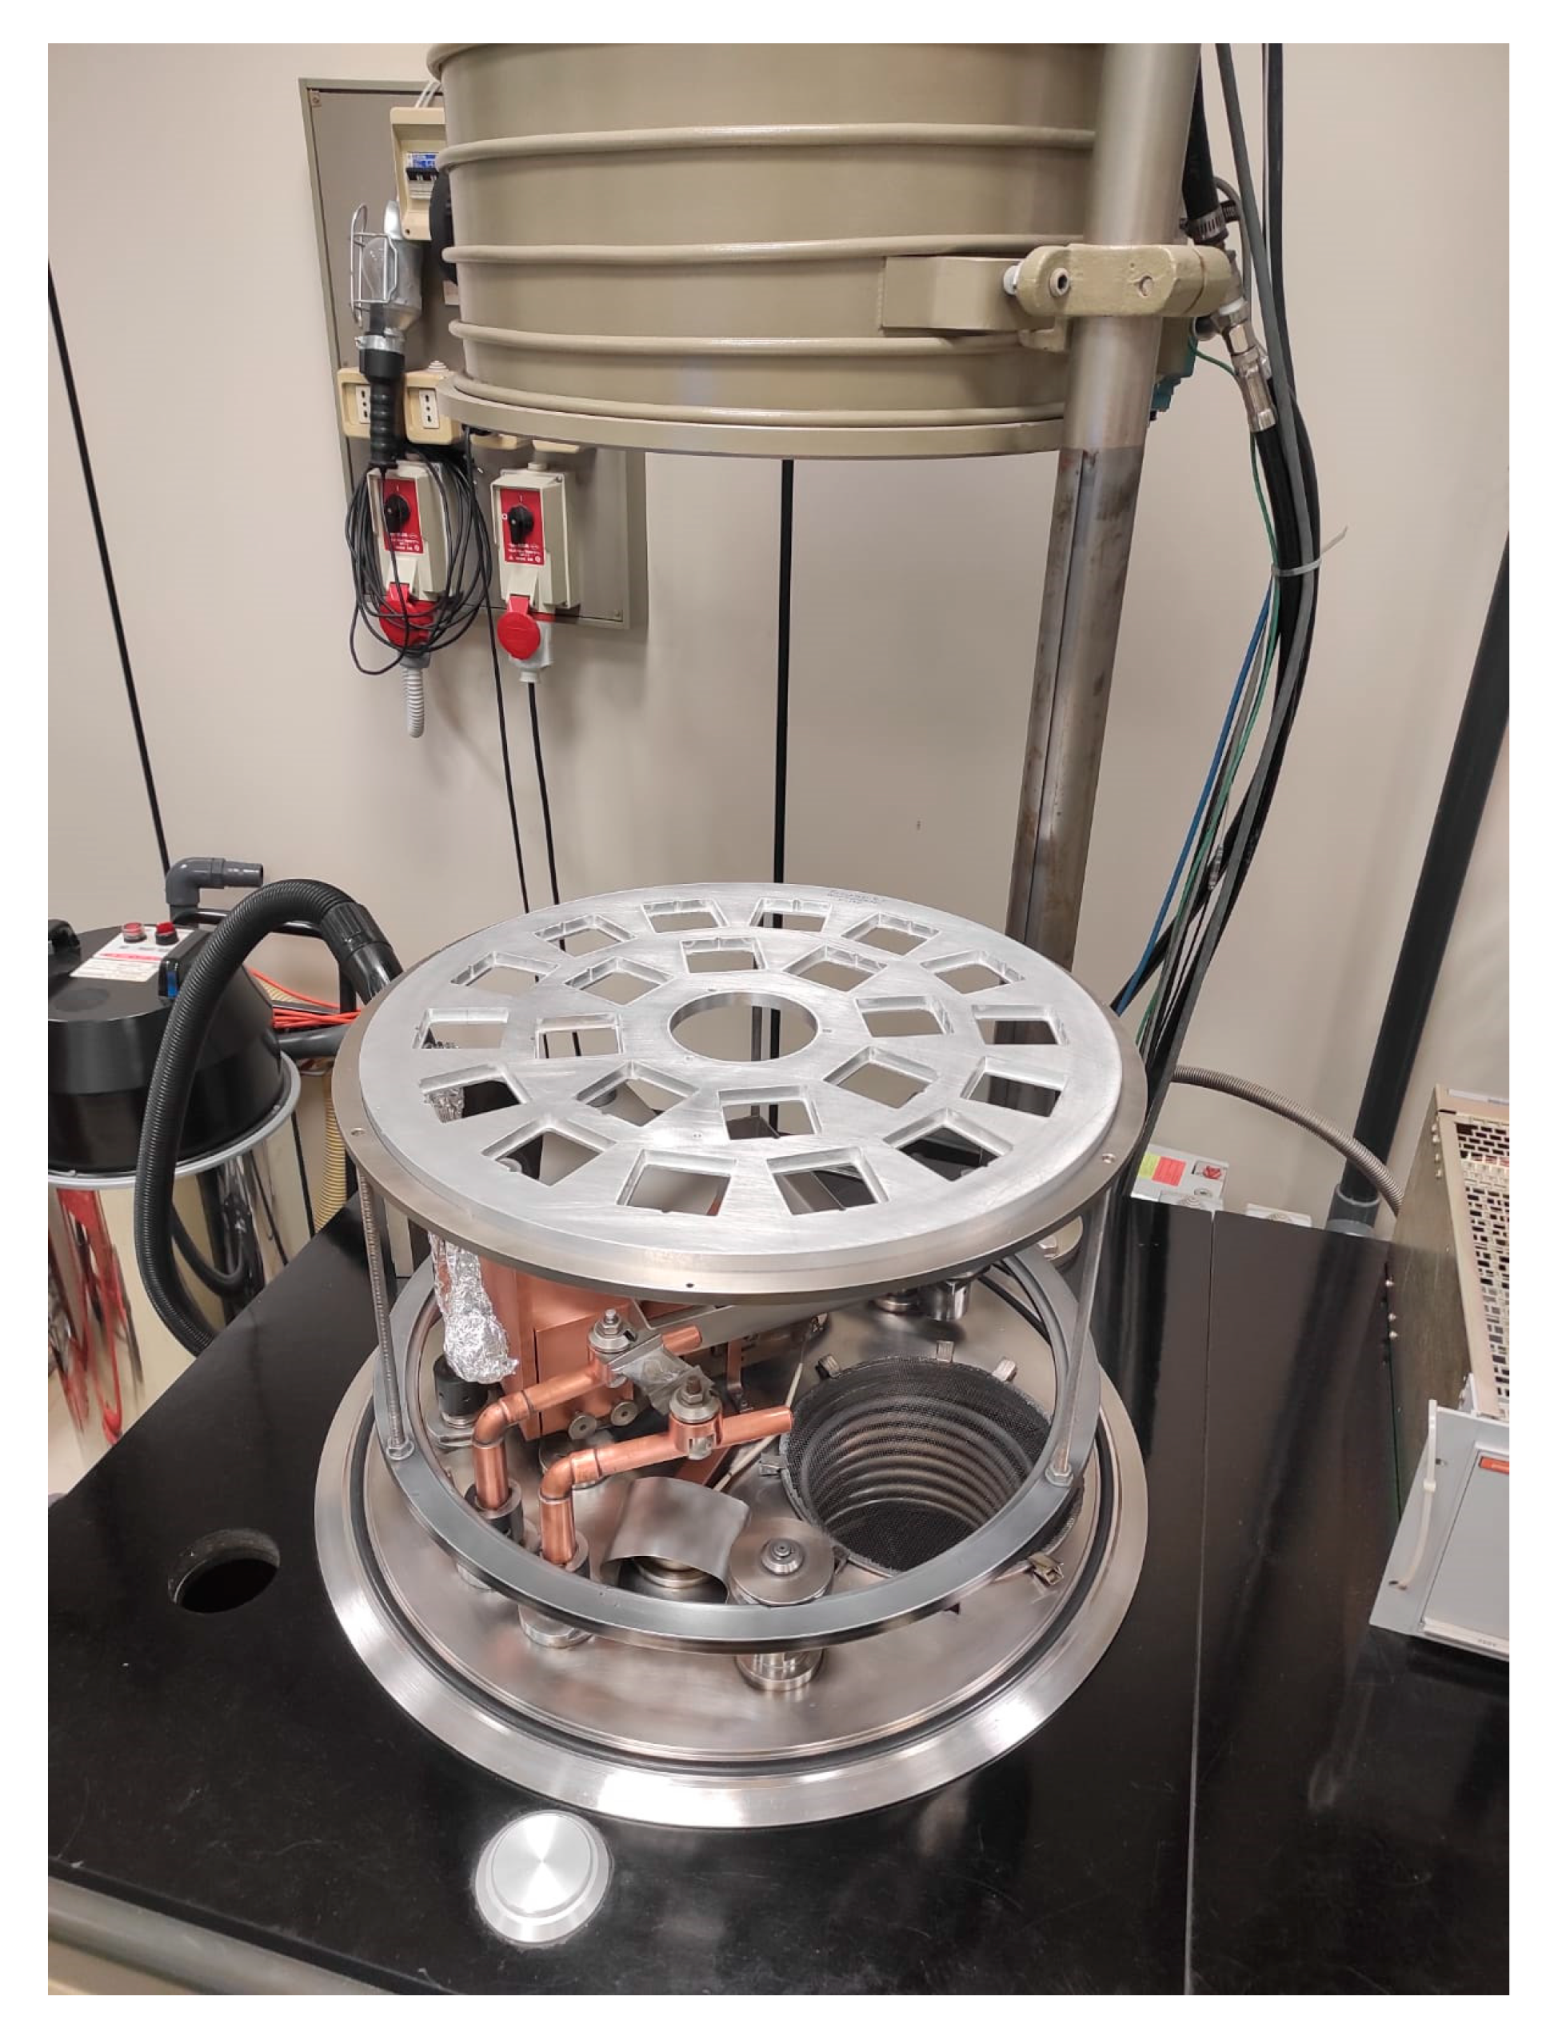
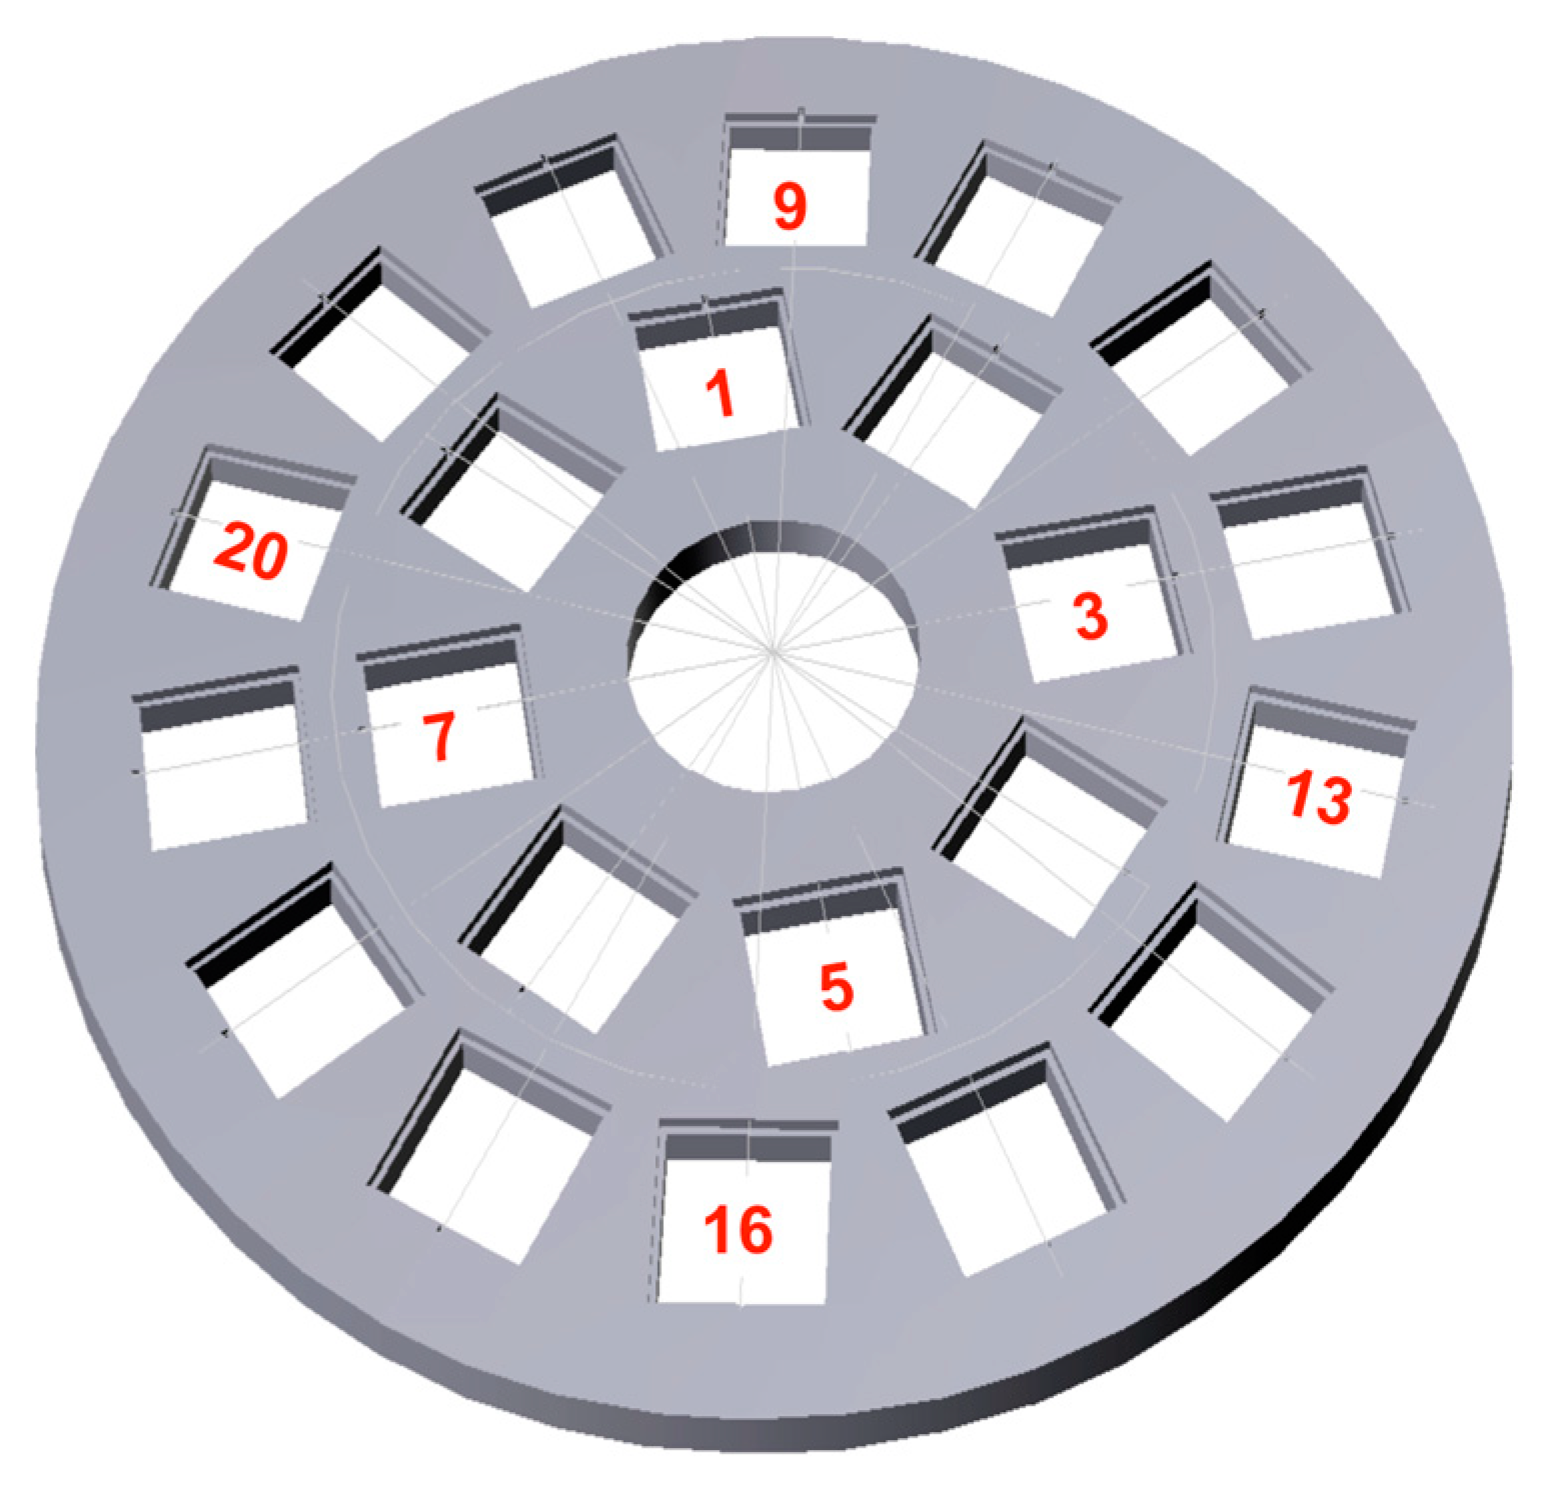
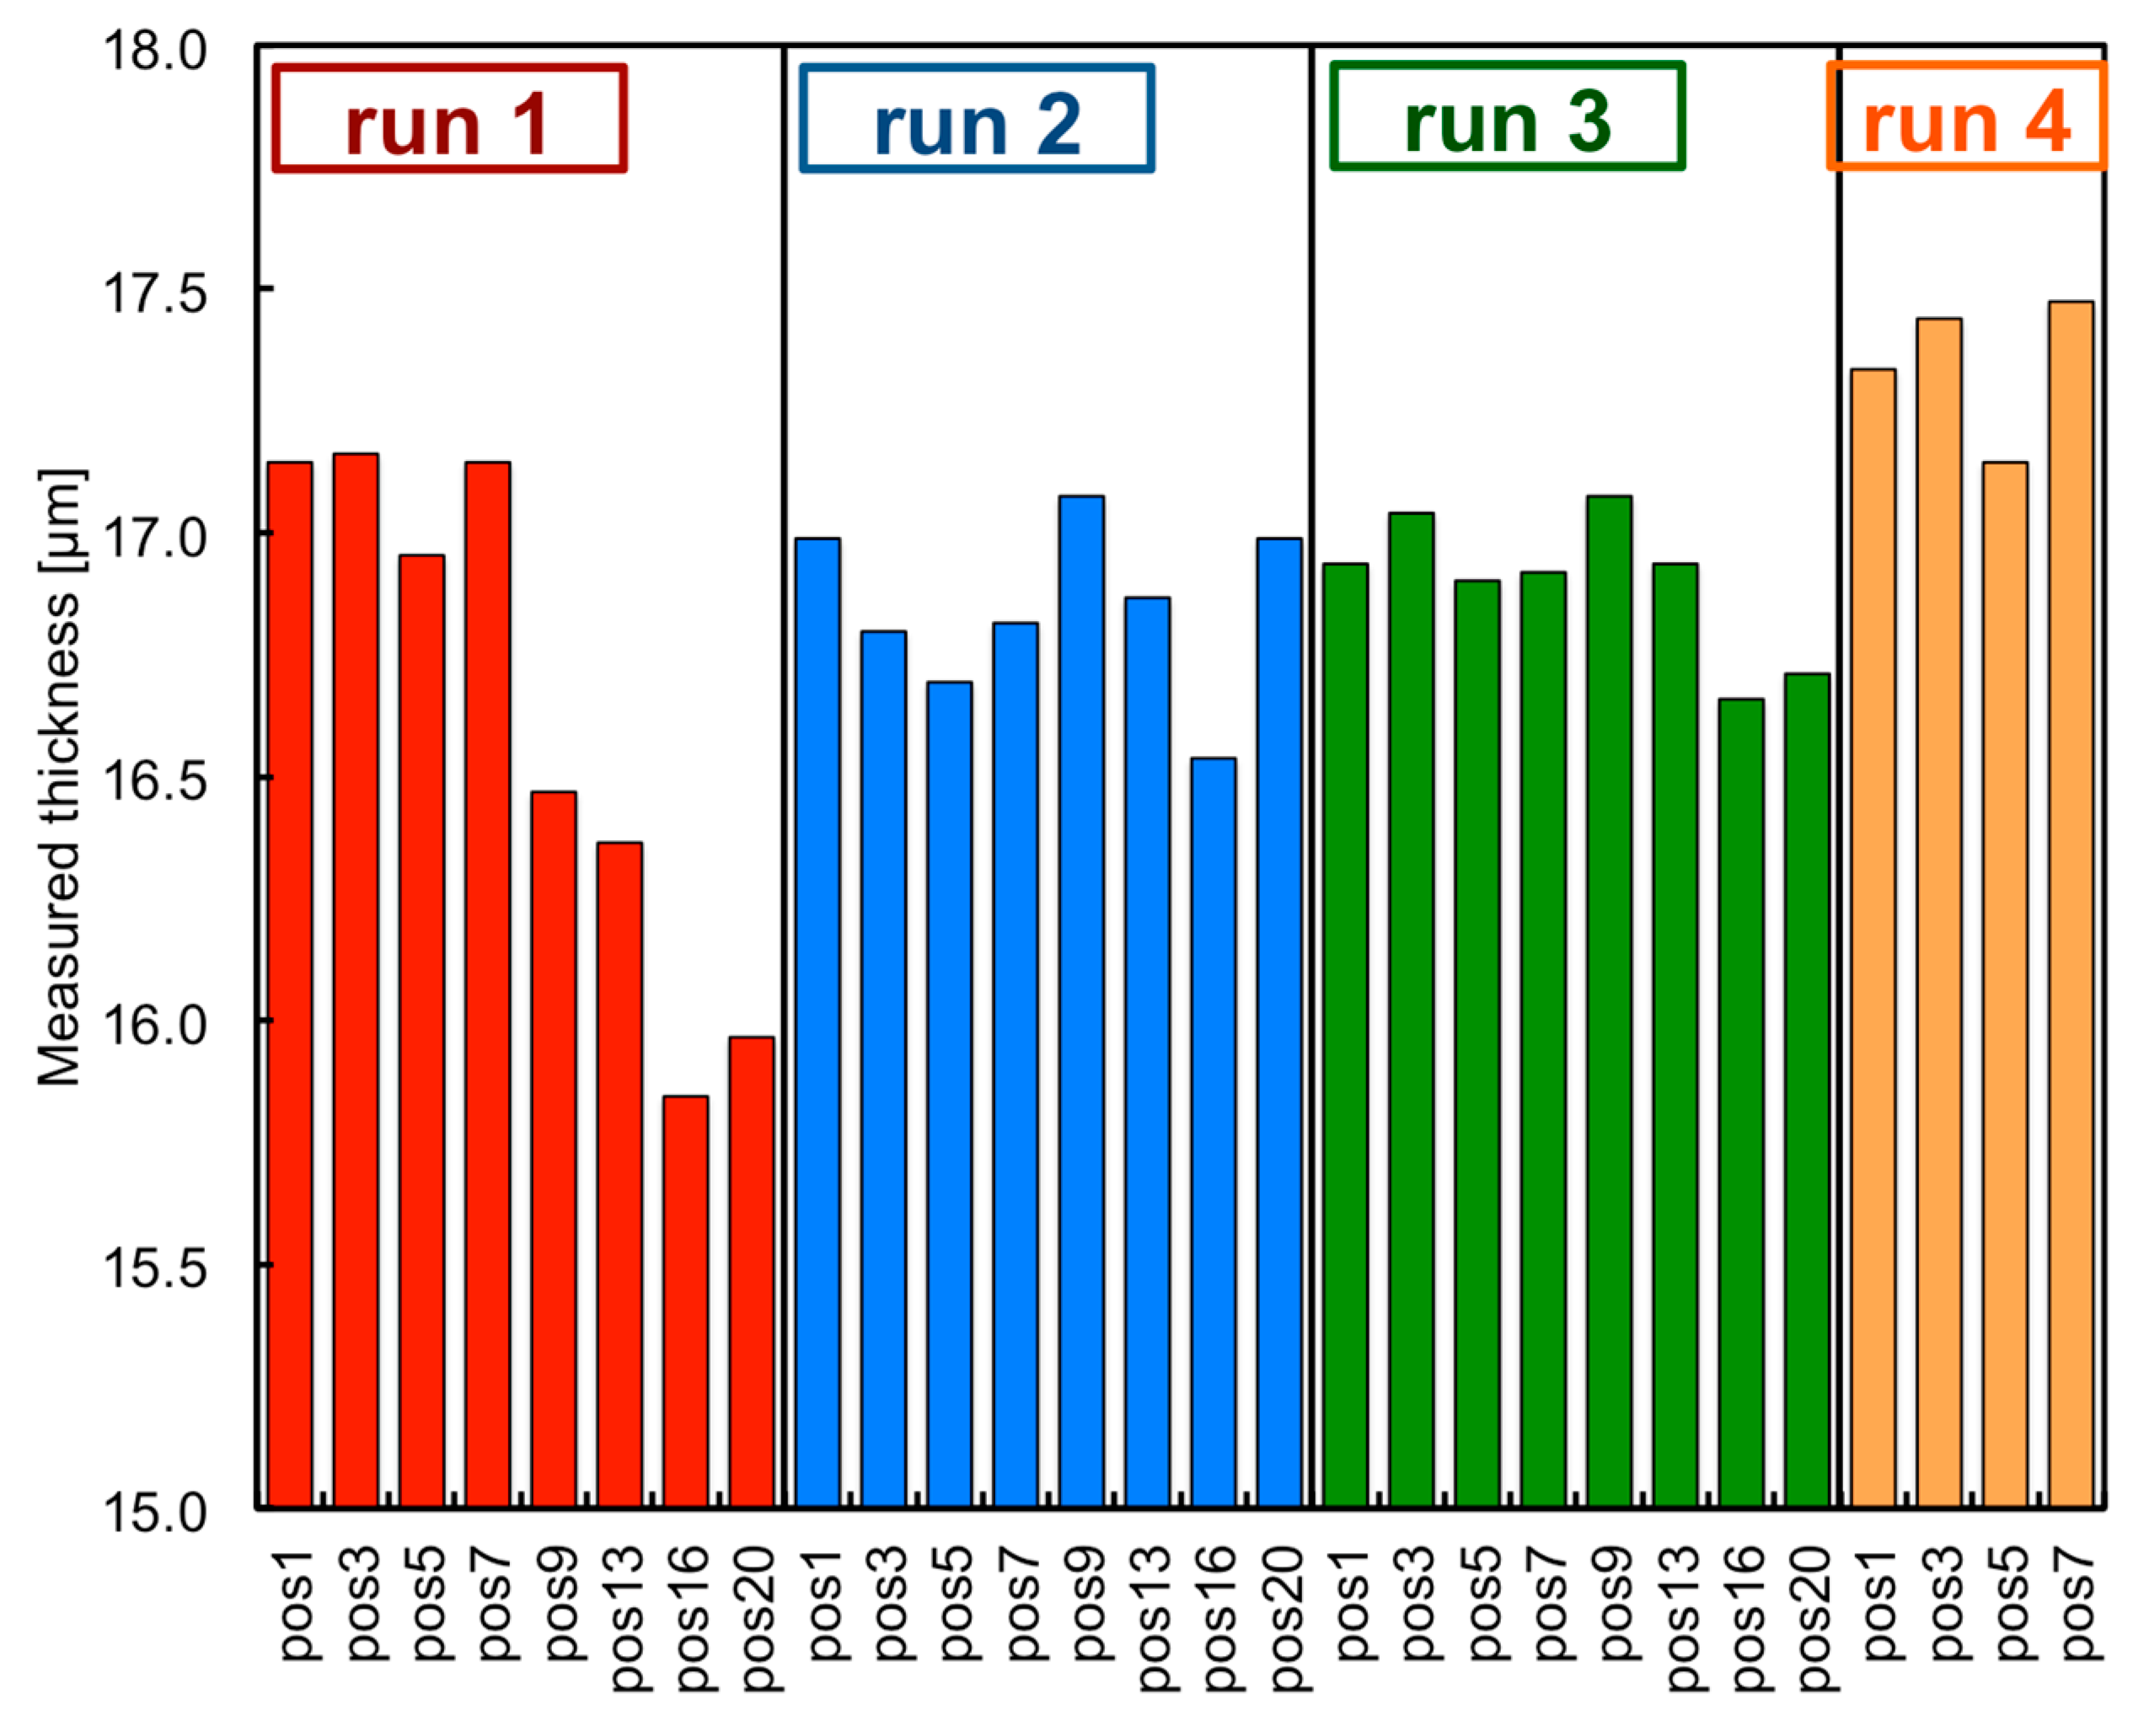
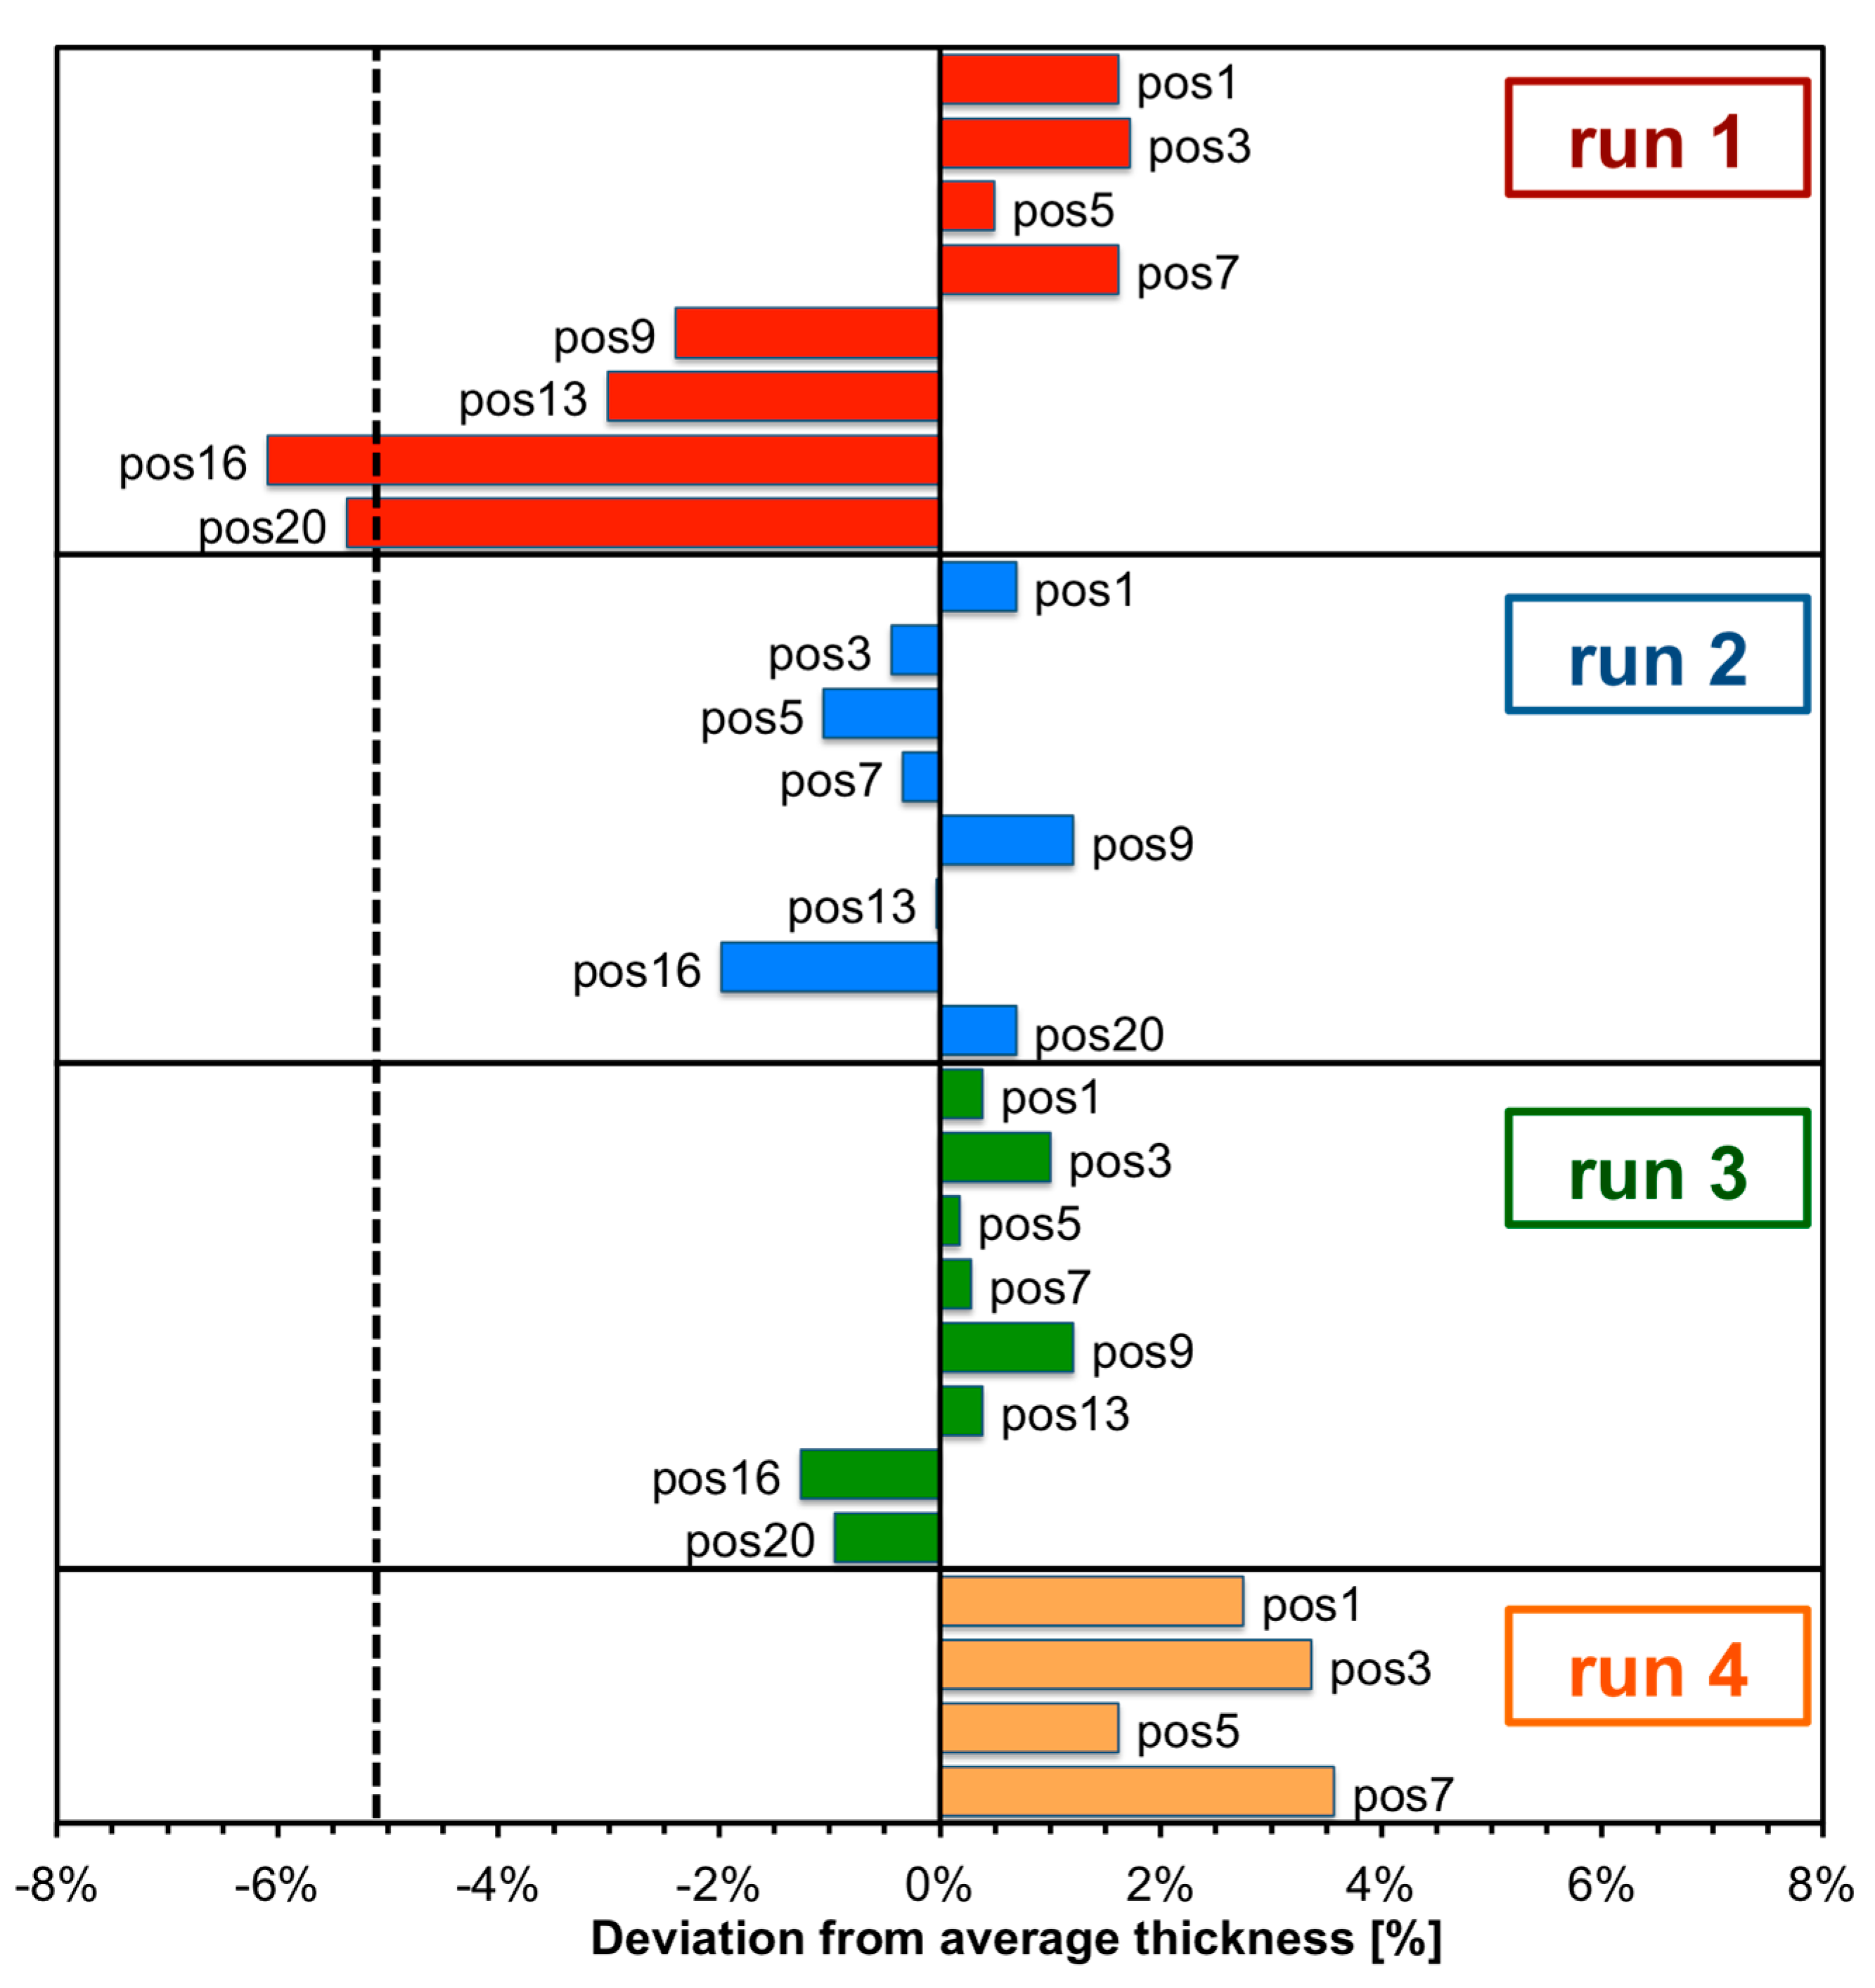
2.2. Converter Production with the Larger Evaporator
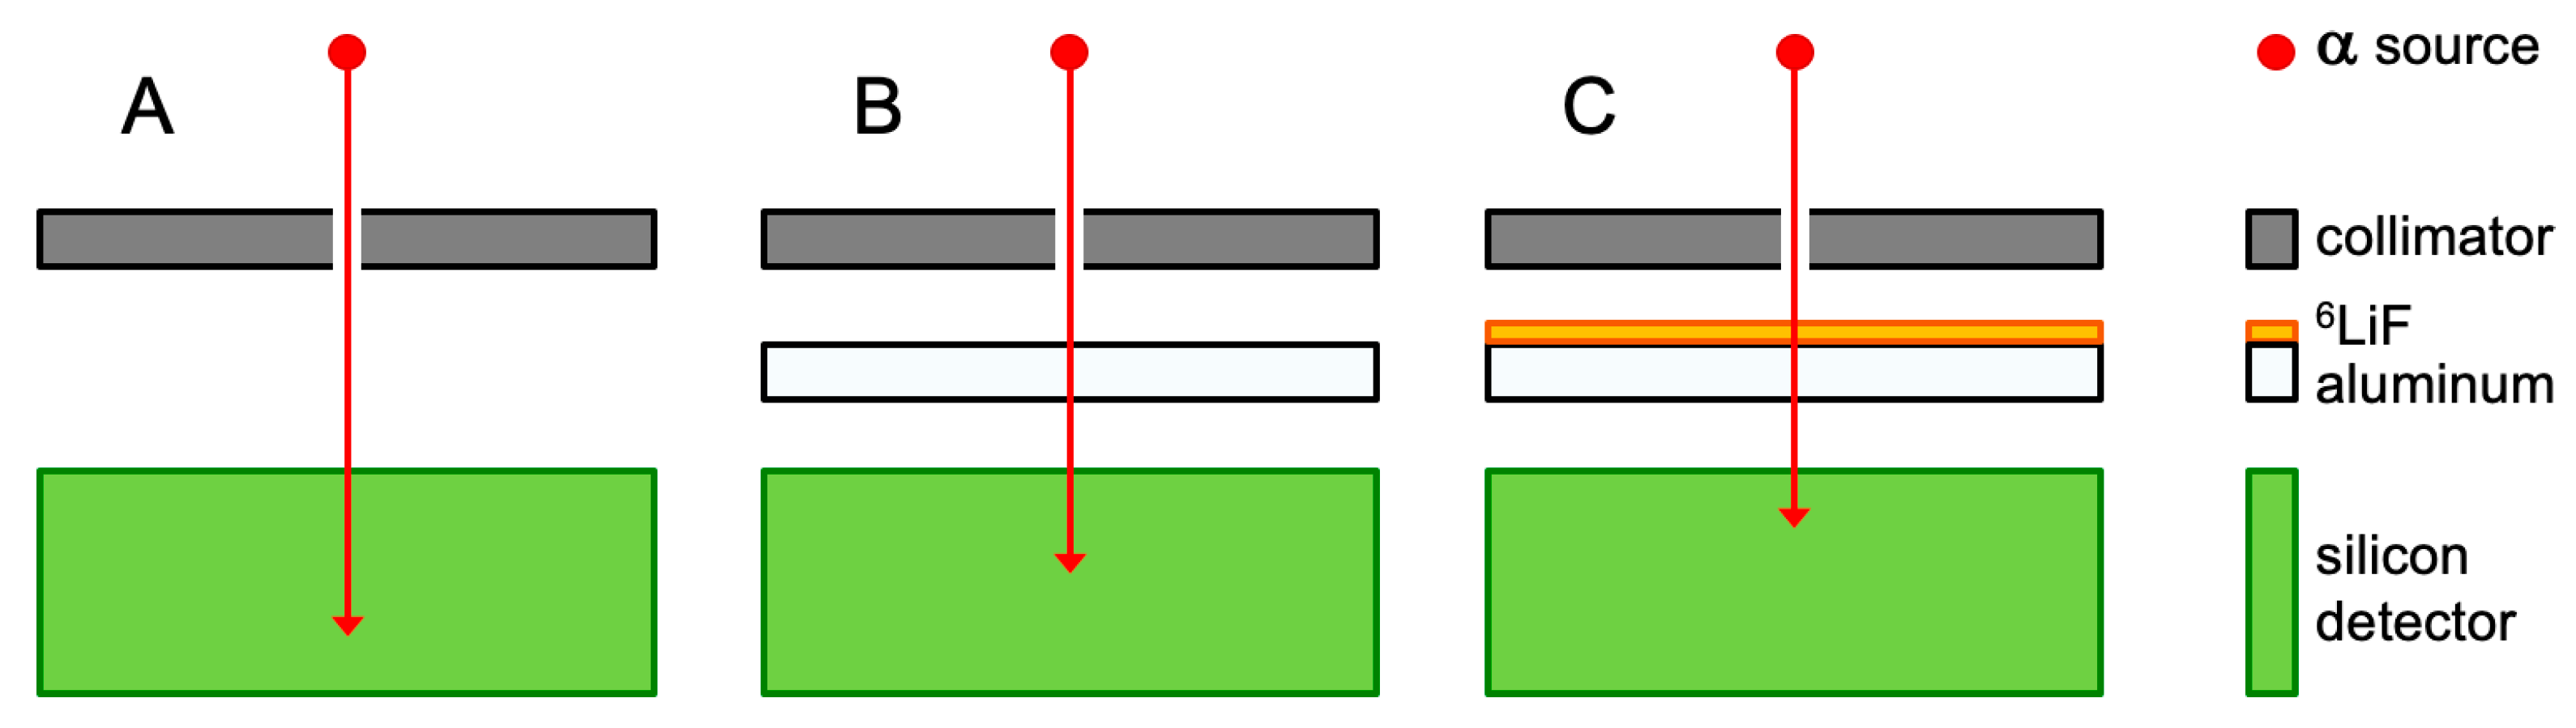
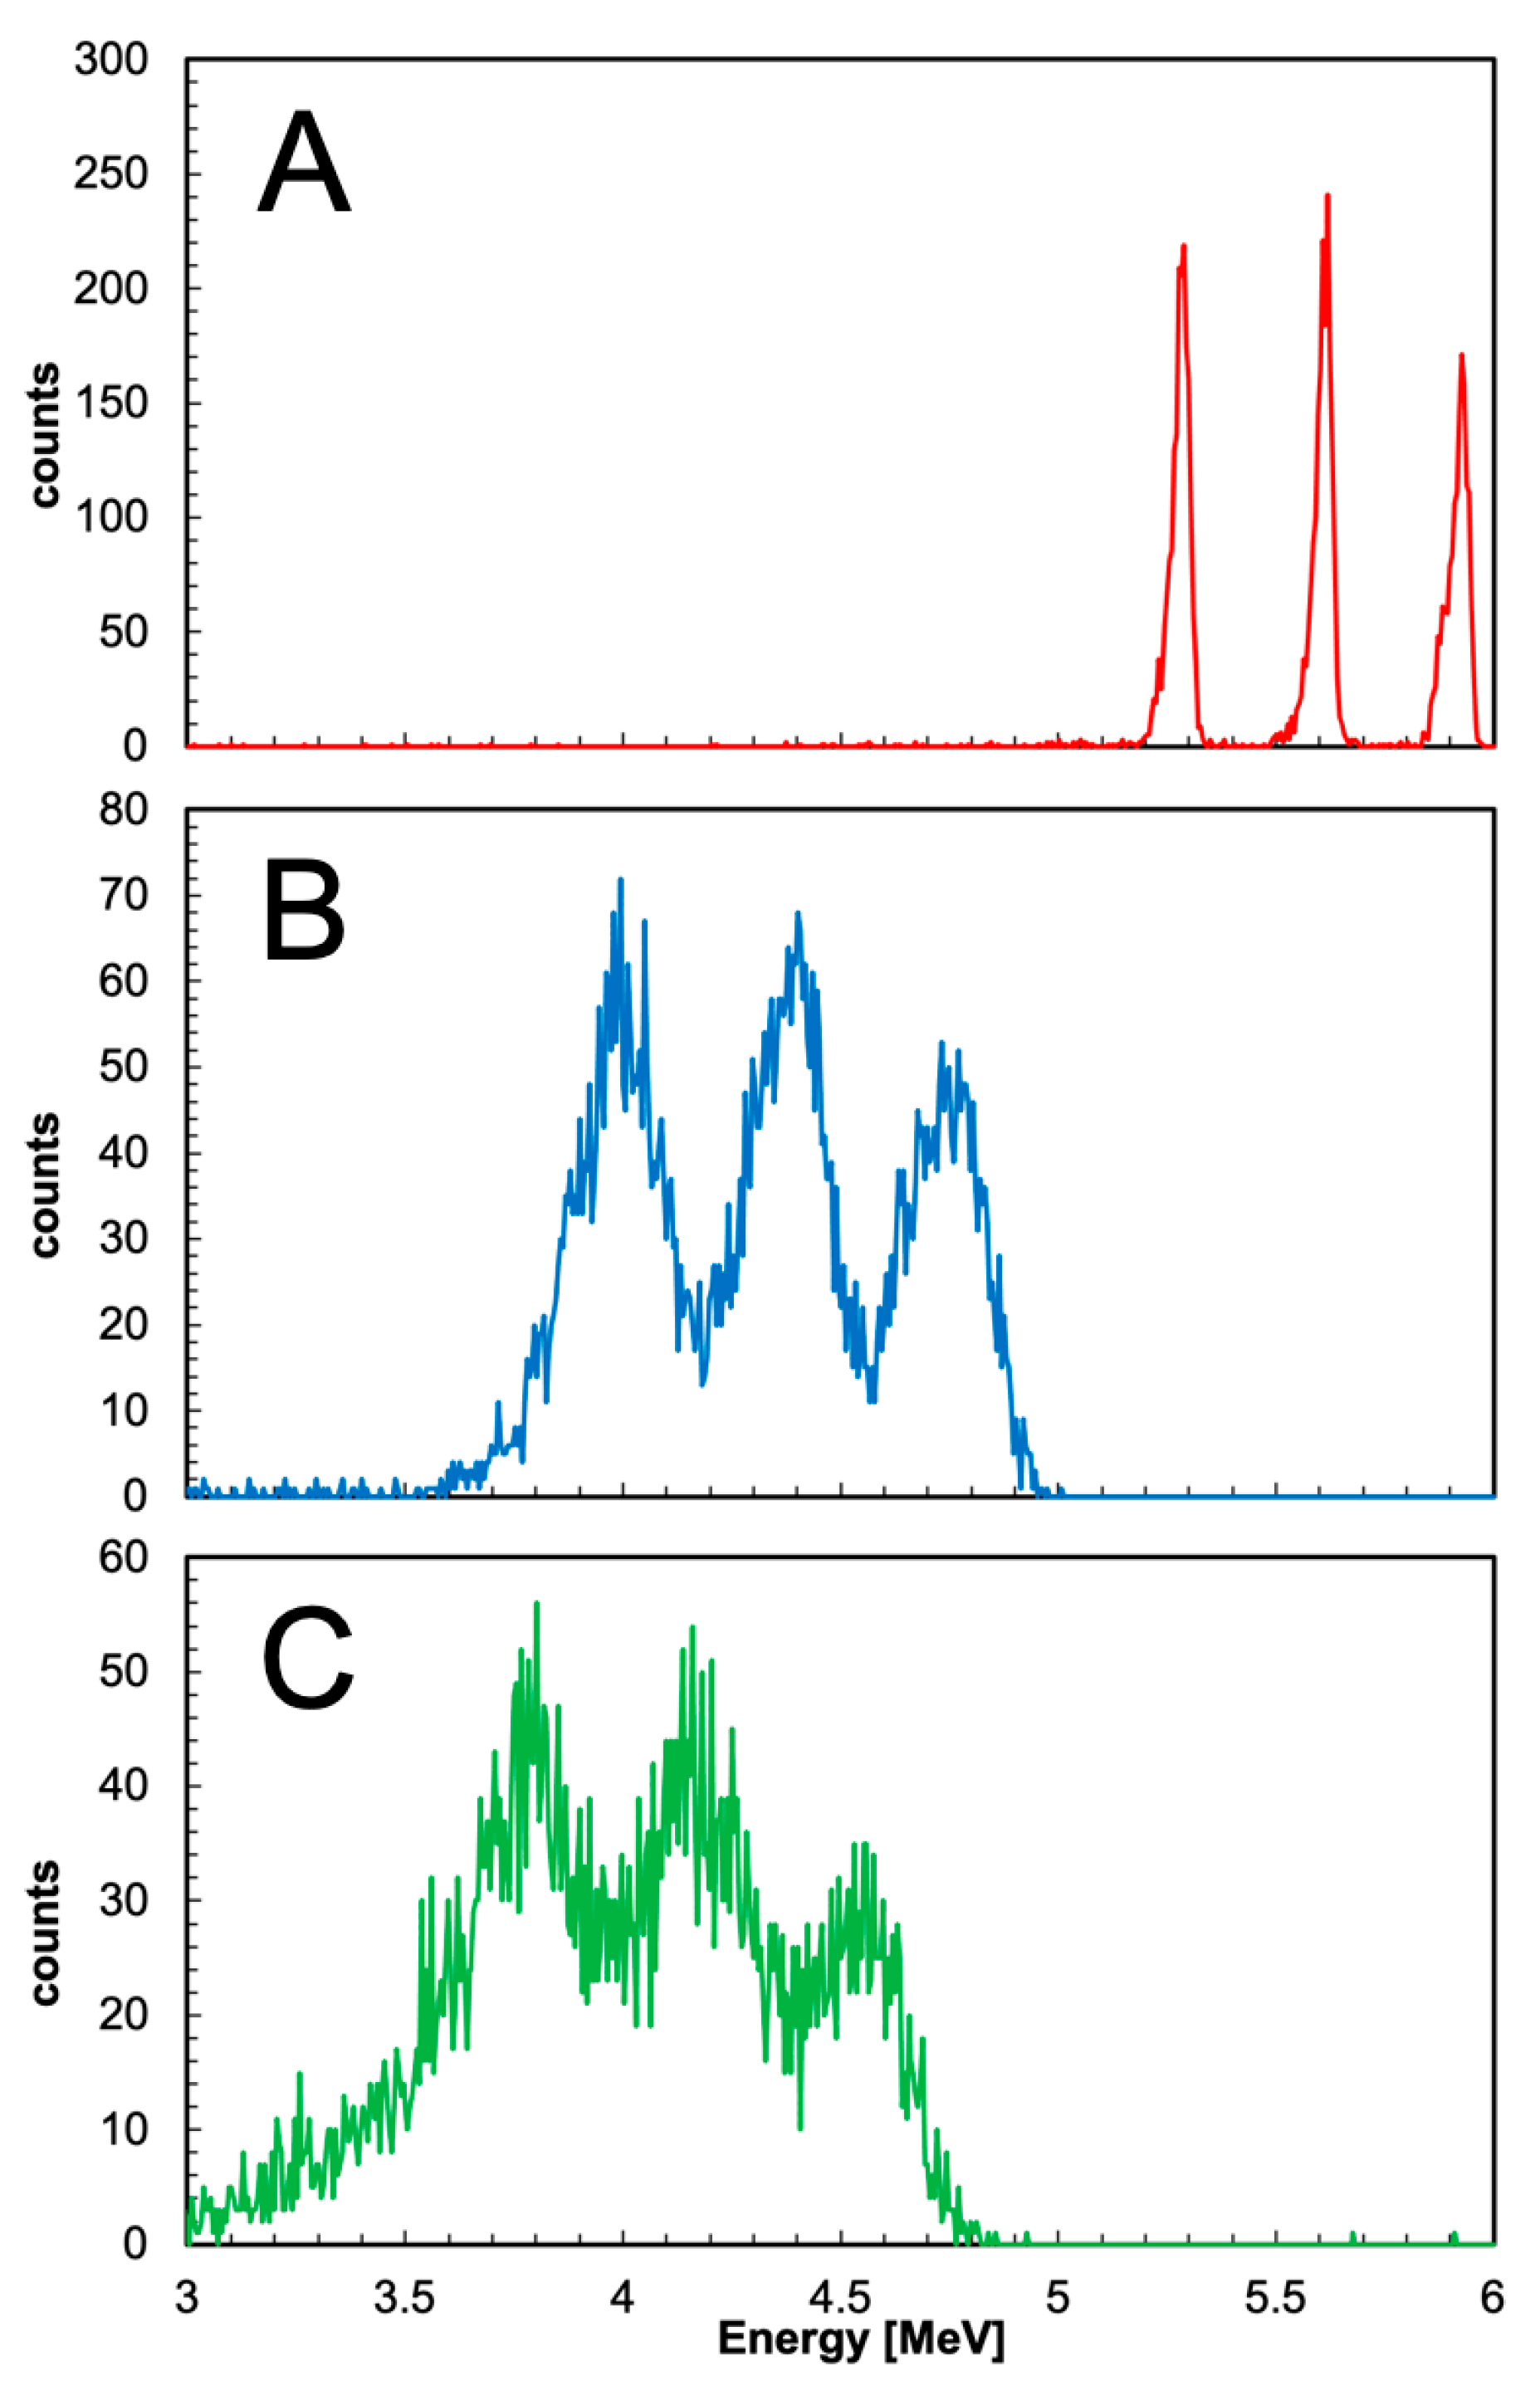
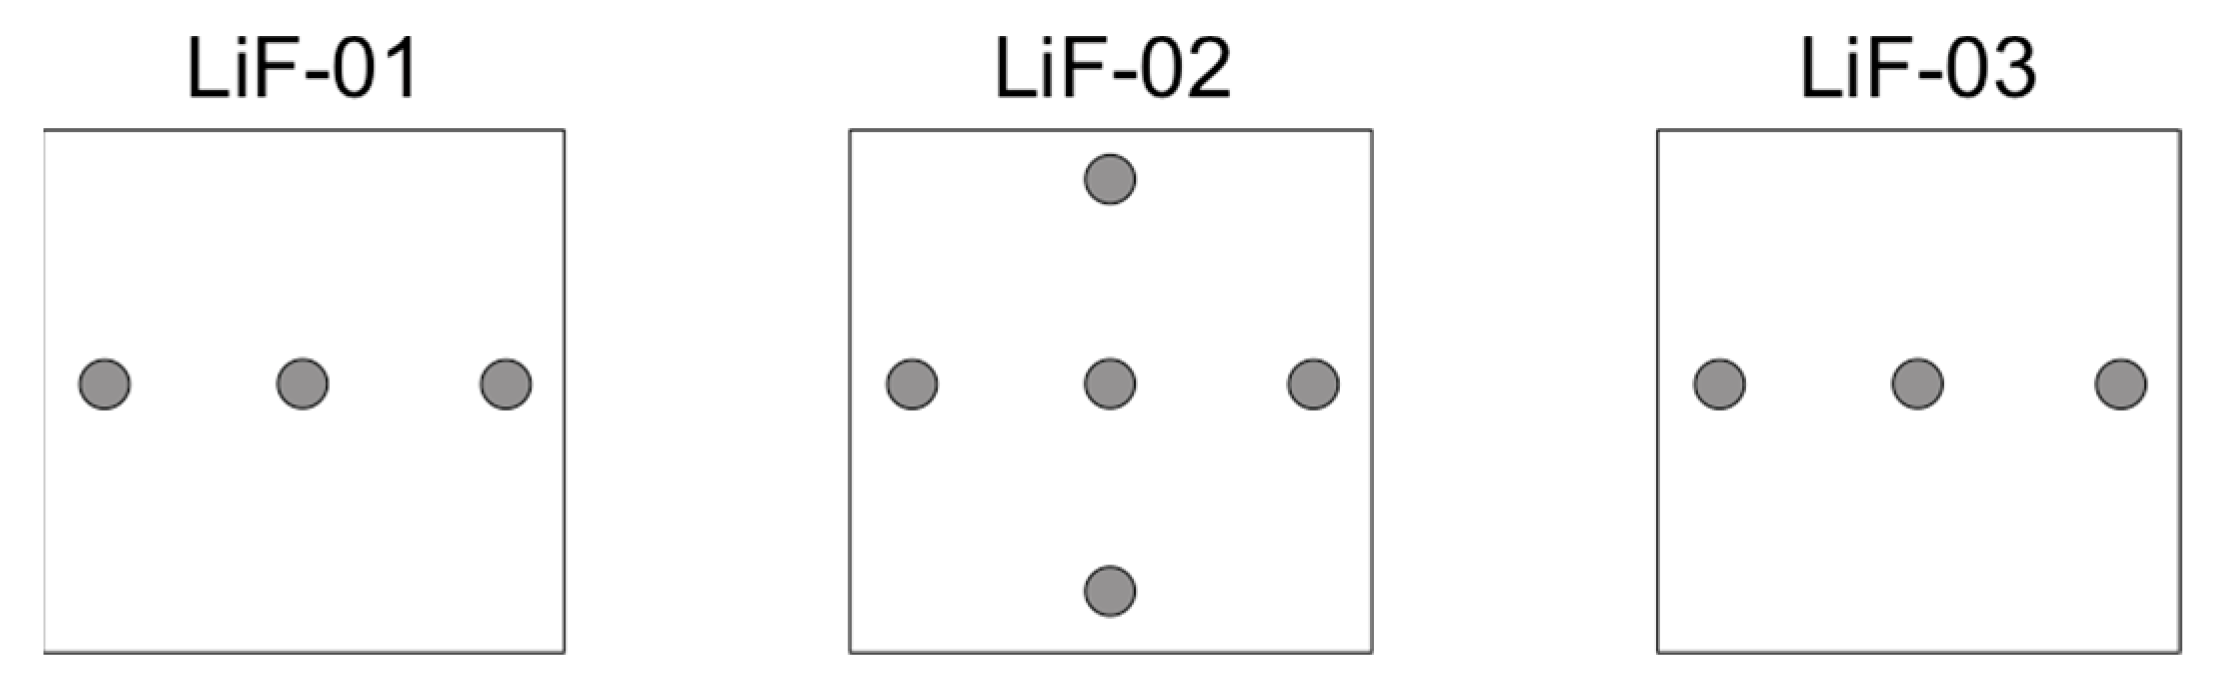
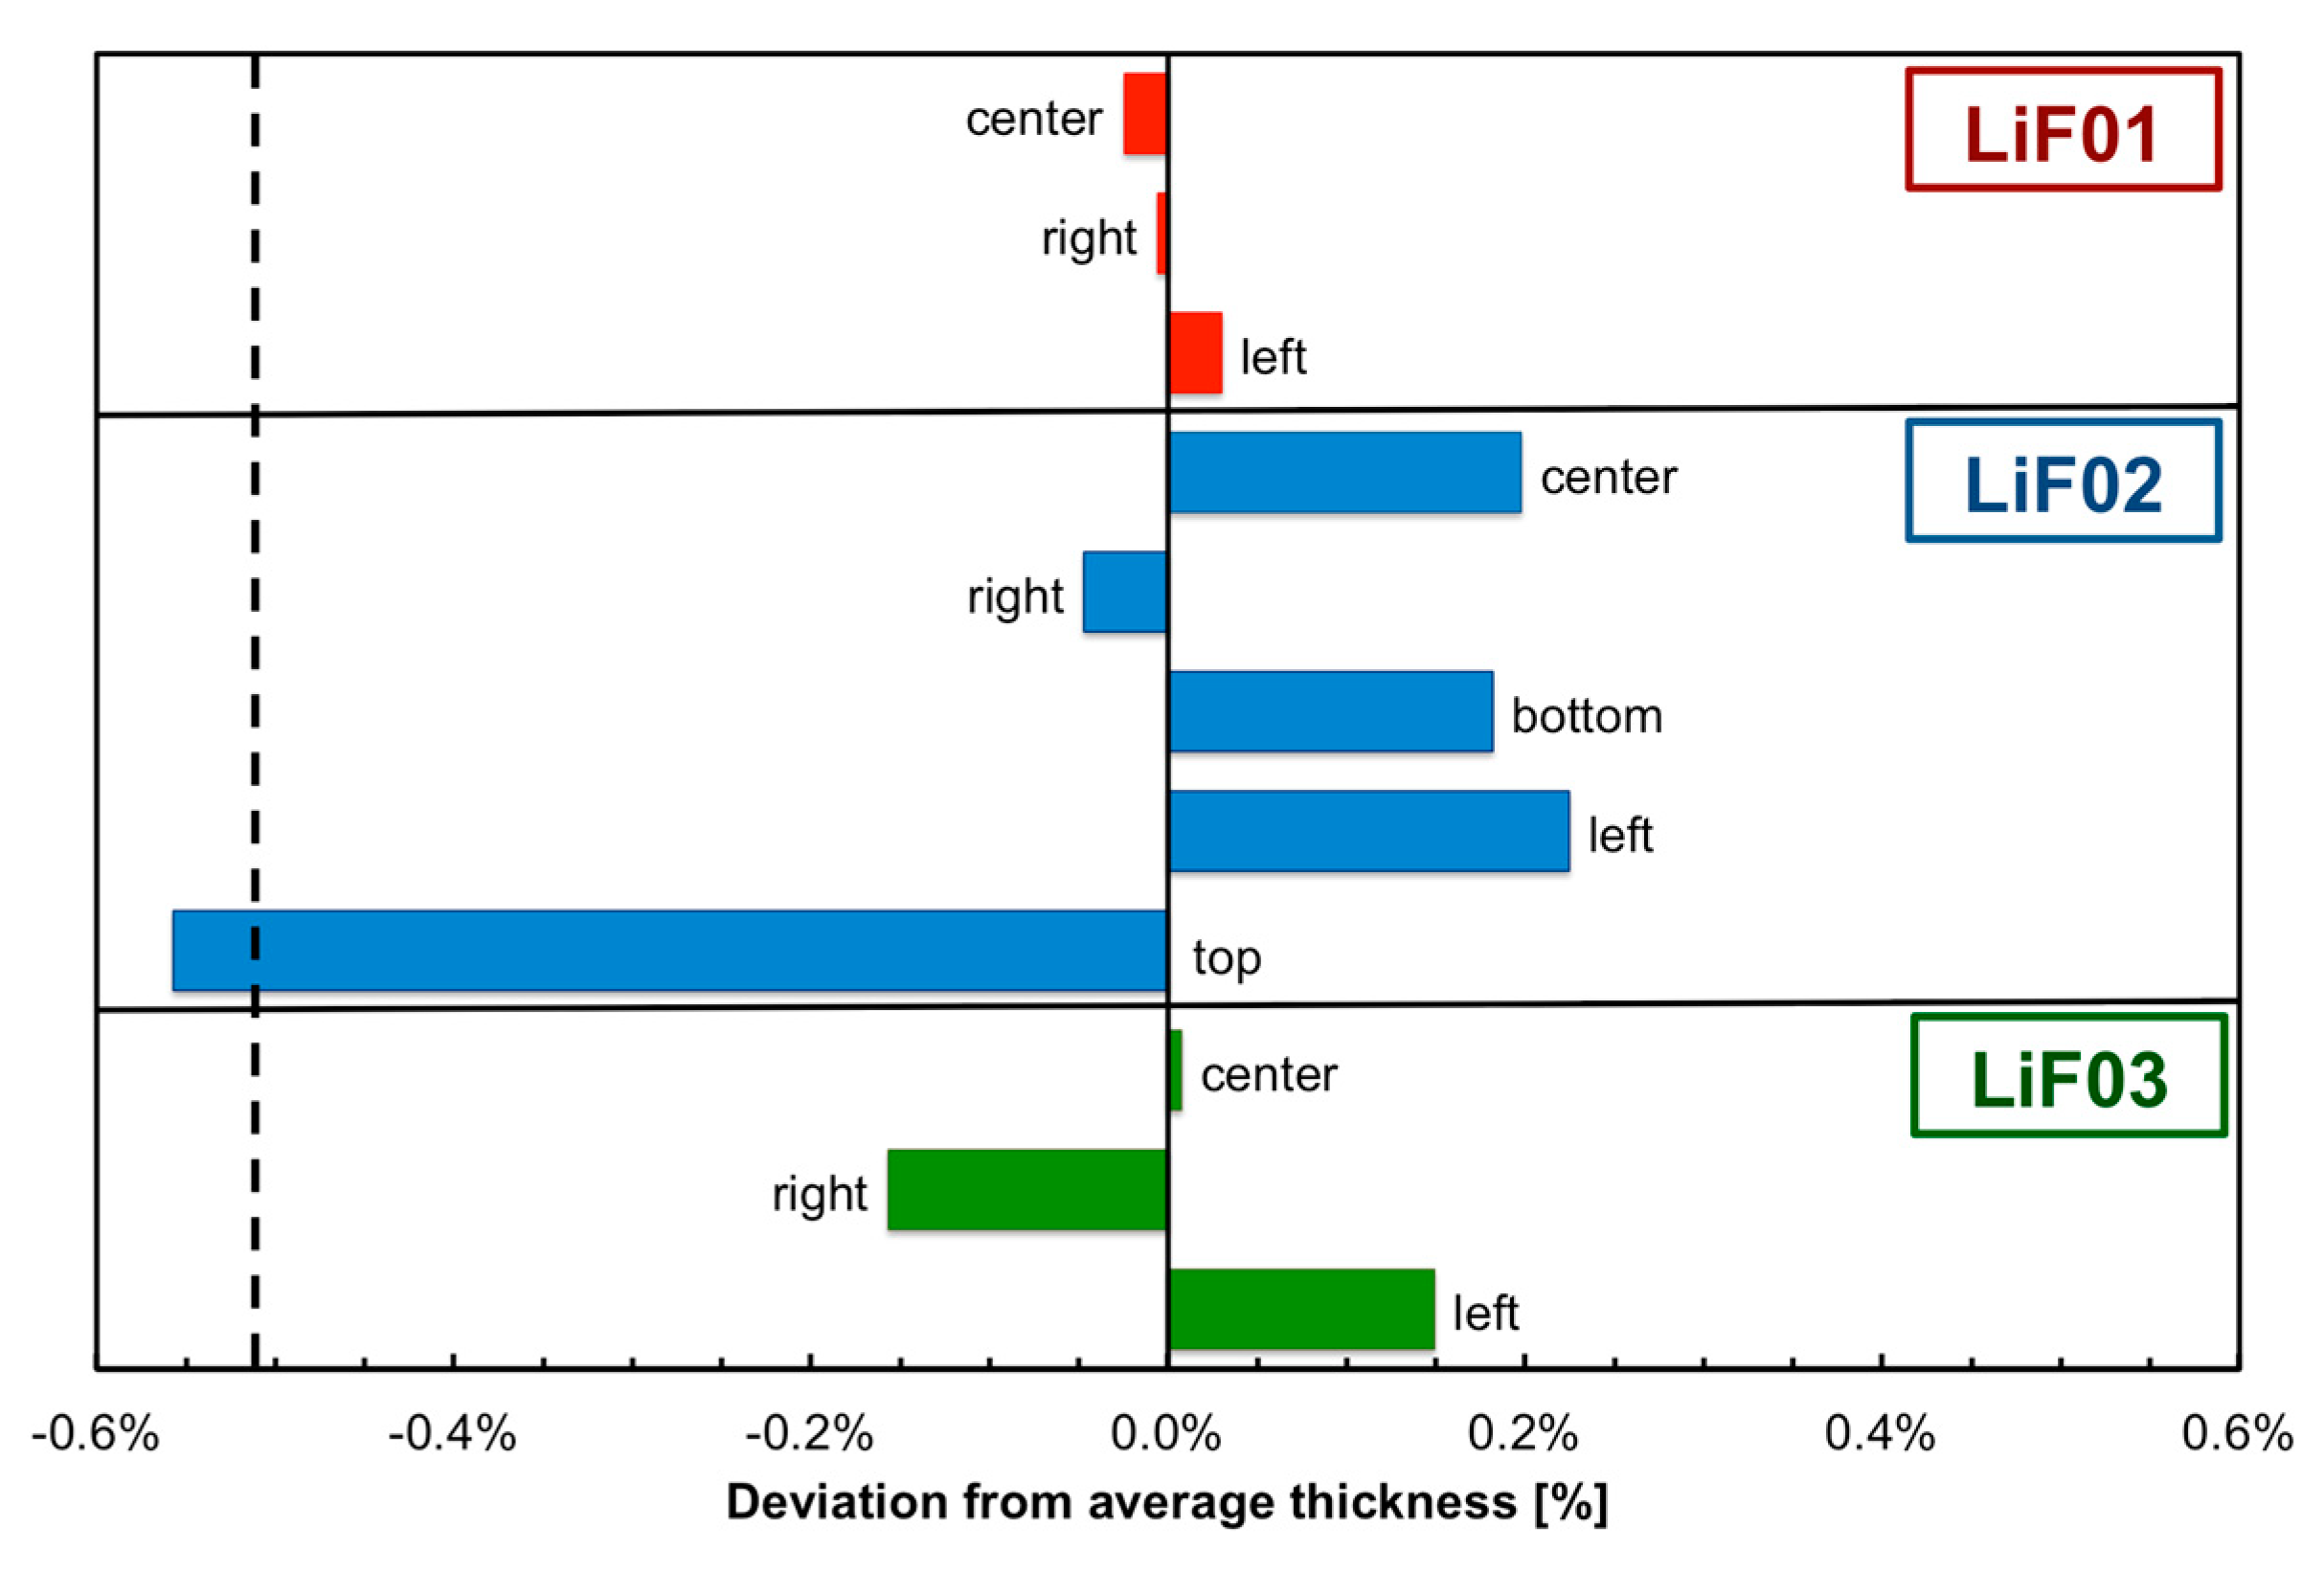
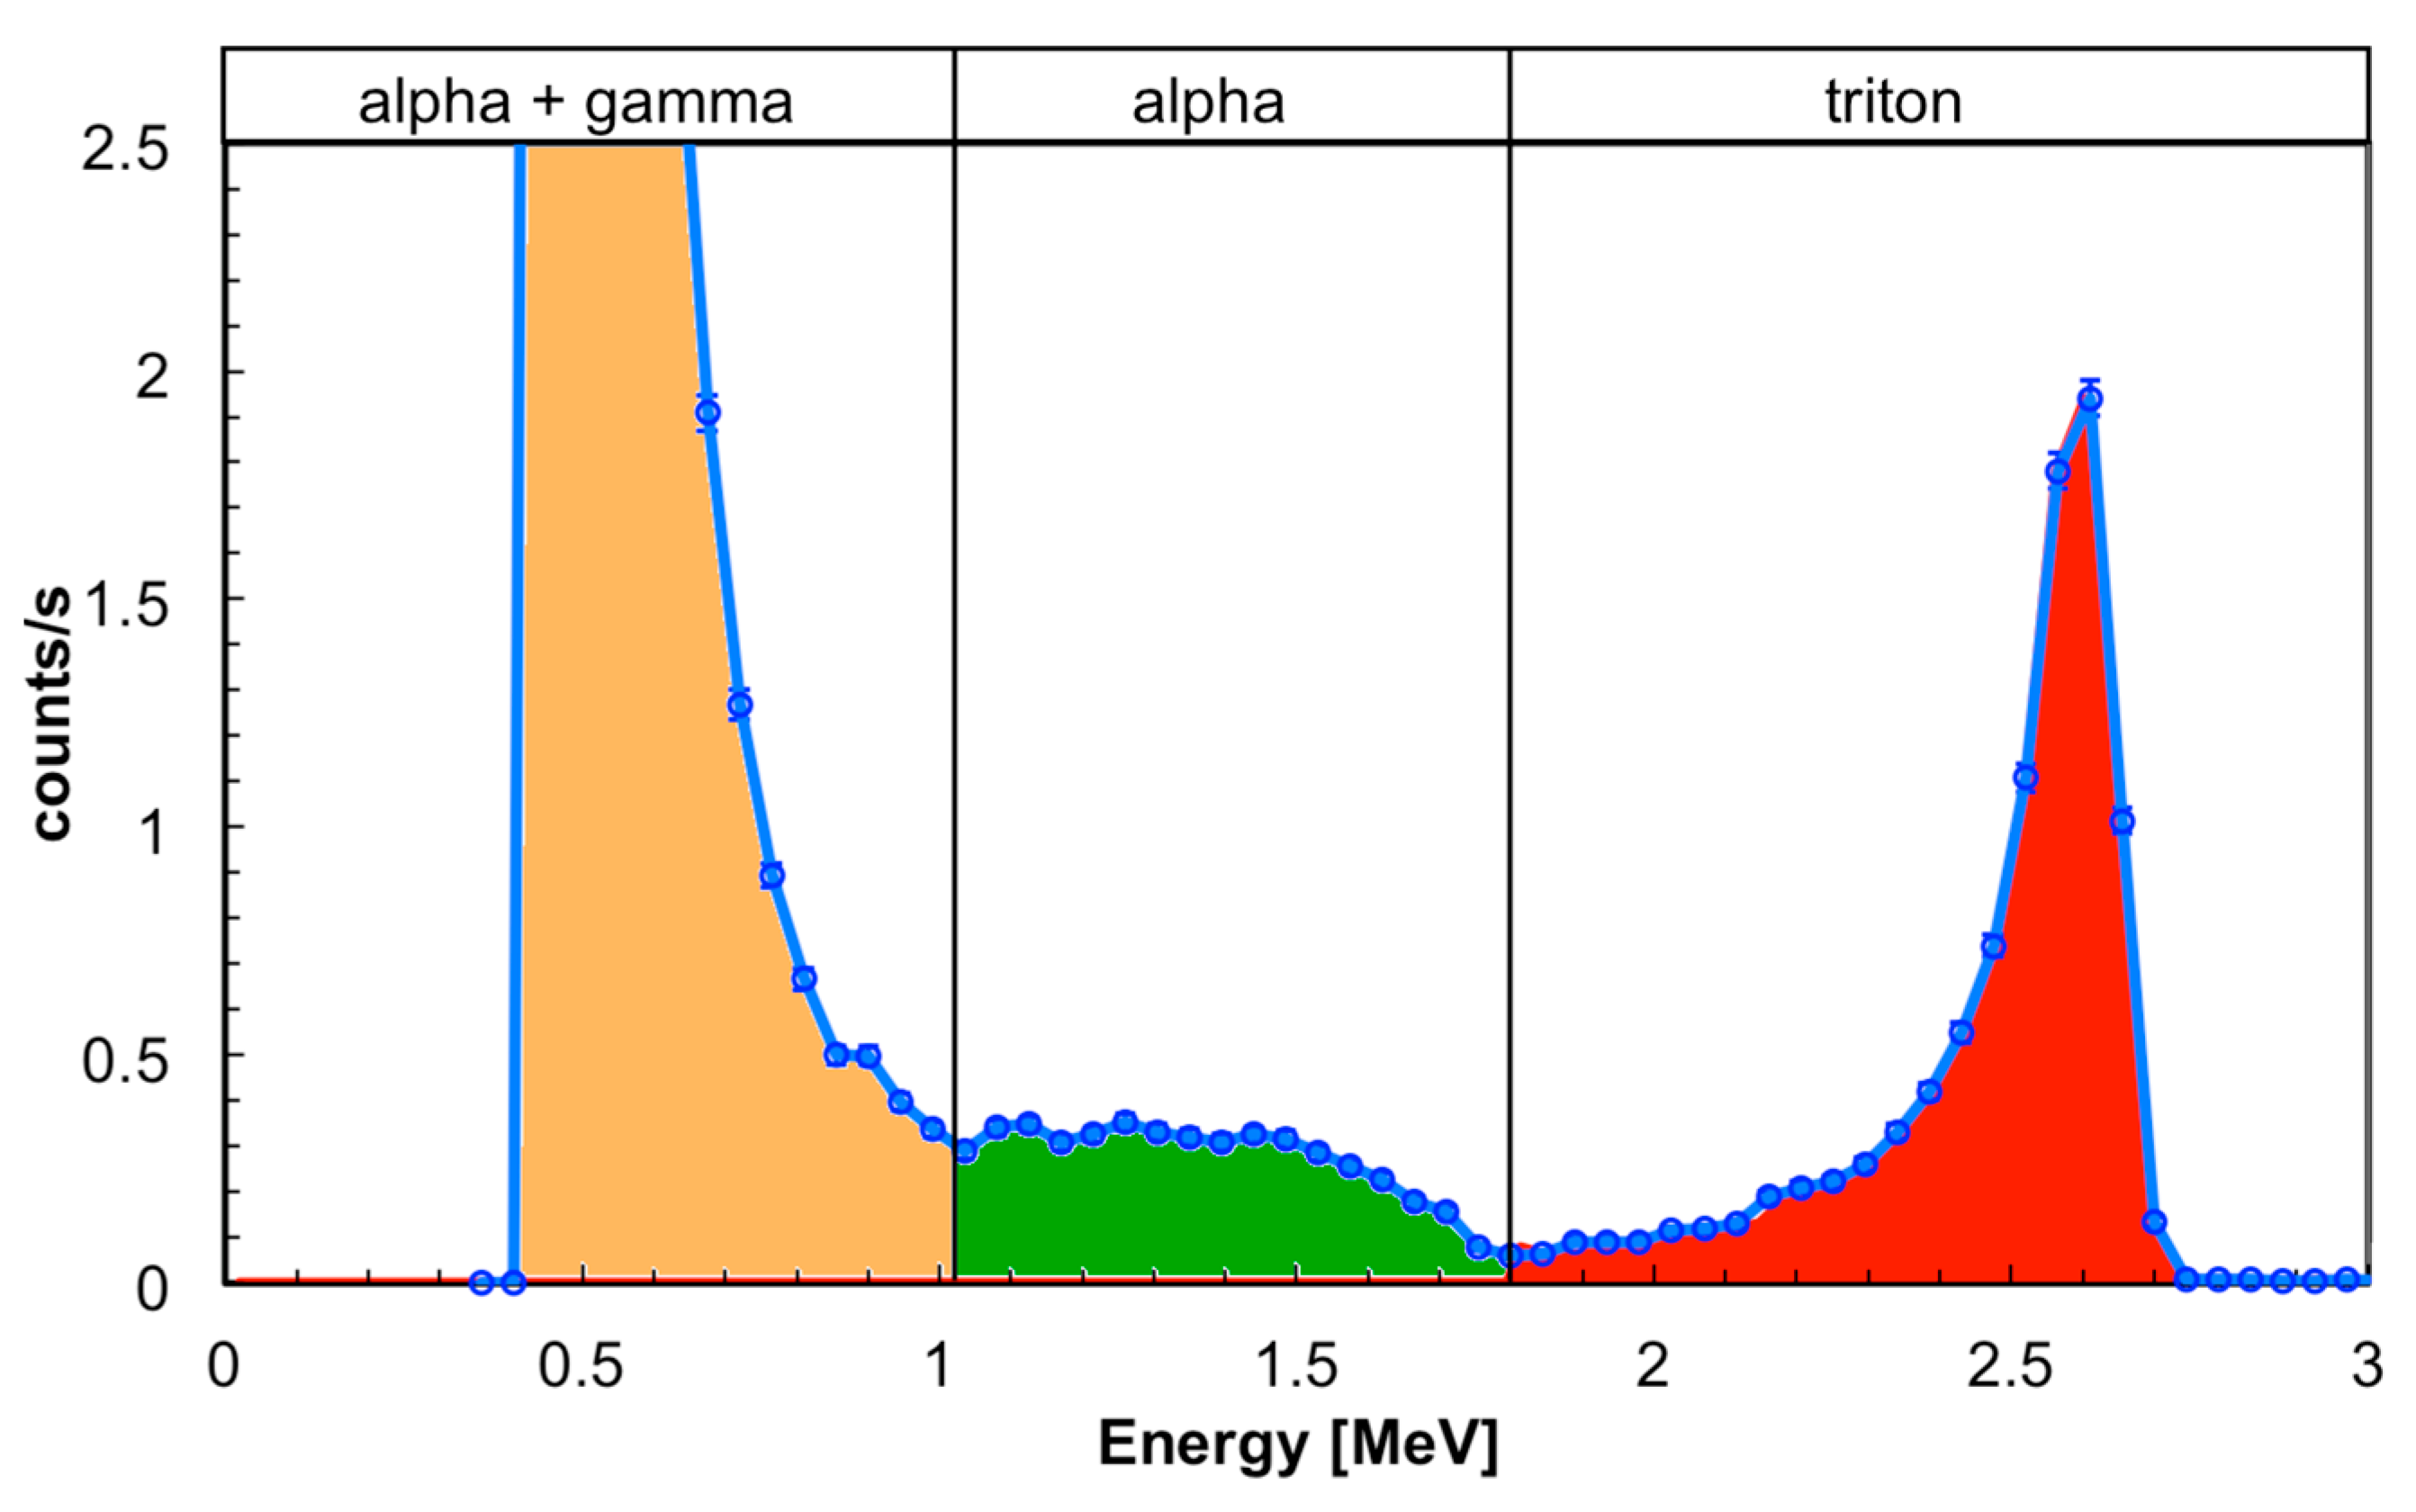
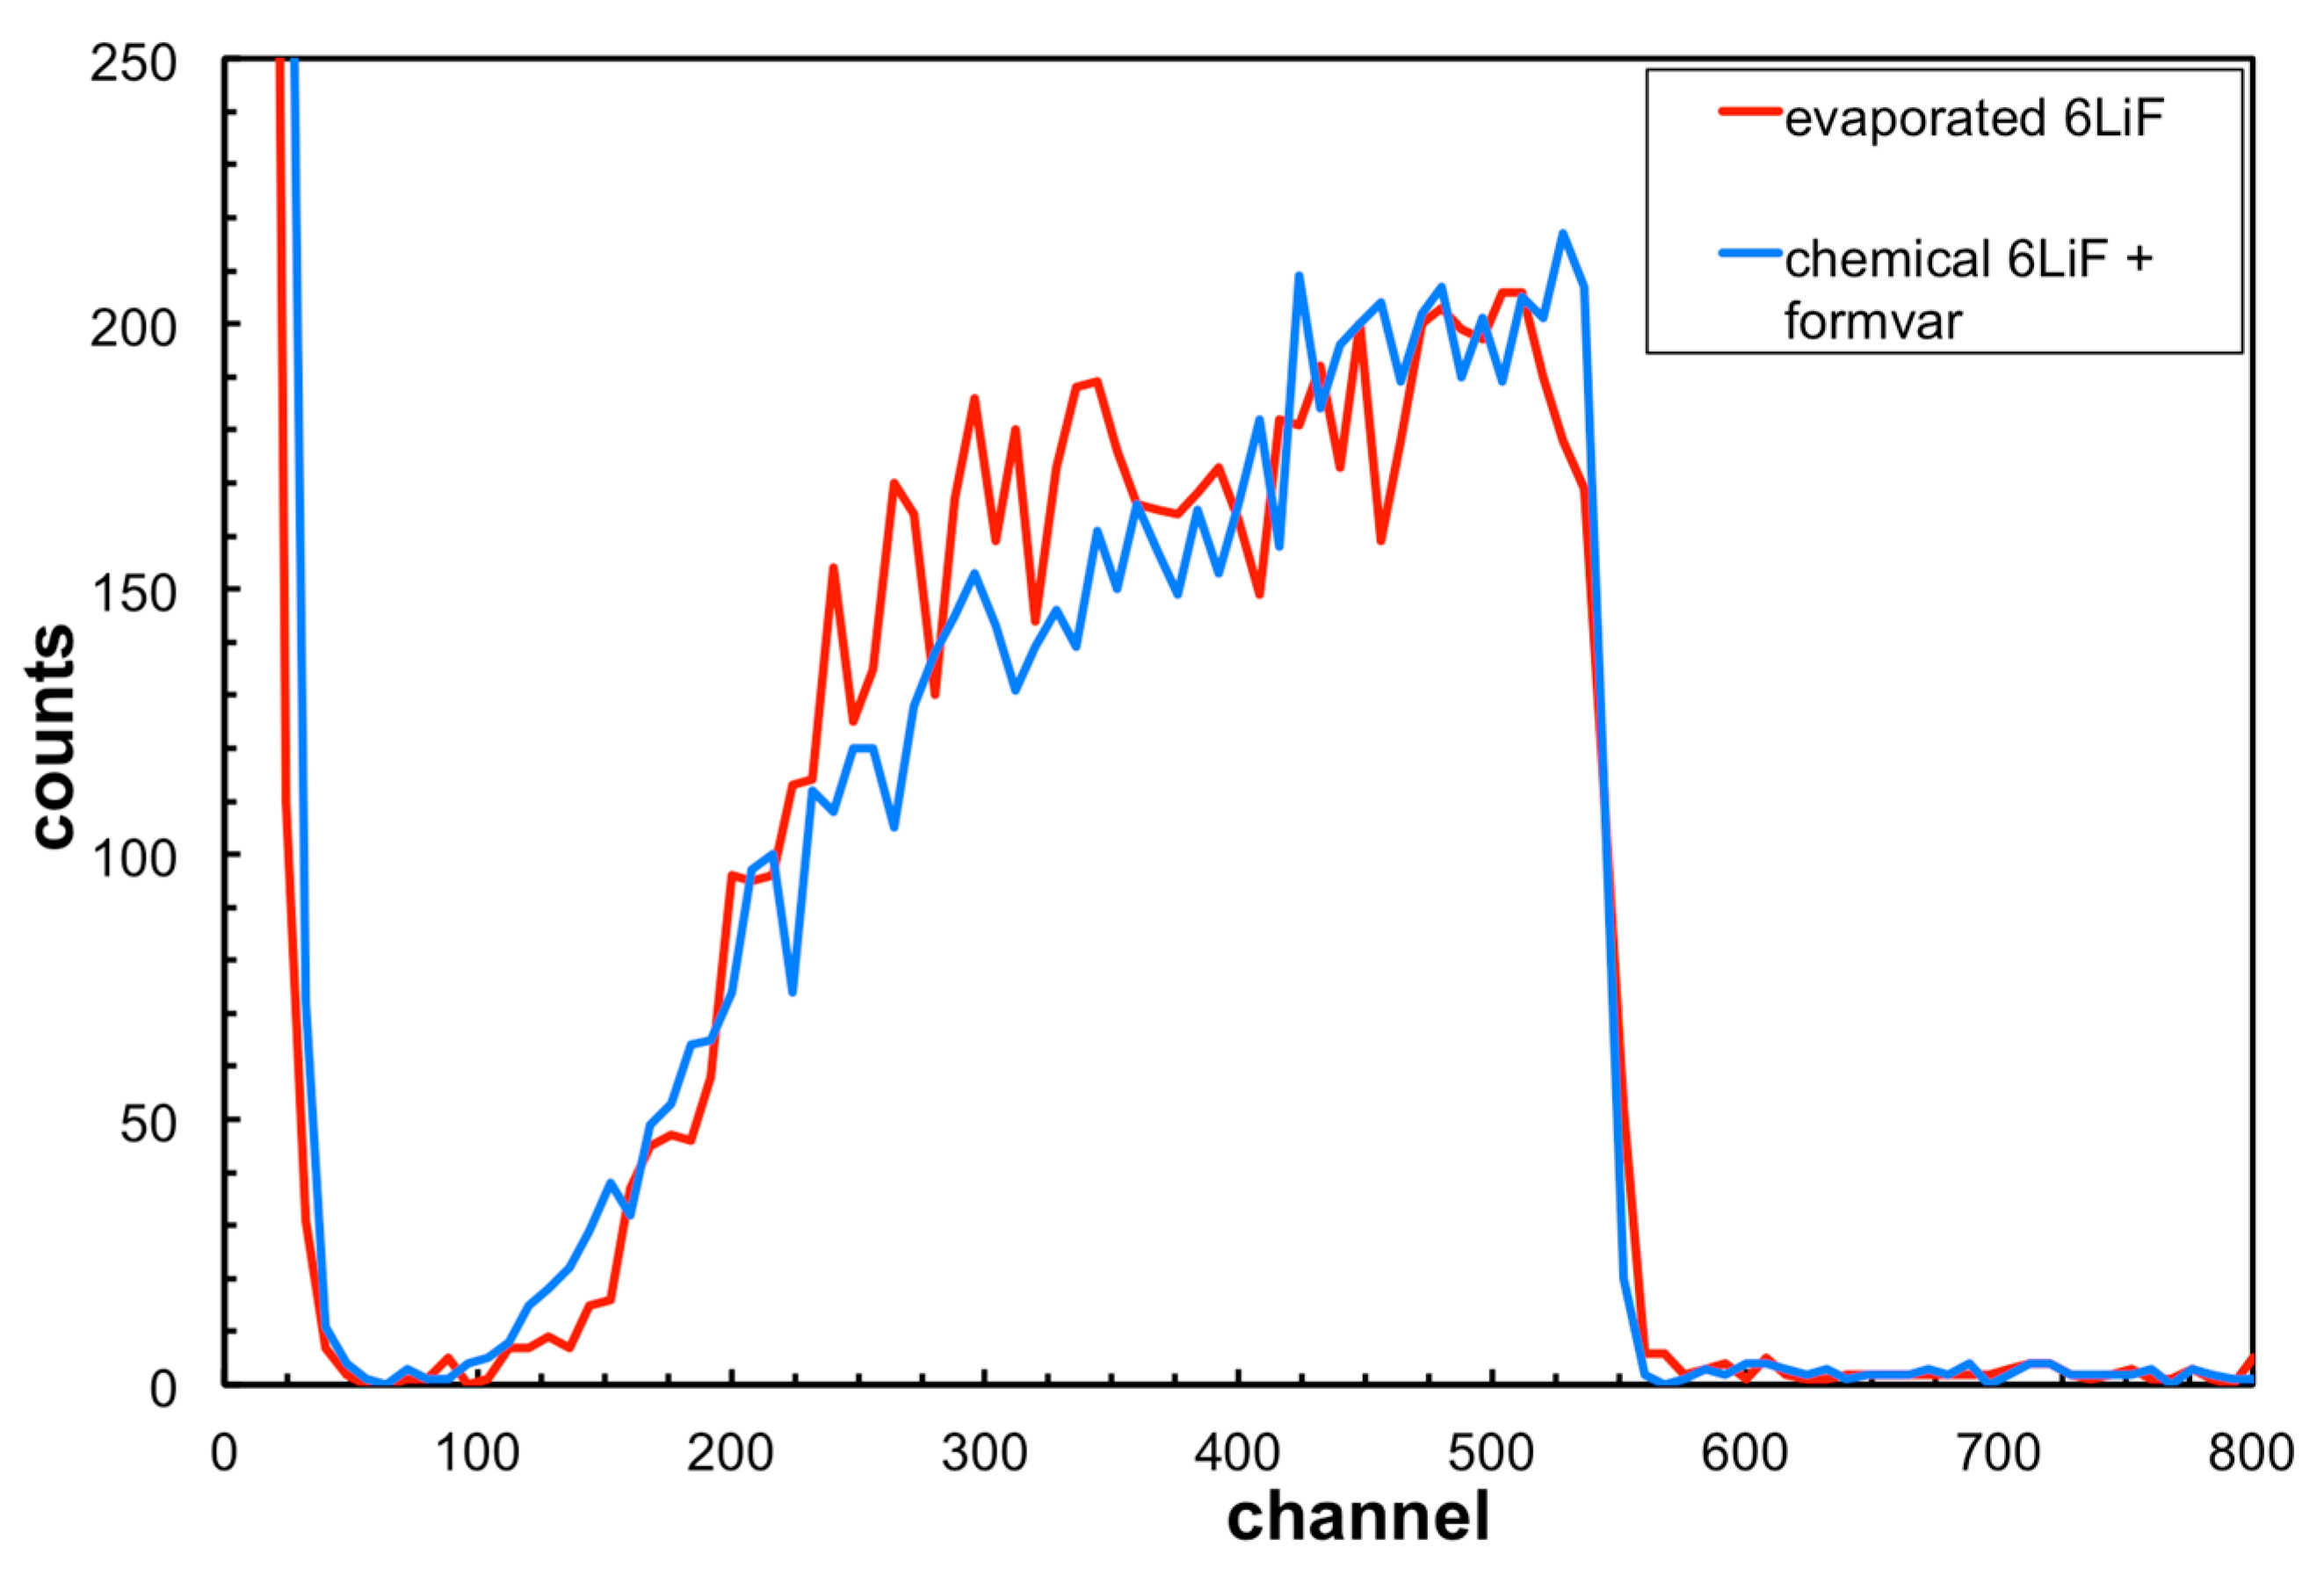
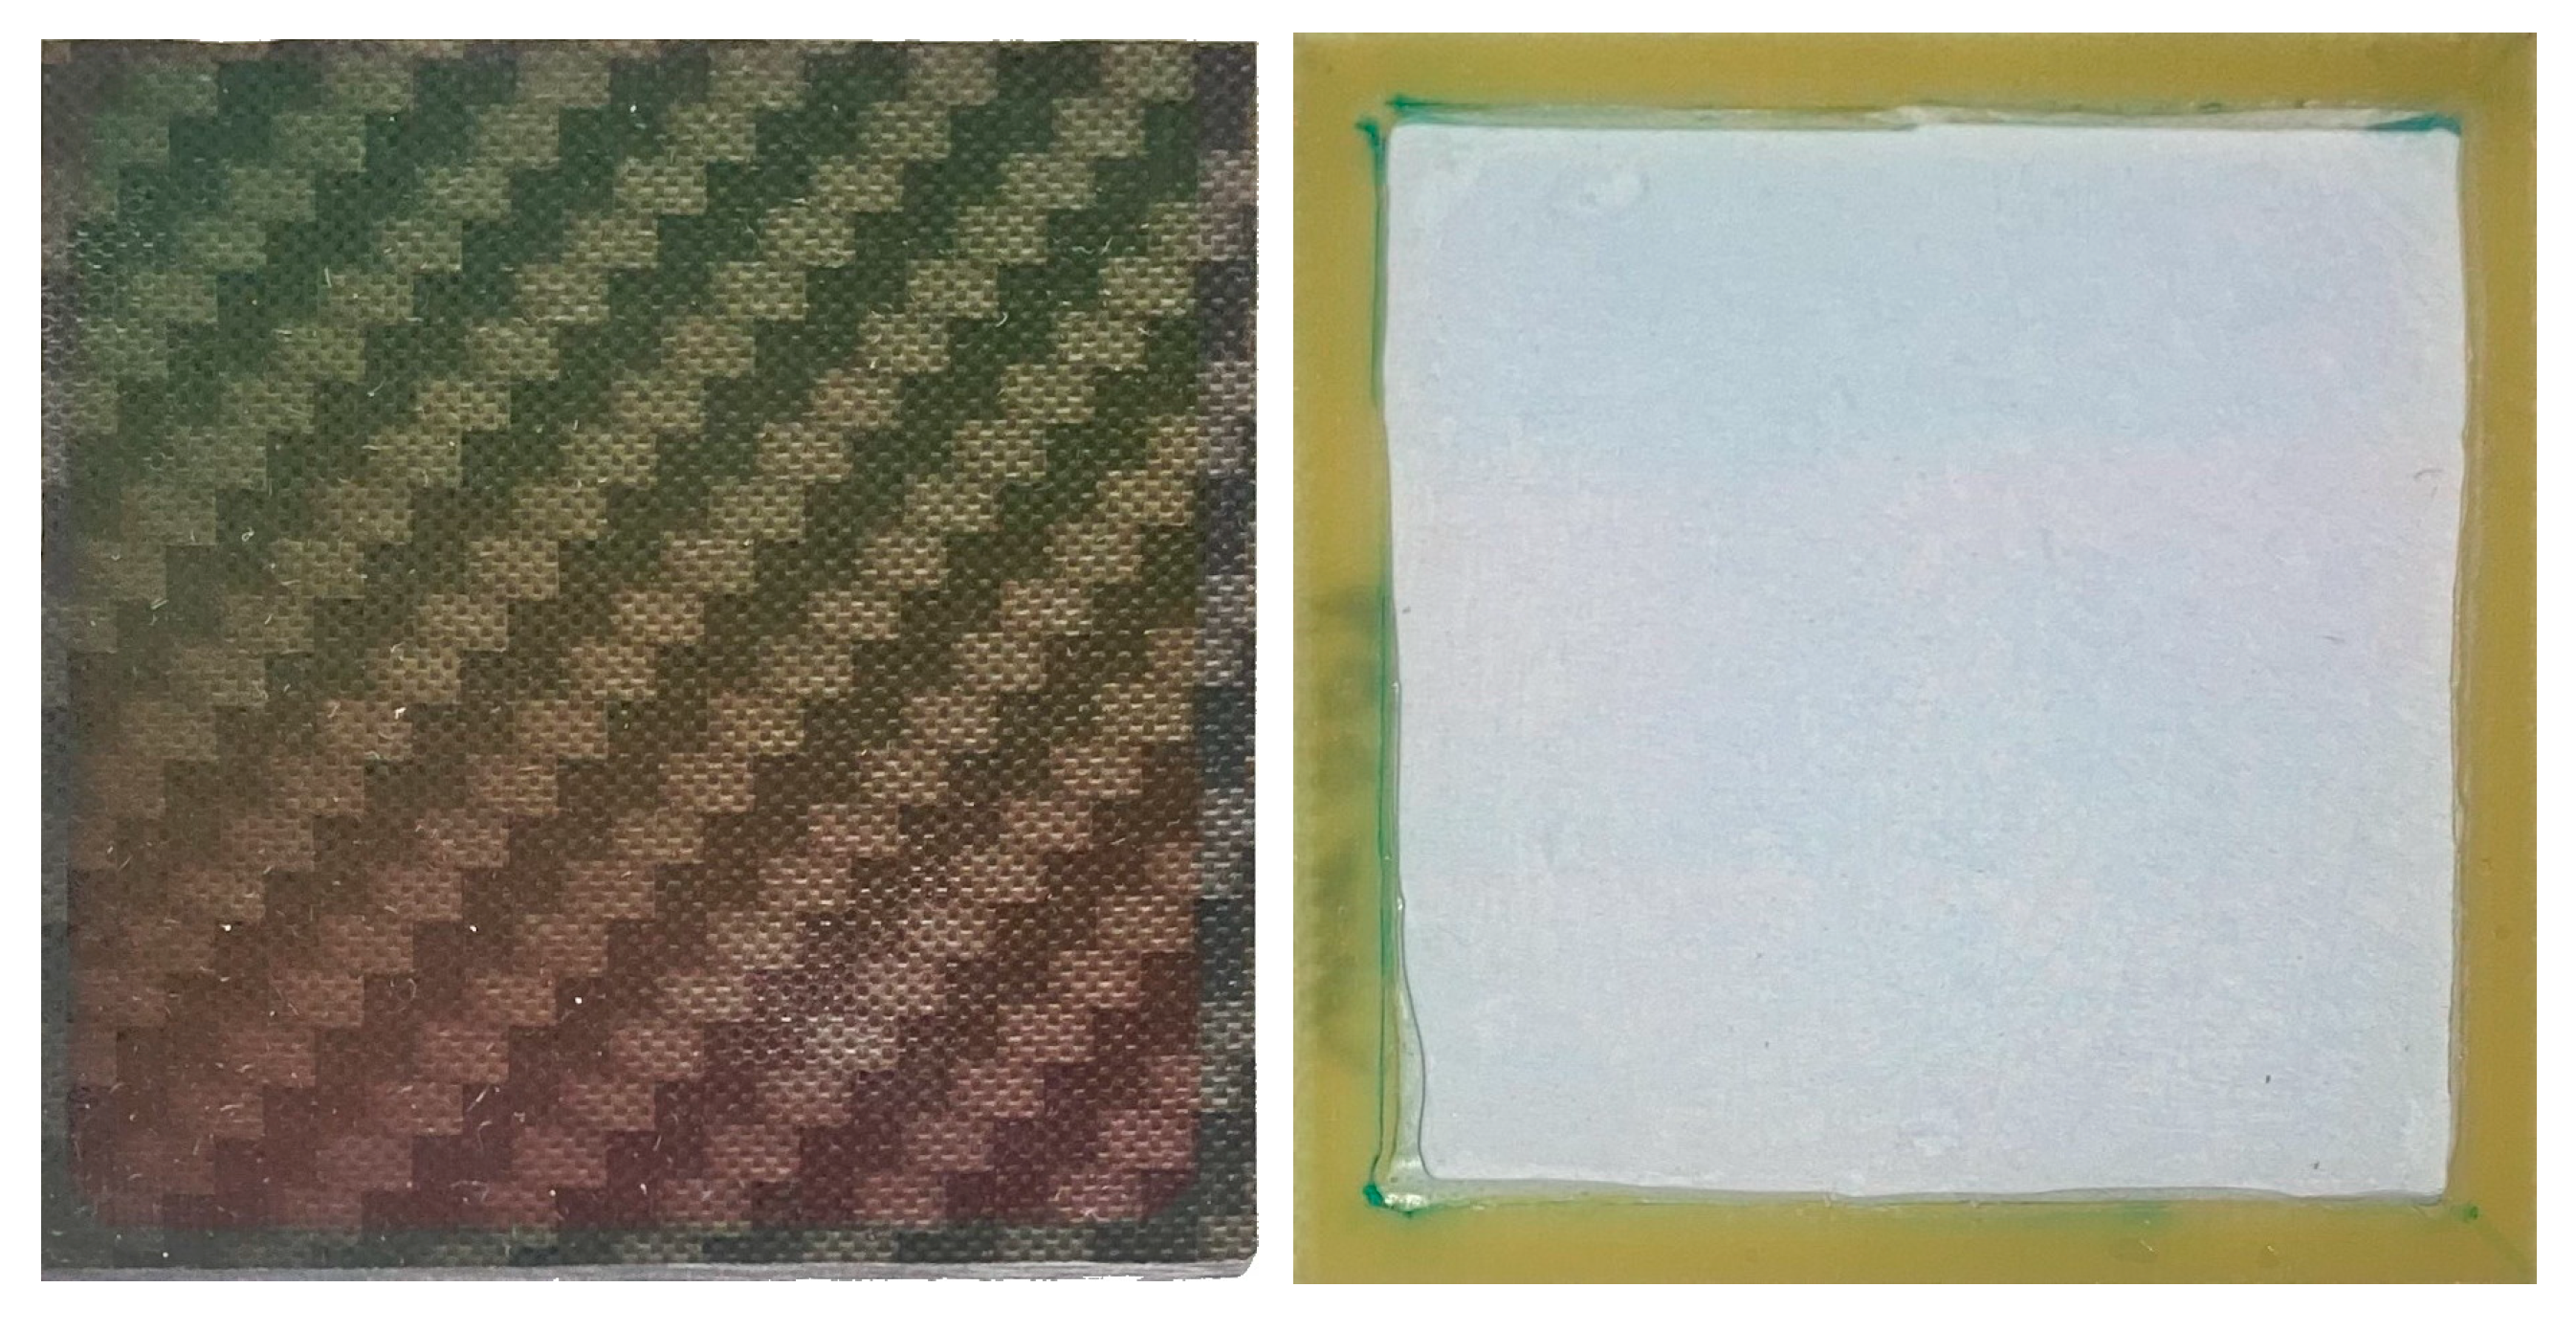
3. The Chemical Deposition Technique
4. Discussion
5. Conclusions
Author Contributions
Funding
Data Availability Statement
Conflicts of Interest
References
- Kouzes, R.T.; Siciliano, E.R.; Ely, J.H.; Keller, P.E.; McConn, R.J. Passive neutron detection at borders. In Proceedings of the 2007 IEEE Nuclear Science Symposium Conference Record, Honolulu, HI, USA, 26 October–3 November 2007; Volume 2, p. 1115. [Google Scholar]
- Ovechkina, L.; Riley, K.; Miller, S.; Bell, Z.; Nagarkar, V. Gadolinium loaded plastic scintillators for high efficiency neutron detection. Phys. Proc. 2009, 2, 161–170. [Google Scholar] [CrossRef] [Green Version]
- van Loef, E.V.; Glodo, J.; Shirwadkar, U.; Zaitseva, N.; Shah, K.S. Novel organic scintillators for neutron detection. In Proceedings of the 2010 IEEE Nuclear Science Symposium Conference Record (NSS/MIC 2010), Knoxville, TN, USA, 30 October–6 November 2010; pp. 1007–1009. [Google Scholar]
- Bell, Z.W.; Miller, M.A.; Maya, L.; Brown, G.M.; Sloop, F.V. Boron-loaded silicone rubber scintillators. IEEE Trans. Nucl. Sci. 2004, 51, 1773–1776. [Google Scholar] [CrossRef]
- Duxbury, D.M.; Rhodes, N.J.; Schooneveld, E.M.; Spill, E.J.; Webster, J.R. Sprinter: A new detector system for the INTER neutron reflectometer. IEEE Trans. Nucl. Sci. 2013, 60, 1327–1331. [Google Scholar] [CrossRef]
- Kouzes, R. Technical Report PNNL-18388; Pacific Northwest National Laboratory: Richland, WA, USA, 2009. [Google Scholar]
- Kouzes, R.T.; Ely, J.H.; Erikson, L.E.; Kernan, W.J.; Lintereur, A.T.; Siciliano, E.R.; Stephens, D.L.; Stromswold, D.C.; van Ginhoven, R.M.; Woodring, M.L. Neutron detection alternatives to 3He for national security applications. Nucl. Instrum. Methods Phys. Res. A 2010, 623, 1035–1045. [Google Scholar] [CrossRef]
- Colonna, N.; Pietropaolo, A.; Sacchetti, F. 3He replacement in neutron detection: Current status and perspectives. Eur. Phys. J. Plus 2015, 130, 236. [Google Scholar] [CrossRef] [Green Version]
- Henzlova, D.; Kouzes, R.; McElroy, R.; Peerani, P.; Aspinall, M.; Baird, K.; Bakel, A.; Borella, M.; Bourne, M.; Bourva, L.; et al. Current Status of 3He Alternative Technologies for Nuclear Safeguards. NNSA USDOE and EURATOM, LA-UR-15-21201. Available online: https://www.osti.gov/biblio/1227248 (accessed on 19 October 2022).
- Barbagallo, M.; Cosentino, L.; Forcina, V.; Marchetta, C.; Pappalardo, A.; Peerani, P.; Scirè, C.; Scirè, S.; Schillaci, M.; Vaccaro, S.; et al. Thermal neutron detection using a silicon pad detector and 6LiF removable converters. Rev. Sci. Instrum. 2013, 84, 033503. [Google Scholar] [CrossRef] [PubMed]
- McGregor, D.S.; Hammig, M.D.; Yang, Y.H.; Gersch, H.K.; Klann, R.T. Design consideration for thin film coated semiconductor thermal neutron detectors—I: Basics regarding alpha particle emitting neutron reactive films. Nucl. Instr. Meth. Phys. Res. A 2003, 500, 272–308. [Google Scholar] [CrossRef]
- Baker, C.; Green, K.; van der Grinten, M.; Iaydjiev, P.; Ivanov, S.; Al-Ayoubi, S.; Harris, P.; Pendlebury, J.; Shiers, D.; Geltenbort, P. Development of solid-state silicon devices as ultra cold neutron detectors. Nucl. Instr. Meth. Phys. Res. A 2002, 487, 511–520. [Google Scholar] [CrossRef]
- Phlips, B.F.; Kub, F.J.; Novikova, E.I.; Wulf, E.A.; Fitzgerald, C. Neutron detection using large area silicon detectors. Nucl. Instr. Meth. Phys. Res. A 2007, 579, 173–176. [Google Scholar] [CrossRef]
- Uher, J.; Fröjdh, C.; Jakůbek, J.; Kenney, C.; Kohout, Z.; Linhart, V.; Parker, S.; Petersson, S.; Pospíšil, S.; Thungström, G. Characterization of 3D thermal neutron semiconductor detectors. Nucl. Instr. Meth. Phys. Res. A 2007, 576, 32–37. [Google Scholar] [CrossRef]
- Voytchev, M.; Iñiguez, M.P.; Méndez, R.; Mañanes, A.; Rodríguez, L.R.; Barquero, R. Neutron detection with a silicon PIN photodiode and 6LiF converter. Nucl. Instr. Meth. Phys. Res. A 2003, 512, 546–552. [Google Scholar] [CrossRef]
- Pappalardo, A.; Barbagallo, M.; Cosentino, L.; Marchetta, C.; Musumarra, A.; Scirè, C.; Scirè, S.; Vecchio, G.; Finocchiaro, P. Characterization of the silicon + 6LiF thermal neutron detection technique. Nucl. Instr. Meth. Phys. Res. A 2016, 810, 6–13. [Google Scholar] [CrossRef] [Green Version]
- Finocchiaro, P.; Cosentino, L.; Lo Meo, S.; Nolte, R.; Radeck, D. Absolute efficiency calibration of 6LiF-based solid state thermal neutron detectors. Nucl. Instr. Meth. Phys. Res. A 2018, 885, 86–90. [Google Scholar] [CrossRef] [Green Version]
- Cosentino, L.; Musumarra, A.; Barbagallo, M.; Colonna, N.; Damone, L.; Pappalardo, A.; Piscopo, M.; Finocchiaro, P. Silicon detectors for monitoring neutron beams in n-TOF beamlines. Rev. Sci. Instrum. 2015, 86, 073509. [Google Scholar] [CrossRef] [PubMed]
- Pappalardo, A.; Vasi, C.; Finocchiaro, P. Direct comparison between solid state Silicon+6LiF and 3He gas tube neutron detectors. Results Phys. 2016, 6, 12–13. [Google Scholar] [CrossRef] [Green Version]
- Cosentino, L.; Ducasse, Q.; Giuffrida, M.; Lo Meo, S.; Longhitano, F.; Marchetta, C.; Massara, A.; Pappalardo, P.; Passaro, G.; Russo, S.; et al. SiLiF Neutron Counters to Monitor Nuclear Materials in the MICADO Project. Sensors 2021, 21, 2630. [Google Scholar] [CrossRef]
- MICADO Project. Available online: https://www.micado-project.eu/ (accessed on 19 October 2022).
- CLEANDEM Project. Available online: https://cordis.europa.eu/project/id/945335/ (accessed on 19 October 2022).
- Sigma Aldrich. Available online: https://www.sigmaaldrich.com/ (accessed on 19 October 2022).
- Finocchiaro, P. Eloss_and_Bragg_v219.xlsb worksheet. unpublished.


| Reaction | Cross-Section [b] |
|---|---|
| 5333 | |
| 3607 | |
| 230 | |
| 940 |
| Layer Material | Nominal Thickness [µm] | Measured Thickness [µm] | Systematic Uncertainty Eloss Method [µm] |
|---|---|---|---|
| Aluminum | 6 | 6.3 | 0.018 |
| 6LiF | 1.8 | 1.9 | 0.005 |
| Small Evaporator | Large Evaporator | Chemical Process | |
|---|---|---|---|
| n. samples | ≈4 units | ≈22 units | single |
| material waste ratio | ≈5:1 | ≈8.5:1 | ≈negligible |
| max sample area | ≈10 × 5 cm2 | ≈30 × 20 cm2 | depends on the well size |
| thickness uniformity | very good (≈0.2%) | good (≈2%) | rough (not measured) |
| best suited for | micron or submicron thickness | 10–20 µm thickness | 10–20 µm, not for well-calibrated efficiency detectors |
| equipment complexity and cost | medium | high | low |
Disclaimer/Publisher’s Note: The statements, opinions and data contained in all publications are solely those of the individual author(s) and contributor(s) and not of MDPI and/or the editor(s). MDPI and/or the editor(s) disclaim responsibility for any injury to people or property resulting from any ideas, methods, instructions or products referred to in the content. |
© 2022 by the authors. Licensee MDPI, Basel, Switzerland. This article is an open access article distributed under the terms and conditions of the Creative Commons Attribution (CC BY) license (https://creativecommons.org/licenses/by/4.0/).
Share and Cite
Massara, A.; Amaducci, S.; Cosentino, L.; Longhitano, F.; Marchetta, C.; Poma, G.E.; Ursino, M.; Finocchiaro, P. 6LiF Converters for Neutron Detection: Production Procedures and Detector Tests. Instruments 2023, 7, 1. https://doi.org/10.3390/instruments7010001
Massara A, Amaducci S, Cosentino L, Longhitano F, Marchetta C, Poma GE, Ursino M, Finocchiaro P. 6LiF Converters for Neutron Detection: Production Procedures and Detector Tests. Instruments. 2023; 7(1):1. https://doi.org/10.3390/instruments7010001
Chicago/Turabian StyleMassara, Antonio, Simone Amaducci, Luigi Cosentino, Fabio Longhitano, Carmelo Marchetta, Gaetano Elio Poma, Martina Ursino, and Paolo Finocchiaro. 2023. "6LiF Converters for Neutron Detection: Production Procedures and Detector Tests" Instruments 7, no. 1: 1. https://doi.org/10.3390/instruments7010001