Article

Temperature Effects on Recruitment and Individual Growth of Two Antagonistic Fish Species, Perch Perca fluviatilis and Roach Rutilus rutilus, from a Climate Change Perspective

by
Arne N. Linløkken
Faculty of Applied Ecology, Agricultural Sciences and Biotechnology, Inland Norway University of Applied Sciences, Box 400, N-2414 Elverum, Norway
Fishes 2023, 8(6), 295; https://doi.org/10.3390/fishes8060295
Submission received: 13 January 2023 / Revised: 9 May 2023 / Accepted: 24 May 2023 / Published: 1 June 2023
(This article belongs to the Section Environment and Climate Change)

Abstract

:
Perch (Perca fluviatilis) in four boreal lakes and sympatric roach (Rutilis rutilis) in two of these lakes were studied by means of gill net sampling, and age and growth were analyzed to explore whether summer temperature affects recruitment and individual growth of the two species differently. Water temperature logging in the lakes showed a highly significant correlation with air temperature. Year-class strength of the perch was significantly positively affected by the summer air temperature, whereas the temperature effect was non-significant for the roach. There was a significant negative effect of year-class strength of one-year-old perch on roach year-class strength in one lake. ln one of the allopatric perch populations, the year-class strength correlation with temperature failed after biomass removal, probably because fishing affected the age structure. July–August air temperature had a significantly positive effect on individual growth rates of two- to five-year-old perch, whereas the effect on roach growth was less clear. The inclination of perch to predate its competitor, roach, as well as conspecifics, as well as accelerated individual growth, were shown to occur more frequently in years with abundant 1+ perch, i.e., the summer after the rise of a strong year-class. Climate warming may potentially favor perch recruitment and growth.
Key Contribution: Recruitment and growth in perch shows a stronger positive response to increased temperature than in roach, a species that can be both its competitor and its prey.

1. Introduction

According to NOAA’s 2021 Annual Climate Report, the combined land and ocean temperature has increased at an average rate of 0.08 degrees Celsius per decade since 1880; however, the average rate of increase since 1981 (0.18 °C) has been more than twice that rate [1]. A continuous warming of the global climate is expected to significantly affect ecosystems on land [2,3], as well as the ecology of aquatic systems [4]. Increased temperature and extended periods of high temperature, i.e., summer, will affect poikilotherm aquatic organisms, such as fishes, and they will affect species differently according to their preferences and tolerances.
In boreal lakes in Fennoscandia, perch (Perca fluviatilis) and roach (Rutilus rutilus) frequently occur sympatrically, and comparative studies have shown that roach appear to be more active and to search for more food than perch at temperatures below 12 °C [5,6,7,8]. Furthermore, 12 °C seems to be the lower limit for the growth of both perch and roach, whereas the optimal temperatures for growth are found to be 23 °C for perch [9] and 27 °C for roach [10,11].
Several studies have explored the competitive interactions between the two species, especially among young and small-sized specimens [12,13,14,15,16,17]. Different from roach, perch may turn piscivorous, and a variable proportion of a population does so, predating both perch and roach [14,18,19,20,21], leading to accelerated individual growth [22,23,24,25]. The roach is the second most widespread cyprinid in Scandinavia, only beaten by the European minnow (Phoxinus phoxinus), and it is a more efficient zooplankton feeder than perch [12,26]. Zooplankton-feeding fish are important in lake ecology due to their ability to reduce the density and body size of herbivorous (algae-feeding) zooplankton, such as the large, efficient grazers of the Daphnia genus [27,28]. A high density of cyprinids also amplifies nutrient recycling [29], promoting algae growth, and it may potentially lead to algal bloom in mesotrophic or eutrophic lakes [28,30,31,32].
Whereas perch is disfavored when encountering roach in competition for zooplankton, piscivory opposes this [33,34] and places perch in a special ecological role. Perch are more widespread than roach and are commonly less abundant in the presence of roach [5,24]. Generally, perch are most abundant in oligotrophic and mesotrophic lakes, whereas the proportion of roach and other cyprinids increases with the lake’s trophic stage [35,36]. A continuing temperature increase may be expected to affect the species’ swimming and feeding activity and will possibly extend the growth season of sympatric perch and roach differently [6,7,24,37]. The interspecific interactions between the species may therefore be changed, although this may occur primarily for small individuals, as the temperature effect is minor for large perch [18,38].
Temperature is shown to affect recruitment and individual growth of both perch [24,39,40,41,42,43,44] and roach [45,46,47,48,49] positively, so temperature increase may increase recruitment and, subsequently, the abundance of perch and roach [50]. Year-class frequencies in vertical life history tables have been used to explore recruitment success variation between years related to temperature [41,51,52]. Based on experiments and field surveys, Karås [44,53,54] concluded that the year-class strength of perch was primarily decided by mortality during the cohort’s first winter, and mortality was negatively related to fry body size and fat storage in autumn. The interannual variation was explained by higher feeding activity and growth rate of larvae and fry in warm summers, rather than an effect of varying availability of food. For roach, Grenouillet et al. [46] found that the number of larvae and young-of-the-year was positively affected by temperature, but the effect was dampened by density-dependent mortality during the first season.
The present study explores the effects of temperature on recruitment and individual growth of perch in four lakes, and, equivalently, for sympatric roach in two of them. Based on existing studies [6,8,24], temperature effects were expected in both species, but the effects were expected to be possibly more pronounced for perch. The individual growth rate of perch and roach is normally reduced after maturation, which occurs at age two to four years and at a body size of 100–150 mm in southeast Norway [24,55], but perch growth may increase later due to ontogenetic shift, i.e., the transition to piscivory [25,56,57]. Perch larger than 200 mm were defined as “large perch”, unlike “normal perch”, and treated separately, as piscivorous behavior commonly occurs from a body length of 150 to 200 mm [25,56,57,58]. Prey abundance probably affects the tendency to ontogenetic shift, and Le Cren [25] found that growth acceleration related to an ontogenetic shift was most frequent in years when strong year-classes occurred. Large perch were more abundant in one of the lakes in this study, and the lake was sampled over 17 years to achieve a reasonable number of large perch. To explore the potential effects of prey fish abundance on the occurrence of ontogenetic shift, growth rates after maturation of large perch were tested for correlation with relative year-class strength of yearlings and one-year-old perch and roach. The stomach contents of large perch were analyzed to confirm piscivory.

2. Materials and Methods
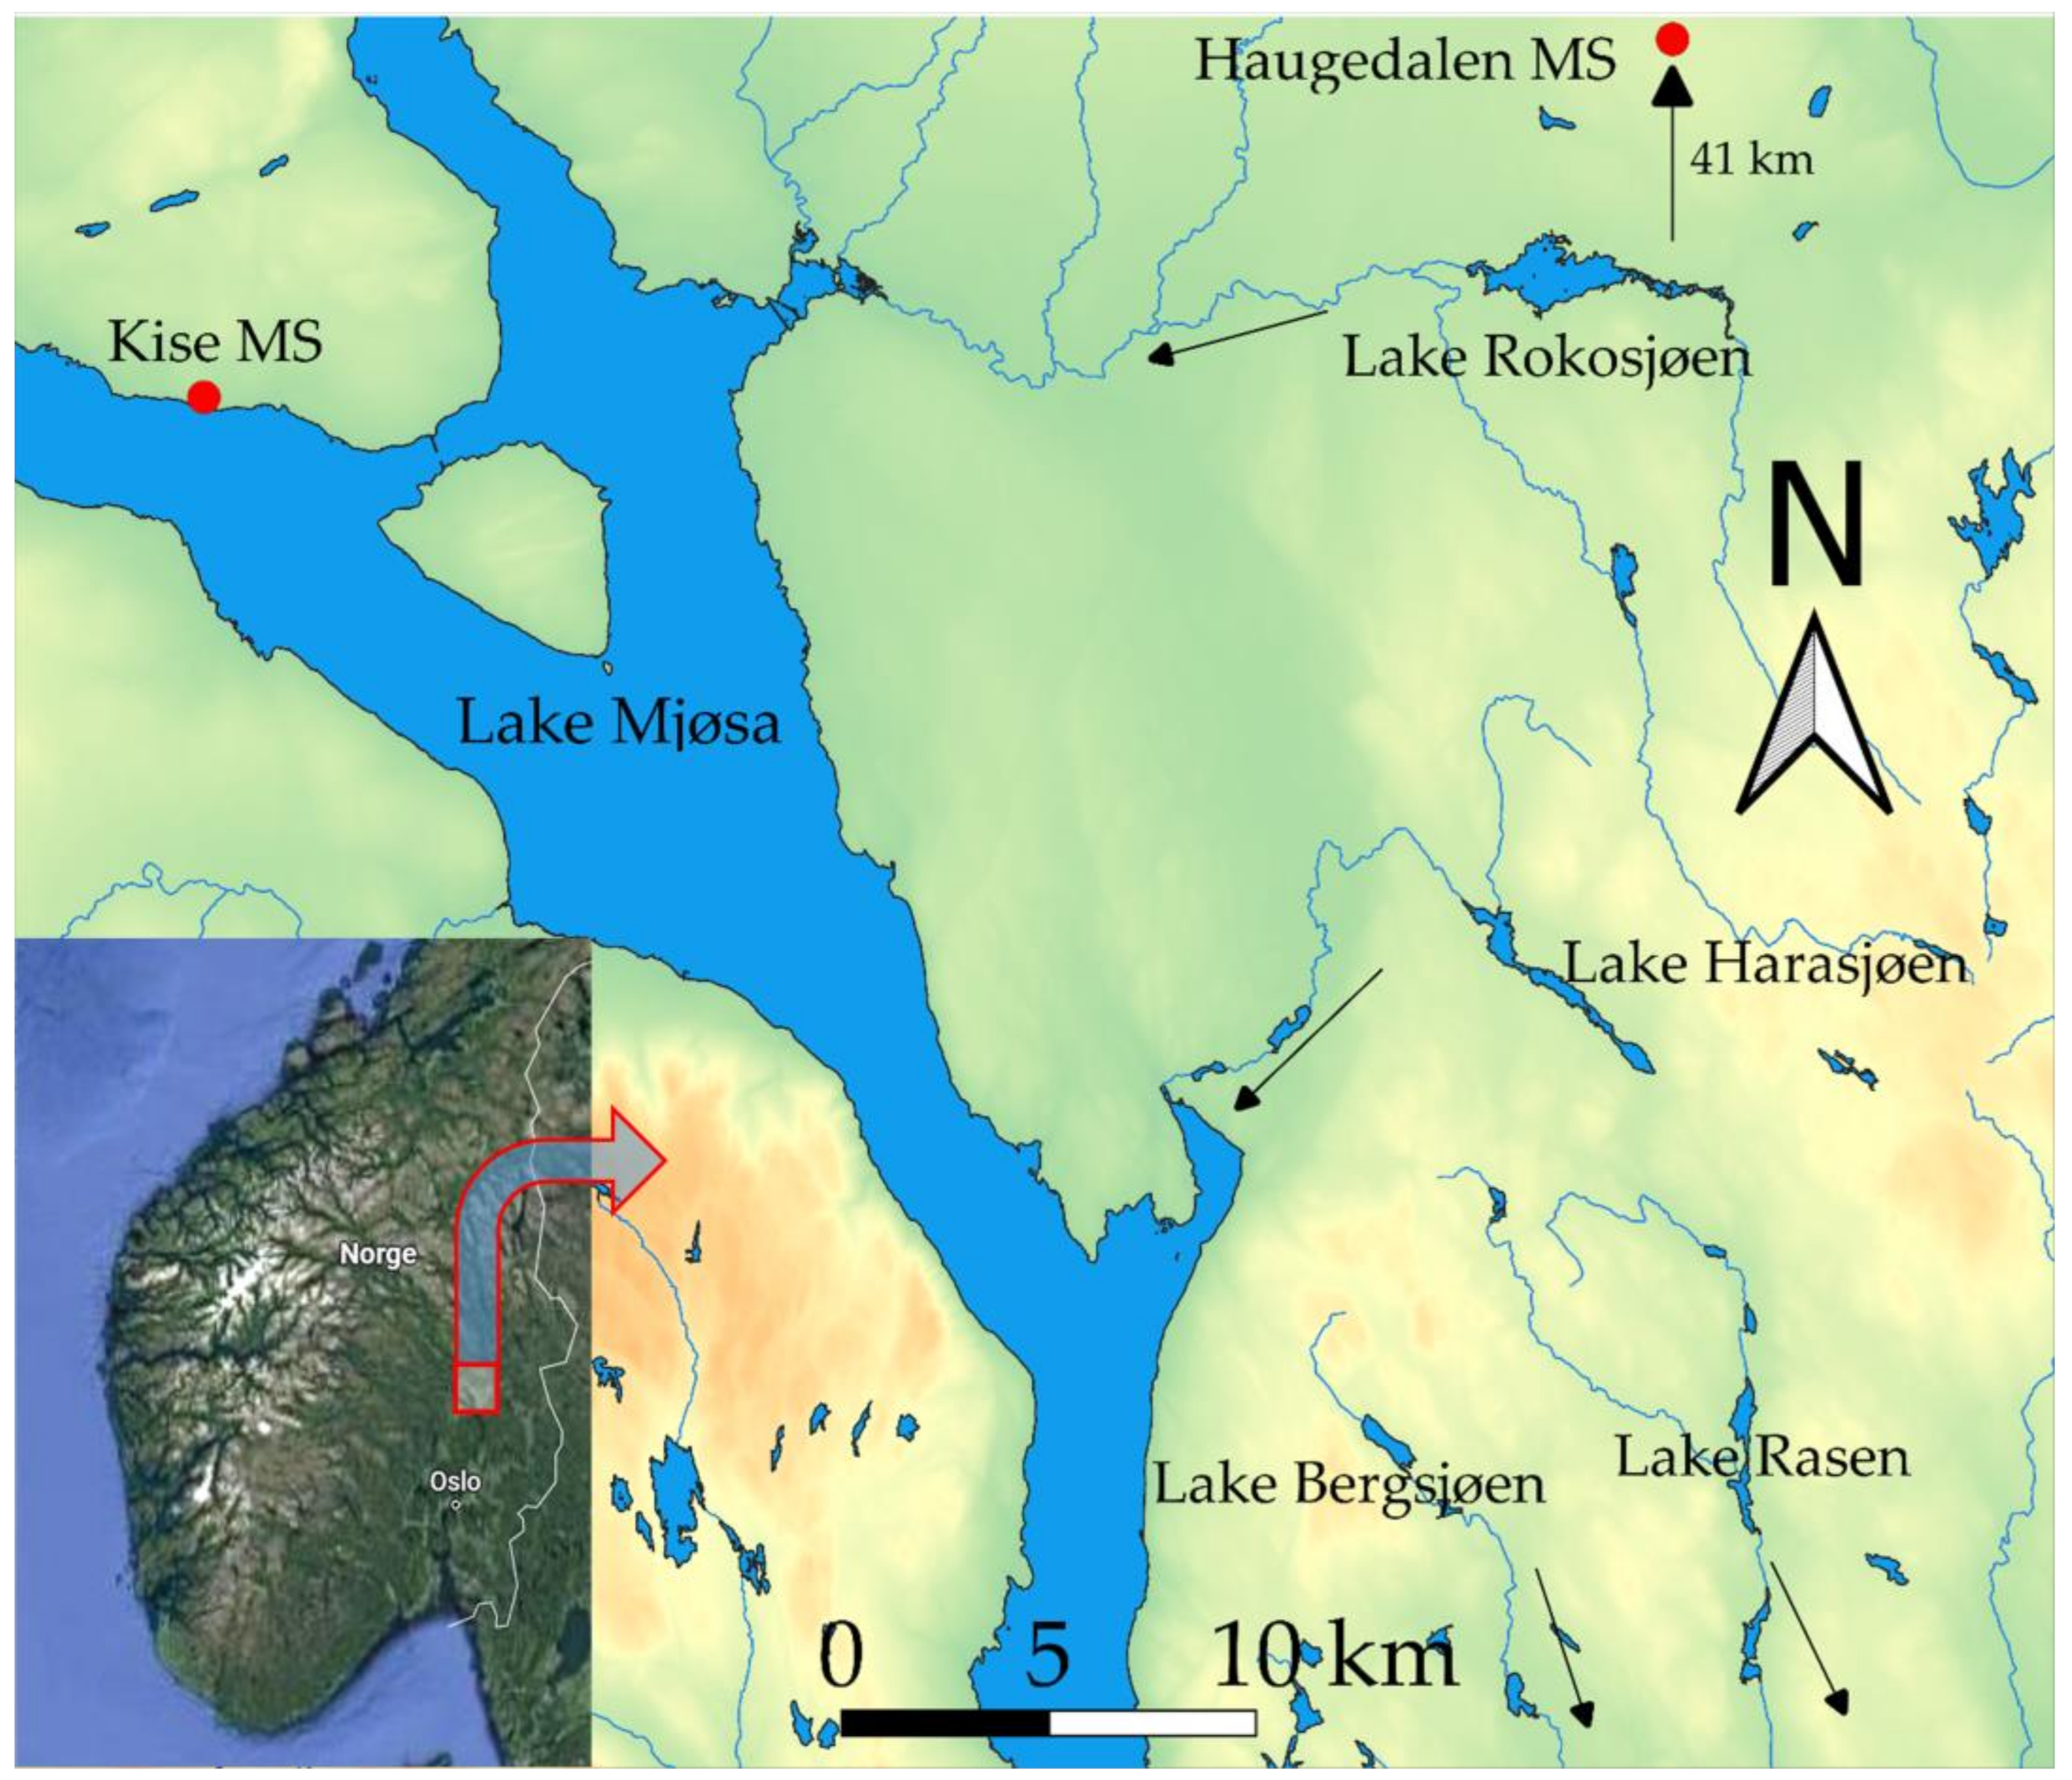
2.1. Study Area

This study was conducted from 1993 to 2009 in four lakes (EU89: 11°21.44′, 60°31.01′ −11°24.14′, 60°47.40′) situated on altitude 209–366 m a.s.l. in southeast Norway (Figure 1, Table 1). The surface area of the lakes ranged from 93 to 377 ha, and maximum depths ranged from 20 to 34 m. The lakes are oligotrophic, with a total phosphorus concentration (Tot P) of 8–11 µg L−1, and they are colored by humus, with 45–110 mg Pt L−1. They are ice-covered from November/December to late April, and holomixis takes place in May and October. The lakes were affected by acidification in the 1980s and 1990s but have gradually recovered after 2000, with pH regularly about 6.0 or higher. Lake Bergsjøen was lime-treated from 1994 to 2006 and was sampled in 1993 and annually from 2006 to 2009. Lake Rasen was sampled in 2005 and annually from 2007 to 2009; Lake Harasjøen was sampled in 2003 and 2004 and annually from 2006 to 2009; and Lake Rokosjøen was sampled annually from 1994 to 1997, in 2000, and annually from 2003 to 2009, except for 2007.
The number of fish species varies between lakes, as Lake Bergsjøen and Lake Rasen harbor perch, brown trout (Salmo trutta), and minnow (Phoxinus phoxinus). In Lake Bergsjøen, there are also sparse populations of whitefish (Coregonus lavaretus) and Arctic charr (Salvelinus alpinus). Lake Harasjøen and Lake Rokosjøen also harbor roach, pike (Esox lucius), and European crayfish (Astacus astacus). Brown trout and minnow are present in inlet and outlet streams of the latter two lakes, but not in the lakes. In Lake Harasjøen, there is additionally a sparse ide population (Leuciscus idus), and in Lake Rokosjøen, there are common bleak (Alburnus alburnus) and ruffe (Gymnocephalus cernua), both potential prey to large perch.

2.2. Sampling

Fish were sampled with benthic gill nets of the Nordic multi-mesh nets with 12 mesh sizes (1.5 × 2.5 m; 5, 6.25, 8, 10, 12.5, 16, 19.5, 24, 29, 35, 43, and 55 mm knot to knot) [59]. Each sampling was conducted with three nets for one night. Exceptions were in Lake Bergsjøen in 1994 and 2006 and in Lake Rokosjøen from 1995–1997, when only two nets were used for one night. The sampling was performed at varying times of the year from late May (after spawning) until early September (mostly from July–August), which could affect the catch per unit effort (CPUE), although water temperature was always above 11 °C. The nets were set from the shore at a depth of approximately 5 m, which is roughly in the epilimnion, where perch and roach dwell during summer stagnation in small boreal lakes [24,60]. Samples were collected (Table 2) to explore year-class strength and individual growth and comprised 326–729 perch and 288–702 roach from each lake. In total, 1717 perch and 990 roach were sampled (File S1). All fish were measured (mm) and weighted (0.1 g); otoliths for age determination were sampled from both species, and for back calculation of length at age, operculum were collected from perch [61] and scales were collected from roach [62]. Stomach contents were sampled from 20 large perch caught in Lake Rokosjøen, and frozen in plastic bags until analysis.
Monthly mean air temperature data (based on homogenized means of five daily records) were attained from a monitoring station of the Norwegian Meteorological Institute at Haugedalen (EU89: 11°27.035′, 61°9.536′, Code SN7010, 240 m a.s.l.), located 41 to 75 km northeast of the studied lakes. This was the closest meteorological station with continuing measurements during the actual years. Another meteorological station, Kise, located 34 to 48 km from the lakes (EU89:10°48.134′ 60°46.374′, Code SN12550, 128 m a.s.l.), was run until 1980 (and restarted in 2010). A regression equation of the temperature, monitored daily throughout the whole year at the two stations, was estimated:
(Haugedalen temperature, °C) = 1.07 × (Kise temperature, °C) − 2.03, r2 = 0.98, p < 0.001
The model’s intercept suggests that the temperature at Haugedalen was, on average, approximately 2 °C lower than at Kise. During years of simultaneous recordings (1970–1980 and 2010–2012), the July temperature means (±S.D.) at Kise and Haugedalen were 15.5 (±1.2) °C and 14.5 (±1.3) °C, respectively, and, correspondingly, 14.3 (±1.0) °C and 12.8 (±1.1) °C in August, i.e., the mean summer temperature was 1.0 to 1.5 °C higher at Kise, presumably due to the lower altitude. Water temperatures were logged with HoBo temperature loggers [63] during periods of one to four years in each lake at a depth of approximately 1 m to describe the relationship between the air and water temperatures.

2.3. Calculations

The catch per unit effort (CPUE) was calculated as the number of fish C caught per 100 m2 gill net and night. The relative strength of a year-class i (YCSi) was calculated as the ratio NO,i:NE,i, where NO,i is the observed frequency of year-class i and NE,i is the expected frequency of the same year-class (File S1). The expected frequency was estimated based on the assumption of a constant annual recruitment (R) across the years, equaling annual mortality (Z): N × R = N × Z, where N is the population size and Ni = Ni+1 × e−Z [52,64] is the number of fish in age group i. The expected age frequency was estimated from an initial N0, which was selected by iterations to achieve NTot = i = 0 n N i × e Z , equaling the sample size of perch of age 2+ and older and roach of age 3+ and older, including age groups up to the first one, with expected NE less than five individuals. Due to this cutoff, roach samples from Lake Rokosjøen from 1994 to 2000 were omitted from the YCS estimation. The age at recruitment in the gill net catches (2+ and 3+) was based on catch curves [65] of pooled samples of perch and roach, respectively, of each lake. Instantaneous mortalities were also estimated from catch curves [66] to Z = 0.25, 0.39, 0.30, and 0.28 for perch, respectively, in Lake Bergsjøen, Rasen, Harasjøen, and Rokosjøen, and Z = 0.30 for roach in both the sympatric populations. If the Z is used in the calculations, this will underestimate the expected N and, consequently, overestimate the YCS. This may be checked by plotting YCS by year. A positive slope will suggest a too high Z. Iterations with different Z-values showed that Z ± 0.05 gave significant regressions in all cases when Z did, so the method is not very sensitive to the Z-value.
Back calculation of length in previous years was conducted for each lake by means of a regression model of log(Fish length (L, mm)) = b × log(Opercular radius, mm) + a for perch [61], and back calculation of length was based on scales and proportionality of fish length and scale radius for roach [62]. Back calculated length at age t (Lt) was transformed to weight at age (Wt) by means of estimated length–weight regression models logW = b × logL + a of each lake, and annual instantaneous growth rate at age t was calculated as Gt = ln(Wt/Wt−1) [67].
Fishing mortality was negligible in all lakes except for in Lake Bergsjøen after 1995, when 50–70 perch per ha were removed annually in an attempt to increase perch and brown trout growth [39,68]. YCS was estimated for each cohort and sample and averaged over samples within lakes. The 1993 sample of Lake Bergsjøen was treated separately due to the annual biomass removal after 1995.

2.4. Statistics

YCS was tested for correlation with the monthly mean air temperature of June, July, August, September, and combinations of these months, with the linear regression and charts presented in Microsoft Excel [69]. Multiple regressions were performed in the r-software [70]. The lakes were treated separately, and so were the samples from Lake Bergsjøen in 1993 and the pooled samples from 2006–2009. The air temperature (Ti) of different time periods (combinations of months) and the year-class strength of 0+ and 1+ of perch (YCSPerch.0+ and YCSPerch.1+) and roach (YCSRoach.0+ and YCSRoach.1+) were used as continuous predictors. The samples of roach from Lake Harasjøen and Lake Rokosjøen were treated similarly.
Growth variation within the lakes was analyzed by means of ANOVA and linear models in the r-software [70]. Annual means (observations within year and lake are not independent observations) of age-specific G (G2+G5+) were used as the response variable. G was ln transformed to obtain an approximately normal distribution. Age was used as the categorical, and monthly mean air temperatures (in June, July, August, and combinations of these months) were used as continuous predictors. The ANOVAs were conducted to achieve the sum of squares of each predictor and further used to calculate partial coefficients of explanation (r2). Akaike’s information criterion (AIC) was calculated [71].
During the sampling in Lake Rokosjøen (1994–2009), in total, 63 (68% females) perch larger than 200 mm were caught and defined as large perch. The growth pattern of these perch was subjected to a closer examination. Growth rates at age 5+ and later (i.e., after maturation) were averaged across specimens, age (≥5+), and sampling years. The mean G variation between calendar years was further analyzed by means of linear modelling, with relative year-class strength of perch and roach of the actual year (YCS0+) and of the foregoing year (YCS1+) used as predictors to reveal potential effects of abundance of 0+ and 1+ fish on the occurrence of growth acceleration.

3. Results

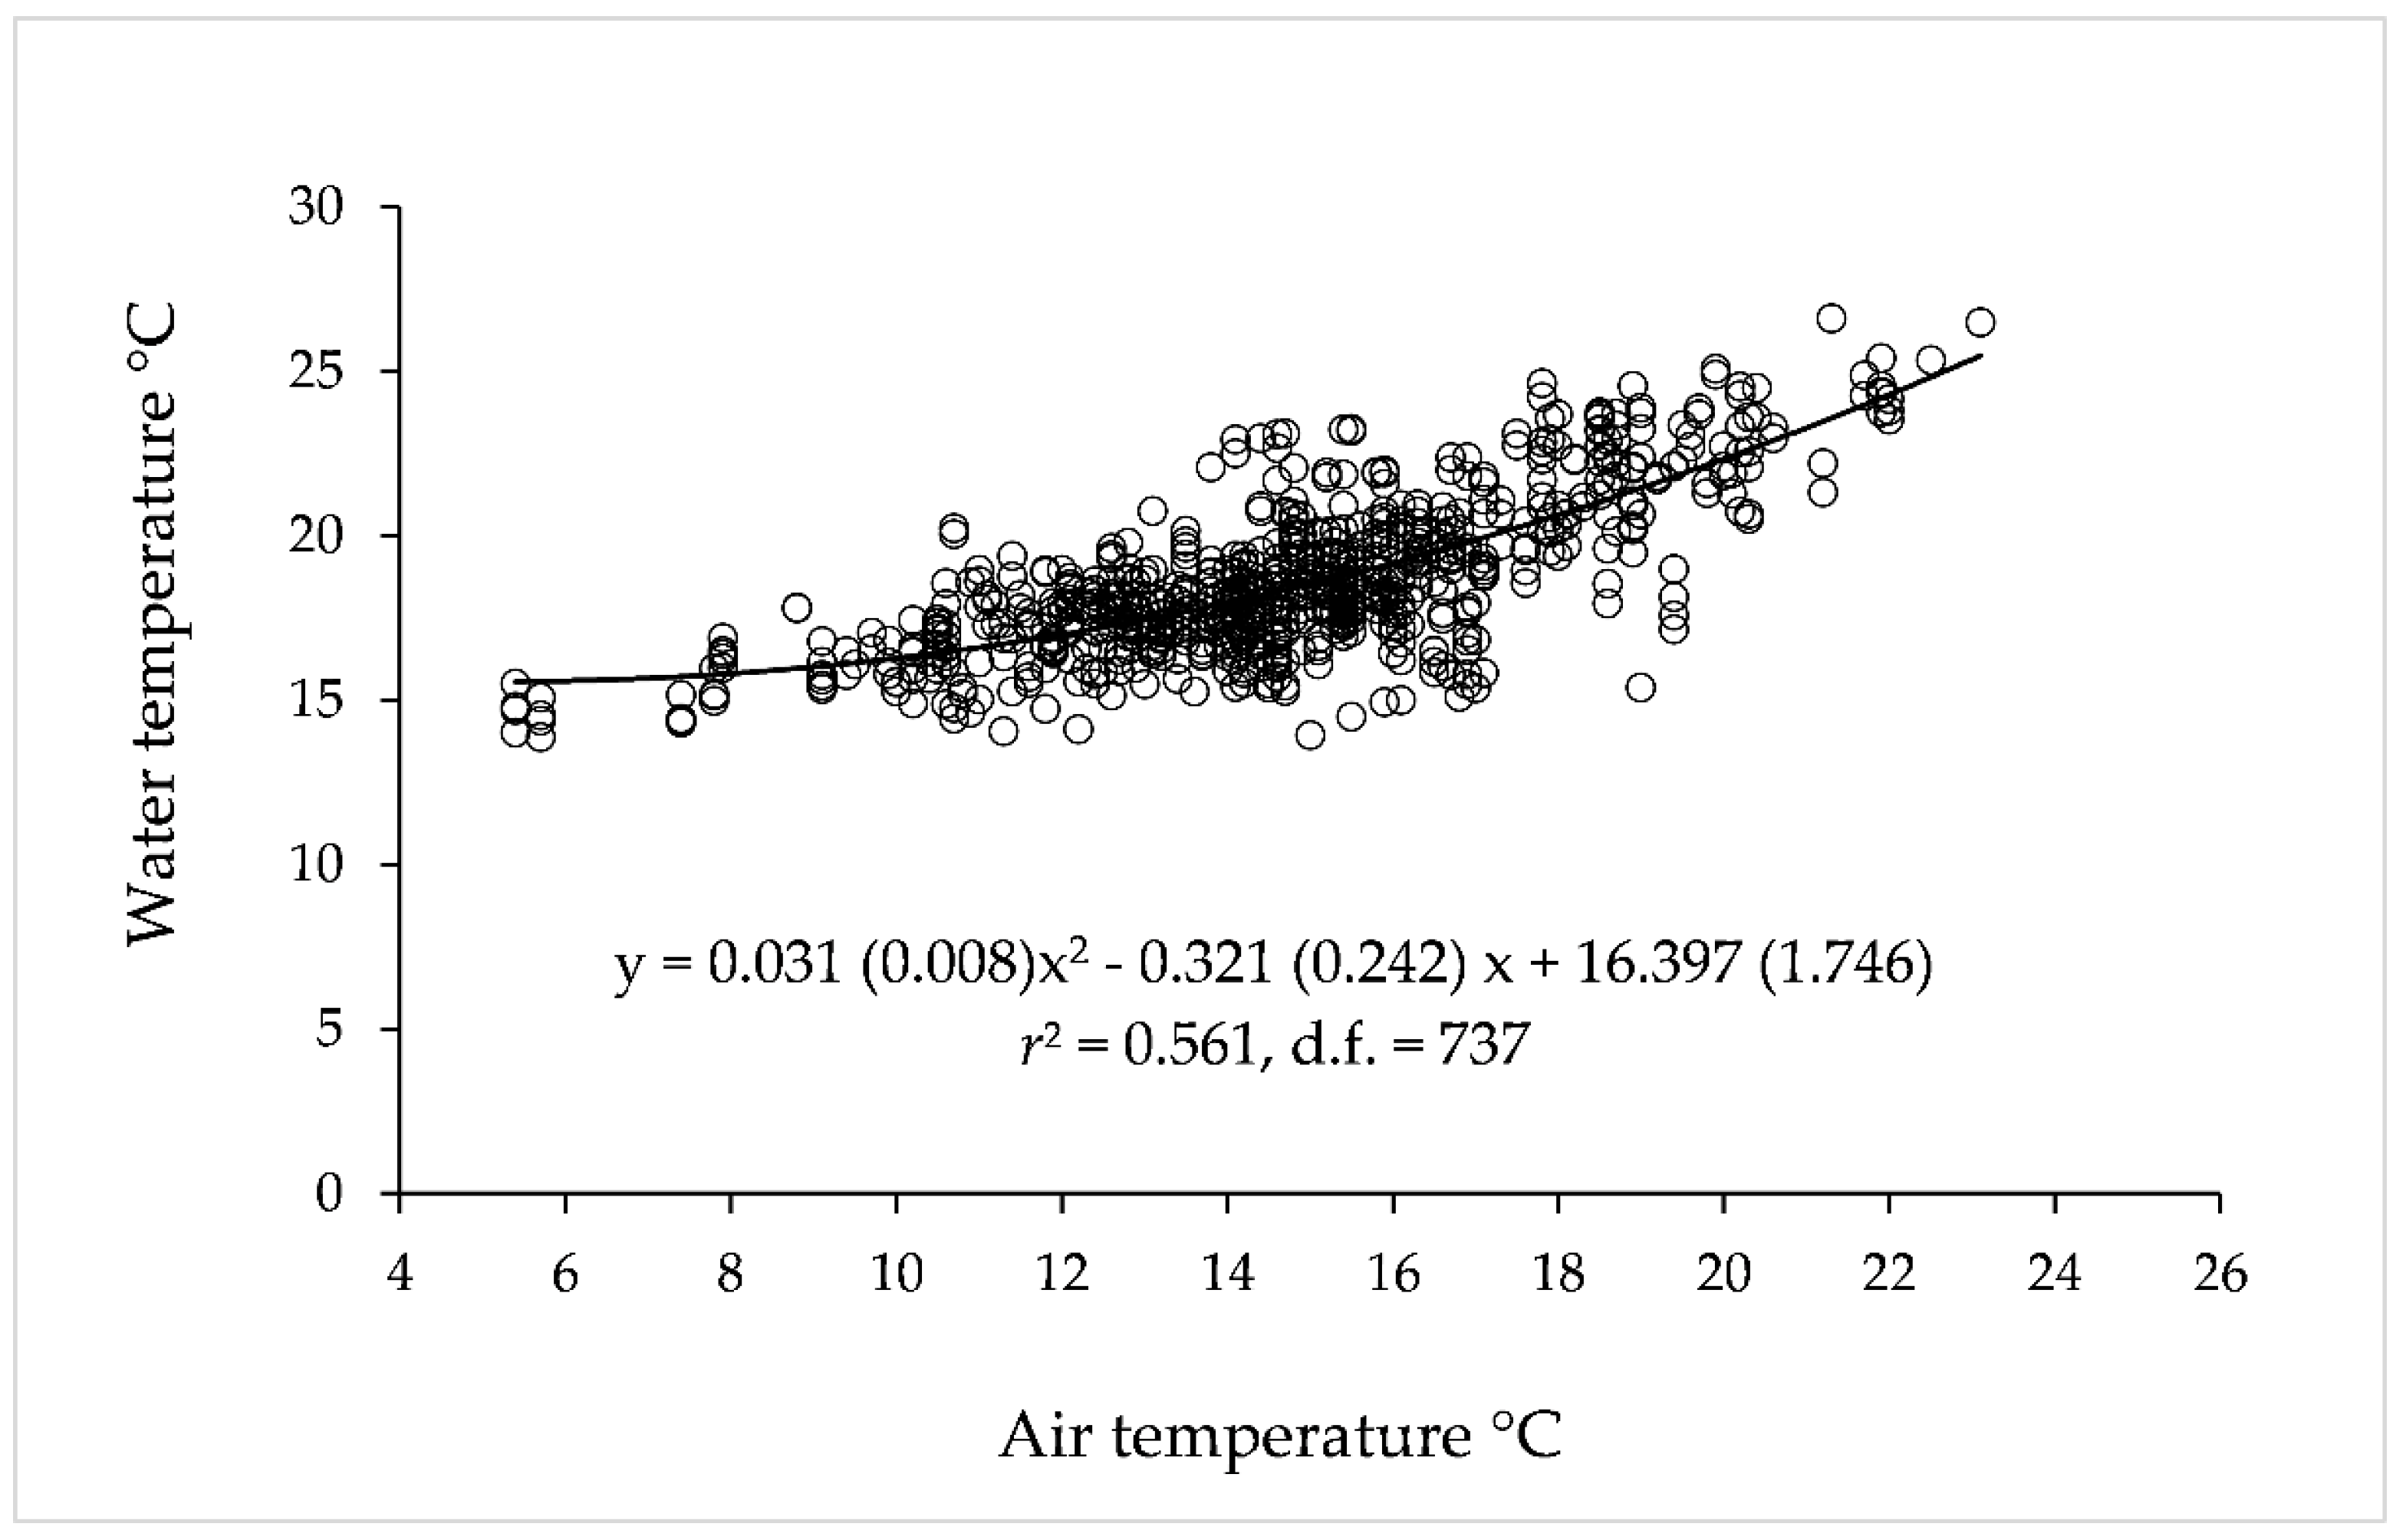
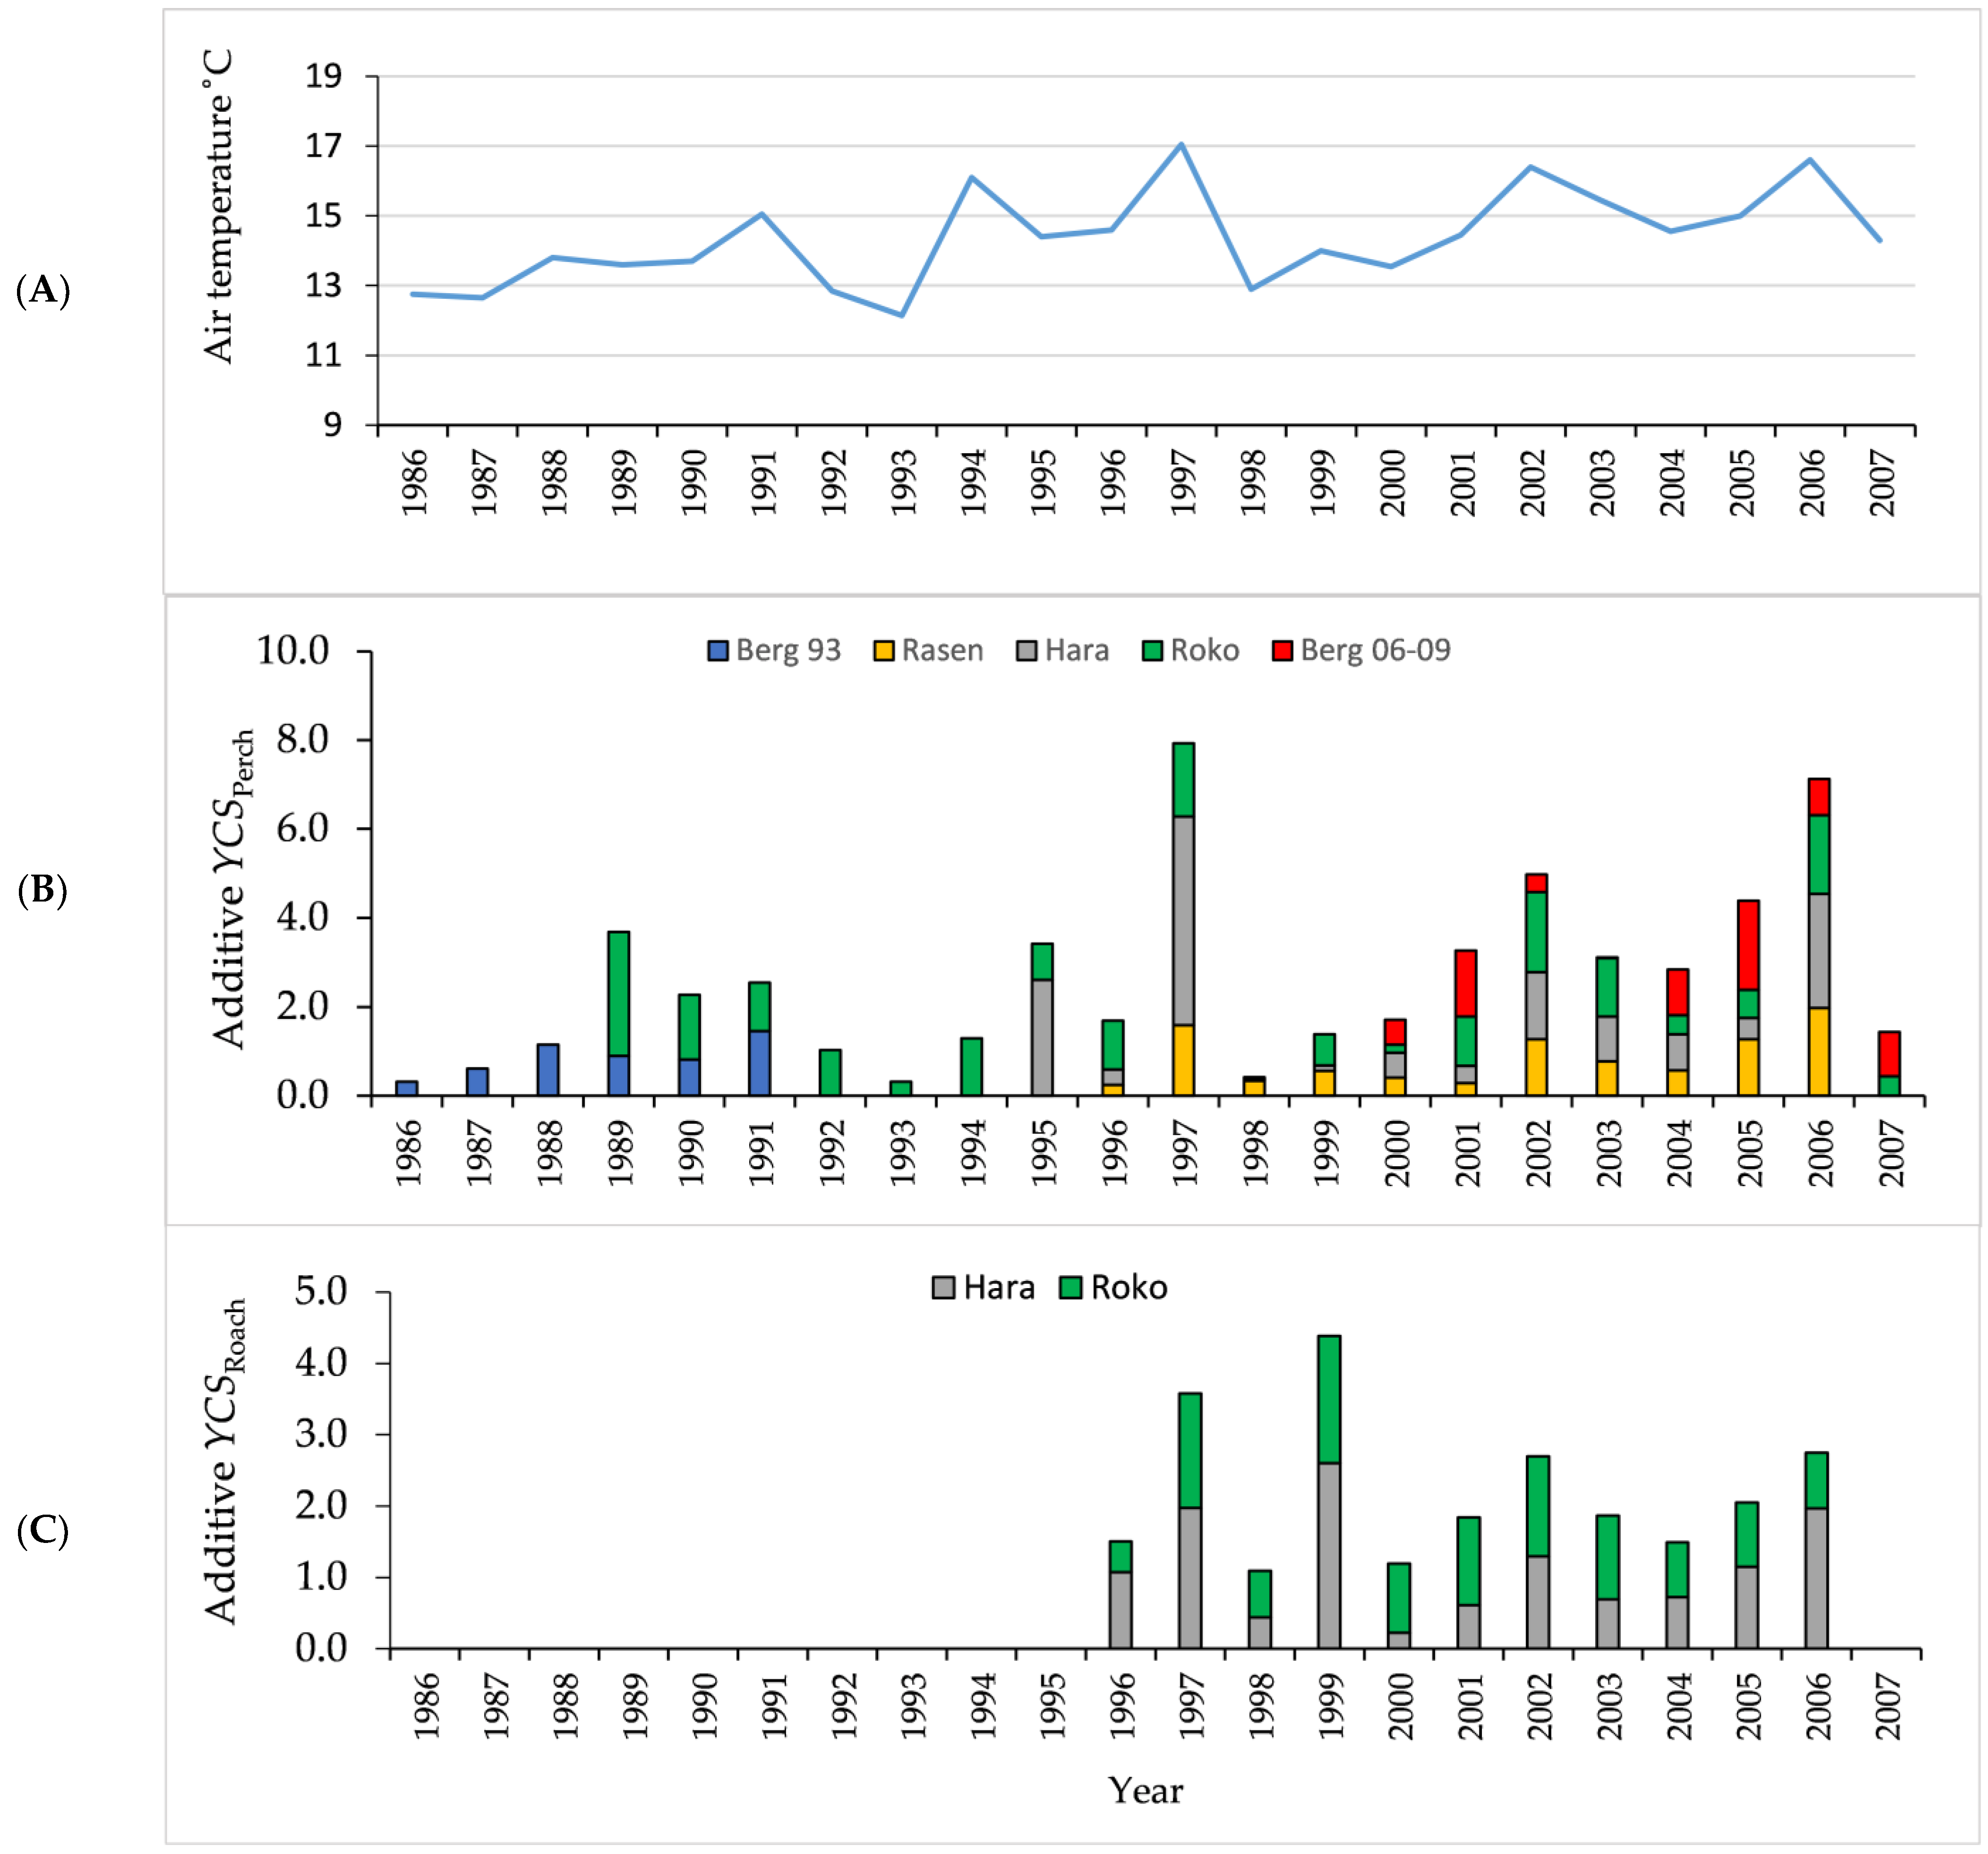
3.1. Air and Water Temperature

A curved model of the pooled water temperature recordings from the four studied lakes revealed a significant correlation between lake water and air temperature in July and August, as measured at the Haugedalen meteorological station. The air temperature explained 56% of the water temperature variation, and the model predicts that the water temperature exceeds 18 °C when the air temperature is 15.3 °C and exceeds 20 °C at an air temperature of 18.2 °C (Figure 2). Outside the exhibited time period, water temperature exceeded 12 °C during the third or fourth week of May and dropped below this temperature during the second or third week of September. Mean (Min–Max) daily air temperature (July–August) during recording was 14.7 (5.4–23.1) °C, as compared with a water temperature mean of 18.6 (13.9–26.1) °C. The water temperature was significantly lower in the most elevated location, Lake Bergsjøen, than in the other three locations, whereas Lake Harasjøen had the highest temperature (Table S1).

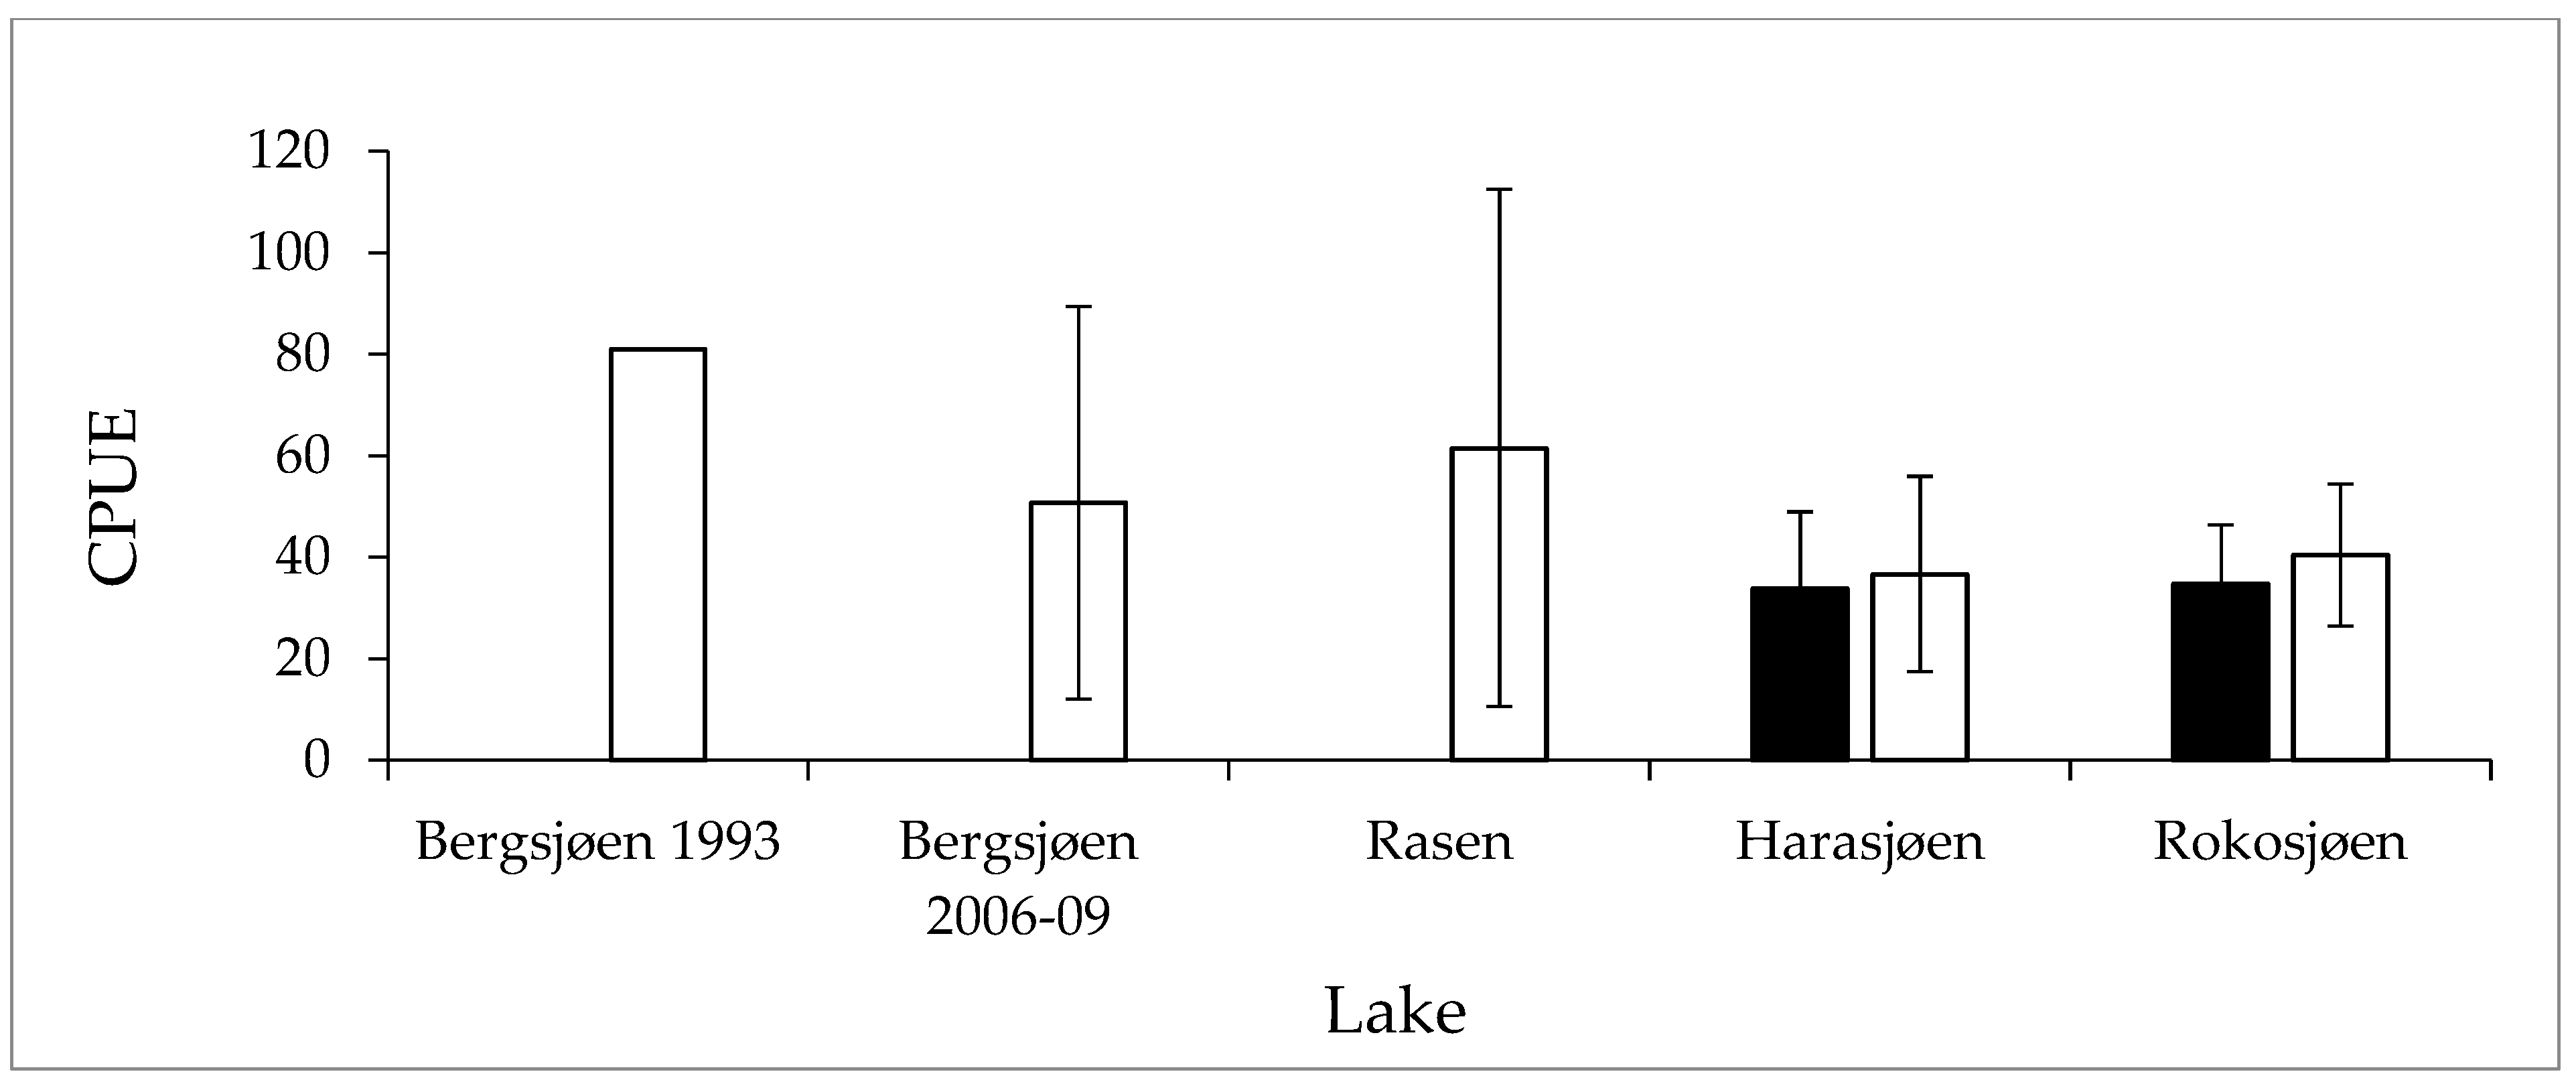
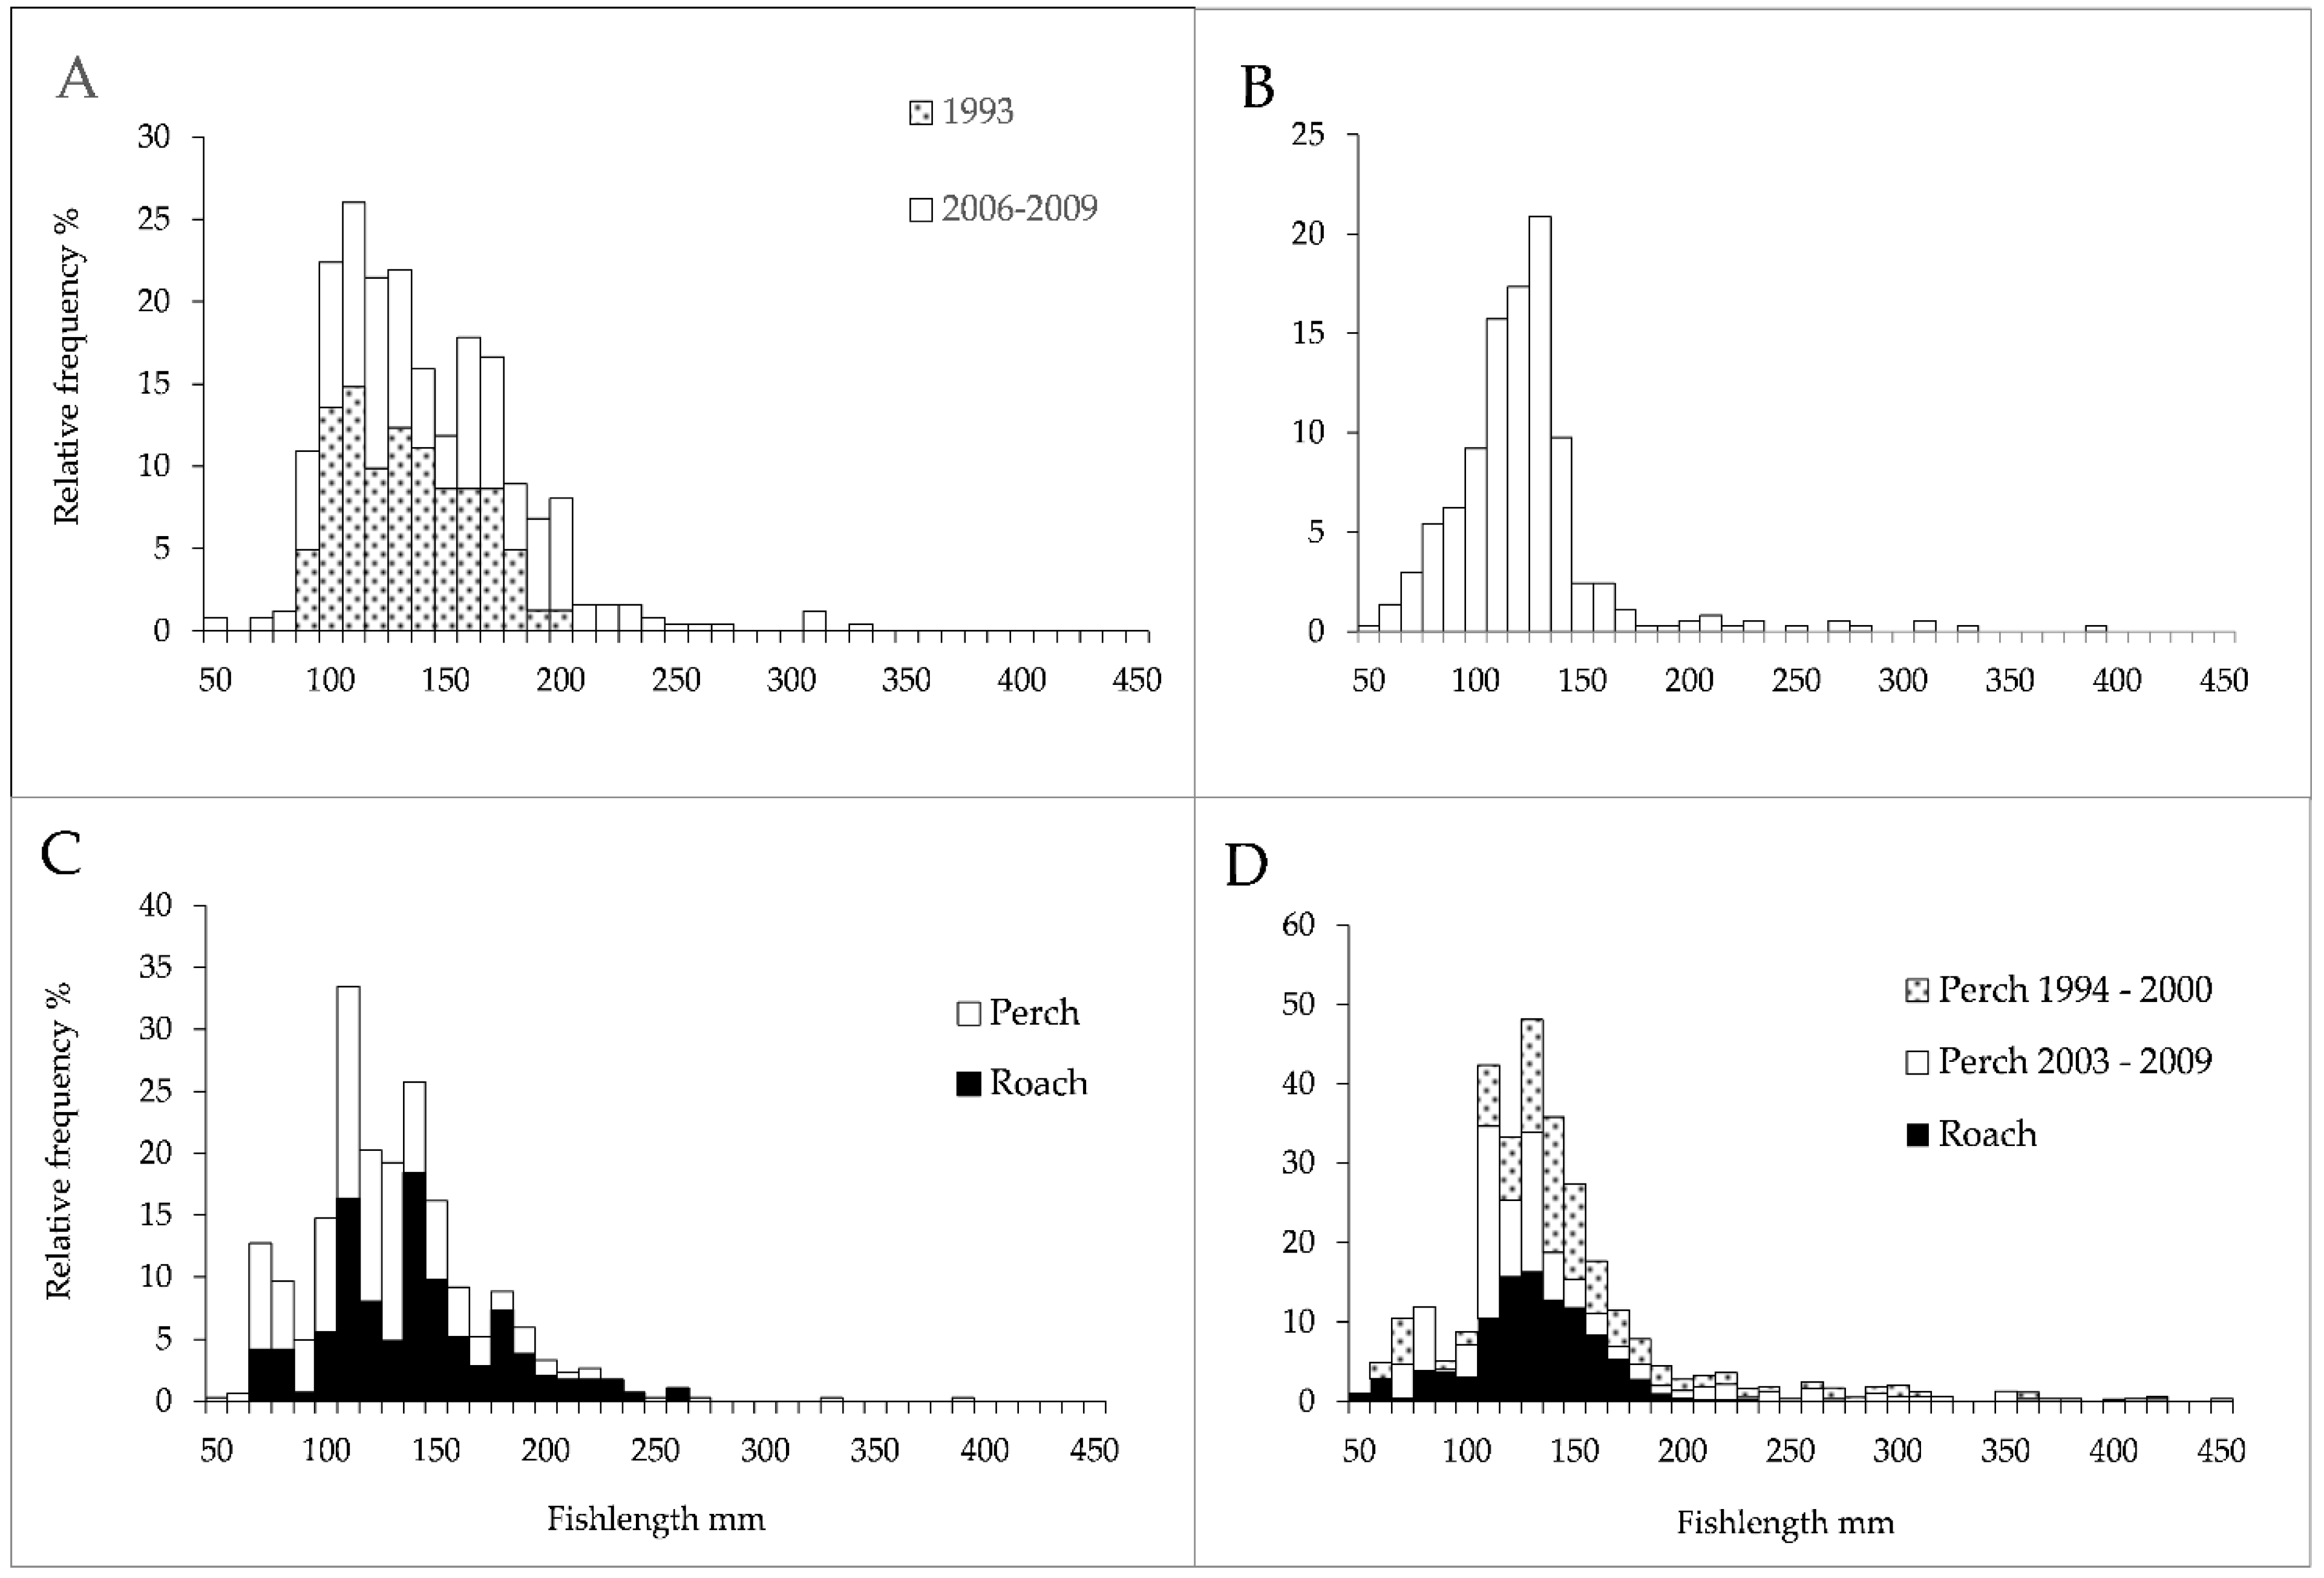
3.2. Fish Abundance and Size Structure

In Lake Bergsjøen, perch comprised 94% of the gill net catches, whereas 5 and 1%, respectively, were brown trout and whitefish, and the CPUE decreased substantially from the 1993 sample to samples from 2006 to 2009 (Figure 3), i.e., during the annual biomass removal. The proportion of perch larger than 150 mm increased from 25% in 1993 to 42% during 2006–2009 (χ2 = 7.08, p < 0.01) (Figure 4). In Lake Rasen, 90% of the catches were perch, whereas brown trout and minnow comprised 3.5% and 6.5%, respectively. The CPUE of perch in Lake Rasen was lower than in the 1993 sample from Lake Bergsjøen but higher than the CPUEs in the 2006–2009 samples, although the C.I.s were large. Only 8% of the perch catches were larger than 150 mm, and Lake Rasen was the only lake where minnows were caught in gill nets. In Lake Harasjøen, perch and roach comprised 52 and 46%, respectively, of the catches, while 1.9% were pike and 0.2% were ide. In Lake Rokosjøen, 50 and 39%, respectively, of catches were perch and roach, 4.1% were common bleak, 2.8% were chub, <0.5% were pike, and <0.1% were burbot. The CPUE of perch in Lake Harasjøen and Lake Rokosjøen was lower than that in Lake Bergsjøen during the biomass removal. The proportion of perch larger than 150 mm was 14% in Lake Harasjøen, whereas in Lake Rokosjøen, the proportion was 42% from 1993–2000 and decreased to 27% in the 2003–2009 samples (χ2 = 4.19, p < 0.05). The proportion of large perch (>200 mm) in Lake Rokosjøen was, on the other hand, stable over the approximately two decades (12.9 and 11.8% (χ2 = 0.73, p > 0.05)), and was substantially higher than in the other lakes (0–8.4% in Lake Bergsjøen, 3.8% in Lake Rasen, and 4% in Lake Harasjøen).
The CPUE of roach was similar in Lakes Harasjøen and Rokosjøen, and it was slightly lower than the CPUE of perch. The size distributions suggested that roach were slightly larger in Lake Harasjøen, as nine percent of the roach caught in this lake were larger than 200 mm, whereas only one percent of the roach caught in Lake Rokosjøen were larger than 200 mm.

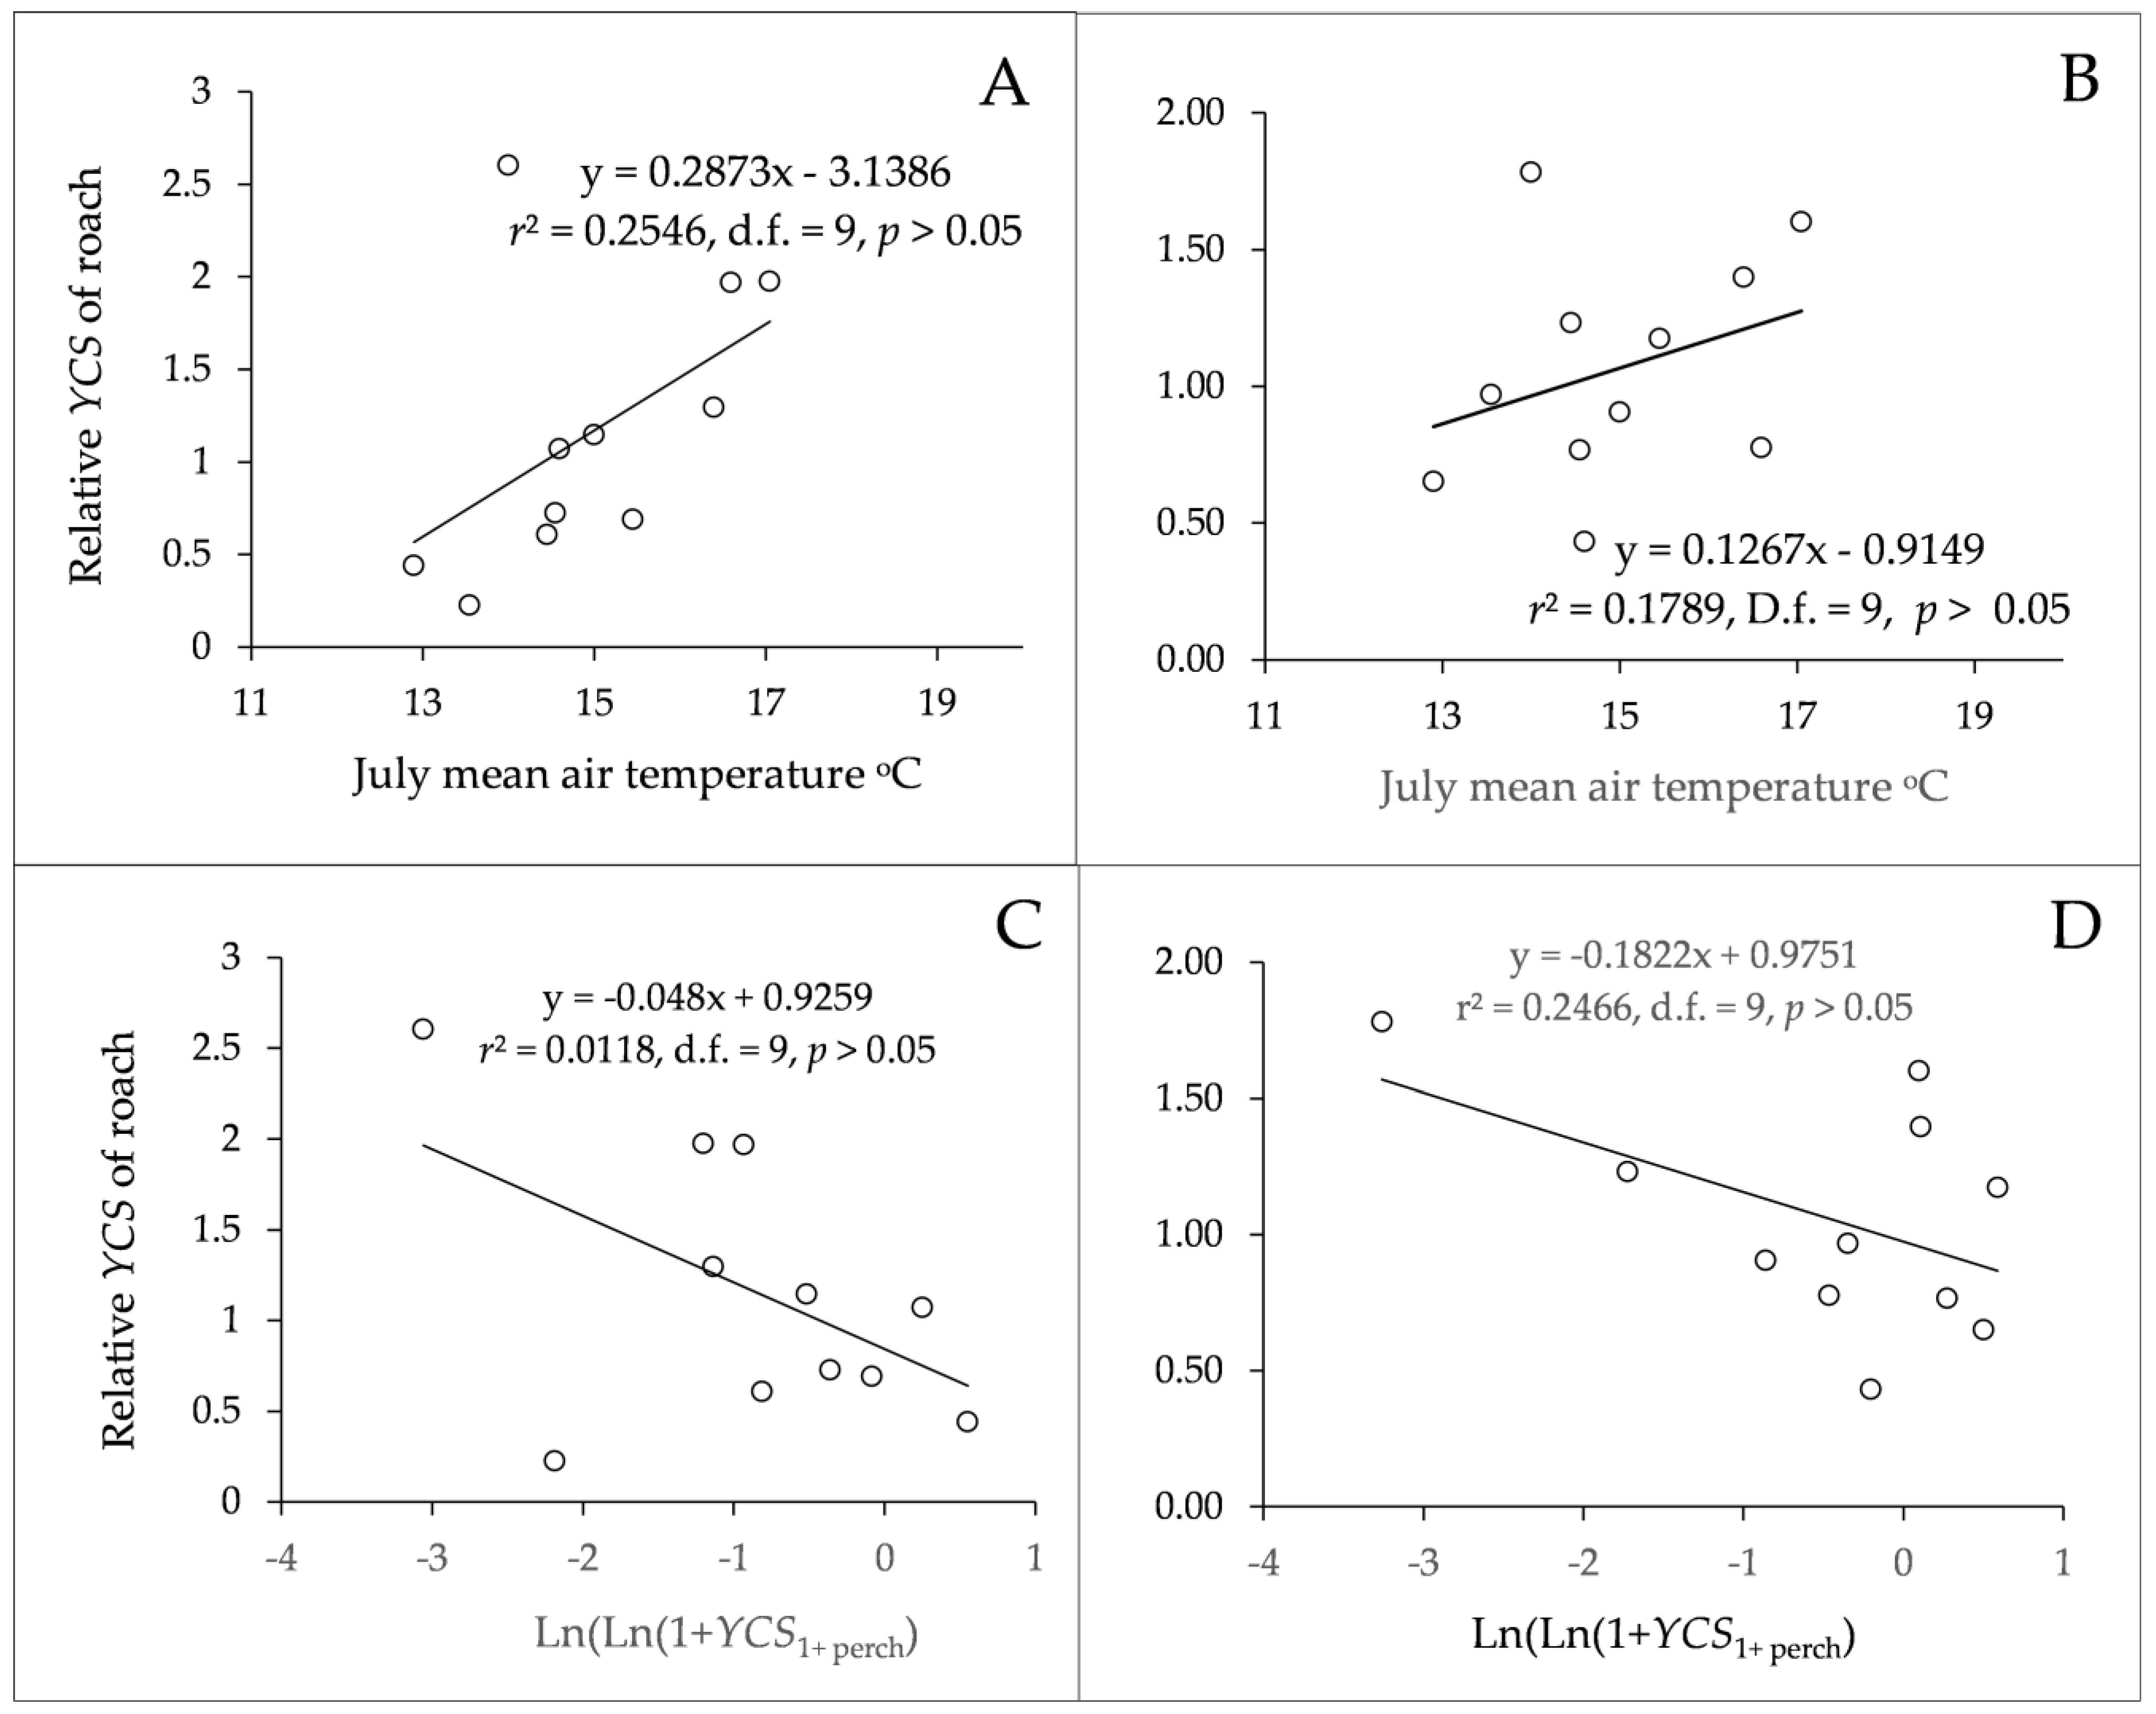
3.3. Age Structure and Year-Class Strength

The estimated relative year-class strength of perch (YCSPerch) was relatively high in 1994, 1997, 2002, and 2006, years with a high summer temperature, and, vice versa, at low temperatures in 1992, 1993, 1998, 2000, 2004, and 2007 (Figure 5). An exception was the pooled samples from 2006–2009 from Lake Bergsjøen. The discrepancy was due to a stronger year-class of 2001 as compared with the 2002 year-class and a stronger year-class of 2005 than of 2006, both differing from the other populations. The YCSRoach of 1997, 1999, 2002, and 2006 were relatively strong, and, among these, 1999 occurred despite a relatively low summer temperature that year (Figure 5). The temperature was even lower the year before, and the YCSPerch of 1998 was weak.
The perch catches included young-of-the-year (0+) to sixteen-year-old specimens, and most specimens (92.0, 90.0, 92.6, and 86.1% in Lakes Bergsjøen, Rasen, Harasjøen, and Rokosjøen, respectively) were one to six years old. Large perch were eight years or older, and normal perch were less than eight years old, except for in Lake Rasen, where most perch (83.3%) at age 8+ to 13+ were less than 200 mm. Roach age ranged from one to twelve years, and most specimens (91.3 and 78.8% in Lakes Harasjøen and Rokosjøen, respectively) were one to six years old.
Linear regressions of YCSPerch by July–August temperature gave significant correlations in all four lakes (Figure 6). The coefficient of explanation ranged from 0.56 to 0.86 and was lowest in Lake Harasjøen and highest in Lake Bergsjøen in 1993. The YCSRoach was positively but not significantly correlated with the mean air temperature of July in Lake Harasjøen and Lake Rokosjøen (Figure 7).
Furthermore, there was a non-significant negative relationship between YCSRoach and the ln(ln(1 + YCS1+perch) in both lakes with roach. Adding both predictors in Figure 7 to models for Lake Harasjøen and Lake Rokosjøen gave close to significant total models (p = 0.06–0.07), and a significant negative effect of ln(ln(1 + YCS1+perch) in Lake Rokosjøen (Table 3).
The mean and coefficient of variation (S.D./mean) of YCSPerch across lakes and years were 0.97 and 0.82, respectively, as compared with 1.08 and 0.53, respectively, for YCSRoach, i.e., YCSPerch was more variable, and the ratio of (the strongest): (the weakest year-class) was 117 for perch and 7.3 for roach.

3.4. Growth and Temperature

Annual means of ln transformed individual growth rates G of age 2+ to 5+ normal perch were significantly positively correlated with air temperature in July or July–August, and, expectedly, G was negatively related to fish age (Table 4A). Age was the most significant predictor, explaining 67 to 97% of the growth variation of perch, whereas temperature explained 1.6 to 4.8% of growth variation. When accounting for the effect of age, temperature explained 14.5 to 36.4% of perch growth variation. Female growth rate was close to significantly higher than for males in Lake Bergsjøen, whereas the difference was non-significant in the other three.
For roach, the growth model was significant only for Lake Rokosjøen, where Age explained 78.6% of roach growth variation and August temperature explained 7.1% of growth variation. Adjusted for Age, temperature explained 33.2% of growth variation in Lake Rokosjøen. The slope of the temperature effect on growth was 0.116–0.221 for perch and 0.038–0.096 for roach, i.e., considerably lower for roach.

3.5. Growth Acceleration

Both normal and large perch showed decreasing G by age, but for large perch, G increased from one year to the next (accelerating growth) at some age after maturation, assumed to indicate transformation to a piscivorous stage. The growth shift occurred most frequently in years following a year with a high summer temperature, i.e., commonly in years with a high abundance of 1+ perch, rather than of 0+ perch or roach. The growth acceleration occurred at age four to eight years, corresponding to a fish length of 150 to 200 mm, and the growth rate increase ∆G from one year to the next (∆G = GiGi−1), regardless of age or calendar year, ranged from −1.19 to 0.86. The mean G (Min–Max) of normal perch was 0.34 (0.09–0.97) at the fourth year, 0.23 (0.04–0.52) at the fifth year, and 0.22 (0.04–0.71) at the sixth year, whereas for large perch, the means were 0.53 (0.15–1.72), 0.54 (0.09–1.40), and 0.50 (0.09–1.10) at age 4+, 5+, and 6+, respectively. Interestingly, mean G at age 5+ to 6+ was approximately twice as high for the large perch as compared with the normal perch, although G Max for 4+ and 6+ of normal perch were both > 0.69, corresponding to a doubling in weight (ln(2) = 0.69), indicating that growth acceleration had already taken place among some of the individuals characterized as normal perch.
The linear model with response variable G of large perch at age 5+ and older (n = 63) showed positive correlation with perch year-class strength of the foregoing year, i.e., YCS1+perch (r2 = 0.33, p < 0.05, Figure 8), but not for the year-class strength of the same year (r2 = 0.02, p > 0.05), neither with the summer air temperature (r2 = 0.03, p > 0.05) nor YCS of 0+ or 1+ roach (p > 0.05).

3.6. Stomach Content

Stomach samples were taken from 20 large perch (215–465 mm long) from Lake Rokosjøen, and 15 (75%) had content, of which 13 (87%) contained fish, comprising in total three 80–130 mm long perch, four 100–160 mm long roach, and two 80–110 mm long common bleak. Four had unidentifiable remnants of fish. Ruffe was not detected in any stomachs, and only one specimen, a 375 mm long perch, had more than one identifiable fish in its stomach (two 100 mm long roaches). The highest ratio (prey length): (predator length) was approximately 0.5. Large perch, therefore, were able to predate one-year-old conspecifics, as these reached 100 mm or less during their second year of life.

4. Discussion

The relative year-class strength of perch estimated from age structure was positively correlated with the mean air temperature from July–August in the four studied lakes. This corresponds with what Linløkken [41] found in 12 of 18 perch populations situated within the same county, and what Böhling et al. [43] found in 14 of 23 perch populations in Baltic coastal areas. Le Cren [40] and Tolonen et al. [42] reported that perch YCS was positively correlated with the number of days with temperatures above 14 °C and 10 °C, respectively.
The allopatric perch in Lake Bergsjøen and Lake Rasen had, according to the CPUE, the highest perch densities and the best correlations between YCS and temperature before biomass removal started in Lake Bergsjøen. Biomass removal resulted in lower perch density and an increased proportion of perch larger than 150 mm, which could potentially affect recruitment. Nevertheless, the population structure in Lake Rokosjøen, with an even higher proportion of perch larger than 150 mm, did not hamper the significant effect of temperature on year-class strength. The lack of correlation in the samples from Lake Bergsjøen from 2006–2009 might be due to the annual biomass removal affecting the age structure of adult fish. Lake Rasen had the lowest fraction of perch larger than 150 mm, and the lake had the most colored water, a disadvantage to visually searching predators, such as perch. This is consequently an advantage to a potential prey species, such as minnow, and could be the reason for the presence of minnow in the gill net catches in contrast to the other lakes.
The CPUEs of perch and roach in the sympatric populations were rather similar, and assuming a positive relationship between the CPUE and fish abundance, the larger proportion of large perch in Lake Rokosjøen did not seem to affect the abundance of perch or roach substantially when compared with Lake Harasjøen. Linløkken et al. [5], on the other hand, found a negative relationship between the CPUE of perch and the proportion of large perch when analyzing 25 perch populations by means of unconstrained redundancy analysis.
The temperature effect on the YCS of roach was non-significant, and a negative effect of the abundance of one-year-old perch was suggested in Lake Rokosjøen. One-year-old perch are shown to predate on perch and roach fry [72]. High summer temperature resulting in strong year-classes of perch in one year may therefore reduce roach recruitment in the subsequent year. Low July–August temperatures, on the contrary, will, according to the YCSPerch models, result in weak perch recruitment and a low abundance of 1+ perch in the following year, favoring recruitment of sympatric roach.
The ratio (strongest YCS):(weakest YCS) of 117 for perch and 7.3 for roach suggested higher variability for perch, and this is supported by other studies. Willemsen [73] found the ratio to be 100, and Buijse [74] found the ratio to be 400 for perch, whereas Grenouille et al. [46] found the ratio to be 15.3 for roach. Positive effects of temperature on roach YCS are shown in a study from the River Rhone in France [46] and in a review study covering seven rivers in England [45]. Both studies showed that temperature-dependent growth of young-of-the-year was a decisive factor for a strong YCS.
Instantaneous growth rates of perch were also positively correlated with mean air temperature in July and/or August, and temperature explained 14.5 to 36.4% of variation when accounting for the effect of age. The temperature effect on roach growth was less and was non-significant in one lake. The slope of the growth–temperature regression was roughly twice as high for perch, so a temperature increase will probably affect the growth of perch more than that of roach. Le Cren [39] found that perch growth was positively correlated with day-degrees over 14 °C in Lake Windermere in England, whereas Tolonen [42] found that perch growth in a lake in northern Finland was positively correlated with day-degrees above 10 °C. The lower temperature limit in northern Finland was assumed to be due to an adaptation to conditions at a high latitude. Bearnsley and Britton [49] found roach growth to correlate positively with the number of degree days > 12 °C in River Wensum in eastern England.
The examples above were from habitats with either perch or roach present but not in sympatry. Linløkken and Hesthagen [24] found a correlation between individual perch growth and summer air temperature in a lake where roach were close to extinction due to acidification, which differed from perch and roach growth in three neighboring lakes where roach dominated numerically. In those three lakes, neither perch nor roach growth were correlated with temperature, and it was suggested that competitive interactions might mask temperature effects. These lakes, or, rather, tarns, were smaller (10–21 ha) than those in the present study, and both species interactions and air temperature effects may be different in small lakes due to lower habitat diversity and, probably, higher summer water temperatures.
Back-calculated growth rates of age 5+ and older large perch from Lake Rokosjøen were significantly positively correlated with a relative abundance of 1+ perch, suggesting that the availability of 1+ perch of approximately 100 mm length triggered growth acceleration due to an ontogenetic shift. This ontogenetic shift led to an approximate doubling of individual growth rates, starting at age 4+ to 8+ and at a size of 150 to 200 mm. This corresponds to the conclusions of Allen [56], LeCren [25], and Person et al. [20]. Lake Rokosjøen harbors common bleak and ruffe, in contrast to the other lakes, and this could be decisive for the larger proportion of large perch. Watercolor, i.e., visibility, was similar to that in Lake Harasjøen.
Ontogenetic shift of perch in Lake Rokosjøen probably begins with predation of young-of-the year, and this behavior is favored when fry abundance is high [75]. The growth response occurred most frequently in years when one-year-old perch were abundant. This finding corresponds with Persson’s [20] conclusion in a study on piscivory and the growth of perch, in which no growth response occurred when predating young-of-the-year, whereas feeding on one-year-old perch did show a growth response. Le Cren’s result in Lake Windermere differs, as growth acceleration occurred in years when strong year-classes occurred [25].
Considering observations of global temperature increases, whether caused by human activity or not, an observed increase of approximately 0.2 °C per decade [76] (and possibly accelerating) constitutes 1.0 °C in 50 years. Meanwhile, lake water temperature increases more, with an average 0.35 °C increase from 1985 to 2009 on a global scale, and even twice of that in seasonally ice-covered, sun-exposed lakes [77]. This may increase perch recruitment and abundance, possibly at the cost of sympatric roach, at least in oligotrophic and mesotrophic lakes, whereas increasing eutrophy will, in general, favor cyprinids due to lowered water clarity [35,36].
Temperature increases may also increase the proportion of large perch and increase individual growth. Perch’s tendency to turn piscivorous is shown to be positively correlated with temperature and growth rate [72]. It may therefore be hypothesized that perch will execute top–down control of roach and other sympatric cyprinid populations [78,79], which, in turn, will reduce the cyprinids’ predation on large algae-feeding zooplankton species. From a lake management perspective, the exploitation of large perch should therefore be limited, preferably by practicing catch–release angling, or ended. An additional argument for catch–release is the fact that large perch are often less suitable as human food due to a high content of environmental toxins [80].

5. Conclusions

The global air temperature increase is beyond doubt, and the temperature of lake water increases even faster than air temperature. This will probably affect poikilotherm aquatic organisms more than terrestrial organisms. Perch and roach are widespread freshwater fish species in the boreal region, often occurring in sympatry. Interspecific interactions include both competition and predator prey roles where perch is the predator, primarily when their size reaches 200 mm or more. This piscivory of perch may potentially control recruitment of both conspecifics and other species, such as roach and other cyprinids. Recruitment of perch was shown to be positively related to summer temperature in July and August in the present study, whereas the temperature effect was more obscure for roach recruitment and seemed to be suppressed by a negative effect of 1+ perch on roach fry. Warm summers increased perch recruitment the most, and abundant one-year-old perch seemed to trigger the transformation of perch to piscivory. Summer temperature increases may therefore enforce perch recruitment in general and possibly increase the proportion of large predatory perch.

Supplementary Materials

The following supporting information can be downloaded at: https://www.mdpi.com/article/10.3390/fishes8060295/s1, Table S1: Linear model of water temperature affected by air temperature and location; Table S2: Non-parametric Spearman correlation tests between relative year-class strength (YCS) and perch and roach and monthly mean air temperatures; File S1: data.

Funding

This research received no external funding.

Institutional Review Board Statement

Sampling for this study (registered in Cristin-ID: 404398) was conducted before our present institution, Inland Norway University of Applied Sciences, and its Research Ethics Committee, were founded, and the Norwegian Act on Experiments on Animals includes only animals kept alive, for some purpose, after catching. The gill net sampling, nevertheless, was conducted in accordance with Norwegian law for salmon and inland fishery, in agreement with, and partly in cooperation with, the fishing rights holders.

Data Availability Statement

Acknowledgments

I would like to thank Ole Mattis Lien and Sigbjørn Stensrud from the Stange Hunting and Fishing Committee, and Ragnar Jensen and Atle Stenberg from the Romedal & Vallset Hunting and Fishing Committee, for their valuable assistance with the fieldwork.

Conflicts of Interest

The author declares no conflict of interest.

References

  1. Lindsey, R.; Dahlman, L. Climate Change: Global Temperature. 2022. Available online: https://www.climate.gov/news-features/understanding-climate/climate-change-global-temperature (accessed on 9 May 2023).
  2. Dore, M.H.I. Climate change and changes in global precipitation patterns: What do we know? Environ. Int. 2005, 31, 1167–1181. [Google Scholar] [CrossRef] [PubMed]
  3. Arunrat, N.; Sereenonchai, S.; Chaowiwat, W.; Wang, C. Climate change impact on major crop yield and water footprint under CMIP6 climate projections in repeated drought and flood areas in Thailand. Sci. Total Environ. 2022, 807, 150741. [Google Scholar] [CrossRef] [PubMed]
  4. EPA. U.S. Environmental Protection Agency. Climate Change Indicators: Ecosystems. 2021 02.082022. Available online: https://www.epa.gov/climate-indicators/ecosystems (accessed on 9 May 2023).
  5. Linløkken, A.; Bergman, E.; Greenberg, L.; Seeland, P.A.H. Environmental correlates of population variables of perch (Perca fluviatilis) in boreal lakes. Environ. Biol. Fishes 2008, 82, 401–408. [Google Scholar] [CrossRef]
  6. Linløkken, A.N.; Bergman, E.; Greenberg, L. Effect of temperature and roach Rutilus rutilus group size on swimming speed and prey capture rate of perch Perca fluviatilis and R-rutilus. J. Fish Biol. 2010, 76, 900–912. [Google Scholar] [CrossRef]
  7. Neuman, E.; Thoresson, G.; Sandstrom, O. Swimming activity of perch, Perca fluviatilis, in relation to temperature, day-length and consumption. Ann. Zool. Fenn. 1996, 33, 669–678. [Google Scholar]
  8. Linløkken, A.; Haugen, T.O. Density and temperature dependence of gill net catch per unit effort for perch, Perca fluviatilis, and roach, Rutilus rutilus. Fish. Manag. Ecol. 2006, 13, 261–269. [Google Scholar] [CrossRef]
  9. Fiogbé, E.D.; Kestemont, P. Optimum daily ration for Eurasian perch Perca fluviatilis L. reared at its optimum growing temperature. Aquaculture 2003, 216, 243–252. [Google Scholar] [CrossRef]
  10. Hardewig, I.; Van Dijk, P.L.M. Is digestive capacity limiting growth at low temperatures in roach? J. Fish Biol. 2003, 62, 358–374. [Google Scholar] [CrossRef]
  11. Van Dijk, P.L.M.; Staaks, G.; Hardewig, I. The effect of fasting and refeeding on temperature preference, activity and growth of roach, Rutilus rutilus. Oecologia 2002, 130, 496–504. [Google Scholar] [CrossRef]
  12. Persson, L. Competition-induced switch in young of the year perch, Perca fluviatilis—An experimental test of resource limitation. Environ. Biol. Fishes 1987, 19, 235–239. [Google Scholar] [CrossRef]
  13. Persson, L. Asymmetries in competitive and predatory interactions in fish populations. In Size-Structured Populations: Ecology and Evolution; Ebenman, B., Persson, L., Eds.; Springer: Berlin/Heidelberg, Germany, 1988. [Google Scholar] [CrossRef]
  14. Persson, L.; Bystrom, P.; Wahlstrom, E.; Andersson, J.; Hjelm, J. Interactions among size-structured populations in a whole-lake experiment: Size- and scale-dependent processes. Oikos 1999, 87, 139–156. [Google Scholar] [CrossRef]
  15. Lessmark, O. Competition between Perch (Perca fluviatilis) and Roach (Rutilus rutilus) in South Swedish Lakes; Lund University: Lund, Sweden, 1983. [Google Scholar]
  16. Persson, L. Effects of intraspecific and interspecific competition on dynamics and size structure of a perch Perca fluviatilis and a roach Rutilus rutilus population. Oikos 1983, 41, 126–132. [Google Scholar] [CrossRef]
  17. Persson, L.; Greenberg, L.A. Interspecific and intraspecific size class competition affecting resource use and growth of perch, Perca fluviatilis. Oikos 1990, 59, 97–106. [Google Scholar] [CrossRef]
  18. Jacobsen, L.; Berg, S.; Broberg, M.; Jepsen, N.; Skov, C. Activity and food choice of piscivorous perch (Perca fluviatilis) in a eutrophic shallow lake: A radio-telemetry study. Freshw. Biol. 2002, 47, 2370–2379. [Google Scholar] [CrossRef]
  19. Pirhonen, J.; Muuri, L.; Kalliokoski, S.M.; Puranen, M.M.; Marjomäki, T.J. Seasonal and ontogenetic variability in stomach size of Eurasian perch (Perca fluviatilis L.). Aquac. Int. 2019, 27, 1125–1135. [Google Scholar] [CrossRef]
  20. Persson, L.; Byström, P.; Wahlström, E. Cannibalism and competition in Eurasian perch: Population dynamics of an ontogenetic omnivore. Ecology 2000, 81, 1058–1071. [Google Scholar] [CrossRef]
  21. Holmgren, K.; Appelberg, M. Effects of environmental factors on size-related growth efficiency of perch, Perca fluviatilis. Ecol. Freshw. Fish 2001, 10, 247–256. [Google Scholar] [CrossRef]
  22. Persson, L.; Diehl, S.; Johansson, L.; Andersson, G.; Hamrin, S.F. Trophic Interactions In Temperate Lake Ecosystems—A Test of Food-Chain Theory. Am. Nat. 1992, 140, 59–84. [Google Scholar] [CrossRef]
  23. Olin, M.; Vinni, M.; Lehtonen, H.; Rask, M.; Ruuhijärvi, J.; Saulamo, K.; Ala-Opas, P. Environmental factors regulate the effects of roach Rutilus rutilus and pike Esox lucius on perch Perca fluviatilis populations in small boreal forest lakes. J. Fish Biol. 2010, 76, 1277–1293. [Google Scholar] [CrossRef]
  24. Linløkken, A.N.; Hesthagen, T. The interactions of abiotic and biotic factors influencing perch Perca fluviatilis and roach Rutilus rutilus populations in small acidified boreal lakes. J. Fish Biol. 2011, 79, 431–448. [Google Scholar] [CrossRef]
  25. Le Cren, E.D. Exceptionally big individual perch (Perca fluviatilis L.) and their growth. J. Fish Biol. 1992, 40, 599–625. [Google Scholar] [CrossRef]
  26. Stenson, J.A.E. Predator-prey relations between fish and invertebrate prey in some forest lakes. Rep. Inst. Freshw. Res. Drottningholm 1979, 58, 166–183. [Google Scholar]
  27. Linløkken, A.N. Effects of Lake Productivity on Density and Size Structure of Pelagic Fish Estimated by Means of Echosounding in 17 Lakes in Southeast Norway. Sensors 2021, 21, 3391. [Google Scholar] [CrossRef] [PubMed]
  28. Sanni, S.; Wærvågen, S.B. Oligotrophication as a result of planktivorous fish removal with rotenone in the small, eutrophic lake Mosvatn, Norway. Hydrobiologia 1990, 200, 263–274. [Google Scholar] [CrossRef]
  29. Olin, M.; Rask, M.; Ruuhijärvi, J.; Keskitalo, J.; Horppila, J.; Tallberg, P. Effects of biomanipulation on fish and plankton communities in ten eutrophic lakes of southern Finland. Hydrobiologia 2006, 553, 67–88. [Google Scholar] [CrossRef]
  30. Kagami, M.; Yoshida, T.; Gurung, T.; Urabe, J. Direct and indirect effects of zooplankton on algal composition in situ grazing experiments. Oecologia 2002, 133, 356–363. [Google Scholar] [CrossRef]
  31. Ginter, K.; Blank, K.; Haberman, J.; Kangur, A.; Kangur, K. Fish predation pressure on zooplankton in a large northern temperate lake: Impact of adult predators versus juvenile predators. Proc. Est. Acad. Sci. 2018, 67, 356–367. [Google Scholar] [CrossRef]
  32. Urrutia-Cordero, P.; Ekvall, M.K.; Hansson, L.-A. Controlling Harmful Cyanobacteria: Taxa-Specific Responses of Cyanobacteria to Grazing by Large-Bodied Daphnia in a Biomanipulation Scenario. PLoS ONE 2016, 11, e0153032. [Google Scholar] [CrossRef]
  33. Persson, L. Predator-Mediated Competition In Prey Refuges—The Importance of Habitat Dependent Prey Resources. Oikos 1993, 68, 12–22. [Google Scholar] [CrossRef]
  34. Claessen, D.; de Roos, A.M.; Persson, L. Dwarfs and Giants: Cannibalism and Competition in Siz… Structured Populations. Am. Nat. 2000, 155, 219–237. [Google Scholar] [CrossRef]
  35. Persson, L.; Diehl, S.; Johansson, L.; Andersson, G.; Hamrin, S.F. Shifts in fish communities along the productivity gradient of temperate lakes—Patterns and the importance of size-structured interactions. J. Fish Biol. 1991, 38, 281–293. [Google Scholar] [CrossRef]
  36. Svärdson, G. Interspecific population dominance in fish communities of Scandinavian lakes. Inst. Freshw. Res. Drottningholm Rep. 1977, 55, 144–172. [Google Scholar]
  37. Neuman, E. The growth and year-class strength of perch in some Baltic archipelagos, with special reference to temperature. Rep. Inst. Freshw. Res. Drottningholm 1976, 55, 51–70. [Google Scholar]
  38. Neuman, E. Activity of perch, Perca fluviatilis L. and roach, Rutilus rutilus (L.), in a Baltic Bay, with special reference to temperature. Inst. Freshw. Res. Drottningholm 1979, 58, 107–125. [Google Scholar]
  39. Le Cren, E.D. Observations on the growth of perch (Perca fluviatilis) over twenty-two years with special reference to effects of temperature and changes in population density. J. Anim. Ecol. 1958, 27, 287–334. [Google Scholar] [CrossRef]
  40. Le Cren, E.D.; Kipling, C.; McCormack, J.C. A Study of the Numbers, Biomass and Year-Class Strengths of Perch (Perca fluviatilis L.) in Windermere from 1941 to 1966. J. Anim. Ecol. 1977, 46, 281–307. [Google Scholar] [CrossRef]
  41. Linløkken, A. Temperature dependence of Eurasian perch (Perca fluviatilis) recruitment. In Percis III: The Third International Percid Fish Symposium; University of Wisconsin Sea Grant Institute: Madison, WI, USA, 2003; pp. 75–76. [Google Scholar]
  42. Tolonen, A.; Lappalainen, J.; Pulliainen, E. Seasonal growth and year class strength variations of perch near the northern limits of its distribution range. J. Fish Biol. 2003, 63, 176–186. [Google Scholar] [CrossRef]
  43. Böhling, P.; Hudd, R.; Lehtonen, H.; Karås, P.; Neuman, E.; Thoresson, G. Variations in year-class strength of different perch (Perca fluviatilis) populations in the Baltic Sea with special reference to temperature and pollution. Can. J. Fish. Aquat. Sci. 1991, 48, 1181–1187. [Google Scholar] [CrossRef]
  44. Karås, P. Recruitment of perch (Perca fluviatilis L) from Baltic coastal waters. Arch. Für Hydrobiol. 1996, 138, 99–121. [Google Scholar] [CrossRef]
  45. Britton, R.; Cowx, I.; Axford, S.; Frear, P. An overview of recruitment patterns of roach Rutilus rutilus (L.) between 1969 and 2001 in the rivers of England and their influence on population abundance. Ecohydrol. Hydrobiol. 2004, 4, 91–102. [Google Scholar]
  46. Grenouillet, G.; Hugueny, B.; Carrel, G.; Olivier, J.M.; Pont, D. Large-scale synchrony and inter-annual variability in roach recruitment in the Rhone River: The relative role of climatic factors and density-dependent processes. Freshw. Biol. 2001, 46, 11–26. [Google Scholar] [CrossRef]
  47. Barnsley, H. Factors Affecting the Growth and Recruitment of Cyprinid Populations of the River Wensum, Eastern England, with Special Reference to Roach Rutilus rutilus (L.). Master’s Thesis, Bournemouth University, Poole, UK, 2012; 17p. [Google Scholar]
  48. Beardsley, H.; Britton, J.R. Recruitment success in a roach Rutilus rutilus population of a hydrologically stable chalk river: Relative influences of temperature and flow. Ecol. Freshw. Fish 2012, 21, 168–171. [Google Scholar] [CrossRef]
  49. Beardsley, H.; Britton, J.R. Contribution of temperature and nutrient loading to growth rate variation of three cyprinid fishes in a lowland river. Aquat. Ecol. 2012, 46, 143–152. [Google Scholar] [CrossRef]
  50. Lehtonen, H. Potential effects of global warming on northern European freshwater fish and fisheries. Fish. Manag. Ecol. 1996, 3, 59–71. [Google Scholar] [CrossRef]
  51. Cowx, I.G.; Frear, P.A. Assessment of year class strength in freshwater recreational fish populations. Fish. Manag. Ecol. 2004, 11, 117–123. [Google Scholar] [CrossRef]
  52. Linløkken, A.N.; Sandlund, O.T. Recruitment of sympatric vendace (Coregonus albula) and whitefish (C. lavaretus) is affected by different environmental factors. Ecol. Freshw. Fish 2015, 25, 652–663. [Google Scholar] [CrossRef]
  53. Karås, P. Basic abiotic conditions for production of perch (Perca fluviatilis L) young-of-the-year in the Gulf of Bothnia. Ann. Zool. Fenn. 1996, 33, 371–381. [Google Scholar]
  54. Karås, P.; Thoresson, G. An application of a bioenergetics model to Eurasian perch (Perca fluviatilis L). J. Fish Biol. 1992, 41, 217–230. [Google Scholar] [CrossRef]
  55. Linløkken, A.; Kleiven, E.; Matzow, D. Population-Structure, Growth and Fecundity of Perch (Perca-fluviatilis L) in an Acidified River System in Southern Norway. Hydrobiologia 1991, 220, 179–188. [Google Scholar] [CrossRef]
  56. Allen, K.R. The food and migration of perch (Perca fluviatilis) in Windermere. J. Anim. Ecol. 1935, 4, 264–273. [Google Scholar] [CrossRef]
  57. Persson, L.; Claessen, D.; De Roos, A.M.; Bystrom, P.; Sjogren, S.; Svanback, R.; Wahlstrom, E.; Westman, E. Cannibalism in a size-structured population: Energy extraction and control. Ecol. Monogr. 2004, 74, 135–157. [Google Scholar] [CrossRef]
  58. Yazıcıoğlu, O.; Yılmaz, S.; Yazıcı, R.; Erbaşaran, M.; Polat, N. Feeding ecology and prey selection of European perch, Perca fluviatilis inhabiting a eutrophic lake in northern Turkey. J. Freshw. Ecol. 2016, 31, 641–651. [Google Scholar] [CrossRef]
  59. Appelberg, M.; Berger, H.M.; Hesthagen, T.; Kleiven, E.; Kurkilahti, M.; Raitaniemi, J.; Rask, M. Development and intercalibration of methods in Nordic freshwater fish monitoring. Water Air Soil Pollut. 1995, 85, 401–406. [Google Scholar] [CrossRef]
  60. Linløkken, A. Vertical distribution of brown trout (Salmo trutta) and perch (Perca fluviatilis) in an acidified lake. Water Air Soil Pollut. 1988, 40, 203–213. [Google Scholar] [CrossRef]
  61. Le Cren, E.D. The determination of the age and growth of perch (Perca fluviatilis) from opercular bone. J. Anim. Ecol. 1947, 16, 188–204. [Google Scholar] [CrossRef]
  62. Horppila, J.; Nyberg, K. The validity of different methods in the backcalculation of the lengths of roach—A comparison between scales and cleithra. J. Fish Biol. 1999, 54, 489–498. [Google Scholar]
  63. Coporation, O.C. Onset Data Loggers. 2021. Available online: https://www.onsetcomp.com/products/data-loggers?gclid=EAIaIQobChMIzumHieS88wIVAeuyCh2dUweBEAAYASAAEgK3ZvD_BwE (accessed on 9 May 2023).
  64. Nunn, A.D.; Frear, P.A.; Lee, M.; Cowx, I.G. Is there evidence for a shift in fish growth and recruitment success linked to climate change? J. Fish Biol. 2010, 77, 1780–1792. [Google Scholar] [CrossRef]
  65. Ricker, W.E. Computation and interpretation of biological statistics of fish populations. Bull. Fish. Res. Board Can. Bull. 1975, 191, 382. [Google Scholar]
  66. Robson, D.S.; Chapman, D.G. Catch Curves and Mortality Rates. Trans. Am. Fish. Soc. 1961, 90, 181–189. [Google Scholar] [CrossRef]
  67. Bagenal, T.B. Methods for Assessment of Fish Production in Fresh Waters; IBP Handbook; Blackwell: London, UK, 1978; Volume 3, 365p. [Google Scholar]
  68. Linløkken, A.; Seeland, P.A.H. Growth and production of perch (Perca fluviatilis L) responding to biomass removal. Ann. Zool. Fenn. 1996, 33, 427–435. [Google Scholar]
  69. Microsoft Excel 365. 2023. Available online: https://www.microsoft.com/en-us/microsoft-365/excel (accessed on 9 May 2023).
  70. R-Core-Team. R—A Language and Environment for Statistical Computing. 2020. Available online: https://www.r-project.org/ (accessed on 9 May 2023).
  71. Crawley, M.J. The R Book; Wiley: Chichester, UK, 2007. [Google Scholar]
  72. Mehner, T.; Schultz, H.; Bauer, D.; Herbst, R.; Voigt, H.; Benndorf, J. Intraguild predation and cannibalism in age-0 perch (Perca fluviatilis) and age-0 zander (Stizostedion lucioperca): Interactions with zooplankton succession, prey fish availability and temperature. Ann. Zool. Fenn. 1996, 33, 353–361. [Google Scholar]
  73. Willemsen, J. Population Dynamics of Percids in Lake IJssel and some Smaller Lakes in The Netherlands. J. Fish. Res. Board Can. 1977, 34, 1710–1719. [Google Scholar] [CrossRef]
  74. Buijse, A.D. Dynamics and Exploitation of an Unstable Percid Population. Ph.D. Thesis, University of Wageningen, Wageningen, The Netherlands, 1992; 168p. [Google Scholar]
  75. Dörner, H.; Berg, S.; Jacobsen, L.; Hülsmann, S.; Brojerg, M.; Wagner, A. The feeding behaviour of large perch Perca fluviatilis (L.) in relation to food availability: A comparative study. Hydrobiologia 2003, 506, 427–434. [Google Scholar] [CrossRef]
  76. NOAA. Monthly Global Climate Report for Annual 2020. State of the Climate 2022. Available online: https://www.ncei.noaa.gov/access/monitoring/monthly-report/global/202013 (accessed on 14 June 2022).
  77. O’Reilly, C.M.; Sharma, S.; Gray, D.K.; Hampton, S.E.; Read, J.S.; Rowley, R.J.; Schneider, P.; Lenters, J.D.; McIntyre, P.B.; Kraemer, B.M.; et al. Rapid and highly variable warming of lake surface waters around the globe. Geophys. Res. Lett. 2015, 42, 10773–10781. [Google Scholar] [CrossRef]
  78. Adámek, Z.; Mikl, L.; Šlapanský, L.; Jurajda, P.; Halačka, K. The diet of predatory fish in drinking water reservoirs—How can they contribute to biomanipulation efforts? Folia Zool. 2019, 68, 215–224, 210. [Google Scholar] [CrossRef]
  79. Persson, L.; Eklöv, P. Prey Refuges Affecting Interactions between Piscivorous Perch and Juvenile Perch and Roach. Ecology 1995, 76, 70–81. [Google Scholar] [CrossRef]
  80. Fjeld, E.; Rognerud, S. Mercury in Freshwater Fish from the South Norway in 1998–2002, Levels and Temporal Development; Norwegian Institute of Water Research: Oslo, Norway, 2004; p. 57. [Google Scholar]
Figure 1. Map showing the four studied lakes and marking the meteorological stations (MS) from which the temperature data were achieved.
Fishes 08 00295 g001
Figure 2. Logged water temperature in the four studied lakes plotted by air temperature in July and August, as monitored at the Haugedalen meteorological station (2 × S.E. in parentheses).
Fishes 08 00295 g002
Figure 3. Mean catch per unit effort (CPUE) of perch (□) and roach (■) during two periods in Lake Bergsjøen and one period in Lakes Rasen (2005–2009), Harasjøen (2003–2009), and Rokosjøen (1993–2009). Vertical lines show 95% confidence limits.
Fishes 08 00295 g003
Figure 4. Length distribution of perch from Lake Bergsjøen (A) and Lake Rasen (B), and length distribution of perch and roach from Lake Harasjøen (C) and Lake Rokosjøen ((D), with perch samples divided into two periods).
Fishes 08 00295 g004
Figure 5. Mean July–August temperature at the Haugedalen meteorological station (A) and relative year-class strength (YCS) of perch (B) and roach (C) in the studied lakes.
Fishes 08 00295 g005
Figure 6. Relative year-class strength of perch (YCSPerch) in the 1993 sample from Lake Bergsjøen (A), in the samples from Lake Rasen from 2005–2009 (B), in the samples from Lake Harasjøen (C) from 2003–2009, and in the samples from Lake Rokosjøen from 1996–2009 (D).
Fishes 08 00295 g006
Figure 7. Relative year-class strength of roach (YCSRoach plotted by mean air temperature in July in the samples from Lake Harasjøen from 2003–2009 (A) and in the samples from Lake Rokosjøen from 1996–2009 (B), and YCSRoach plotted by Ln(Ln(1+YCS1+ perch) in the samples from Lake Harasjøen from 2003–2009 (C) and in the samples from Lake Rokosjøen from 1996–2009 (D).
Fishes 08 00295 g007
Figure 8. Instantaneous growth rate G of large perch at age 5+ and older plotted by relative year-class strength of 1+ perch.
Fishes 08 00295 g008
Table 1. Some physical and chemical characteristics of the studied lakes (Tot P = total phosphorus).
LakeAreaAltitudeDepthmaxpHConductivityColorTot P
ham o.s.l.m mS m−1mg Pt/Lµg L−1
Bergsjøen before liming57366345.172.145-
Bergsjøen after liming 6.543.0568
Rasen93246205.983.21108
Harasjøen182280306.323.37010
Rokosjøen377209306.324.17511
Table 2. Number of perch and roach caught from 1993 to 2009 in the four studied lakes.
YearLake BergsjøenLake RasenLake Harasjøen Lake Rokosjøen
PerchPerchPerchRoachPerchRoach
199381
1994 11935
1995 2323
1996 4659
1997 3324
1998
1999
2000 5616
2001
2002
2003 95425550
2004 28183126
2005 47 3133
200634 42562047
200769503749
20083113860754199
2009656135349483
Total280296297274549495
Table 3. Linear modelling of YCSRoach with ln(ln(1 + YCS1+perch)) and July–August temperature as predictors in Lake Harasjøen and Lake Rokosjøen.
Lake HarasjøenCoefficientS.E.tr2p
Total model: Ln(GRoach) = + b1 × factor(Age) + b2 × TAAIC = 23.86, F2,8 = 4.110.5070.06
Intercept−3.3082.121−1.560 >0.05
Ln(ln(1 + YCS1+perch)) perch−0.35810.178−2.0170.2510.08
TJulAug0.2580.1411.9700.2560.08
Lake RokosjøenCoefficientS.E.tr2p
Total model: AIC = 11.70, F2,8 = 3.650.4770.07
Intercept−1.3851.278−1.083 >0.05
Ln(ln(1 + YCS1+perch)) perch−0.2680.112−2.3910.374<0.05
TJulAug0.1490.0841.7870.104>0.05
Table 4. (A). Linear models with ln transformed growth rates of perch (GPerch) as the response variable and categorical Age and continuous annual mean air temperature of selected months (Ti) as predictor variables. (B). Linear models with ln transformed growth rates of roach (GRoach) as response variables with Age as categorical and annual mean air temperature of August (TAug) as continuous predictor variables.
(A)
CoefficientsEstimateS.E.t-ValueR2/r2p
Model: Ln(GPerch) = +b1 × Sex + b2 × factor(Age) + b3 × T
Lake BergsjøenAIC = 15.01
F5,18 = 32.64
F5,18 = 32.64 0.901<0.001
Intercept−2.4761.094−2.264 <0.05
Sex (female)0.2450.1192.0520.0210.07
Factor (Age) 0.839
Age 3+−0.8230.156−5.274 <0.0001
Age 4+−1.4390.164−8.752 <0.0001
Age 5+−1.7170.166−10.337 <0.0001
TJulAug0.1890.0702.7130.041<0.05
Lake RasenAIC = −16.22, F5,14 = 99.37,
F5,14 = 99.37
0.973<0.00001
Intercept−1.4410.587−2.456 <0.05
Sex0.0240.0620.3870.00>0.05
Factor (Age) 0.956
Age 3+−0.7610.091−8.386 <0.0001
Age 4+−−1.6120.096−16.712 <0.0001
Age 5+−1.8790.096−19.475 <0.0001
TJul0.1160.0402.8870.016<0.05
Lake HarasjøenAIC = 35.48, F5,30 = 16.710.736<0.0001
Intercept−2.8951.513−1.913 >0.05
Sex−0.1360.123−1.1010.018>0.05
Factor (Age) 0.670
Age 3+−089020.153−5.818 <0.0001
Age 4+−1.0240.164−6.231 <0.0001
Age 5+−1.5750.202−7.789 <0.0001
TJulAug0.2210.0952.3250.048<0.05
Lake RokosjøenAIC = 14.93, F5,35 = 62.2 0.899<0.0001
Intercept−1.9200.746−2.572 <0.05
Sex−0.05120.083−0.6160.0006>0.05
Factor (Age) 0.8694
Age 3+−0.8100.110−7.354 <0.0001
Age 4+−1.5450.108−14.279 <0.0001
Age 5+−1.9240.145−13.267 <0.0001
TJulAug0.1540.0493.1650.029<0.01
(B)
CoefficientsEstimateS.E.t-ValueR2/r2p
Lake Harasjøen
Total model: AIC = −1.681, F4,14 = 28.04 0.889>0.05
Intercept0.0390.4720.083
Factor (Age) 0.878
Age 3+−0.9550.119−7.996 <0.00001
Age 4+−0.9840.124−7.913 <0.00001
Age 5+−1.3250.145−9.160 <0.00001
TAug0.0380.0311.6160.0193>0.05
Lake Rokosjøen
Total model: AIC = 10.19, F4,24 = 35.77 0.856<0.00001
Intercept−0.5590.369−1.412 >0.05
Factor (Age) 0.786
Age 3+−0.6100.136−4.474 <0.001
Age 4+−1.0160.140−7.251 <0.00001
Age 5+−1.4060.132−10.684 <0.00001
TAug0.0960.0283.4360.071<0.01
Disclaimer/Publisher’s Note: The statements, opinions and data contained in all publications are solely those of the individual author(s) and contributor(s) and not of MDPI and/or the editor(s). MDPI and/or the editor(s) disclaim responsibility for any injury to people or property resulting from any ideas, methods, instructions or products referred to in the content.

