Article

Study on the Microflora Structure in a Litopenaeus vannameiSinonovacula constricta Tandem-Culture Model Based on High-Throughput Sequencing under Different Culture Densities

1
School of Marine Science, Ningbo University, Ningbo 315211, China
2
Key Laboratory of Applied Marine Biotechnology, Ningbo University, Chinese Ministry of Education, Ningbo 315211, China
*
Authors to whom correspondence should be addressed.
Fishes 2023, 8(6), 287; https://doi.org/10.3390/fishes8060287
Submission received: 18 April 2023 / Revised: 22 May 2023 / Accepted: 24 May 2023 / Published: 26 May 2023

Abstract

:
In this study, we evaluated the intestinal contents of Pacific whiteleg shrimp (Litopenaeus vannamei), the visceral mass of razor clams (Sinonovacula constricta) and the water columns and the substrate sediments in different culture-density groups in a L. vannameiS. constricta tandem-culture model by high-throughput sequencing of the 16S rRNA gene. The results show that the culture density affected the bacterial floral structure of the water columns, substrate sediment and razor-clam gut masses without making significant differences in the bacterial flora structure of the shrimp gut; the Shannon diversity indexes of the bacterial communities in the substrate sediment, shrimp gut and razor-clam gut masses were not significantly different among the density groups, and the Shannon diversity index of the bacterial communities in the water column was higher in the group with higher culture densities; at the phylum level, the dominant bacteria common to the shrimp guts, razor-clam visceral mass, water columns and substrate sediment were Proteobacteria and Bacteroidetes; Chloroflexi was the dominant bacterium specific to the substrate sediment; and Firmicutes was the dominant bacterium specific to the shrimp gut and razor-clam gut mass. We used national standards (GB 17378.4-2007, China) to evaluate the content of water-quality factors through the environmental factors and the genus-level correlation analysis of bacterial flora that follow: the dominant bacterium in the water column, uncultured_bacterium_f_Rhodobacteraceae, was negatively correlated with PO43−-P; the dominant bacteria in the substrate sediments, uncultured_bacterium_f_Anaerolineaceae and Woeseia, were significantly and negatively correlated with DO; and the dominant bacteria Lactococcus spp. in the razor-clam gut mass and the shrimp intestines were positively correlated with DO. These results show that culture density directly affects water-quality factors, which in turn affect the culture environment and the composition structure of the bacterial flora in a cultured organism.
Key Contribution: This study is the first to investigate the composition of bacterial flora of cultured organisms and the culture environment in a tandem-culture model.

1. Introduction

The Pacific white shrimp (Litopenaeus vannamei) is native to the area from the Pacific coastal waters of northern Peru to Sanola, Mexico, and it is one of the three largest shrimp species in the world’s most farmed and most productive. The razor clam (Sinonovacula constricta) is a widely tempered shellfish, endemic to China and Japan, and is farmed more frequently along the coasts of Shandong, Zhejiang and Fujian in China, with Zhejiang and Fujian on the southeast coast being the main farming areas. In China, shrimp and razor clams are popular among consumers because of their delicious taste and rich nutritional value. In recent years, China’s shrimp and razor-clam farming production have grown year by year; the total output of S. constricta in 2018 reached 853,000 tons, according to the 2020 China Fisheries Statistical Yearbook statistics, and China’s L. vannamei farming production has accounted for more than 80% of the world’s total shrimp farming production. However, the high-density intensive farming adopted by farmers can easily cause disease of cultured organisms, resulting in slow growth or even death of shrimp and razor clams, which hinders healthy and sustainable development of aquaculture. In order to solve the above problems, a new culture model, the “L. vannameiS. constricta tandem culture model”, came into being. The system would be stocked in adjacent ponds of shrimp and razor clams, with the shrimp pond artificially feeding residual bait and shrimp feces and other metabolic waste into nutrient salts, fully absorbed by the pond microalgae, so that the pond would maintain a high population advantage of planktonic algae injected into the razor-clam pond through the pump, while the razor clams would filter rich algae, organic debris and bacterial masses, brought from the shrimp pond, back into the shrimp pond, thereby achieving the purposes of water purification and recycling of seawater.
Bacteria are the most widely distributed group of organisms in nature, with the characteristics of small individuals, large numbers and diverse species, and are an important part of the ecosystem and environment [1]. Bacteria play a very important role in the aquaculture environment and are an important part of the composition of the ecosystem. They not only participate in the material cycle in the system but also maintain the stability of the system by decomposing nutrient wastes and hindering reproduction of pathogenic bacteria [2,3], so it became extremely necessary to pay attention to the bacteria in the tandem-culture model. Microbial research in farming environments has become increasingly popular in the last decade, with studies on microbial community structure in monoculture or mixed-culture environments and on gut microbes in farmed animals. Tang et al. used polymerase chain reaction–denaturing gradient gel electrophoresis (PCR–DGGE) and 16S rDNA pyrophosphate sequencing to assess the effect of environmental temperature on the compositions of bacterial communities in freshwater aquaculture systems of Penaeus vannamei and identified some potentially pathogenic bacteria [4]. Zheng et al. used high-throughput sequencing technology to study the relationships between diseases and the culture environment and gut bacteria in Pacific white shrimp and carp and found that the abundance and diversity of bacteria in the substrate were higher than in the water column and bacteria were higher than fungi in the samples at the same time point [5]. Wang et al. studied seasonal changes in the bacterial flora structures of razor clams and their culture ponds based on high-throughput sequencing and found that the bacterial flora structure in the water column in winter differed significantly from that in the other three seasons, and there were no significant differences in the bacterial flora structure in the sediment and the razor-clam gut mass in all four seasons [6]. However, no studies have been conducted on the structure of bacterial flora in the shrimp and razor-clam tandem-culture model, and few studies have been conducted on the structure of bacterial flora of shrimp or razor clams at different culture densities. In this experiment, high-throughput sequencing technology was used to measure and analyze the bacterial flora of the tank water, the sediment and the intestinal contents of shrimp and razor clams in different culture-density groups in the tandem-culture model in order to understand the bacterial flora in the ecosystem structure of the tandem-culture model of shrimp and razor clams at different culture densities and to provide a theoretical basis for adjustment of culture density, regulation of culture water quality and disease prevention of cultured organisms in this model.

2. Materials and Methods

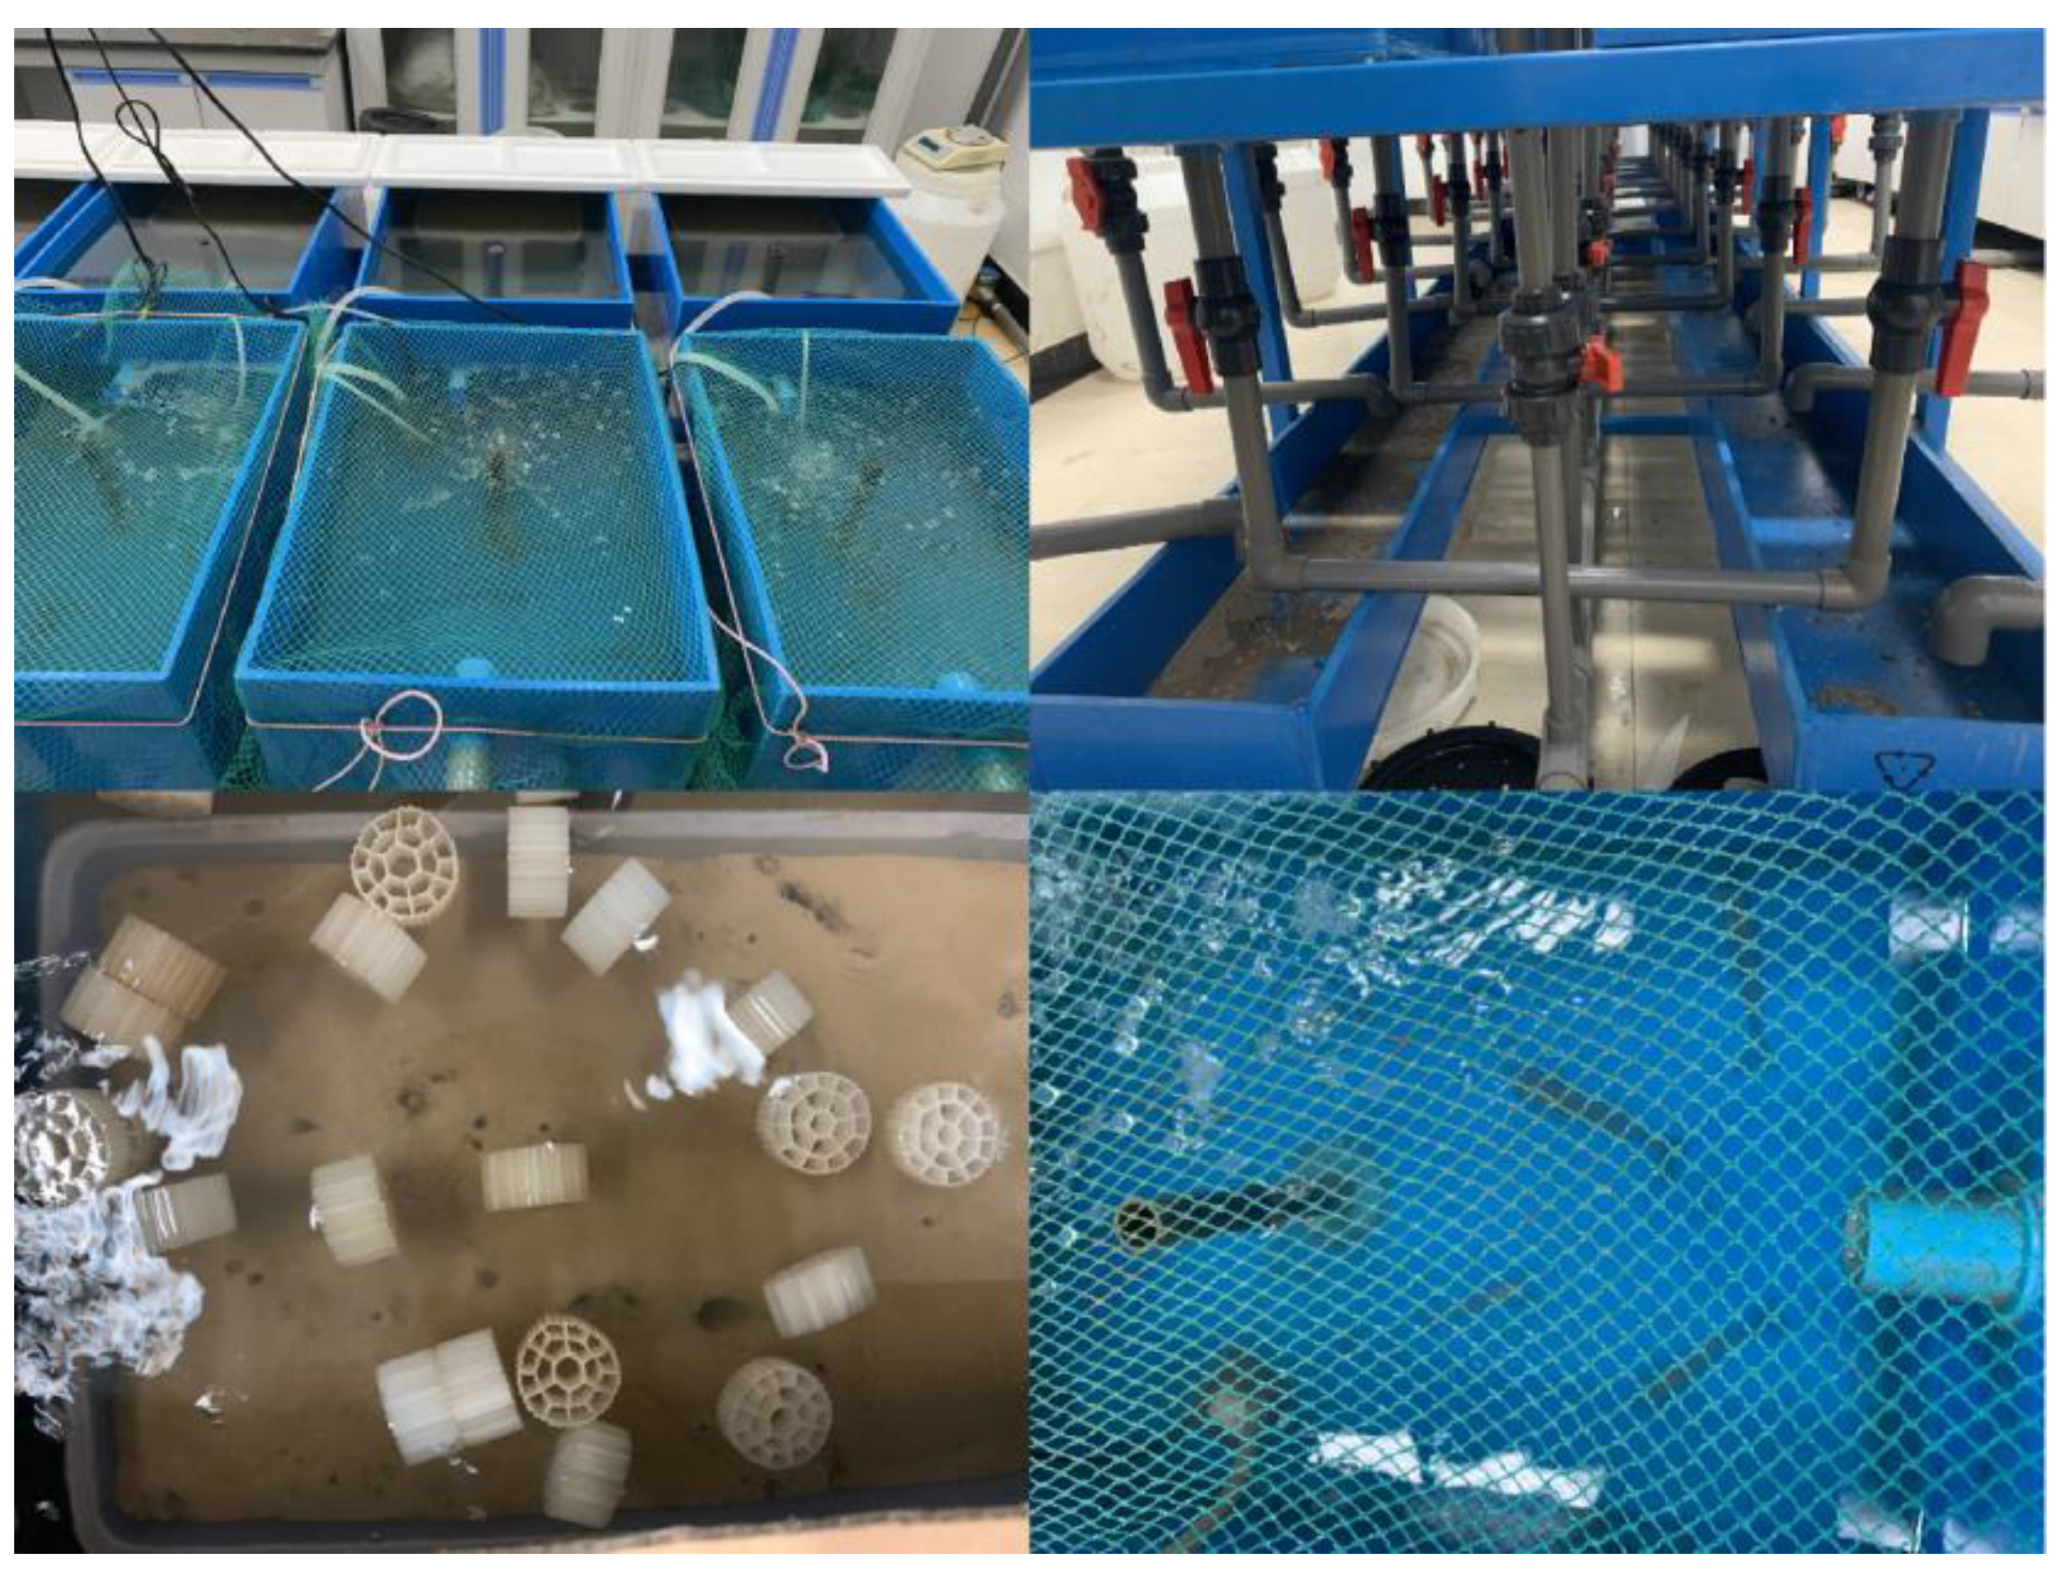
2.1. Basic Information of the Shrimp and Razor-Clam Tandem-Culture Tank

The experiments were conducted from 10 August to 5 October 2020 in a tandem-culture-model tank built at the Marine and Fisheries Science and Technology Innovation Base in Ningbo, Zhejiang Province. The size of the culture tank was 50 cm × 40 cm × 30 cm, with a 0.05 m2 bottom area of the razor-clam culture tank (replaced with a plastic box) and a 0.2 m2 bottom area of the shrimp culture tank: that is, a shrimp–razor-clam tank area ratio of about 4:1. A layer of 10 cm-thick mud was added at the bottom of the razor-clam tank and the shrimp tank using air-stone-bottom oxygenation while a small 3 W pump was equipped to pump water from the shrimp tank into the razor-clam tank, each parallel group of shrimp tank and the bottom of the razor-clam tank having a water-pipe connection so that the razor-clam culture tank and the Pacific-white-shrimp tank water would interchange. The shrimp tank was fixed with mesh on top, and the razor-clam tank was covered with foam boards for shade, as shown in Figure 1. After two weeks of experimentation, biofilter media was placed on the water surface of the razor-clam tank for microbial attachment and growth in the water column. The initial weight of the Litopenaeus vannamei was 4.28 ± 0.08 g, and that of the Sinonovacula constricta was 7.81 ± 0.06 g.

2.2. Experiment Design

There were 4 density groups in this experiment, identified as “Group 1”, “Group 2”, “Group 3” and “Group 4”. The stocking-density ratio of Pacific white shrimp to razor clams in each density group was 1:5, and the specific stocking densities are shown in Table 1. Each group was set up in a parallel three, and the actual number of prawns and razor clams stocked in the experimental tanks was calculated according to the area of each tank. This experiment was conducted for 56 d.

2.3. Daily Feeding and Management

The shrimp were fed with Yuehai compound shrimp feed (granular feed, 40% crude protein, 16% ash, 4% crude lipid and 12% moisture) every day at 7:00, 12:00 and 17:00. The feeding amount was 2% of the total weight of shrimp in the tank (the total feeding amount per day was 6% of the body weight of the shrimp). In the tank of razor clams, 1000-times-diluted micrococcus algal fluid (the original concentration of algae cells was 7 × 10⁵ ind/mL) was fed in at 9:00 and 18:00 every day, and the feeding amount increased in a gradient according to the culture density so that the number of algal cells in the tank was about 1 × 10⁵ ind/mL. All of the aquacultural tanks had a water amount of 33% changed at 8:00 and 13:00 every day, and the total daily water exchange was 66%. The replacement seawater came from Xiangshan Port, Zhejiang, China (Latitude: 29.64798, Longitude: 121.77904), with a salinity of 20 ppt, a water temperature of 27.2–30.7 °C and a pH of 7.95–8.10.

2.4. Measurement of Water-Quality Indicators in Culture Tanks

Water-quality factors were determined according to marine monitoring specifications (GB 17378.4-2007, China), using the potassium-persulfate oxidation method to determine the total nitrogen (TN) and the total phosphorus (TP), the sodium-hypobromite oxidation method to determine the ammonium nitrogen (NH4+-N), the zinc–cadmium reduction method to determine the nitrate nitrogen (NO3-N), naphthalene ethylenediamine hydrochloride to determine the nitrite nitrogen (NO2-N), the molybdenum blue method to determine the reactive phosphorus (PO43−-P) and the potassium-permanganate oxidation method to determine the chemical oxygen demand (COD).

2.5. Sample Collection and DNA Extraction

All experimental procedures conformed to the Standard Operating Procedures (SOPs) of the Guide for Use of Experimental Animals of Ningbo University. The studies involving animals were reviewed and approved by the Ningbo University Laboratory Animal Center under permit number SYXK (ZHE2008-0110). On the beginning day of this experiment, initial samples of water, sediment, gut mass of S. constricta and gut contents of L. vannamei were, respectively, sampled according to the company’s sampling requirements (Biomarker, Beijing, China), and 3 parallel samples of each sample were taken from each density group. At the end of the test, 1000 mL of water samples were taken from each of the four density groups (divided into shrimp tank water samples and razor-clam tank water samples), filtered through a 0.22 μm sterile cellulose filter membrane made of acetate fiber (Jinjing, Shanghai, China) and then cut with sterile scissors to shred the membrane; 500 mg of sediment samples were taken from the substrate in each parallel sample culture tank; the razor clams were placed on ice and anesthetized, then rinsed with sterile water for surface sediment and dissected aseptically in sterilized dissection trays to remove the visceral mass; and the shrimp were placed on ice and anesthetized, the shrimp intestinal samples then dissected out of the intestine in sterilized dissection trays and the intestinal contents extruded with sterilized forceps. The above samples were loaded into lyophilization tubes, rapidly cooled in liquid nitrogen tanks and sent to Beijing Bemac Biotechnology Co., Ltd. (Beijing, China).
The abovementioned water, sediment, razor-clam and Pacific-white-shrimp samples were extracted using the MNNucleoSpin96 Soi kit (Biomarker, Beijing, China), and the extraction was performed according to the kit instructions. The obtained DNA concentration and purity were determined with NanoDrop2000 (Thermo Fisher, Waltham, MA, USA), and the samples were stored at −20 °C for subsequent PCR amplification.

2.6. PCR Amplification and High-Throughput Sequencing of 16S rDNA Sequences

The extracted total bacterial DNA was used as a template to design the V3-V4 variable-region amplification primers 338 F (5′-ACTCCTACGGGAGGCAGCA-3′) and 806 R (5′-GGACTACHVGGGTWTCTAA T-3′), which were used for PCR amplification. The target-region PCR was performed first with a 10 μL system: 50 ng ± 20% of genomic DNA, 0.3 μL each of VnF (10 μM) and VnR (10 μM), 5 μL of KODFXNeoBuffer, 2 μL of dNTP (2 mM each), 0.2 μL of KODFXNeo and ddH2O made up to 10 μL. PCR reaction conditions were pre-denaturation at 95 °C for 5 min, denaturation at 95 °C for 30 s, annealing at 50 °C for 30 s and extension at 72 °C for 40 s. A total of 25 cycles were performed, and the final extension was at 72 °C for another 7 min. SolexaPCR was then performed with a 20 μL system: 5 μL of PCR purification product from the target region and 2.5 μL each of MPPI-a and MPPI-b at concentrations of 2 μM and 10 μL of 2 × Q5 HFMM. Reaction conditions were pre-denaturation at 98 °C for 30 s, denaturation at 98 ℃ for 10 s, annealing at 65 °C for 30 s, extension at 72 °C for 30 s, 10 cycles and, finally, extension at 72 °C for 5 min. The PCR amplification products were detected with agarose (1.8%) gel electrophoresis and then sequenced with a machine (Biorad, Hercules, CA, USA).
In the following text, the initial water sample, the initial sediment sample, the initial razor-clam viscera sample, and the initial gut contents sample of shrimp are labeled as “CS”, “CN”, “CY” and “CX”, respectively, and the shrimp tank water sample, the razor-clam tank water sample, the sediment sample, the razor-clam viscera sample and the shrimp-gut-contents sample at the end of the test are labeled as “MXS”, “MYS”, “MYN”, “MY” and “MX”, respectively.

2.7. Data Processing and Analysis

The raw data were spliced (FLASH, version 1.2.11), the spliced sequences were subjected to quality filtering (Trimmomatic, version 0.33) and chimerism (UCHIME, version 8.1) was removed to obtain high-quality tag sequences. Sequences were clustered at the ninety-seven-percent similarity level (USEARCH, version 10.0); OTUs were filtered with 0.005% of all sequenced sequences as the threshold and compared with the Silva database (Release 128, http://www.arb-Silva.de; accessed on 10 December 2020) using RDP Classic (Version 2.2, http://sourceforge.net/projects/rdpclassifier/; accessed on 12 December 2020), with a confidence threshold of 0.8. If the similarity between sequences was higher than ninety-seven percent (species level), it could be defined as an OTU (Operational Taxonomic Unit), and each OTU represented a species.
α diversity index analysis: the colony richness index (Chao1 index, ACE index) and the colony diversity index (Shannon index, Simpson index) were analyzed using Mothurversion v.1.30 software (http://www.mothur.org/; accessed on 15 December 2020). The statistical t-test was also used to calculate the variability of each index (α = 0.05).
β diversity analysis: species diversity matrices were presented based on binary Jaccard, Bray–Curtis and (un)weighted unifrac (restricted bacteria) with multiple algorithms. Sample principal component analysis (PCA), principal coordinate analysis (PCoA) and non-metric multidimensional scaling method analysis (NMDS) were plotted based on the R language platform. After normalization (logarithmic) based on the OUT data, the top 80 species with the highest numbers were selected, and the sample heatmap was drawn based on the R heatmap.

3. Results

3.1. Structural Compositions and Differences of Bacterial Communities of Each Sample in Different Density Groups

After analyzing the high-throughput sequencing data from the initial samples and the four density groups of samples at the end of culture, a total of 5,669,638 pairs of raw sequences were obtained from the sequencing of 72 samples, and 5,599,890 sequences were generated after double-end sequence-quality control and splicing, which produced at least 42,404 sequences per sample and 77,776 sequences on average. All sequences were classified into 34 phyla, 85 orders, 195 families, 332 families, 596 genera and 1698 OTUs.

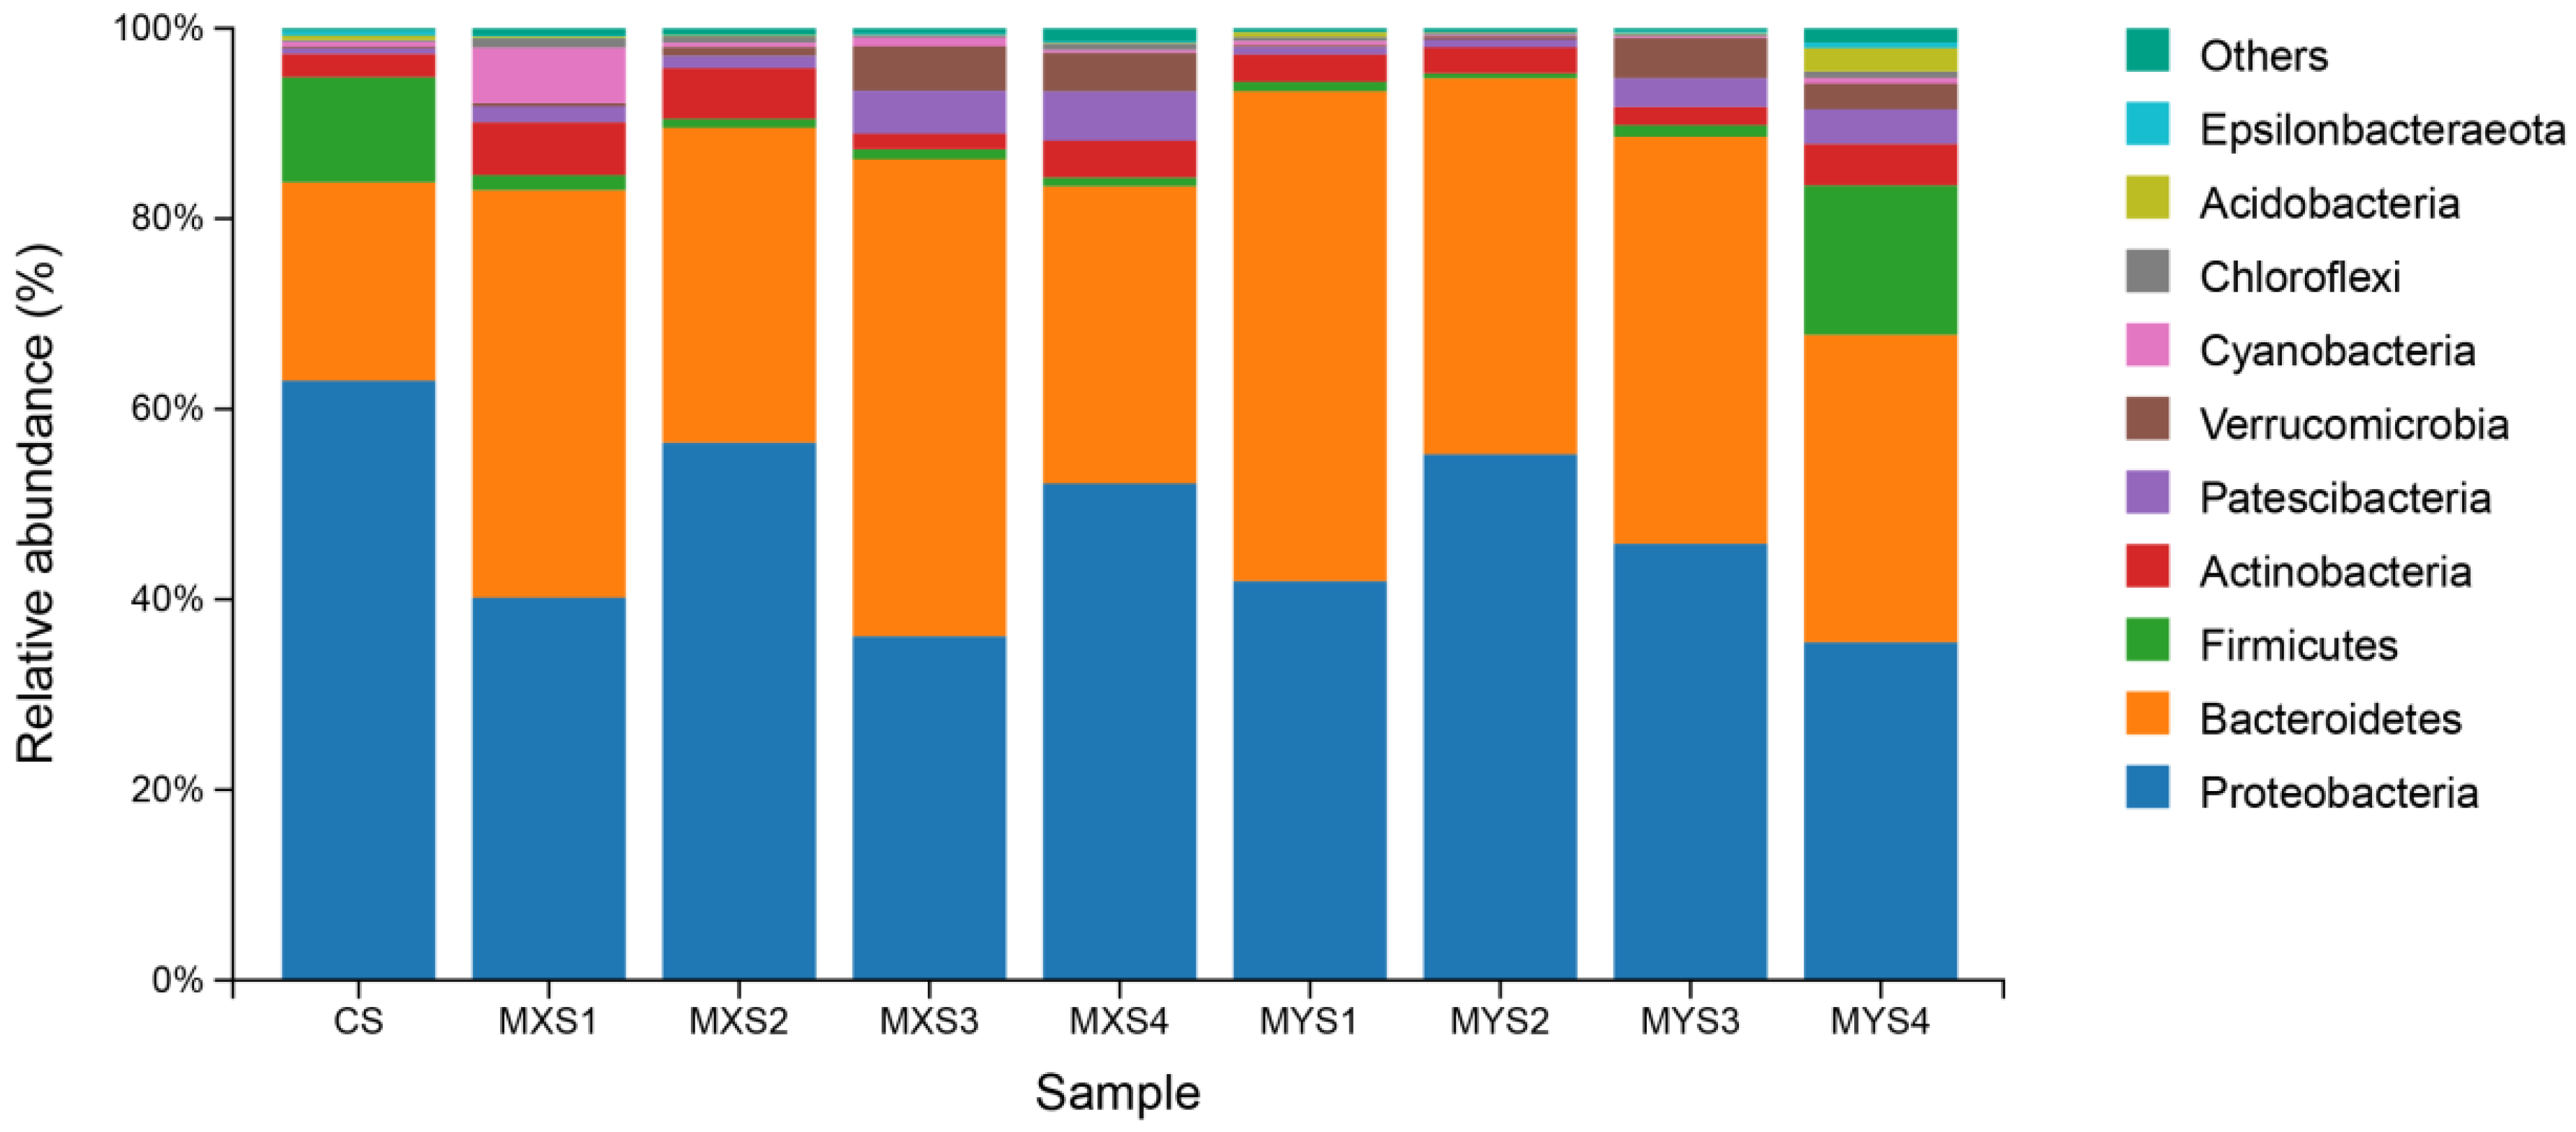
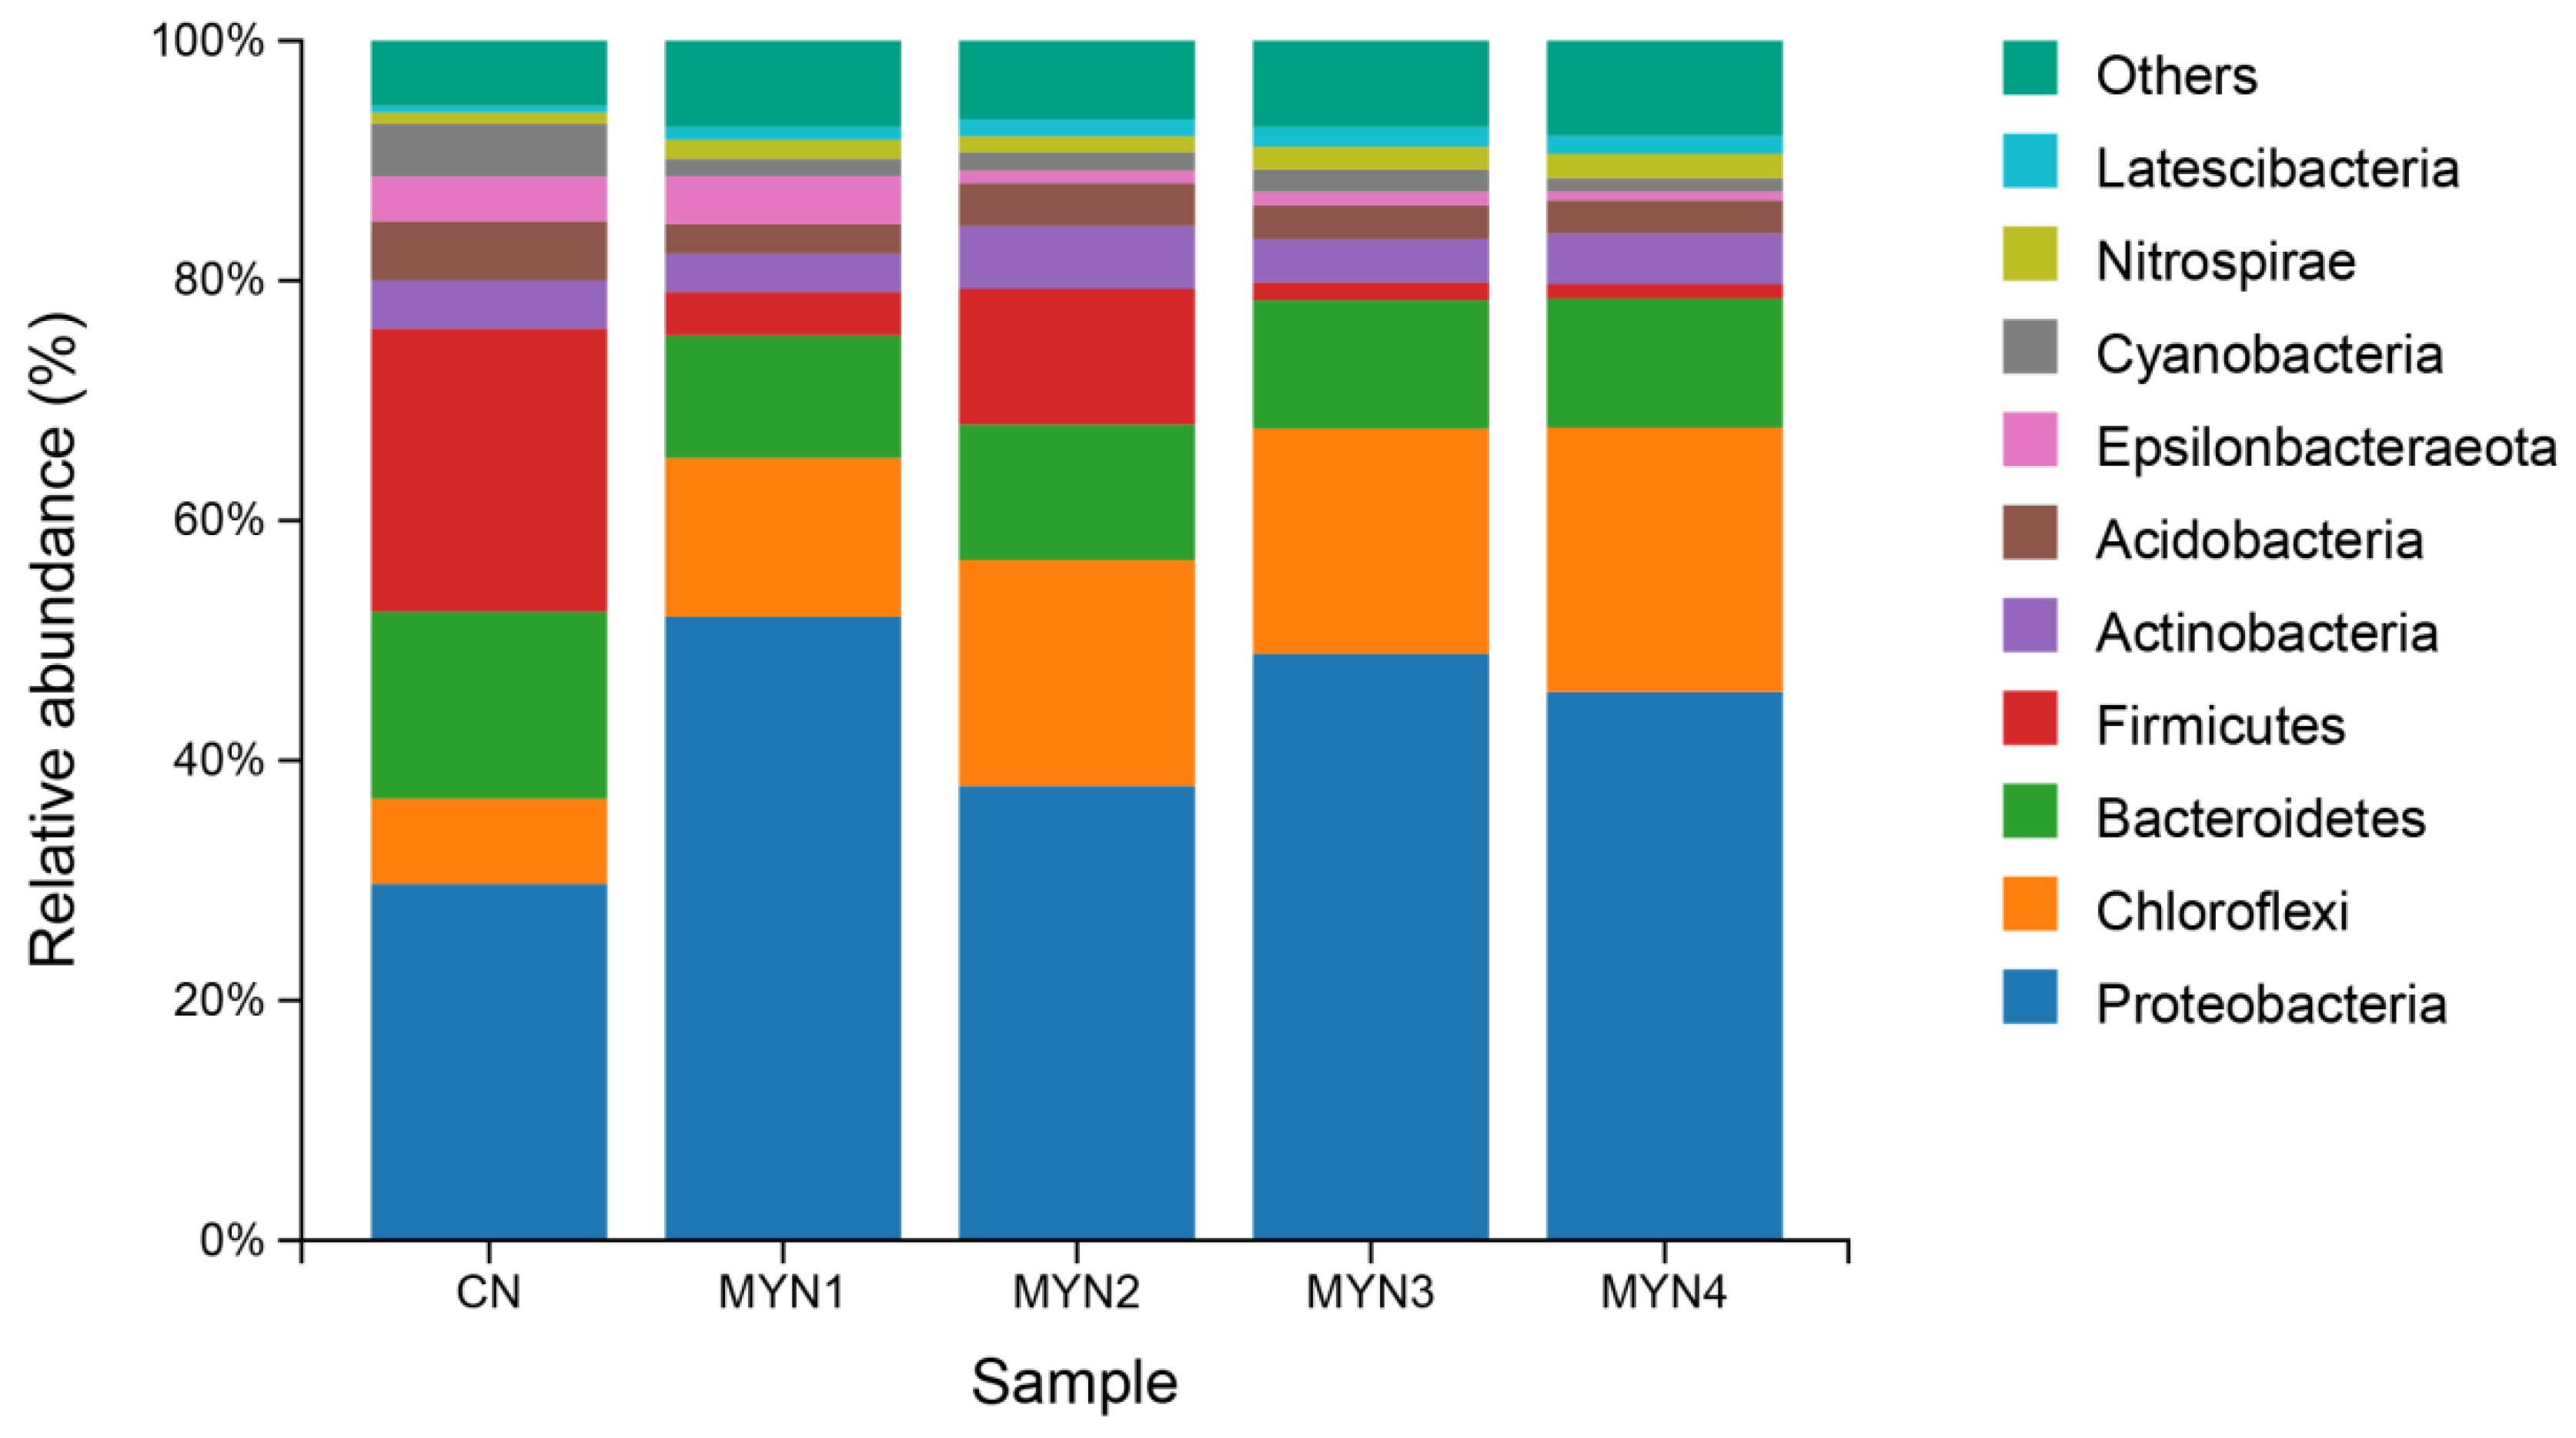
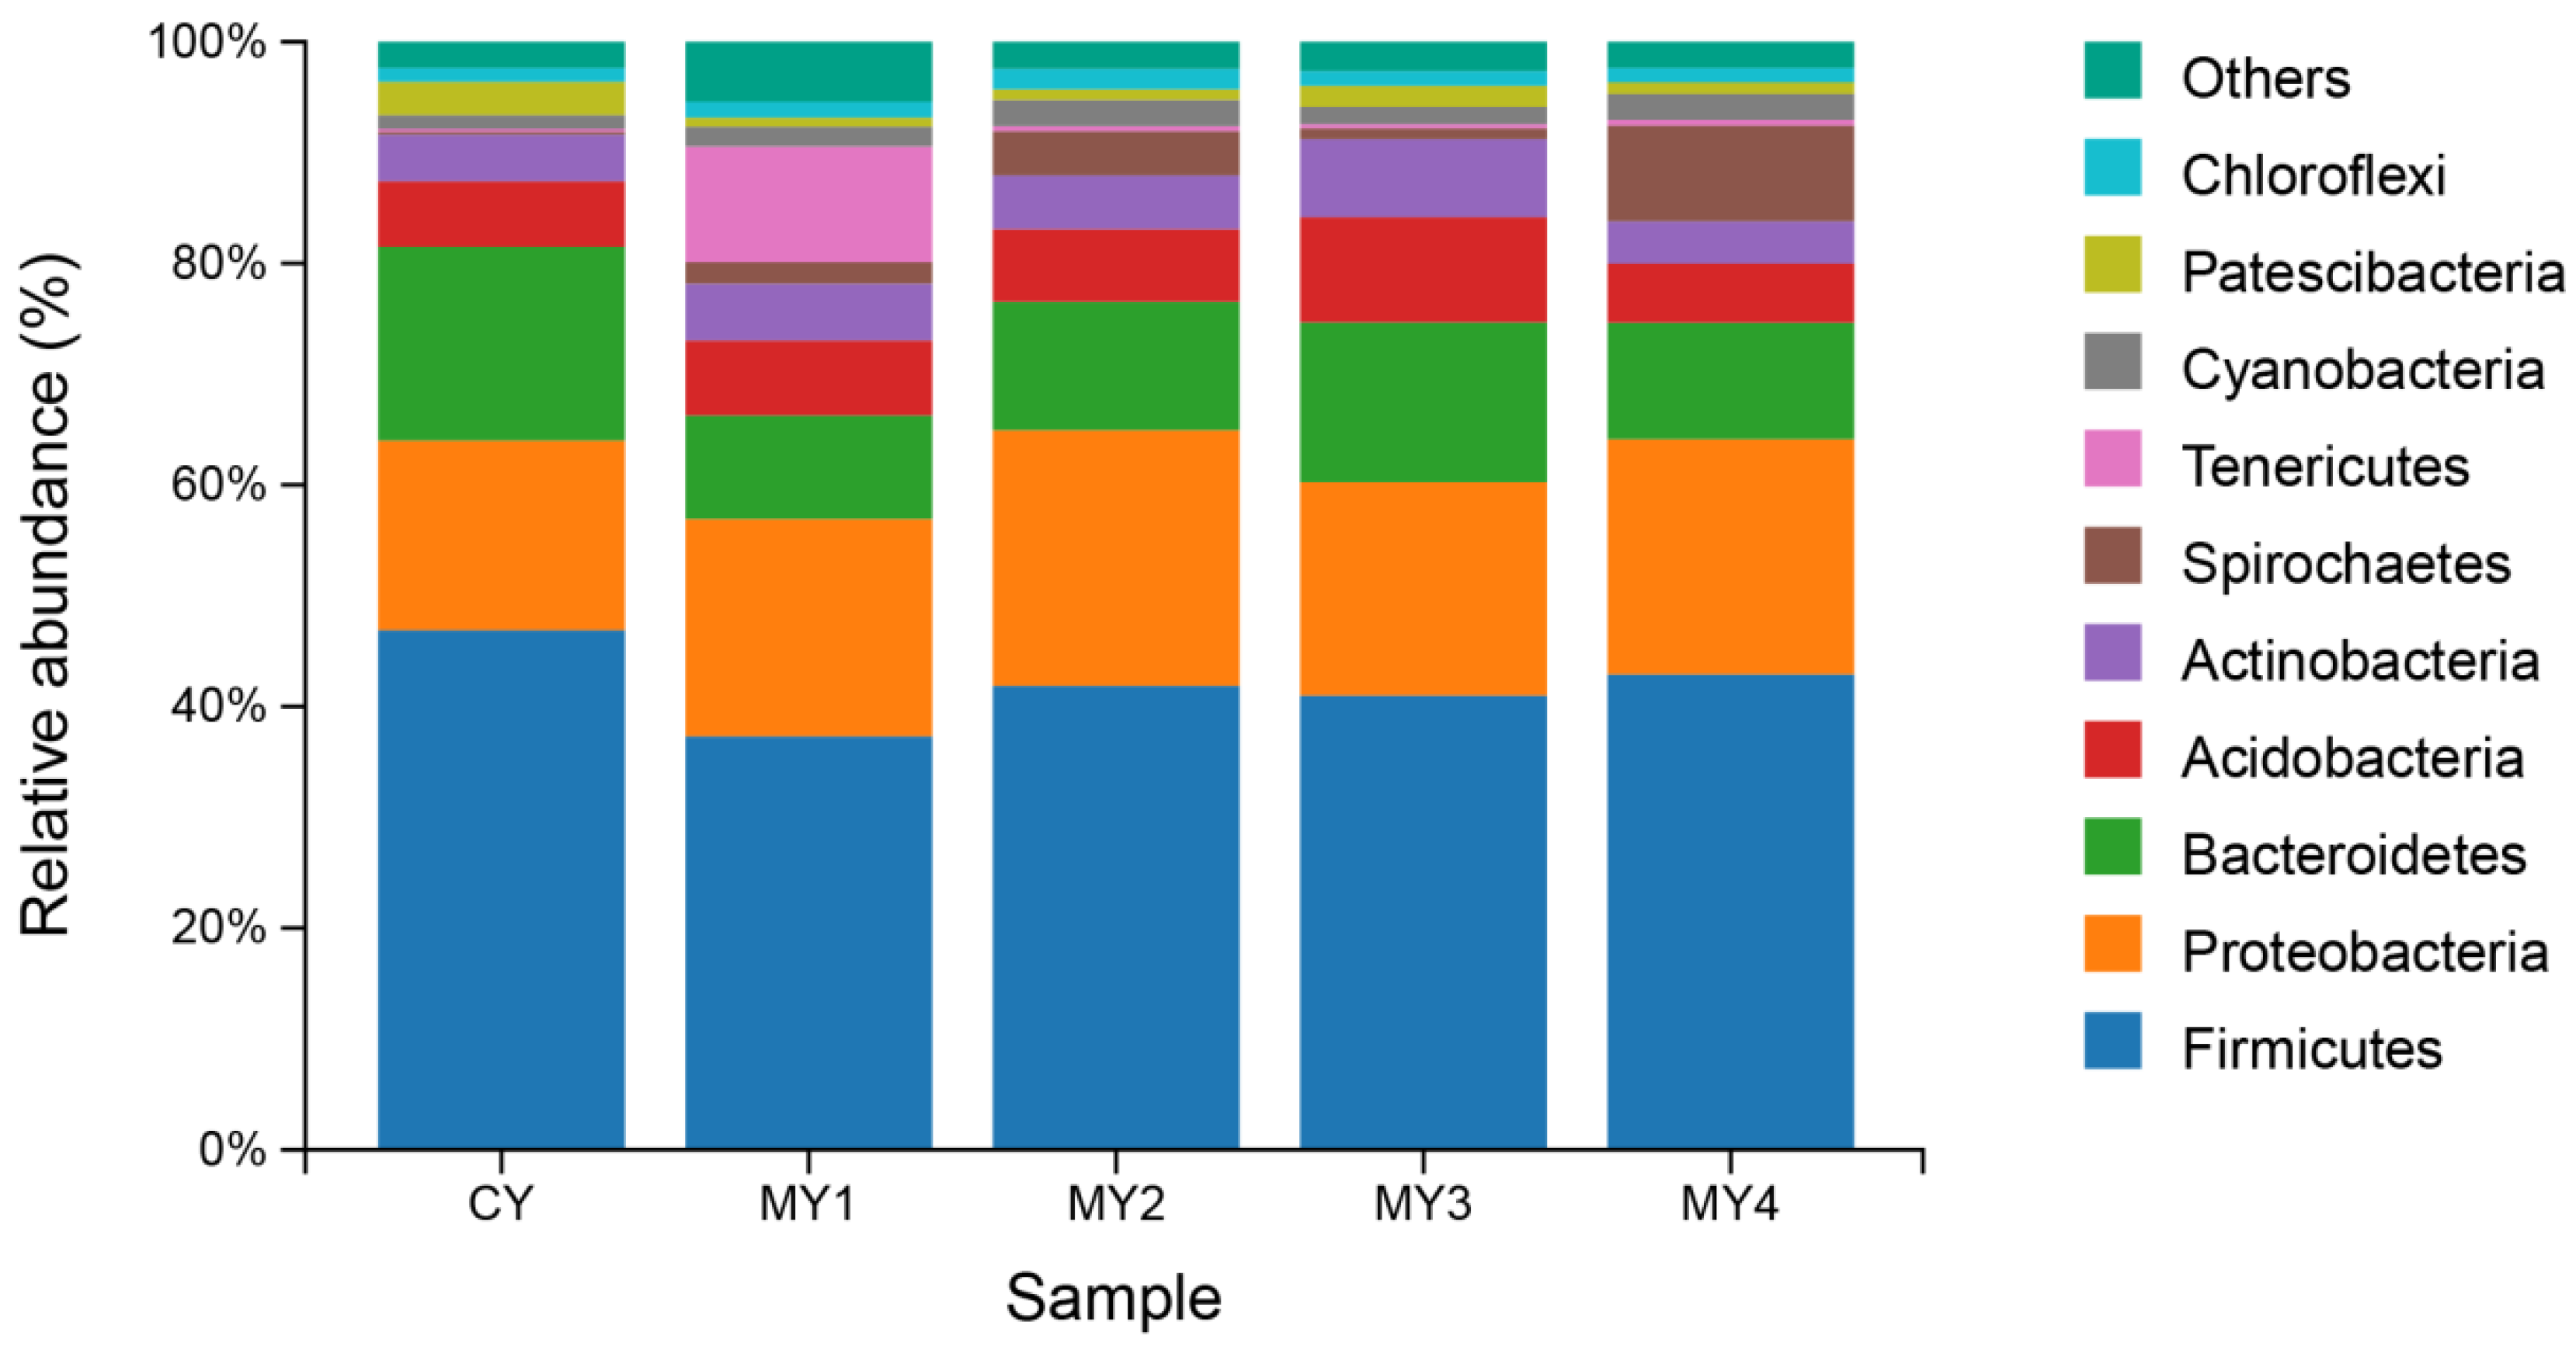
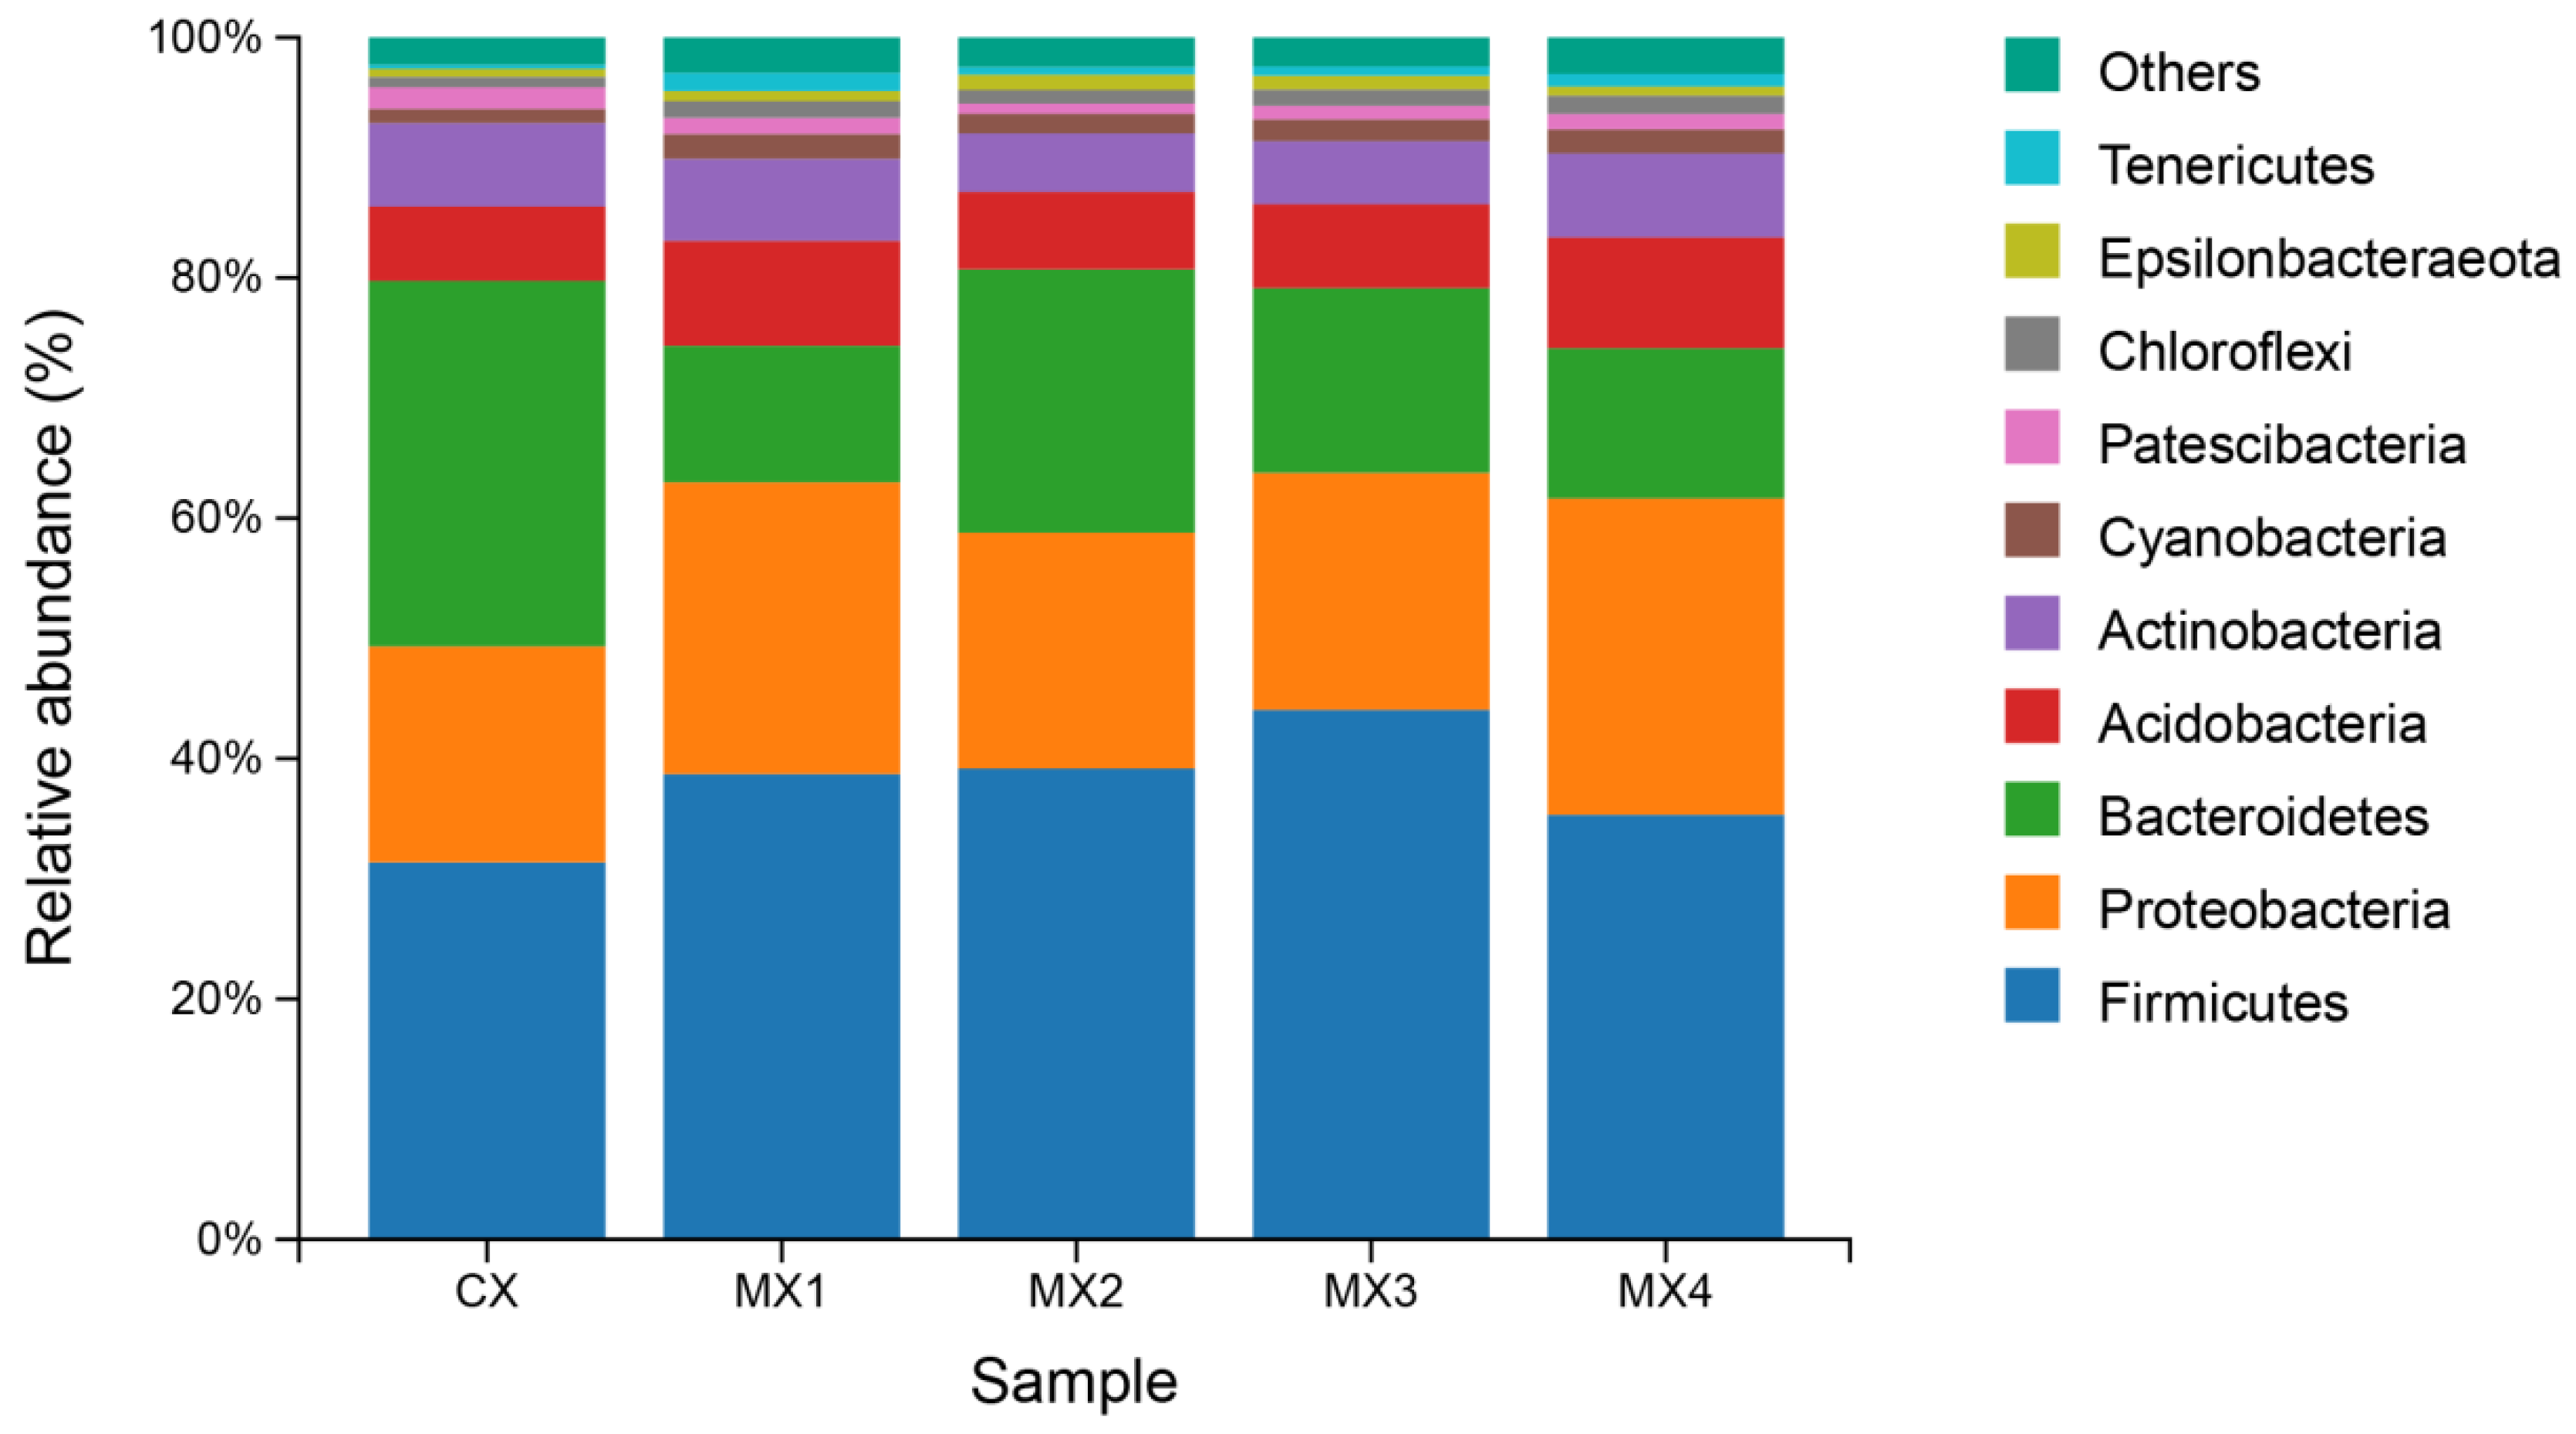
3.1.1. Bacterial Community Structure of Each Sample Based on Phylum Level

As can be seen in Figure 2, the dominant bacterial groups in the initial water samples and in the different density groups were divided into two categories: Proteobacteria (CS: 63.0%; MXS1: 40.2%; MXS2: 56.5%; MXS3: 36.1%; MXS4: 52.2%; MYS1: 41.9%; MYS2: 55.2%; MYS3. 45.9%; MYS4: 35.5%) and Bacteroidetes (CS: 20.8%; MXS1: 42.8%; MXS2: 33.1%; MXS3: 50.1%; MXS4: 31.2%; MYS1: 51.5%; MYS2: 39.5%; MYS3: 42.7%; MYS4: 32.3%).
As can be seen in Figure 3, the initial sediment samples and the sediment samples of different density groups were divided into three categories of dominant groups: Proteobacteria (CN: 29.7%; MYN1: 52.0%; MYN2: 37.9%; MYN3: 48.9%; MYN4: 45.7%), Chloroflexi (CN: 7.1%; MYN1: 13.2%; MYN2: 18.8%; MYN3: 18.8%; MYN4: 22.0%) and Bacteroidetes (CN: 15.6%; MYN1: 10.2%; MYN2: 11.3%; MYN3: 10.7%; MYN4: 10.7%).
The compositions and structures of the razor-clam visceral-mass flora are shown in Figure 4, and the initial visceral mass and the different density groups of dominant visceral-mass flora were divided into three categories: Firmicutes (CY: 46.9%; MY1: 37.3%; MY2: 41.9%; MY3: 41.0%; MY4: 42.9%), Proteobacteria (CY: 17.1%; MY1: 19.6%; MY2: 23.1%; MY3: 19.3%; MY4: 21.2%) and Bacteroidetes (CY: 17.5%; MY1: 9.3%; MY2: 11.6%; MY3: 14.4%; MY4: 10.5%).
The compositions and structures of the gut-content flora of the shrimp are shown in Figure 5. The initial gut contents and the different density groups of dominant gut-content flora were divided into three categories: Firmicutes (CX: 31.4%; MX1: 38.7%; MX2: 39.2%; MX3: 44.1%; MX4: 35.3%), Proteobacteria (CX: 18.0%; MX1: 24.3%; MX2: 19.6%; MX3: 19.7%; MX4: 26.3%) and Bacteroidetes (CX: 30.4%; MX1: 11.4%; MX2: 21.9%; MX3: 15.4%; MX4: 12.5%).

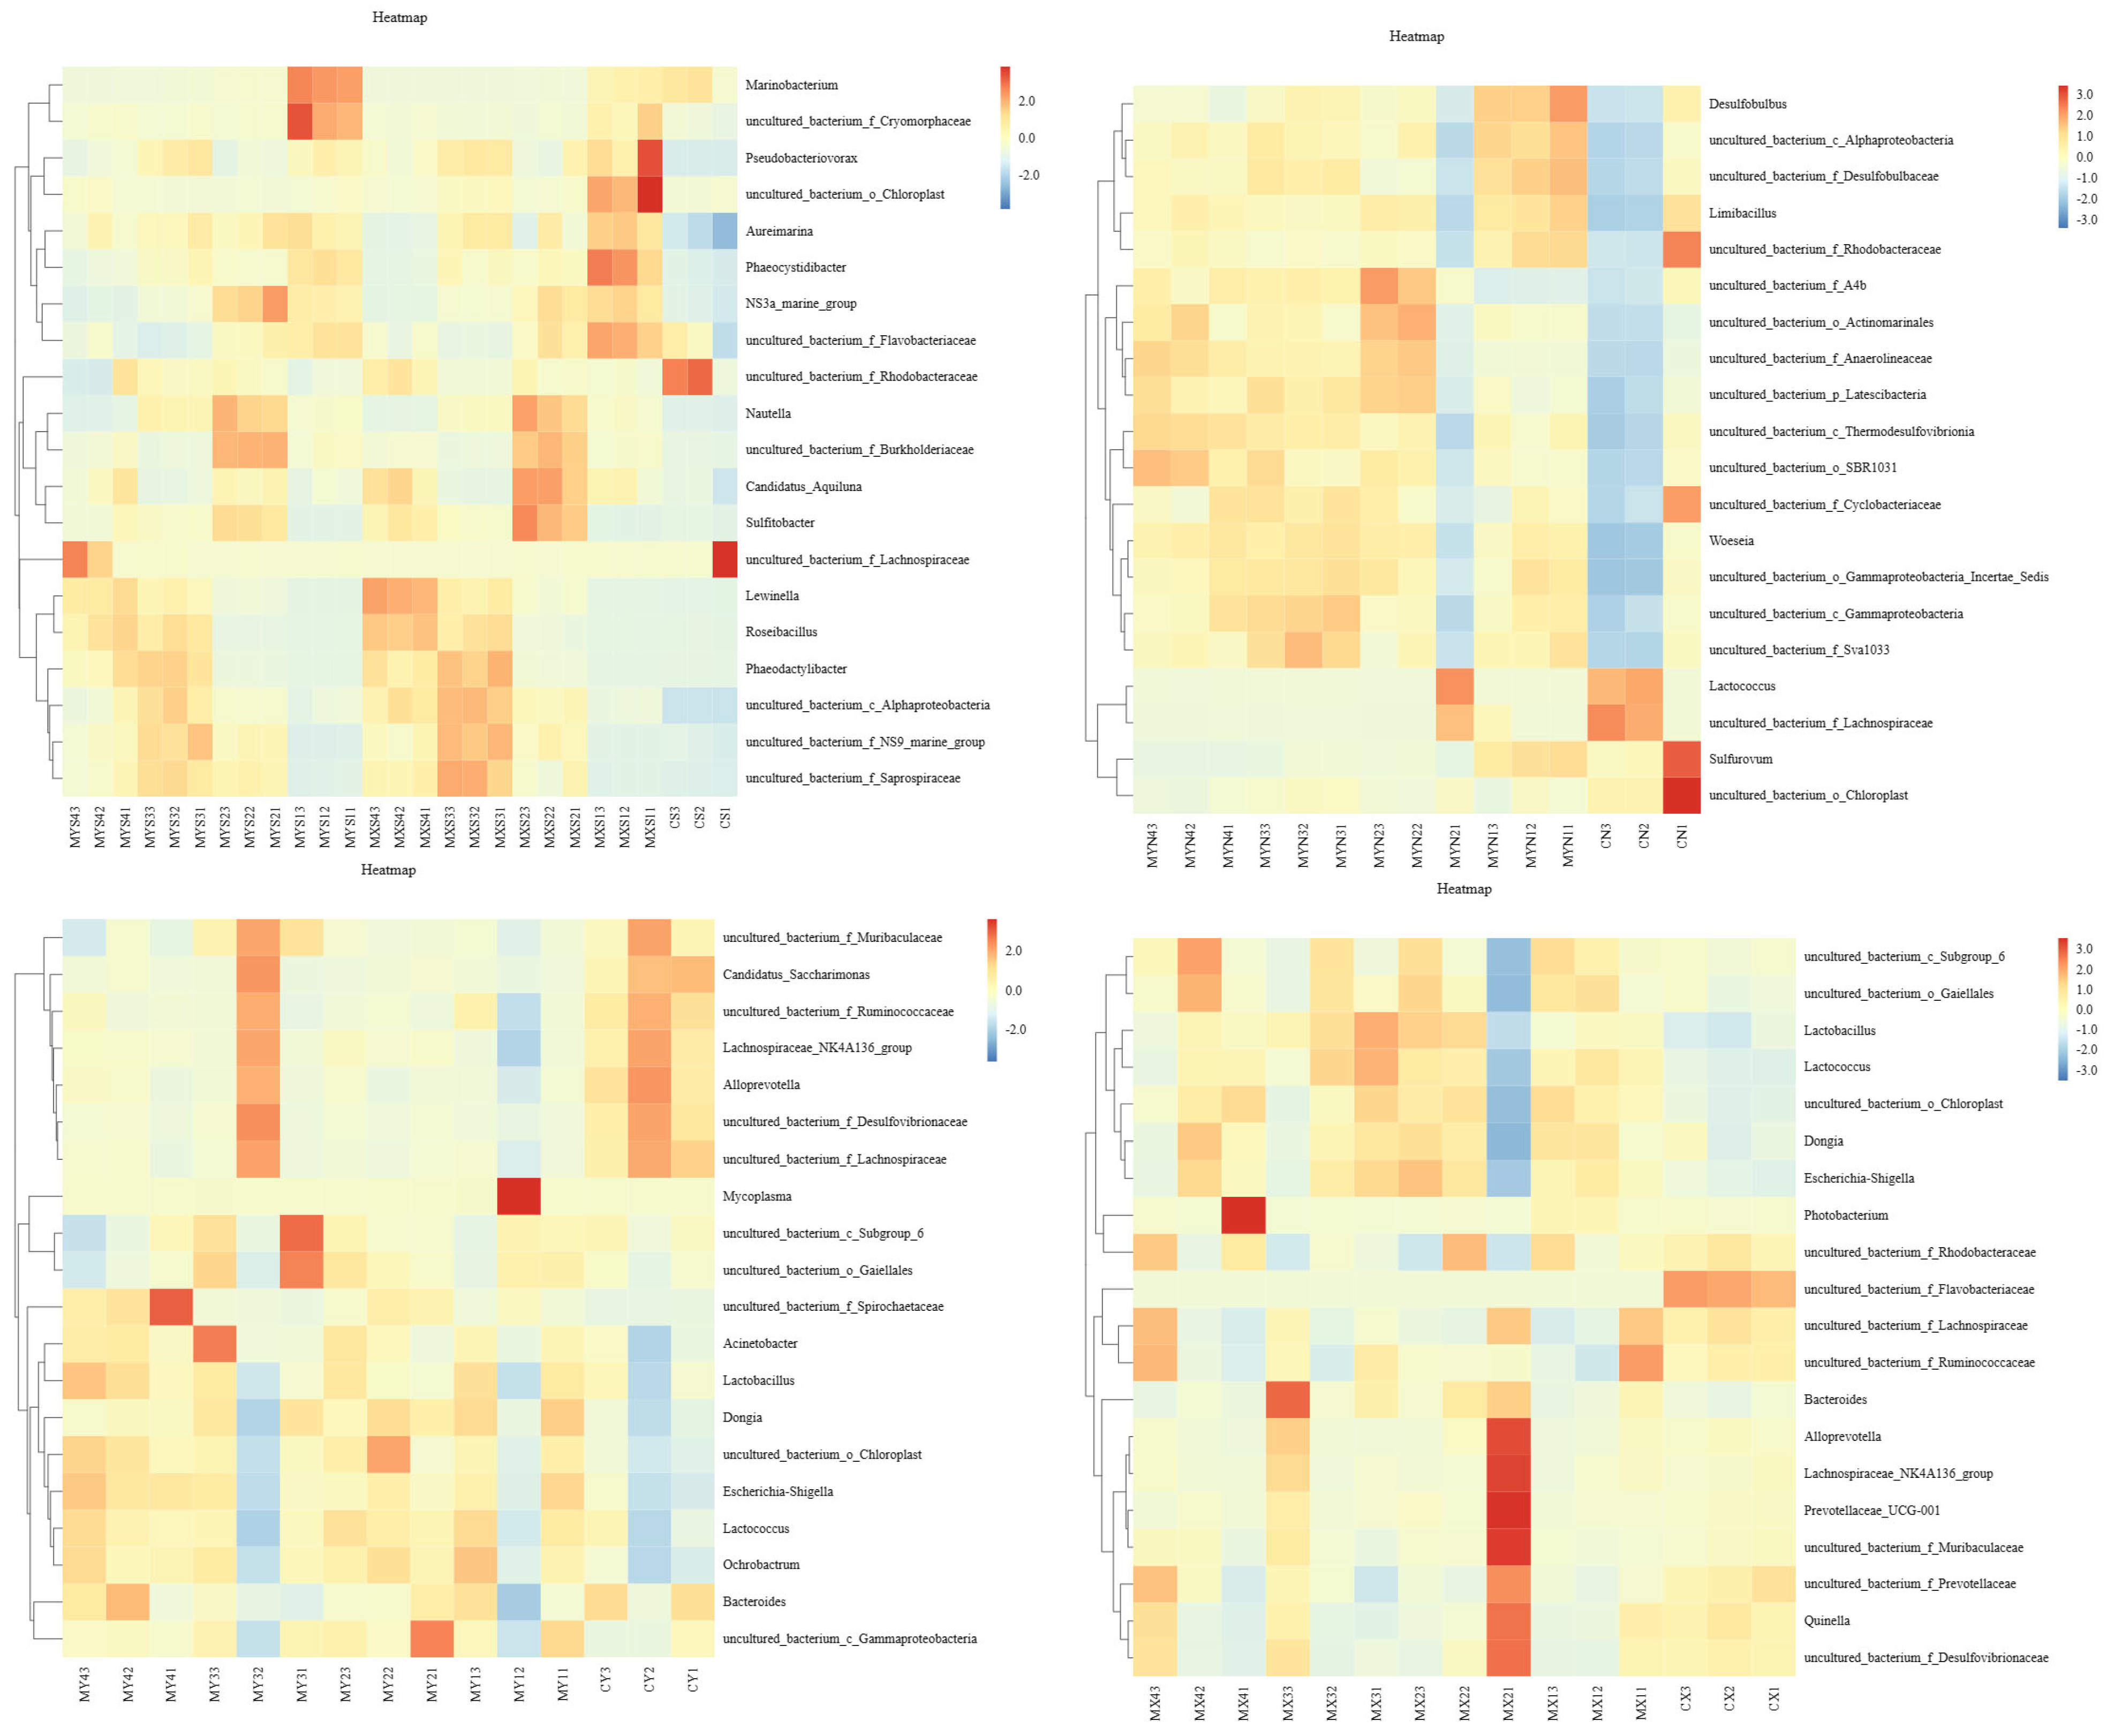
3.1.2. Structural Compositions of Bacterial Communities for Each Sample Based on Genus Level

Figure 6 shows the community heatmap of the four samples at the genus level, and Tables S1–S4 show the relative abundance of the dominant bacterial groups of the four samples at the genus level for the initial samples and the different density groups, respectively. The results show that the difference between the initial sample of uncultured_bacterium_f_Rhodobacteraceae and the Density Group 4 shrimp tank water samples was not significant (p > 0.05), but the differences from other density groups of shrimp-tank and razor-clam tank water samples were significant (p < 0.05). The abundance of uncultured_bacterium_f_Cryomorphaceae was significantly higher in the shrimp and razor-clam tanks of Group 1 than in the initial sample and the other groups. With the increase in culture density, the abundance of uncultured_bacterium_f_NS9_marine_group showed a trend of increasing and then decreasing. The abundance of Phaeodactylibacter, uncultured_bacterium_f_NS9_marine_group and Lewinella increased with the increase in culture density. In the sediment samples, the first dominant bacterium, uncultured_bacterium_f_Anaerolineaceae, had the highest abundance in Group 4 and differed significantly from the initial sample and the rest of the density groups. Woeseia in Density Groups 1, 3 and 4 were not significantly different from those in Density Group 2 (p > 0.05), but differed significantly from in the initial sample (p < 0.05). Lactococcus, uncultured_bacterium_f_Lachnospiraceae and uncultured_bacterium_o_Chloroplast were more abundant in the initial samples than in the four groups. Within the constricted razor-clam visceral mass, there was no significant difference between the first dominant bacterium, Lactococcus, in the initial sample and in the four groups, and no significant difference between the uncultured_bacterium_f_Lachnospiraceae in the initial sample and in Group 3, but significant differences from the rest of the groups (p < 0.05). There were no significant differences between the uncultured_bacterium_c_Subgroup_6 and the Lactobacillus in the initial sample and in the four groups, and there were significant differences between the uncultured_bacterium_f_Spirochaetaceae and the rest of the samples in Group 4 (p < 0.05). In the gut contents of the shrimp, the top five dominant bacteria, Lactococcus, uncultured_bacterium_f_Lachnospiraceae, uncultured_bacterium_c_Subgroup_6, Alloprevotella and uncultured_bacterium_f_Muribaculaceae, were not significantly different (p > 0.05), and the abundance of uncultured_bacterium_f_Flavobacteriaceae in the initial sample was significantly higher than in the four groups.
As can be seen in Figure 7, in the water samples, the initial sample and the Group 4 razor-clam tank water samples are farther away from the rest of the density-group-culture tank water samples, indicating that the initial sample and the Group 4 razor-clam tank water samples were different from the rest of the density-group-culture tank water samples in bacterial communities. In the samples of bottom sediment, the distance between the initial sample, Group 1 and the rest of the groups is far, indicating that there were large differences in the bacterial communities between the initial sample, Group 1 and the rest of the groups. The distance between the initial sample and Group 1 is also far, indicating that they also had large differences. In the samples of razor-clam gut mass, the initial sample and Density Group 2 are far away from the rest of the density groups, indicating that the bacterial communities of the initial sample and Density Group 2 were different from the rest of the density groups. In the samples of gut contents of shrimp, the initial samples and the samples of each group are basically clustered into one group, indicating that there were no significant differences in bacterial communities between the initial samples and the samples of each group.

3.2. α Diversity Index

α diversity is the diversity within a specific region or ecosystem and is a composite of the ACE, the Chao1, the Shannon, the Simpson and other indices. The abundance of flora was expressed by the ACE and Chao1 indexes, and the larger the value was, the greater the abundance would be. The species diversity of flora was expressed by the Shannon index and the Simpson index. The larger the Shannon index was, the higher the diversity would be. A higher Simpson index indicated that the dominant species was more concentrated. The α-diversity indices of the bacterial communities for each sample in the initial sample and the different groups are shown in Tables S5–S7. It can be seen that there are large differences in the abundance and diversity indices of the bacterial flora in the shrimp and razor-clam tandem-culture environment at different culture densities. In the guts of the shrimp, the Shannon and Simpson indices of the different density groups were not significantly different (p > 0.05); the ACE and Chao1 indices of Group 3 were significantly different compared with those of the other subgroups, indicating a high species richness in the guts of shrimp at this culture density. In the razor-clam visceral mass, the Shannon index of each group was not significantly different, and the ACE index and Chao1 index of the initial sample and Group 2 were much higher than in the other groups, indicating a higher species richness in their visceral mass; since the initial sample was a healthy razor-clam sample, this may indicate that the culture density set for Group 2 was more suitable for the growth of the razor clams in the tandem-culture model. In the culture water, the Shannon index, the ACE index and the Chao1 index of the Group 4 razor-clam tank water were much higher than those of the other groups, indicating that the abundance and diversity of bacteria in the Group 4 razor-clam tank water were the highest among all groups; meanwhile, the Simpson index of each water sample in the tandem-culture model was higher than that of the initial water sample, indicating that the dominant species of bacteria in the water body were more concentrated in the tandem-culture model. In the sediment, there was no significant difference between the Shannon index of the initial sample and those of the samples of each group, and the Simpson index of the initial sample was the lowest value among all of the groups, while the ACE index and the Chao1 index were the highest values, indicating that the initial sediment had the most abundant bacterial flora. The ACE index and the Chao1 index of Group 1 were significantly different from those of the other density groups and only slightly lower than those of the initial sample, indicating that the sediment flora of Group 1 had higher species richness compared with the other groups.

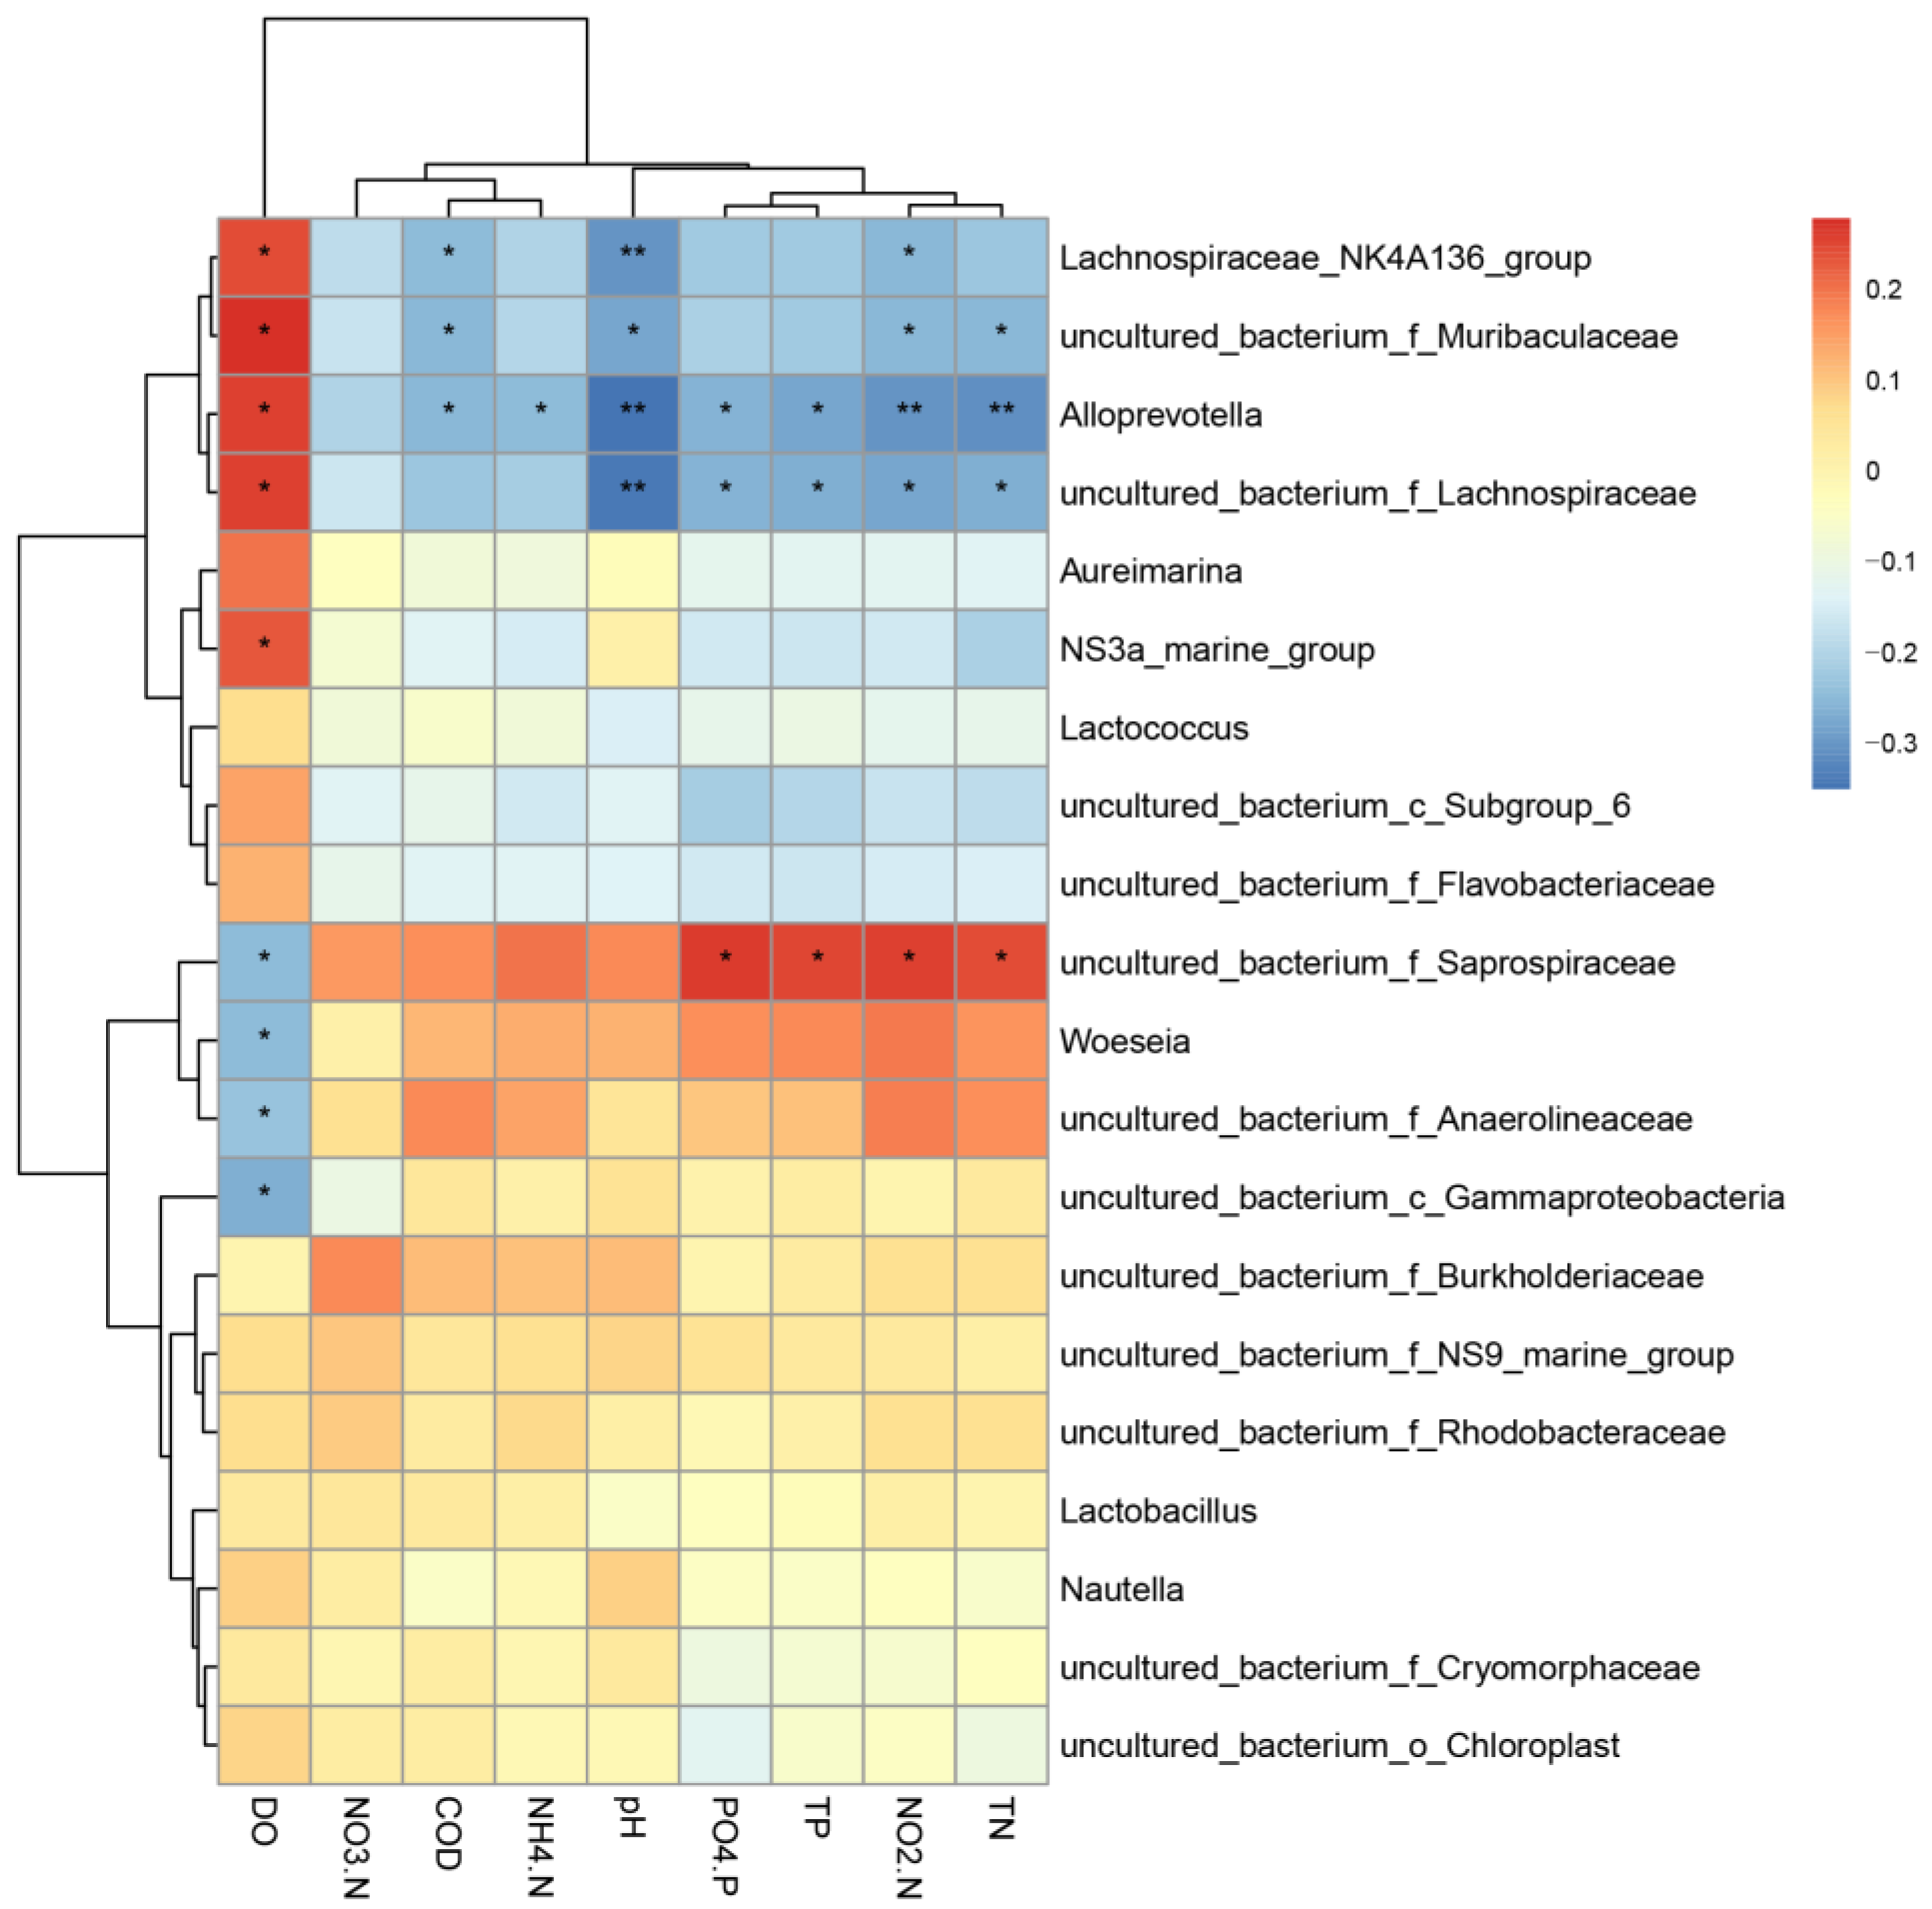
3.3. Correlation of Each Sample Flora with Water Environment Factors

As can be seen in Table 2, the water-quality indexes of the initial water samples and the water samples of each tank in different groups show significant differences. Among the water-quality indexes of the different groups, DO shows a trend of decreasing with the increase in culture density; pH shows a small change with the increase in culture density, among which the pH value of Group 3 was the highest; COD, TN, NO3-N, NO2N and NH4+-N all show a trend of increasing with the increase in culture density; and TP and PO43−-P show a trend of increasing and then decreasing with the increase in culture density, among which the value of Group 3 was the highest among all groups.
As can be seen in Figure 8, the correlations between different species of bacteria and environmental factors show more significant differences. The results show that the dominant bacteria, uncultured_bacterium_f_Rhodobacteraceae, in the water column were negatively correlated with PO43−-P and positively correlated with DO, pH, COD, NO2-N, NO3-N, NH4+-N, TN and TP. The Uncultured_bacterium_f_Anaerolineaceae and Woeseia in the sediment were significantly negatively correlated with DO and positively correlated with PO43−-P, pH, COD, NO2-N, NO3-N, NH4+-N, TN and TP. The dominant bacteria, Lactococcus, in the guts of the shrimp and the razor-clam gut mass were positively correlated with DO and negatively correlated with PO43−-P, pH, COD, NO2-N, NO3-N, NH4+-N, TN and TP. Uncultured_bacterium_f_Lachnospiraceae had a significant positive correlation with DO (p < 0.05); a significant negative correlation with PO43−-P, pH, NO2-N, TN and TP (p < 0.05); and a negative correlation with COD, NO3-N and NH4+-N. In addition, Lachnospiraceae_NK4A136_group, uncultured_bacterium_f_Muribaculaceae and Alloprevotella all showed significant positive correlations with DO and significant negative correlations with COD, pH and NO2-N (p < 0.05).

4. Discussion

4.1. Bacterial Community Composition in Different Culture-Density Groups in the Tandem-Culture Model

There have been many studies on determination of culture environments and cultured-organism flora in monoculture, mixed culture and biofloc culture models [7,8], but no one has yet evaluated the flora of culture environments and cultured organisms in the shrimp and razor-clam tandem-culture model. In addition, there are few studies related to determination of bacterial flora in Pacific white shrimp and razor clams at different culture densities.
In this study, the structural compositions of bacterial communities in the water column, substrate sediment, shrimp gut contents and razor-clam gut mass, in shrimp and razor-clam tandem-culture tanks at different culture densities, was analyzed using high-throughput sequencing technology. First, at the phylum level, Proteobacteria were present among the dominant groups in all samples, mainly because the nucleocytoplasmic homologs of many genes originate from Proteobacteria, which have absolute advantages in molecular biological classification and phenotypic classification among prokaryotes [9]. The dominant bacteria in the culture environment (water column and substrate sediment) were Bacteroidetes and Chloroflexi, which is consistent with the results already reported [10,11]. The first dominant bacteria in the guts of shrimp and the clam gut masses were Firmicutes, followed by Proteobacteria and Bacteroidetes, which differed from many existing studies. For example, Liu et al. determined the gut flora of spotted prawns and Hong Kong oyster visceral-mass flora in mixed shrimp-and-shellfish ponds and found that the dominant bacteria were Proteobacteria (43.0%) and Firmicutes (17.0%) [12]. However, Mukherjee et al. found that the abundance of Firmicutes was higher in the dominant intestinal microorganisms of Catla than was that of Proteobacteria [13]. Zhao et al. also found that there were significant differences in the gut microbial community structures of Pacific white shrimp in the four culture models, and the abundance of Cyanophyta was much higher in the freshwater pond culture model than in the other culture models [14]. We hypothesize that dominant bacteria are related to culture species, environment and model. The dominant bacteria in the intestinal and visceral masses of the cultured organisms in this experiment, based on genus level, were all Lactococcus spp. under the phylum Firmicutes, and in much higher abundance than the others. It has been shown that some bacteria of the genus Lactococcus can synthesize a lactococcal peptide with antimicrobial effects [15], and that the dominant phyla Proteobacteria and Bacteroidetes are essential for organic-matter degradation, presumably putting shrimp and razor clams in a healthier state in the tandem-culture model compared to the conventional culture method.
The structure of the gut flora of farmed organisms is closely related to the structure of the microflora of the farming environment, and environmental factors determine the structure and function of the microbial community [16], while the structure and function of the gut microflora play an important role in the physiology, immunity, metabolism and health of the host [17,18]. In the results of this study, it was found that there were differences between water samples, sediment samples and cultured organisms based on the dominant bacteria at the genus level. In the water sample, the first dominant bacterium was uncultured_bacterium_f_Rhodobacteraceae, which belongs to the α-Amastigotes phylum and is an important heterotrophic bacterium in the marine environment, with a high metabolic versatility and capable of oxygen-producing photosynthesis, metabolizing a variety of organic compounds, degrading dimethyl sulfopropionate and producing various secondary metabolites [19]. The second dominant bacterium was uncultured_bacterium_f_Cryomorphaceae, and related studies have shown that its abundance is high in algal cultures [20]; the reason for its greater abundance in the culture water of this experiment may be related to the feeding with the microgreen coccolithophore algae solution. The third dominant bacterium, NS3a_marine_group, is a genus whose abundance increases significantly when the ambient temperature drops [21]. The water temperature decreased from 30.7 °C at the beginning to 25.5 °C at the end of this test cycle, while it can be seen that the abundance of NS3a_marine_group in the initial sample was much lower than that of the density group samples collected at the end of this study, which is consistent with the above results in the literature. In addition, among the dominant bacteria, there were pathogenic bacteria, such as uncultured_bacterium_f_Burkholderiaceae and uncultured_bacterium_f_Flavobacteriaceae, but due to their low abundance, they had little impact on the health of the cultured organisms. In the sediment sample, the first dominant bacterium was uncultured_bacterium_f_Anaerolineaceae, belonging to Chloroflexi, which plays an important role in organic-matter degradation under anoxic conditions [22]. The second dominant bacterium was Woeseia, which belongs to the order γ-Amastigotes and is found to be widely distributed in coastal marine environments around the world, with rich biogeochemical functions, such as heterosulfur oxidation and denitrification [23,24]. The first three dominant bacteria in the shrimp intestinal and razor-clam gut groups were all Lactococcus, uncultured_bacterium_f_Lachnospiraceae and uncultured_bacterium_c_Subgroup_6. Lactococcus has been mentioned above and is a probiotic that plays an important role in maintaining the intestinal health of organisms; gross uncultured_bacterium_f_Lachnospiraceae is an important butyrate producer in intestinal flora, while butyrate and other SCFAs inhibit intestinal inflammation, maintain the intestinal barrier and regulate intestinal motility through different mechanisms [25]; and uncultured _bacterium_c_Subgroup_6 belongs to Acidobacteria, with related studies that have found that it may be associated with low nitrogen input to inter-rhizosphere organic carbon turnover [26]. The abundance of Photobacterium in the MX4 group was found to be much higher than in the other groups in the gut samples of shrimp, mainly because the first parallel sample in the MX4 group contained a large amount of Photobacteria. It has been shown that some strains of Photobacteria have the ability to cause disease in the host, and the growth index of the shrimp in the tank where this parallel sample was located was the worst among all of the tanks, with a specific growth rate of only 80.9% of the average value of all of the tanks, while the remaining two parallels were in good condition and the abundance of Photobacteria was much lower than that of this parallel sample, presumably due to the individual differences of the shrimp in this tank. The uncultured_bacterium_f_Flavobacteriaceae are conditionally pathogenic bacteria that can cause infections such as pneumonia, meningitis and sepsis [27], but they are not very pathogenic and do not cause morbidity in general. As seen in the results, the abundance of uncultured_bacterium_f_Flavobacteriaceae in the initial sample was 15.81 ± 1.25, which was much higher than in the density groups in the four tandem-culture patterns, and it is presumed that the growth of uncultured_bacterium_f_Flavobacteriaceae in the culture pattern was inhibited. In the razor-clam gut-mass samples, the abundance of Mycoplasma was found to be much higher in the MY1 group than in the other groups, which was mainly due to the presence of a large amount of Mycoplasma, one of the pathogenic bacteria of shellfish organisms, in the second parallel sample in the MY2 group [28], and the growth index of razor clams in the tank of this parallel sample was the worst among all of the tanks, with the specific growth rate being only 66.0% of the mean value of all of the tanks. This is also presumed to be due to the individual differences of the razor clams in this tank.

4.2. Changes in α-Diversity Indexes of Bacterial Communities in Different Culture-Density Groups in the Tandem-Culture Model

It has been shown that the compositions and structures of bacterial communities in a culture environment are related to culture density, and changes in bacterial-community diversity can affect the growth and health of cultured organisms to some extent. In this study, the Shannon index, the Simpson index, the ACE index and the Chao1 index were found to be the largest in the bottom sediments of the four samples, indicating the highest diversity and abundance of bacterial communities. This is mainly because the material composition of substrate sediment is more complex and contains more nutrients, which provide better conditions for growth of bacterial flora [29]. The ACE index and the Chao1 index of the water column were higher than those of the razor-clam visceral mass and the guts of the shrimp, indicating a higher bacterial abundance in the water column, similar to the results of studies on bacterial flora in aquatic animals such as Hyriopsis cumingii and Cynoglossus semilaevis [30,31]. In addition, the Shannon index, the ACE index and the Chao1 index of the razor-clam tank water samples increased with the increase in culture density, indicating that an increase in culture density will increase the diversity and abundance of bacterial flora in culture water, as can be seen in Figure 9; the colors of the biofilters of the four density groups in the razor-clam tank darkened with the increase in culture density, and the darkening in color indicated that more detritus (i.e., uneaten food and feces) were present in the system. For cultured organisms, the Shannon index, the ACE index and the Chao1 index of the shrimp samples in Group 3 and the razor-clam samples in Group 2 were higher, indicating that the abundance and diversity of cultured organisms are higher at their culture densities, and related studies have also shown that growth, metabolism and immunity of cultured organisms show a trend of increasing and then decreasing with increases in culture density [32,33]. The survival rate of the shrimp reached 100% during the experimental period, while the Shannon index, the ACE index and the Chao1 index of the gut contents of the shrimp in the four density groups were higher than in the initial shrimp samples. The ACE index and the Chao1 index of the razor-clam gut mass were slightly lower compared with those of the initial samples, and the Shannon indexes of all water samples in the density group were higher than those of the initial samples, which may be closely related to water temperature. In general, the water bacteria in a water temperature of more than 30 °C will be reduced in reproduction rate and activity; about a 25 °C water temperature is more suitable for survival of bacterial reproduction. The initial water temperature of this study was 30.7 °C, and the water temperature dropped to 25.5 °C at the end of this study. Wang et al.’s high-throughput sequencing of water quality and razor-clam gut mass in four seasons in razor-clam culture ponds revealed that the abundance of razor-clam gut mass decreased from summer to winter with the decrease in water temperature [30], and the diversity of the bacterial community in the culture water was higher in summer and autumn, which is more consistent with the results of this experiment. The ACE indexes and the Chao1 indexes of the sediment samples of the substrate showed decreases with the increase in culture density, and both were lower than in the initial samples. It is speculated that this may be related to the bioturbation effect of razor clams; razor clams, because of their living habits, drill mud and spray water, resulting in a certain amount of bacteria in the sediment being carried into the water. The number of clams in each group increased in a gradient from Group 1 to Group 4; presumably, the intensity of the bioturbation effect increased in each group, so more bacteria were carried into the water from the sediment, resulting in a decrease in the abundance of bacteria in the sediment samples of the substrate with the increase in culture density.

4.3. Correlation between Bacterial Composition and Environmental Factors in Shrimp and Razor-Clam Culture Tanks of Different Density Groups in the Tandem-Culture Model

Many studies have shown that changes in the compositions of bacterial communities are closely related to the factors of the culture environment [34,35], which is beneficial for disease prevention and control and water-quality control and plays an extremely important role in application of the tandem-culture model in actual production by mastering the changes in the structures of bacterial communities in a culture environment with culture density and its influencing factors. In NMDS analysis, for shrimp tank water samples, Groups 1 and 2 clustered into one group and Groups 3 and 4 clustered into one group, and these two groups were relatively far apart, suggesting that culture density might have a greater effect on growth of different bacterial groups in Pacific-white-shrimp culture water. For razor-clam tank water samples, the differences between Group 1 and the remaining three groups were significant, indicating that there were significant differences between the composition of the razor-clam-culture water flora at low culture densities and the razor-clam-culture water flora at relatively high culture densities. From the table of the abundance of dominant bacteria in the water samples, it can be seen that culture density had a greater effect on NS3 a_marine_group and uncultured_bacterium_f_Saprospiraceae. Meanwhile, uncultured_bacterium_f_Saprospiraceae belongs to the family Spirulinaceae and plays an important role in denitrification. Nitrification plays an important role, and existing studies have shown that conditions such as the carbon source, dissolved oxygen and pH are the main factors affecting its response. As seen in Figure 8, uncultured_bacterium_f_Saprospiraceae was negatively correlated with DO and positively correlated with TN and NO2-N, which is consistent with existing studies, but it was also significantly positively correlated with TP and PO43−-P, which requires further investigation to explore the relationship between this bacterium and phosphorus sources. For the substrate sediments, Groups 2, 3 and 4 clustered into one group and were far away from Group 1, indicating that the culture density had a greater influence on the growth of different bacterial groups in the substrate sediments in the tandem-culture model. From the table of the abundance of dominant bacteria in the sediment samples of the substrate, it can be seen that culture density had a greater effect on uncultured_bacterium_f_Anaerolineaceae and Woeseia, both of which are genera associated with the natural material cycle [36] and, when present in large numbers, will lead to a lack of nitrogen sources in the substrate sediment, affecting the ecological environment and even the health of cultured organisms. In Figure 8, it can be seen that they were positively but not significantly correlated with nitrogen and TN, and both were significantly negatively correlated with DO (p < 0.05). In general, culture density directly affects the water DO, feed intake and nitrogen and phosphorus outputs of cultured organisms, which further affects the culture environment and the composition structure of bacterial flora in cultured organisms and has an impact on the health status and growth of cultured organisms, so it is extremely important to control a reasonable culture density in actual production.

5. Conclusions

In this study, we found that culture density in the tandem-culture model had an effect on the bacterial structures of the water column, sediment and razor-clam visceral mass samples, but had no significant effect on the bacterial structures of the shrimp samples. Correlation analysis combining environmental factors with bacterial flora at the genus level showed that culture density directly influenced water-quality factors, which in turn influenced the composition structure of the bacterial flora in the culture environment and the cultured organisms.

Supplementary Materials

The following supporting information can be downloaded at: https://www.mdpi.com/article/10.3390/fishes8060287/s1, Table S1: Relative abundance of main bacterial groups in water; Table S2: Relative abundance of main bacterial groups in sediment; Table S3: Relative abundance of main flora in the visceral mass of S. constricta; Table S4: Relative abundance of major intestinal flora of L. vannamei; Table S5: Alpha diversity index of each L. vannamei intestinal content sample at the OTU level; Table S6: Alpha diversity index of the visceral mass samples of each S. constricta at the OTU level; Table S7: Alpha diversity index of water samples at OTU level; Table S8: Alpha diversity index of sediment samples at OTU level.

Author Contributions

C.Z. and S.X. conceived this project and designed the experiments. C.Z. wrote the manuscript. C.Z. and G.B. performed the experiments. C.Z. and S.X. analyzed the data. J.X., S.X. and D.W. provided the resources. The manuscript was revised and improved by S.X. and D.W. All authors have read and agreed to the published version of the manuscript.

Funding

This work was supported by the National Key Research and Development Program of China (grant numbers: 2019 YFD0900400); Ningbo Science and Technology Research Projects, China (grant numbers: 2019B10006); the China Agriculture Research System of MOF and MARA; and the K. C. Wong Magna Fund in Ningbo University.

Institutional Review Board Statement

The studies involving animals were reviewed and approved by the Ningbo University Laboratory Animal Center under permit number no. SYXK (ZHE2008-0110).

Informed Consent Statement

Not applicable.

Data Availability Statement

The datasets used and/or analyzed during the current study are available from the corresponding authors upon reasonable request.

Conflicts of Interest

The authors declare no conflict of interest.

References

  1. Wang, L.; Liu, L.; Zheng, B.; Zhu, Y.; Wang, X. Analysis of the bacterial community in the two typical intertidal sediments of Bohai Bay, China by pyrosequencing. Mar. Pollut. Bull. 2013, 72, 181–187. [Google Scholar] [CrossRef]
  2. Fan, L.; Chen, J.; Meng, S.; Song, C.; Qiu, L.; Hu, G.; Xu, P. Characterization of microbial communities in intensive GIFT tilapia (Oreochromis niloticus) pond systems during the peak period of breeding. Aquac. Res. 2017, 48, 459–472. [Google Scholar] [CrossRef]
  3. Michaud, L.; Giudice, A.L.; Troussellier, M.; Smedile, F.; Bruni, V.; Blancheton, J.P. Phylogenetic characterization of the heterotrophic bacterial communities inhabiting a marine recirculating aquaculture system. J. Appl. Microbiol. 2010, 107, 1935–1946. [Google Scholar] [CrossRef] [PubMed]
  4. Tang, Y.; Tao, P.; Tan, J.; Mu, H.; Peng, L.; Yang, D.; Tong, S.; Chen, L. Identification of Bacterial Community Composition in Freshwater Aquaculture System Farming of Litopenaeus vannamei Reveals Distinct Temperature-Driven Patterns. Int. J. Mol. Sci. 2014, 15, 13663–13680. [Google Scholar] [CrossRef]
  5. Zheng, X.; Tang, J.; Zhang, C.; Qin, J.; Wang, Y. Bacterial composition, abundance and diversity in fish polyculture and mussel-fish integrated cultured ponds in China. Aquac. Res. 2017, 48, 3950–3961. [Google Scholar]
  6. Wang, X.; Xie, X.; Jin, S.; Zhu, J.; Zhao, Q.; Zhou, S. Seasonal changes of the bacterial community structure of Sinonovacula constricta and its aquaculture ponds in high-throughput sequencing. J. Appl. Ecol. 2019, 30, 4267–4276. [Google Scholar]
  7. Guan, X.; Wang, B.; Jiang, J.; Tian, J.; Dong, Y.; Chen, Z.; Gao, S.; Wang, X.; Sun, B.; Duan, P.; et al. Comparative study on microbial communities in sediments of mixed culture ponds of Penaeus vannamei in China. Mar. Sci. Bull. 2020, 39, 730–739. [Google Scholar]
  8. Fabrini, C.; Gustavo, B.G.; Olav, V.; Schveitzer, R. Management of biofloc concentrations as an ecological strategy for microbial control in intensive shrimp culture. Aquaculture 2021, 543, 736969. [Google Scholar]
  9. Radhey, S. The phylogeny of proteobacteria: Relationships to other eubacterial phyla and eukaryotes. FEMS Microbiol. Rev. 2000, 24, 367–402. [Google Scholar]
  10. Li, Q.; Zhang, Y.; Juck, D.; Fortin, N.; Greer, C.W.; Tang, Q. Phylogenetic analysis of bacterial communities in the shrimp and sea cucumber aquaculture environment in northern China by culturing and PCR–DGGE. Aquacult. Int. 2010, 18, 977–990. [Google Scholar] [CrossRef]
  11. Betina, L.; Yang, W.; Zheng, Y.; Nicholaus, R.; Zhu, J.; Zhu, J. Bioturbation by the razor clam (Sinonovacula constricta) on the microbial community and enzymatic activities in the sediment of an ecological aquaculture wastewater treatment system. Sci. Total Environ. 2018, 643, 1098–1107. [Google Scholar]
  12. Liu, C.; Jie, R.; Jiang, Z.; Zhang, M.; Wang, J. Development of a Blocking Primer to Inhibit the PCR Amplification of the 18S rDNA Sequences of Litopenaeus vannamei and Its Efficacy in Crassostrea hongkongensis. Front. Microbiol. 2019, 10, 830. [Google Scholar] [CrossRef]
  13. Mukherjee, A.; Rodiles, A.; Merrifield, D.L.; Chandra, G.; Ghosh, K. Exploring intestinal microbiome composition in three Indian major carps under polyculture system: A high-throughput sequencing based approach. Aquaculture 2020, 524, 735206. [Google Scholar] [CrossRef]
  14. Zhao, Y.; Guo, H.; Zhang, D. Effects of different farming modes on intestinal microbial community of Litopenaeus vannamei. J. Fish. China 2021, 45, 221–234. [Google Scholar]
  15. Adrien, F.; Yanath, B.; Francois, K.; Drider, D.; Dhulster, P.; Firdaous, L. Recovery of nisin from culture supernatants of Lactococcus lactis by ultrafiltration: Flux properties and separation efficiency. Food Bioprod. Process. 2022, 136, 196–210. [Google Scholar]
  16. Allison, S.D.; Martiny, J. Resistance, resilience, and redundancy in microbial communities. Proc. Natl. Acad. Sci. USA 2008, 105, 11512–11519. [Google Scholar] [CrossRef]
  17. Ramakrishna, B.S. Role of the gut microbiota in human nutrition and metabolism. J. Gastroen. Hepatol. 2013, 28, 9–17. [Google Scholar] [CrossRef] [PubMed]
  18. Xiong, J.; Dai, W.; Zhu, J.; Liu, K.; Dong, C.; Qiu, Q. The Underlying Ecological Processes of Gut Microbiota Among Cohabitating Retarded, Overgrown and Normal Shrimp. Microb. Ecol. 2017, 73, 988–999. [Google Scholar] [CrossRef]
  19. Bischoff, V.; Zucker, F.; Moraru, C. Marine Bacteriophages. Encycl. Virol. (Fourth Ed.) 2021, 4, 322–341. [Google Scholar]
  20. Asmani, K.; Petton, B.; Grand, J.L.; Mounier, J.; Robert, R.; Nicolas, J.L. Establishment of microbiota in larval culture of Pacific oyster, Crassostrea gigas. Aquaculture 2016, 464, 434–444. [Google Scholar] [CrossRef]
  21. Krüger, K.; Chafee, M.; Francis, T.B.; del Rio, T.G.; Becher, D.; Schweder, T.; Amann, R.I.; Teeling, H. In marine Bacteroidetes the bulk of glycan degradation during algae blooms is mediated by few clades using a restricted set of genes. ISME J. 2019, 13, 2800–2816. [Google Scholar] [CrossRef]
  22. Meng, D.; Li, J.; Liu, T.; Liu, Y.; Yan, M.; Hu, J.; Li, X.; Liu, X.; Liang, Y.; Liu, H.; et al. Effects of redox potential on soil cadmium solubility: Insight into microbial community. J. Environ. Sci. 2019, 75, 224–232. [Google Scholar] [CrossRef]
  23. Guo, C.; Zhang, X.; Luan, S.; Zhou, H.; Liu, L.; Qu, Y. Diversity and structure of soil bacterial community in intertidal zone of Daliao River estuary, Northeast China. Mar. Pollut. Bull. 2021, 163, 111965. [Google Scholar] [CrossRef] [PubMed]
  24. MußMann, M.; Pjevac, P.; Krüger, K.; Dyksma, S. Genomic repertoire of the Woeseiaceae/JTB255, cosmopolitan and abundant core members of microbial communities in marine sediments. ISME J. 2017, 11, 1276–1281. [Google Scholar] [CrossRef] [PubMed]
  25. Dinesh, K.; Renuka; Arun, K. New-Generation Probiotics. In Microbiome and Metabolome in Diagnosis, Therapy, and other Strategic Applications; Faintuch, J., Faintuch, S., Eds.; Elsevier: Amsterdam, The Netherlands, 2019; pp. 417–424. [Google Scholar]
  26. Hester, E.R.; Harpenslager, S.F.; van Diggelen, J.M.H.; Lamers, L.L.; Jetten, M.S.M.; Luke, C.; Lucker, S.; Welte, C.U. Linking nitrogen load to the structure and function of wetland soil and rhizosphere microbial communities. mSystems 2018, 3, e00214-17. [Google Scholar] [CrossRef] [PubMed]
  27. Li, Y.; Zhao, Y.; Liu, X.; Yuan, L.; Liu, X.; Wang, L.; Sun, H. Effects of endogenous potential probiotic Lactobacillus rhamnosus M2-4 on intestinal microflora and metabonomics in juvenile sea cucumber Apostichopus japonicus. Aquaculture 2022, 555, 738247. [Google Scholar] [CrossRef]
  28. Kong, N.; Han, S.; Fu, Q.; Yu, Z.; Wang, L.; Song, L. Impact of ocean acidification on the intestinal microflora of the Pacific oyster Crassostrea gigas. Aquaculture 2022, 546, 737365. [Google Scholar] [CrossRef]
  29. Wang, Y.; Ji, Z.; Li, X.; Long, Z.; Pei, Y. Comprehensive analysis of the migration and transformation of nutrients between sediment and overlying water in complex habitat systems. Sci. Total Environ. 2022, 852, 158433. [Google Scholar] [CrossRef]
  30. Sheng, P.; Chen, Q.; Han, Q.; Lu, J.; Zhang, B.; Jiang, M.; Peng, R.; Jiang, X. Bacterial community in gut, shell sediment, and surrounding water of Hyriopsis cumingii fed three different microalgal diets. Aquaculture 2021, 540, 736701. [Google Scholar] [CrossRef]
  31. Zheng, Z.; Lin, B.; Wang, Y.; Liao, M.; Wang, L.; Rong, X. Analysis of the structural characteristics of digestive tract flora of Cynoglossus semilaevis cultured in ponds in high-throughput sequencing. J. Aquat. Biol. 2015, 39, 38–45. [Google Scholar]
  32. Lu, J.; Li, S.; He, X.; Tang, R.; Li, D. An in-pond tank culture system for high-intensive fish production: Effect of stocking density on growth of grass carp (Ctenopharyngodon idella Valenciennes, 1844) and blunt snout bream (Megalobrama amblycephala Yih, 1955). Aquaculture 2022, 549, 737808. [Google Scholar] [CrossRef]
  33. Aurobinda, U.; Himanshu, S.S.; Basanta, K.D.; Ramteke, M.H.; Kumar, V.; Krishna, G.; Mohanty, B.P.; Chadha, N.K.; Das, A.K. Stocking density matters in open water cage culture: Influence on growth, digestive enzymes, haemato-immuno and stress responses of Puntius sarana (Ham, 1822). Aquaculture 2022, 547, 737445. [Google Scholar]
  34. Zhou, L.; Qu, Y.; Qin, J.; Chen, L.; Han, F.; Li, E. Deep insight into bacterial community characterization and relationship in the pond water, sediment and the gut of shrimp (Penaeus japonicus). Aquaculture 2020, 539, 736658. [Google Scholar] [CrossRef]
  35. Alexia, O.; Regina, E.G.; Eduardo, Q.G.; Cristina, E.F.; Roberto, H.H.; Alberto, P.R. Digestive microbiota of shrimp Penaeus vannamei and oyster Crassostrea gigas co-cultured in integrated multi-trophic aquaculture system. Aquaculture 2020, 521, 735059. [Google Scholar]
  36. Fernandes, G.L.; Shenoy, B.D.; Damare, S.R. Diversity of bacterial community in the oxygen minimum zones of Arabian Sea and Bay of Bengal as deduced by illumina sequencing. Front. Microbiol. 2022, 10, 3153. [Google Scholar] [CrossRef]
Figure 1. Basic setup of culture tank. The upper two pictures are the field condition of the experimental tank and the condition of the bottom water pipeline, respectively, and the lower two pictures are the actual conditions of the razor-clam culture tank and the shrimp culture tank, respectively.
Fishes 08 00287 g001
Figure 2. Bacterial community compositions and structures of water samples at the phylum level.
Fishes 08 00287 g002
Figure 3. Compositions and structures of bacterial communities at the phylum level in sediment samples.
Fishes 08 00287 g003
Figure 4. Compositions and structures of bacterial communities at the phylum level in S. constricta viscera.
Fishes 08 00287 g004
Figure 5. Compositions and structures of bacterial communities at the phylum level in the intestinal contents of L. vannamei.
Fishes 08 00287 g005
Figure 6. Heatmaps of microbial community abundance clustering at the genus level of each sample.
Fishes 08 00287 g006
Figure 7. Non-metric multidimensional scaling (NMDS) analysis of bacterial community structure in each sample.
Fishes 08 00287 g007
Figure 8. Heatmap of the correlation between water-quality indicators and the dominant flora in tandem-culture tanks for shrimp and clams. “*” and “**” indicate significant correlations at the 0.05 and 0.01 levels.
Fishes 08 00287 g008
Figure 9. The situations of the biological filter material in four density groups of S. constricta. The color of the biomedia darkened with the increase in the culture densities of shrimp and razor clams.
Fishes 08 00287 g009
Table 1. Grouping of culture tanks.
Cultured OrganismsCulture Tank Groups
Group 1Group 2Group 3Group 4
Stocking Density of Pacific White Shrimp (ind/m2)406080100
Actual Number of Shrimp Raised (ind)8121620
Stocking Density of Razor Clams (ind/m2)200300400500
Actual Number of Razor Clams Raised (ind)10152025
Table 2. The water-quality indexes of initial samples and culture tanks of different density groups.
IndicatorCSMXS1MXS2MXS3MXS4MYS1MYS2MYS3MYS4
DO7.96 ± 0.27 a7.39 ± 0.09 b7.27 ± 0.06 b7.17 ± 0.08 b7.11 ± 0.10 b6.55 ± 0.07 c 6.44 ± 0.07 cd6.32 ± 0.11 cd6.23 ± 0.12 d
pH7.97 ± 0.01 c7.99 ± 0.06 bc8.03 ± 0.01 abc8.05 ± 0.01 ab8.02 ± 0.02 abc8.05 ± 0.04 ab 8.03 ± 0.01 abc8.08 ± 0.05 a8.02 ± 0.02 abc
COD0.64 ± 0.01 f5.75 ± 0.15 de5.53 ± 0.02 e6.10 ± 0.11 bc6.40 ± 0.26 a5.84 ± 0.08 cd 5.69 ± 0.13 de5.84 ± 0.11 cd6.25 ± 0.11 ab
TN1.10 ± 0.00 f8.71 ± 0.63 e10.44 ± 0.69 cd12.16 ± 0.57 b14.91 ± 0.47 a9.50 ± 1.04 de 11.33 ± 0.45 bc12.64 ± 0.51 b14.01 ± 0.49 a
NO3-N0.51 ± 0.00 e3.24 ± 0.23 cd3.94 ± 0.83 bc4.37 ± 0.48 b6.06 ± 0.71 a2.71 ± 0.44 d 2.67 ± 0.30 d3.08 ± 0.23 cd4.13 ± 0.57 bc
NO2-N0.01 ± 0.00 d0.11 ± 0.02 c0.17 ± 0.01 b0.24 ± 0.02 a0.24 ± 0.02 a0.10 ± 0.01 c0.17 ± 0.02 b0.21 ± 0.00 a0.23 ± 0.02 a
NH4+-N0.002 ± 0.00 e0.11 ± 0.09 cd0.14 ± 0.02 bcd0.18 ± 0.00 abc0.23 ± 0.03 ab0.08 ± 0.05 de 0.14 ± 0.03 bcd0.16 ± 0.05 abcd0.25 ± 0.03 a
TP0.25 ± 0.00 e1.72 ± 0.13 d2.14 ± 0.17 c2.58 ± 0.12 ab2.33 ± 0.23 bc1.45 ± 0.04 d 2.09 ± 0.26 c2.79 ± 0.19 a2.44 ± 0.18 abc
PO43−-P0.13 ± 0.00 c0.17 ± 0.01 c0.24 ± 0.04 b0.31 ± 0.02 a0.25 ± 0.03 b0.17 ± 0.03 c0.24 ± 0.03 b0.31 ± 0.02 a0.26 ± 0.03 ab
Different letters in the same line represent significant differences between different groups (p < 0.05).
Disclaimer/Publisher’s Note: The statements, opinions and data contained in all publications are solely those of the individual author(s) and contributor(s) and not of MDPI and/or the editor(s). MDPI and/or the editor(s) disclaim responsibility for any injury to people or property resulting from any ideas, methods, instructions or products referred to in the content.

