1. Introduction
The Atlantic Goliath Grouper,
Epinephelus itajara, is the largest grouper in the Atlantic Ocean, reaching lengths of more than 2.4 m and weights as high as 400 kg [
1,
2]. As with many other large-bodied reef fishes, Goliath Grouper exhibit life history characteristics that make them particularly vulnerable to overfishing, including that they are relatively long-lived, are slow to mature, and aggregate to spawn [
1,
3,
4]. In the United States (US), intense exploitation of Goliath Grouper led to a complete harvest moratorium in all US waters starting in 1990 [
5,
6]. This moratorium was partially lifted in Florida in 2023 and regulations now allow a seasonal take of a limited number of juveniles [
7]. In recent years, the Goliath Grouper population in the southeastern US, specifically around Florida, has shown signs of recovery, including the expanded range of identified spawning aggregations, increased observations of adult individuals, and increased juvenile abundance [
4,
8,
9,
10].
Despite these promising signs, several Goliath Grouper stock assessments conducted since the closure of the fishery have all failed to determine stock status [
11,
12,
13]. Two primary causes of the assessment failures were the lack of current catch data and uncertainty in many important life history parameters [
13]. It is clear from the rejection of these assessments that biological data are essential for estimating the population parameters used for stock recovery predictions and harvest sustainability. With nearly all harvest of Goliath Grouper closed, there are no fishery-dependent means of acquiring those data. This sets up a complicated question: How best to procure the biological samples needed for stock assessment from a closed fishery?
Of all the life history data required in a stock assessment, age is among the most valuable, as it forms the basis of life history tables and contributes to population metrics such as growth, reproduction, mortality, and recruitment [
14]. Most bony fishes, including Goliath Grouper, are aged using their sagittal otoliths, but this method is lethal [
1,
15]. For most species, otolith samples are obtained primarily from fish harvested by the fishery and secondarily from fishery-independent sampling. With the fishery closed since 1990, however, the traditional otolith collection methods are limited to stochastic mortality events and are no longer a viable option for ageing Goliath Grouper. Consequently, alternative structures, such as dorsal fin rays and dorsal fin spines (hereafter referred to as ‘rays’ or ‘spines’), are potential nonlethal options for estimating the age of Goliath Grouper, as these structures can be removed from live fish prior to their release [
16,
17].
Alternative ageing structures, particularly rays and spines, have been used to age diverse groups of fish with varying degrees of accuracy and precision [
15]. Ray ageing has been well documented in cold-temperate species, where the annual banding patterns are relatively wide and distinct [
18,
19,
20]. More recently, ray and spine ageing has been applied successfully to tropical and warm-temperate species [
21,
22,
23,
24]. External structures are increasingly being used because the sampling is nonlethal, which is especially important for sportfish species with catch-and-release fisheries [
16,
25,
26] and threatened or endangered species [
27,
28].
Alternative ageing structures for Goliath Grouper have shown promise but previous studies have been limited either in the range of ages available or in sample size [
17,
21,
29]. For example, Brusher and Schull [
29] compared scales, otoliths, and dorsal fin rays and spines from Goliath Grouper and determined that spines were the preferred external ageing structure (with otoliths as the reference). That study, however, included only juveniles up to 6 years and had a relatively small otolith sample size for comparative analyses (
n = 35 otoliths). Murie et al. [
17] compared otoliths and dorsal rays from 21 Goliath Grouper over a wider age range—0 to 18 years—than other studies but did not include spines in the comparison. While these studies show promise for using nonlethal structures for ageing, none point to a definitive nonlethal structure that can be used to accurately and precisely age Goliath Grouper. The limited range of ages, small sample sizes, and divergent conclusions regarding specific structures warrants a comprehensive comparison of paired otoliths, rays and spines (i.e., all three structures removed and aged from the same fish). Episodic mortality events (particularly cold snaps and harmful algal blooms) provided a unique opportunity to collect a large sample of external structures from Goliath Grouper, which made possible a comprehensive ageing comparison for this species.
The overall goal of this study was to evaluate the use of dorsal rays and spines to nonlethally age Goliath Grouper, with the following three objectives: (1) to compare ages derived from rays and spines relative to otoliths by identifying annuli in the structures, seasonality of annulus deposition relative to otoliths, and developing age class assignment criteria for each structure; (2) to estimate the ageing accuracy and precision of rays and spines using otolith ages as the reference age and to apply a correction factor, if needed, in response to inaccuracies related to structure vascularization; and (3) to determine the optimal sectioning region along each structure for accurate ageing, specifically as it applies to nonlethal structure removal.
2. Materials and Methods
Biological samples including otoliths, rays, and spines have been collected since 2006 as part of an ongoing Goliath Grouper mortality event response program by researchers at the FWC’s Fish and Wildlife Research Institute (FWRI;
Figure 1). FWRI researchers performed necropsies of dead Goliath Grouper reported via the FWC Fish Kill Hotline [
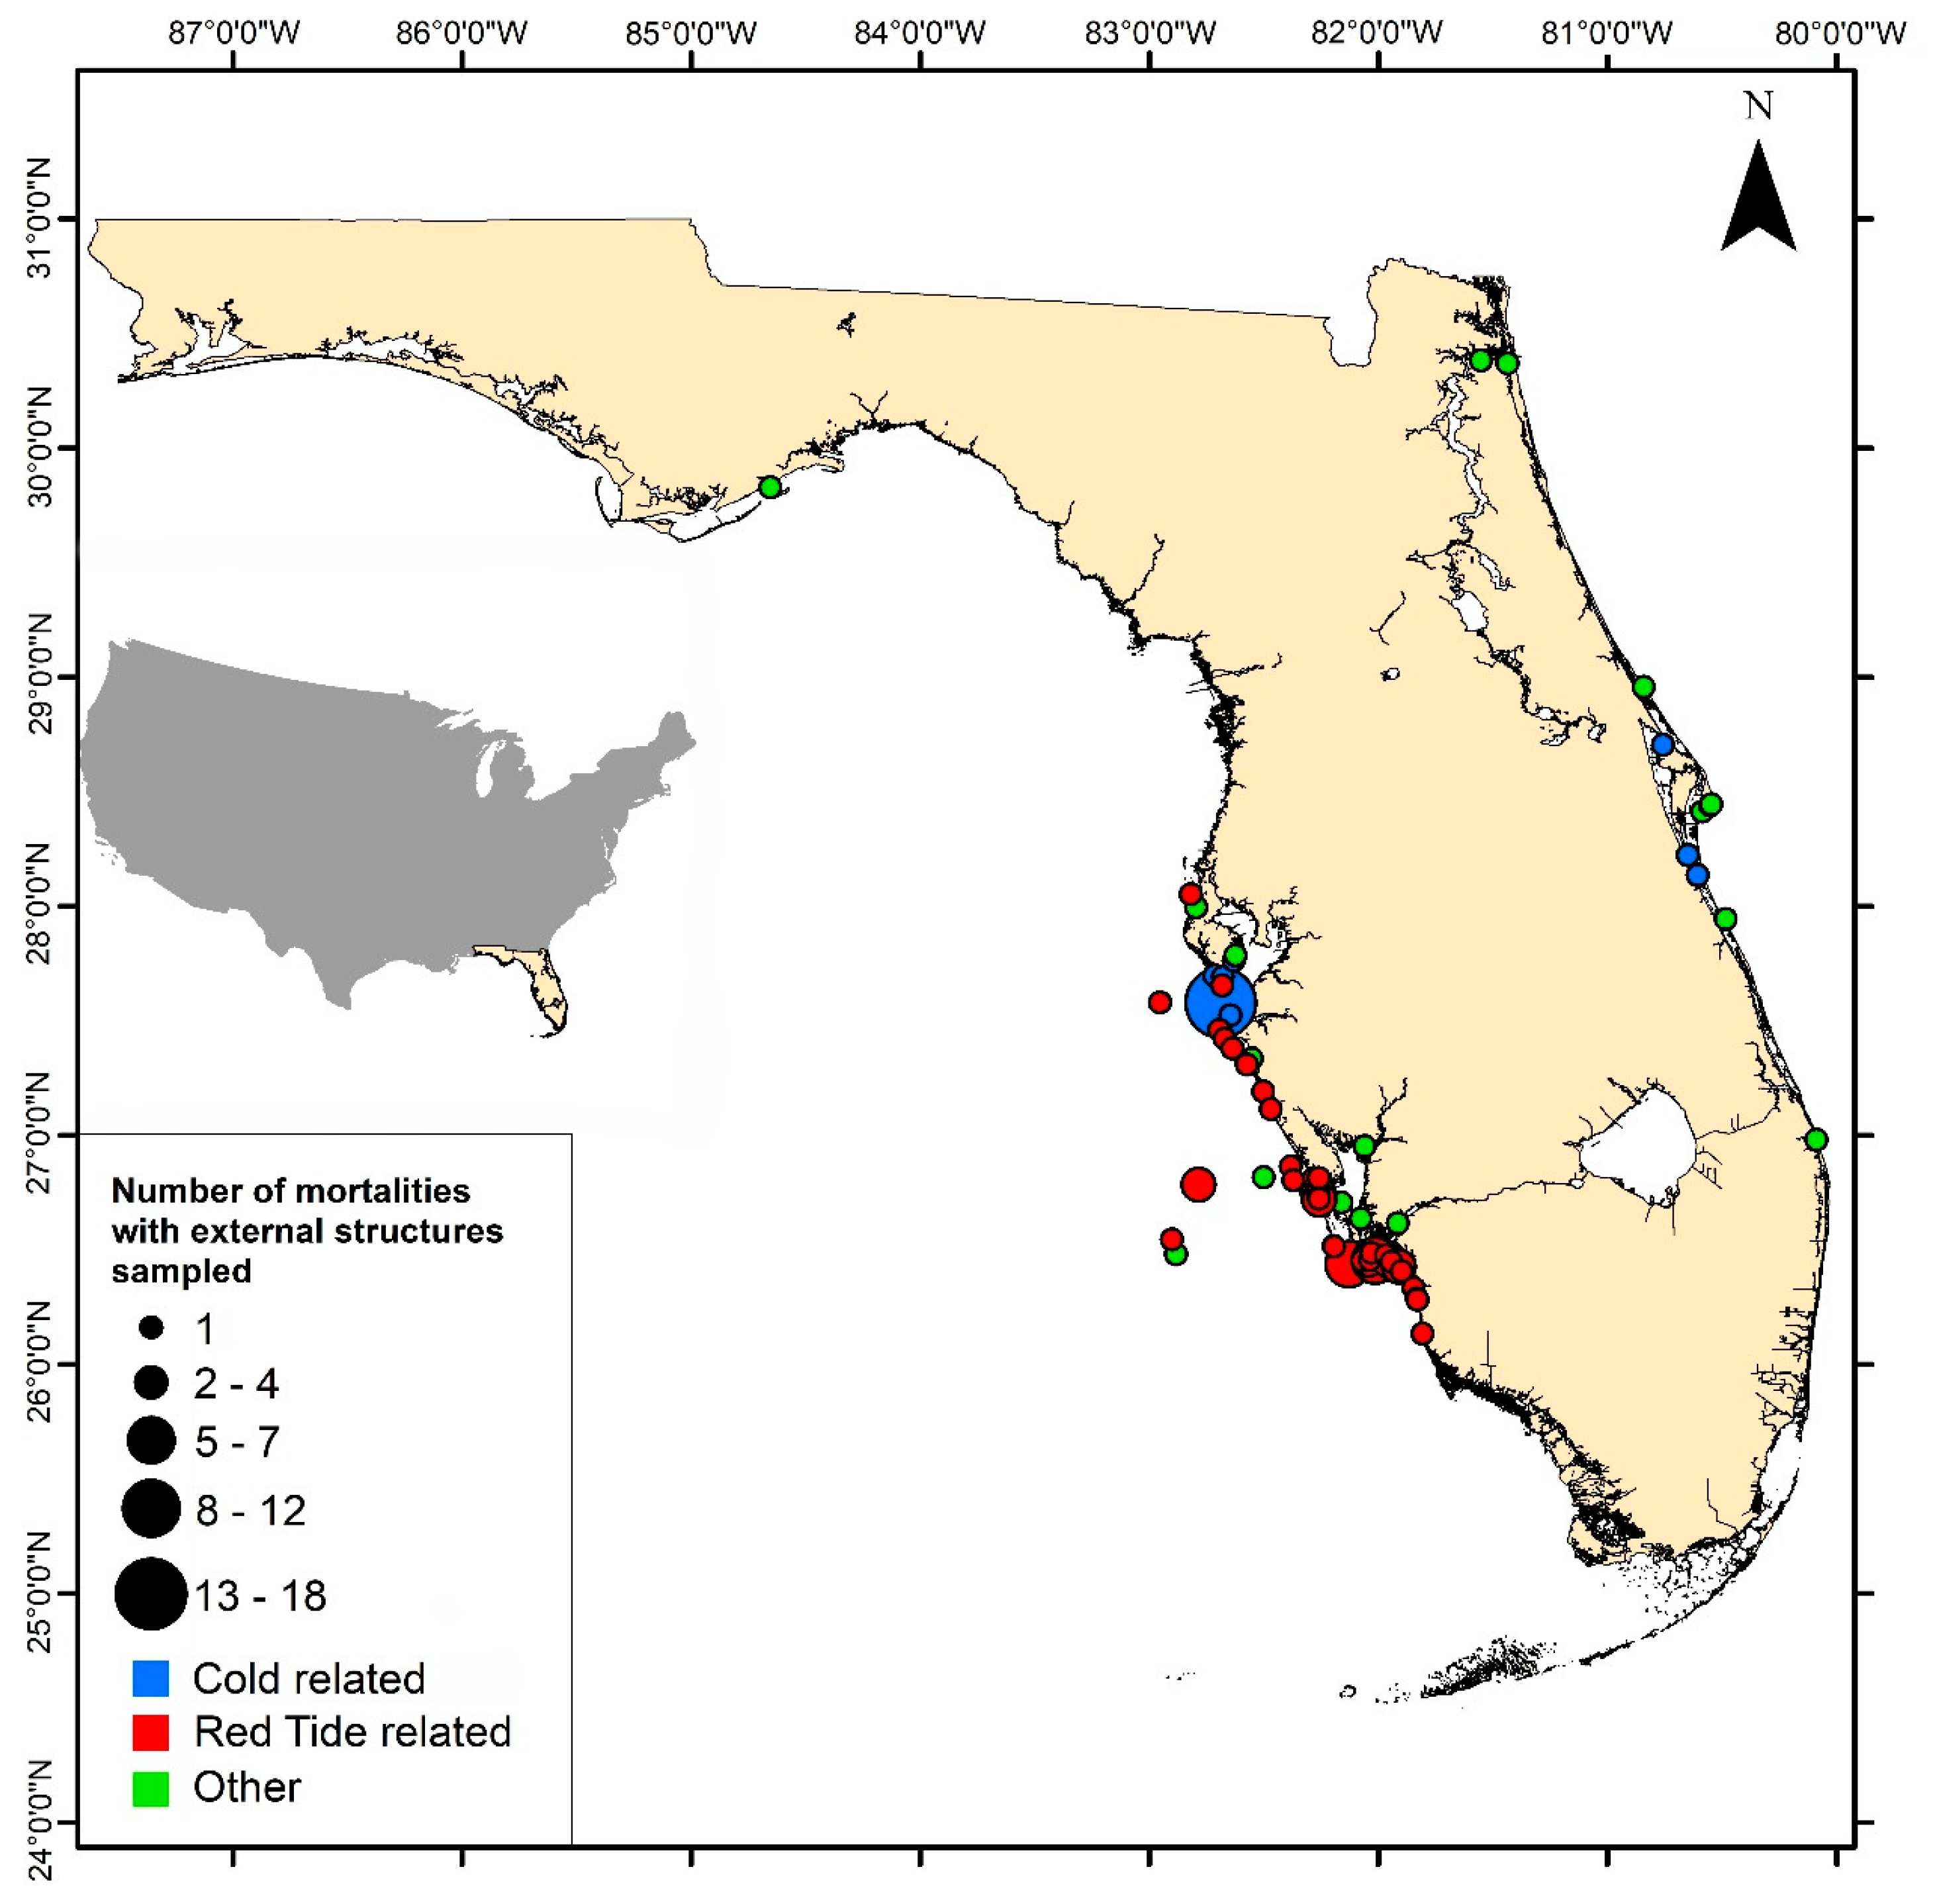
30], intercepted by the FWC’s Division of Law Enforcement, or encountered by FWRI researchers deployed in the field. The date and location of reported Goliath Grouper carcasses were recorded when possible but are considered approximations because most of them were found washed up on shore after having been dead for >24 h (
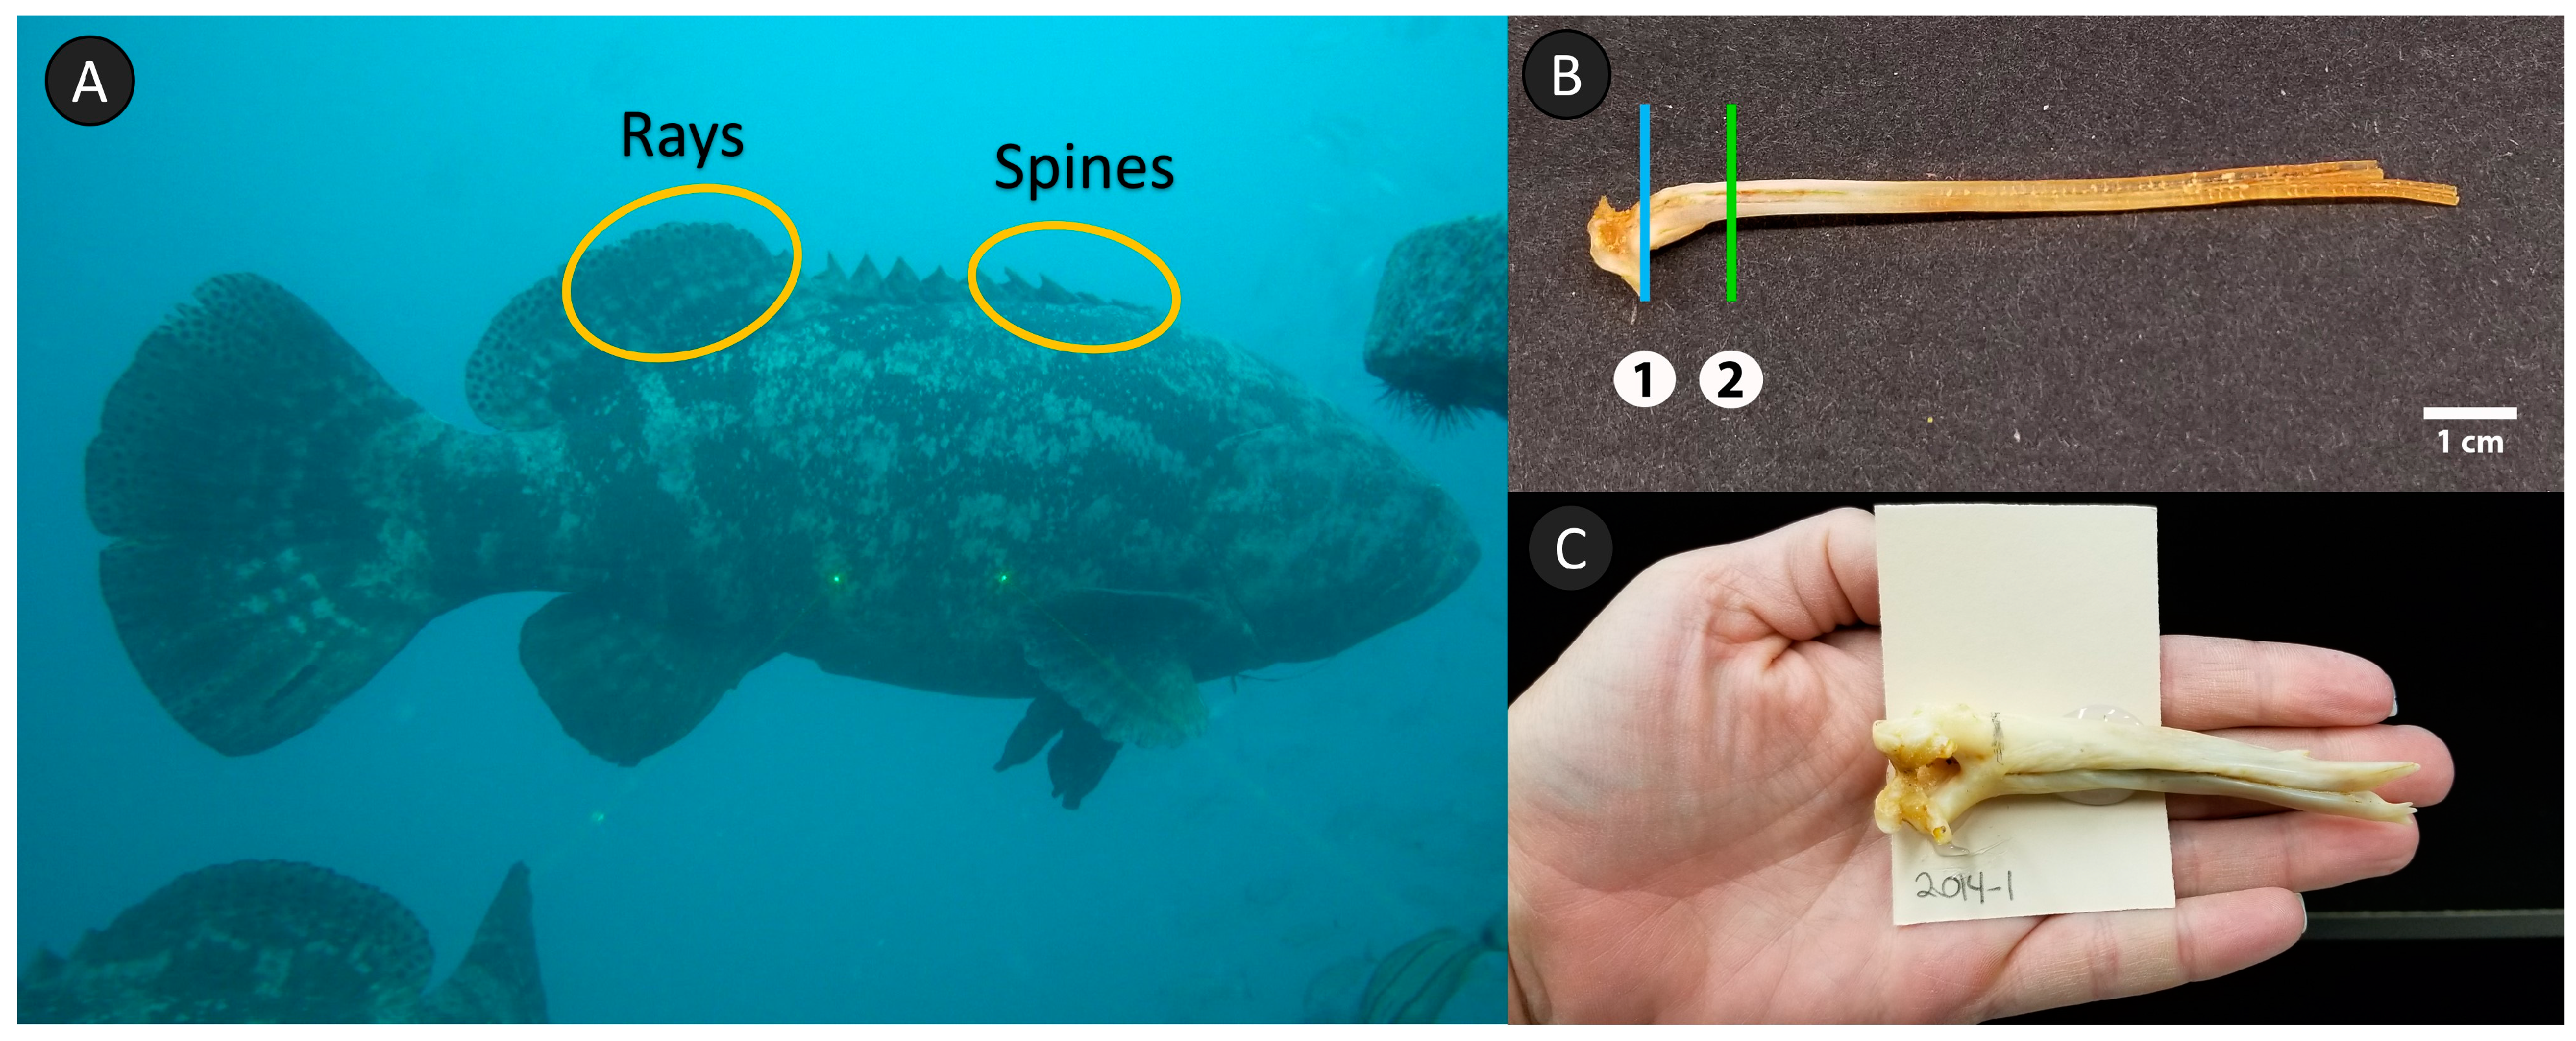
Figure 2). Sagittal otoliths, rays and spines were removed from the carcass, typically by using a reciprocating saw. Due to the nature of sampling prolonged mortality events, the sampling protocols encompassed a variety of samplers and different degrees of carcass decomposition. For example, the total length of each fish was measured but depended on the degree of decomposition; in some cases, the caudal fin was missing, damaged, or highly degraded, so standard length was recorded as the longest measurement (with an accompanying note about the discrepancy). In addition, several techniques had to be used to remove rays and spines, depending on condition of the carcass and structures. Ideally, dorsal rays 1–7 and spines 1–3 were excised at their insertion point (base), including the pterygiophores (
Figure 3). However, when decomposition was too extensive, it was not always possible to take the full complement of rays and spines, or it was necessary to excise the structures along the fleshy back of the fish (i.e., as if it were nonlethal sampling). Otoliths were rinsed and stored dry. Rays and spines were frozen until preparation for ageing.
2.1. Sample Preparation
Preparation of otolith samples followed standard practices as detailed in Section 3.2.6 of VanderKooy et al. [
15]. The left otolith was processed for age determination unless it was broken through the core, in which case the right otolith was used. The core of the otolith was marked with a pencil and the otolith was embedded in an epoxy resin (Araldite resin, Electron Microscopy Sciences, Hartfield, PA, USA) and mounted on card stock using hot glue. Otoliths were then sectioned on a Buehler Isomet™ low-speed saw (Buehler Co., Lake Bluff, IL, USA) equipped with four equally spaced 4-in. Buehler diamond wafering blades. With this technique, one transverse cut yields three sections, each approximately 0.4 mm thick. After processing, the sections were removed from the card stock and mounted in sequential order on glass slides using a mounting medium (Epredia™ Shandon-Mount, Thermo Fisher Scientific, Waltham, MA, USA).
Because rays and spines are functional external structures with skin and vascularization, sample preparation was more involved. Before they were cleaned, if the rays and spines were intact and the dorsal skin or distal tips were not deteriorated, then the distance from the distal tip of the structure to the base of the skin (the fleshy surface where the structure protruded from the dorsal musculature) was measured. The structures were thawed, and the base separated from the pterygiophores of the fish, if present. To maintain consistency, rays 3 and 4 and spine 2 were chosen for cleaning and ageing. Spines were boiled and rays simmered in water to soften tissues and remove any attached skin. The two parallel ray elements (hemitrichia) were separated and vascular tissue removed from the medial groove by alternating tissue removal with forceps and simmering the ray in water. After cleaning, rays and spines that were completely intact and had previously been measured were measured again, but this time from the true base to tip to get a full structure measurement. Cleaned rays and spines were air-dried in a laminar-flow hood.
The processing region for rays and spines was marked with a pencil, and the structure was mounted on card stock using the same protocol as for otoliths (
Figure 3). The optimal region for a spine section is generally considered to be slightly distal of the condyle [
15]; for rays, the basal region was marked as the starting point for several sequentially-distal cuts [
17] (
Figure 3). Whole rays and spines with a pre-cleaning measurement were marked at the measured distance of where the structure protruded from the skin on the back of the fish. This location was also sectioned for ageing, and these sections are hereafter referred to as skin-cut sections and ages. Most rays and spines with a skin-cut needed to be remounted after processing the basal region to adjust the structure properly for a transverse section of the skin-cut region. In all cases, care was taken to ensure that the rays and spines were mounted perpendicular to the saw blades, so that a true cross section of the structure was obtained. Further details of the preparation for all Goliath Grouper ageing structures, with images and a guide to troubleshooting, are provided in the
Supplementary Materials.
2.2. Ageing and Measurements
The banding patterns in cross-sections of rays and spines were counted differently from those of otoliths due to the differential appearance of opaque and translucent zones between structures (otoliths vs. rays and spines). Otolith ageing was conducted by counting the number of opaque zones along either side of the sulcal groove [
1,
15]; in other words, each opaque zone in an otolith was referred to as an annulus in this study. However, in both ray and spine sections, the translucent zones were the most defined, so these were counted as annuli [
17,
29]. The translucent zones of the rays and spines were counted with the understanding that the timing of their deposition might have been offset compared to the otoliths (i.e., translucent deposition of rays and spines may not occur at the same time as opaque deposition in otoliths). The timing of the deposition was tested and, if offset, the final ages of rays and spines were adjusted such that the assigned ages from all structures were aligned and comparable.
The sections of all structures were examined with a Leica MZ9.5 stereomicroscope (20–100× magnification) (Leica Microsystems, Wetzlar, Germany) using transmitted light. Ages assigned to otoliths were used as the reference ages for ray and spine comparisons because otoliths were assumed to be the most accurate and precise ageing structure. Otoliths were assigned to age classes using annulus count, degree of marginal completion, otolith annulus deposition period, and date of collection (
Table 1). With this method, fish are assigned to age classes based on the calendar year, which keeps cohorts together and is the current standard for assigning age classes in stock assessments. This method differs from Bullock et al. [
1], who assigned fish to biological age groups based on the timing of peak spawning. Final age class assignment for rays and spines was determined following results of the marginal-increment analysis but ultimately aligned with the otolith age class assignment protocol.
The margin (the distance between the last annulus and the edge of the structure) was qualitatively categorized for all three structures during ageing using the standardized coding system outlined in VanderKooy et al. [
15]. Keeping in mind the different banding patterns, the margins of all structures were qualitatively assessed as: Code 1, an annulus on the edge (opaque for otoliths, translucent for rays and spines); Code 2, <⅓ growth beyond the last annulus (<⅓ translucent for otoliths, <⅓ opaque for rays and spines); Code 3, ⅓–⅔ growth beyond the last annulus; or Code 4, >⅔ growth beyond the last annulus.
Each structure was aged by the primary reader (JLC) at least twice with no knowledge of any previous age estimate or the fish’s size. If the first two reads agreed, this was considered the final age. When age estimates did not agree, a third read was conducted to determine a consensus on the age of the sample. Otoliths were aged within a month of sampling as part of the regular FWRI Age and Growth Lab ageing queue, but rays and spines were cleaned, processed, and aged in one large batch. Ray and spine slides, including skin-cut sections, were randomized prior to ageing to avoid ageing bias related to knowledge of mortality events. A between-reader assessment of precision was conducted between the primary and a secondary reader (DJM) using a 20% subsample of the ray sections. Each reader independently conducted ray ageing and determined a final age for the sections in the subsample, which was then analyzed for between-reader precision, as well as reader accuracy using otolith ages.
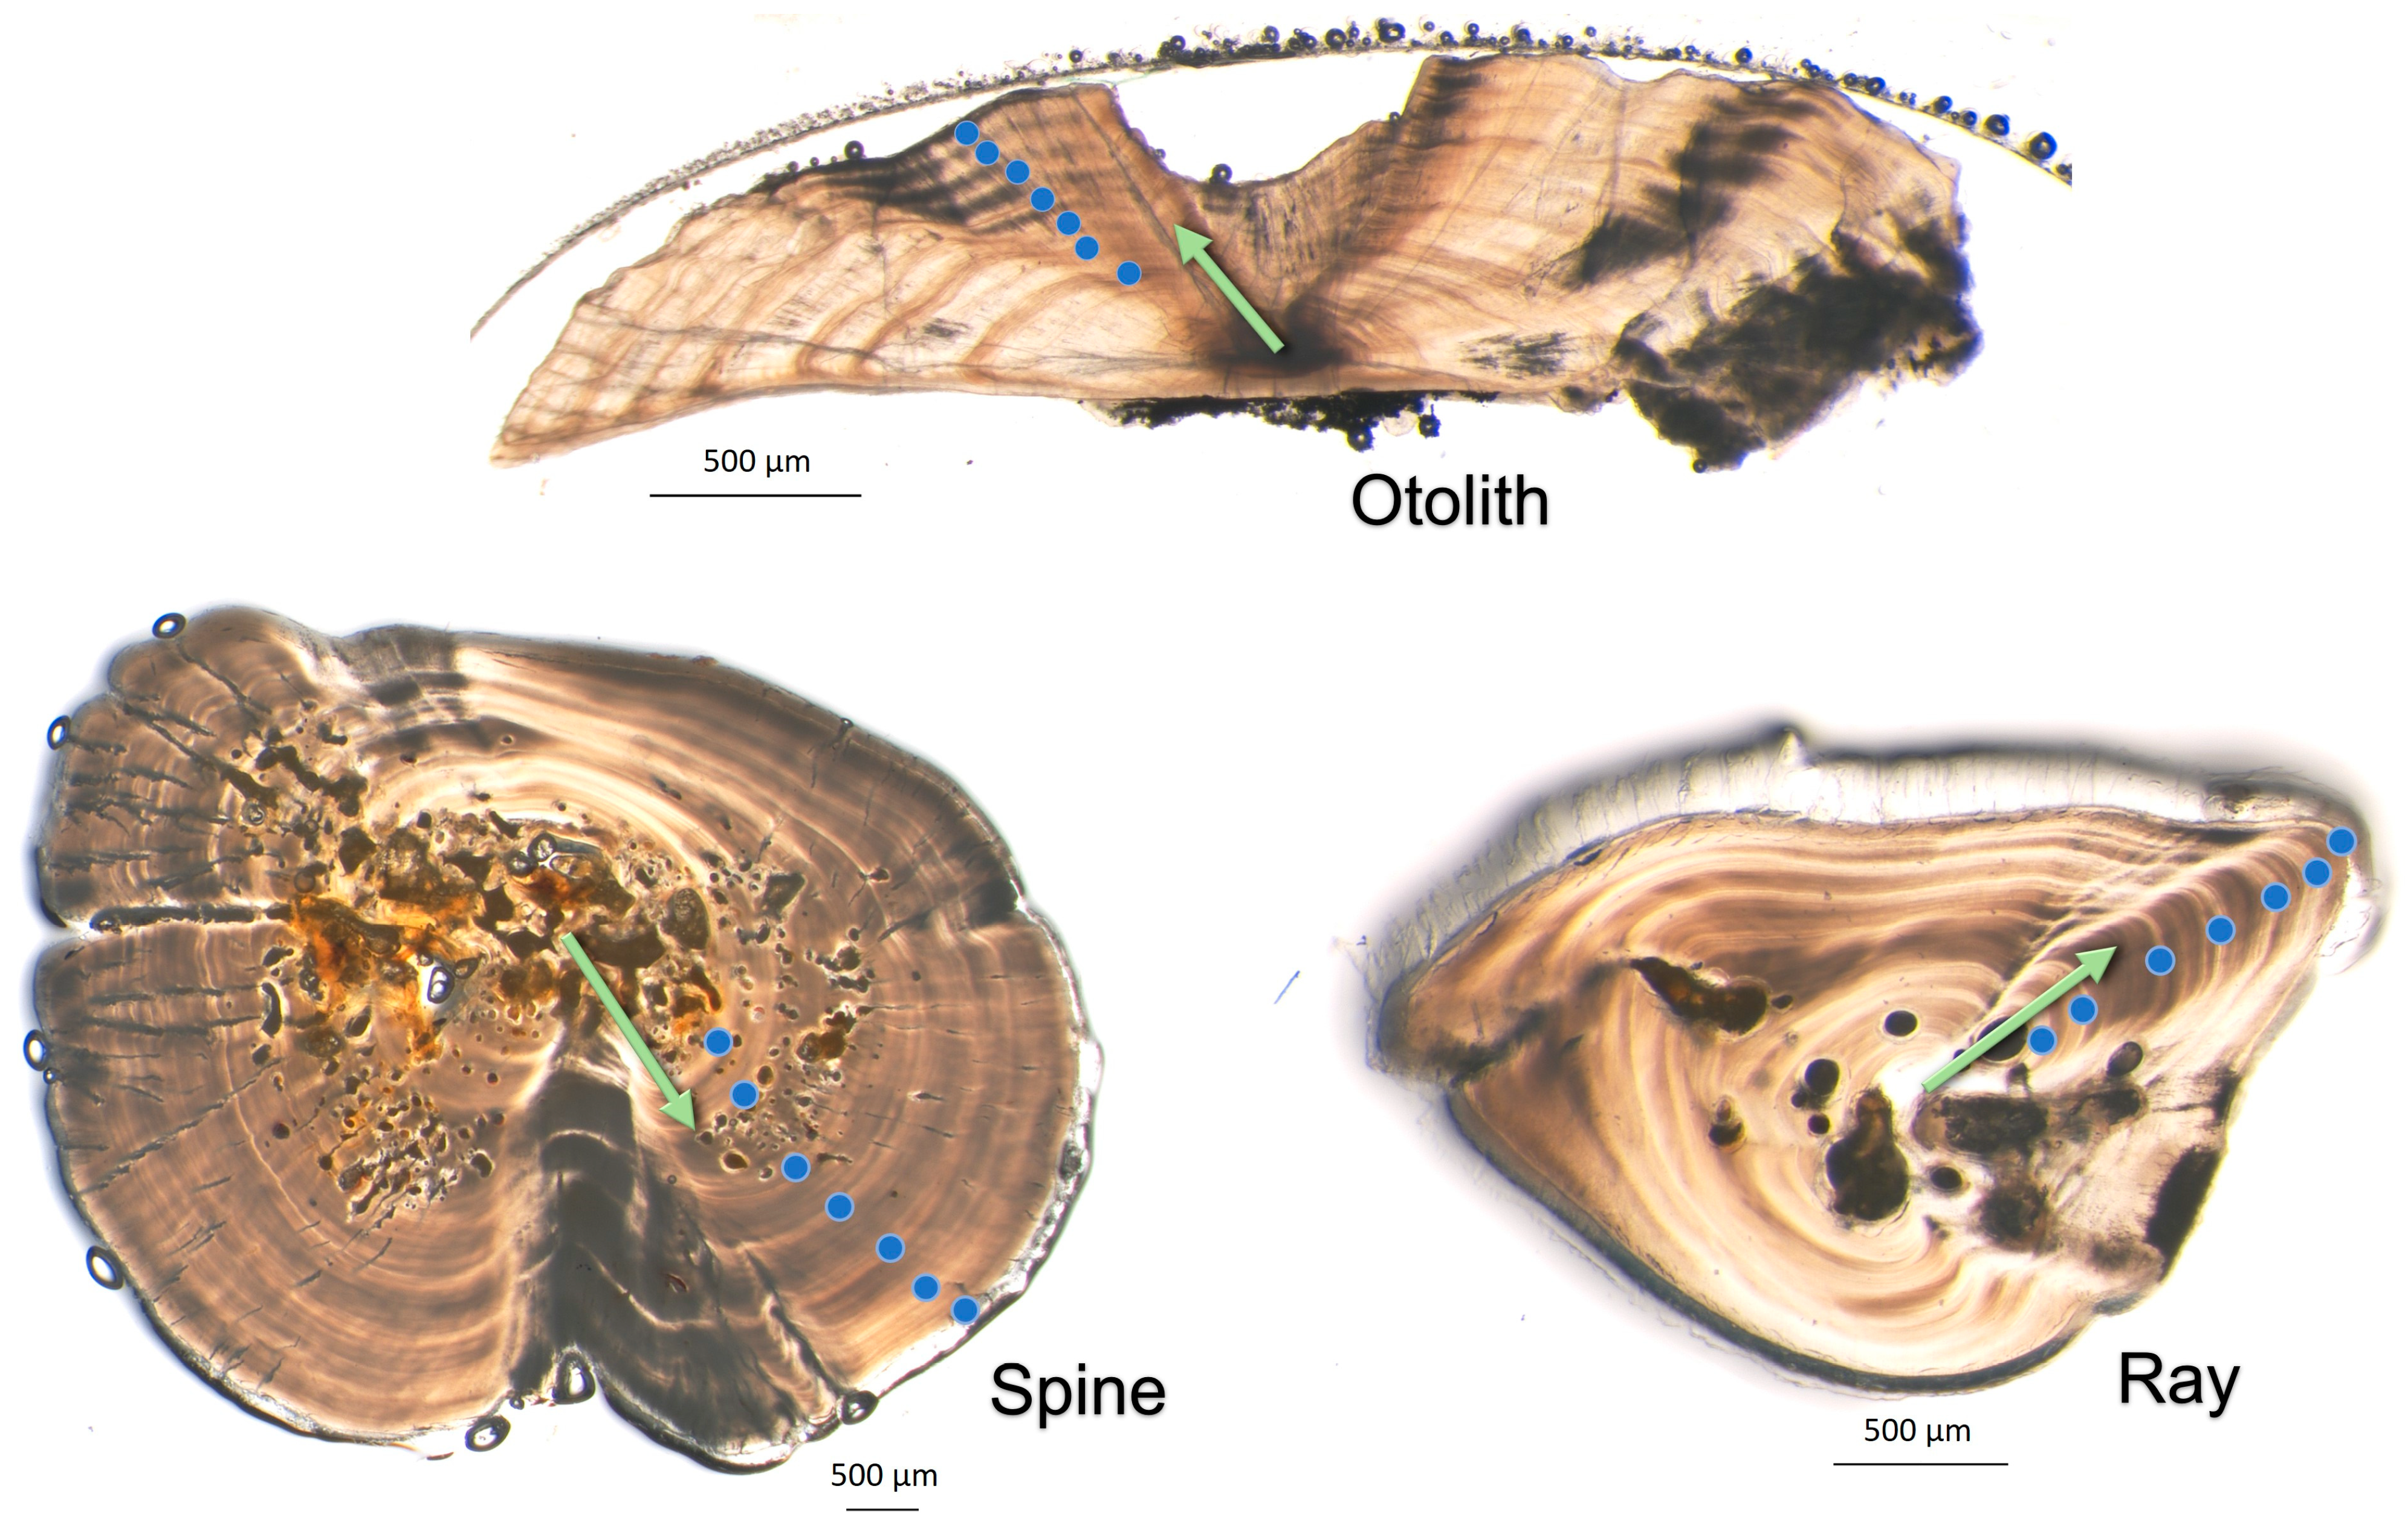
Margins of all structures were measured using a Jenoptik Arktur camera and Gryphax
® software (Jenoptik Optical Systems, Jupiter, FL, USA). These measurements were made along an axis adjacent to the inner groove of the section for rays and spines, and along the dorsal edge of the sulcal groove for otoliths (
Figure 4). For each ray and spine, the presence of any occlusion (an obstruction in the central part of the structure due to encroaching vascularization) or resorption (the degeneration of central structure material due to the growth of vascular tissue) was noted but grouped under the general category of occlusion for ageing and measuring [
31,
32]. Though different issues, occlusion and resorption have a similar effect of loss of annuli, and they were therefore classified into one general category. Occlusion was noted to be present if any vascularization interrupted or dissected any annuli, or if the structure exhibited resorption that intersected any annuli.
2.3. Analyses
Marginal increment analyses were conducted on both the qualitative and the quantitative margin data of all structures to determine the timing of annulus formation, indirectly validate annulus deposition, and assess any synchrony in annulus deposition among structures. First, the margin codes assigned during ageing were plotted across collection months to illustrate the trends and synchrony of deposition among structures. Second, a marginal increment ratio (MIR) analysis was done to determine the timing and variability of deposition [
26]. This was conducted by plotting the MIR (margin measurement divided by measurement of last fully formed annulus) by month for all structures, such that one minimum in the MIR during a 12-month period indirectly validated structure deposition as one annulus per year [
33].
Accuracy of the ray and spine ageing was determined by comparing age class estimates from these structures with otoliths. Otolith ages were considered the true (reference) ages of the fish because otolith ageing has been validated using oxytetracycline (OTC) and marginal-increment analysis [
1]. To assess structure accuracy, modified Bland–Altman plots were generated using the FSA (Fisheries Stock Assessment) package in R (The R Foundation, Vienna, Austria) [
34]. A local regression nonparametric smoother line with 95% confidence limits was added to the plot via a generalized additive model (GAM) designed to estimate a smoothed, and potentially nonlinear, relationship between the differences of ages across the entire range of otolith ages and deriving the 95% confidence interval of those predictions [
35].
Average percent error (APE) and percent agreement (PA) were calculated to estimate precision between readers and structures [
33]. An Evans–Hoenig test of symmetry was also conducted to identify any systematic ageing bias; this test used a chi-square statistic to demonstrate whether the distribution of disagreeing ages was asymmetrical around those that agree [
36,
37]. For the Evans–Hoenig test of symmetry, significance was indicated by a
p-value ≤ 0.05.
Accuracy and precision of samples removed at the nonlethal level (i.e., skin-cut analysis) were assessed using a paired t-test comparing base-cut sections and skin-cut subsamples from the same fish. Any significant difference between the paired ages would indicate a systematic ageing difference due to the structure removal methodology. A modified Bland–Altman plot was also constructed between the two structure removal methodologies to visualize age-related differences; for this plot, the x-axis described the mean of the two spine or ray ages, given that no reference age was inferred [
37,
38].
Finally, an analysis of a ray- or spine-specific correction factor was used to determine the range of ages for which the external structures can be reliably considered accurate. While the overall accuracy of the ageing structures was assessed as above, the accuracy was expected to be age-biased due to occlusion of the structures at older age classes. A correction factor was applied to offset the underageing known to occur in older age classes and align the external structure ages with otolith ages. The first part of this analysis identified the age classes at which the agreement of external structures with otoliths deviated from the 1:1 agreement line in the original Bland–Altman plots. Then a correction factor was applied to all age classes older than the point of deviation. Corrected ages were then tested using the metrics described above to assess whether the correction had increased the accuracy of ageing.
3. Results
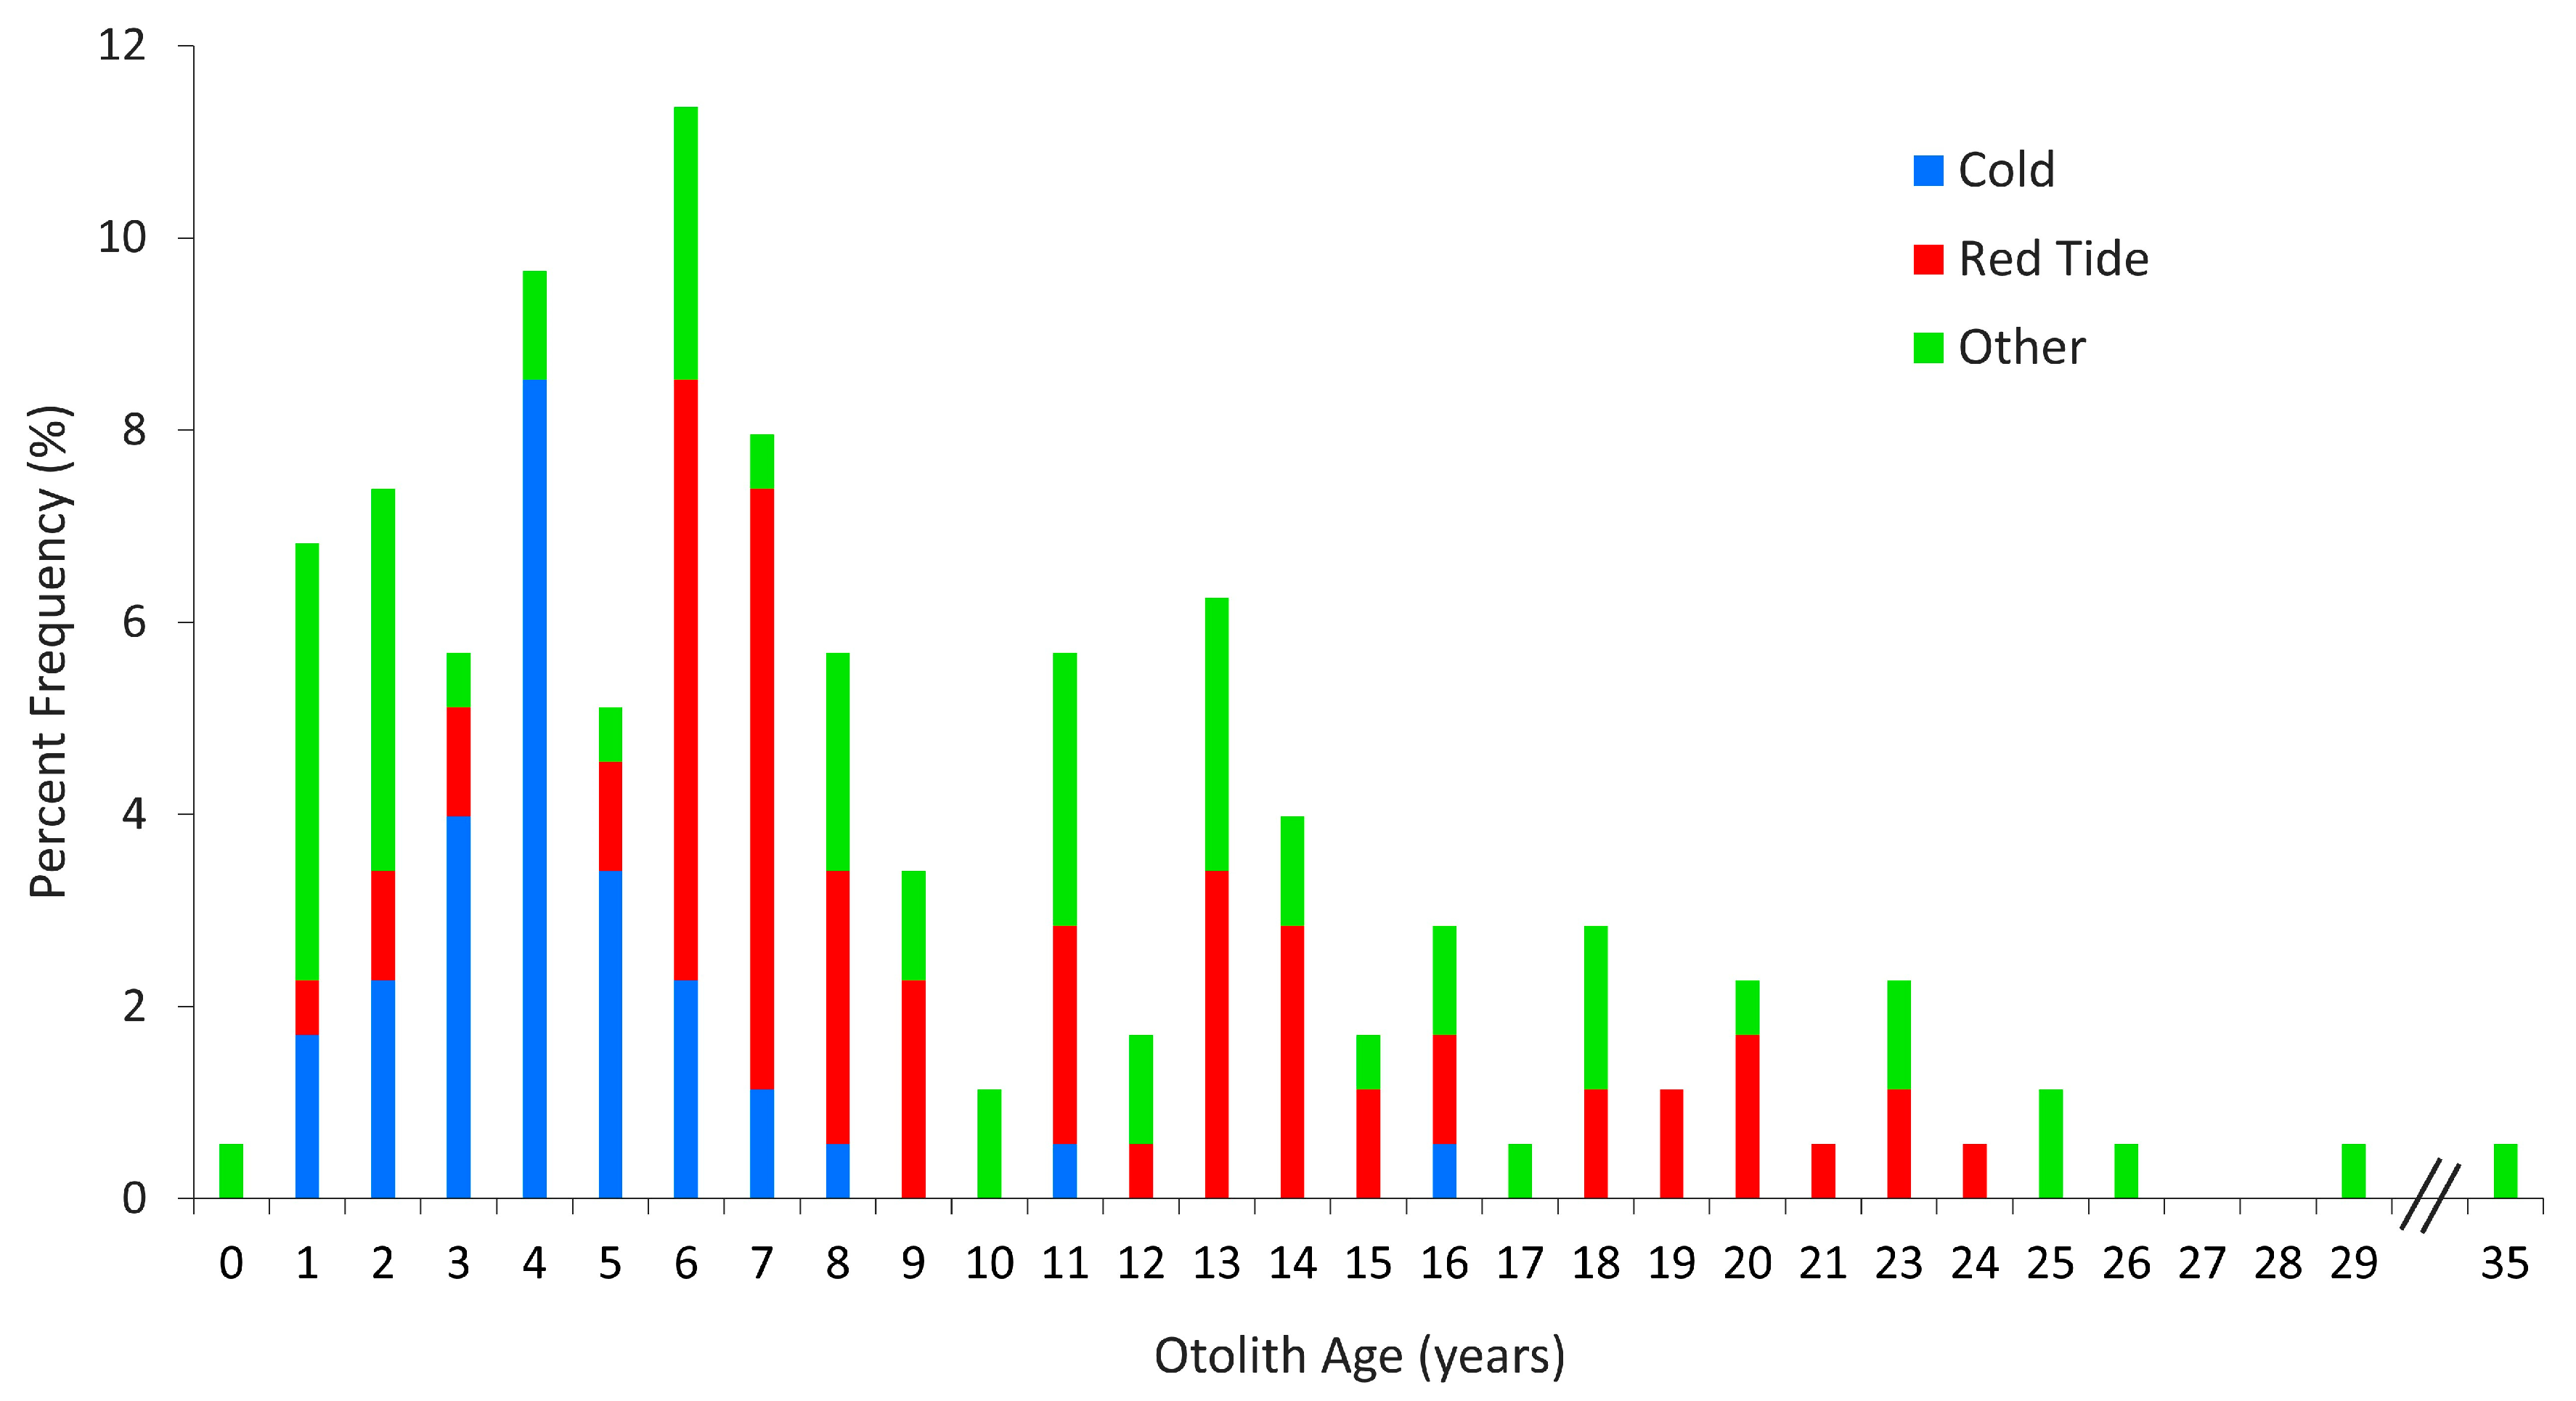
Opportunistic sampling of Goliath Grouper from 2006–2018 resulted in the collection of 176 otoliths for life history analyses from fish aged 0–35 years, 16% of which were older than age 15 (
Figure 1). External structures were not collected during the earliest years of this program but were added to the response protocol in 2008. The sample sizes for each of the various external structures analyzed here varied from 23 skin-cut rays to 122 spines (
Table 2). The number of samples for the analysis of skin-cut sections was limited because the fish were badly decomposed, but the size and age range of available skin-cut samples were representative of the overall sample set (
Table 2).
Within-reader precision for all structures was highly precise (i.e., the APE was less than 5% [
33]). Accordingly, APE values were low and similar for the structures individually: otoliths, 2.1%; rays, 2.5%; and spines 2.2%. The between-reader precision for the 20% subsample was 2.9% APE, and the APE of ray ages and otolith ages from the subsample was 4.9% for both readers. Percent agreement for base-cut rays with otoliths was 37.6%, with 68.3% agreement ± 1 year (
Table 3). Percent agreement for base-cut spines with otoliths was slightly better with 39.8% and 79.6% ± 1 year (
Table 3). Ageing precision between rays and otoliths, and between spines and otoliths, was within acceptable precision limits, at APEs of 6.0% and 5.0%, respectively; spine ageing would be considered highly precise (
Table 3). A typical paired otolith, ray and spine from a single individual fish is shown in
Figure 4.
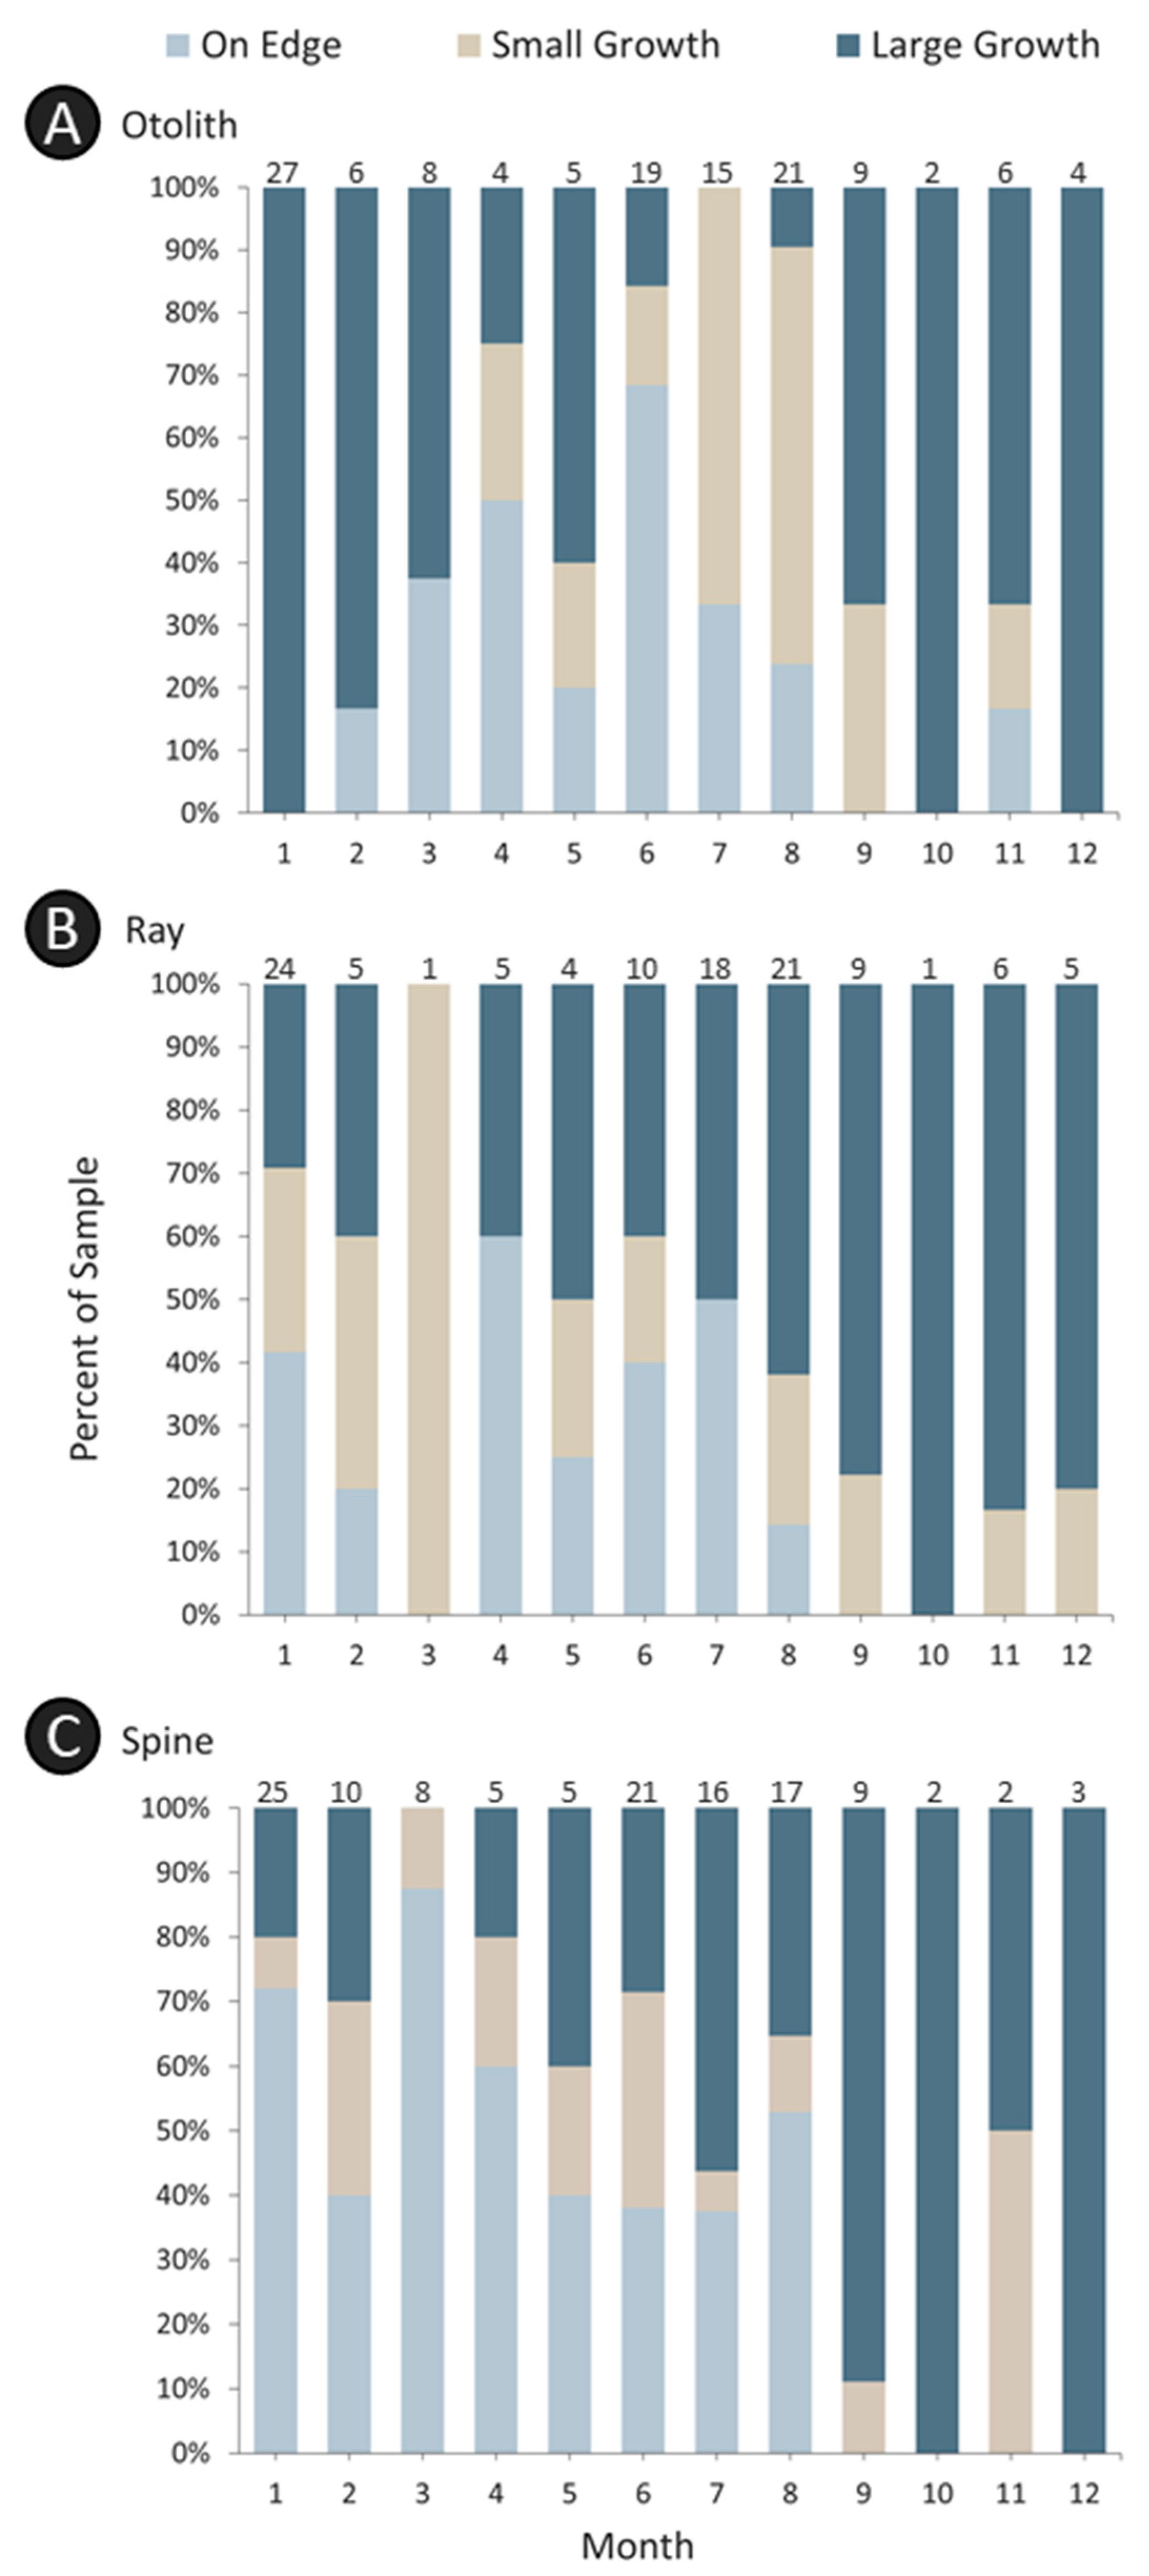
Annulus deposition in all structures demonstrated a seasonal pattern, but the timing varied by structure and assessment (
Figure 5 and
Figure 6). The qualitative margin analysis demonstrated that opaque zones were deposited in otoliths during February–August and that the number of otoliths having newly formed annuli (i.e., a small translucent zone on the edge) increased primarily during April–September (
Figure 5A). Translucent zones were deposited for both rays and spines during January–August (
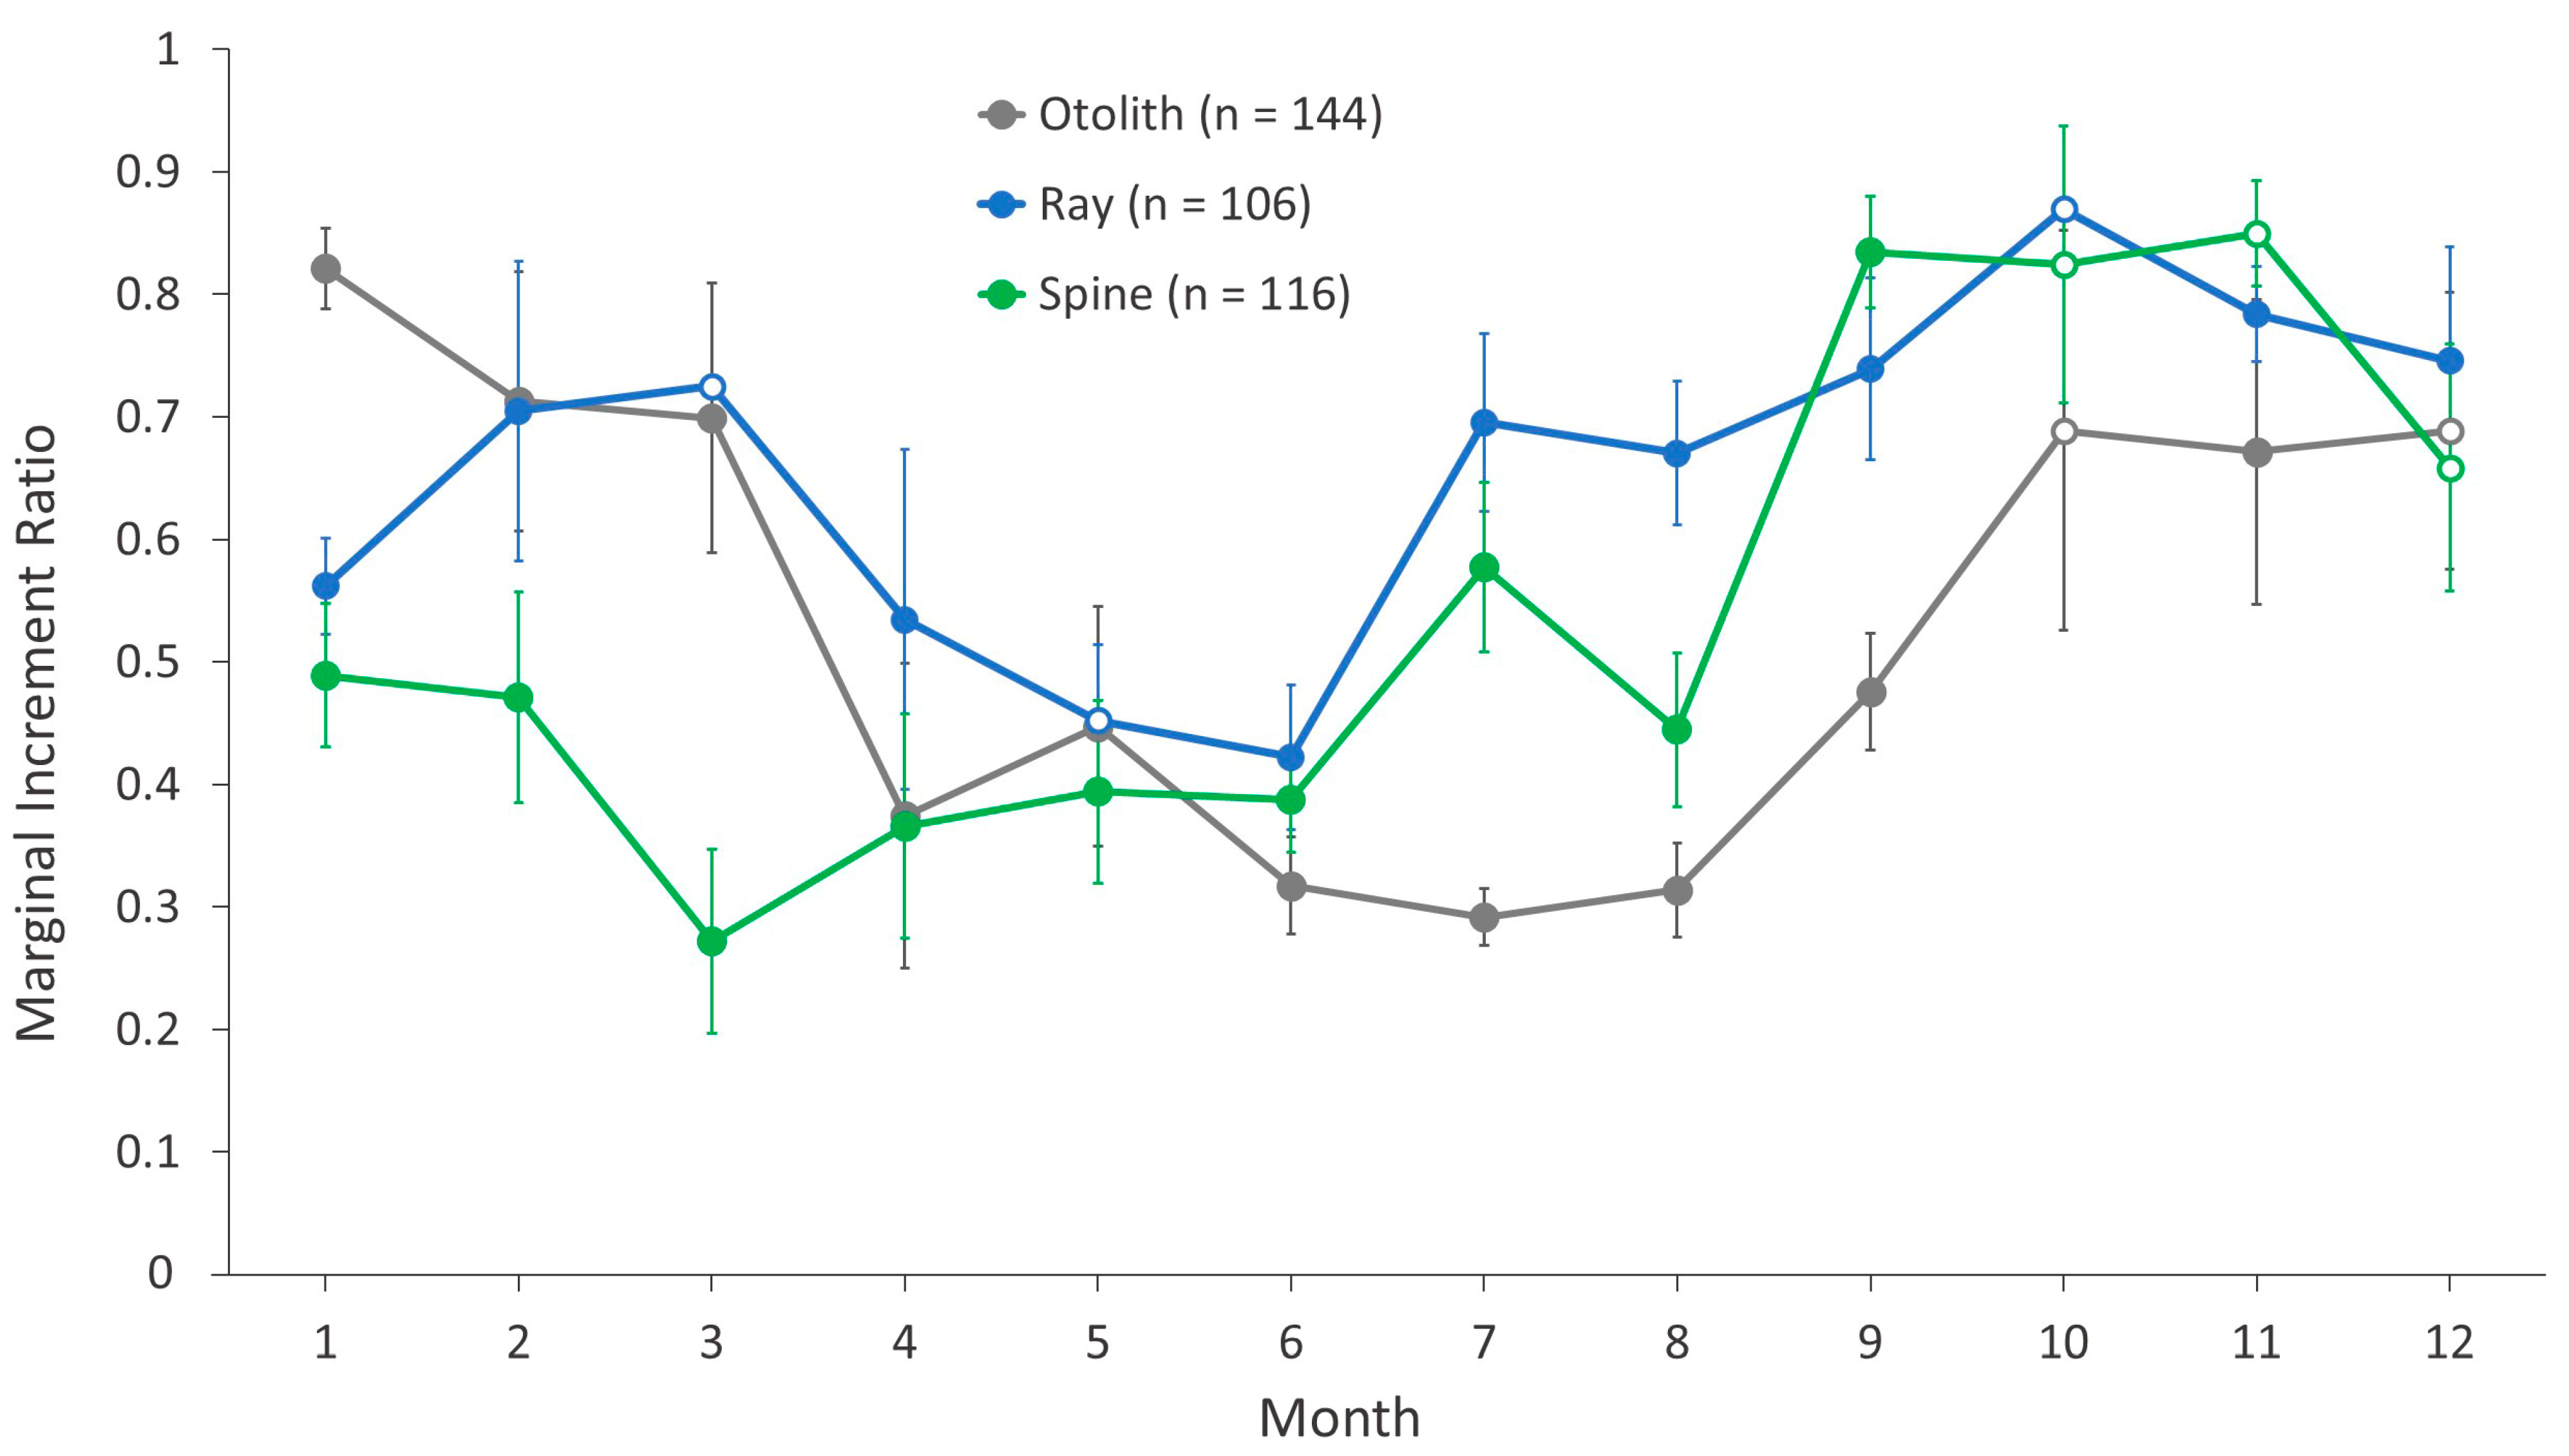
Figure 5B,C), with varying levels of newly formed annuli being detected throughout the year. For rays and spines, July and August were transitional: most samples contained either a large opaque zone or a new translucent zone at the edge. The marginal increment ratio analysis (
Figure 6) demonstrated a similar pattern for otoliths, with opaque zone deposition occurring from April–September. For rays and spines, the general patterns were also similar. Translucent zones in rays were deposited during April–June; those in spines were deposited during March–June (
Figure 6). Overall, the annulus deposition period for rays and spines appeared to initiate earlier than that of otoliths, but the external structures exhibited general agreement with otolith deposition. Given the similar timing of annulus deposition, the same age class assignment protocol was implemented for all structures.
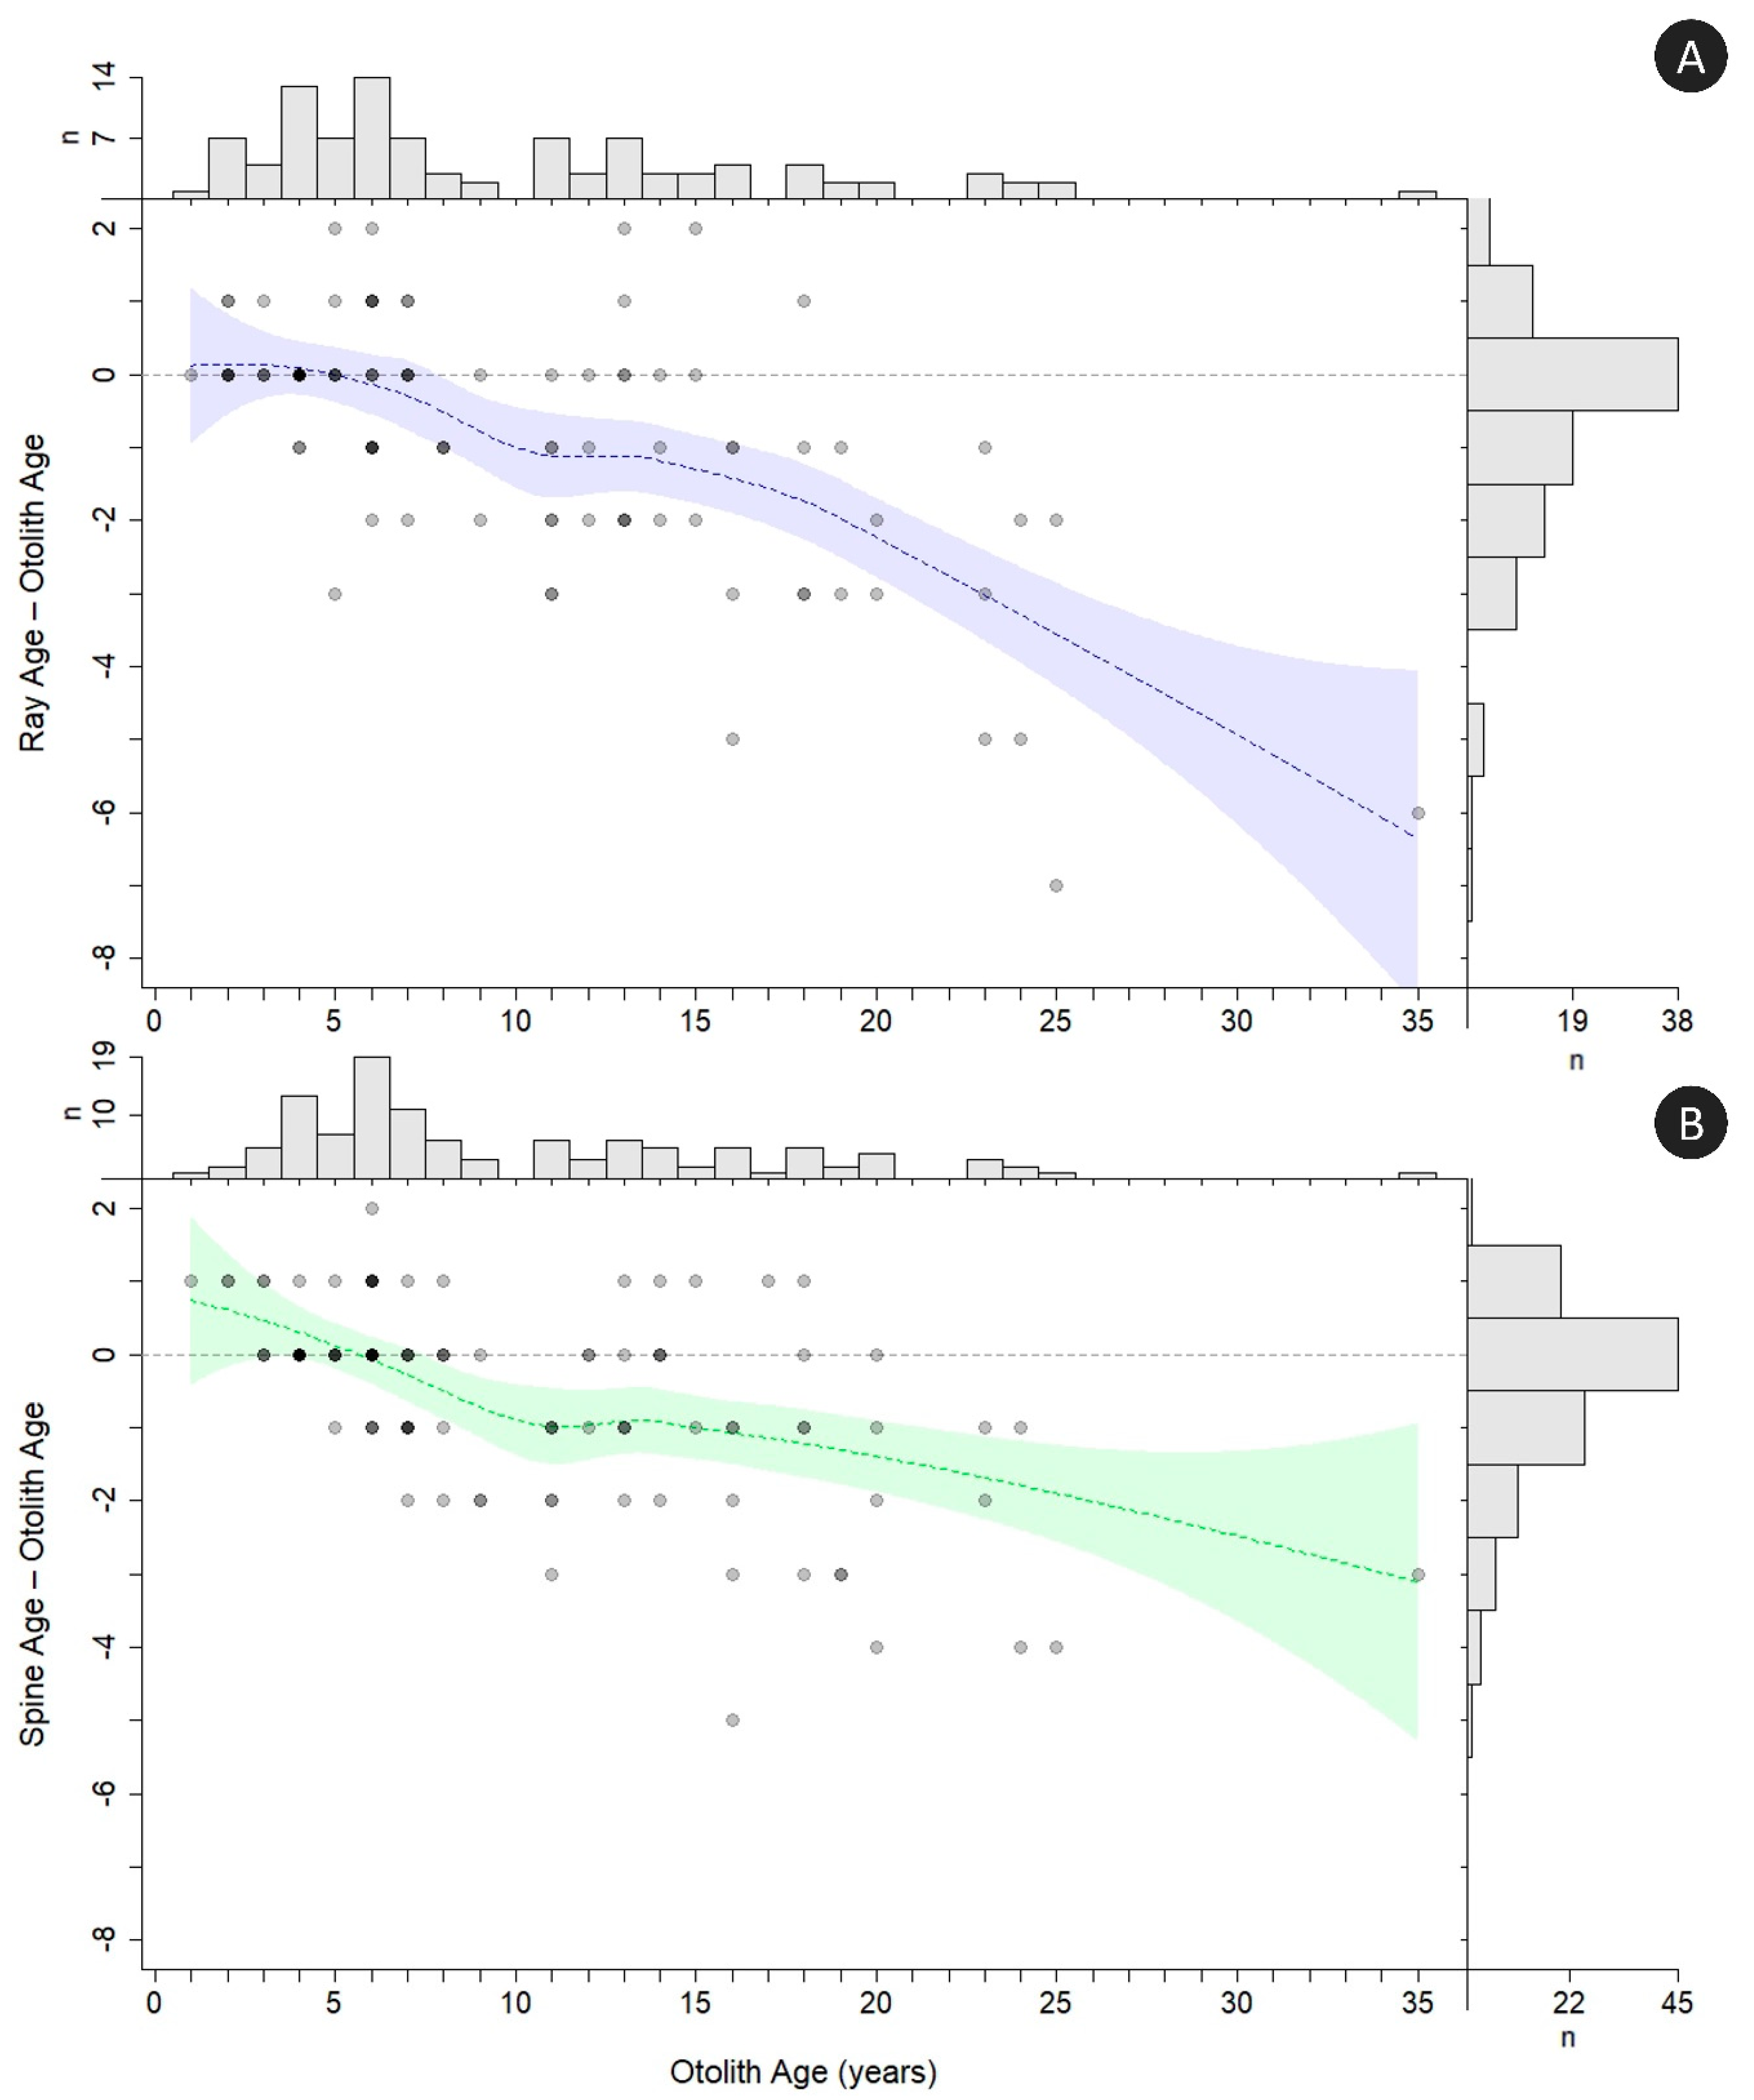
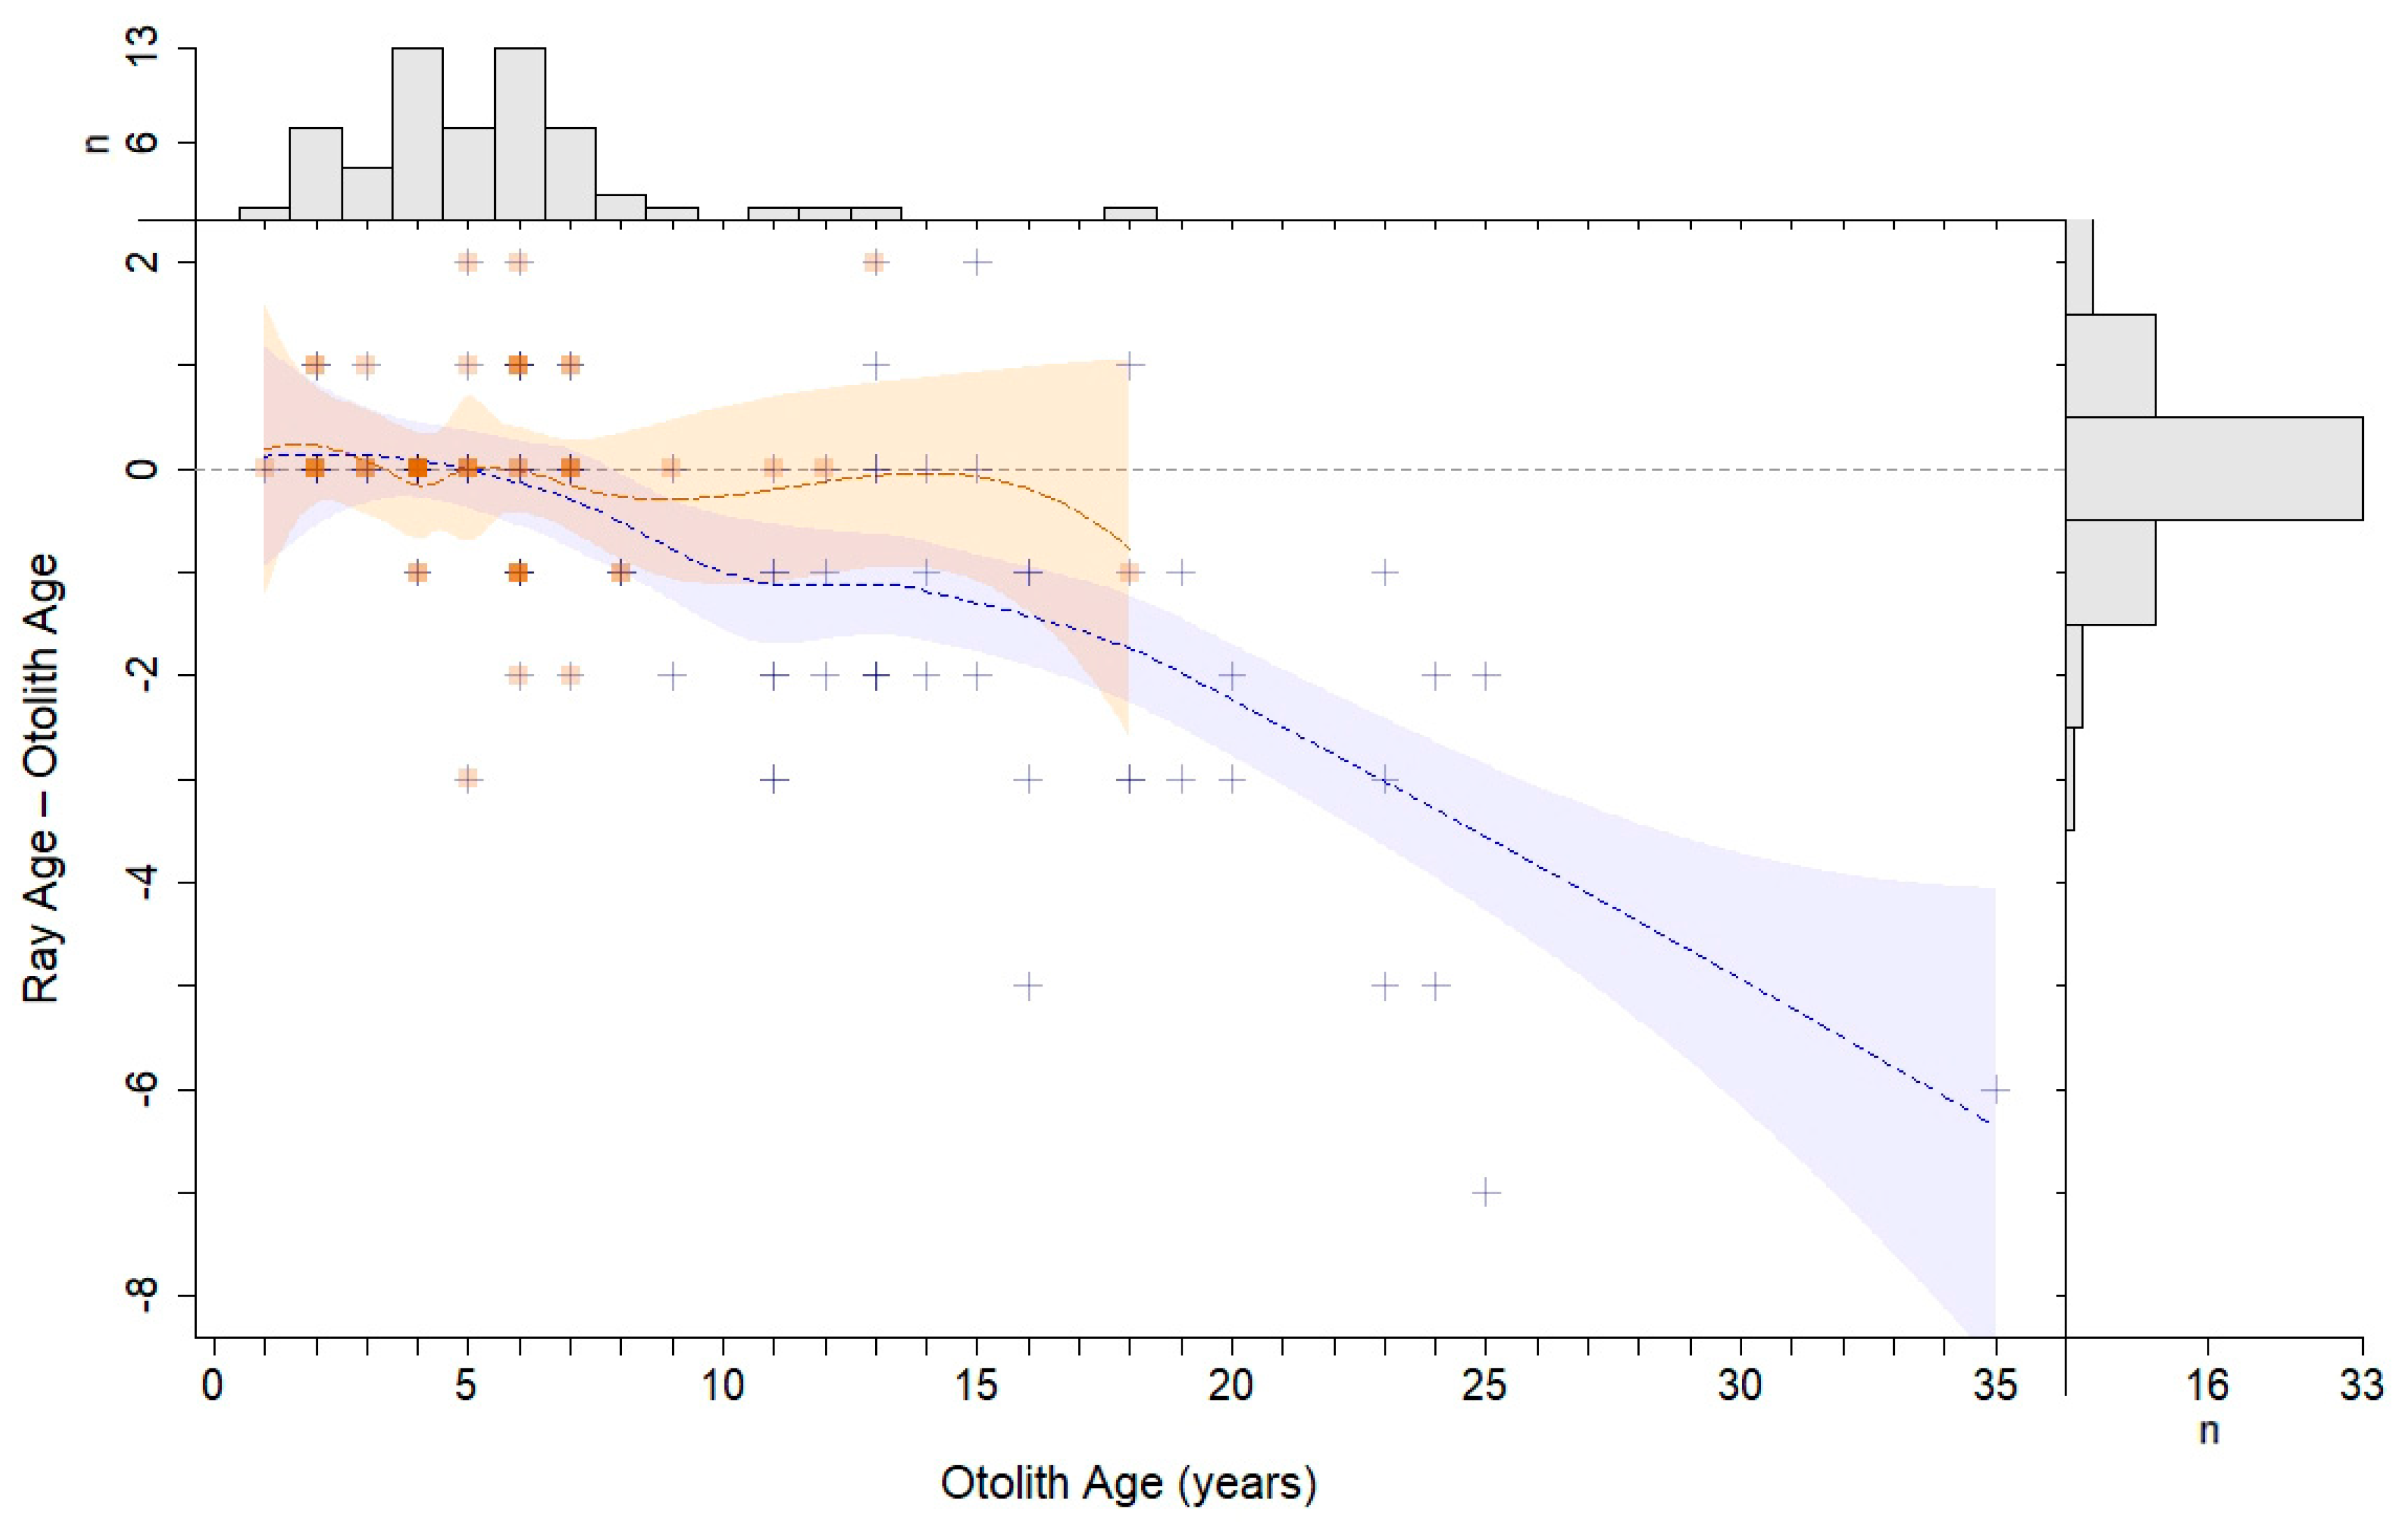
The modified Bland–Altman plots for rays and spines (
Figure 7) indicated underageing of the oldest age classes for both external structures compared to otoliths. Underageing of rays started after age 5, and rays were consistently underaged by at least 1 year starting at age 8. Ray ageing exhibited an almost linear decline in accuracy with increasing age, starting around age 5 (
Figure 7). Spine ageing diverged off the agreement line after age 6, but, in contrast with the rays, was consistently underaged by 1 year through all but the oldest age classes. Fish from the youngest age classes tended toward overageing with spines but were accurately aged using rays.
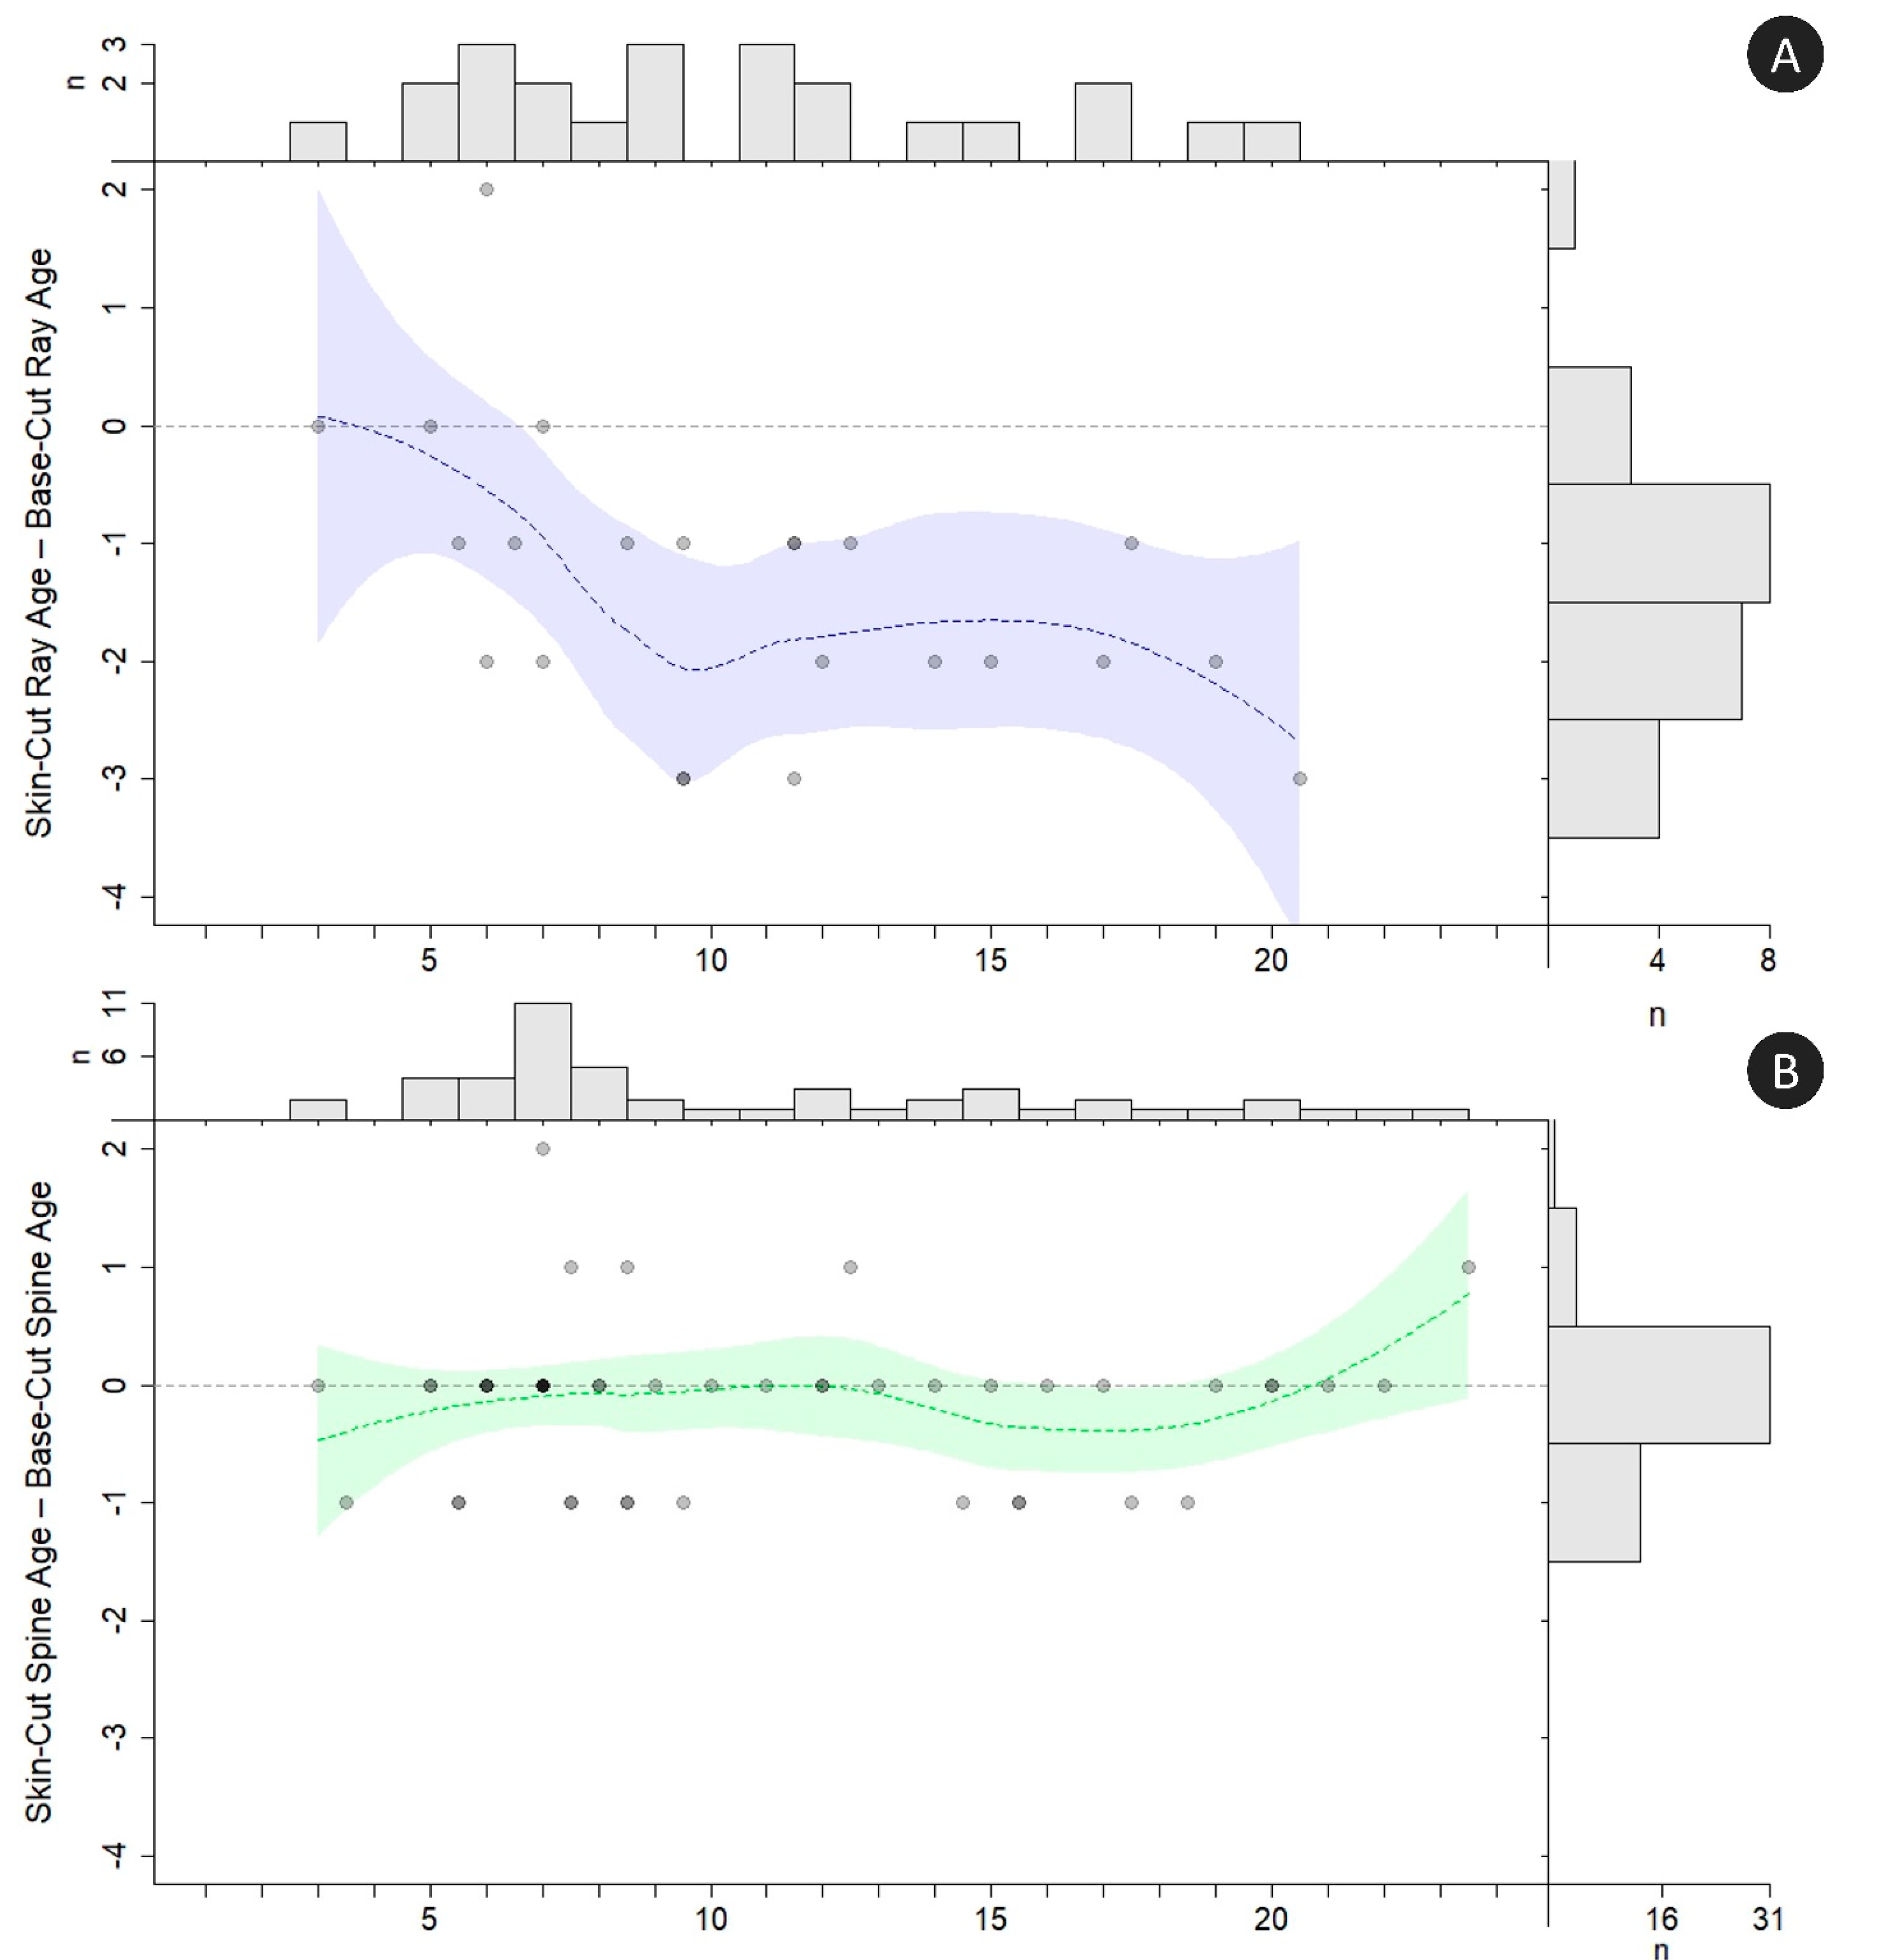
Skin-cut ages and base-cut ages from rays differed significantly (paired
t-test:
t = 5.58,
df = 22,
p < 0.0001). Skin-cut ray samples diverged from the base age agreement line around age 4 and were consistently aged 1 to 2 years younger than the base ages starting around age 7 (
Figure 8A). Ray base-cut and skin-cut samples had a percent agreement of 13%, with 48% agreement ± 1 year. In contrast, skin-cut spine ages were not significantly different from base-cut ages (paired
t-test:
t = 1.55,
df = 48,
p = 0.13). The spine skin-cut samples agreed consistently with base-cut ages through age 11, after which the agreement became less consistent with higher variability amongst the oldest age classes (
Figure 8B). Spine base-cut and skin-cut samples had a percent agreement of 63%, with 98% agreement ± 1 year. Interestingly, in 45% of the spines, the measurement from the tip of the spine to the skin-cut processing mark corresponded to the optimum processing mark for spines (i.e., the preferred basal region for processing the spine coincided with the skin-cut measurement mark). This phenomenon was not the case for rays, as no skin-cut sample demarcation coincided with the optimum base processing zone.
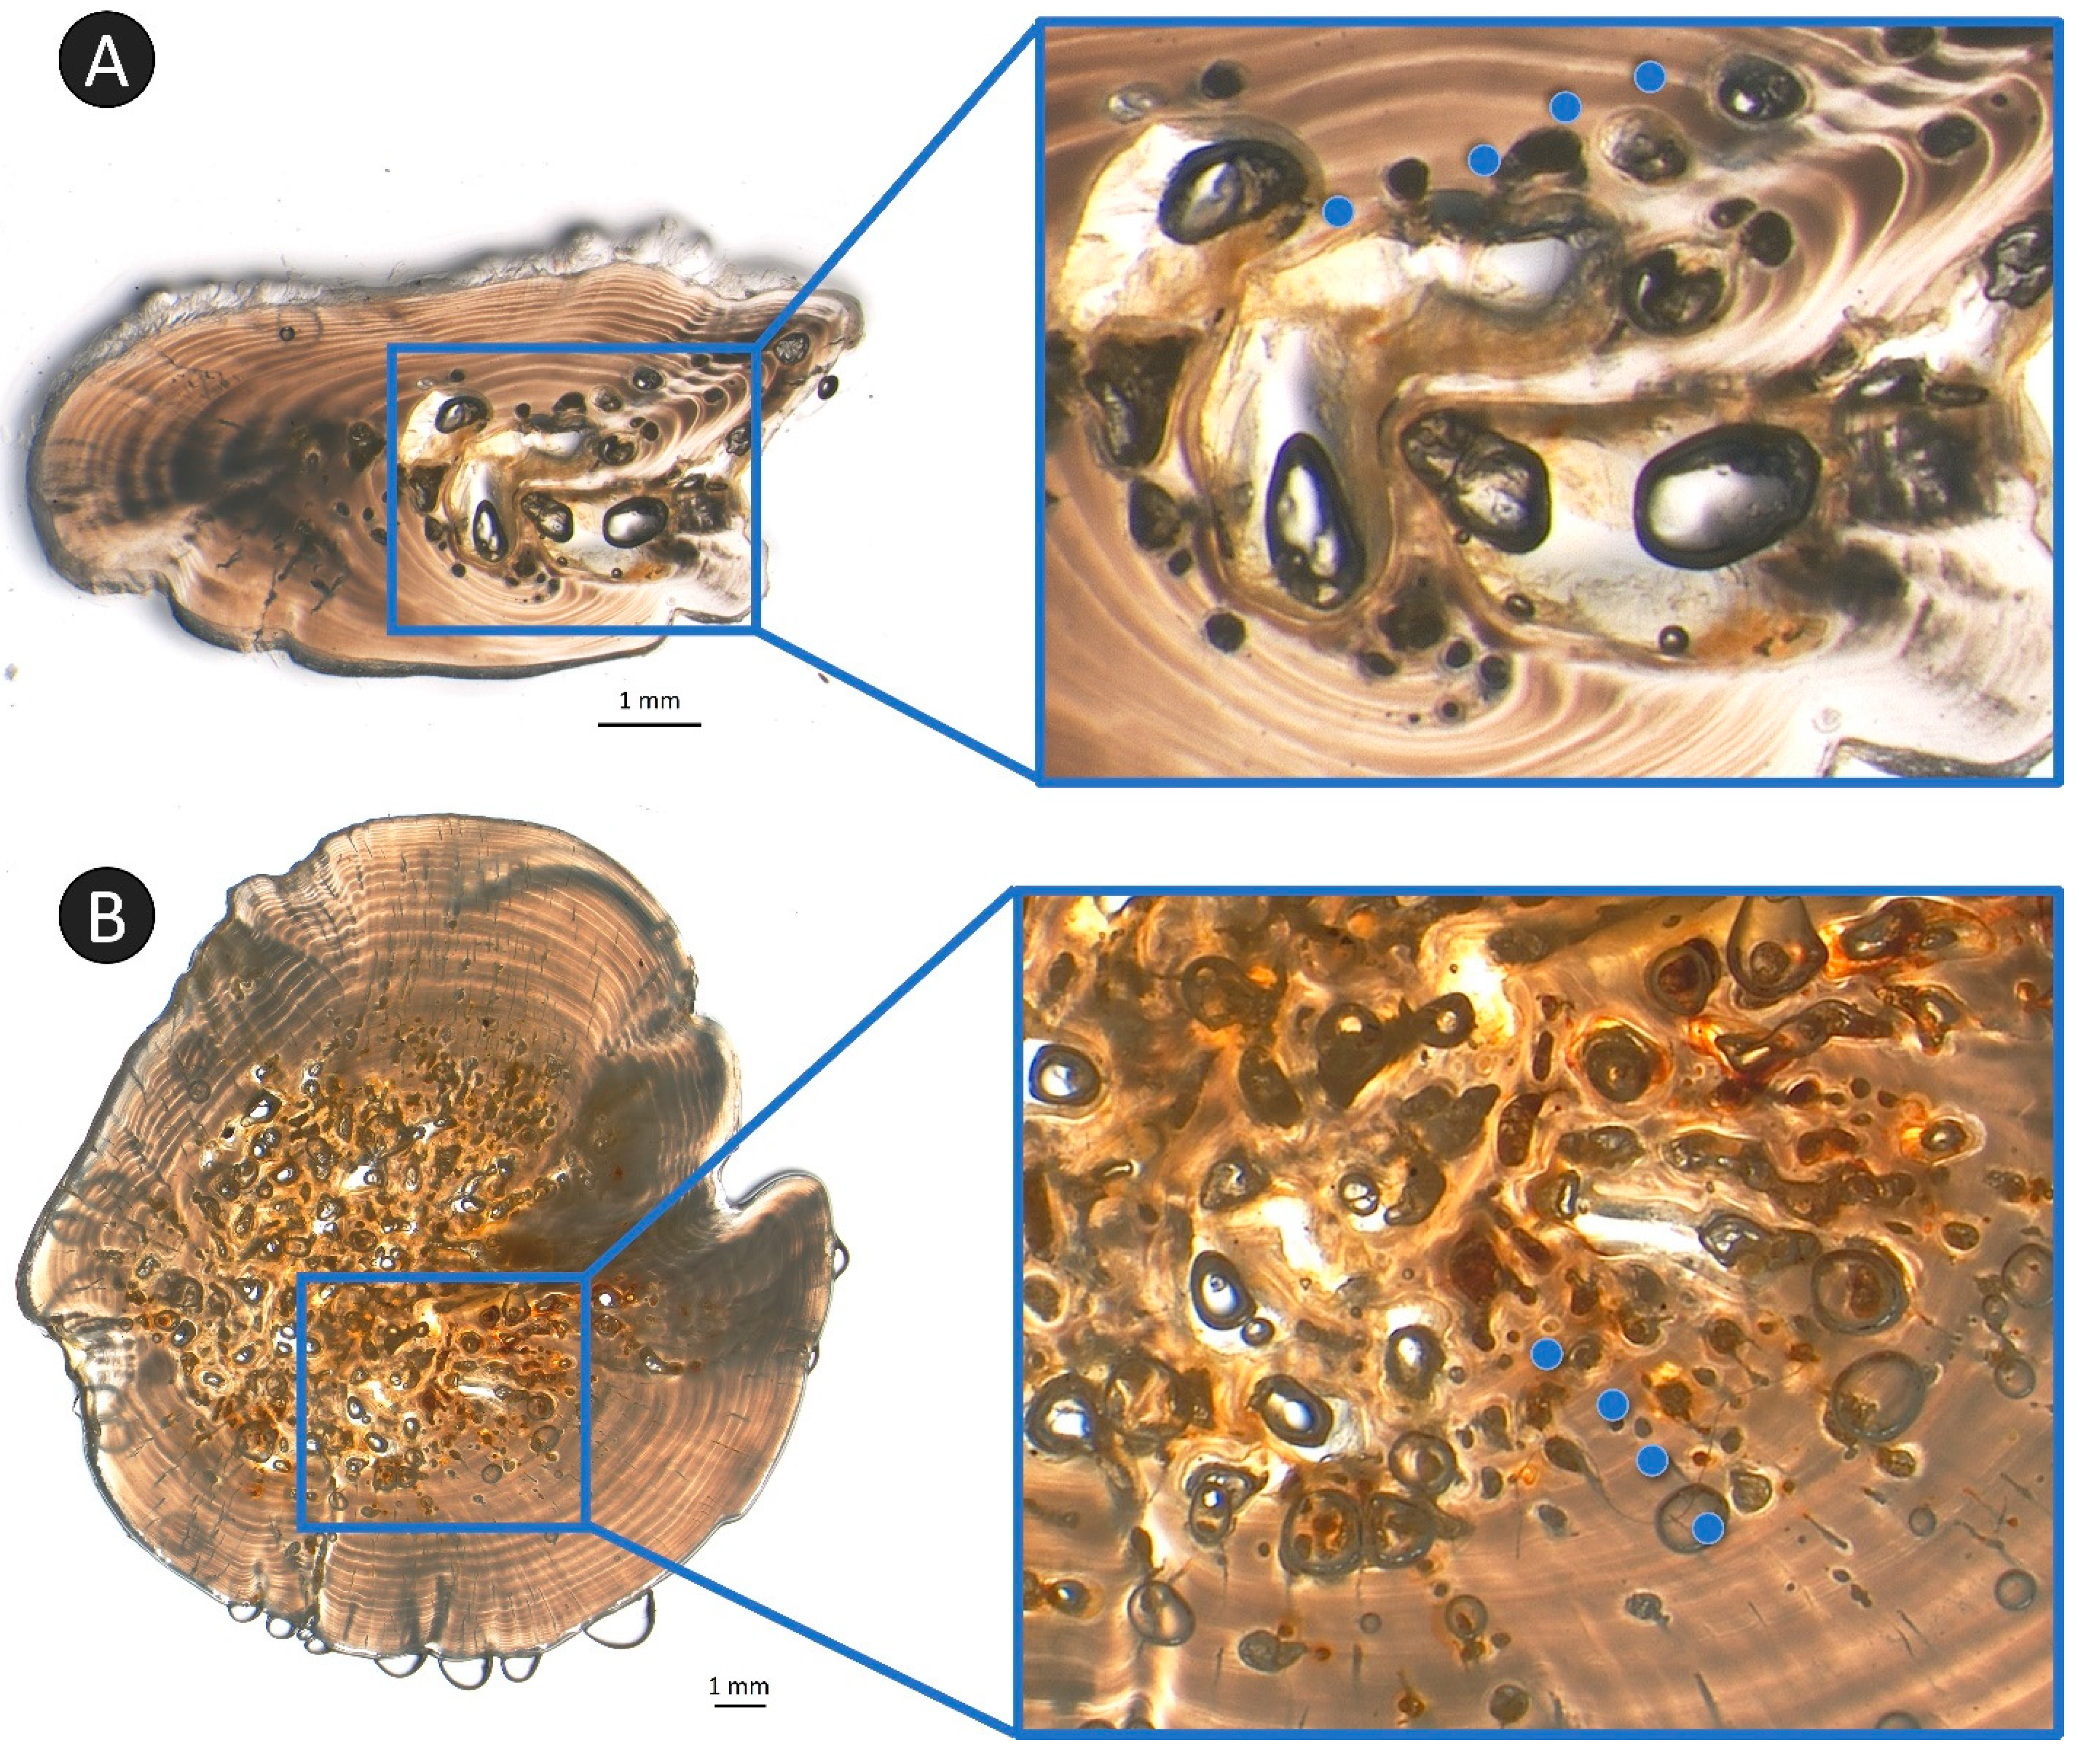
Occlusion was noted on both ray and spine sections but was more widespread in spines (
Figure 9). Only 40% of ray samples exhibited occlusion through the ageing plane. Fish with occluded rays ranged in otolith age from 8–35 years; occlusion was present in all rays sampled from fish older than age 18. Conversely, 95% of all spine samples exhibited occlusion through the ageing plane; only seven spine samples did not have any occlusion, all of which were sampled from young fish (ages 1–3, plus one 8-year-old). Because occlusion was so pervasive among the spine samples, these were not analyzed specifically for a correction in response to the removal of occluded samples from analyses.
All ray samples exhibiting occlusion through the ageing plane were removed from analysis, and a modified Bland–Altman plot was created to evaluate the effect of the occluded samples compared to the original age bias plot (
Figure 10). The fish not exhibiting occlusion ranged in otolith age from 1–18 years. As expected, the oldest age classes were removed due to occlusion, and when occluded fish were eliminated from analyses, underageing was virtually eliminated. It is worth noting that the most egregious outliers of the original age bias plot were almost exclusively occluded rays (shown in blue + in
Figure 10). It is possible that the underageing of these older rays was compounded by alternative ageing errors, but that those errors were masked by the primary issue of occlusion.
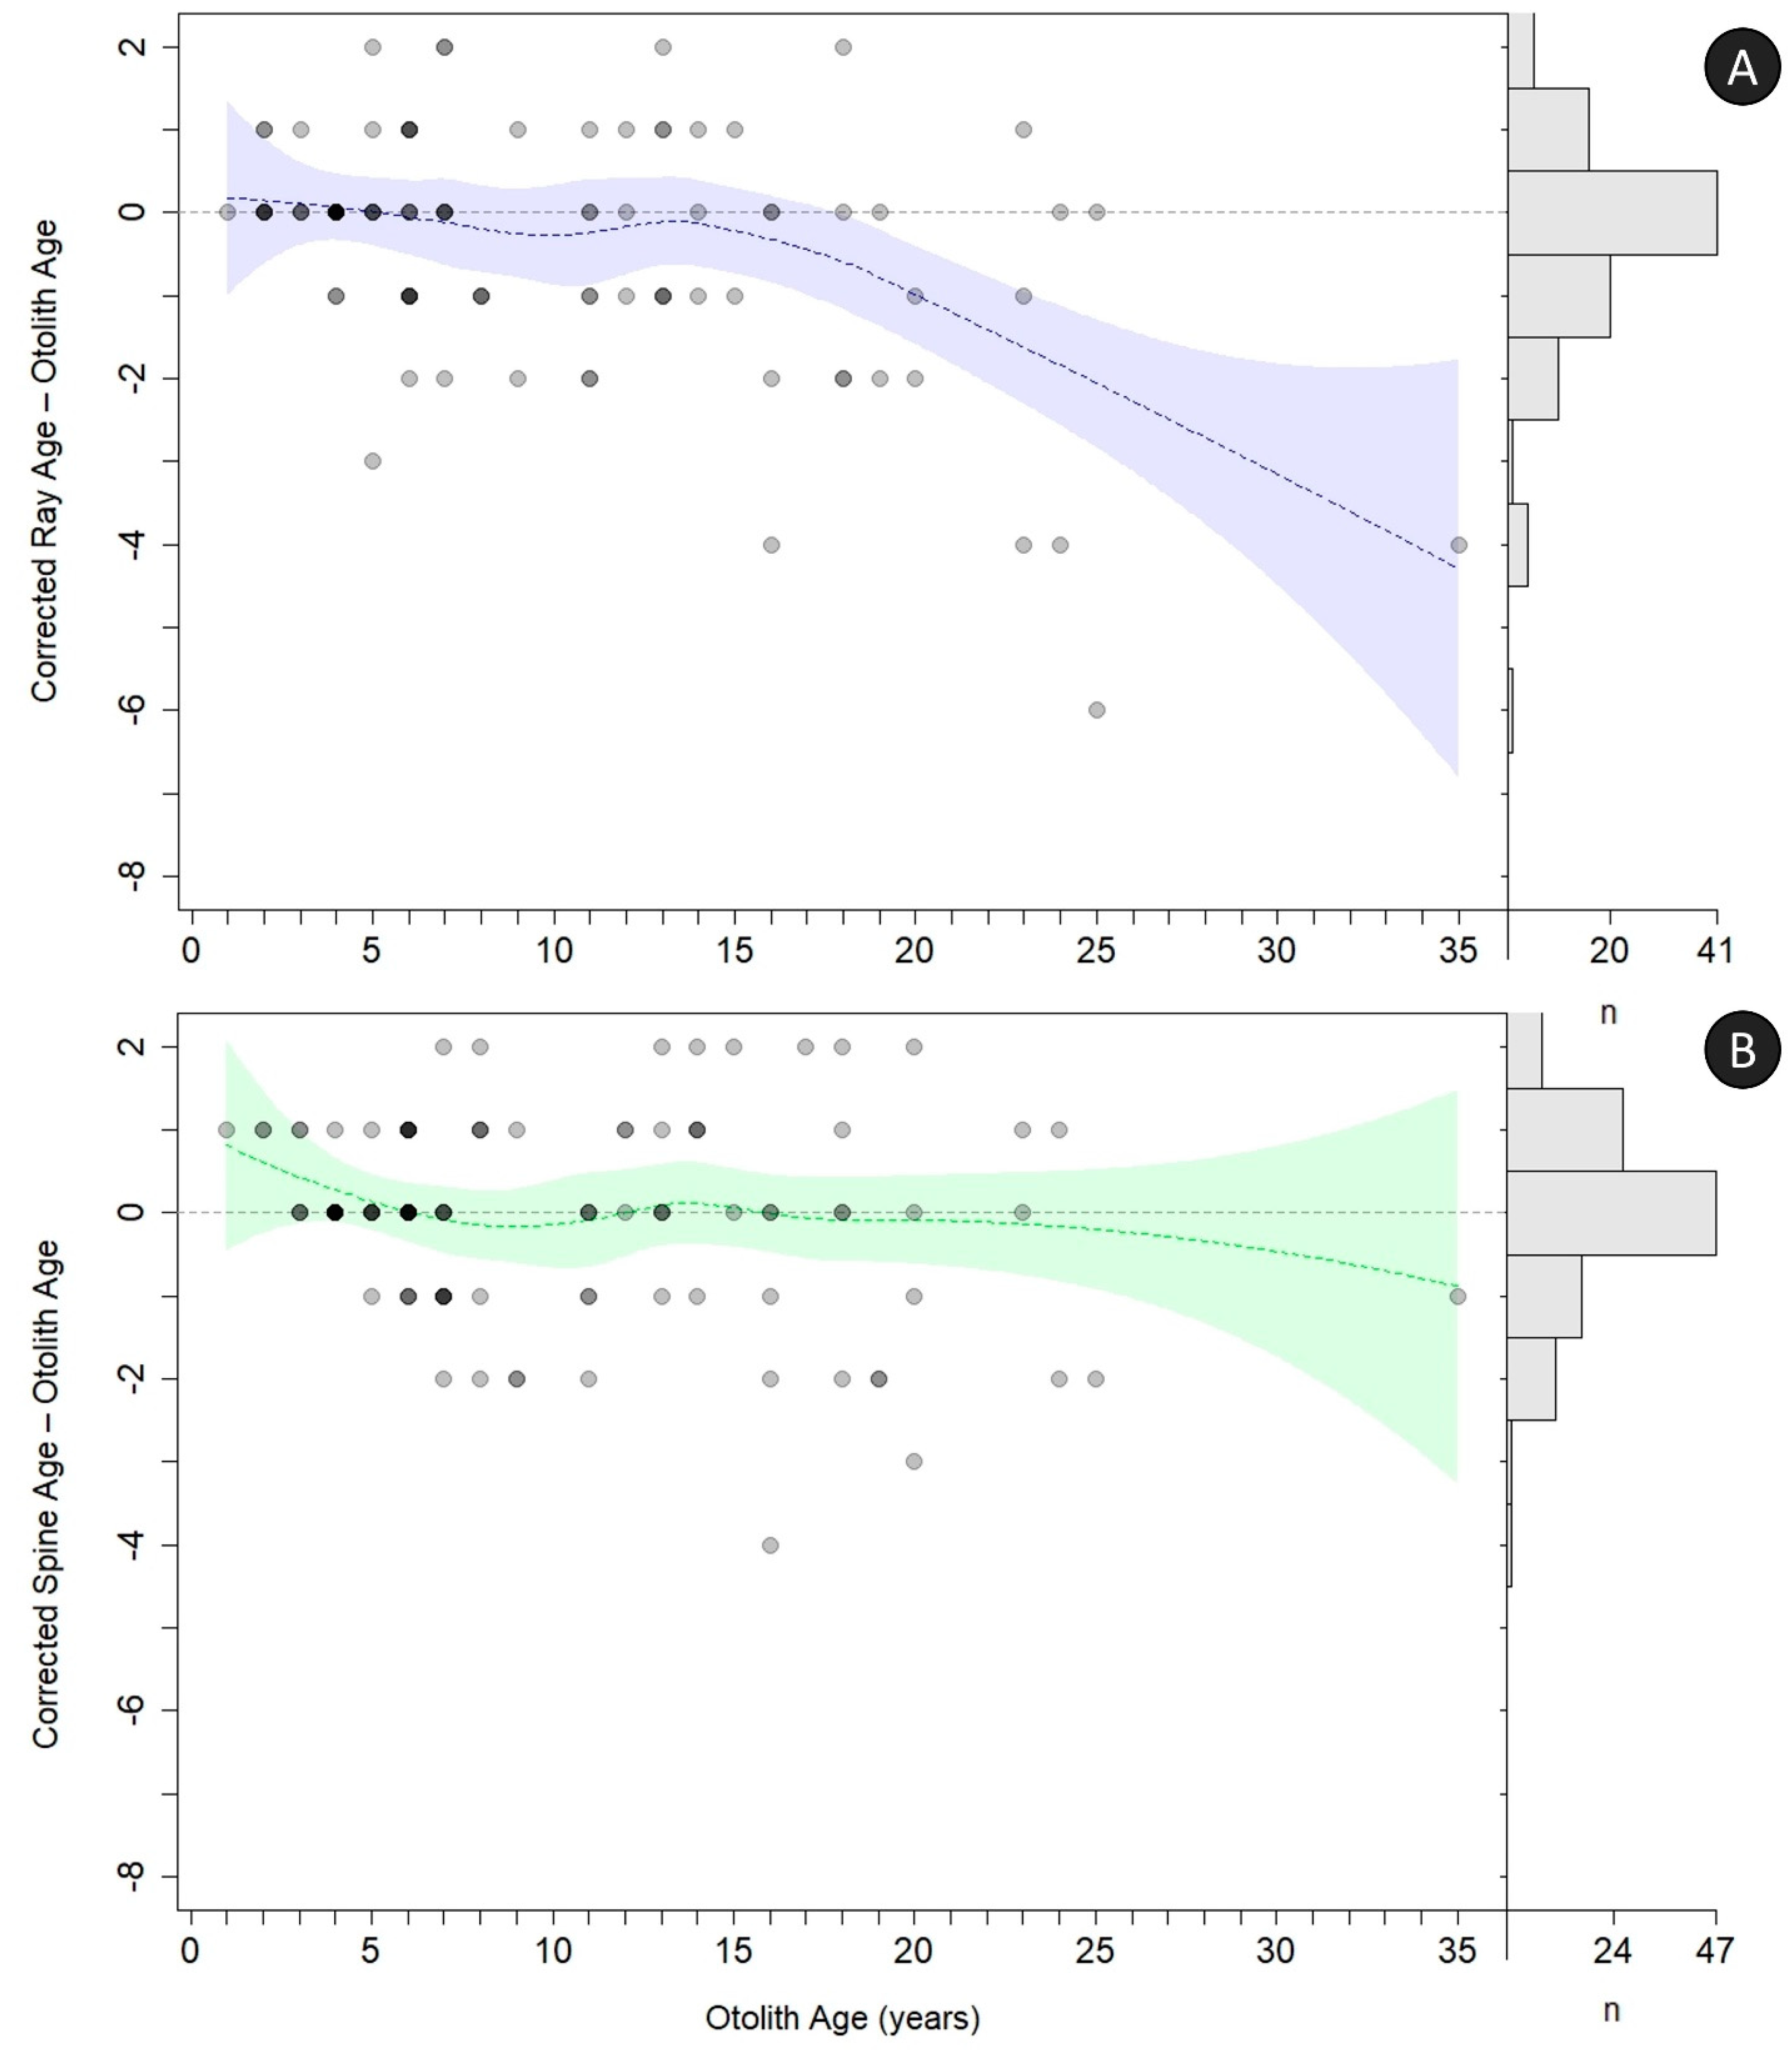
Correction factors were developed for offsetting the loss of the earliest annuli for both rays and spines, and then age bias plots (
Figure 11) and precision metrics (
Table 3) were recalculated. Underageing of rays was corrected in two different ways. First, all occluded samples were removed from the analysis. By removing occluded rays, most underageing of the rays was corrected and no further correction was needed. However, because removing the occluded rays also removed the oldest age classes, it may not always be prudent to move forward with this correction alone, so a correction factor was applied to all ray ages. This correction factor, applied to all ray samples regardless of occlusion, required adding 1 year to the age of all fish 8–14, and adding 2 years to every fish aged 15 and older; the spine correction factor required adding 1 year to the age of all fish aged 8–19, and 2 years to every fish aged 20 and older (
Table 3). All corrections improved agreement of the external structures; this is visualized by observing the fit of the locally weighted, smoothed average agreement by age, specifically how the 95% confidence intervals include a larger amount of the line of zero difference (
Figure 11). Nevertheless, ages for rays and spines were still not entirely in agreement with otolith ages after the correction factor was applied (
Figure 10 and
Figure 11). For rays, the underageing of the age classes older than 18 years was substantial enough that no reasonable correction would align ray ages across all age classes. For spines, corrected age classes still differed from otolith ages around age 22; however, this appears to be driven mainly by small sample sizes of older ages and disagreement between spine and otolith age of the oldest fish (otolith age = 35, uncorrected spine age = 32).
The accuracy and precision metrics of both external structures improved after correction (
Table 3). Removing the occluded ray samples increased the percent agreement ± 1 year from 68.3% to 89.8%; similarly, applying the correction factor to all rays improved the percent agreement ± 1 year to 79.2%. Further, the individual corrections for rays yielded nearly identical improvements to the APE, and the application of each correction resulted in ray ages that were no longer considered systematically biased (per the Evans–Hoenig analysis;
Table 3). Spine metrics were marginally improved upon application of the correction factor; even though percent agreement ± 1 year was 79.6% before and after correction, the APE improved from 5.0% to 4.8%. As for rays, the Evans–Hoenig analysis determined that corrected spine ages likewise were no longer systematically biased toward underageing (
Table 3).
4. Discussion
This study determined that fin rays and spines can be used to age Goliath Grouper across a broad range of ages to inform the population age structure, filling a key data gap for the species and its management. Though earlier studies had investigated rays and spines for ageing, the present study is the first that comprehensively compared both external structures and focused on their utility for nonlethal ageing. Moreover, the sample size in this study was nearly triple those of all other studies and encompassed nearly the entire size and age ranges of the species [
17,
21,
29].
Cold kill and red tide events accounted for more than half the samples available for comparative analysis from this data set (
Figure 2). Fish collected during a cold event in 2010 were relatively small and young, presumably because it is the juveniles that occupy shallow, estuarine waters, which can cool suddenly, resulting in fish kills [
9,
39]. The size and age range of fish collected during red tide events were more distributed than those from cold events. While this Goliath Grouper mortality data set had its weaknesses (e.g., samples focused along one coastline; appearance of annuli can vary by region [
40]), it nonetheless proved valuable in evaluating the use of these external hard parts in ageing the fish.
The precision metrics for rays and spines were similar, including within-reader and within-structure assessments. These metrics alone, however, were not sufficient to determine the success of ageing via the external structures, as they (PA and APE, in particular) failed to detect the significant underageing that occurred with the uncorrected ray and spine sections. The Evans–Hoenig test of symmetry and modified Bland–Altman plots were particularly helpful in pinpointing the ages at which the ageing error occurred.
Uncorrected ages derived from rays and spines were inaccurate for the oldest age classes. While spines from fish older than 8 years consistently underaged the fish by one year and those from fish older than 20 by two years, underageing using rays was more variable, so much so that a correction factor, meant to offset underageing for all age classes of rays, did not work. Occlusion or resorption started to impact ageing during a fish’s first decade; this finding is relatively consistent with those of previous studies. The maximum ages in the studies by Brusher and Schull [
29] and Artero et al. [
21] were both 6 years, younger than the age at which consistent underageing was observed in the present study, so their oldest samples might have missed the underageing observed in the present study. Murie et al. [
17] aged fish successfully to age 18 but had a small sample size of older fish. While the trend in the present study was toward underageing of the oldest age classes, some spines were aged accurately (vs. otoliths) as old as age 20, some rays as old as age 15.
4.1. Marginal Increment Analysis
The timing of otolith opaque zone deposition from this study agreed with Bullock et al. [
1], as deposition occurred April–August. In rays and spines, deposition patterns were more variable, and the translucent zone was deposited during January–August, peaking in late spring and early summer. While Murie et al. [
17] did not perform a marginal increment analysis, they did report that fish collected in March and April had translucent growth on the edge of their rays and that 79% of otoliths and rays had translucent edge codes at that time of the year. From the more extensive sampling of otoliths, rays, and spines throughout the summer and fall in the present study, it is clear that the opaque zone in otoliths corresponds to the translucent zone in rays and spines.
Brusher and Schull [
29] used a qualitative margin analysis and OTC to validate annulus deposition of rays and spines of juvenile Goliath Grouper collected in southern Florida. They found that the deposition of the translucent zone occurred during August–December. While Brusher and Schull [
29] had a large sample size of fish available for marginal increment analyses (
n = 1114 spines,
n = 48 rays), a few other key differences between their study and the present study may further explain these findings. First, the timing of sample collection differed; Brusher and Schull [
29] collected most of their samples in the latter part of the year, whereas most of the samples in the present study were collected in January and the summer months (June, July, and August). Second, qualitative edges were categorized differently: Brusher and Schull [
29] noted presence or absence of translucence on the edge, whereas the present study used more descriptive margin codes (see
Table 1). Third, samples were collected in different regions, Brusher and Schull’s [
29] from the Ten Thousand Islands region of South Florida, the present study’s from farther north, primarily in and around Charlotte Harbor and Tampa Bay. Opaque zone deposition in hard parts varies along latitudinal gradients, and although the geographic distance between the regions may not be large, seasonal temperature may have differed enough to create this differential deposition pattern [
15,
40,
41]. Finally, while Brusher and Schull [
29] targeted primarily juveniles in nursery habitat, the present study examined samples from a much broader age range. The current study included many individuals that were older than the age at maturity and were likely a part of the spawning population [
8]. The timing of annulus deposition often coincides with the spawning period [
15], and Goliath Grouper are no exception [
1]. It is possible that spawning activities led to a different pattern of annulus deposition in adults compared to juveniles and subadults, and because Brusher and Schull [
29] sampled only juveniles, they did not encounter this development. Further, rays and spines sampled from juvenile fish are often less vascularized and have clearer edges than those from adults [
26,
29,
42]; in fact, the rays and spines with the clearest edges in the present study were from the youngest fish. The absence of fish from the youngest age classes in the present study was likely a contributing factor to the difference in margin results between this study and Brusher and Schull’s [
29].
While every effort was made to reduce error, obtrusive vascularization and compaction of annuli on the edge of the structure often impeded the ability to make measurements. Ageing and measuring were conducted along the same plane for each type of structure, but in some cases the visibility and deposition along the edge of the structure was not consistent all the way around the section. This may be due, in part, to the transition from one deposition phase to the next. However, the phenomenon of inconsistent deposition around the entirety of an external structure has been well documented [
18,
22,
26]. The edge clarity of rays and spines from adult fish was always a consideration in this study. To address this issue, some of the preliminary marginal increment analyses included subsampling of fish to a set of more closely-aligned and younger age classes. Ultimately, sample sizes from certain months (particularly the winter) were too limited without adult samples, which led to the choice to utilize all samples in favor of providing analyses across all months.
4.2. Ageing Challenges
The sheer size of the rays and spines from Goliath Grouper in this study amplified some issues with processing and ageing. For example, the thickness of some spines nearly exceeded the cutting radius of the laboratory saw blades used to section them, so abundant caution was necessary to not break the blades, saw, or spine sections during processing. Spine sections also needed to have the liquid cover slip (Epredia™ Shandon Mount) applied immediately following processing to prevent the section from drying out and curling at the edges, which would diminish the ability to read and measure across a flat plane. Rays, however, were comparatively easier to process, as they were much thinner and less dense.
The identification of checks, or false annuli, in both rays and spines also presented challenges. A check is a zone where there is an apparent annulus, but it is often thinner and exhibits inconsistent spacing when compared to the true translucent annuli [
18,
22,
43]. If a suspected check was noted along the ageing plane, more investigation was necessary to examine its consistency across the entirety of the structure. A check will almost always merge into another translucent zone, whereas a true annulus will always remain separate [
44,
45]. If there was a translucent zone that did not merge with other translucent zones, it was counted as an annulus regardless of spacing. It is unlikely that false annuli were a contributing factor to underageing; typically, checks lead toward overageing, as they are often mistaken for annuli and counted [
17]. In fact, Kopf et al. [
26] noted that if every possible increment on the fin spines of Striped Marlin,
Kajikia audax, were enumerated as an annulus, then age estimates would be doubled or tripled. Here, checks were particularly problematic in spines from the youngest fish, which is consistent with results from Beamish [
18], who noted numerous checks during the first year of growth, and Stolarski and Hartman [
46], who found that the annuli of younger individuals were often ill-defined, though notably, both studies were conducted on rays. The samples from the youngest fish, even of otoliths, can be the most difficult to interpret because there is a lack of alternate material with which one could conduct a comparative analysis of the section (i.e., when there is only one true annulus, nothing else is available to compare a suspected check).
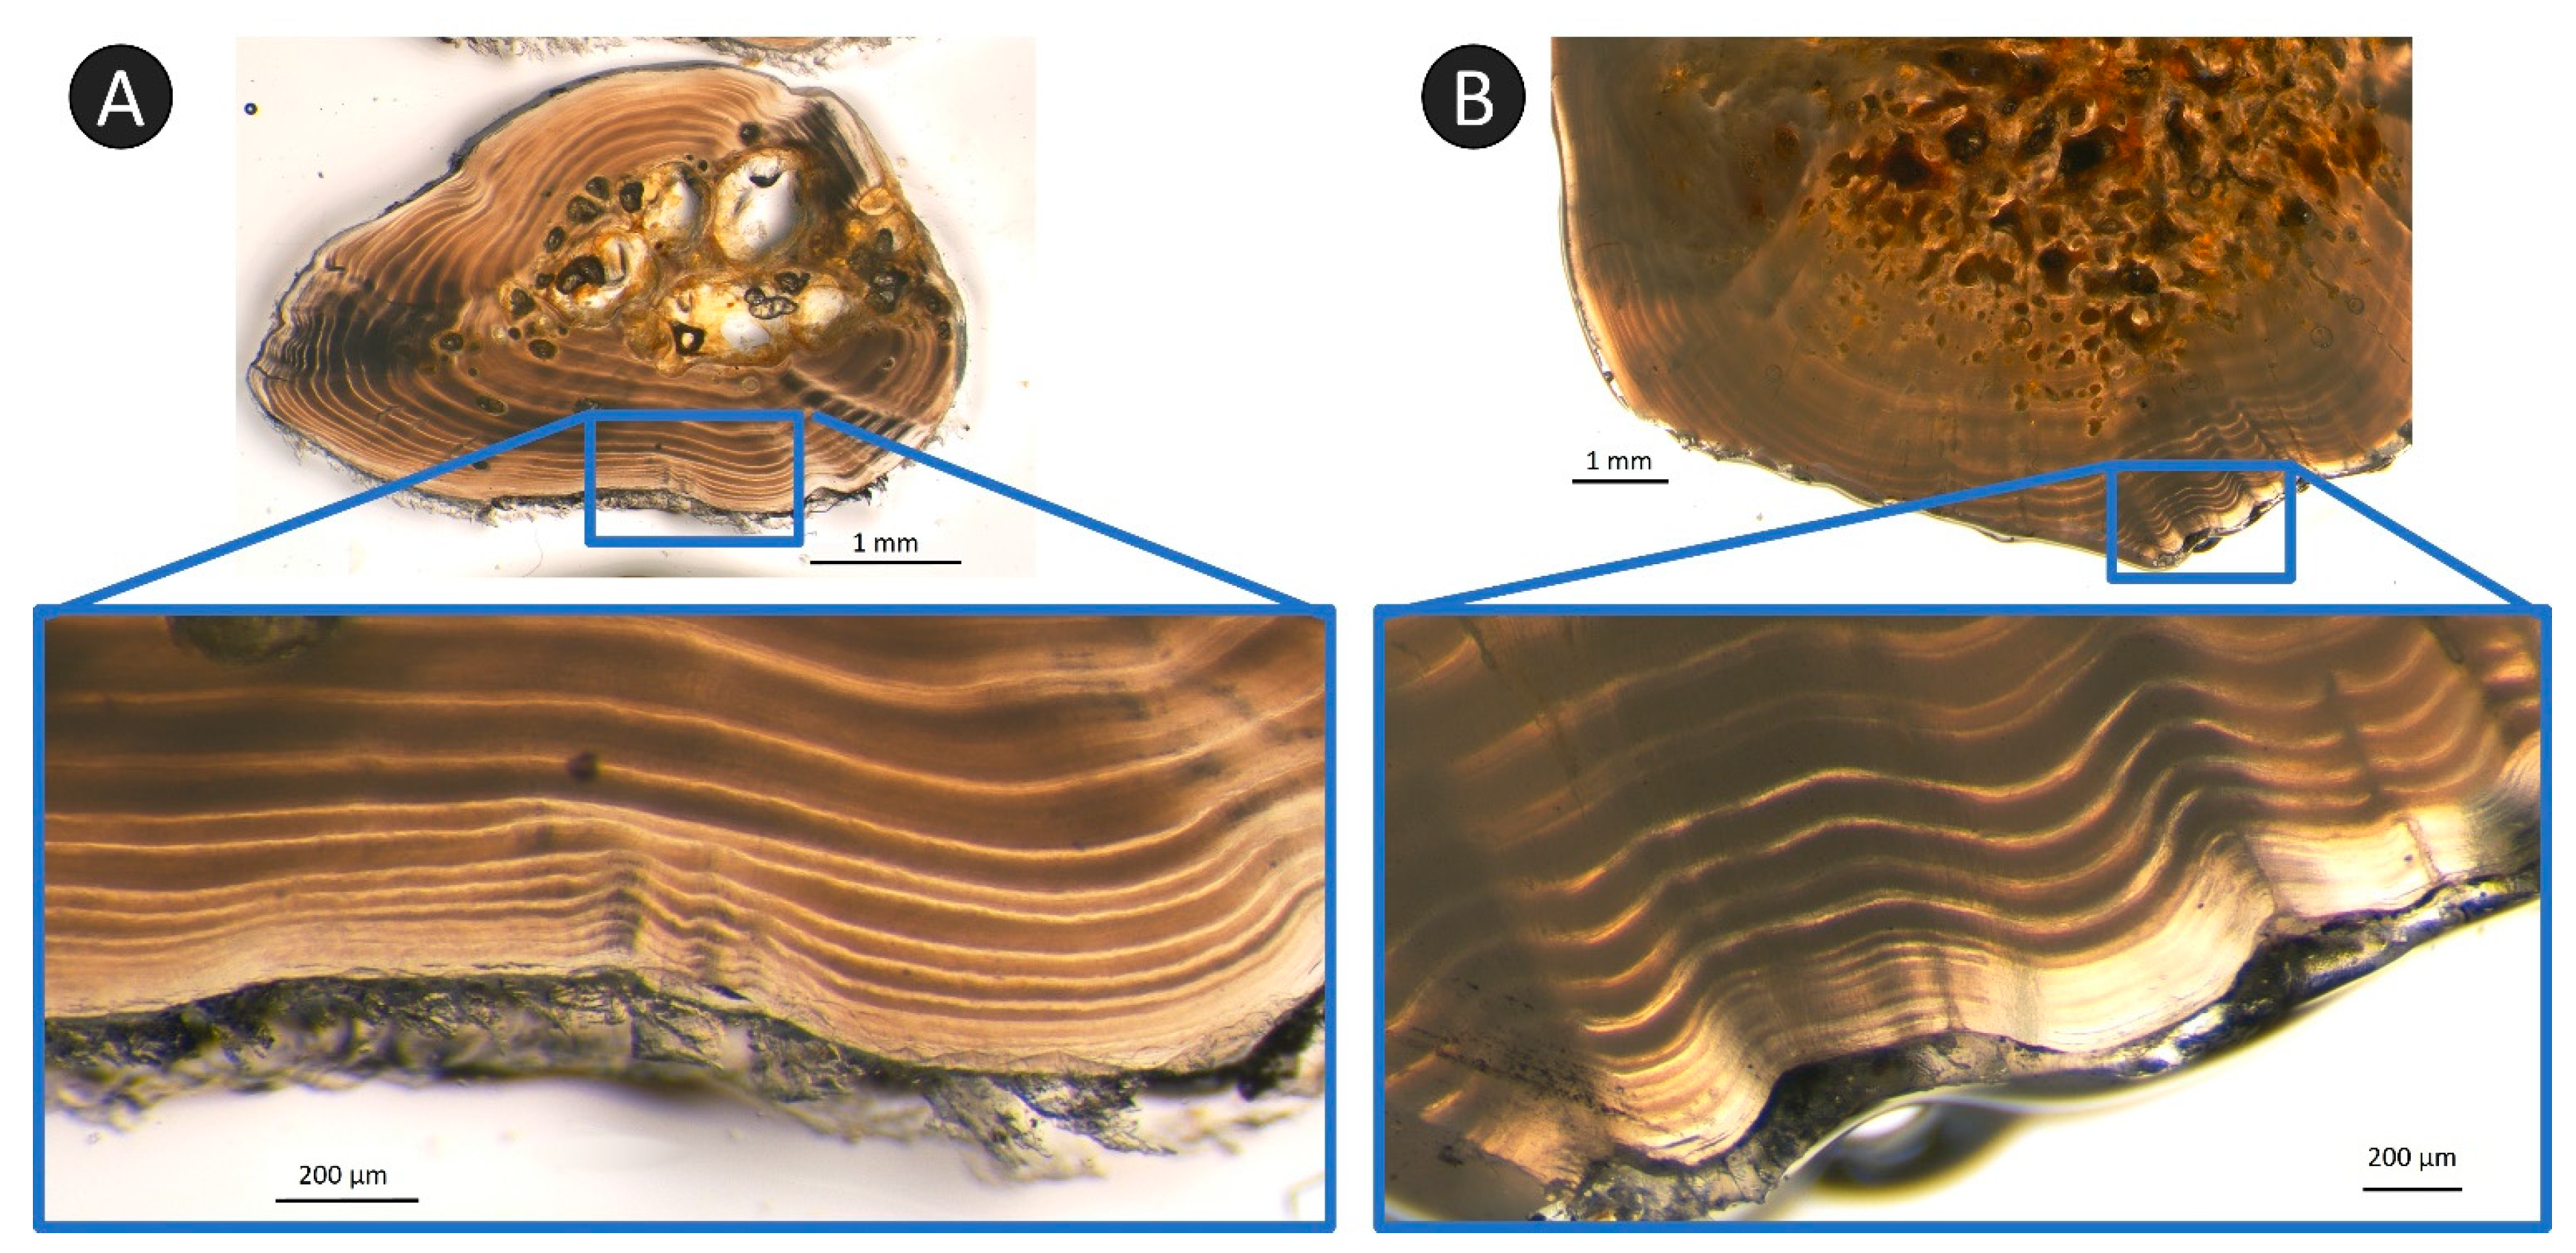
Another difficulty related to ageing these structures was the compaction of annuli on the edge of older fish [
17,
18]. This compaction was observed in both the rays and spines starting around age 10 but was most pronounced in the oldest samples. It was obvious on sections when this compaction was occurring, as the edge became almost entirely translucent when looking at a lower magnification, but focusing on the edge at a higher magnification revealed all the annuli (
Figure 12). It is worth noting that if the section was damaged during cleaning or processing, some annuli in the compacted region may have been lost, or the edge may not have been entirely clear for assigning a margin code [
22]. While most underageing was attributable to occlusion, particularly in the rays, compaction may have been an additional compounding factor. The oldest rays that were not in alignment with otolith ages, even after age correction, may have been underaged due to compaction as well as occlusion.
The most challenging aspect of ageing Goliath Grouper rays and spines was the occlusion and resorption of these structures. As noted previously, occlusion is specifically an obstruction in the central part of the structure due to encroaching vascularization, and resorption is the degeneration of central structure material due to the growth of vascular tissue. The present study found that ray sections primarily exhibited resorption while spine sections primarily exhibited occlusion. It was expected that the central lumen of spines would contain vascularization, given that they are a functional appendage of the fish, but the individual variation of occlusion between samples was unexpected. While there was a general trend of increasing occlusion diameter with fish age, the severity, coloration, and scale of occlusion, even on fish of a similar age, was highly individualized. For spines, the first annulus was nearly always obscured by age 9 because the vascularization would have overtaken the earliest annulus. The vascularization in spines, however, did not result in a consistent hollowing out or replacement of the central lumen, but rather an encroachment upon the annuli as they were established. The individual blood vessels penetrated through the spine, resulting not in a comprehensive degeneration of material but more of an amorphous expansion of the center. The result of the expansion in this manner was that some of the earliest annuli, while obstructed, could almost always be observed from within the occlusion (see
Figure 9). Thus, the occlusion diameter of the spine did not always represent the level of obstruction encountered while ageing. This ability to consistently observe and count early annuli from within the occlusion of the spine was the primary reason that the oldest spine samples were underaged only by a small degree compared to otoliths. For rays, the first annulus was nearly always lost by age 9, but in contrast to spines, resorption was the primary cause of annulus loss. When there was deterioration of the ray across the ageing plane, the material was generally evacuated at the site, with a hole left in its place. This resorption essentially eliminated the early annuli and was likely a contributing factor to the extensive underageing of the rays marked as occluded. As such, the removal of occluded samples improved ray accuracy equally as much as did adding a correction factor to all age classes.
Another factor worth noting is the individual variation of ray and spine sections. No single age class had perfect agreement between the external structure and otolith age. However, the readability of individual spines or rays from fish of the same otolith age resulted in ages from external structures that ranged from 2 years younger to 2 years older than the otolith age. This variability was a contributing factor to the correctability of ages and the resultant nonsignificant Evans–Hoenig symmetry tests. Further, the sample size of fish from the oldest age classes (>25 years) was small, and those few fish, even after correction, remained underaged. Thus, without a larger sample size, it remains to be seen whether the underageing of the oldest age classes would continue or if they too would exhibit such variability as to allow for consistent correction.
The application of a correction factor for rays and spines resulted in acceptable alterations to the age class assignment for each structure, and corrected ages did not exhibit systematic ageing bias. Corrected spine ages agreed with otolith ages through nearly the entire age range of the species, while ray corrections resulted in age agreement through the most abundant age classes. Given the correctability of ages from spine sections, these structures were the most accurate external structure for ageing Goliath Grouper.
4.3. Utility for Nonlethal Sampling
Spines were the preferred structure from the standpoint of structure removal from the fish and accuracy of the structure while ageing nonlethally. Dorsal rays of Goliath Grouper have a region of thick outer flesh and skin that extends from the base partway up the rays, so removing rays at the base (i.e., the insertion point of the dorsal musculature) requires a cut into this flesh. Alternatively, there is only a thin connective membrane between dorsal spines, so nonlethal removal of the structure requires cutting only this thin membrane before sampling. Therefore, nonlethal sampling of spines can be accomplished using pruning shears or wire cutters and the skin-cut region on a live fish can be easily identified and accessed.
In addition to easier collection, spines were the preferred structure for nonlethal ageing due to the alignment of ages from the base of the spine with ages from the skin-cut sections. Similar results have been shown in other studies that tested a skin-cut approach for spine ageing. For example, Metcalf and Swearer [
28] conducted a comparison for Blue Throat Wrasse,
Notolabrus tetricus, that analyzed a base cut and a ‘spine top’ cut (i.e., a cut halfway up the spine); they found no significant differences between these and otolith ages throughout the age range of fish in the study (1–12 years). Similarly, a study of two large tropical snappers, Papuan Black Bass,
Lutjanus goldiei, and Spot-tail Snapper,
Lutjanus fuscescens, determined that the ‘base’ cut of their spines, which corresponded to the definition of a skin-cut in the present study, provided equivalent age estimates with otoliths to age 15, the maximum age in the study [
16].
Spine morphology is one contributing factor that led to greater accuracy of ages from skin-cut sections. The base of the spine below the condyle groove is asymmetrical and highly resorbed and thus is not a good candidate for sectioning and ageing [
15,
47]. The preferred processing zone for a spine is distal from the base, in the region where the spine becomes more symmetrical (
Figure 3). However, Goliath Grouper spines are so large and broad that the preferred processing zone is often a centimeter or more distal of the base. The skin-cut region of spines often aligned with the preferred processing zone because the distance necessary to process distally away from the condyle base was often substantial. In contrast, skin-cut rays in this study consistently underaged base-cut samples. This finding is consistent with Murie et al. [
17] who identified clearly visible annuli in rays that had been sampled very close to the base, but these were not apparent in more distal sections. Similarly, Debicella [
22] noted that ray removal at the base of the dorsal fin (skin-cut level) for Gag,
Mycteroperca microlepis, provided no loss of annuli for fish aged 0–5 but that in sections above the level of the dorsal surface it exhibited a first annulus that was difficult to identify. Lastly, Allman et al. [
43] noted that the most readable ray samples for Gray Triggerfish,
Balistes capriscus, were to be removed at the insertion point of the pterygiophore. While they did not specifically test the assumption, they noted that the ray-removal procedure could increase the potential for infection to the fish, which they said could preclude the use of rays as a nonlethal ageing method for that species [
16,
43].
4.4. Management Implications
The present study determined that spines are the preferred external structure for nonlethal ageing of Goliath Grouper based largely on the application of the correction factor. Interestingly, the spine correction factor suggested here recognizes the likelihood of underageing by age 7, which is a biologically relevant time period for Goliath Grouper, as they mature and undergo an ontogenetic habitat shift from inshore to offshore [
1,
3,
9]. Inaccurate ageing of fish around this age could result in incorrectly including immature fish in estimates of the spawning population or including mature fish as subadults in population models. From a stock assessment perspective, this error could bias estimates of spawning stock biomass (SSB) by overestimating the number of fish in younger adult age classes [
48]. However, given that ageing error of spine sections generally trended toward underageing, overestimation of young adult age class abundance due to ageing error would likely be dwarfed by the underestimation of potential SSB and recruitment due to underageing.
Ageing error associated with the oldest age classes could be another consequential source of error in future stock assessments. Given the consistent underageing of the oldest individuals in the present study and the lack of information on the recovery of the population of Goliath Grouper in US waters, accurately determining the ages of the oldest samples is critical for accurate stock assessments. The current oldest Goliath Grouper sample on record (37 years, otolith age Bullock et al. [
1]) was collected before the moratorium on harvest. Based on validation of similar species [
49,
50,
51], it is generally assumed that Goliath Grouper can live longer than the maximum known age. The maximum age is integral to assigning the natural mortality curve used in stock assessments [
13], so if an individual older than 37 years were to be captured, it would be important to accurately determine the age of the specimen. When the correction is applied, a sample from a fish close to the maximum recorded age could be aged confidently with a spine.
Traditional stock assessment methods have been largely unsuccessful in assessing the population status of Goliath Grouper in US waters [
11,
12,
13], largely due to the absence of typical data streams of fishery catch information and life history metrics due to the harvest moratorium. The most recent attempt was rejected during review because of the uncertainty surrounding available data and the structure of the chosen models [
13]. Specifically relevant to the present study is the conclusion that the available age data used in the models was “highly uncertain and relatively sparse”, particularly for the offshore adult population [
13]. A program using nonlethally sampled spines could fill this gap by providing critical information about the age structure of the offshore population. The SEDAR 49 assessment team recommended the sampling of 400–500 specimens for an estimate of the age structure of the offshore population, which could be conducted by state or federal researchers with assistance from the recreational and charter fisheries [
13]. A cooperative group of stakeholders who are empowered and trained in the proper removal of spines would be able to access and sample many more fish than one fishery research team. Many such cooperative programs have been used successfully in addressing pressing fishery-management needs [
52]. As such, nonlethal sampling and ageing of Goliath Grouper spines could address management goals and contribute to future stock assessments.


