
Automated Identification of Morphological Characteristics of Three Thunnus Species Based on Different Machine Learning Algorithms
 ,
,
Abstract
:
1. Introduction
2. Materials and Methods
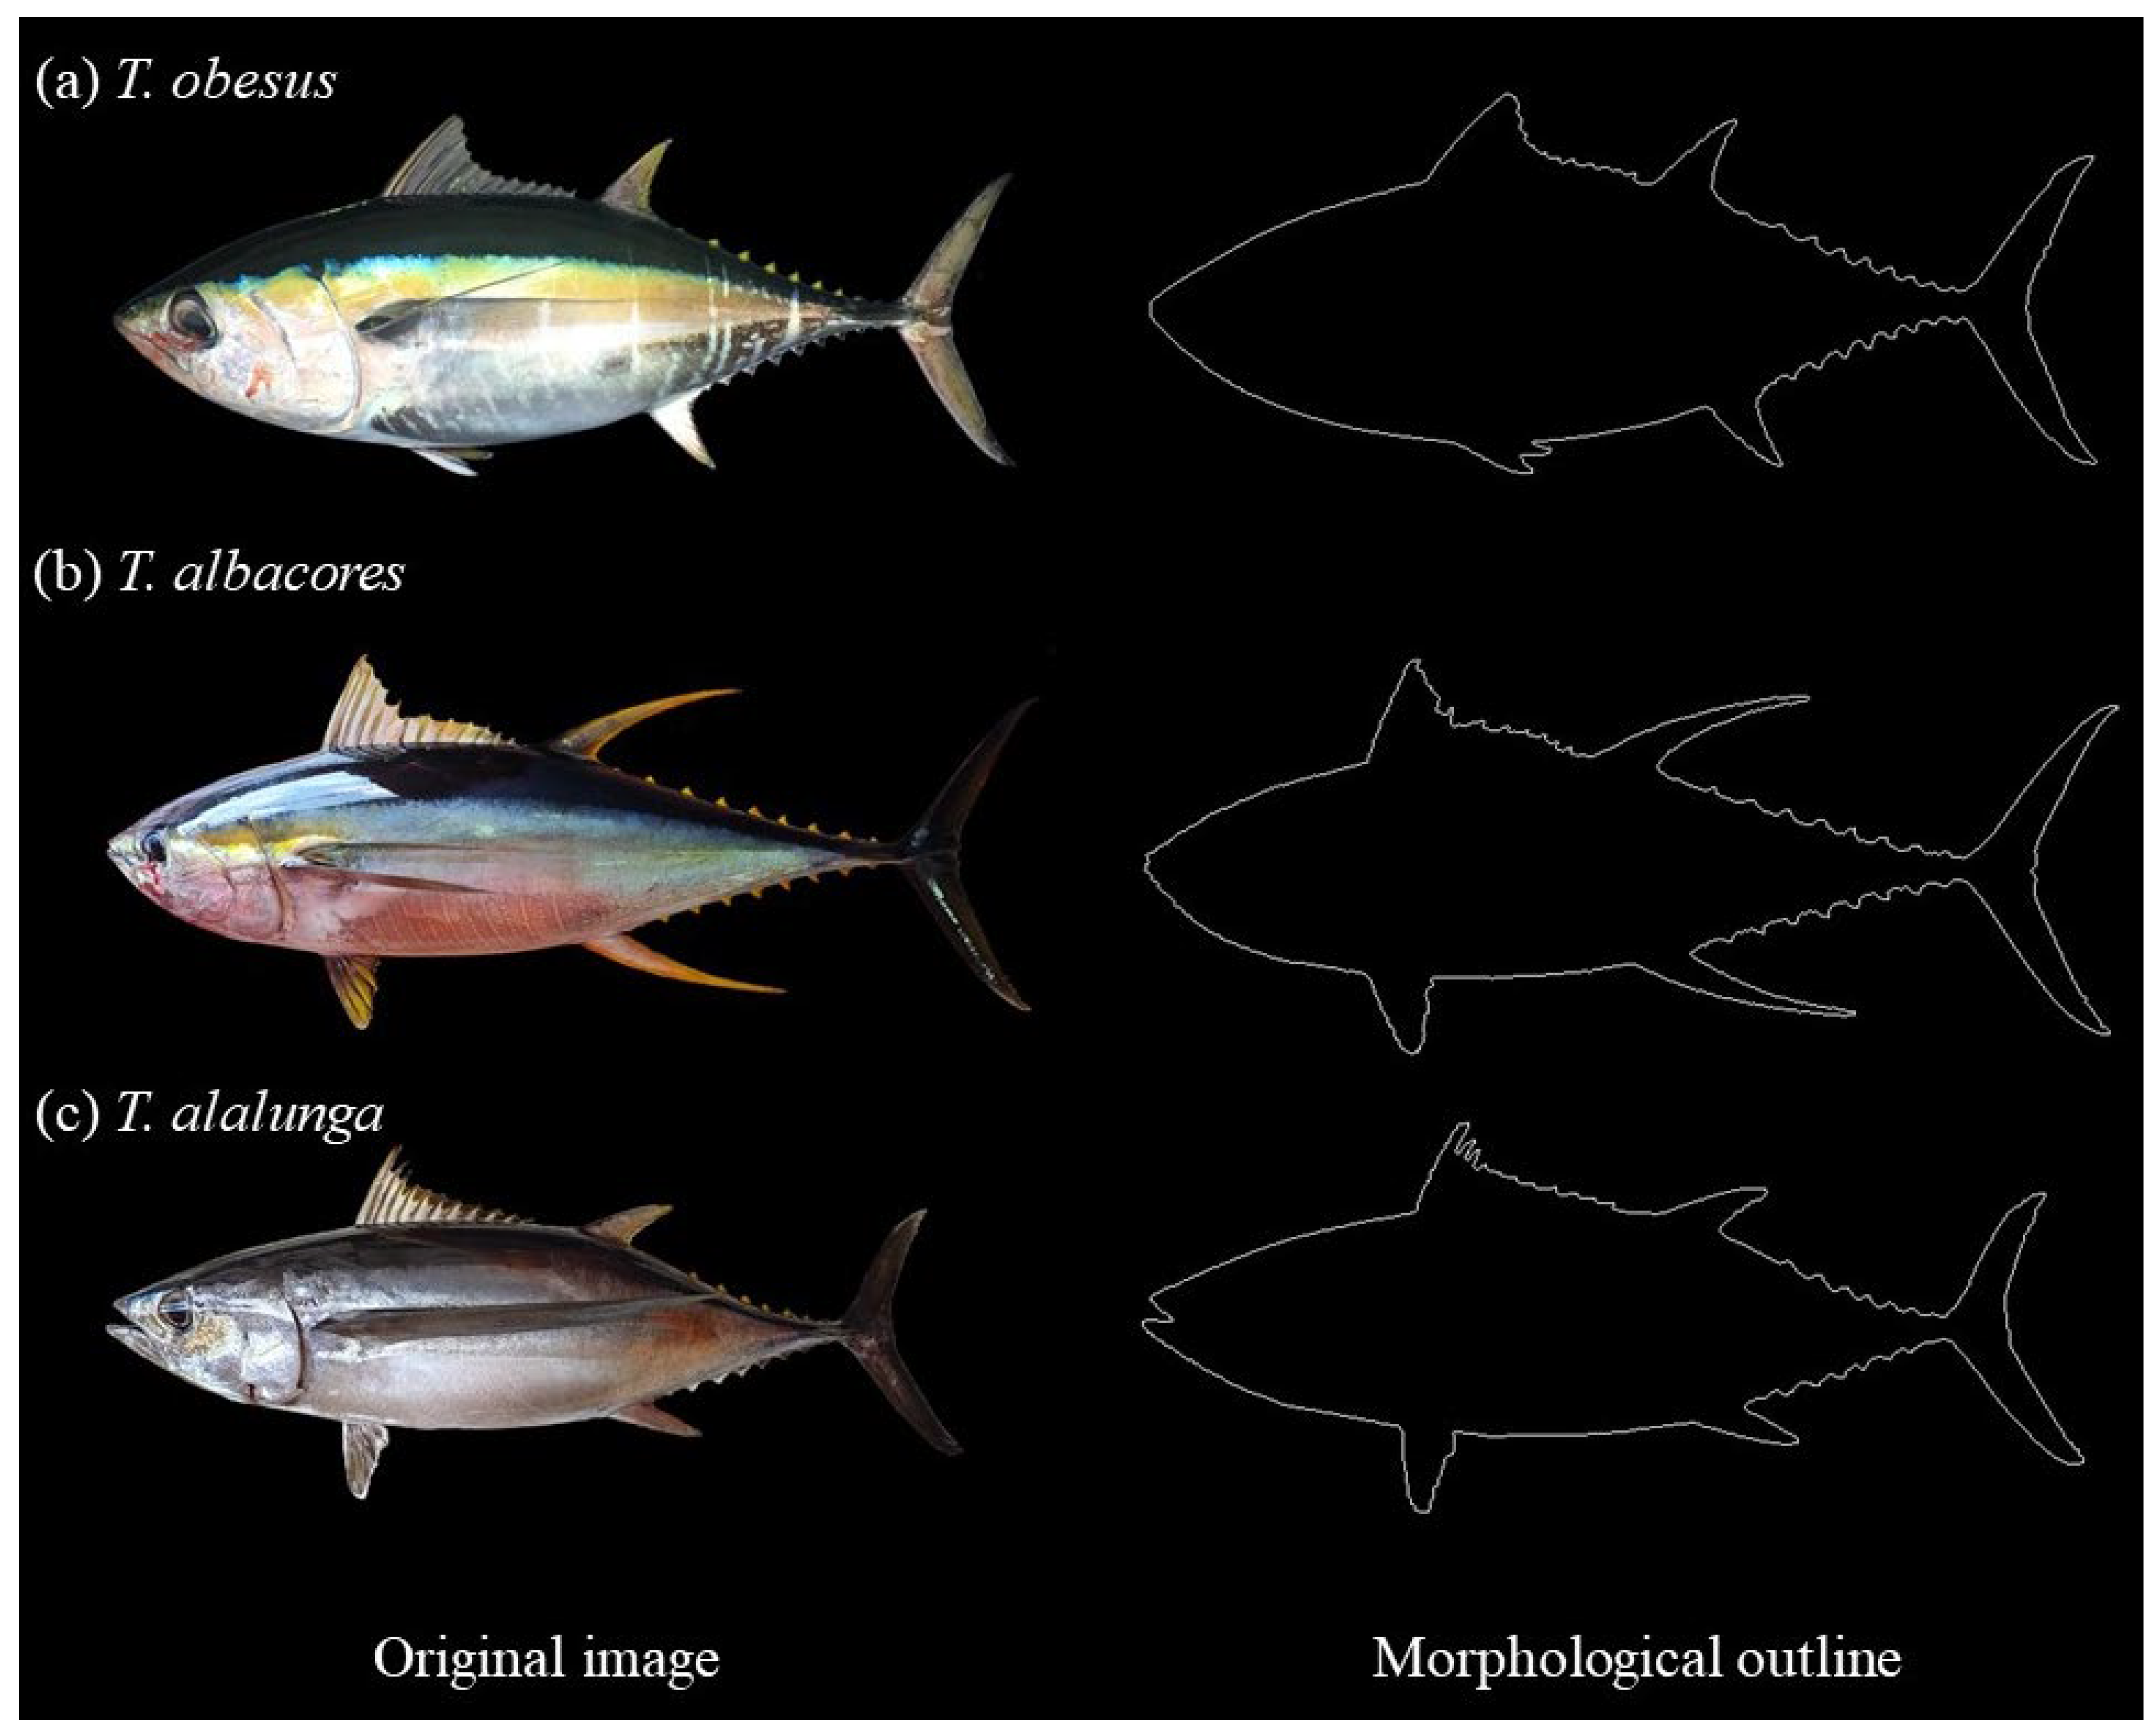
2.1. Materials
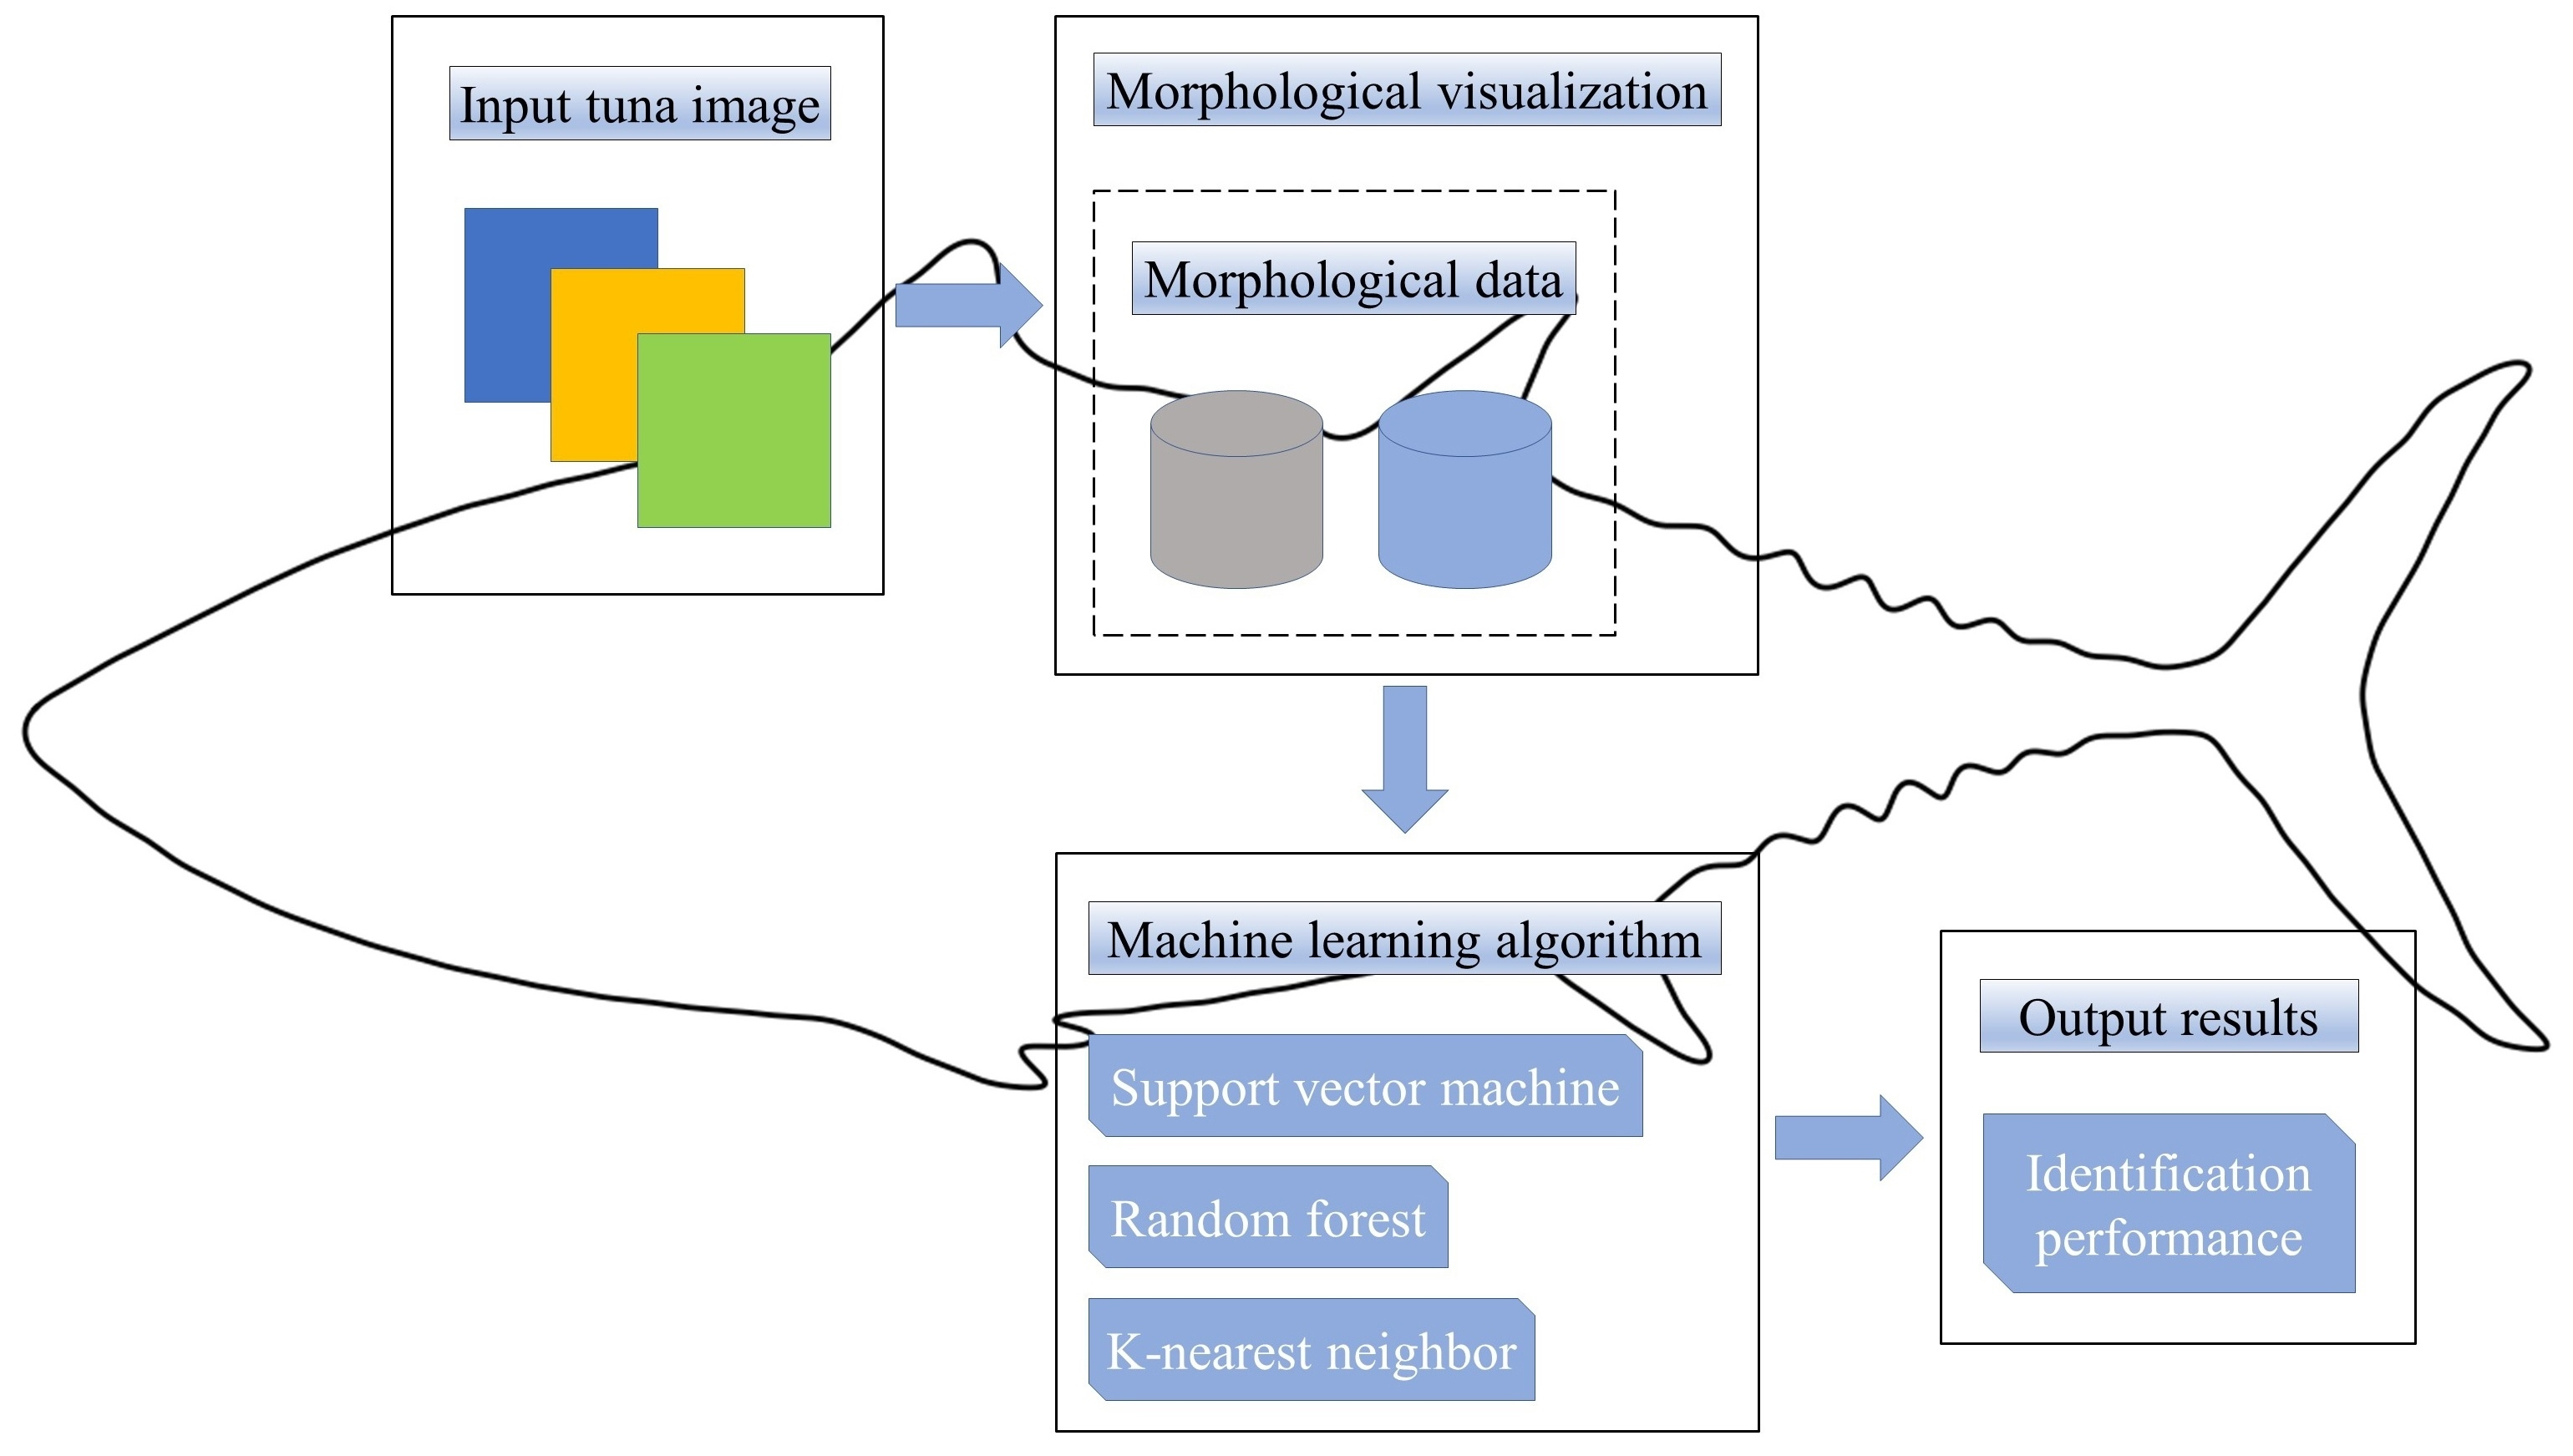
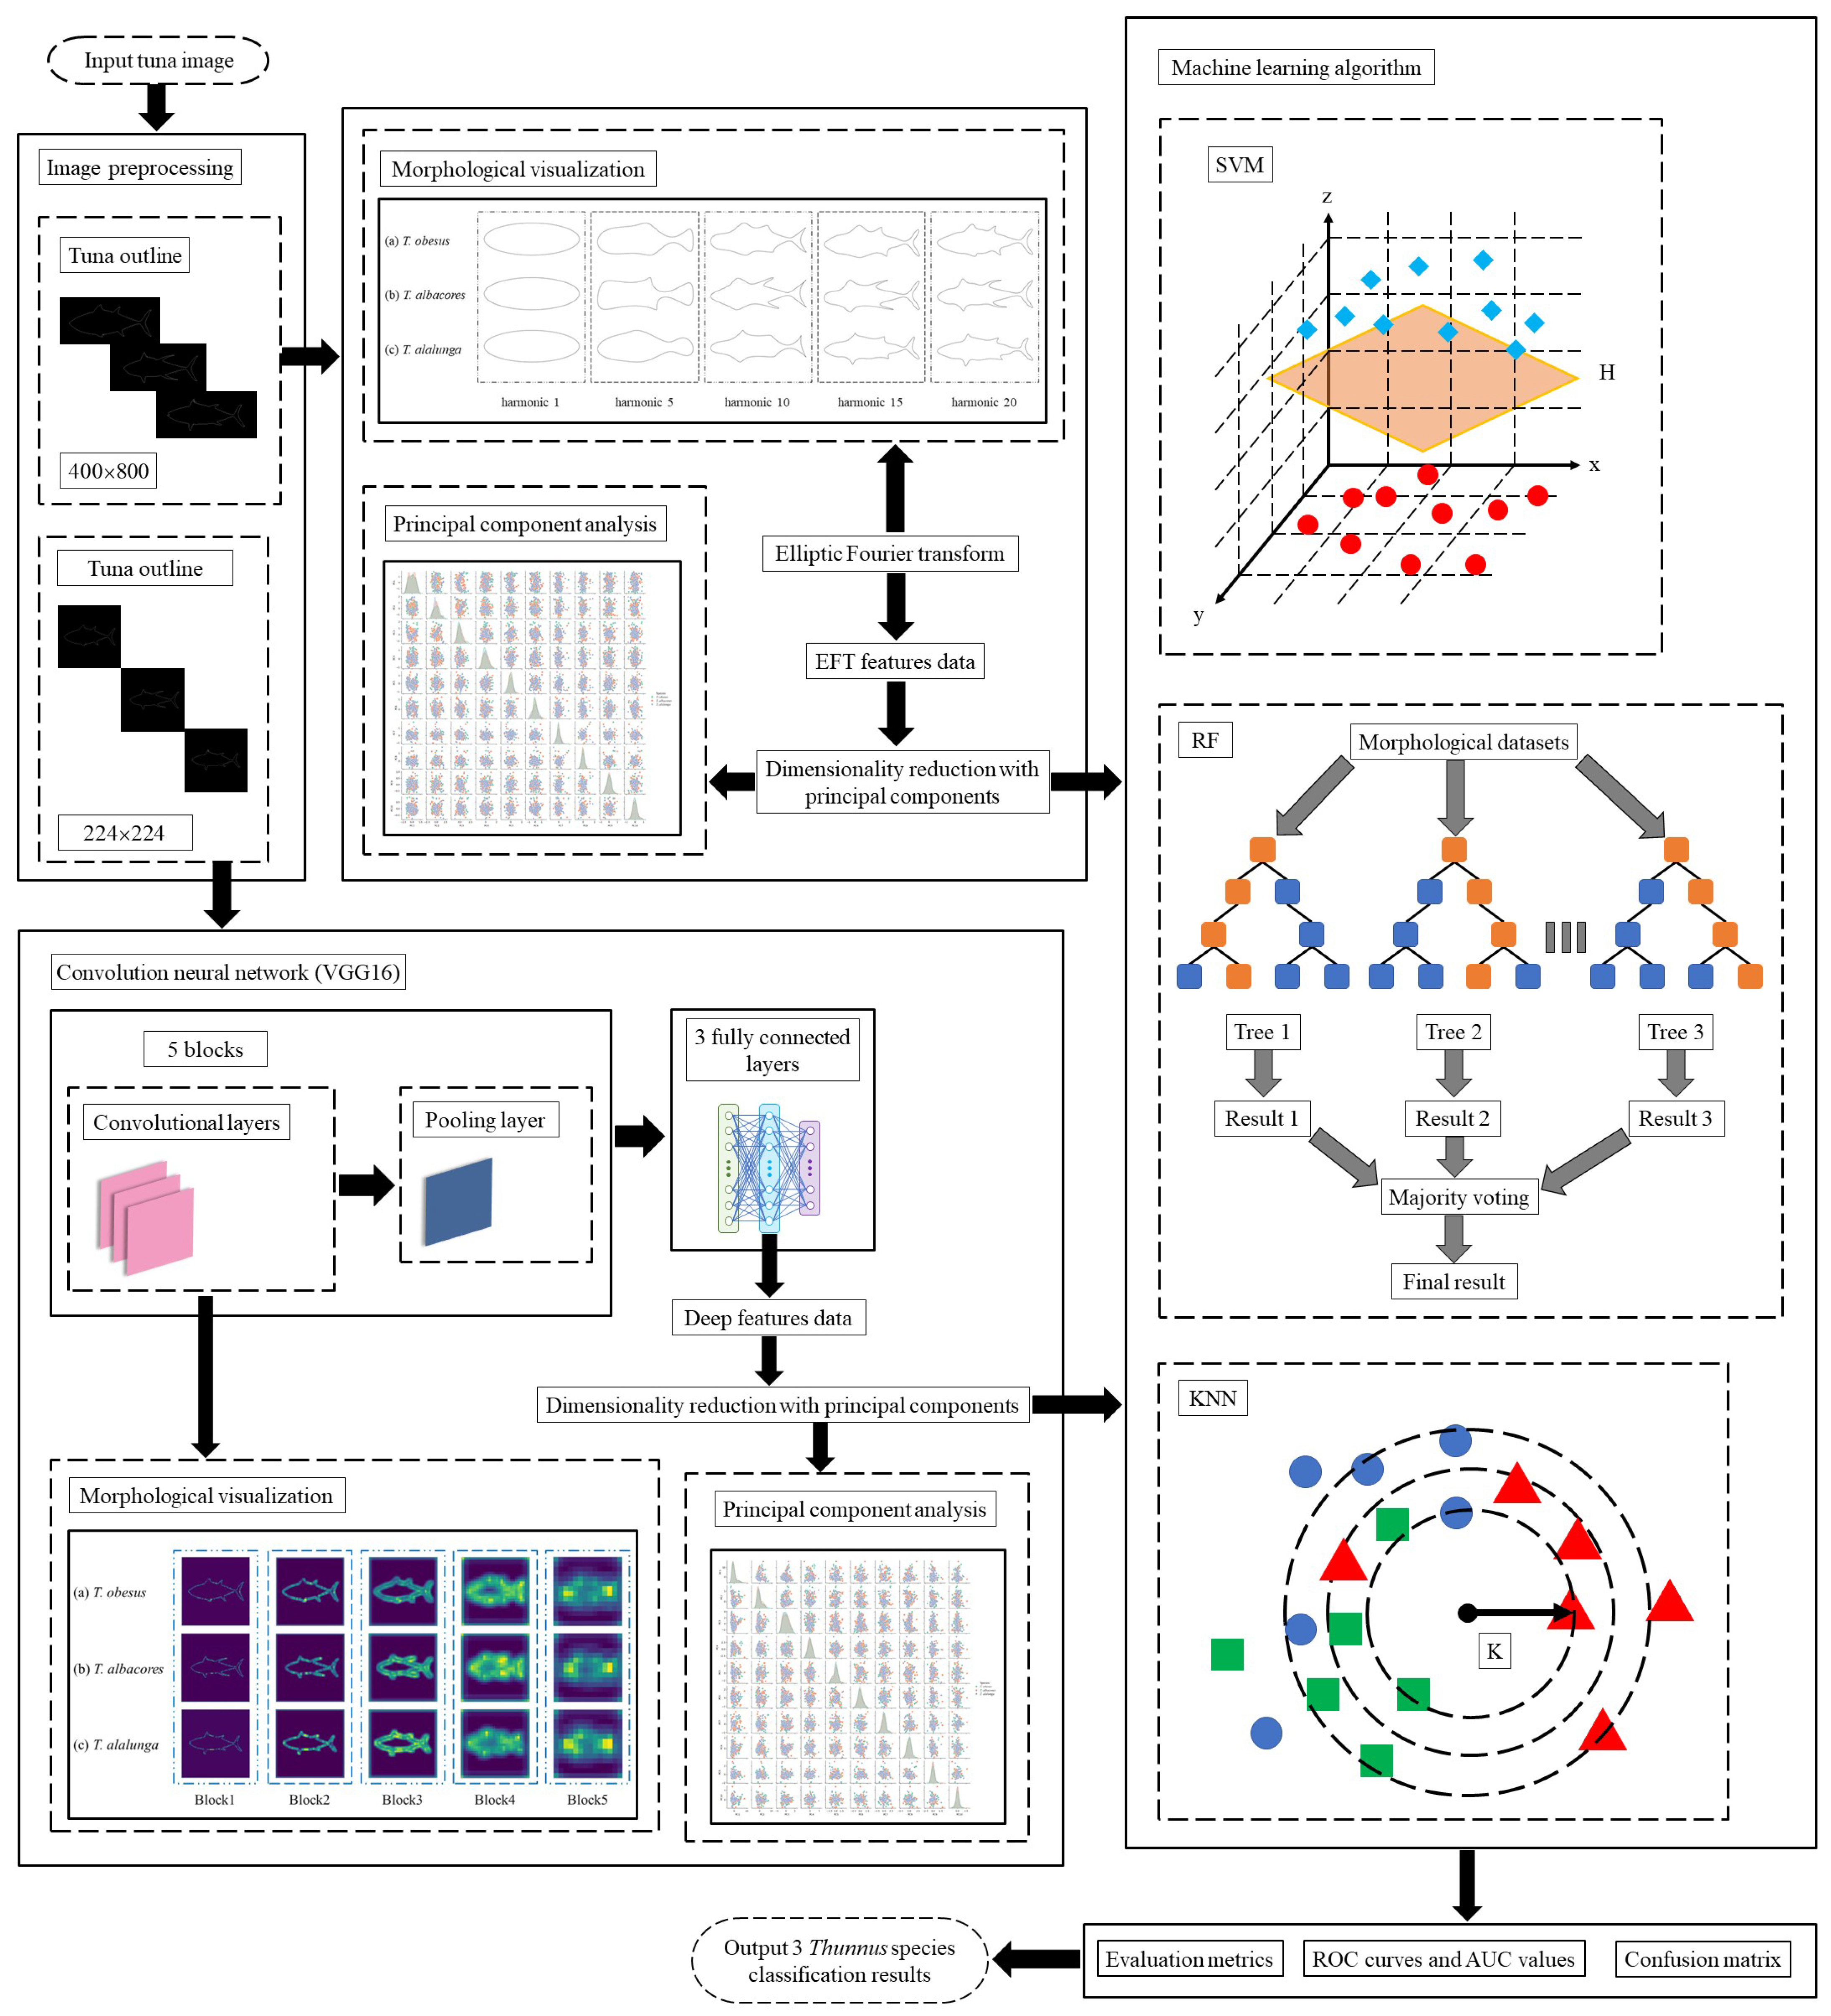
2.2. Methods
2.2.1. Preprocessing of Tuna Images
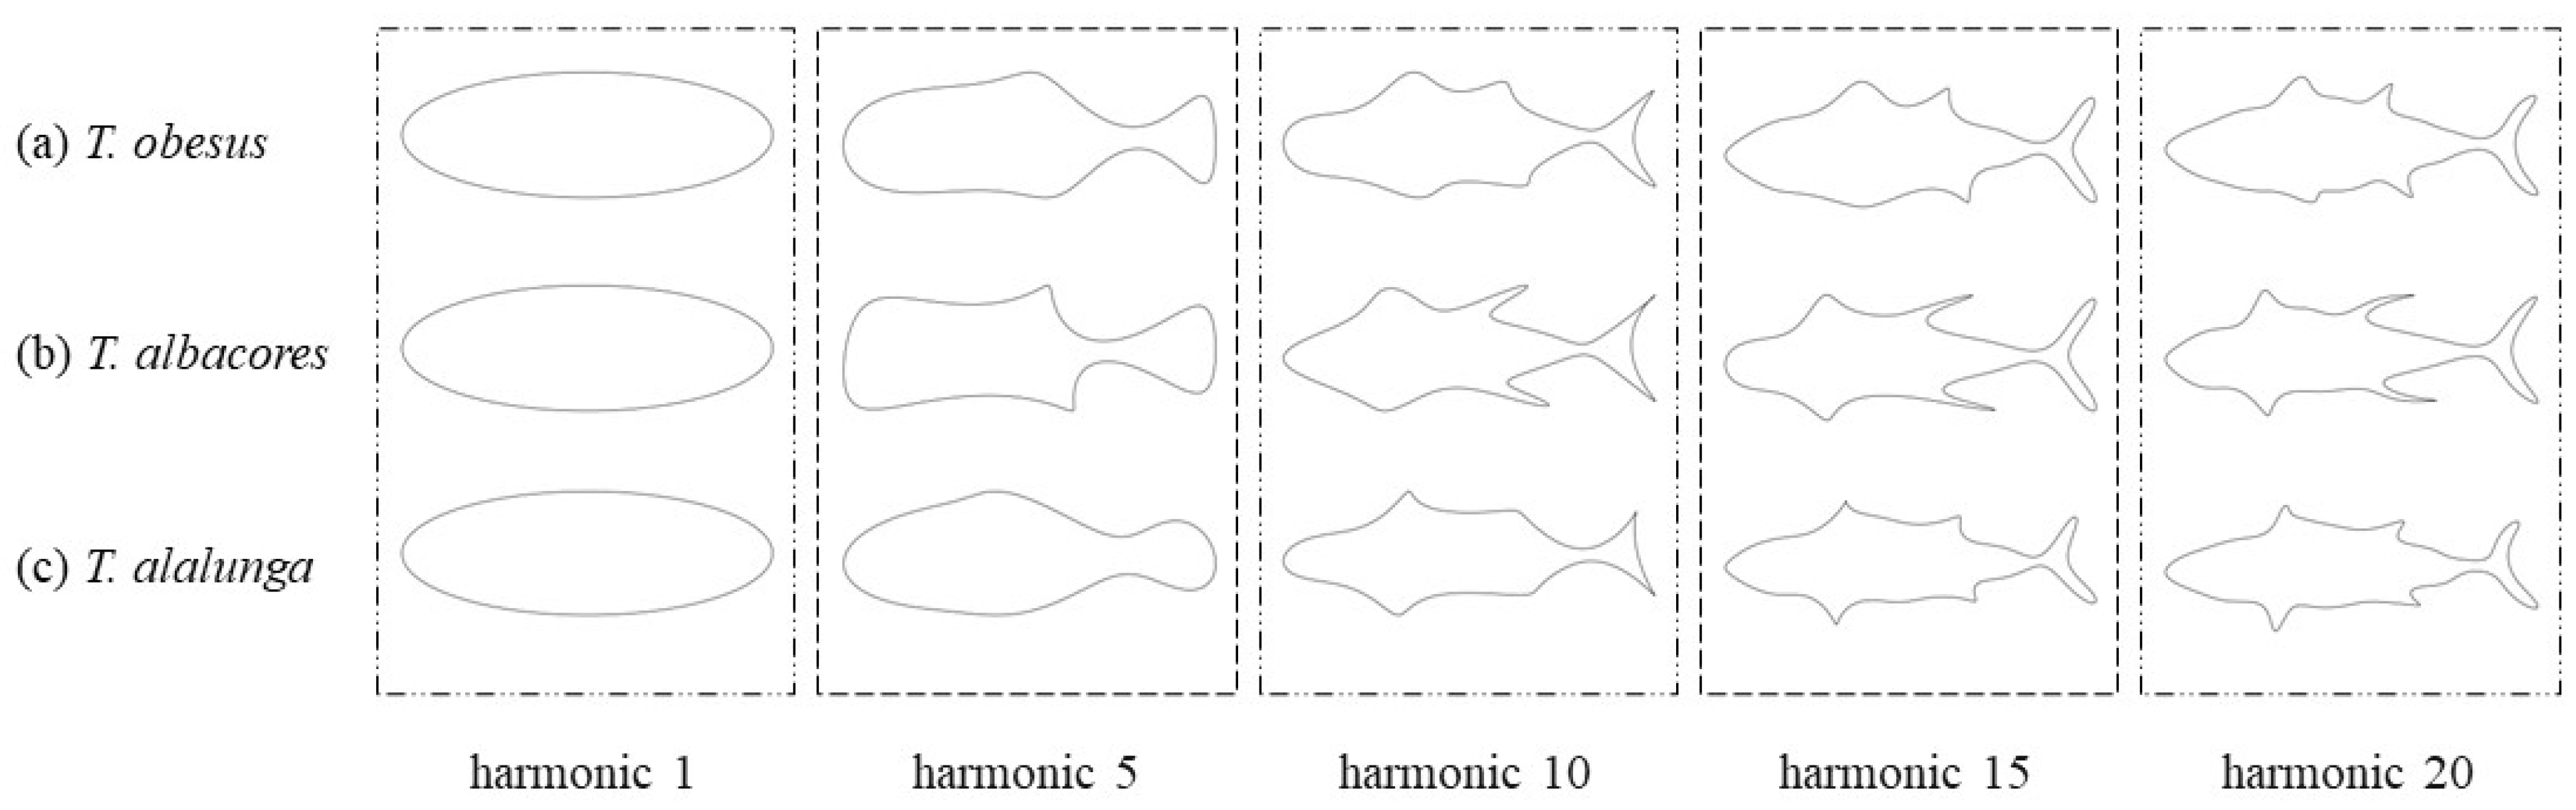
2.2.2. Elliptic Fourier Transform Features and Morphological Reconstruction
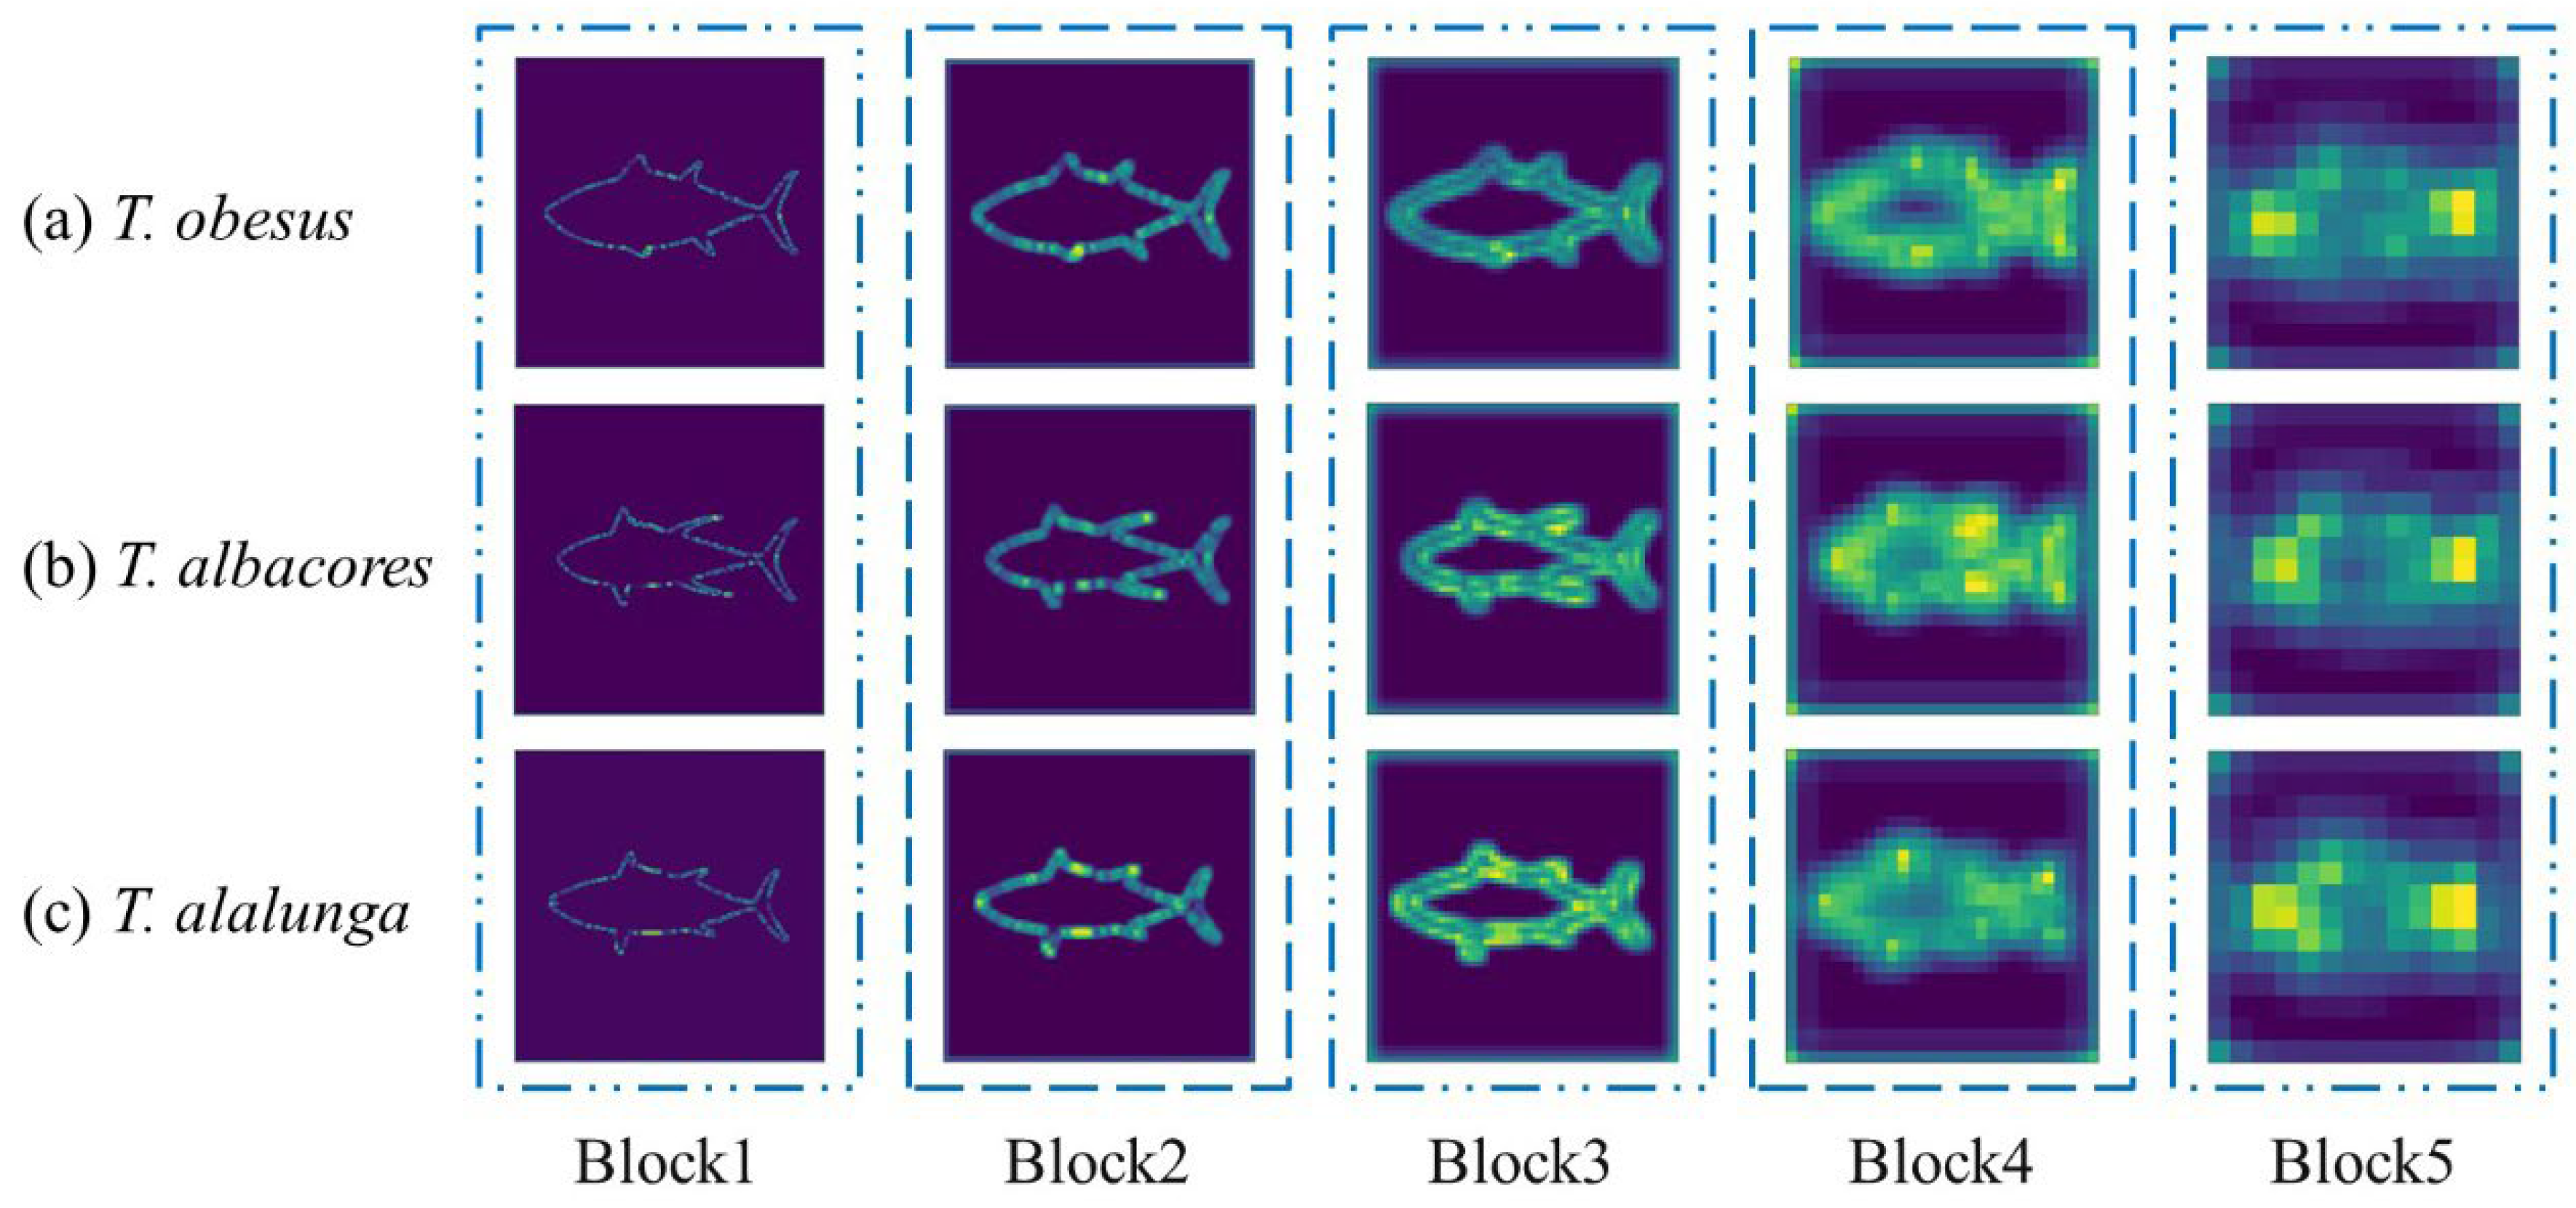
2.2.3. Deep Features and Convolution Neural Network Visualization
2.2.4. Machine Learning Algorithm
2.2.5. Evaluation Metrics
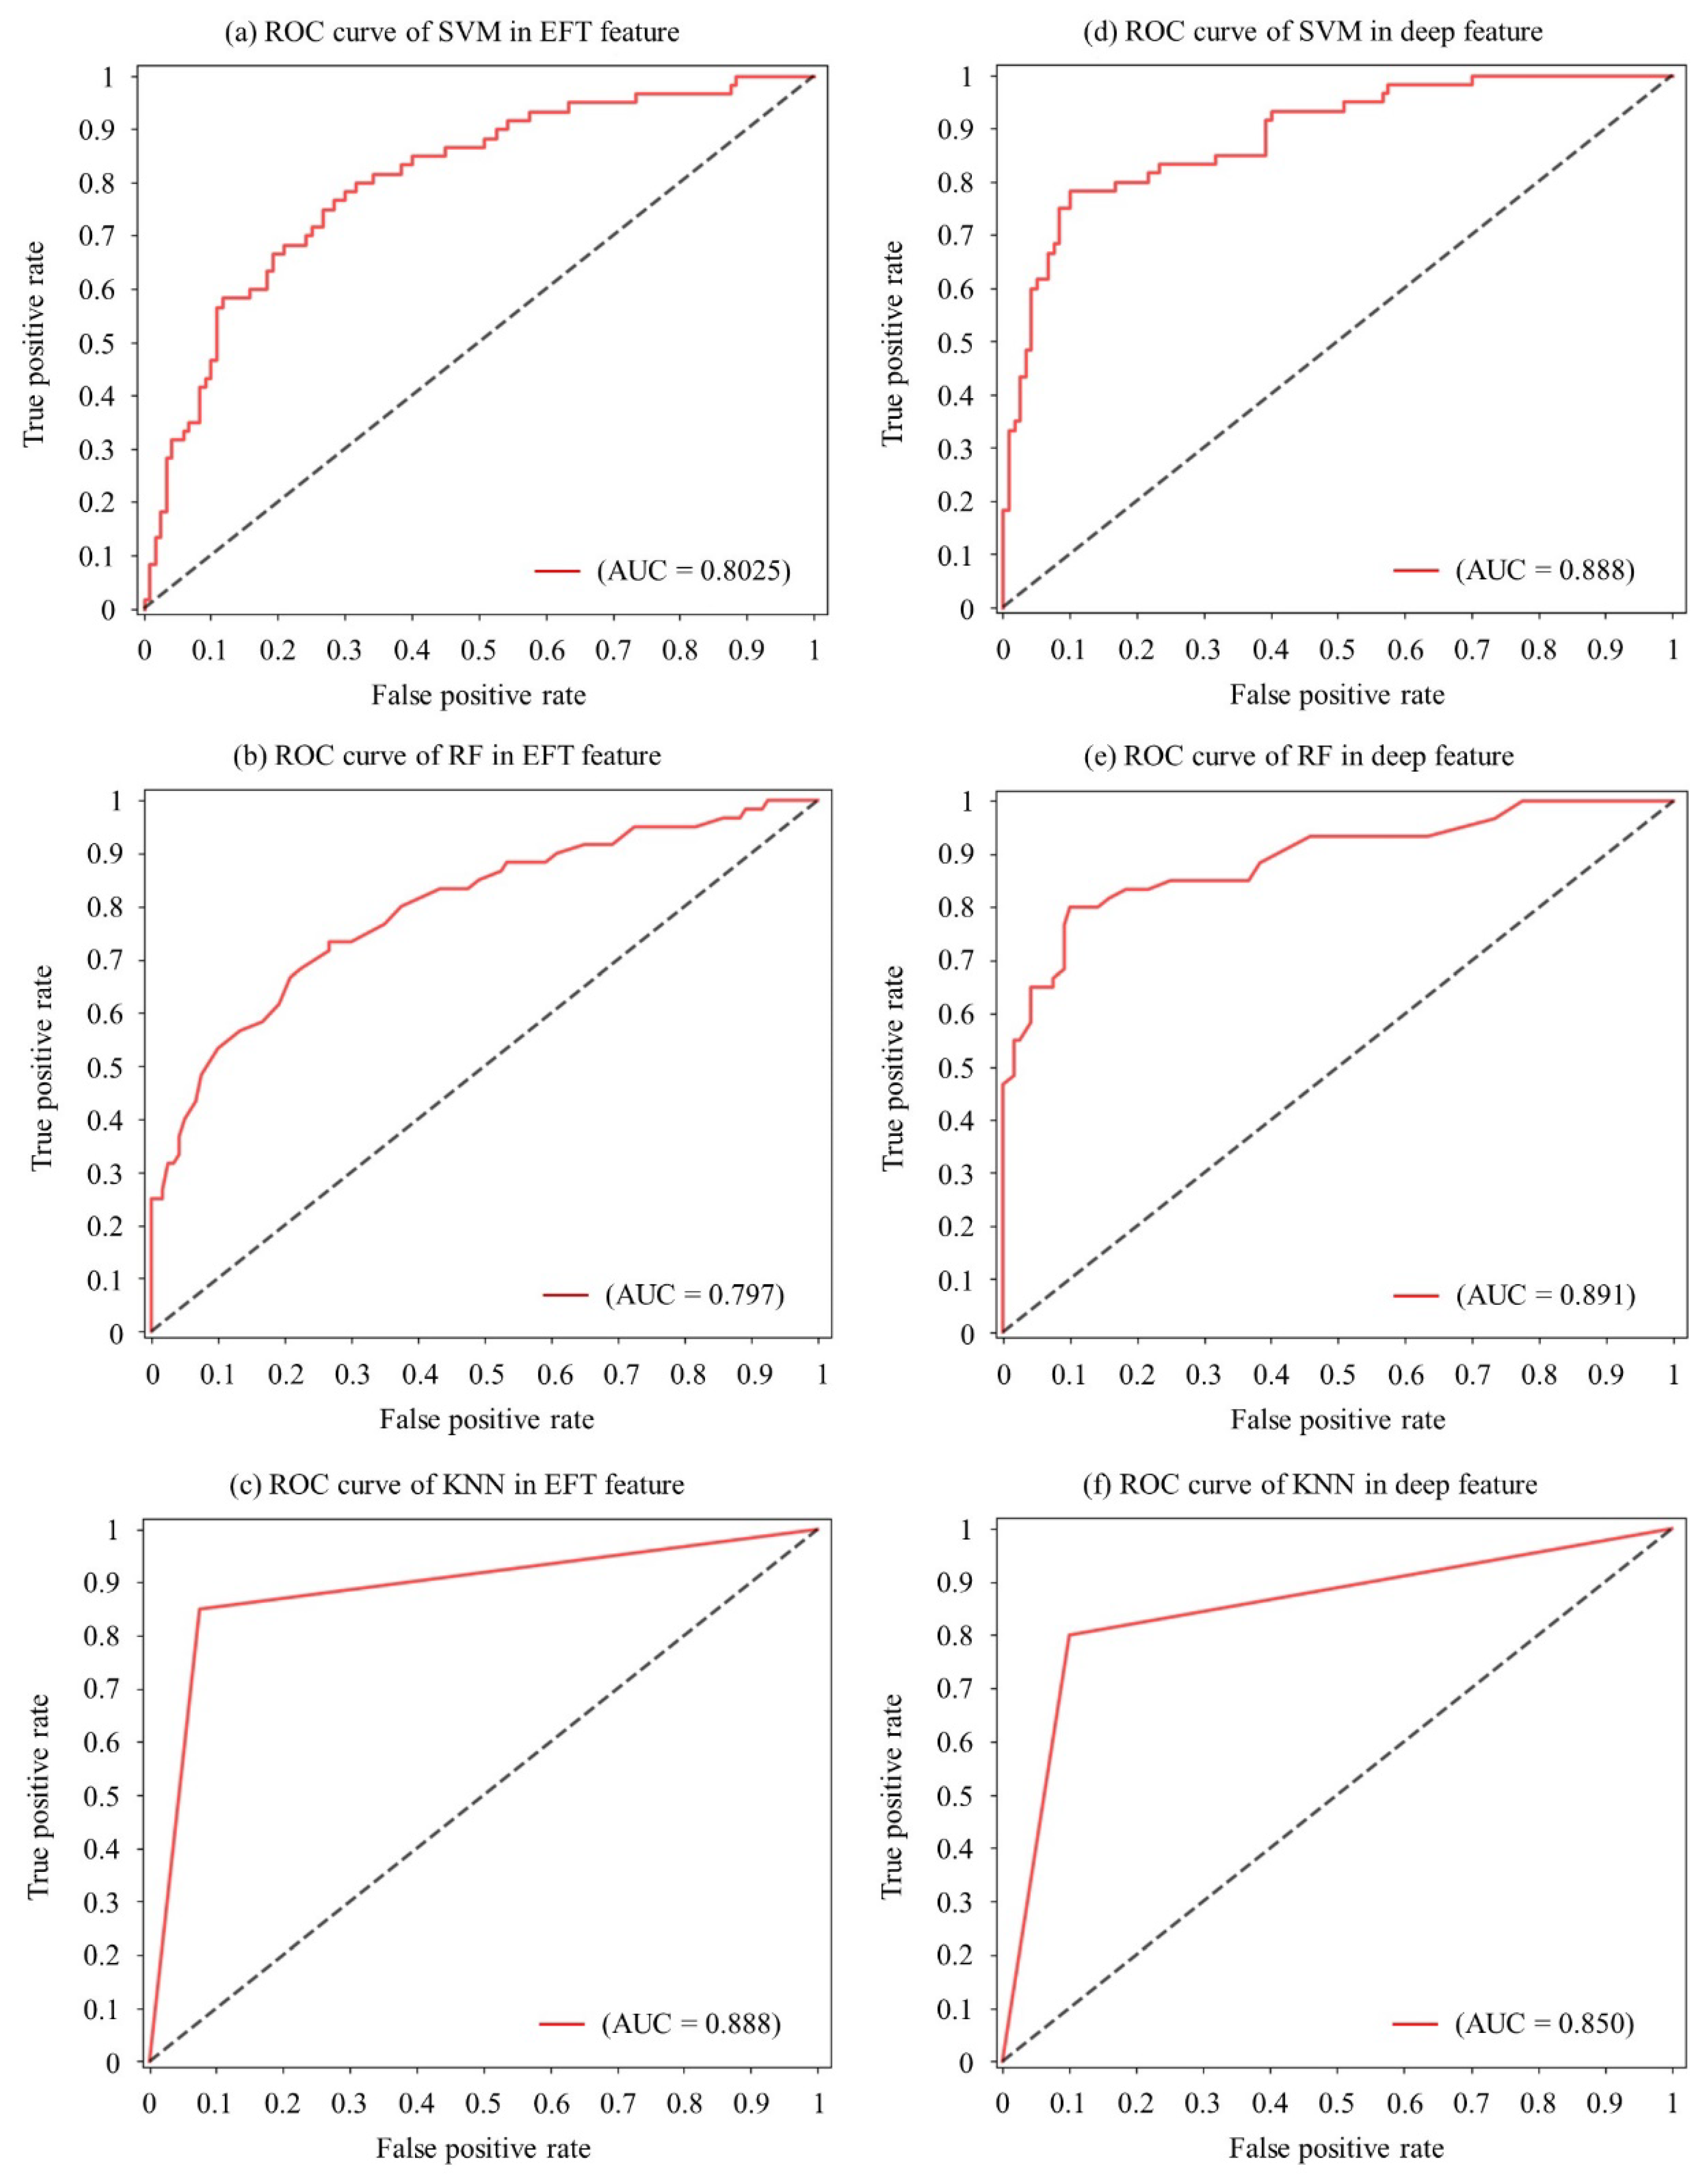
2.2.6. ROC Curves and AUC Values
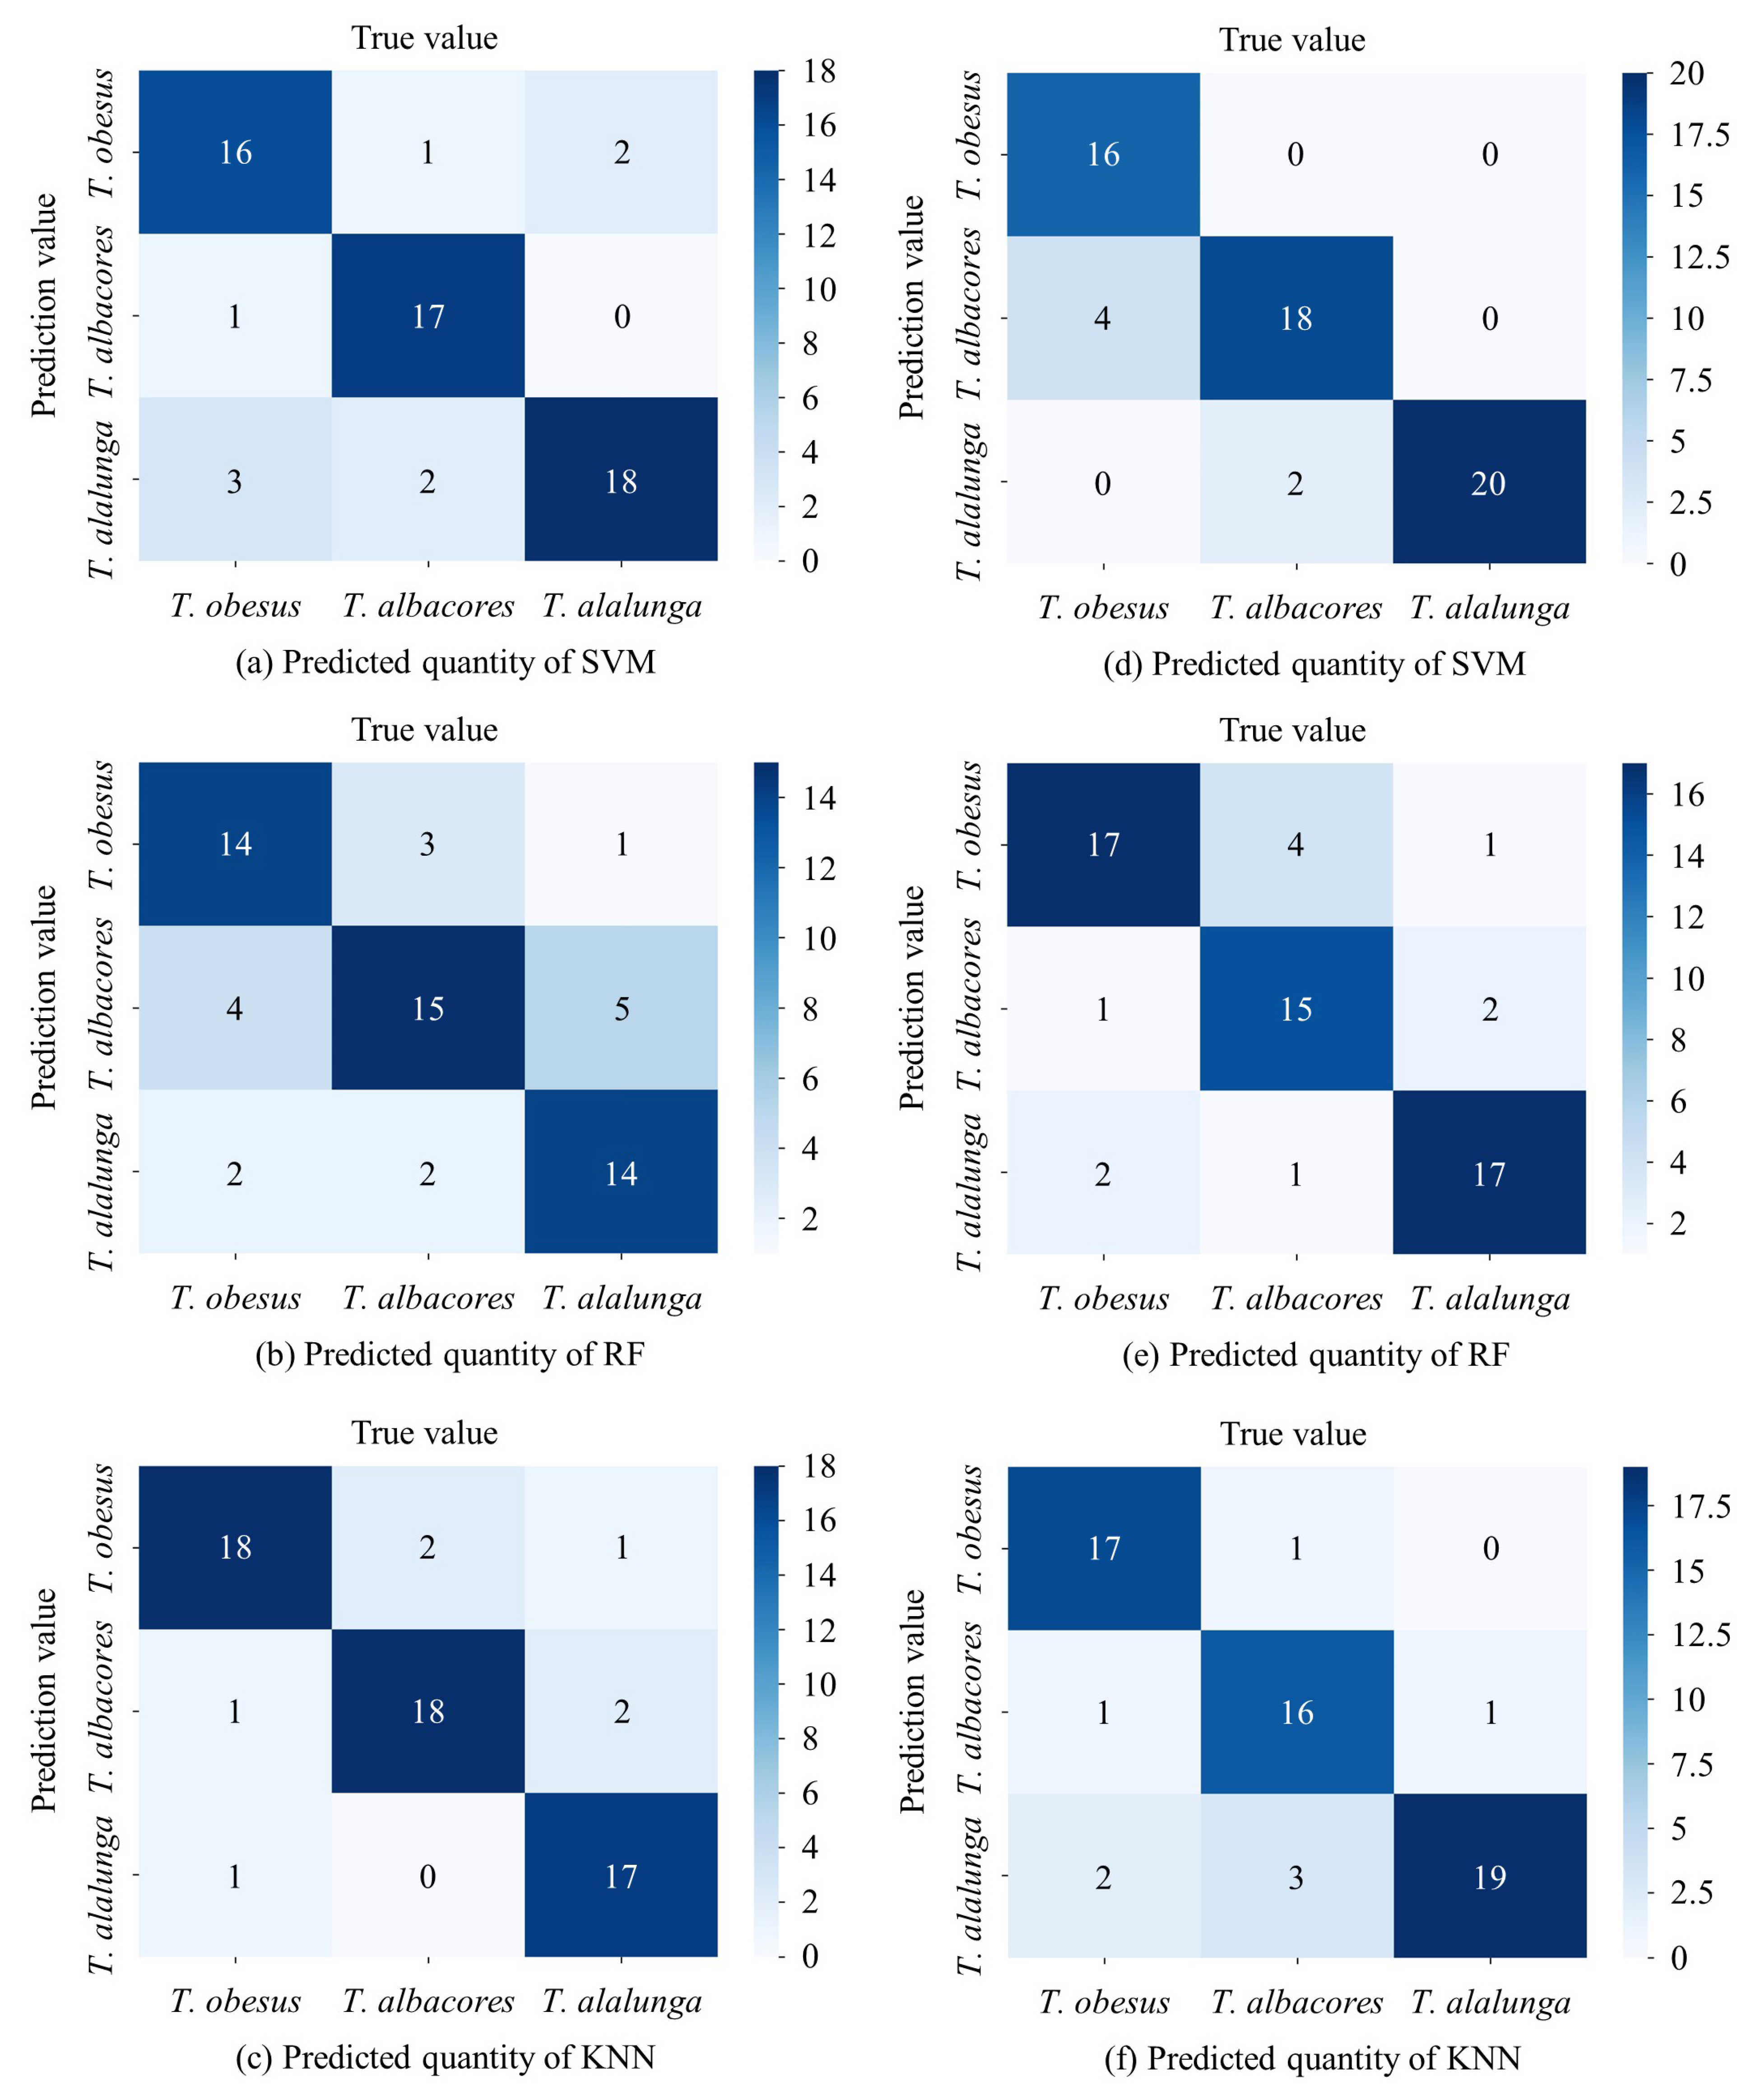
2.2.7. Confusion Matrix
2.2.8. Data Processing
3. Results
3.1. Visualization of Tuna Morphology
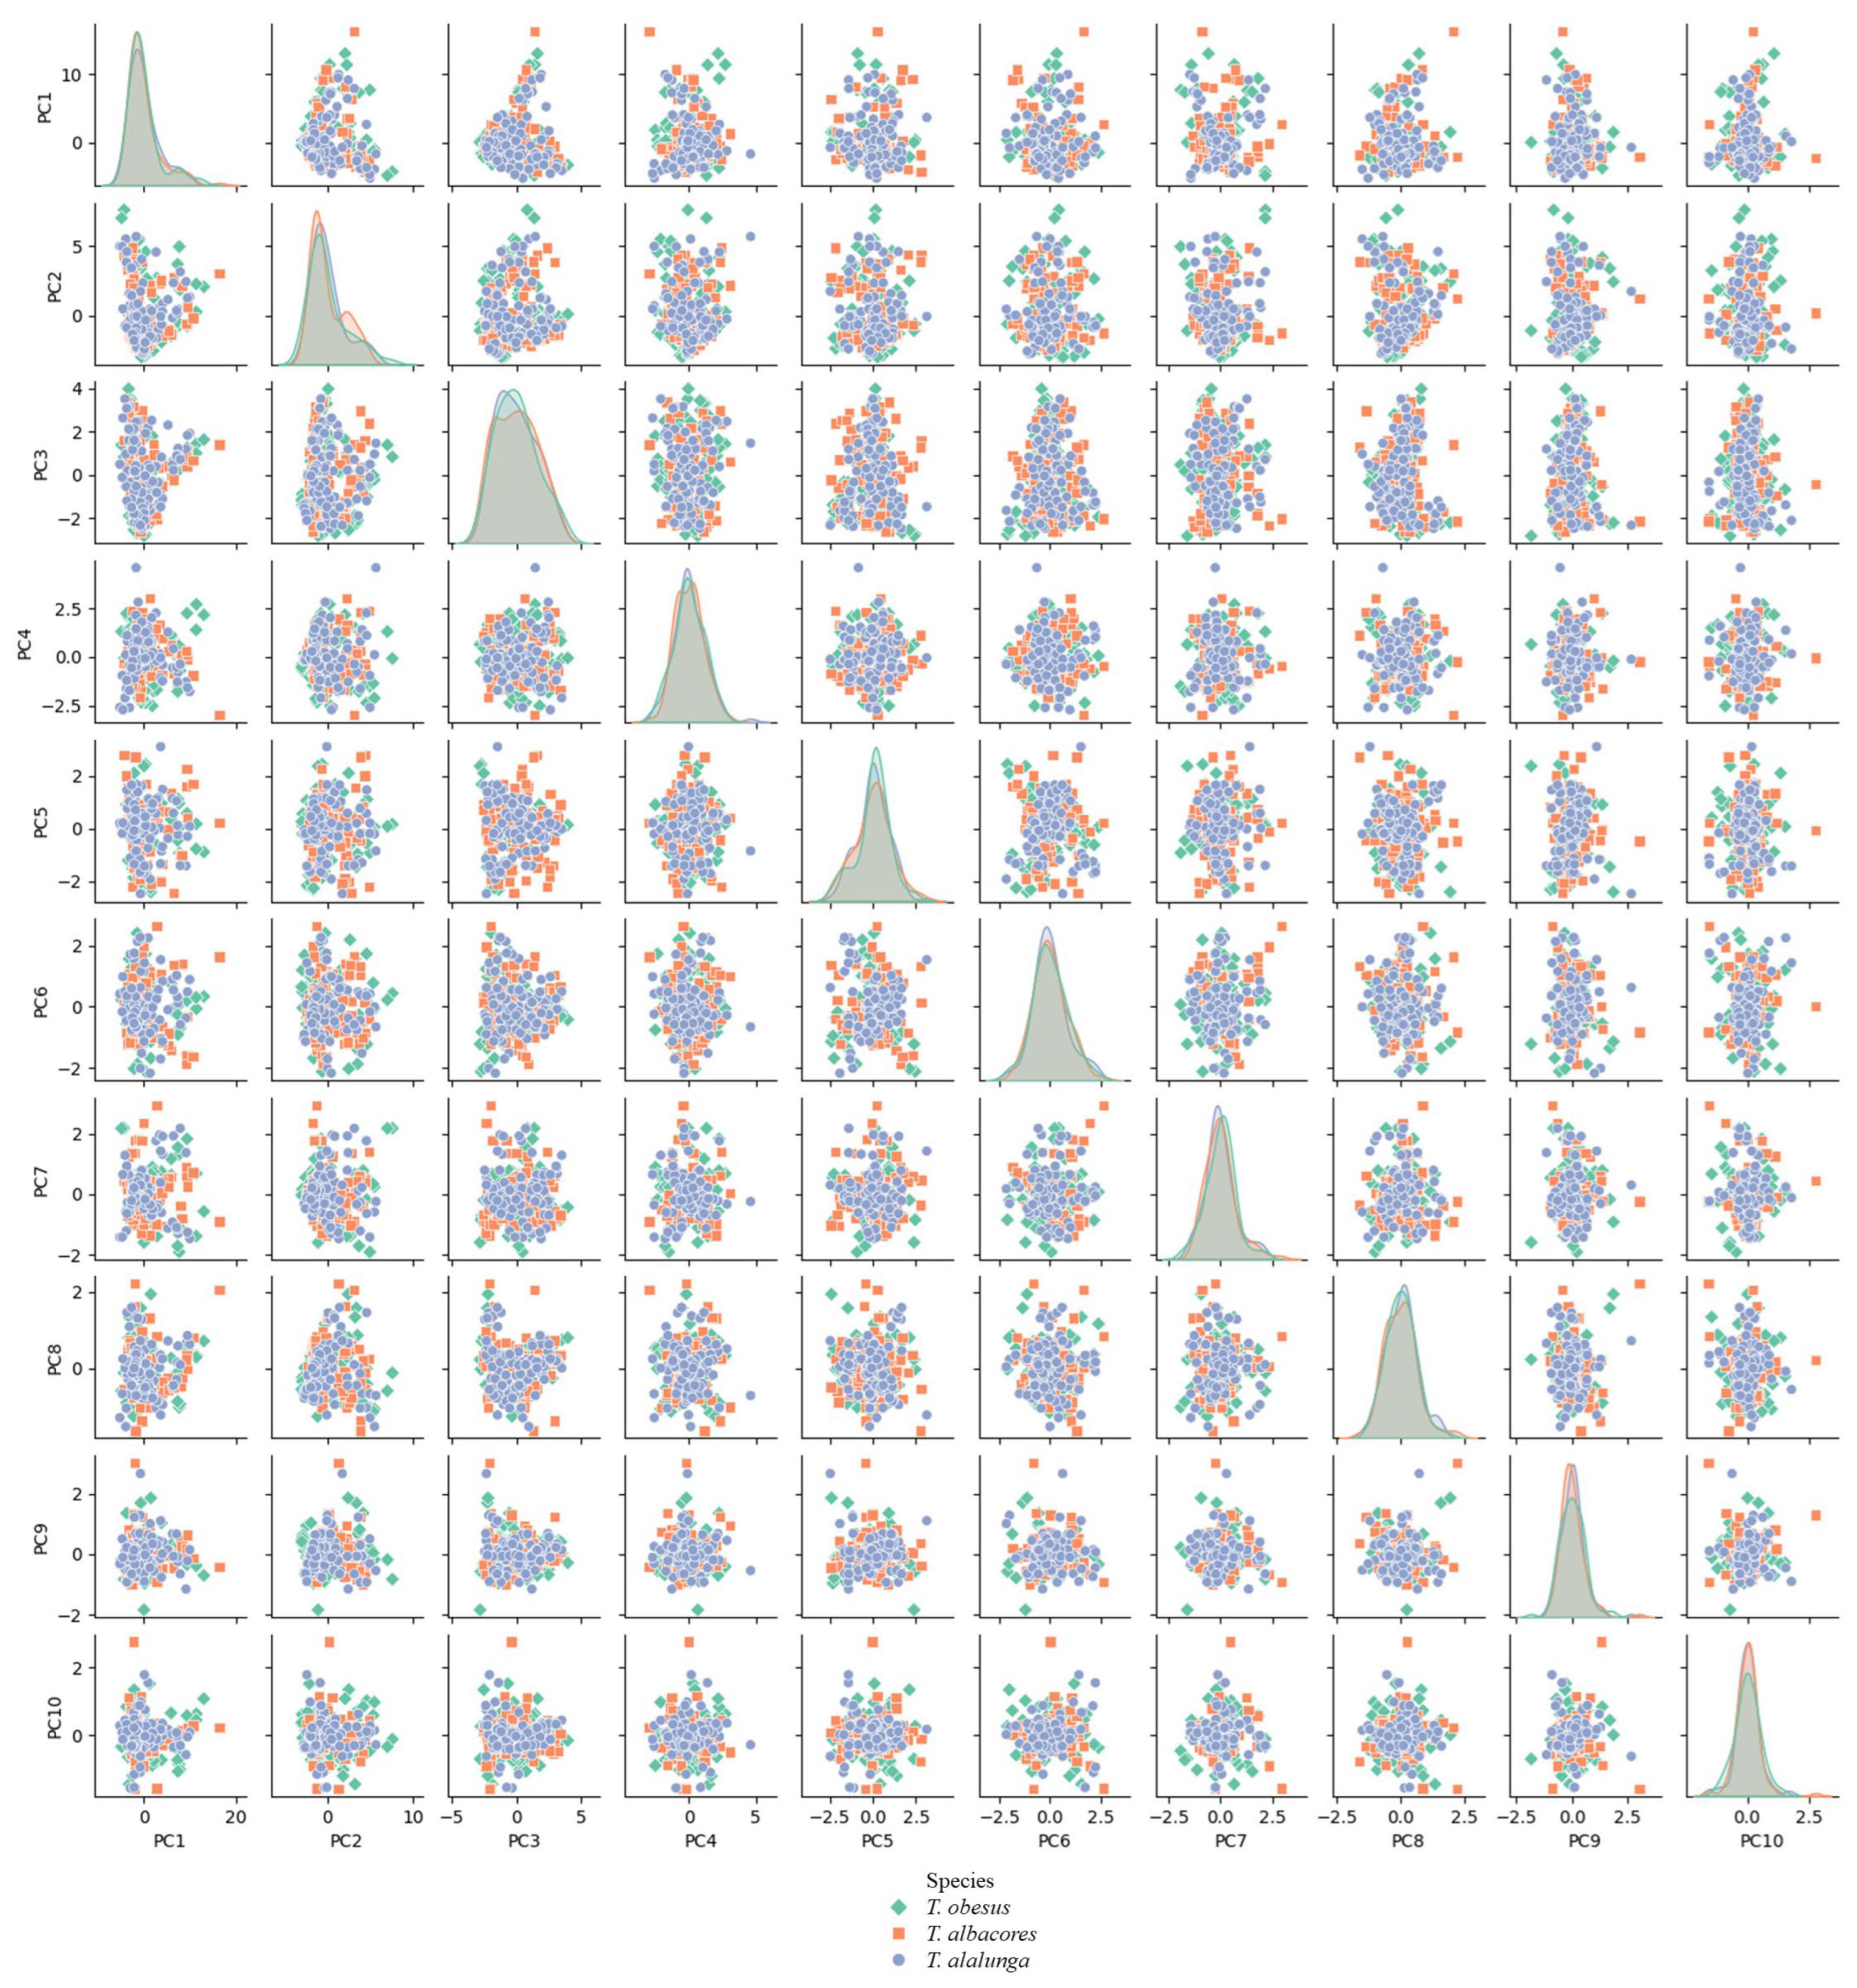
3.2. Principal Component Analysis of Thunnus Species
3.3. Evaluation Metrics of Different Machine Learning Algorithms
3.4. ROC Curves and AUC Values of Thunnus Species
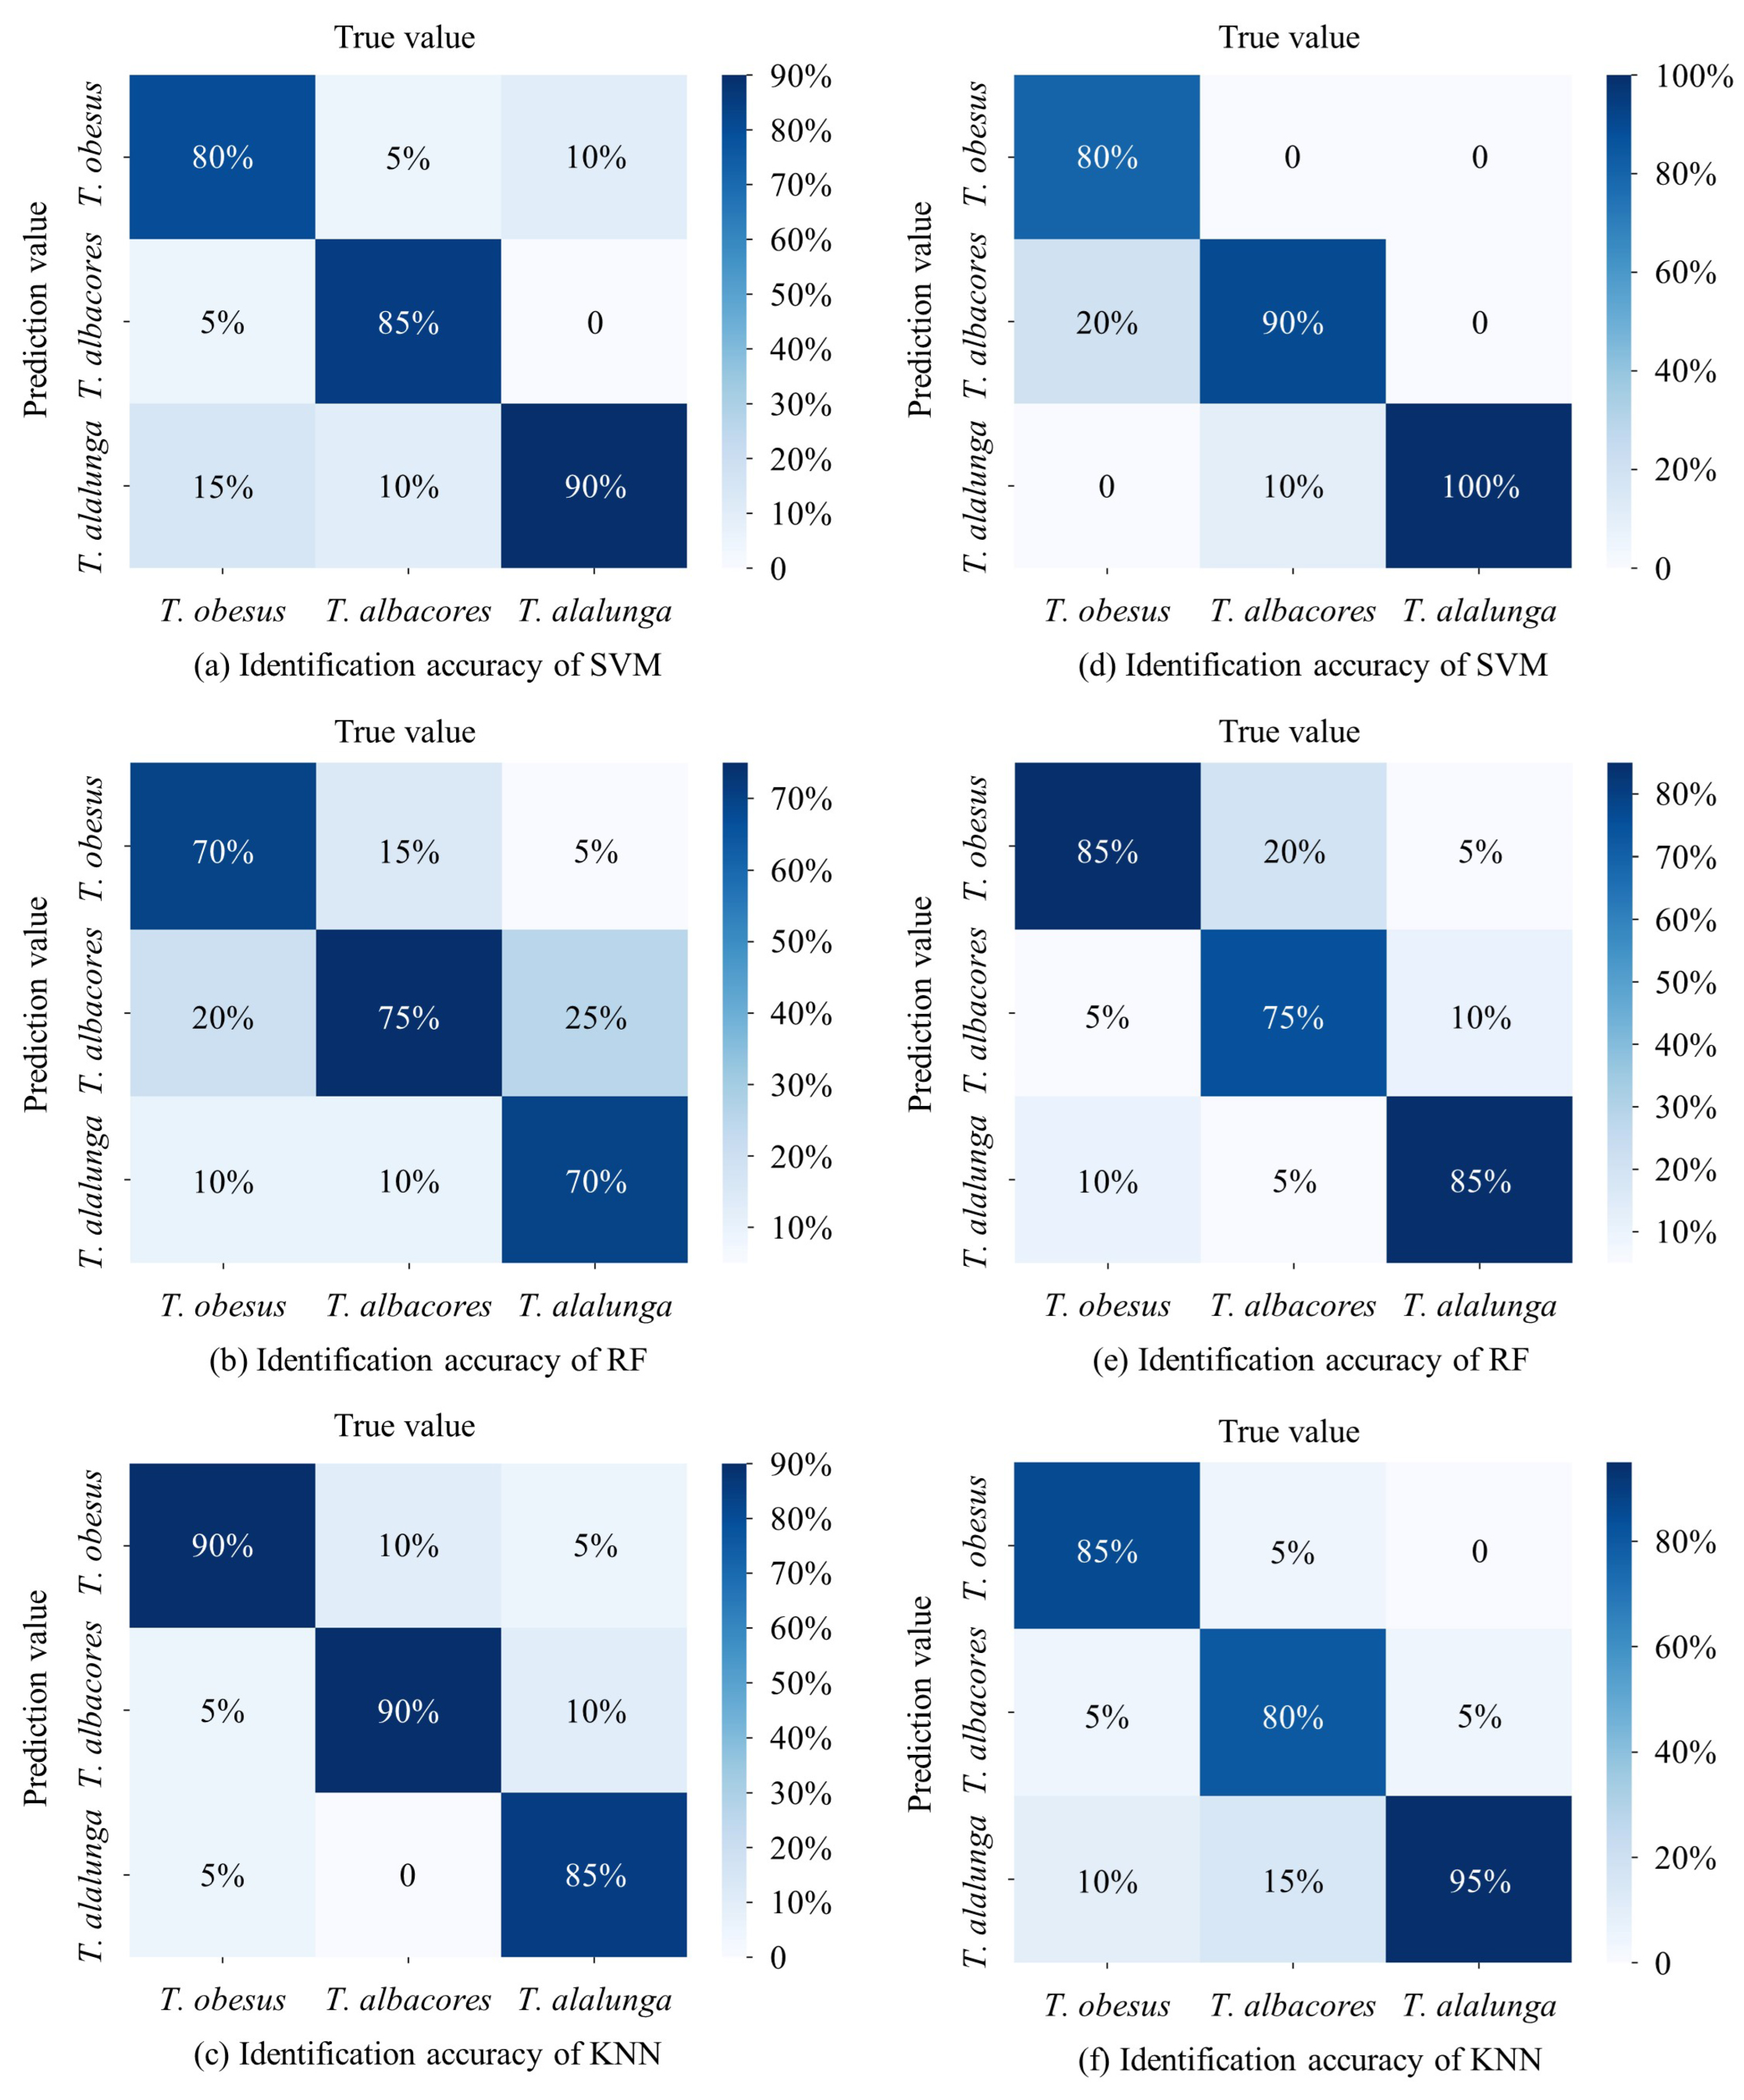
3.5. Comparison of EFT Features and Deep Features Using Confusion Matrix
4. Discussion
4.1. Visual Analysis of Morphology of Genus Thunnus Species
4.2. Automated Identification of Different Tuna Species Using Machine Learning Algorithms
5. Conclusions
Author Contributions
Funding
Institutional Review Board Statement
Data Availability Statement
Acknowledgments
Conflicts of Interest
References
- Wang, H.; Zhang, S.; Zhao, S.; Lu, J.; Wang, Y.; Li, D.; Zhao, R. Fast detection of cannibalism behavior of juvenile fish based on deep learning. Comput. Electron. Agric. 2022, 198, 107033. [Google Scholar] [CrossRef]
- McCluney, J.K.; Anderson, C.M.; Anderson, J.L. The fishery performance indicators for global tuna fisheries. Nat. Commun. 2019, 10, 1641. [Google Scholar] [CrossRef] [PubMed] [Green Version]
- Herpandi, N.H.; Rosma, A.; Wan Nadiah, W.A. The tuna fishing industry: A new outlook on fish protein hydrolysates. Compr. Rev. Food Sci. Food Saf. 2011, 10, 195–207. [Google Scholar] [CrossRef]
- Mata, W.; Chanmalee, T.; Punyasuk, N.; Thitamadee, S. Simple PCR-RFLP detection method for genus and species-authentication of four types of tuna used in canned tuna industry. Food Control. 2020, 108, 106842. [Google Scholar] [CrossRef]
- Lin, Q.; Chen, Y.; Zhu, J. A comparative analysis of the ecological impacts of Chinese tuna longline fishery on the Eastern Pacific Ocean. Ecol. Indic. 2022, 143, 109284. [Google Scholar] [CrossRef]
- Guisande, C.; Manjarrés-Hernández, A.; Pelayo-Villamil, P.; Granado-Lorencio, C.; Riveiro, I.; Acuña, A.; Prieto-Piraquive, E.; Janeiro, E.; Matías, J.M.; Patti, C.; et al. IPez: An expert system for the taxonomic identification of fishes based on machine learning techniques. Fish. Res. 2010, 102, 240–247. [Google Scholar] [CrossRef]
- Batubara, A.S.; Muchlisin, Z.A.; Efizon, D.; Elvyra, R.; Fadli, N.; Irham, M. Morphometric variations of the genus Barbonymus (Pisces, Cyprinidae) harvested from Aceh waters, Indonesia. Fish. Aquat. Life 2018, 26, 231–237. [Google Scholar] [CrossRef]
- Rahayu, S.R.; Muchlisin, Z.A.; Fadli, N. Morphometric and genetic variations of two dominant species of snappers (Lutjanidae) harvested from the Northern Coast of Aceh waters, Indonesia. Zool. Anz. 2023, 303, 26–32. [Google Scholar] [CrossRef]
- Díaz-Cruz, J.A.; Alvarado-Ortega, J.; Ramírez-Sánchez, M.M.; Bernard, E.L.; Allington-Jones, L.; Graham, M. Phylogenetic morphometrics, geometric morphometrics and the Mexican fossils to understand evolutionary trends of enchodontid fishes. J. S. Am. Earth. Sci. 2021, 111, 103492. [Google Scholar] [CrossRef]
- Li, Y.; Burridge, C.P.; Lv, Y.; Peng, Z. Morphometric and population genomic evidence for species divergence in the Chimarrichthys fish complex of the Tibetan Plateau. Mol. Phylogenet. Evol. 2021, 159, 107117. [Google Scholar] [CrossRef]
- Hanif, M.A.; Siddik, M.A.; Islam, M.A.; Chaklader, M.R.; Nahar, A. Multivariate morphometric variability in sardine, Amblygaster clupeoides (Bleeker, 1849), from the Bay of Bengal coast, Bangladesh. J. Basic Appl. Zool. 2019, 80, 53. [Google Scholar] [CrossRef] [Green Version]
- Nur, F.M.; Batubara, A.S.; Fadli, N.; Rizal, S.; Siti-Azizah, M.N.; Muchlisin, Z.A. Elucidating species diversity of genus Betta from Aceh waters Indonesia using morphometric and genetic data. Zool. Anz. 2022, 296, 129–140. [Google Scholar] [CrossRef]
- Yulianto, D.; Indra, I.; Batubara, A.S.; Nur, F.M.; Rizal, S.; Siti-Azizah, M.N.; Muchlisin, Z.A. Morphometrics and genetics variations of mullets (Pisces: Mugilidae) from Aceh waters, Indonesia. Biodiversitas J. Biol. Divers. 2020, 21, 3422–3430. [Google Scholar] [CrossRef]
- Zhao, S.; Zhang, S.; Liu, J.; Wang, H.; Zhu, J.; Li, D.; Zhao, R. Application of machine learning in intelligent fish aquaculture: A review. Aquaculture 2021, 540, 736724. [Google Scholar] [CrossRef]
- Liakos, K.G.; Busato, P.; Moshou, D.; Pearson, S.; Bochtis, D. Machine learning in agriculture: A review. Sensors 2018, 18, 2674. [Google Scholar] [CrossRef] [Green Version]
- Alsmadi, M.K.; Almarashdeh, I. A survey on fish classification techniques. J. King. Saud. Univ. Com. Inf. Sci. 2020, 34, 1625–1638. [Google Scholar] [CrossRef]
- Hu, J.; Li, D.; Duan, Q.; Han, Y.; Chen, G.; Si, X. Fish species classification by color, texture and multi-class support vector machine using computer vision. Comput. Electron. Agric. 2012, 88, 133–140. [Google Scholar] [CrossRef]
- Xu, X.; Li, W.; Duan, Q. Transfer learning and SE-ResNet152 networks-based for small-scale unbalanced fish species identification. Comput. Electron. Agric. 2021, 180, 105878. [Google Scholar] [CrossRef]
- Ogunlana, S.O.; Olabode, O.; Oluwadare, S.A.A.; Iwasokun, G.B. Fish classification using support vector machine. Afr. J. Comput. ICT 2015, 8, 75–82. [Google Scholar]
- Tharwat, A.; Hemedan, A.A.; Hassanien, A.E.; Gabel, T. A biometric-based model for fish species classification. Fish. Res. 2018, 204, 324–336. [Google Scholar] [CrossRef]
- Andayani, U.; Wijaya, A.; Rahmat, R.F.; Siregar, B.; Syahputra, M.F. Fish species classification using probabilistic neural network. J. Phys. Conf. Ser. 2019, 1235, 012094. [Google Scholar] [CrossRef]
- Strachan, N.J.C.; Nesvadba, P.; Allen, A.R. Fish species recognition by shape analysis of images. Pattern. Recogn. 1990, 23, 539–544. [Google Scholar] [CrossRef]
- Salman, A.; Jalal, A.; Shafait, F.; Mian, A.; Shortis, M.; Seager, J.; Harvey, E. Fish species classification in unconstrained underwater environments based on deep learning. Limnol. Oceanogr. Methods 2016, 14, 570–585. [Google Scholar] [CrossRef] [Green Version]
- Taheri-Garavand, A.; Nasiri, A.; Banan, A.; Zhang, Y.D. Smart deep learning-based approach for non-destructive freshness diagnosis of common carp fish. J. Food. Eng. 2020, 278, 109930. [Google Scholar] [CrossRef]
- Bui, H.M.; Lech, M.; Cheng, E.; Neville, K.; Burnett, I.S. Object recognition using deep convolutional features transformed by a recursive network structure. IEEE Access 2016, 4, 10059–10066. [Google Scholar] [CrossRef]
- Iqbal, M.A.; Wang, Z.; Ali, Z.A.; Riaz, S. Automatic fish species classification using deep convolutional neural networks. Wireless. Pers. Commun. 2021, 116, 1043–1053. [Google Scholar] [CrossRef]
- Khan, S.; Yairi, T. A review on the application of deep learning in system health management. Mech. Syst. Signal. Process. 2018, 107, 241–265. [Google Scholar] [CrossRef]
- Rathi, D.; Jain, S.; Indu, S. Underwater fish species classification using convolutional neural network and deep learning. In Proceedings of the 2017 Ninth International Conference on Advances in Pattern Recognition (ICAPR), Bangalore, India, 27–30 December 2017. [Google Scholar]
- Villon, S.; Mouillot, D.; Chaumont, M.; Darling, E.S.; Subsol, G.; Claverie, T.; Villéger, S. A deep learning method for accurate and fast identification of coral reef fishes in underwater images. Ecol. Inform. 2018, 48, 238–244. [Google Scholar] [CrossRef] [Green Version]
- Rekha, B.S.; Srinivasan, G.N.; Reddy, S.K.; Kakwani, D.; Bhattad, N. Fish detection and classification using convolutional neural networks. In Computational Vision and Bio-Inspired Computing: ICCVBIC 2019; Springer: Cham, Switzerland, 2020. [Google Scholar]
- Tamou, A.B.; Benzinou, A.; Nasreddine, K. Underwater live fish recognition by deep learning. In Image and Signal Processing; Springer: Cham, Switzerland, 2018. [Google Scholar]
- Deep, B.V.; Dash, R. Underwater fish species recognition using deep learning techniques. In Proceedings of the 2019 6th International Conference on Signal Processing and Integrated Networks (SPIN), Noida, India, 7–8 March 2019. [Google Scholar]
- Kuhl, F.P.; Giardina, C.R. Elliptic Fourier features of a closed contour. Comput. Graph. Image Process. 1982, 18, 236–258. [Google Scholar] [CrossRef]
- Fauzan, M.H.N.; Rakun, E.; Hardianto, D. Feature Extraction from Smartphone Images by Using Elliptical Fourier Descriptor, Centroid and Area for Recognizing Indonesian Sign Language SIBI (Sistem Isyarat Bahasa Indonesia). In Proceedings of the 2019 2nd International Conference on Intelligent Autonomous Systems (ICoIAS), Singapore, 28 February–2 March 2019. [Google Scholar]
- Wei, S.J.; Al Riza, D.F.; Nugroho, H. Comparative study on the performance of deep learning implementation in the edge computing: Case study on the plant leaf disease identification. J. Agric. Food Res. 2022, 10, 100389. [Google Scholar] [CrossRef]
- Simonyan, K.; Zisserman, A. Very deep convolutional networks for large-scale image recognition. arXiv Prepr. 2014, arXiv:1409.1556. [Google Scholar]
- Ren, L.; Tian, Y.; Yang, X.; Wang, Q.; Wang, L.; Geng, X.; Wang, K.; Du, Z.; Lia, Y.; Lin, H. Rapid identification of fish species by laser-induced breakdown spectroscopy and Raman spectroscopy coupled with machine learning methods. Food. Chem. 2023, 400, 134043. [Google Scholar] [CrossRef]
- Zhu, Y.; Weiyi, X.U.; Luo, G.; Wang, H.; Yang, J.; Lu, W. Random Forest enhancement using improved Artificial Fish Swarm for the medial knee contact force prediction. Artif. Intell. Med. 2020, 103, 101811. [Google Scholar] [CrossRef] [PubMed]
- Politikos, D.V.; Petasis, G.; Chatzispyrou, A.; Mytilineou, C.; Anastasopoulou, A. Automating fish age estimation combining otolith images and deep learning: The role of multitask learning. Fish Res. 2021, 242, 106033. [Google Scholar] [CrossRef]
- Dogan, M.; Taspinar, Y.S.; Cinar, I.; Kursun, R.; Ozkan, I.A.; Koklu, M. Dry bean cultivars classification using deep cnn features and salp swarm algorithm based extreme learning machine. Comput. Electron. Agric. 2023, 204, 107575. [Google Scholar] [CrossRef]
- Hsieh, C.L.; Chang, H.Y.; Chen, F.H.; Liou, J.H.; Chang, S.K.; Lin, T.T. A simple and effective digital imaging approach for tuna fish length measurement compatible with fishing operations. Comput. Electron. Agric. 2011, 75, 44–51. [Google Scholar] [CrossRef]
- Elliott, M.; Whitfield, A.K.; Potter, I.C.; Blaber, S.J.; Cyrus, D.P.; Nordlie, F.G.; Harrison, T.D. The guild approach to categorizing estuarine fish assemblages: A global review. Fish Fish. 2007, 8, 241–268. [Google Scholar] [CrossRef]
- Whitfield, A.K.; Elliott, M. Fishes as indicators of environmental and ecological changes within estuaries: A review of progress and some suggestions for the future. J. Fish. Biol. 2002, 61, 229–250. [Google Scholar] [CrossRef]
- Canty, S.W.; Truelove, N.K.; Preziosi, R.F.; Chenery, S.; Horstwood, M.A.; Box, S.J. Evaluating tools for the spatial management of fisheries. J. Appl. Ecol. 2018, 55, 2997–3004. [Google Scholar] [CrossRef]
- Floeter, S.R.; Bender, M.G.; Siqueira, A.C.; Cowman, P.F. Phylogenetic perspectives on reef fish functional traits. Biol. Rev. 2018, 93, 131–151. [Google Scholar] [CrossRef]
- Strachan, N.J.C. Length measurement of fish by computer vision. Comput. Electron. Agric. 1993, 8, 93–104. [Google Scholar] [CrossRef]
- Khotimah, W.N.; Arifin, A.Z.; Yuniarti, A.; Wijaya, A.Y.; Navastara, D.A.; Kalbuadi, M.A. Tuna fish classification using decision tree algorithm and image processing method. In Proceedings of the 2015 International Conference on Computer, Control, Informatics and its Applications (IC3INA), Bandung, Indonesia, 5–7 October 2015. [Google Scholar]
- Almeida, P.R.; Monteiro-Neto, C.; Tubino, R.A.; Costa, M.R. Variações na forma do otólito sagitta de Coryphaena hippurus (Actinopterygii: Coryphaenidae) em uma área de ressurgência na costa sudoeste do Oceano Atlântico. Iheringia. Série Zool. 2020, 110. [Google Scholar] [CrossRef]
- Bakhshalizadeh, S.; Abbasi, K.; Rostamzadeh Liafuie, A.; Bani, A.; Pavithran, A.; Tiralongo, F. Morphometric Analyses of Phenotypic Plasticity in Habitat Use in Two Caspian Sea Mullets. J. Mar. Sci. Eng. 2022, 10, 1398. [Google Scholar] [CrossRef]
- Saputra, W.A.; Herumurti, D. Integration GLCM and geometric feature extraction of region of interest for classifying tuna. In Proceedings of the 2016 International Conference on Information & Communication Technology and Systems (ICTS), Surabaya, Indonesia, 12 October 2016. [Google Scholar]
- Qiao, M.; Wang, D.; Tuck, G.N.; Little, L.R.; Punt, A.E.; Gerner, M. Deep learning methods applied to electronic monitoring data: Automated catch event detection for longline fishing. ICES J. Mar. Sci. 2021, 78, 25–35. [Google Scholar] [CrossRef]
- Khokher, M.R.; Little, L.R.; Tuck, G.N.; Smith, D.V.; Qiao, M.; Devine, C.; O’Neill, H.; Pogonoski, J.; Arangio, R.; Wang, D. Early lessons in deploying cameras and artificial intelligence technology for fisheries catch monitoring: Where machine learning meets commercial fishing. Can. J. Fish. Aquat. Sci. 2022, 79, 257–266. [Google Scholar] [CrossRef]


| Author | Model | Accuracy |
|---|---|---|
| Rathi et al. (2017) [28] | CNN | 96.3% |
| Villon et al. (2018) [29] | CNN | 94.9% |
| Rekha et al. (2020) [30] | CNN | 92% |
| Iqbal et al. (2021) [26] | Original AlexNet | 87% |
| Iqbal et al. (2021) [26] | Improved AlexNet | 90% |
| Principal Components | EFT Features | Deep Features |
|---|---|---|
| PC1 | 27% | 42% |
| PC2 | 16% | 15% |
| PC3 | 10% | 9% |
| PC4 | 8% | 5% |
| PC5 | 5% | 3% |
| PC6 | 5% | 3% |
| PC7 | 4% | 2% |
| PC8 | 3% | 1% |
| PC9 | 3% | 1% |
| PC10 | 2% | 1% |
| Cumulative contribution rate | 83% | 82% |
| Algorithm | Species | Precision | Recall | F1-Score |
|---|---|---|---|---|
| SVM | T. obesus | 84% | 80% | 82% |
| T. albacores | 94% | 85% | 89% | |
| T. alalunga | 78% | 90% | 84% | |
| mean | 85% | 85% | 85% | |
| RF | T. obesus | 78% | 70% | 74% |
| T. albacores | 62% | 75% | 68% | |
| T. alalunga | 78% | 70% | 74% | |
| mean | 73% | 72% | 72% | |
| KNN | T. obesus | 86% | 90% | 88% |
| T. albacores | 86% | 90% | 88% | |
| T. alalunga | 94% | 85% | 89% | |
| mean | 89% | 88% | 88% |
| Algorithm | Species | Precision | Recall | F1-Score |
|---|---|---|---|---|
| SVM | T. obesus | 100% | 80% | 89% |
| T. albacores | 82% | 90% | 86% | |
| T. alalunga | 91% | 100% | 95% | |
| mean | 91% | 90% | 90% | |
| RF | T. obesus | 77% | 85% | 81% |
| T. albacores | 83% | 75% | 79% | |
| T. alalunga | 85% | 85% | 85% | |
| mean | 82% | 82% | 82% | |
| KNN | T. obesus | 94% | 85% | 89% |
| T. albacores | 89% | 80% | 84% | |
| T. alalunga | 79% | 95% | 86% | |
| mean | 87% | 87% | 86% |
Disclaimer/Publisher’s Note: The statements, opinions and data contained in all publications are solely those of the individual author(s) and contributor(s) and not of MDPI and/or the editor(s). MDPI and/or the editor(s) disclaim responsibility for any injury to people or property resulting from any ideas, methods, instructions or products referred to in the content. |
© 2023 by the authors. Licensee MDPI, Basel, Switzerland. This article is an open access article distributed under the terms and conditions of the Creative Commons Attribution (CC BY) license (https://creativecommons.org/licenses/by/4.0/).
Share and Cite
Ou, L.; Liu, B.; Chen, X.; He, Q.; Qian, W.; Zou, L. Automated Identification of Morphological Characteristics of Three Thunnus Species Based on Different Machine Learning Algorithms. Fishes 2023, 8, 182. https://doi.org/10.3390/fishes8040182
Ou L, Liu B, Chen X, He Q, Qian W, Zou L. Automated Identification of Morphological Characteristics of Three Thunnus Species Based on Different Machine Learning Algorithms. Fishes. 2023; 8(4):182. https://doi.org/10.3390/fishes8040182
Chicago/Turabian StyleOu, Liguo, Bilin Liu, Xinjun Chen, Qi He, Weiguo Qian, and Leilei Zou. 2023. "Automated Identification of Morphological Characteristics of Three Thunnus Species Based on Different Machine Learning Algorithms" Fishes 8, no. 4: 182. https://doi.org/10.3390/fishes8040182