
Early Detection of Clustered Trojan Attacks on Integrated Circuits Using Transition Delay Fault Model

Department of Electronics and Communication Engineering, Amrita School of Engineering, Amrita Vishwa Vidyapeetham, Coimbatore 641112, India
*
Author to whom correspondence should be addressed.
Cryptography 2023, 7(1), 4; https://doi.org/10.3390/cryptography7010004
Submission received: 9 October 2022
/
Revised: 30 December 2022
/
Accepted: 19 January 2023
/
Published: 28 January 2023
(This article belongs to the Special Issue Feature Papers in Hardware Security II)
Abstract
:The chances of detecting a malicious reliability attack induced by an offshore foundry are grim. The hardware Trojans affecting a circuit’s reliability do not tend to alter the circuit layout. These Trojans often manifest as an increased delay in certain parts of the circuit. These delay faults easily escape during the integrated circuits (IC) testing phase, hence are difficult to detect. If additional patterns to detect delay faults are generated during the test pattern generation stage, then reliability attacks can be detected early without any hardware overhead. This paper proposes a novel method to generate patterns that trigger Trojans without altering the circuit model. The generated patterns’ ability to diagnose clustered Trojans are also analyzed. The proposed method uses only single fault simulation to detect clustered Trojans, thereby reducing the computational complexity. Experimental results show that the proposed algorithm has a detection ratio of 99.99% when applied on ISCAS’89, ITC’99 and IWLS’05 benchmark circuits. Experiments on clustered Trojans indicate a 46% and 34% improvement in accuracy and resolution compared to a standard Automatic Test Pattern Generator (ATPG)Tool.
1. Introduction
Faults occurring in a computer system have historically been related to integrated circuit (IC) fabrication defects. However, with the advent of hardware Trojan-based attacks, there is a high probability of defects being intentionally induced in the circuit. The trend of outsourcing fabrication has increased the vulnerability of ICs to Trojan attacks. These hardware Trojans alter not only the functionality of the circuit but also degrade their reliability. Hence, they are difficult to identify during the IC testing phase. Special attention must be given to preventing and identifying such attacks. Split fabrication has proven effective in reducing the Trojan attacks on the critical parts of the IC. However, if such an attack has occurred, it must be identified as early as possible in the manufacturing cycle.
Methods mentioned in the literature for Trojan detection can be classified broadly as destructive and non-destructive [1]. Destructive methods include physical inspection and advanced image processing techniques. The major disadvantages of this method are low detection speed, high cost and poor coverage of Trojan types. The non-destructive methods include logic testing-based approaches and side channel analysis. In the logic testing-based approach, the activation probability of a hardware Trojan is usually low. Hence, standard test patterns have low chances of detecting a Trojan. For this reason, researchers focused on improving the existing testing techniques to increase Trojan detection. The advantage of the testing-based approach is that it is non-invasive and can identify Trojans inserted at different design flow levels. The side channel analysis method is also powerful to detect malicious modifications in an IC. This technique uses an IC’s physical characteristics (power and EM radiations) to detect a Trojan’s presence. However, this method requires a golden IC for comparison. Factors other than hardware Trojans can also alter the physical characteristics. Hence, it is difficult to determine the cause behind the abnormal behavior [2,3,4]. Hardware Trojan or malicious modifications in a circuit include:
- (a)
- Modification of the functional behavior: Inserting logic gates at an intermediate node of the IC.
- (b)
- Electrical modifications: Adding extra load capacitance at the output of logic gates, thereby increasing the delay of the path.
- (c)
- Transistor ageing: Increasing the threshold voltage by inducing Negative-Bias Temperature Instability (NBTI).
Figure 1 shows examples of the three types of hardware Trojans that affect the functionality and reliability of a circuit. The functional modifications in a circuit can be easily detected using test patterns generated by any standard Automatic Test Pattern Generator (ATPG) tool. However, detecting electrical modifications and transistor ageing requires specific patterns that can trigger such attacks. This paper refers to such patterns as Trojan Triggering Patterns (TTP). These attacks have an adverse effect on the reliability of the IC. Hence, they are commonly termed as reliability attacks. It is nearly impossible to identify them during destructive physical analysis. This paper proposes a novel Trojan detection technique using Transition Delay Fault (TDF) identification. The proposed method can identify reliability attacks without using any hardware overhead.
It is mentioned in [5,6] that the Trojan-infected nodes tend to cluster. Detection of clustered Trojans becomes a laborious task as the output responses interact and obscure some faulty responses. Hence, the proposed method enhances the Trojan detection accuracy by using K-means clustering algorithm.
Every hardware Trojan has malicious intent. If the Trojan attack aims at leaking safety critical information from the IC, then the Trojans will be targeted on specific modules in the IC. Hence, clustering of Trojans is possible. Since the clustered Trojans interact and lead to masking and reinforcement effects, it is difficult to detect them. Moreover, the clustered Trojan signatures are entirely different, making their identification more time-consuming. The probability of clustered hardware Trojans may be less, but once clustered it requires a special procedure for proper identification [5,6].
The remainder of the paper is arranged as follows: Section 2 gives a brief overview of the related work in the detection of reliability attacks, and Section 3 provides a detailed understanding of the proposed TTP generation algorithm. Section 4 gives the necessary details on the proposed clustered Trojan detection procedure. Section 5 discusses the results and comparisons with existing methodologies, and finally, Section 6 concludes the paper.
2. Related Works
2.1. Hardware Trojan (HT)
The proposed method targets extremely stealthy Trojan attacks at the transistor level. Instead of adding additional circuitry, the Trojans are inserted by altering the doping concentration of the transistor. Since the modified circuit appears legitimate on all wiring layers, this family of Trojans is resistant to most detection techniques, like optical inspection and checking against “golden chips”. The process variations such as altering the nitrate concentration or increasing the temperature during the gate oxide formation create infected ICs. Such attacks tend to cluster in one functional block or even a section of the circuit block, thereby evading standard post-fabrication testing procedures [2,3]. Due to the fault masking problem observed in clustered Trojans, standard ATPG patterns cannot detect them efficiently. Moreover, the ATPG patterns are optimized for identifying faults in the critical path. Hence, the challenge here is to generate patterns that can activate a Trojan in the non-critical paths and with the possibility of fault interactions.
In this paper, a TDF is used to model the Trojan. TDF represents a fault in a circuit due to increased delay. However, patterns that can detect a TDF may not be sufficient to identify a Trojan, as it requires specific trigger conditions. Hence, the paper focuses on generating patterns to detect TDF based on various activation conditions. The paper also explores a procedure to generate test patterns that trigger clustered Trojans.
2.2. TDF Model
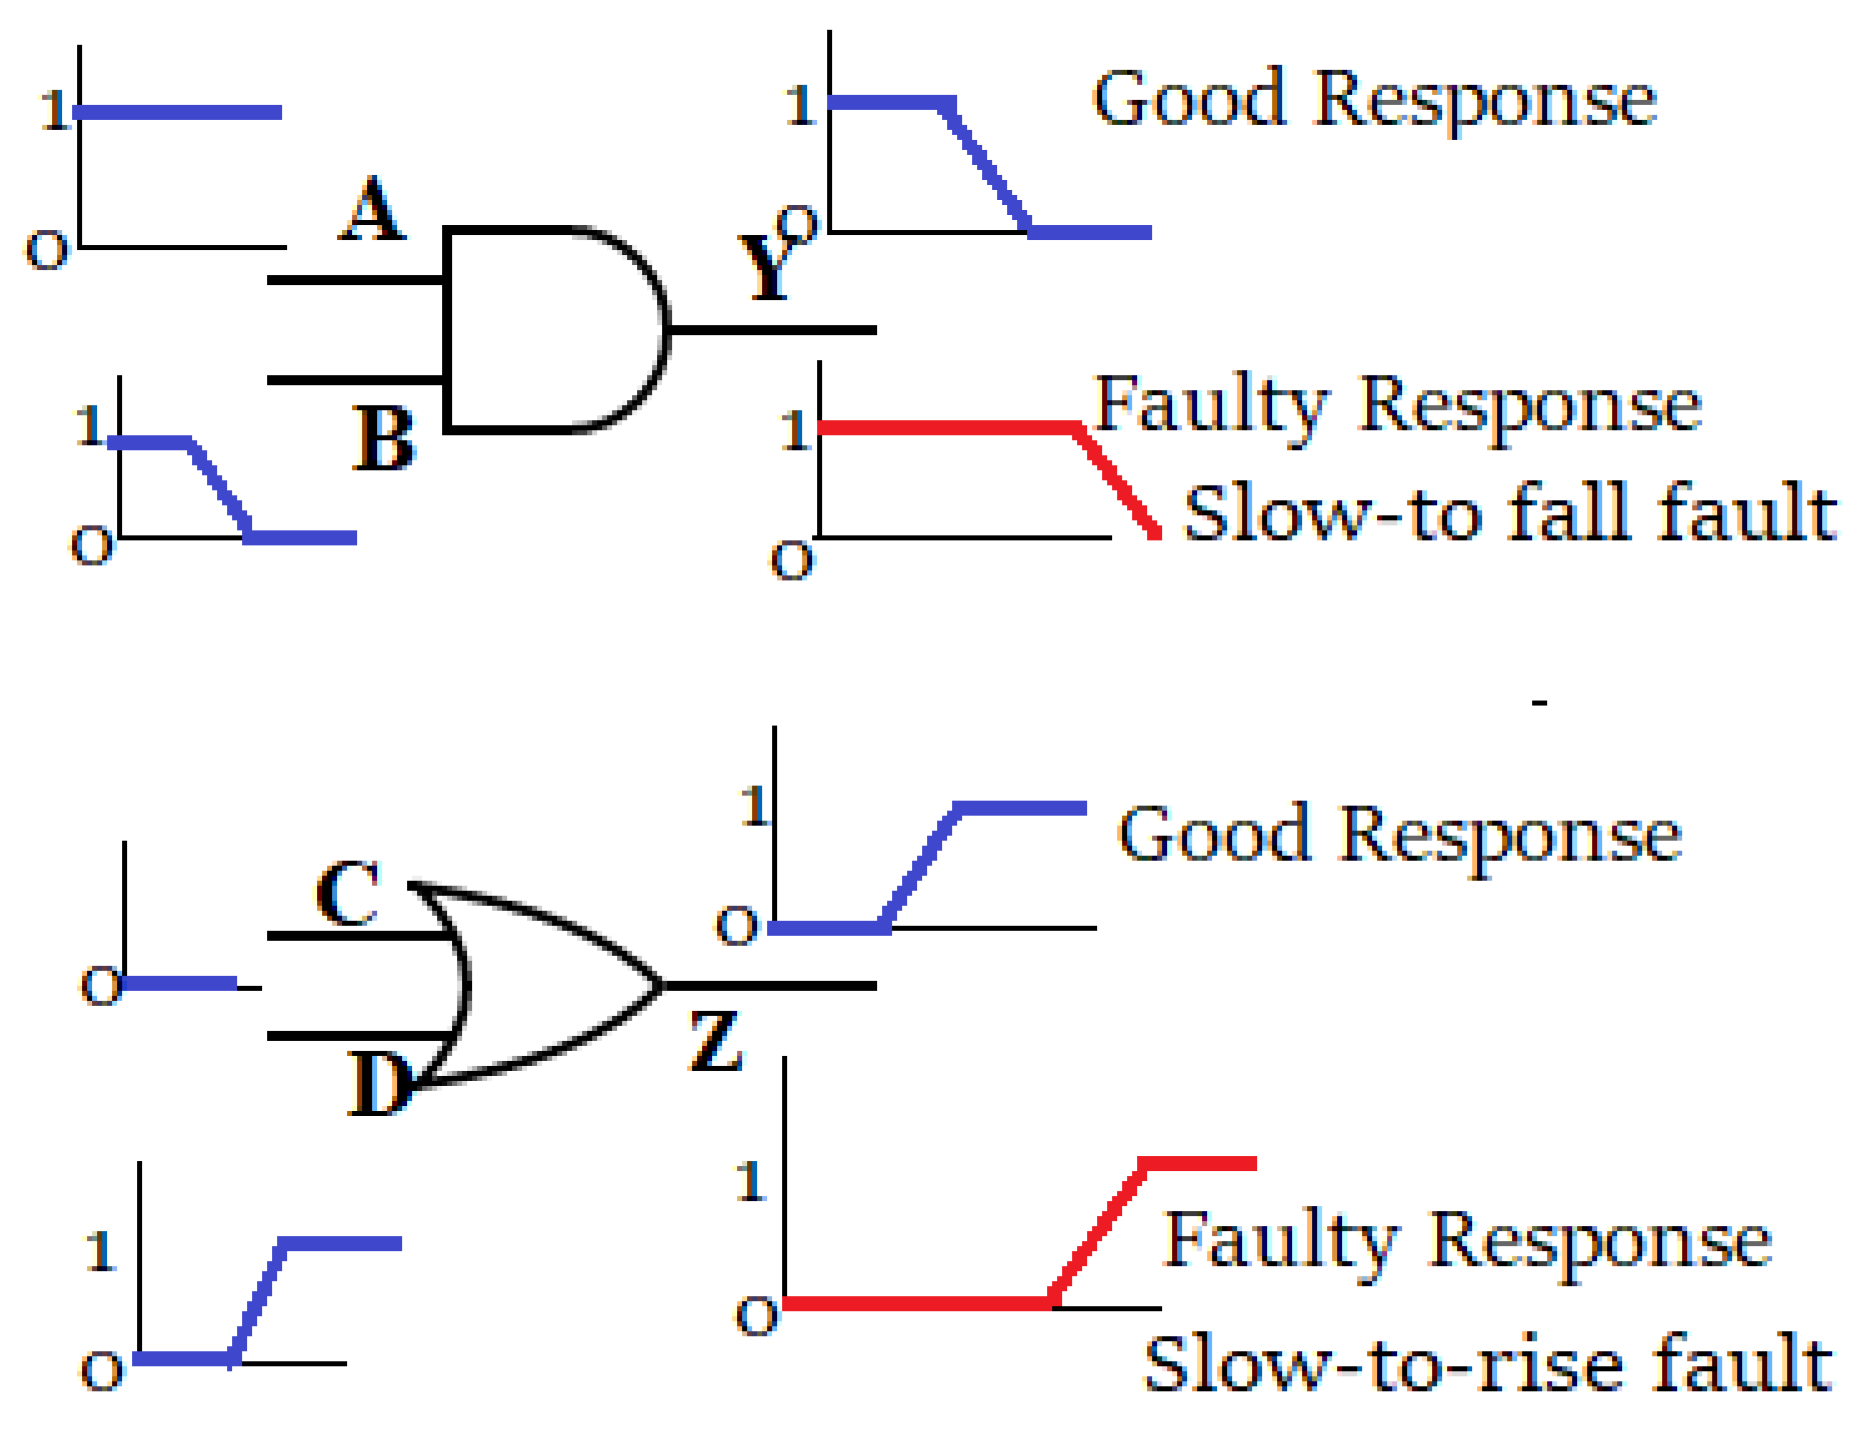
Certain Trojans do not alter the chip’s logic but can cause timing delays. These Trojans can be modelled using TDFs [7]. In the TDF model, it is assumed that the delay defect is concentrated at one logical node. Therefore, any signal passing through this node will be delayed beyond the clock period. Analysis of TDF and its fault simulation was first reported in [8]. A scan-based Design for Testability (DFT) procedure is used for testing TDFs. During testing, the Scan Enable (SE) signal is set to logic high, and all sequential elements are connected in the form of a chain. Multiplexed D flip-flops are used for this purpose. Two types of transition faults are reported in the literature [8,9,10] Slow-to-rise and Slow-to-fall. Figure 2 shows examples of slow-to-rise and slow-to-fall faults. Here, ‘A’, ‘B’, ‘C’ and ‘D’ are inputs to the gates and ‘X’ and ‘Y’ are the outputs. To test TDF, a two-pattern sequence is needed. The first pattern is used for initializing a node, and the second for setting up the required transition. Two methods are reported in the literature for generating TDF patterns: Launch on Shift (LOS) and Launch on Capture (LOC).
2.2.1. Launch on Shift
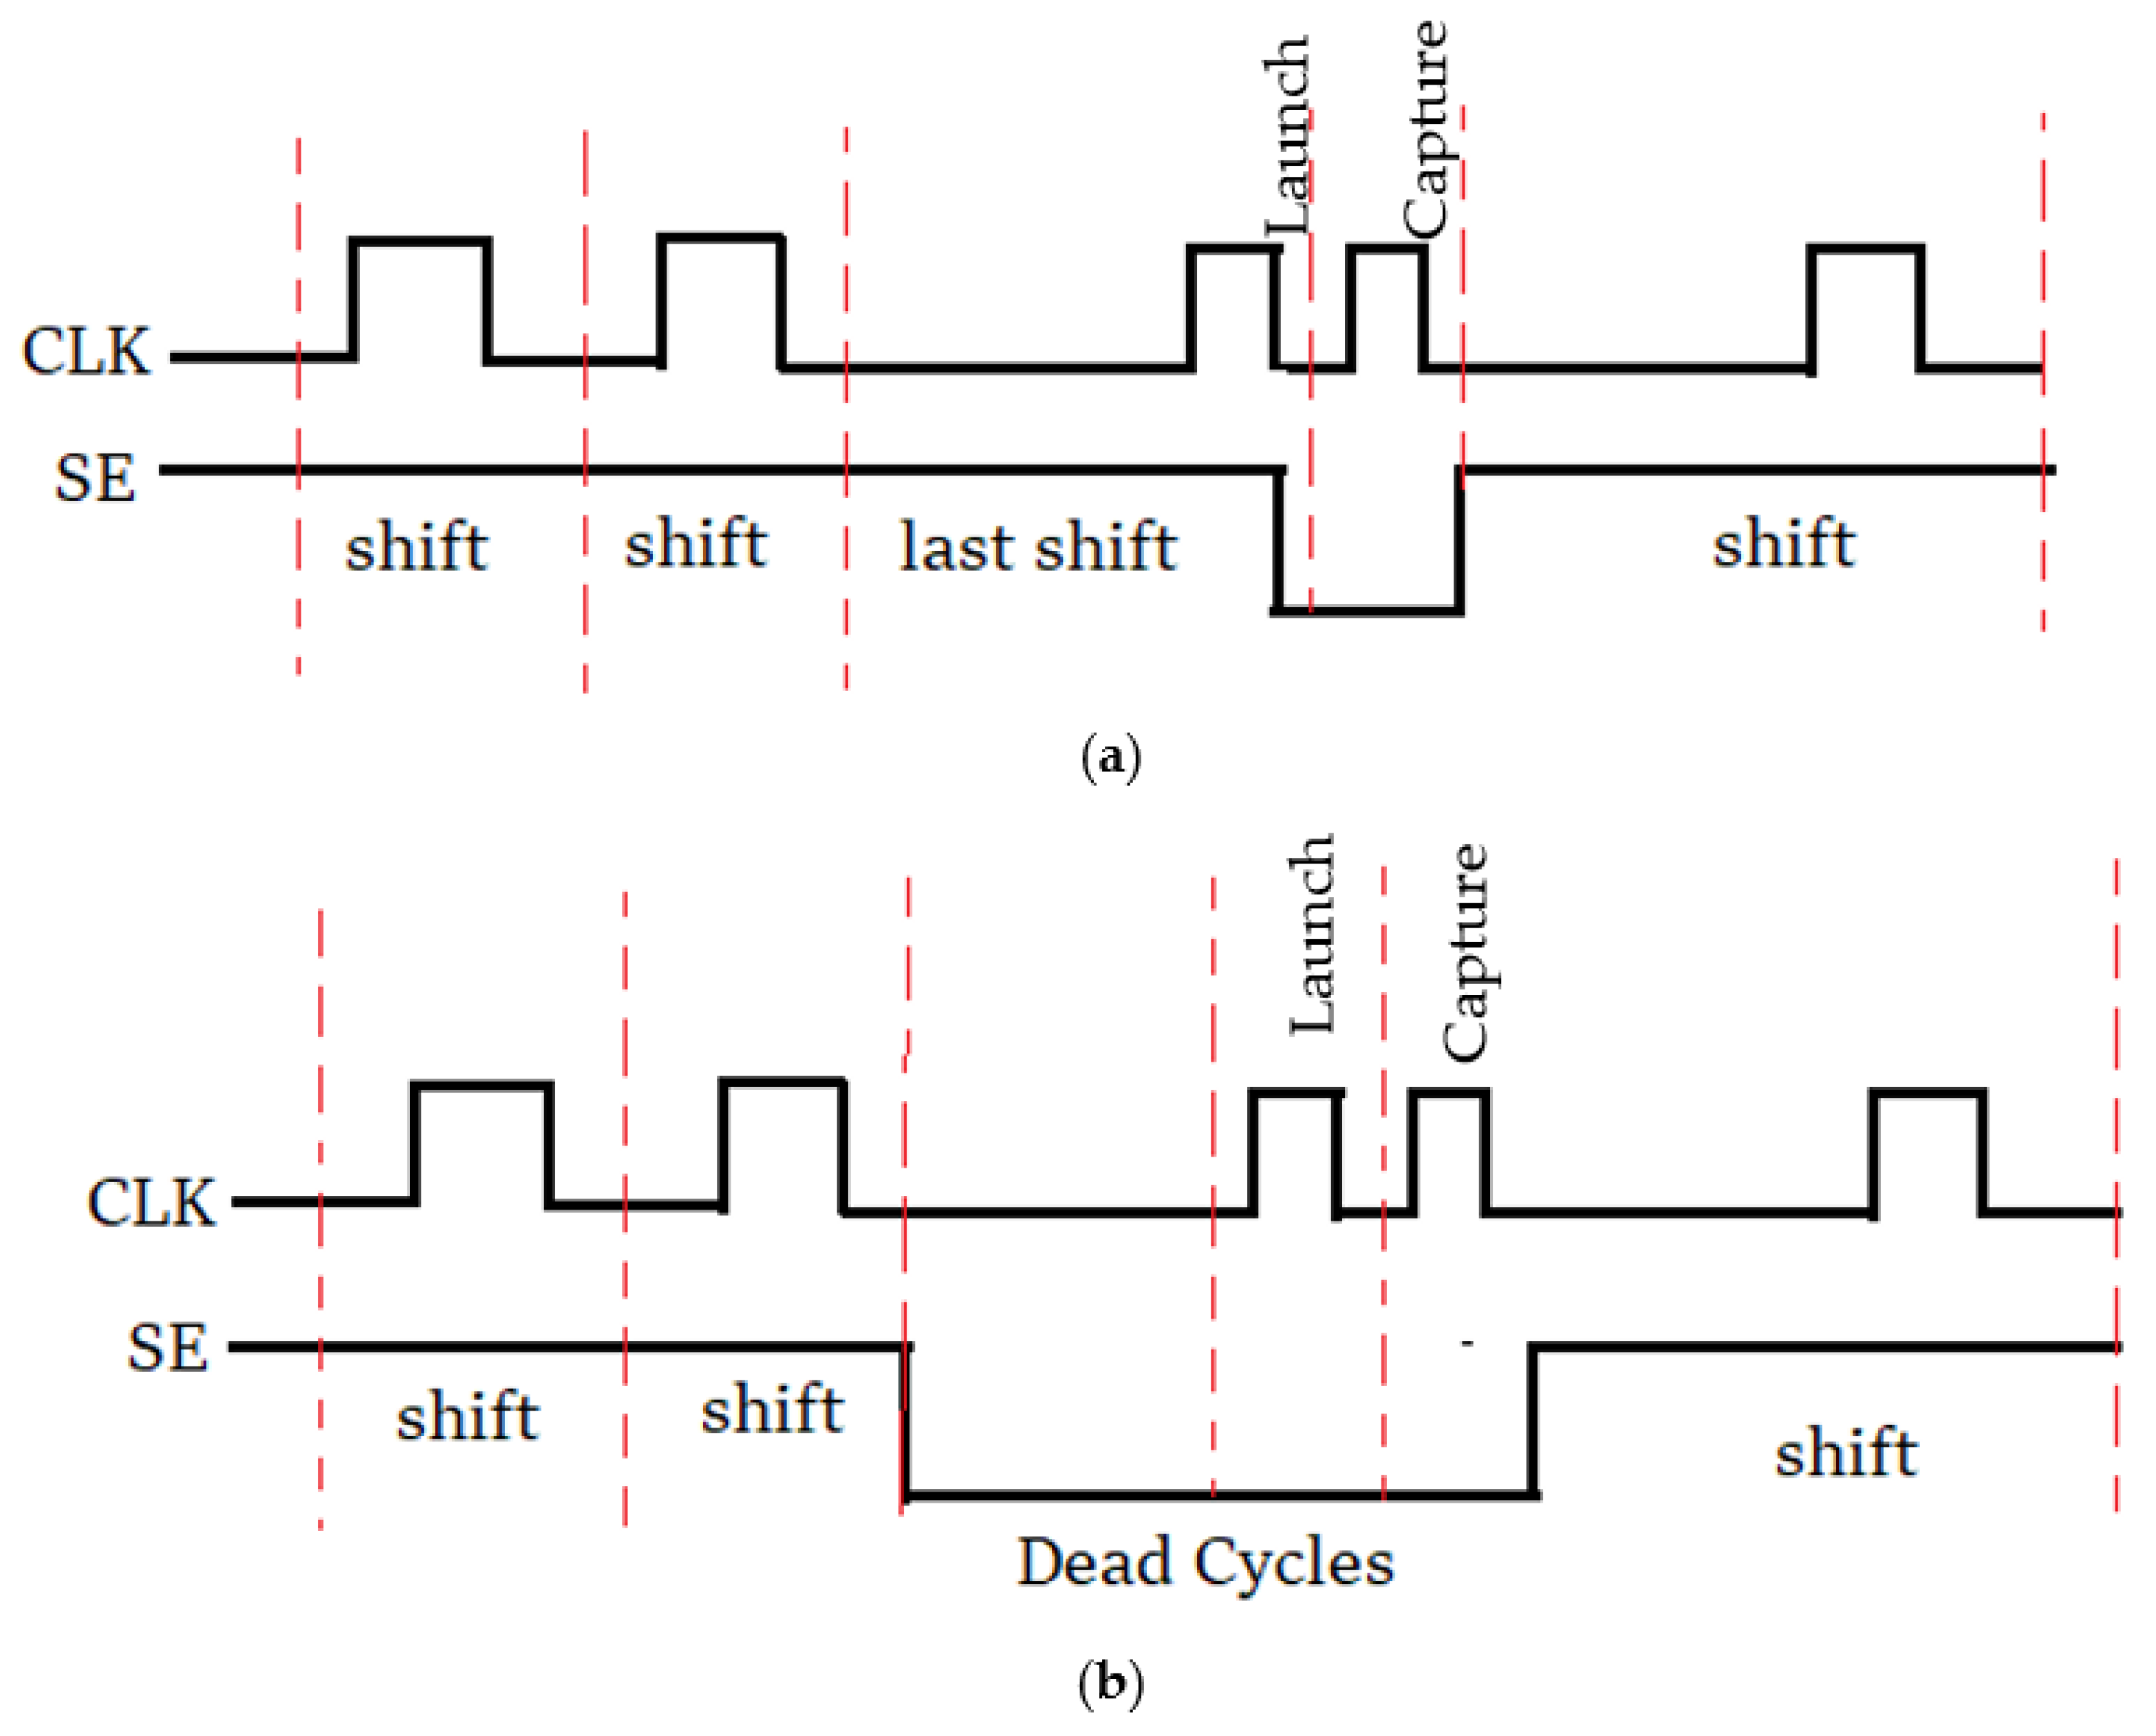
Figure 3a illustrates the timing diagram for the LOS procedure. In the test vector pair (V1, V2), the second vector, V2, is a 1-bit shifted version of V1. During the initialization stage, SE is high, and the first vector, V1, is loaded into the scan chain using multiple clock cycles. During the next stage, called the launch, the first bit of the second vector V2 is loaded, and the transition is launched. After this stage, SE is lowered, followed by a capture in the next clock cycle. SE signal is again turned high to unload the scan outputs. It can be noted that the SE signal switches between the launch and the capture cycles. Hence to achieve an at-speed capture, SE should switch at functional clock speed. Due to the routing of the high-speed SE signal, additional buffers are needed, thereby increasing the gate count. Nevertheless, the LOS scheme provides higher fault coverage.
2.2.2. Launch on Capture
To test a transition fault in LOC methodology, a test vector pair (V1, V2) is employed. However, here the second vector, V2, is the functional response of V1. Figure 3b shows the timing diagram for LOC. Initially, Vector V1 is loaded by holding SE to ‘1’. The SE signal is then lowered to obtain the second vector, V2. A clock signal is then pulsed to load the second vector. One more clock pulse is required to capture the transition induced by vector V2. SE is switched to logic ‘1’ to unload the scan outputs. The main advantage of LOC is that the SE can be routed as a standard signal. However, since the capture cycle happens immediately after loading vector V2, the ATPG is complex compared to the LOS scheme.
2.3. Trojan Cluster
When multiple defects occur in a circuit, it is assumed that they are randomly distributed throughout the circuit. However, multiple defects arising due to malicious process variations are more likely to cluster. When defects cluster in an area, their effect interaction is much more potent than when they are farther apart. These interactions will obscure some fault effects. This phenomenon is called fault-masking [11], which may lead to false negative detection.
On the other hand, these interactions may result in an additional number of faulty outputs that would not appear if a single defect is considered at a time. This effect is called fault reinforcement [11] which may lead to false positive detection. In the traditional testing procedure, fault diagnosis using single fault simulation is based on one-to-one mapping of a defect with faulty responses. In the presence of clustered Trojans, the observed responses and the responses in the presence of single Trojans are different. Hence, single-fault simulation-based procedures are less effective for identifying clustered multiple Trojans [10].
In this paper, three types of clusters are considered.
- (a)
- α-clusters: When two or more Trojans are present physically close to each other but have separate observation cones.
- (b)
- β-clusters: When two or more Trojans are present in the same sub-path and have overlapping observation cones.
- (c)
- ϒ-clusters: Two or more Trojans belong to separate sub-paths and have overlapping observation cones.
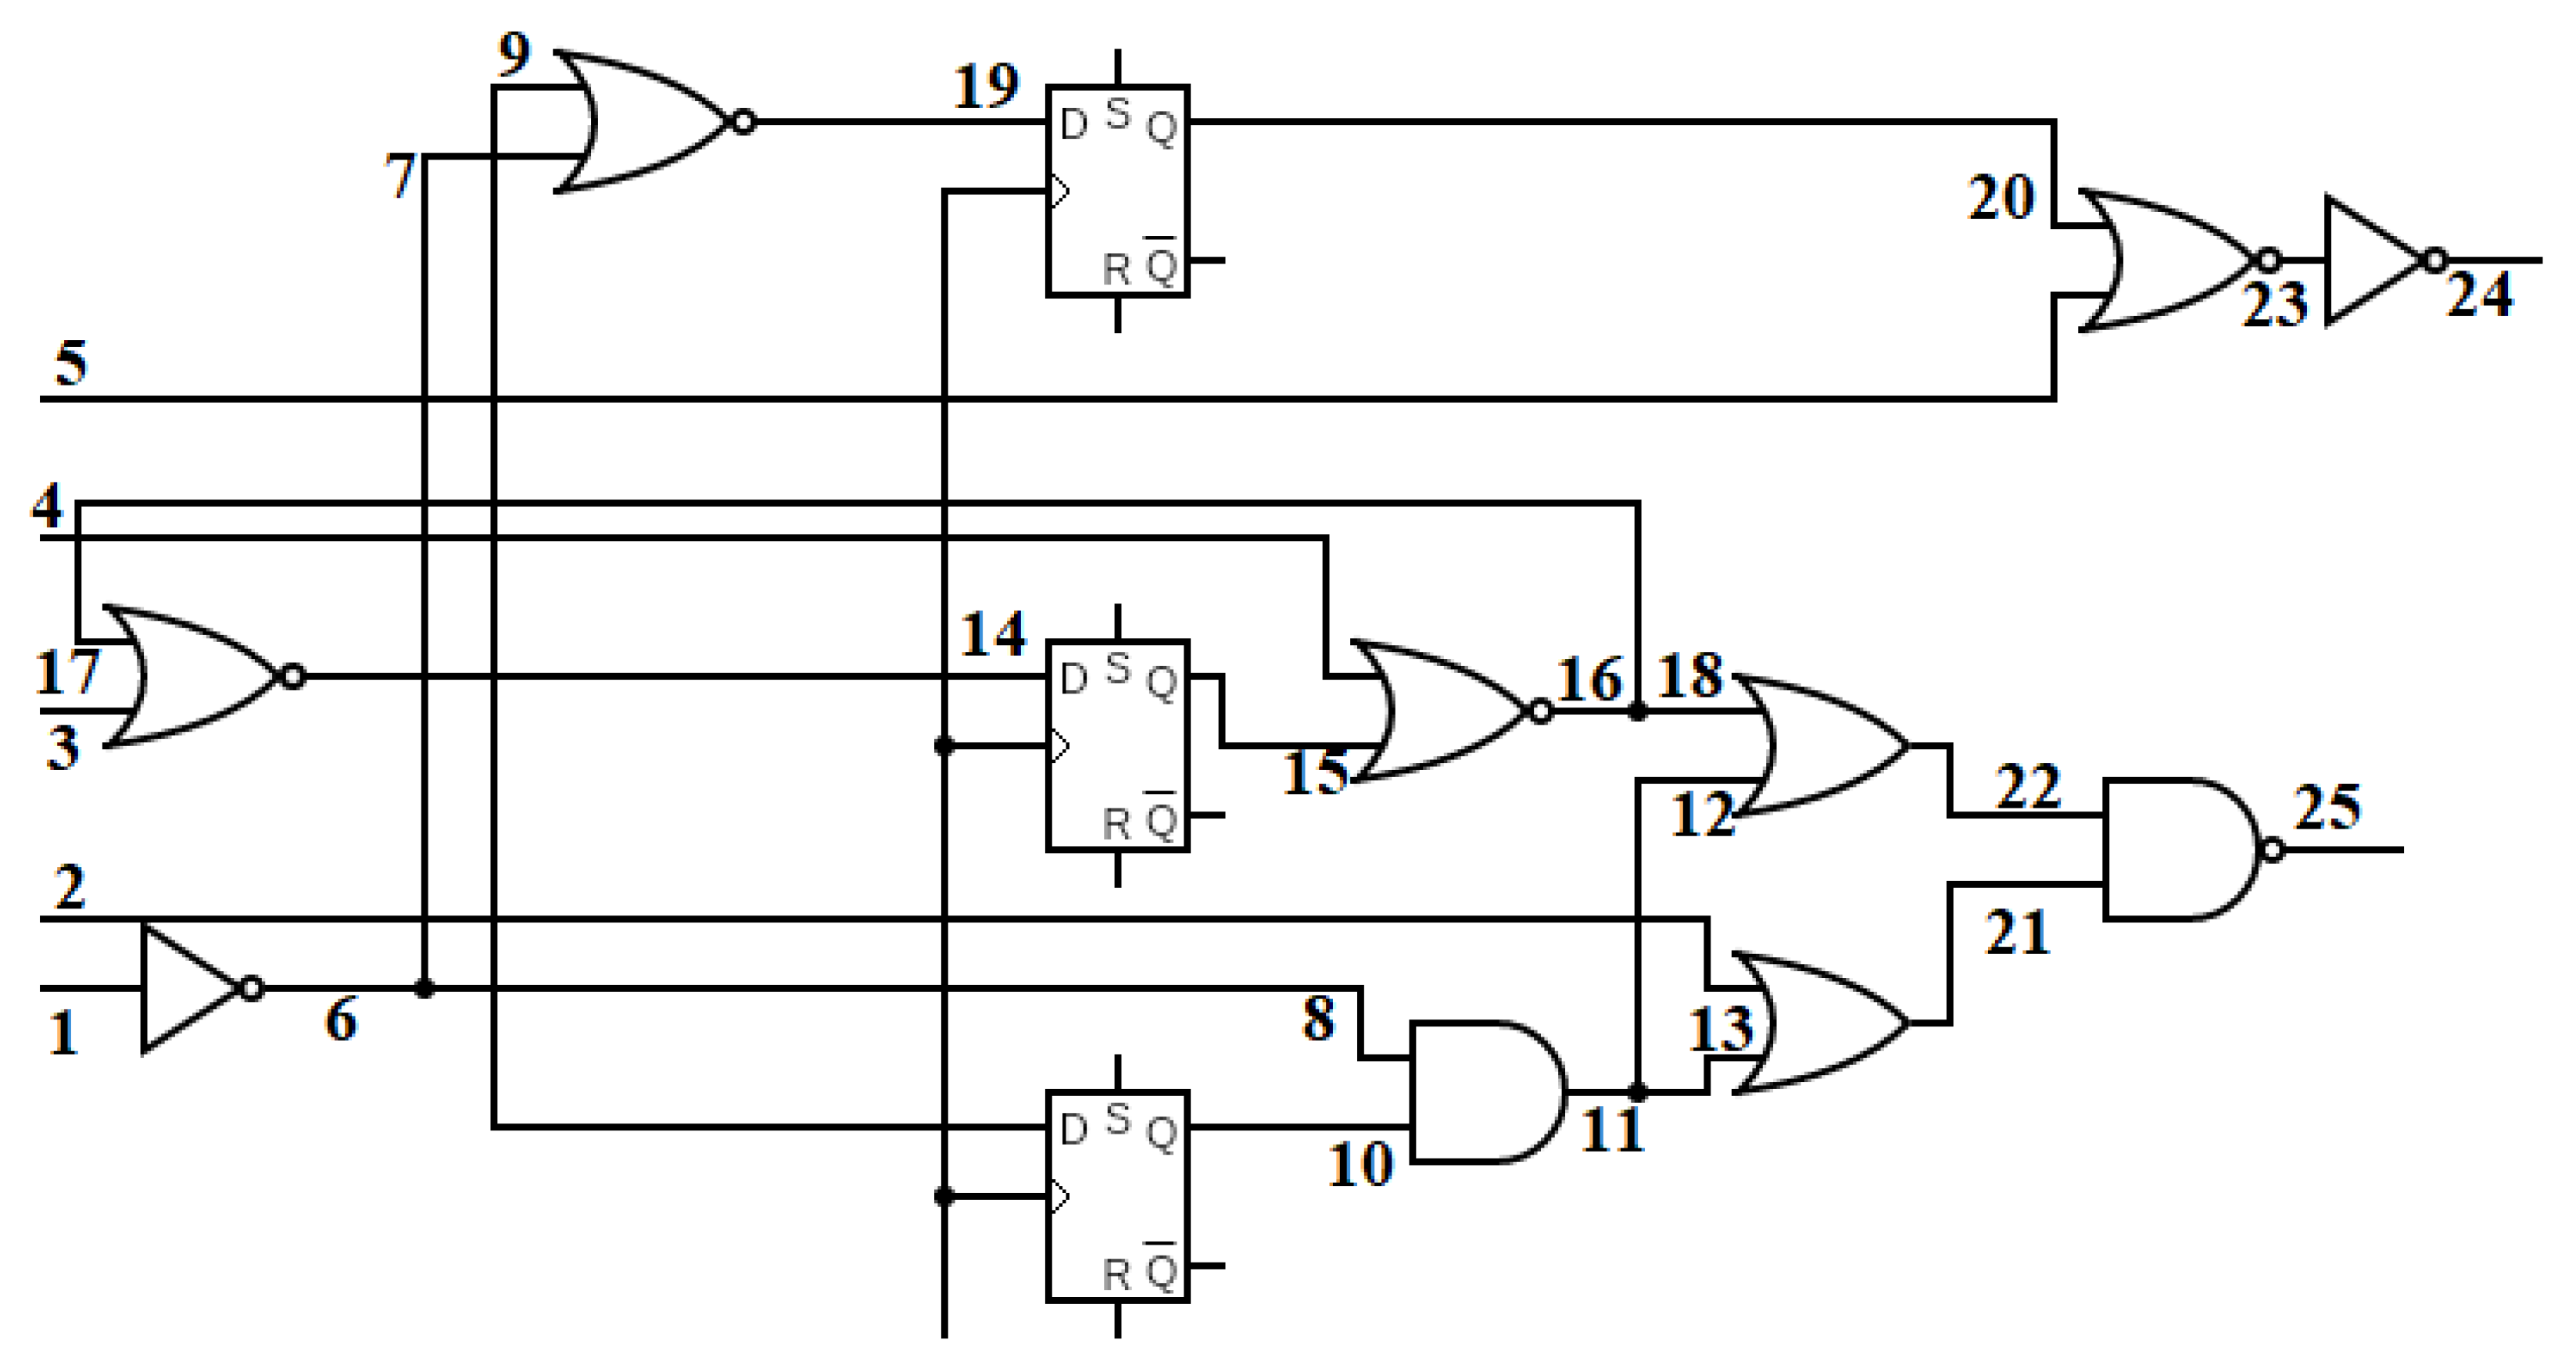
Consider an example circuit shown in Figure 4. There are 25 nodes in the circuit, for ease of representation, each node is identified using a number ‘1’, ‘2’, ‘3’, etc. A slow-to-rise TDF used to model a Trojan at node ‘1’ is represented as 1/01. Correspondingly, a slow-to-fall fault at node ‘2’ is denoted as 2/10. The TDFs, A1 = {23/10, 22/10} form an α-cluster, as they propagate to separate outputs and do not have any common nodes. Even though the faults in α-clusters are physically close to each other, they can be easily distinguished as they do not interact with each other. Hence, α-clusters can be diagnosed using the patterns generated by any standard ATPG tool. The TDFs B1 = {18/01, 22/01,25/10} form a β-cluster. It can be observed from Figure 4 that faults that lie closer to the output node are dominant over the other faults in the cluster. For example, in the B1 cluster, the TDF 25/10 is dominant over the fault 22/01. Hence, they are moderately difficult to diagnose clusters. The TDFs C1 = {12/10,13/01} form a possible ϒ-cluster. The diagnosis of ϒ-cluster is also considered difficult as the faults interact. However, using the proposed transition deactivation method described in Section 3.1, the TDFs can be selectively deactivated, thereby generating effective diagnosis patterns for β and ϒ-clusters.
The proposed work aims to generate patterns that can detect reliability attacks. The ability of these patterns to detect clustered Trojans is improved by applying path tracing and clustering algorithms. The proposed method uses only single fault simulations. Thus, any existing ATPG tool can be used for the proposed Trojan detection procedure. The proposed procedure consists of two parts: In the first part, Trojan grouping and Trojan triggering conditions are used to generate patterns that can identify and trigger multiple Trojans even if they have overlapping observation cones. Thus, the procedure aims at generating a highly compact test pattern set. In the second part, clustered Trojans are injected into the circuit. Faulty responses of the Circuit Under Test (CUT) are analyzed for the patterns generated in the first step. False positive and false negative cases in the presence of clustered Trojans are reduced by selecting the most probable clustered Trojan Candidates (TC).
3. Proposed TDF-Based TTP Generation Algorithm
An algorithm to generate TTPs for detecting Trojans without adding additional gates into the circuit model is explained here. The algorithm consists of two main parts: Trojan triggering condition and TDF-pair grouping. A detailed description of the proposed algorithm is given below.
3.1. Trojan Triggering Condition
Generally, a two-pattern set is used to test TDFs. Here, the first pattern initializes the faulty node, and the second pattern sets the transition at the node. Consider the circuit shown in Figure 4. To detect a slow-to-rise fault at node 5, represented as 5/01, a test vector pair that ensures a logic ‘0’ to logic ‘1’ transition at node 5 must be applied. To increase the probability of detecting a Trojan, patterns that can activate a Trojan at a node while deactivating the transition in the nearby nodes are considered. Since such conditions occur rarely, they are suitable for triggering a Trojan. This can be treated as a rare event capable of triggering a Trojan. Hence, for generating the triggering condition for a Trojan, a pattern that can activate a TDF at the Trojan node while deactivating TDFs in the nearby nodes can be used. For example, to deactivate the 5/01 TDF, any test vector pair that activates a ‘10’, ‘11’, ‘10’ transition at node 5 can be used.
On further investigation, it can be observed that if the value of node 5 in the first time-frame is logic ‘1’, then irrespective of the second time-frame value, the TDF 5/01 gets deactivated. Similarly, if the value of node 5 at time-frame 2 is logic ‘0’, then irrespective of the first time-frame values, the TDF 5/01 gets deactivated. The proposed method selects the Trojan triggering patterns based on the second time-frame information only. Thus, generating TTPs using only one time-frame value makes the proposed method faster than the existing methods [8,12], which use two time-frame values.
The patterns that satisfy the constraints for transition deactivation are obtained using Zero Suppressed Binary Decision Diagram (ZBDD) based SAT-solvers [13]. In this approach, the ZBDDs are used as the fundamental data structure. ZBDDs are proven to be efficient compared to lists and tries [12,13]. ZBDD can represent Boolean expressions in a compressed form, resulting in much faster search times. The results in [12,13,14] show that ZBDDs work well for digital benchmark circuits such as ISCAS’89, ITC’99 and IWLS’05.
3.2. TDF-Pair Grouping
In the proposed method, multiple TDF pairs are considered simultaneously for generating compact test patterns that trigger multiple Trojans. The TDF pairs that can be considered in one cycle are grouped together. TDF pairs can be grouped together if at least one fault in a pair has a disjoint observation cone with other pairs of the group. Fault pairs that satisfy the above constraint can be of the following two types:
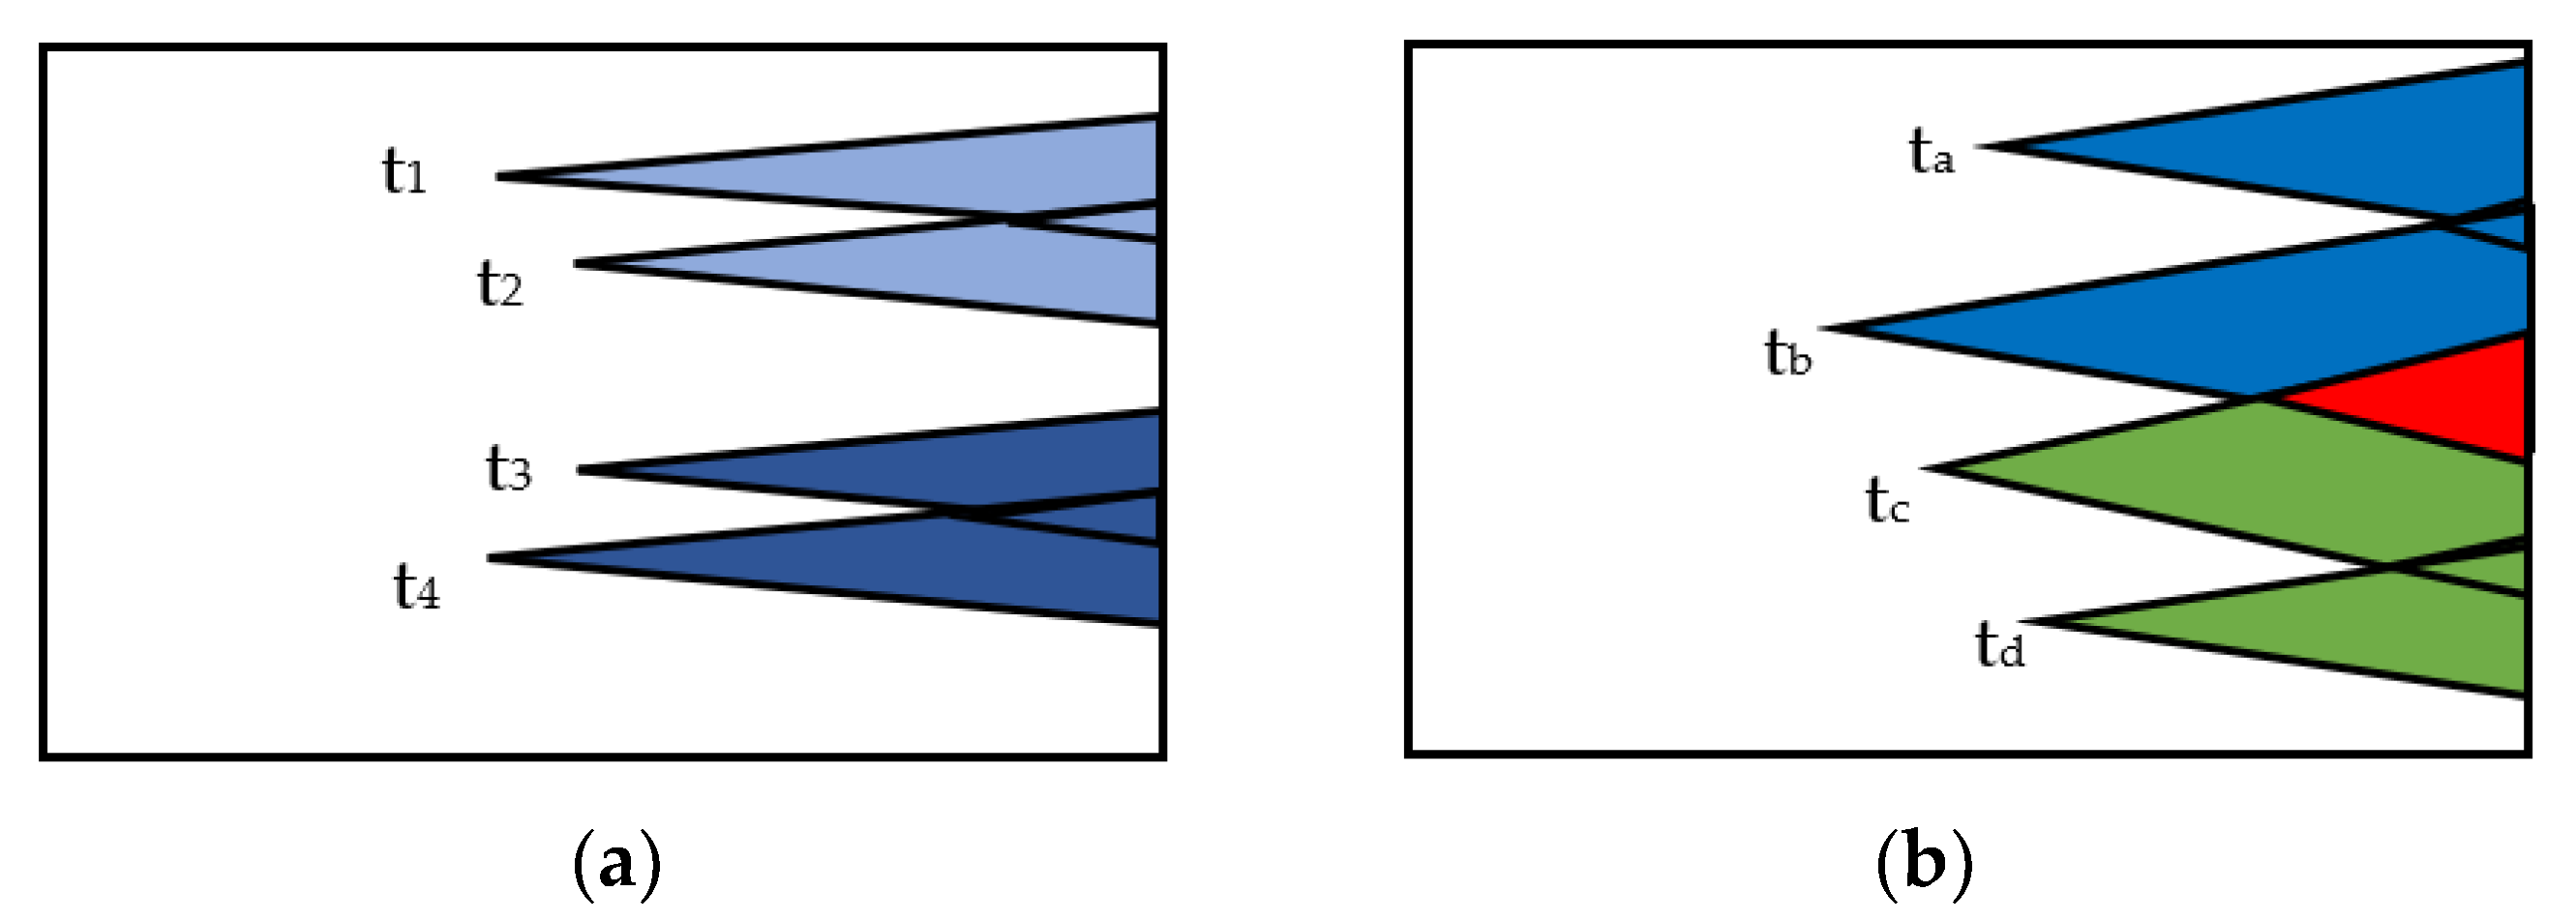
Type 1: Two fault pairs that have non-overlapping observation cones. For example, Figure 5a shows two fault pairs P1 = (t1, t2) and P2 = (t3, t4). The faults pairs P1 and P2 have disjoint observation cones. Hence, the pairs do not interact. Hence, P1 and P2 can be grouped.
Type 2: Two fault pairs have overlapping observation cones. Consider the fault pairs P3 = (ta, tb) and P4 = (tc, td), shown in Figure 5b. Here, ta has no common nodes with pair P4. Similarly, td does not have any common nodes with pair P3. Thus, the pairs P3 and P4 satisfy the criterion for grouping.
When type 2 faults are grouped, an additional grouping constraint must be satisfied. For example, tb and tc cannot be activated simultaneously, as they have common propagation nodes.
The pseudocode for the proposed Algorithm 1 for TTP generation is shown below. The following terms are used: TDF List is the list of Transition Delay Faults, FP is the list of fault pairs. TTP is the set of Trojan Triggering Patterns, and TP is the set of Test Patterns. EQFP indicates the fault pairs which cannot be distinguished as they produce a similar response at the output. Hence, they are termed Equivalent Fault Pairs. OP is the set of primary outputs to which a fault or a group of faults are propagating. ‘G’ indicates the group of fault pairs that are considered simultaneously.
To avoid detection, the Trojans are inserted in the non-critical path. General ATPG methods are constrained to generate patterns for critical path. Cha and Gupta [15] have addressed this issue and have proved that shorter paths can increase detection sensitivity. The delay added by the HT has a larger fractional impact on the path delay as compared to the longer paths. For example, if Δt is the delay added due to a HT in a path with total delay T, then Δt/T is the fractional delay induced by the HT. If T is smaller, then Δt/T will be a higher value thereby increasing its detection probability. Hence, HT at shorter paths can be detected by using an appropriate test vector generation strategy. In [15], the existing ATPG tool is modified by leveraging the TDF model since it is assumed as a delay on an individual node.
A similar approach is used in the proposed method. Here, in addition to the test patterns generated using a standard ATPG tool, Trojan triggering patterns are generated after obtaining the delay of each sensitized path. The path delays are computed using the Prime-Time tool in Synopsys. The ATPG tool is then adjusted for the required delay.
| Algorithm 1. Pseudocode for proposed TTP Generation |
| INPUT: Netlist, TDF List, FP OUTPUT: TTP, TP, EQFP for i in TDF Generate test pattern tpi using an ATPG tool Add the pattern to TP Remove fault pairs from FP which can be distinguished using tpi Remove the faults from TDF which can be detected using tpi for i in FP //Remaining fault pair grouping OPi <= ɸ OPi <= set of Primary Outputs in the observation cone of fpi Compute the delay for each path; FP= FP-fpi Gi = fpi for j in FP OPj <= set of Primary Outputs in the observation cone of fpj If (fpi and fpj satisfy the grouping criterion) Gi = Gi + fpj FP = FP- fpj OPi = OPi + OPj for i in G // Transition Deactivation Condition Generate ZBDD for the set of outputs in OPi Select the patterns which satisfy the Transition Deactivation and delay Condition Add the patterns to TTP Add the remaining Fault pairs to EQFP |
4. Proposed Detection of Clustered Trojans
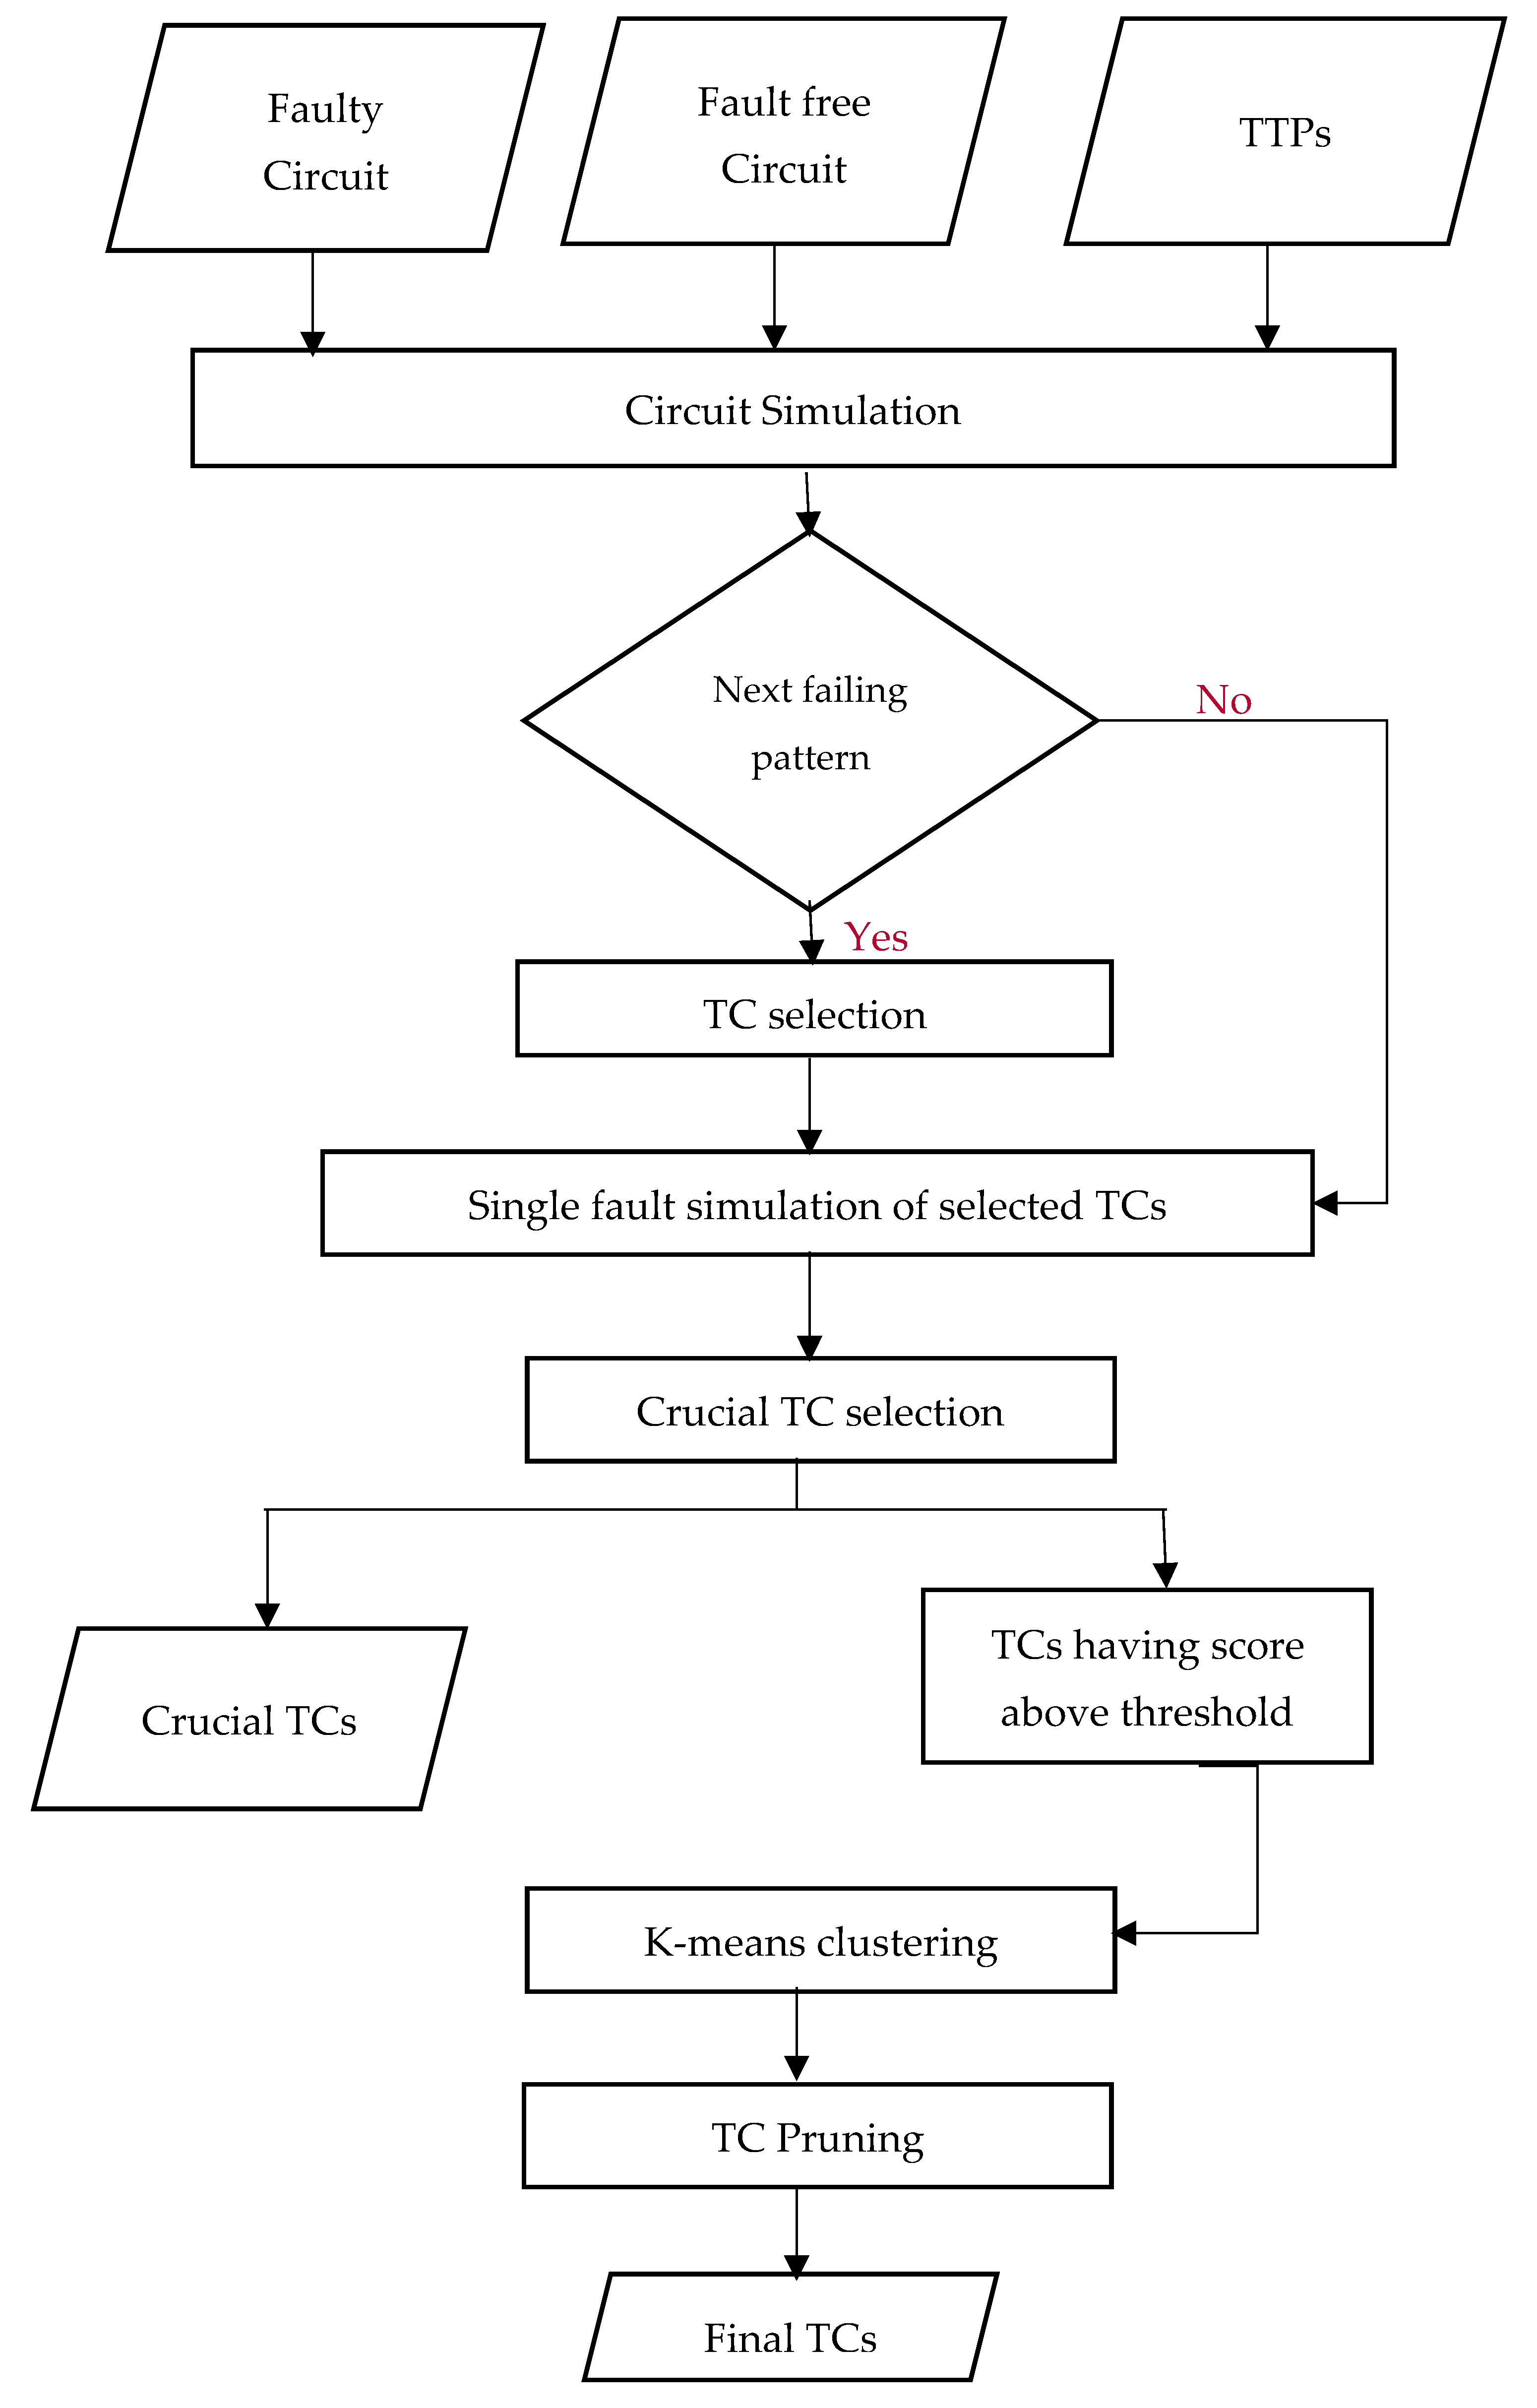
The overall flow of the proposed clustered Trojan detection is shown in Figure 6. A set of clustered Trojans are injected into the CUT. The TTPs obtained using the method explained in Section 3 are used to perform the circuit simulation. The obtained response is then compared with the golden response of the fault-free circuit to obtain the list of Trojan Candidates (TCs) using the proposed TC selection algorithm explained in Section 4.1. Single fault simulations of the selected TCs are performed to assign a score to the TCs. The TCs with the highest scores are named crucial TCs. This procedure is called Crucial TC selection, details of which are given in Section 4.2. Finally, the K-means clustering algorithm, with the optimal number of clusters discussed in Section 4.3, is used to prune the list of TCs.
4.1. TC Selection Algorithm
In the proposed Algorithm 2, a list of TCs is obtained with the help of generated TTPs as explained in Section 3. TTPs are highly efficient in triggering Trojans. However, the fault-masking and fault reinforcement due to the presence of multiple Trojans would affect the efficiency of TTPs. Hence the TC selection algorithm is followed by crucial TC selection and the K-means clustering algorithm.
During the TC selection algorithm, a list of nodes connected to each failing output is obtained. The second time-frame values of these nodes are compared with the second time-frame values of the fault-free circuit. Each node with a mismatch in the second time-frame value is listed as a TC.
The advantage of the proposed TC selection algorithm is that it needs only one time-frame value to obtain the list of TCs. Thus, the algorithm is comparatively faster and requires less memory. The pseudocode for the algorithm is shown below. The following terms are used in the algorithm: FO is the list of failing outputs for the Failing Test Patterns (FTPs).
| Algorithm 2. Algorithm: TC Selection |
| Input: FO, FTP Output: List of TC for i in FO Obtain the list of nodes connected directly or indirectly to foi Update N for i in FTP for j in N If (faultfree response of njϵ N ≠Actual response of nj) Add nj to TC |
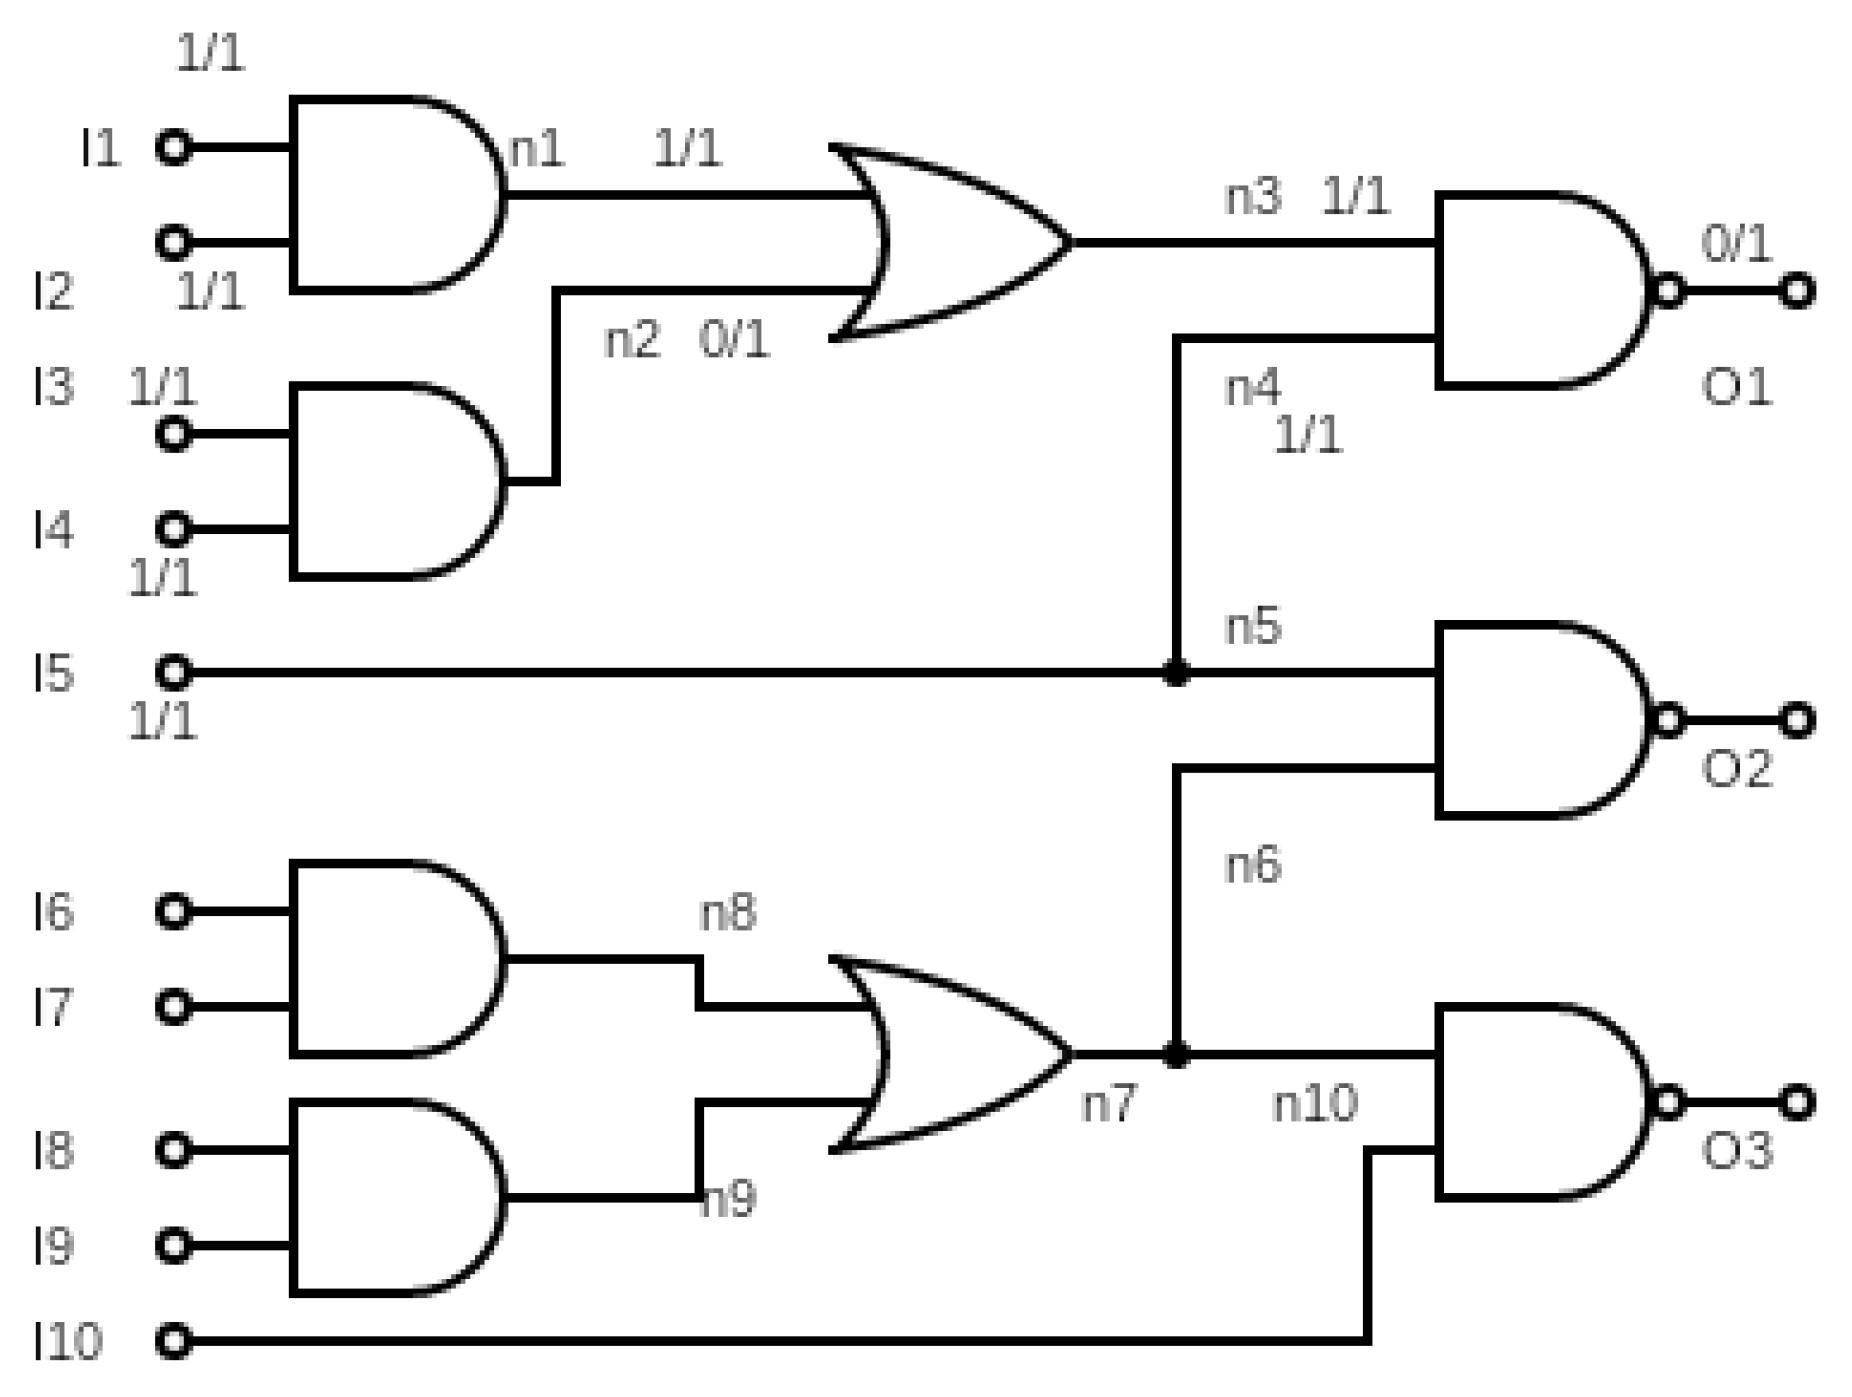
Consider an example circuit shown in Figure 7 where the primary inputs are denoted as I1, I2, … I10, primary outputs as O1, O2, O3 and intermediate nodes are represented as n1, n2, … n10, etc. Assume that, after circuit simulation, output O1 shows a faulty response in the second time-frame. The true response and the actual response are shown in the circuit as 0/1, where ‘0’ is the true response or expected value and ‘1’ is the faulty response. In the first step, the list of nodes to which the output propagates are obtained. In this example, the list is N = {n3, n4, I5, n1, n2, I1, I2, I3, I4}. In the second iterative loop of the proposed algorithm, the nodes which have a conflicting true response and actual response for the second time-frame are selected. These nodes indicate possible Trojan locations. Hence, they are added to the list of TCs.
4.2. Crucial TC Selection
Algorithm 3 explains the crucial TC selection process. A single fault simulation is performed on each fault in the list of TCs. The fault simulation responses are obtained only for the failing test patterns reported during the simulation of the faulty circuit. The obtained single-fault simulation responses are then compared with the actual faulty circuit responses. The TC, which can explain the maximum number of failed outputs, will have the highest score. The score for each TC is computed using the Equation (1):
Here, FTP is the set of Failing Test Patterns, and FO is the set of failing outputs. SFS indicates the single fault simulation procedure. AFS indicates the actual fault simulation after injecting a clustered fault into the circuit. The score is the sum of the intersection of the failing outputs for SFS and AFS for each failing pattern. The TCs with maximum scores are named crucial TCs. Among the remaining TCs, those that cross a threshold of 0.9 × max_score are considered as viable TCs. Here, 0.9 is a user-defined value for the threshold. Considering faults with less than the maximum score attempts to include the fault-masking and fault reinforcement effects. The pseudocode for crucial TC selection is shown below. Inputs to the algorithm 3 are the list of TCs and the list of Failing Test Patterns (FTPs)
| Algorithm 3. Crucial TC Selection |
| Inputs: TC, FTP Outputs: Crucial_TC, Final_TC Max_score = 0; for i in TC Scorei = 0 for j in FTP SFSj <= Failing outputs for single fault Simulation AFSj <= Failing outputs of Actual fault simulation Current_scorej = |SFSj ∩ AFSj| Scorei = scorei + current_scorej if (scorei > Max_score) Max_score = scorei for i in TC if (scorei = = Max_score) Crucial_TC = crucial_TC ∪ TCi if (scorei > 0.9 × Max_score) Final_TC=Final_TC ∪ DCi |
4.3. K-Means Clustering Algorithm
K-Means clustering is used when a set of n-samples are grouped into K clusters. The CUT must be converted into a 2-Dimensional plane for applying the K-means clustering algorithm. Hence, the ‘x’ and ‘y’ coordinate values are extracted for each TC node using the layout information. Various methods can be used for searching a TC node in a layout. A Horizontal Vertical Tree (HVT)-based data structure mentioned in [14] is used in the proposed method. A binary search algorithm is used to search for the given TC. These coordinates represent the physical position of the possible Trojan nodes.
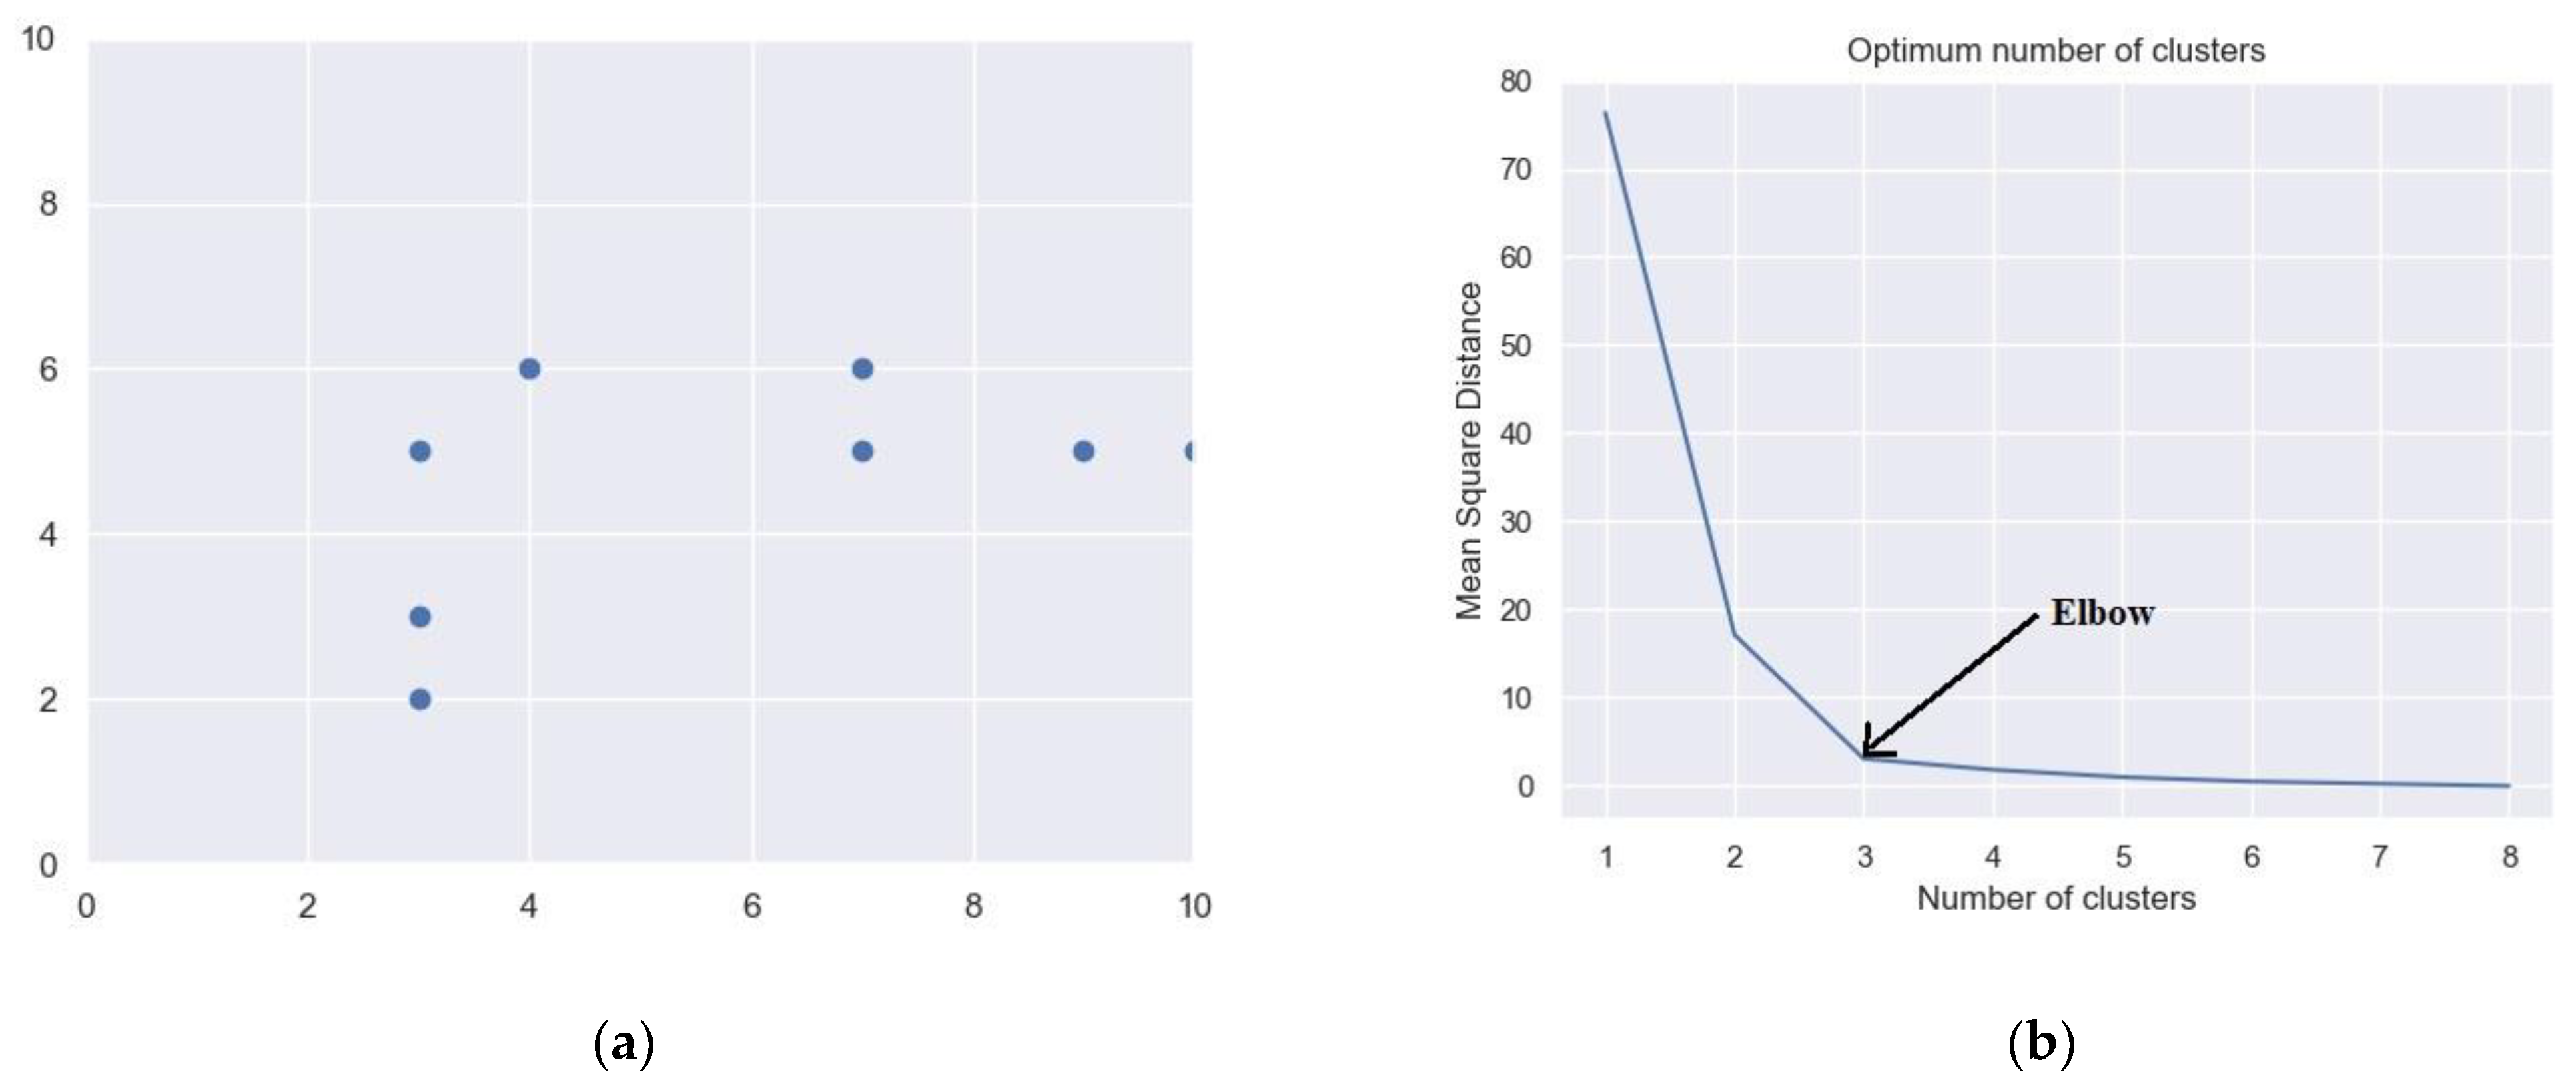
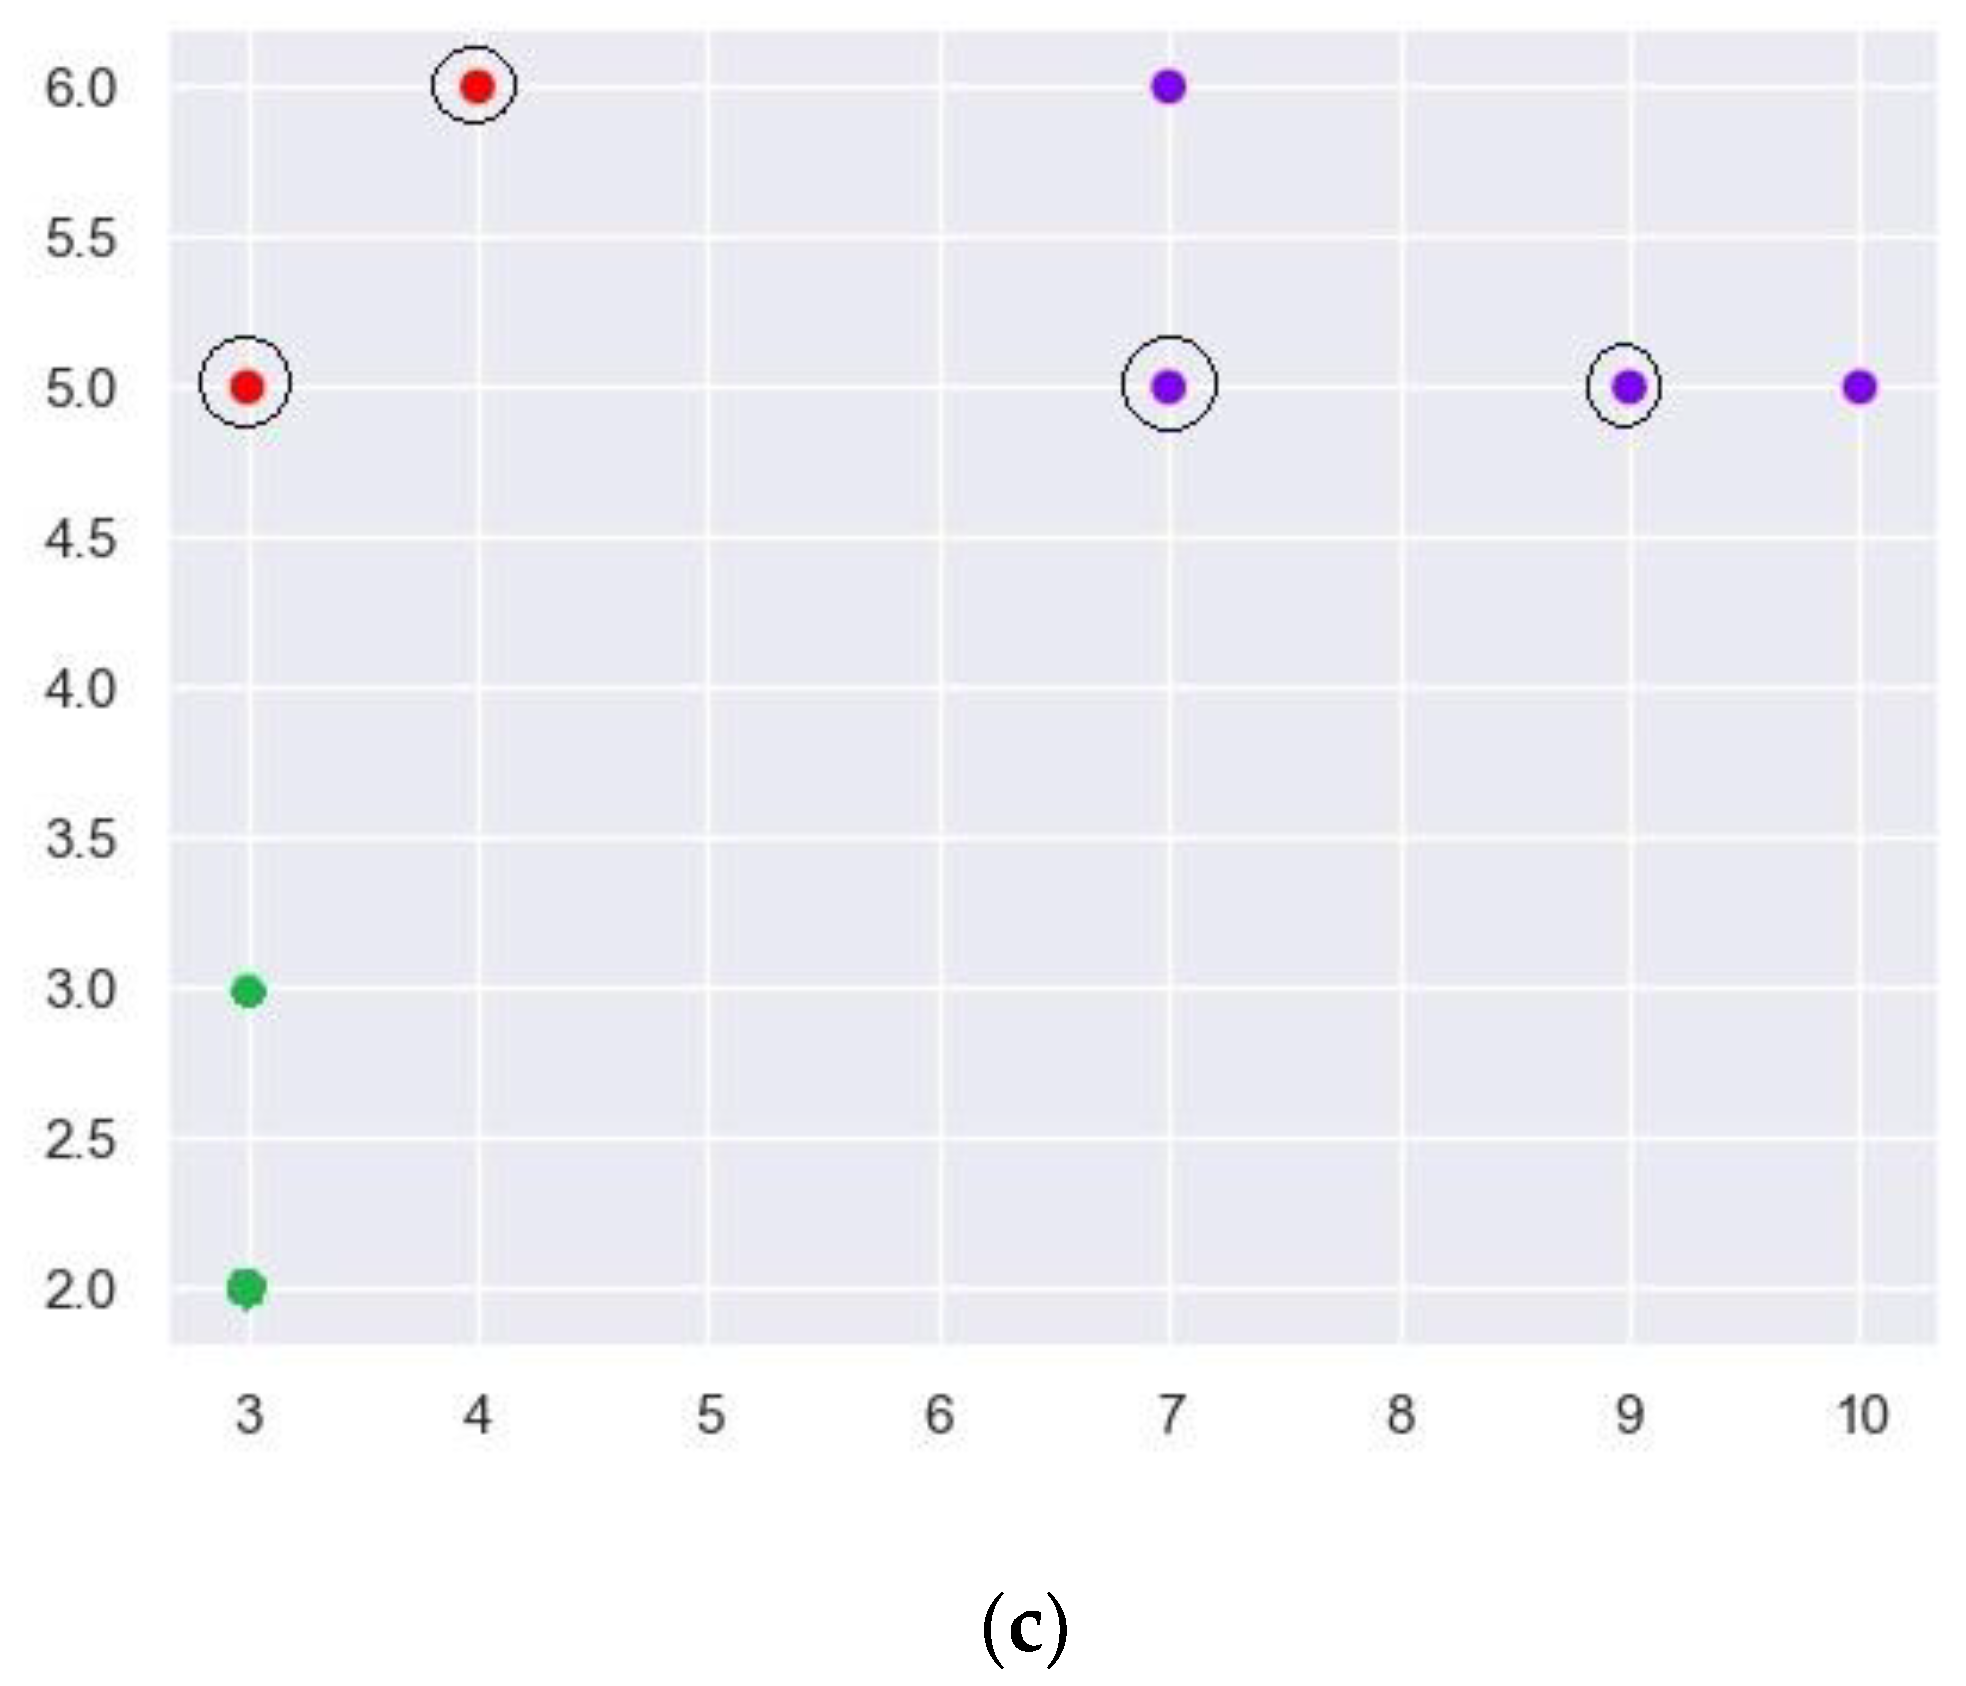
An important parameter that affects the algorithm’s efficacy is the optimum Number of Clusters (NC). This paper uses the Elbow-Curve method to obtain the Optimum Number of Clusters (ONC). In this method, the K-means clustering is run on the combined list of Crucial TCs and viable TCs, for a range of K (from K = 1 to K = N), where 1 is the minimum and N is the maximum number of clusters. For each value of K, the average distance to the centroid of all DCs in a cluster is computed. These values are plotted in a graph. The point where the average distance to the centroid drops suddenly (elbow) is selected as the optimum NC.
Figure 8 shows the result of applying the K-means clustering algorithm on the ISCAS’89-s27 benchmark circuit. Figure 8a indicates the 2-Dimensional plot of the list of TCs when four TDFs belonging to the α-cluster were injected into the circuit. Figure 8b shows the plot for obtaining the ONC. The x-axis shows the number of clusters ranging from one to eight (number of TCs). Y-axis shows the mean square distance of the centroid of each cluster to the TCs in the respective clusters. It is observed that at NC = 3, the mean square distance drops drastically. Hence, K-means clustering is applied for K = 3, and the obtained clusters are shown in Figure 8c. Cluster C1 with 4 TCs are represented using ‘Blue’ color dots. Clusters C2 and C3, with two members each, are represented using ‘Red’ and ‘Green’ color dots, respectively.
After clustering, TC pruning is performed to remove the scattered TCs. A user-defined parameter ‘s = 0.6’ is used for pruning. All the clusters with a size less than 0.6 times the biggest cluster are removed. However, the crucial suspects are retained, even if they belong to a cluster to be removed. In Figure 8c, the crucial suspects are indicated using black circles enclosing the dot. The maximum size of the cluster is 4. Hence any cluster with a size less than 0.6 × 4 = 2.4 is to be removed. Since both the elements of cluster C2 are crucial suspects, they are retained, and cluster C3 is removed. Hence, the final list of TCs will have six entries where four are the actual injected Trojans, and only two are incorrectly identified TCs. Hence, in this case, the accuracy is 1, and the resolution is 0.67. Accuracy and resolution are computed using Equations (2) and (3), respectively.
Accuracy indicates the number of Trojans identified out of the total number of injected Trojans. Resolution indicates the number of correctly identified Trojans among the list of TCs reported at the end of the diagnostic procedure. 100% accuracy indicates there are no false negative cases. As resolution increases, the false negative cases decrease. The accuracy and resolution when a single TDF is injected are observed to be maximum. This also indicates the efficiency of the TTPs in identifying the Trojans.
5. Results and Discussion
To validate the proposed Trojan detection procedure for single and clustered Trojans, experiments were conducted on various ISCAS’89, ITC’99 and IWLS’05 benchmark circuits. SYNOPSYS TMAX was used to generate the LOC and LOS test patterns for the TDFs. The circuit netlist was derived from SYNOPSYS Design Compiler, with 90 nm standard cell library. The Colorado University Decision Diagram (CUDD) tool [16] was used to manipulate the ZBDDs. The script for the proposed TDF-based TTP generation algorithm and detection of clustered Trojans was written in Python 3.0. All experiments were conducted on Intel® Core i5, 1.8 GHz processor and Linux operating system. The proposed method works best when high resolution delay measurement technique is used.
Table 1 shows the consolidated results for the proposed TDF-based TTP generation algorithm. The first column lists the benchmark circuits on which the proposed algorithm was applied. #TDF is the number of Transition Delay faults reported by the Synopsys TMAX tool. #FP is the total number of fault pairs. If ‘n’ is the number of TDFs in a circuit, then nC2 is the number of possible fault pairs. #TP indicates the number of test patterns. INDIS indicates the number of fault pairs that could not be distinguished using only the TPs. To generate TTPs the Trojan triggering condition and TDF-pair grouping methods are applied on these fault pairs that cannot be distinguished (referred to as indistinguished in this paper). These patterns are listed in the column labelled #TTP. The fault pairs which cannot be distinguished, as they have a similar response at the output, are grouped as Equivalent faults (EQU). The fault pairs for which the fault effects do not reach the output are listed under the column labelled ‘#Aborted’. The Next column shows the Detection Ratio (DR). Equation (4) is used to compute DR. No false positives were reported; however, some of the fault pairs were aborted in s15850 and s38584 circuits; hence false negatives are reported in these two cases.
Table 2 compares the results of the proposed TTP generation algorithm [17]. The columns labelled #EQU in Table 2 show the number of equivalent fault pairs in [17] and the proposed TTP generation algorithm. The results indicate a 32.1% decrease in the number of equivalent fault-pairs. In the proposed algorithm, a novel Trojan triggering condition is used. Moreover, multiple fault pairs with overlapping observation cones are considered simultaneously, thus reducing the number of equivalent faults as compared to [17]. Reduced equivalent faults indicate that the TTPs generated using the proposed method can trigger Trojans more effectively.
In the proposed TTP generation algorithm, high detection capability is achieved at the expense of a slight increase (4.2%) in the total number of patterns. The number of patterns (#TP + #TTP) is high for two ISCAS’89 circuits, namely s15850 and s35932. However, it can be observed that the number of aborted faults reported in the proposed TTP generation algorithm is only ‘7’ as compared to ‘11’ in [17] for s15850. The number of aborted faults are reported in the columns labelled ‘Ab’ in Table 2 for [17] and the proposed TTP generation algorithm, respectively. Overall, the proposed TTP generation algorithm efficiently generates patterns with high Trojan Triggering capability.
The proposed Clustered Trojan procedure was applied on ISCAS’89 circuit s38584 and ITC’99 circuits b17 and b18. One to ten Trojans were injected into each circuit. Clustered Trojans belonging to α, β and ϒ clusters were injected. Hence, in total 3 × 10 × 3 = 90 faulty circuits were analyzed. The HTs were inserted based on their physical closeness. These clusters can be on the critical as well as non-critical paths. The HTs on the critical paths can be detected using the standard ATPG patterns, and for those on the non-critical paths, the patterns generated using the TTP generation algorithm are used. A Gaussian delay distribution is generally assumed when path delay fault models are considered. However, in the proposed method a transition fault model is considered. It assumes that the delay is on a single node in the excited path.
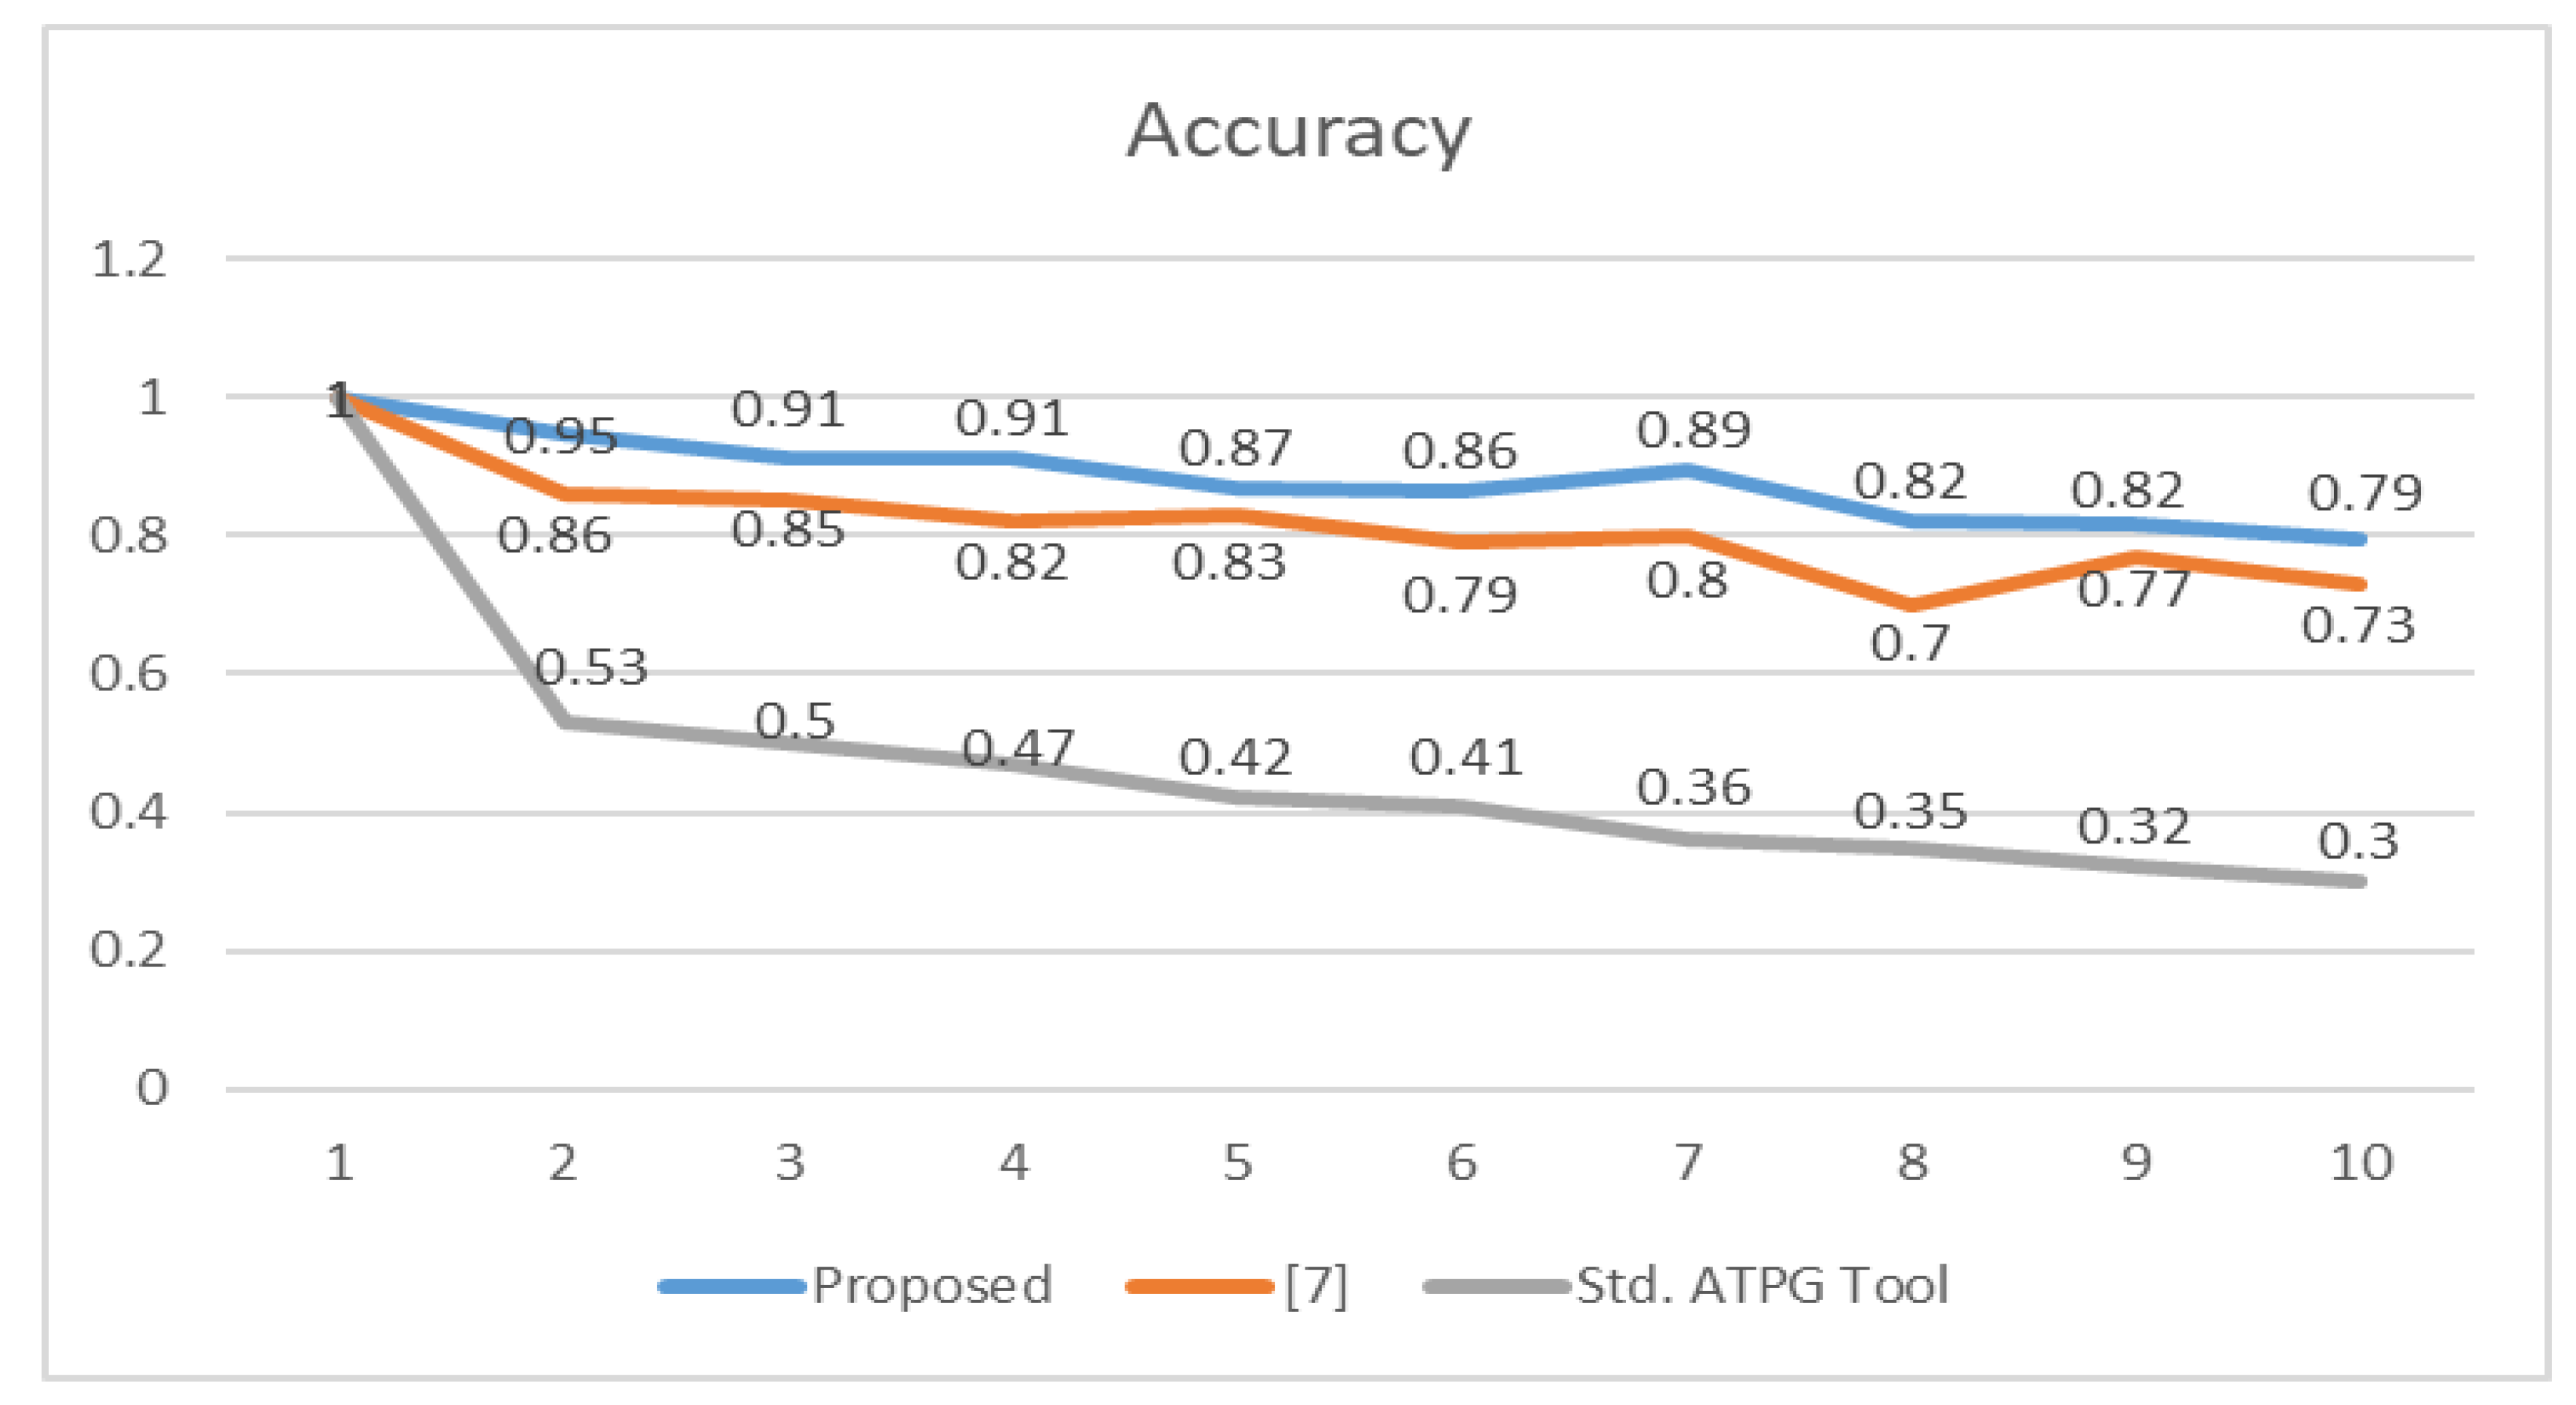
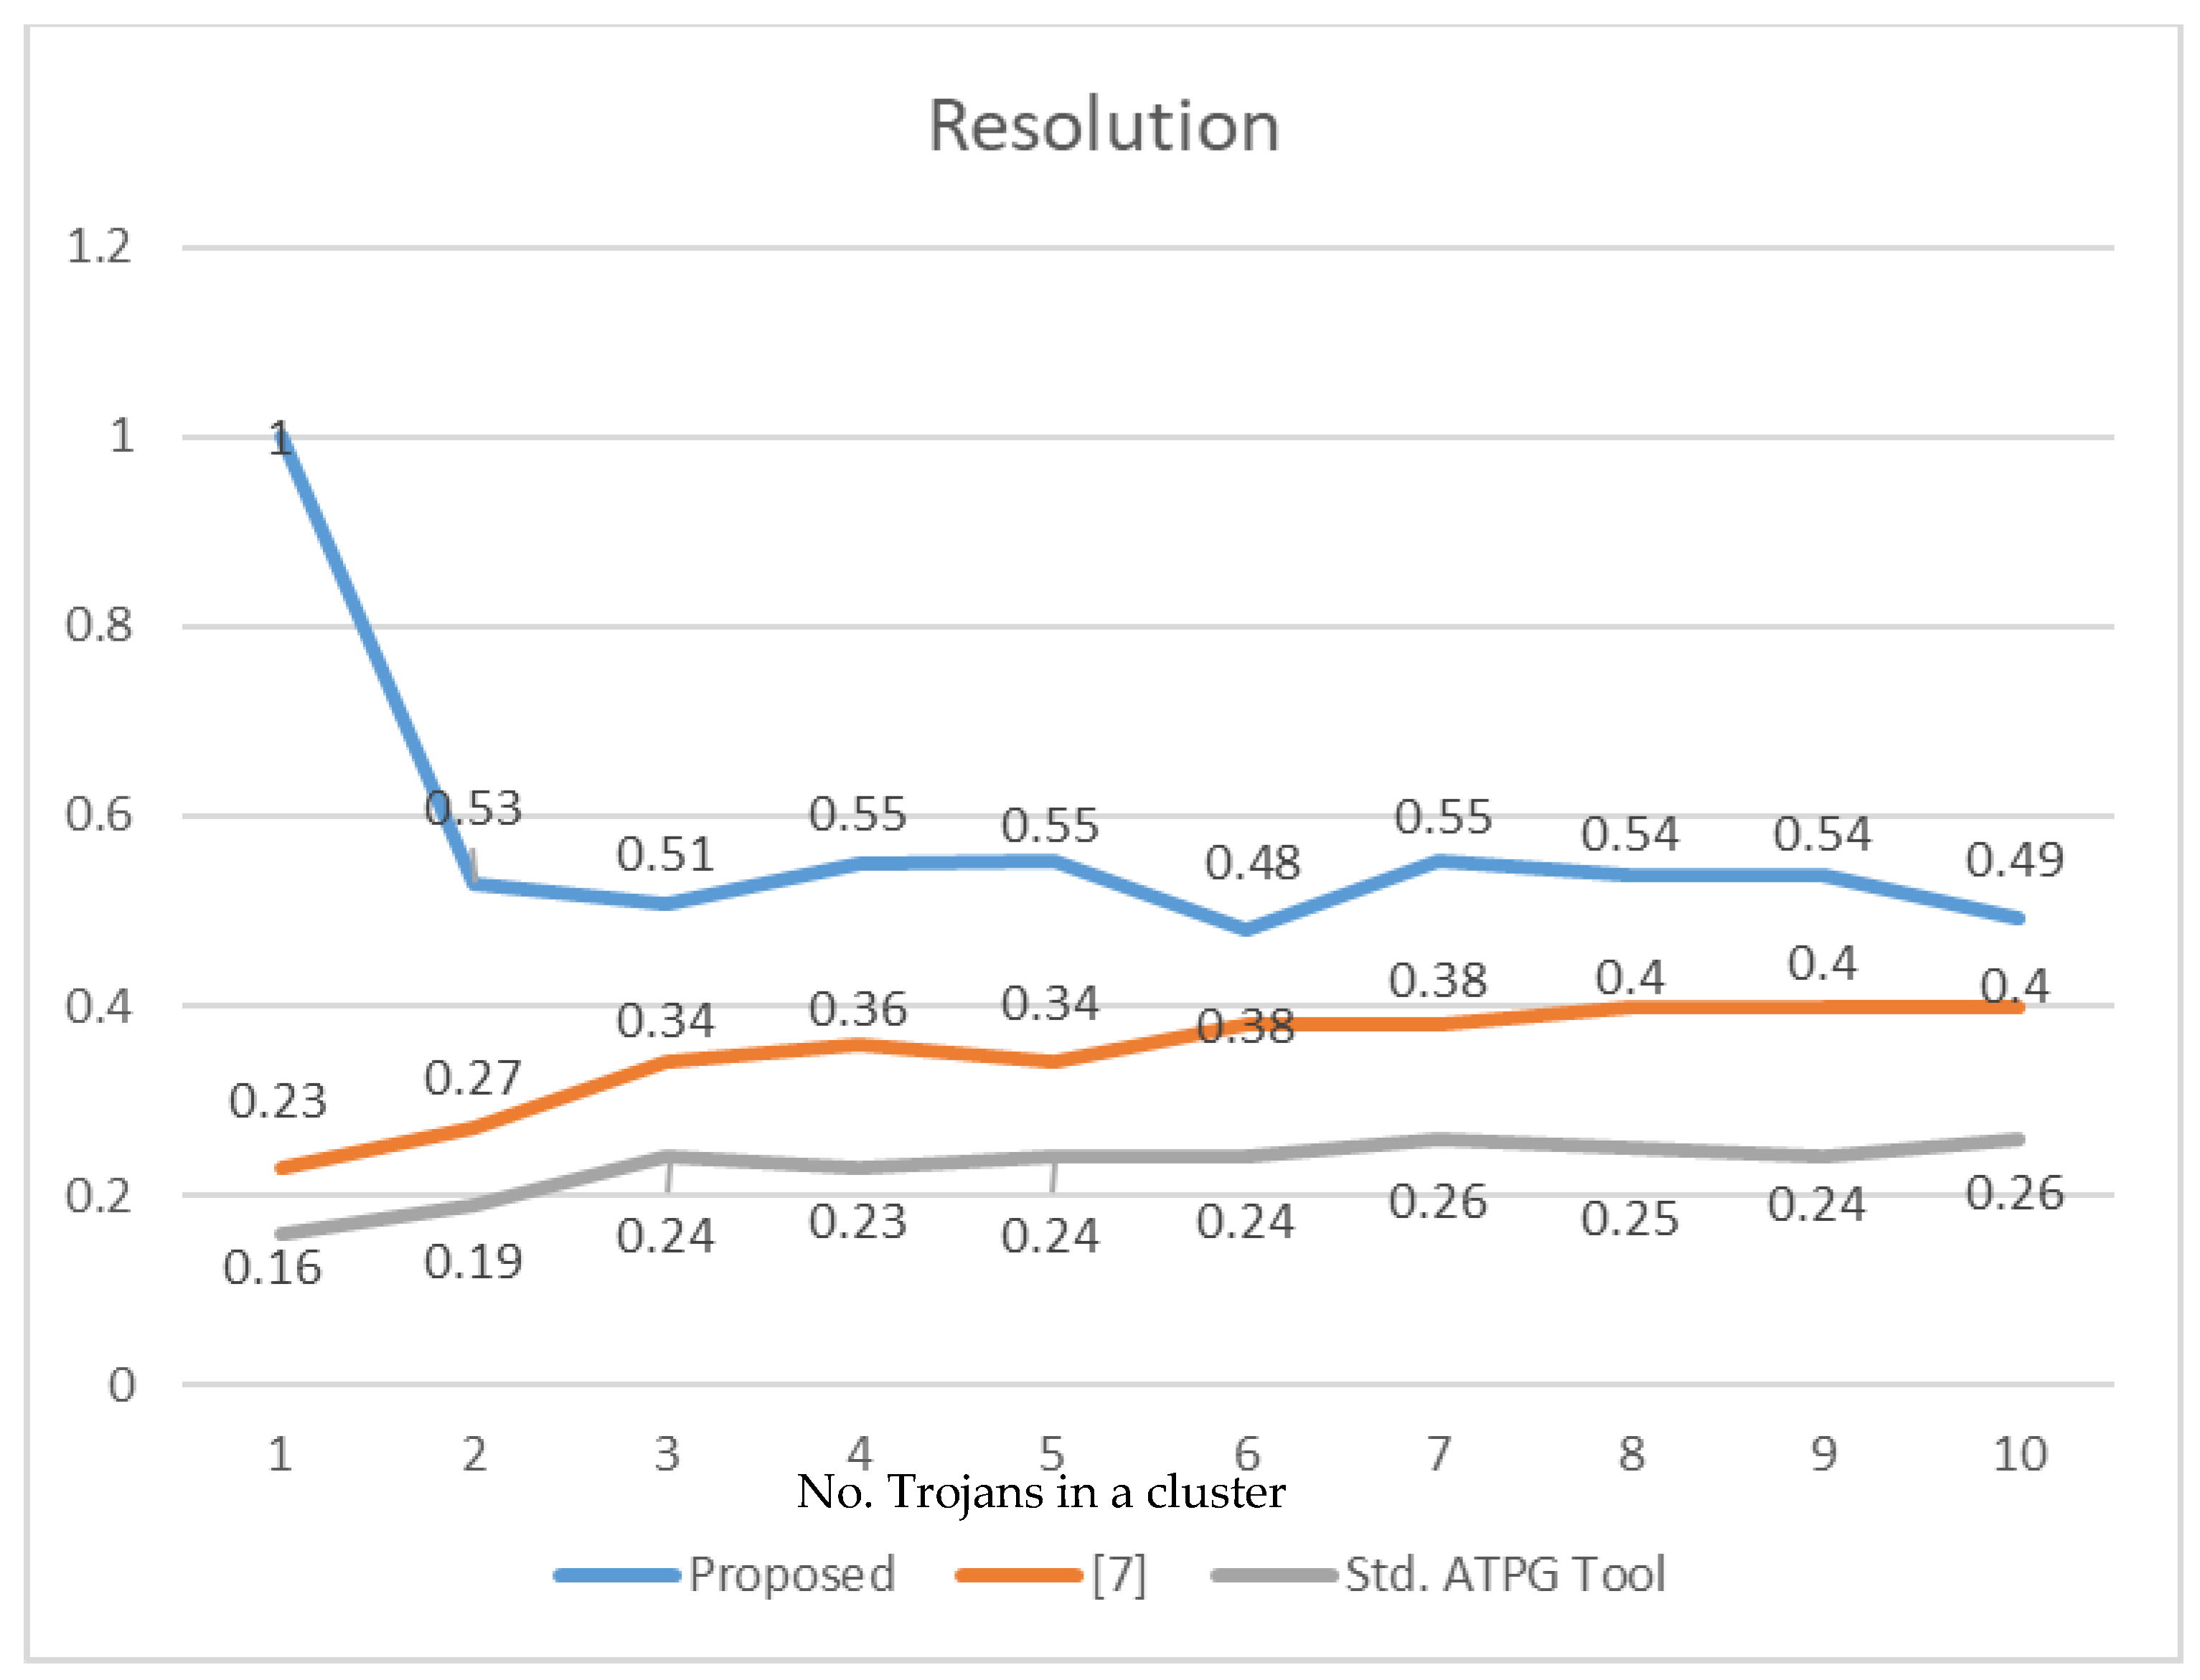
The accuracy and resolution of the proposed method for clustered multiple TDF diagnosis are reported in Table 3 and Table 4, respectively. It is observed that the accuracy and resolution decrease as the number of faults increases due to fault-masking and fault-reinforcement effects. However, the proposed method maintains a minimum accuracy of 0.79 even when ten clustered Trojans are injected into the CUDs. Similarly, the resolution also decreases as the number of clustered Trojans increases.
Figure 9 and Figure 10 compare the average accuracy and resolution of the proposed clustered Trojan procedure with [7] and Synopsys ATPG tool TMAX. There is a 46% increase in accuracy and a 34% increase in resolution compared to the ATPG tool. There is a 7% increase in accuracy and a 22% increase in resolution compared to [7]. The use of TTPs with high distinguishing capability followed by the crucial TC selection and K-means clustering algorithm has improved the accuracy and resolution of the proposed clustered multiple TDF diagnosis.
Table 5 compares the Trojan coverage (TrC) of the proposed method with [18]. The proposed method reports zero false positive cases. False negatives are reported only in s15850 and s38584 benchmark circuits. The false positives reported for s35932 are comparatively higher in [18]. This has reduced the TrC to 27%. The proposed method provides an average of 83% improvement in TrC. Table 6 compares the Trojan coverage, number of test patterns and test pattern generation time of the proposed method with [15] for ISCAS’89 benchmark circuit s5378. The proposed method tries to generate patterns that can activate multiple Trojans simultaneously. Hence there is a 2.4 times reduction in the number of patterns and over 25 times reduction in pattern generation time. Test cost is directly proportional to the number of test patterns and test generation time. Thus, the proposed method is cost efficient as compared to [15].
6. Conclusions
This paper proposes a Trojan Triggering pattern generation approach to detect Trojans that manifest as delays in the circuit. These Trojans cannot be necessary triggered by the test patterns as they can be injected in the non-critical path. The proposed method uses a novel approach to generate patterns by sensitizing the non-critical paths. This paper also considers the effect of clustered Trojan detection. Since the clustered Trojans cannot be activated using standard test patterns, the proposed method detects clustered Trojans using additional patterns generated for distinguishing TDFs. The proposed method uses only single fault simulation responses for predicting the clustered Trojans. Hence, any commercial ATPG tool with single fault simulation capability for TDFs can be used to implement the proposed procedure. A TTP generation algorithm generates the patterns required for testing and activating a Trojan circuit. These patterns are then used for clustered Trojan detection.
The accuracy and resolution of the proposed clustered Trojan detection procedure are improved further by applying crucial TC selection and K-means clustering algorithms. Some of the less significant TCs are neglected, thereby improving the resolution. It is also observed that keeping the crucial TCs improves the accuracy, thereby reducing the false positives and false negatives.
Author Contributions
Conceptualization, N.M. and J.P.A.; methodology, N.M.; software, N.M.; validation, J.P.A.; investigation, N.M.; resources, J.P.A.; data curation, N.M.; writing—original draft preparation, N.M.; writing—review and editing, J.P.A.; visualization, N.M.; supervision, J.P.A. All authors have read and agreed to the published version of the manuscript.
Funding
This research received no external funding.
Data Availability Statement
Not applicable.
Conflicts of Interest
The authors declare no conflict of interest.
References
- Bhasin, S.; Regazzoni, F. A survey on hardware trojan detection techniques. In Proceedings of the 2015 IEEE International Symposium on Circuits and Systems (ISCAS), Lisbon, Portugal, 24–27 May 2015; IEEE: Piscataway, NJ, USA, 2015; pp. 2021–2024. [Google Scholar] [CrossRef]
- Bhunia, S.; Hsiao, M.S.; Banga, M.; Narasimhan, S. Hardware trojan attacks: Threat analysis and countermeasures. Proc. IEEE 2014, 102, 1229–1247. [Google Scholar] [CrossRef]
- Surabhi, V.R.; Krishnamurthy, P.; Amrouch, H.; Basu, K.; Henkel, J.; Karri, R.; Khorrami, F. Hardware trojan detection using controlled circuit aging. IEEE Access 2020, 8, 77415–77434. [Google Scholar] [CrossRef]
- Wu, T.F.; Ganesan, K.; Hu, Y.A.; Wong, H.S.P.; Wong, S.; Mitra, S. TPAD: Hardware trojan prevention and detection for trusted integrated circuits. IEEE Trans. Comput. Des. Integr. Circuits Syst. 2016, 35, 521–534. [Google Scholar] [CrossRef] [Green Version]
- Reshma, K.; Priyatharishini, M.; Nirmala Devi, M. Hardware trojan detection using deep learning technique. Adv. Intell. Syst. Comput. 2019, 898, 671–680. [Google Scholar] [CrossRef]
- Shiny, M.I.; Nirmala Devi, M. Trustworthy Scan Design and Testability Using Obfuscation and Logic Locking Scheme for Wireless Network Application. Mob. Netw. Appl. 2022, 27, 1000–1018. [Google Scholar] [CrossRef]
- You, Y.S.; Liu, C.Y.; Wu, M.T.; Chen, P.W.; Li, J.C.M. Diagnosis technique for Clustered Multiple Transition Delay Faults. In Proceedings of the 2020 IEEE International Test Conference in Asia, ITC-Asia 2020, Taipei, Taiwan, 23–25 September 2020; Institute of Electrical and Electronics Engineers Inc.: Piscataway, NJ, USA, 2020; pp. 53–58. [Google Scholar]
- Waicukauski, J.A.; Lindbloom, E.; Rosen, B.K.; Iyengar, V.S. Transition fault simulation. IEEE Des. Test Comput. 1987, 4, 32–38. [Google Scholar] [CrossRef]
- Pomeranz, I.; Reddy, S.M. A delay fault model for at-speed fault simulation and test generation. In Proceedings of the 2006 IEEE/ACM International Conference on Computer-Aided Design (ICCAD), San Jose, CA, USA, 5–9 November 2006; pp. 89–95. [Google Scholar]
- Pomeranz, I. Diagnosis of Transition Fault Clusters. In Proceedings of the 48th Design Automation Conference, San Diego, CA, USA, 5–10 June 2011; Association for Computing Machinery (ACM): New York, NY, USA, 2011; pp. 429–434. [Google Scholar]
- Pomeranz, I. Classes of difficult-to-diagnose transition fault clusters. In Proceedings of the 2013 IEEE International Symposium on Defect and Fault Tolerance in VLSI Systems and Nanotechnology Systems (DFTS), New York, NY, USA, 2–4 October 2013; pp. 1–6. [Google Scholar]
- Mohan, N.; Anita, J.P. Test and diagnosis pattern generation for distinguishing stuck-at faults and bridging faults. Integration 2022, 83, 24–32. [Google Scholar] [CrossRef]
- Aloul, F.A.; Mneimneh, M.N.; Sakallah, K.A. ZBDD-Based Backtrack Search SAT Solver. In Proceedings of the 11th IEEE/ACM International Workshop on Logic & Synthesis, IWLS 2002, New Orleans, LA, USA, 4–7 June 2002; IEEE: Piscataway, NJ, USA, 2002; pp. 131–136. [Google Scholar]
- Ren, J.; Pan, W.W.; Zheng, Y.J.; Shi, Z.; Yan, X.L. Array based HV/VH tree: An effective data structure for layout representation. J. Zhejiang Univ. Sci. C 2012, 13, 232–237. [Google Scholar] [CrossRef]
- Cha, B.; Gupta, S.K. Trojan detection via delay measurements: A new approach to select paths and vectors to maximize effectiveness and minimize cost. In Proceedings of the 2013 Design, Automation & Test in Europe Conference & Exhibition (DATE), Grenoble, France, 18–22 March 2013; pp. 1265–1270. [Google Scholar]
- Somenzi, F. CUDD: CU Decision Diagram Package Release 2.7.0; University of Colorado Boulder: Boulder, CO, USA, 2018. [Google Scholar]
- Lee, K.J.; Wu, C.H. An efficient diagnosis-aware pattern generation procedure for transition faults. In Proceedings of the International Test Conference, Seattle, WA, USA, 20–23 October 2014; Institute of Electrical and Electronics Engineers Inc.: Piscataway, NJ, USA, 2015; pp. 1–10. [Google Scholar]
- Cakır, B.; Sharad, M. Hardware Trojan detection for gate-level ICs using signal correlation based clustering. In Proceedings of the 2015 Design, Automation & Test in Europe Conference & Exhibition (DATE), Grenoble, France, 9–13 March 2015; pp. 471–476. [Google Scholar]
Figure 1.
Types of Trojans. (a) Modification of the functional behavior; (b) Electrical changes; (c) transistor ageing [4].
Figure 1.
Types of Trojans. (a) Modification of the functional behavior; (b) Electrical changes; (c) transistor ageing [4].

Figure 2.
Examples of Slow-to-Rise and Slow-to Fall Faults.

Figure 3.
Timing diagram for (a) LOS scheme (b) LOC scheme.

Figure 4.
An example circuit to demonstrate types of Trojan clusters modelled as TDFs.

Figure 5.
(a) Observation cones for Type 1 pairs and (b) for Type 2 pairs.

Figure 6.
Overall flow for detecting clustered Trojans.

Figure 7.
Sample circuit for demonstrating TC Selection Algorithm.

Figure 8.
(a) The 2D plot of the TCs. (b) The plot for ONC (c) K-means clustering for K = 3.


Figure 9.
Comparison of accuracy of proposed clustered Trojan detection procedure with [7].
Figure 9.
Comparison of accuracy of proposed clustered Trojan detection procedure with [7].

Figure 10.
Comparison of resolution of proposed clustered Trojan detection procedure with [7].
Figure 10.
Comparison of resolution of proposed clustered Trojan detection procedure with [7].


Table 1.
Results of TTP generation algorithm on ISCAS’89, ITC’99 and IWLS’05 circuits.
| Circuit | #TDF | #FP | #TP | #TTP | INDIS | EQU | #Aborted | DR | False Negative |
|---|---|---|---|---|---|---|---|---|---|
| s5378 | 5342 | 14,265,811 | 287 | 63 | 651 | 181 | 0 | 1 | No |
| s9234 | 4324 | 9,346,326 | 371 | 73 | 532 | 120 | 0 | 1 | No |
| s13207 | 10,725 | 57,507,450 | 320 | 123 | 1826 | 678 | 0 | 1 | No |
| s15850 | 11,011 | 60,615,555 | 212 | 101 | 3656 | 1561 | 21 | 0.99 | Yes |
| s35932 | 30,811 | 474,643,455 | 111 | 15 | 4087 | 3670 | 0 | 1 | No |
| s38417 | 32,861 | 539,906,230 | 325 | 282 | 3564 | 732 | 0 | 1 | No |
| s38584 | 39,021 | 761,299,710 | 580 | 351 | 6785 | 4051 | 5 | 0.99 | Yes |
| b17 | 56374 | 1,588,985,751 | 2369 | 1496 | 27,356 | 11,047 | 0 | 1 | No |
| b18 | 136,482 | 93,13,599,921 | 1993 | 486 | 13,947 | 7349 | 0 | 1 | No |
| b14 | 24,948 | 3,111,888,78 | 666 | 231 | 4307 | 632 | 0 | 1 | No |
| b10 | 862 | 371,091 | 55 | 27 | 279 | 0 | 0 | 1 | No |
| simple_spi | 4052 | 8,207,326 | 40 | 22 | 1846 | 371 | 0 | 1 | No |
| USB_phy | 2732 | 3,730,546 | 76 | 58 | 29 | 1 | 0 | 1 | No |
Table 2.
Comparison of the proposed TTP generation algorithm with [17].
Table 2.
Comparison of the proposed TTP generation algorithm with [17].
| [17] | Proposed TTP Generation Algorithm | Comparison | ||||||||||
|---|---|---|---|---|---|---|---|---|---|---|---|---|
| Circuit | #TF | #FP | EQU | Ab | #TP | #DP | EQU | Ab | #TP | #TTP | % Reduction in EQU | % Reduction in #TP + #TTP |
| s5378 | 1862 | 1,732,591 | 141 | 0 | 104 | 56 | 98 | 0 | 117 | 32 | 30.5 | 6.9 |
| s9234 | 2373 | 2,814,378 | 83 | 0 | 169 | 45 | 56 | 0 | 175 | 34 | 32.5 | 2.3 |
| s13207 | 5548 | 15,387,378 | 528 | 0 | 144 | 102 | 321 | 0 | 156 | 86 | 39.2 | 1.6 |
| s15850 | 6352 | 20,170,776 | 1138 | 11 | 120 | 68 | 732 | 7 | 171 | 51 | 35.7 | −18.1 |
| s35932 | 14,680 | 107,743,860 | 2430 | 0 | 41 | 4 | 1670 | 0 | 50 | 5 | 31.3 | −22.2 |
| s38417 | 26,202 | 343,259,301 | 439 | 0 | 189 | 182 | 321 | 0 | 201 | 168 | 26.9 | 0.5 |
| s38584 | 22,669 | 256,930,446 | 2857 | 1 | 290 | 177 | 2041 | 0 | 310 | 159 | 28.6 | −0.4 |
Table 3.
Accuracy of proposed Clustered Trojan detection procedure.
| No. Trojans Injected | 1 | 2 | 3 | 4 | 5 | 6 | 7 | 8 | 9 | 10 | |
|---|---|---|---|---|---|---|---|---|---|---|---|
| Circuit | |||||||||||
| s38584 | 1 | 0.92 | 0.93 | 0.88 | 0.85 | 0.92 | 0.89 | 0.82 | 0.73 | 0.79 | |
| b17 | 1 | 0.97 | 0.89 | 0.94 | 0.88 | 0.87 | 0.91 | 0.79 | 0.84 | 0.8 | |
| b18 | 1 | 0.95 | 0.92 | 0.91 | 0.87 | 0.8 | 0.88 | 0.85 | 0.88 | 0.79 | |
| Average | 1 | 0.95 | 0.91 | 0.91 | 0.87 | 0.86 | 0.89 | 0.82 | 0.82 | 0.79 | |
Table 4.
Resolution of proposed Clustered Trojan detection procedure.
| No. Trojans Injected | 1 | 2 | 3 | 4 | 5 | 6 | 7 | 8 | 9 | 10 | |
|---|---|---|---|---|---|---|---|---|---|---|---|
| Circuit | |||||||||||
| s38584 | 1 | 0.52 | 0.45 | 0.59 | 0.55 | 0.49 | 0.57 | 0.54 | 0.51 | 0.49 | |
| b17 | 1 | 0.49 | 0.51 | 0.58 | 0.58 | 0.48 | 0.53 | 0.59 | 0.58 | 0.51 | |
| b18 | 1 | 0.58 | 0.56 | 0.48 | 0.53 | 0.47 | 0.56 | 0.48 | 0.52 | 0.48 | |
| Average | 1 | 0.53 | 0.51 | 0.55 | 0.55 | 0.48 | 0.55 | 0.54 | 0.54 | 0.49 | |
Table 5.
Comparison of the proposed method with [18].
Table 5.
Comparison of the proposed method with [18].
| Circuit | TrC (%) in [18] | TrC (%) in Proposed Method | % Improvement |
|---|---|---|---|
| S15850 | 61 | 99 | 62 |
| S35932 | 27 | 100 | 270 |
| S38417 | 100 | 100 | 0 |
| S38584 | 99 | 99 | 0 |
Table 6.
Comparison of the proposed method with [15].
Disclaimer/Publisher’s Note: The statements, opinions and data contained in all publications are solely those of the individual author(s) and contributor(s) and not of MDPI and/or the editor(s). MDPI and/or the editor(s) disclaim responsibility for any injury to people or property resulting from any ideas, methods, instructions or products referred to in the content. |
© 2023 by the authors. Licensee MDPI, Basel, Switzerland. This article is an open access article distributed under the terms and conditions of the Creative Commons Attribution (CC BY) license (https://creativecommons.org/licenses/by/4.0/).
Share and Cite
MDPI and ACS Style
Mohan, N.; Anita, J.P. Early Detection of Clustered Trojan Attacks on Integrated Circuits Using Transition Delay Fault Model. Cryptography 2023, 7, 4. https://doi.org/10.3390/cryptography7010004
AMA Style
Mohan N, Anita JP. Early Detection of Clustered Trojan Attacks on Integrated Circuits Using Transition Delay Fault Model. Cryptography. 2023; 7(1):4. https://doi.org/10.3390/cryptography7010004
Chicago/Turabian StyleMohan, Navya, and J. P. Anita. 2023. "Early Detection of Clustered Trojan Attacks on Integrated Circuits Using Transition Delay Fault Model" Cryptography 7, no. 1: 4. https://doi.org/10.3390/cryptography7010004