
Protocol to Assess the Biological Activity of Insulin Glargine, Insulin Lispro, and Insulin Aspart In Vitro

Abstract
:1. Introduction
2. Experimental Design
2.1. Materials
- Bovine Serum Albumin (Sigma, St. Louis, MO, USA, #A9647);
- 96-well microplate, black, polystyrene (Sigma, #CLS3603);
- 96 well plates, polypropylene (Sigma, #M9685-100EA);
- Accutase (Sigma, #A6964-100ML);
- 37% (w/v) formaldehyde solution (Sigma, #252549-25ML);
- Hygromycin B (Invitrogen, Waltham, MA, USA, #10687010);
- Ham’s F-12 Nutrient Mix with GlutaMAX (Invitrogen, #31765092);
- Fetal Bovine Serum, certified, heat-inactivated (Invitrogen, #A3840002);
- PBS, no calcium, no magnesium (Invitrogen, #14190250);
- CHO INSR 1284 (ATCC, Manassas, VA, USA, CRL-3307™);
- F-12K Medium (ATCC, #30-2004);
- Hoechst 33342 (Thermo Fisher, Waltham, MA, USA, #62249);
- Goat anti-Mouse IgG (H + L) secondary antibody, Alexa Fluor 488 (Invitrogen, #A28175);
- 75 cm2 cell culture flask (GSS, Reston, VA, USA, #CLS430641U-100EA);
- Triton X-100 (GSS, #1086432500);
- Polysorbate 20 (GSS, #1547925-2G);
- Dimethyl sulfoxide (GSS, #D2438-5X10ML);
- Anti-phosphotyrosine antibody (GSS, #05-321);
- USP Insulin Aspart (7.62 mg) (USP, Rockville, MD, USA, #1342037);
- USP Insulin Glargine (15.06 mg) (USP, #1342059);
- USP Insulin Lispro (5.73 mg) (USP, #1342321).
2.2. Equipment
- A plate reader with the capability to read:
- o
- Alexa Fluorophore 488: Ex/Em: 493/519
- o
- Hoechst 33342: Ex/Em: 361/486
- 2.
- Access to a biosafety cabinet that adheres to institutional BSL2 requirements to perform sterile cell culture.
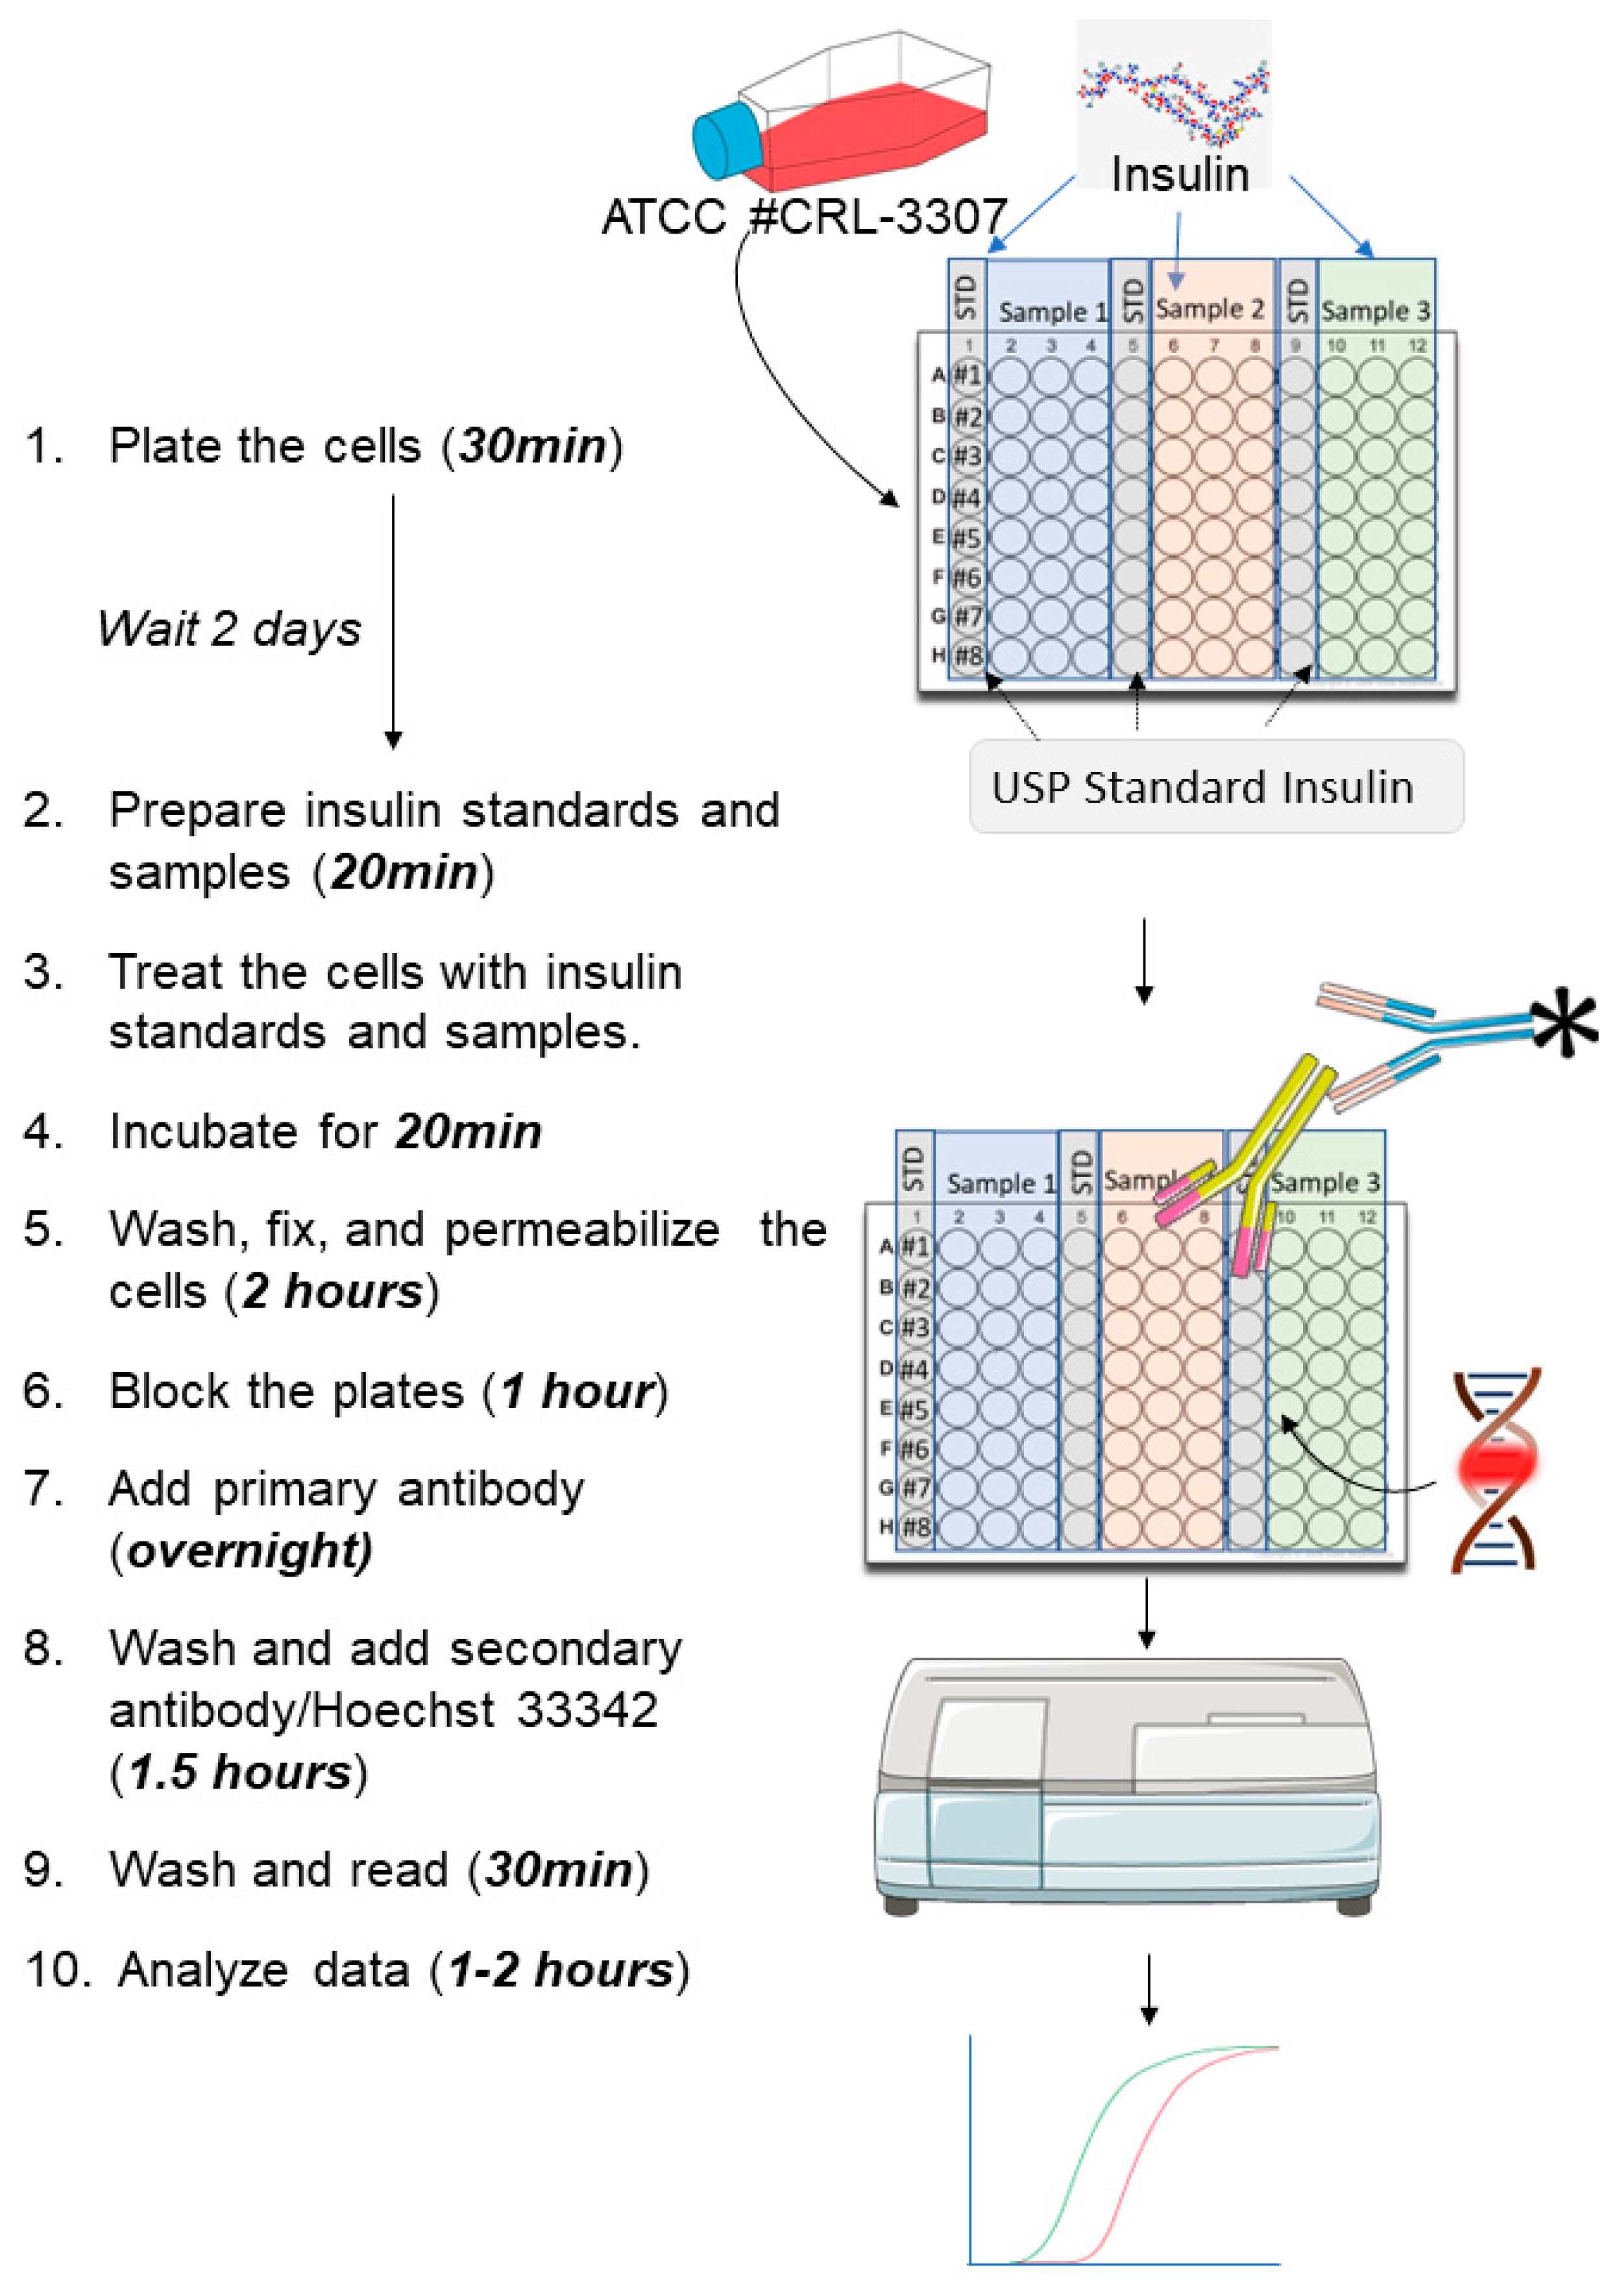
2.3. Experimental Design including the Time Needed to Complete Every Stage
3. Procedure
3.1. Cell Culture
- Culture CHO INSR 1284 cells in complete medium (Ham’s F-12/Glutamax + 10% (v/v) FBS, + 0.03% (v/v) hygromycinB) at 37 °C and 5% carbon dioxide (CO2) atmosphere in a humidified incubator;
- When cells reach 80–95% confluency, remove the flasks from the incubator and discard the media;
- Rinse the cells one time with 1.5 mL of Accutase;
- Add 2.5 mL of Accutase to the cells and place the flask in an incubator for about 2–3 min at 37 °C. Tap gently on the flask to detach the cells from the flask’s bottom. Add 5 mL of complete medium to stop the Accutase activity;
- Determine cell concentration and viability with trypan blue;
- Calculate the desired number of cells for seeding;
- Prepare at least two 96-well plates: For each plate, add 0.2 mL of cell solution at 0.9 × 10⁵ viable cells/mL in complete medium per well of a sterile 96-well, clear bottom, black polystyrene plate:
- o
- Mix the cell solution frequently during dispensing to prevent cells from settling and ensure consistent density throughout the plate;
- o
- Note: Two plates are necessary per run. One standard and three samples from two independent dilutions can be assessed using 2 plates;
- o
- OPTIONAL STEP: let the plates stand at room temperature for 30 min before transferring them into an incubator to minimize an edge effect;
- Cover the plates and incubate them at 37 °C with 5% CO2 for 2 days;
- CRITICAL STEP: Verify homogeneous monolayer growth and 90–95% confluency via microscope before performing the experiment.
3.2. Preparation of the Insulin Samples
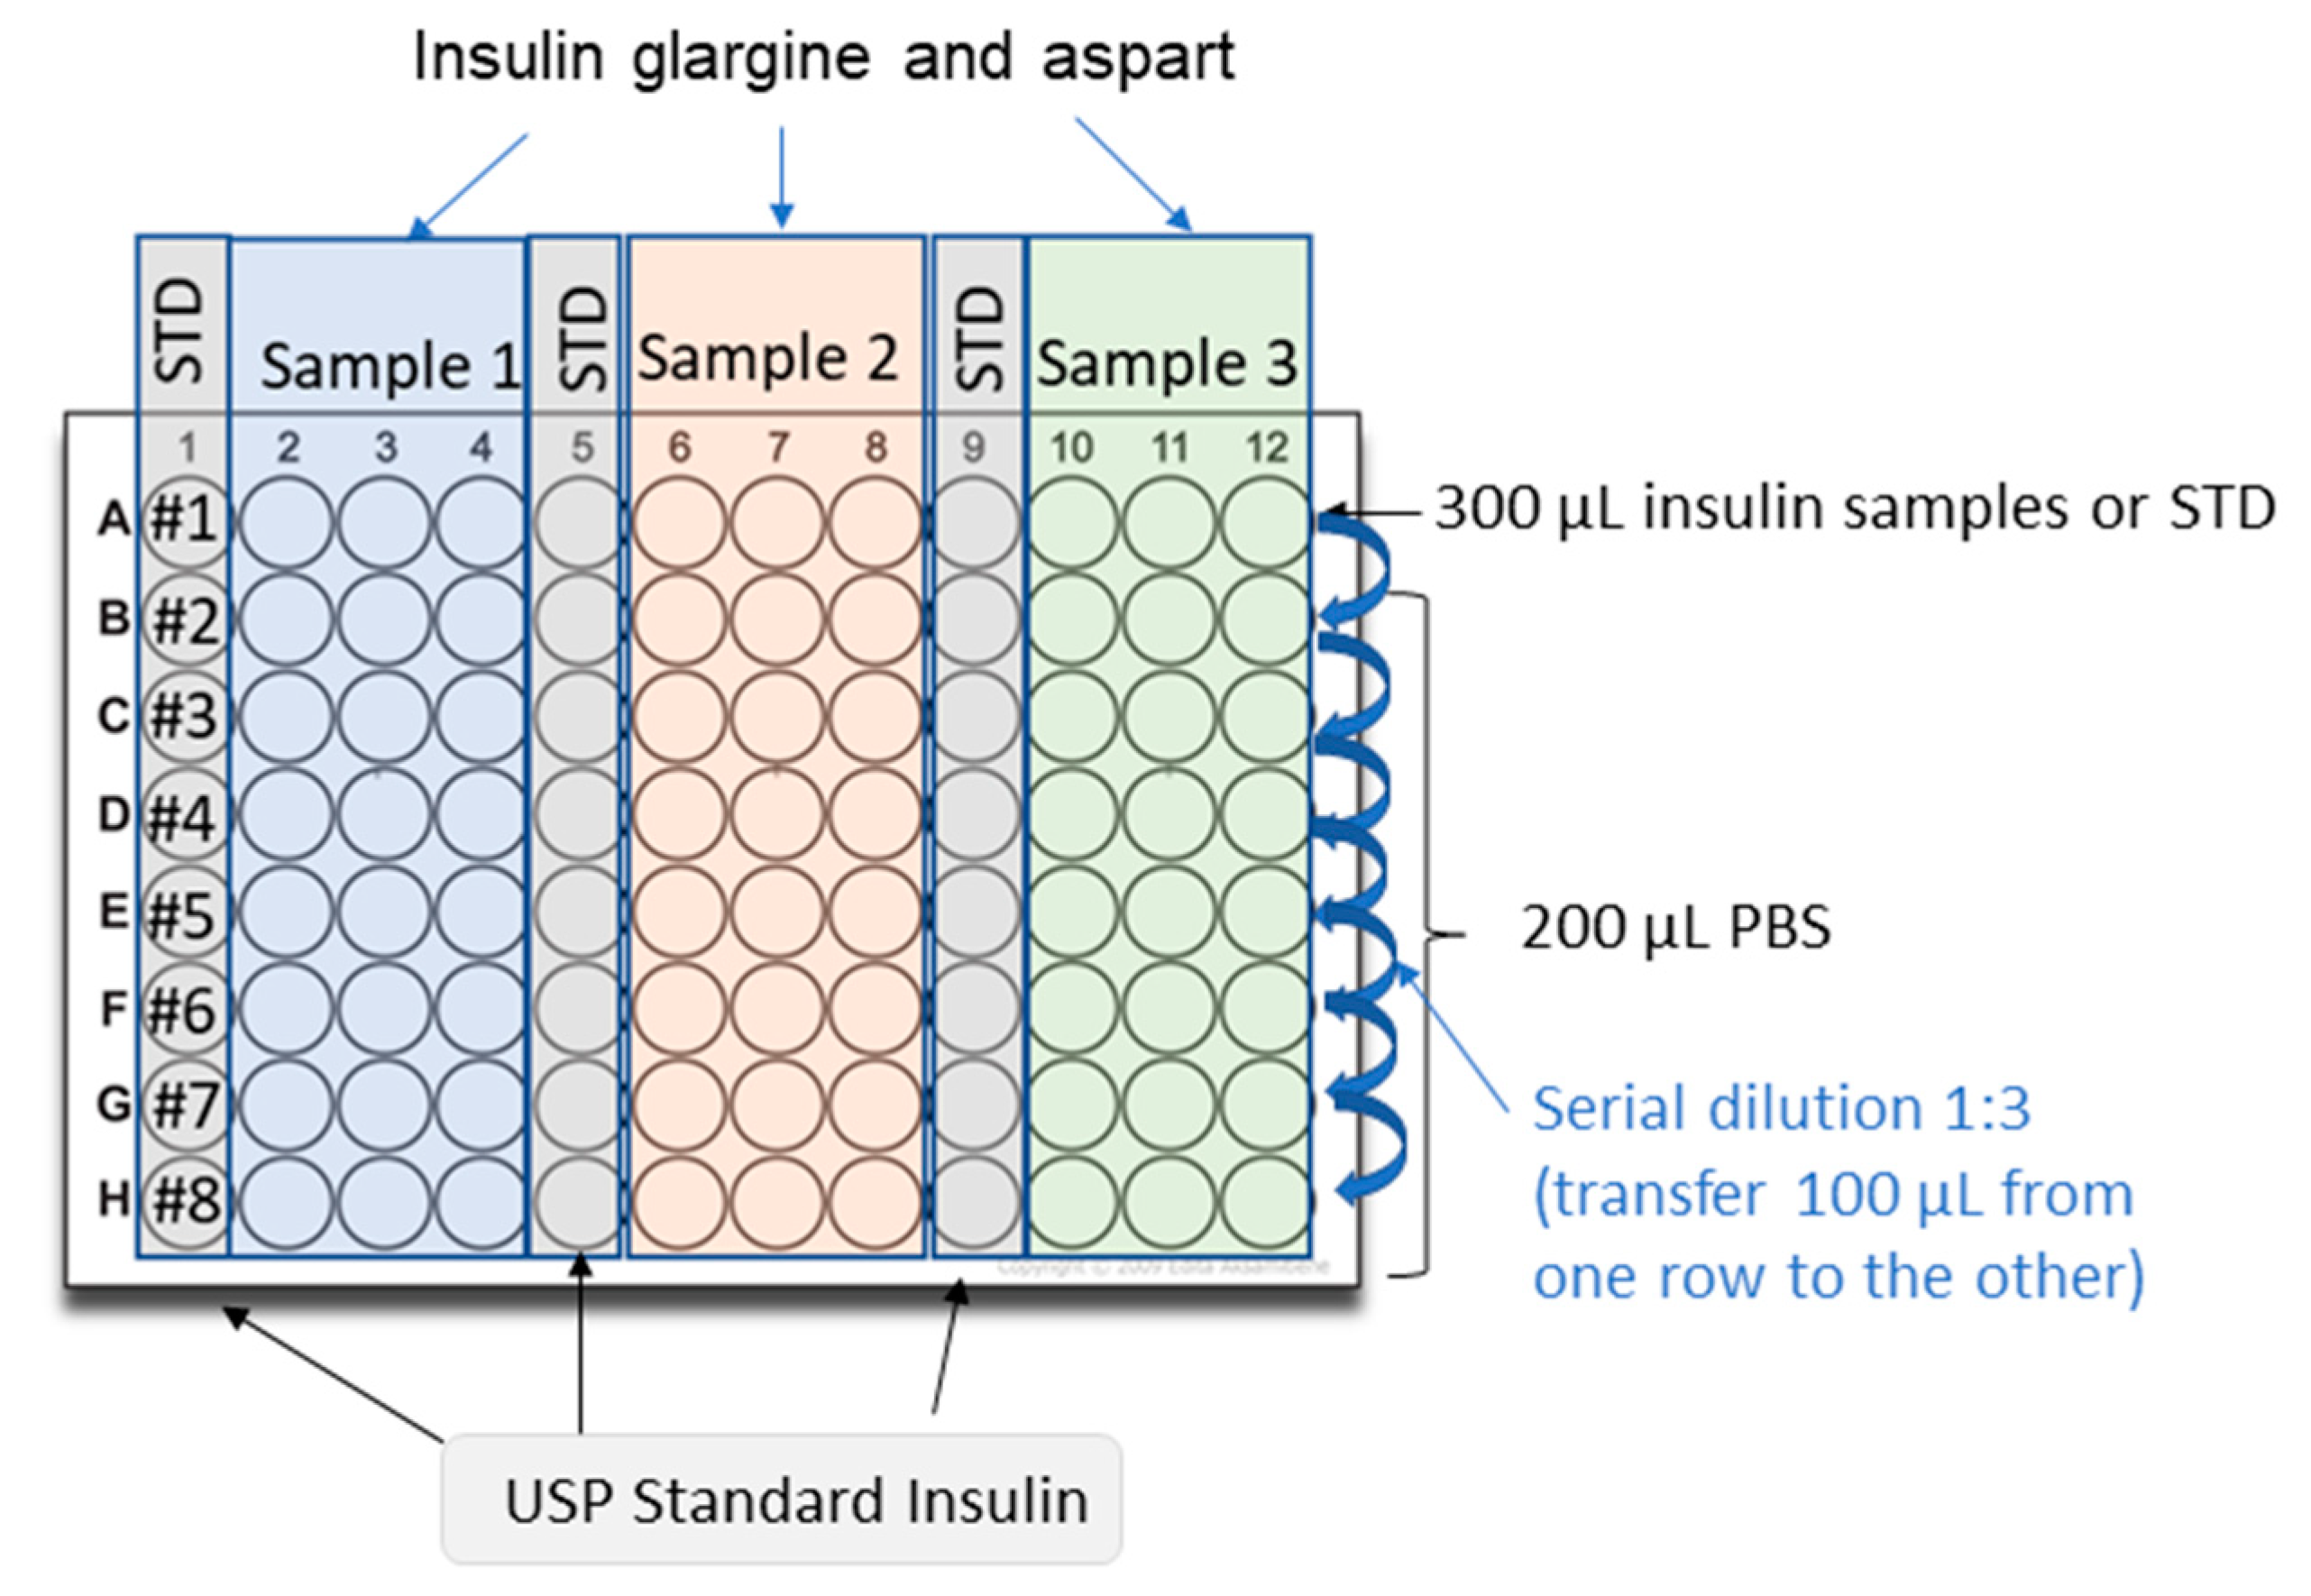
3.2.1. Insulin Glargine
- Dilute 100 U/mL USP insulin glargine in 0.01 N hydrochloric acid to generate a stock solution of 17 U/mL;
- Dilute the 17 U/mL standard stock solution to 0.34 U/mL with PBS. Prepare in duplicate for the preparation of the second plate;
- Dilute insulin samples to 0.34 U/mL in PBS. Prepare in duplicate for the preparation of the second plate;
- Add 200 μL of PBS solution to rows B-H of a 96-well polypropylene plate;
- Add 300 μL of standard (0.34 U/mL) into at least three wells of row A of the dilution plate;
- Add 300 μL of the first insulin sample (0.34 U/mL) into at least three wells of row A of the dilution plate;
- Add 300 μL of the second sample (if necessary) into at least three wells of row A of the dilution plate;
- Add 300 μL of the third sample (if necessary) into three wells of row A of the dilution plate;
- Perform simultaneously serial three-fold dilutions on the plate using a multichannel pipette:
- Transfer 100 μL of solution from row A to row B;
- Mix three times with a multichannel pipette;
- Transfer 100 μL of solution from row B to row C;
- Mix three times;
- Repeat this procedure across the whole plate up to row H;
- Repeat the procedure described above (steps 4–9) for the second plate using the solutions prepared in duplicate (steps 2–3).
3.2.2. Insulin Aspart
- Dilute 100 U/mL USP insulin aspart in PBS to generate a standard stock solution of 17 U/mL;
- Dilute the 17 U/mL standard stock solution to 0.34 U/mL with PBS. Prepare in duplicate for the preparation of the second plate;
- Prepare the insulin samples to be tested by diluting them to 0.34 U/mL in PBS. Prepare in duplicate for the preparation of the second plate;
- Add 200 μL of PBS solution rows B-H of a 96-well polypropylene plate;
- Add 300 μL of standard (0.34 U/mL) into at least three wells of row A of the dilution plate;
- Add 300 μL of the first sample (0.34 U/mL) into at least three wells of row A of the dilution plate;
- Add 300 μL of the second sample (if necessary) into at least three wells of row A of the dilution plate;
- Add 300 μL of the third sample (if necessary) into three wells of row A of the dilution plate;
- Perform simultaneously serial three-fold dilutions on the plate using a multichannel pipette:
- Transfer 100 μL of solution from row A to row B;
- Mix three times with a multichannel pipette;
- Transfer 100 μL of solution from row B to row C;
- Mix three times;
- Repeat this procedure across the whole plate up to row H;
- Repeat the procedure described above (steps 4–9) for the second plate of dilution using the solutions prepared in duplicate (steps 2–3).
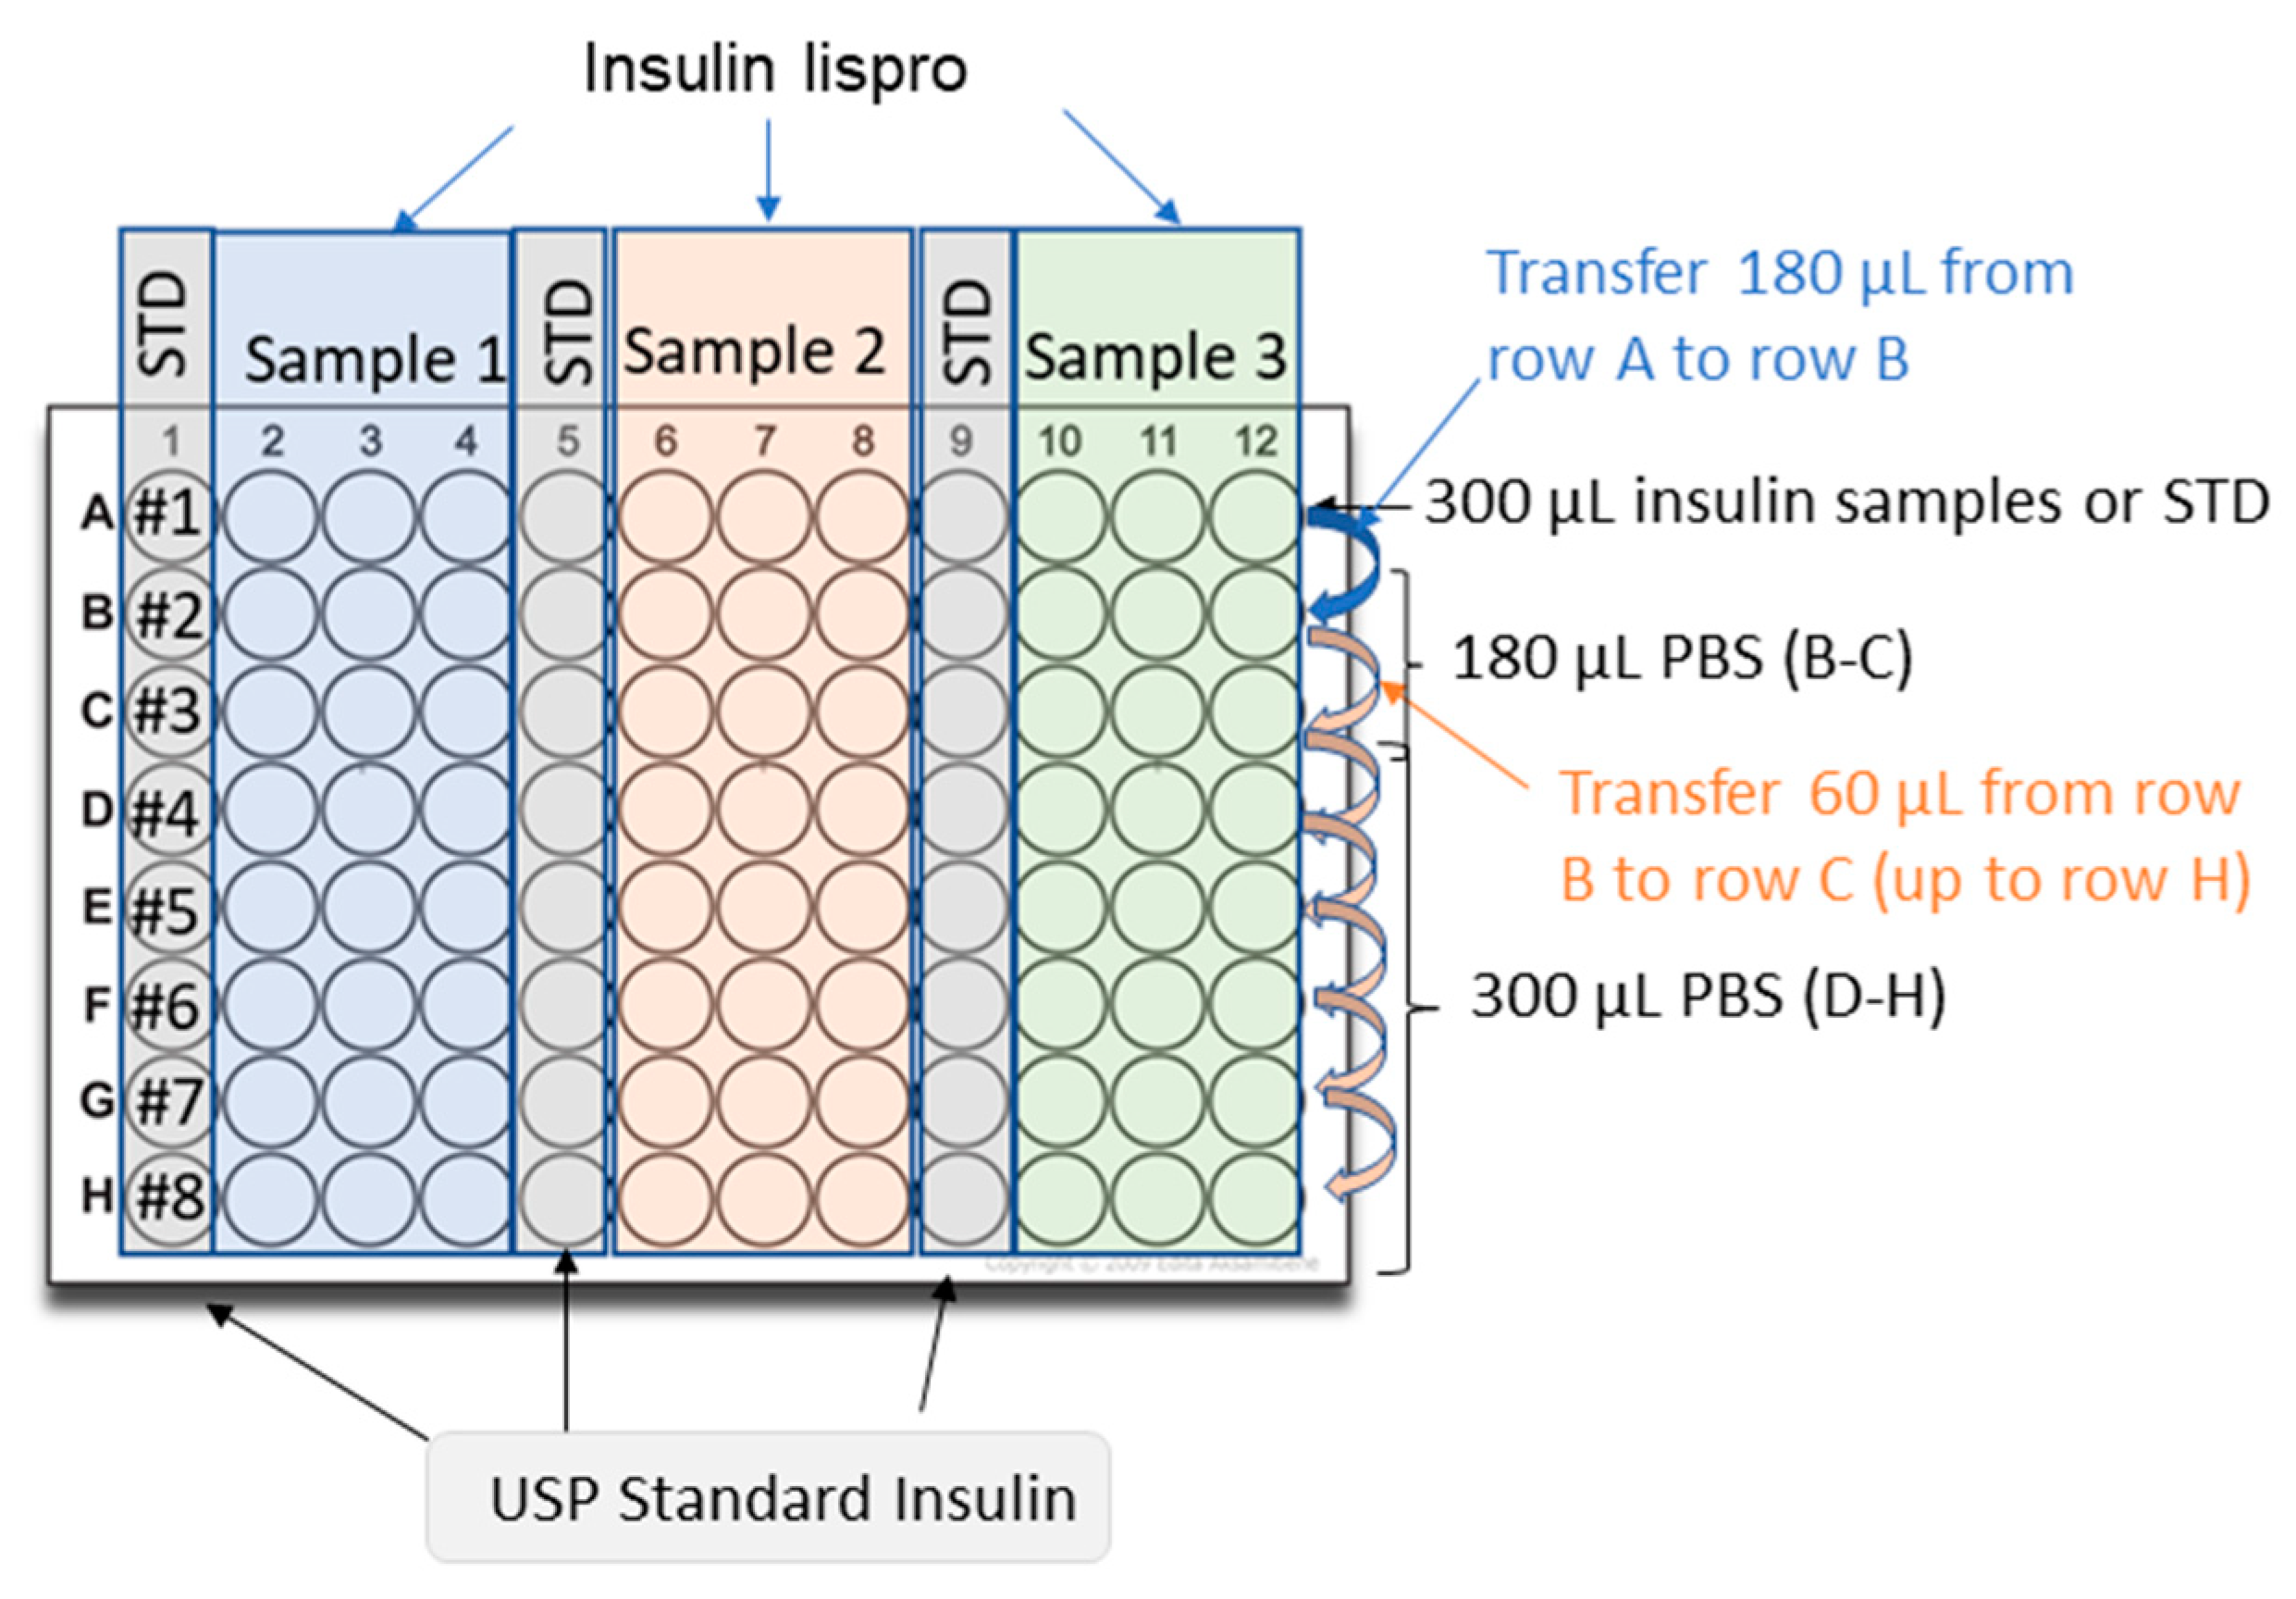
3.2.3. Insulin Lispro
- Dilute 100 U/mL USP insulin lispro in 0.1% (w/v) BSA in PBS to generate a stock solution of 10 U/mL;
- Dilute the 10 U/mL stock solution to 0.3 U/mL with 0.1% (w/v) BSA in PBS. Prepare in duplicate for the preparation of the second plate;
- Dilute insulin samples to 0.3 U/mL in 0.1% (w/v) BSA in PBS. Prepare in duplicate for the preparation of the second plate;
- Add 300 μL of 0.1% (w/v) BSA in PBS to rows D-H of a 96-well polypropylene plate;
- Add 180 μL of 0.1% (w/v) BSA in PBS into the wells of rows B and C;
- Add 300 μL of standard (0.3 U/mL) into at least three wells of row A of the dilution plate;
- Add 300 μL of the first sample (0.3 U/mL) into at least three wells of row A of the dilution plate;
- Add 300 μL of the second sample (if necessary) into at least three wells of row A of the dilution plate;
- Add 300 μL of the third sample (if necessary) into three wells of row A of the dilution plate;
- Perform simultaneously serial dilutions on the plate using a multichannel pipette:
- Transfer 120 μL of solution from row A to row B;
- Mix three times with a multichannel pipette;
- Transfer 60 μL of solution from row B to row C;
- Mix three times;
- Transfer 60 μL of solution from row C to row D;
- Mix three times;
- Repeat this procedure across the whole plate up to row H.
- Repeat the procedure described above (4–10) for the second plate using the solutions prepared in duplicate (steps 2–3).
3.3. Treatment of the Cells and Performing the in-Cell Western
- On the day of the experiment, remove media from the cells and wash each well once gently with PBS;
- Add 160 μL of Ham’s F-12/Glutamax (without FBS) to each well. Incubate plates for 3–5 h at 37 °C with 5% CO2;
- Add 40 μL per well of each dilution of insulin standard and test samples into the appropriate wells of the plate;
- CRITICAL STEP: Incubate the plates at 37 °C with 5% carbon dioxide (CO2) for 20 min;
- Discard the media and wash it one time with PBS;
- Add 150 μL of 3.7% formaldehyde solution per well (dilute the 37% formaldehyde solution in PBS) to fix the cells. Incubate the plates for 20 min with constant gentle orbital shaking (40–50 rpm);
- Discard the formaldehyde solution, wash it one time with PBS, and add 200 μL/wells of 0.2% (v/v) Triton X-100 (diluted in PBS) to permeabilize the cells;
- Incubate the plates for 10 min with constant gentle orbital shaking (40–50 rpm);
- Repeat the permeabilization step one more time.
- Discard the permeabilization solution, and wash 1 time with PBS:
- o
![Mps 06 00033 i001]() PAUSE STEP: the covered plate containing PBS could be stored at 4 °C overnight;
PAUSE STEP: the covered plate containing PBS could be stored at 4 °C overnight;
- Add 300 μL/well of blocking buffer (2% (w/v) BSA in PBS);
- Incubate the plates at room temperature for 1 h;
- Remove the blocking buffer and add 50 μL/well of primary antibody solution (dilute 1:1000 the anti-phospho-tyrosine mouse monoclonal antibody in 2% (w/v) BSA in PBS supplemented with 0.1% PS20);
- Cover the plates and incubate them at 2–8 °C overnight with gentle shaking;
- Discard the primary antibody solution and wash each well three times using 200 μL/well of washing solution (0.1% (v/v) PS20 in PBS). Perform each wash step under constant gentle shaking for about 7 min;
- Add 50 μL/well of the secondary antibody and Hoechst solution (dilute 1:1000 the goat anti-mouse secondary antibody conjugated with Alexa Fluor 488 into 2% (w/v) BSA in PBS supplemented with 0.2% PS20 and Hoechst 33342 at 0.5 µg/mL);
- Incubate the plates protected from light (use black lids or equivalent) for about 1 h with constant gentle shaking at room temperature;
- Discard the secondary antibody solution and wash each well three times using 200 μL of washing solution (0.1% (v/v) PS20 in PBS); perform each wash step under constant gentle orbital shaking for about 7 min;
- Keep the plates in 200 μL/well of washing solution (0.1% (v/v) PS20 in PBS), protected from light until measurement:
- o
![Mps 06 00033 i002]() PAUSE STEP: The plates containing the washing solution can be stored at 4 °C for a maximum of 24 h while protected from light;
PAUSE STEP: The plates containing the washing solution can be stored at 4 °C for a maximum of 24 h while protected from light;
- Read the plate in a plate reader with appropriate excitation and emission wavelengths:
- o
- Alexa Fluorophore 488: Ex/Em: 493/519;
- o
- Hoechst 33342: Ex/Em: 361/486.


4. Results
4.1. Analyses of the Data
- Normalize each well per number of cells using the assay signal detected from the secondary antibody relative to the signal from Hoechst;
- Subtract the background signal from the normalized signal. The background signal is the average of the normalized signals detected by the diluted standard solution at the lowest concentration of insulin;
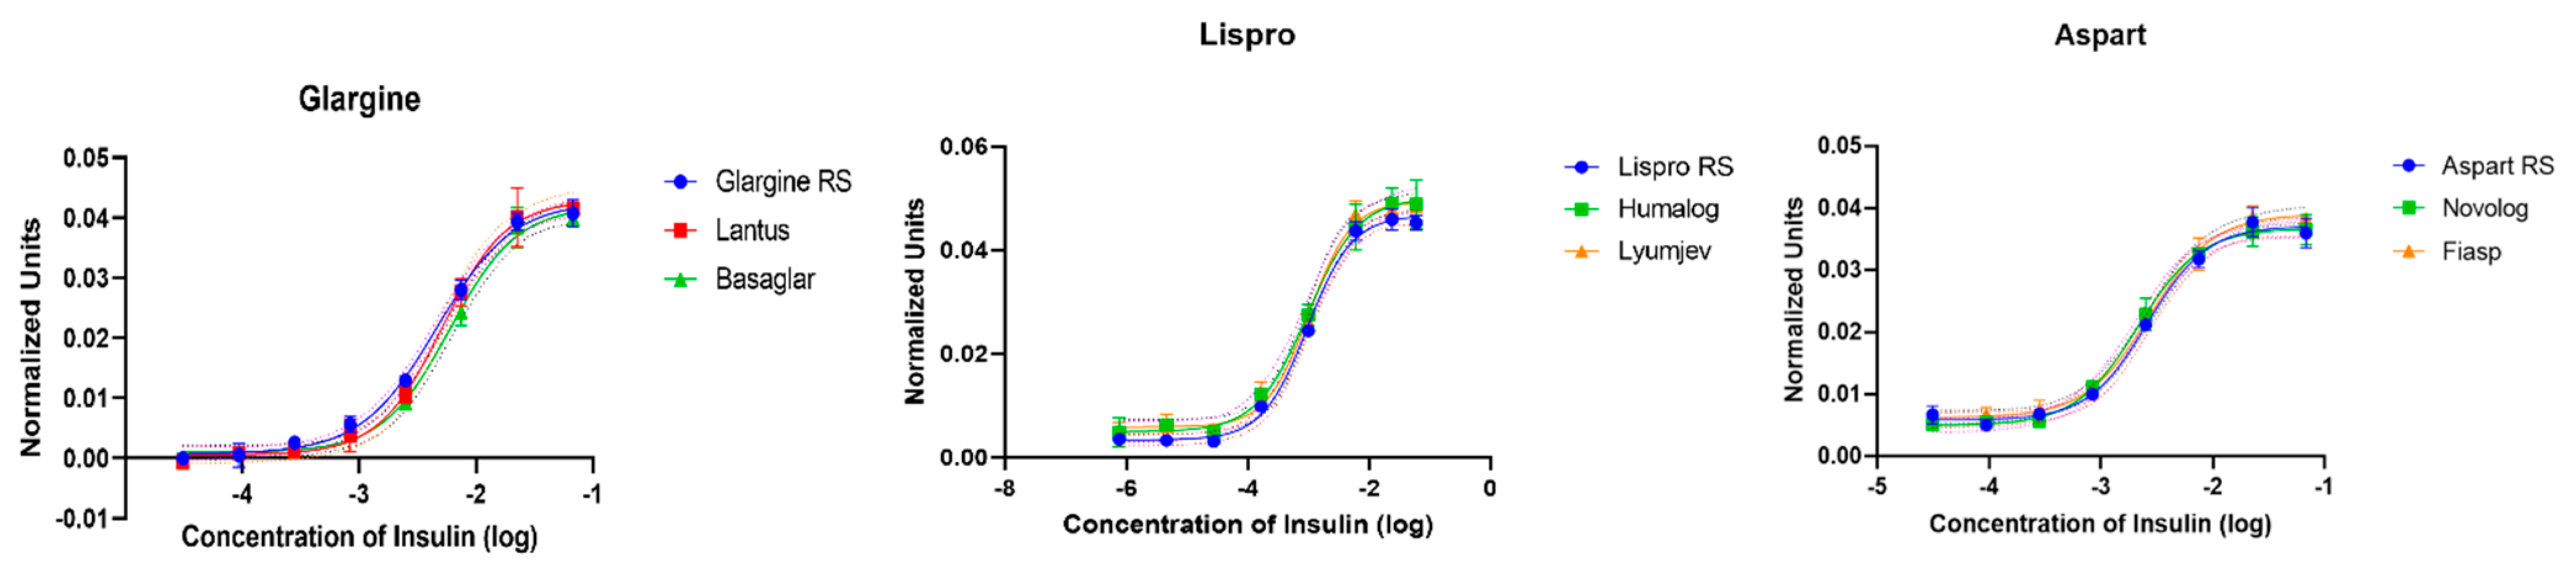
- Generate a 4PL dose-response curve for each standard and sample;
- The linearity of the curves (R2 ≥ 0.95) should be assessed for each curve;
- Determine EC50 for the standard curve and the samples from 4PL dose-response curves;
- Relative potency is calculated by dividing the EC50 from the standard with the EC50 from the sample and multiplying by 100. Relative Potency = (EC50, standard/EC50, sample) × 100;
- The mean relative potency is calculated by calculating the geometric mean of the relative potency of the two plates that were prepared in parallel;
- Relative bias (RB) for the relative potency of the samples is calculated for each plate from the relative potency calculated from each plate and the mean relative potency. RB plate x = [(relative potency plate x/mean relative potency) − 1] × 100;
- Additional parameters, including relative standard deviation, slope, and parallelism, could be used to ensure the consistency of this assay;
- Depending on the intended use of this assay, a full validation may be required to confirm that the assay is suitable for the intended purpose with predefined acceptance criteria for successful application.
4.2. Potential Results
5. Conclusions
Author Contributions
Funding
Institutional Review Board Statement
Informed Consent Statement
Data Availability Statement
Acknowledgments
Conflicts of Interest
References
- Fu, Z.; Gilbert, E.R.; Liu, D. Regulation of insulin synthesis and secretion and pancreatic Beta-cell dysfunction in diabetes. Curr. Diabetes Rev. 2013, 9, 25–53. [Google Scholar] [CrossRef] [PubMed]
- Nicol, D.S.; Smith, L.F. Amino-acid sequence of human insulin. Nature 1960, 187, 483–485. [Google Scholar] [CrossRef] [PubMed]
- Dunn, M.F. Zinc-ligand interactions modulate assembly and stability of the insulin hexamer—A review. Biometals 2005, 18, 295–303. [Google Scholar] [CrossRef] [PubMed]
- Haeusler, R.A.; McGraw, T.E.; Accili, D. Biochemical and cellular properties of insulin receptor signalling. Nat. Rev. Mol. Cell Biol. 2018, 19, 31–44. [Google Scholar] [CrossRef] [PubMed]
- Schmidt, A.M. Highlighting Diabetes Mellitus: The Epidemic Continues. Arteriosccler. Thromb. Vasc. Biol. 2018, 38, e1–e8. [Google Scholar] [CrossRef] [PubMed] [Green Version]
- Vecchio, I.; Tornali, C.; Bragazzi, N.L.; Martini, M. The Discovery of Insulin: An Important Milestone in the History of Medicine. Front. Endocrinol. 2018, 9, 613. [Google Scholar] [CrossRef] [PubMed] [Green Version]
- Quianzon, C.C.; Cheikh, I. History of insulin. J. Community Hosp. Intern. Med. Perspect. 2012, 2, 18701. [Google Scholar] [CrossRef] [PubMed] [Green Version]
- Centers for Disease Control and Prevention. Types of Insulin. 2022. Available online: https://www.cdc.gov/diabetes/basics/type-1-types-of-insulin.html (accessed on 10 March 2023).
- Hirsch, I.B.; Juneja, R.; Beals, J.M.; Antalis, C.J.; Wright, E.E. The Evolution of Insulin and How it Informs Therapy and Treatment Choices. Endocr. Rev. 2020, 41, 733–755. [Google Scholar] [CrossRef] [PubMed]
- Tibaldi, J.M. Evolution of Insulin Development: Focus on Key Parameters. Adv. Ther. 2012, 29, 590–619. [Google Scholar] [CrossRef] [PubMed]
- USP. Insulin Assays; US Pharmacopoeia: Rockville, MD, USA, 2015; Chapter 121. [Google Scholar]
- Hack, R.; Rueggeberg, S.; Schneider, L.; Mayert, D.; Tennagels, N.; Welte, S.; Niederhaus, B.; Arz, W.; Usener, D.; Troschau, G.; et al. Progress towards the replacement of the rabbit blood sugar bioidentity assay by an in vitro test for batch release of insulins in quality control. Altex 2017, 34, 565–566. [Google Scholar] [CrossRef] [PubMed] [Green Version]
- Franco, N.H.; Sandøe, P.; Olsson, I.A.S. Researchers’ attitudes to the 3Rs-An upturned hierarchy? PLoS ONE 2018, 13, e0200895. [Google Scholar] [CrossRef] [PubMed] [Green Version]
- Delbeck, S.; Krolinski, A.; Dederich, Y.; Stoppelkamp, S.; Heise, H.M. A Novel Approach for the Assessment of Insulin Potency by Glycemic Monitoring of an Insulin-Dependent Human Cell Line. J. Diabetes Sci. Technol. 2020, 14, 691–692. [Google Scholar] [CrossRef] [PubMed]
- Goyal, P.; Pai, H.V.; Kodali, P.; Vats, B.; Vajpai, N.; Annegowda, S.; Mane, K.; Mohan, S.; Saxena, S.; Veerabhadraia, A.B.; et al. Physicochemical and functional characterization of MYL-1501D, a proposed biosimilar to insulin glargine. PLoS ONE 2021, 16, e0253168. [Google Scholar] [CrossRef] [PubMed]
- Yie, J.; Dey, M.; Su, J.; Sergi, J.; Zhang, Y.; Le, T.H.; Kashi, S.; Gurney, K. Development of a robust functional cell-based assay for replacing the rabbit blood sugar bioidentity test of insulin glargine drug substance. J. Pharm. Biomed. Anal. 2020, 186, 113328. [Google Scholar] [CrossRef] [PubMed]
- Sommerfeld, M.R.; Müller, G.; Tschank, G.; Seipke, G.; Habermann, P.; Kurrle, R.; Tennagels, N. In vitro metabolic and mitogenic signaling of insulin glargine and its metabolites. PLoS ONE 2010, 5, e9540. [Google Scholar] [CrossRef] [PubMed]
- Kaufmann, B.; Boulle, P.; Berthou, F.; Fournier, M.; Beran, D.; Ciglenecki, I.; Townsend, M.; Schmidt, G.; Shah, M.; Cristofani, S.; et al. Heat-stability study of various insulin types in tropical temperature conditions: New insights towards improving diabetes care. PLoS ONE 2021, 16, e0245372. [Google Scholar] [CrossRef]


| Values in Comparison to USP Reference Standards | Relative Potency (RP, %) | Mean Relative Potency (MU, %) | % CV | Relative Bias (RB) | ||
|---|---|---|---|---|---|---|
| Insulin glargine | Plate A | Plate B | Plate A | Plate B | ||
| Lantus | 90.22 | 104.26 | 97.24 | 10.21 | −6.97 | 7.49 |
| Basaglar | 104.61 | 95.54 | 100.07 | 6.41 | 4.64 | −4.43 |
| Insulin lispro | Plate A | Plate B | Plate A | Plate B | ||
| Humalog | 91.69 | 108.1 | 99.89 | 11.60 | −7.89 | 8.57 |
| Lyumjev | 95.94 | 84.98 | 90.46 | 8.57 | 6.26 | −5.88 |
| Insulin aspart | Plate A | Plate B | Plate A | Plate B | ||
| Novolog | 112.12 | 95.91 | 104.01 | 11.46 | 8.12 | −7.51 |
| Fiasp | 105.61 | 96.5 | 101.05 | 6.44 | 4.614 | −4.41 |
Disclaimer/Publisher’s Note: The statements, opinions and data contained in all publications are solely those of the individual author(s) and contributor(s) and not of MDPI and/or the editor(s). MDPI and/or the editor(s) disclaim responsibility for any injury to people or property resulting from any ideas, methods, instructions or products referred to in the content. |
© 2023 by the authors. Licensee MDPI, Basel, Switzerland. This article is an open access article distributed under the terms and conditions of the Creative Commons Attribution (CC BY) license (https://creativecommons.org/licenses/by/4.0/).
Share and Cite
Garige, M.; Ghosh, S.; Roelofs, B.; Rao, V.A.; Sourbier, C. Protocol to Assess the Biological Activity of Insulin Glargine, Insulin Lispro, and Insulin Aspart In Vitro. Methods Protoc. 2023, 6, 33. https://doi.org/10.3390/mps6020033
Garige M, Ghosh S, Roelofs B, Rao VA, Sourbier C. Protocol to Assess the Biological Activity of Insulin Glargine, Insulin Lispro, and Insulin Aspart In Vitro. Methods and Protocols. 2023; 6(2):33. https://doi.org/10.3390/mps6020033
Chicago/Turabian StyleGarige, Mamatha, Susmita Ghosh, Brian Roelofs, V. Ashutosh Rao, and Carole Sourbier. 2023. "Protocol to Assess the Biological Activity of Insulin Glargine, Insulin Lispro, and Insulin Aspart In Vitro" Methods and Protocols 6, no. 2: 33. https://doi.org/10.3390/mps6020033