
Mastering DNA Content Estimation by Flow Cytometry as an Efficient Tool for Plant Breeding and Biodiversity Research


Abstract
:1. Introduction
2. Experimental Design

| Variables | Difficulties | Options | References |
|---|---|---|---|
| Tissue choice | High secondary metabolite content, sturdy tissues, high level of endopolyploidy | Young leaves are preferred. It is possible to use other tissues, callus and seeds. | [1,15] |
| Lysis buffer | Poor isolation of nuclei, too much debris | Otto, LB01, Galbraith, Tris-MgCl2 and other buffers | [9,14] |
| Buffer supplements | Secondary metabolites perturb DNA staining. Loss of reproducibility | Ascorbic acid, β-mercaptoethanol, sodium metabisulfite, Polyvinylpyrrolidone (PVP) supplements | [16] |
| Nuclei isolation | Poor isolation of nuclei, too much debris | Adjust chopping or bead beating time and vigor, use a new razor blade | [6,8,10,17] |
| Cytometer setup and maintenance | Results are not reproducible, poor peak quality, no peaks | Cytometer startup, quality control and cleaning | Flow cytometer manufacturer’s guidelines |
| Acquisition settings | Population of nuclei is not found, too much non-nuclear debris is visible | Adjust gain, threshold and plot properties | [18], Flow cytometer manufacturer’s guidelines |
| Data processing | Poor peak CV (coefficient of variation). High DNA content/ploidy variation between experimental repeats. | The instrument deep clean and/or de-bubbling is needed. Different buffers or antioxidants should be tried. | The references above |
2.1. Materials
- Plant sample and reference standard tissue (for details refer to Section 3.1.1).
- Lysis buffer components (for buffer recipes refer to Supplementary Tables S1–S5).
- NaOH and HCl for adjusting pH.
- PI stock solution (Sigma-Aldrich, St. Louis, MO, USA; Cat. no. P4170). Dilute powder in MilliQ or dH2O to stock concentration 1 mg/mL. Take time to fully dissolve PI. CAUTION: MUTAGEN, TOXIC. Handle with gloves, do not inhale. Store in a dark location at 4 °C.
- DAPI stock solution (Sigma-Aldrich, USA; Cat. no. D9542). Dilute powder (stored at room temperature) in MilliQ or ddH2O to stock concentration 1 mg/mL. Store the stock solution in a dark location at −20 °C.
- RNase A, DNase and protease-free (10 mg/mL) (ThermoFisher Scientific, Waltham, MA, USA; Cat. no. EN0531).
- Ascorbic acid.
- Sodium metabisulfite.
- β-mercaptoethanol (Sigma-Aldrich, USA; Cat. no. M6250). CAUTION: TOXIC.
- PVP with different molecular weights (10–40K) e.g., PVP10 (Sigma-Aldrich, USA; Cat. no. PVP10) or PVP40 (Sigma-Aldrich, USA; Cat. no. PVP40).
- Sodium azide.
- Calibration beads recommended by the cytometer manufacturer (e.g., CytoFLEX Daily QC fluorospheres, Beckman Coulter, Brea, CA, USA; Cat. no. B53230).
- Sheath fluid recommended by the cytometer manufacturer (e.g., CytoFLEX Sheath Fluid, Beckman Coulter, USA; Cat. no. B51503) or homemade options described in Section 3.2.1.
- Decontamination solution, e.g., diluted Contrad 70: H2O = 1:1 (Contrad 70, Beckman Coulter, USA; Cat. no. 81911).
- Cleaning solution (e.g., FlowClean Cleaning Agent, Beckman Coulter, USA; Cat. no. A64669).
- Bleach.
2.2. Equipment and Disposables
- Flow cytometer with a software provided by a manufacturer. This has to have a light source with the fluorochrome excitation wavelength—535 or 358 nm for PI or DAPI, respectively (e.g., CytoFLEX Beckman Coulter, USA, Cat. no. B53017).
- pH-meter.
- pH calibration solutions.
- Tissue homogenizer (e.g., TissueLyser, Qiagen, Germany)—optional.
- Plastic Petri dishes (60 or 100 mm). Plastic dishes are preferred since razor blades remain sharp longer.
- Razor blades
- A 20–50 µm mesh or a pre-separation filter (e.g., 30 µm filter, Miltenyi Biotec, 130-041-407). Can be reused if immediately washed with tap water and rinsed with dH2O.
- Flow cytometry tubes (e.g., Beckman Coulter, USA; Cat. no. 2523749)
- Tube racks
- Ice container or ice pads.
- Micropipette and suitable tips (10, 200, 1000 µL).
- Nitrile gloves of appropriate size.
- A computer with flow cytometry software e.g., Flowing software (free option) or a commercial software.
3. Procedure and Expected Results
3.1. Sample Preparation
3.1.1. Sample and Reference Standard Tissue Collection
 PAUSE STEP. Fresh sample and reference standard tissues are preferred, but it is possible to store them at 4 °C wrapped in a moistened paper in a Petri dish for up to several days (a preliminary test is needed to make sure it works for the species of interest).
 3.1.2. Lysis Buffer Preparation
- Prepare the buffer based on the recipe and adjust pH (Supplementary Tables S1–S5). Different buffers should be tested for a new species.
- Prechill to 4 °C.
![Mps 06 00018 i002]() PAUSE STEP, Store the buffer in the fridge (except for Otto II, which is stored at room temperature). To prevent contamination, this is sterile filtered after preparation and aliquot. Galbraith buffer aliquots can be frozen for future use (do not refreeze) [8]. The addition of preservatives such as sodium azide can also be considered.
PAUSE STEP, Store the buffer in the fridge (except for Otto II, which is stored at room temperature). To prevent contamination, this is sterile filtered after preparation and aliquot. Galbraith buffer aliquots can be frozen for future use (do not refreeze) [8]. The addition of preservatives such as sodium azide can also be considered.
3.1.3. Buffer Supplement Addition
- Immediately before measurements add RNase at 50 µg/mL.RNase addition might be omitted for some samples, although it should be tested for each case separately. In general, leaves have lower RNA content, but meristem and seed cells are abundant with RNA [19].
- Immediately before measurements, add an antioxidant such as 0.2 mg/mL ascorbic acid, 10 mM sodium metabisulfite, 15 mM β-mercaptoethanol (CAUTION: TOXIC). PVP (v/v 1–2%) with different molecular weights (10–40 K) can be used for tannin binding [16].
![Mps 06 00018 i001]() CRITICAL STEP. If sample darkening is observed (for instance, beet leaves turn brown without antioxidants within minutes), the addition of antioxidants becomes a key step for reducing negative secondary metabolite effects, i.e., uneven staining leading to unreproducible results.
CRITICAL STEP. If sample darkening is observed (for instance, beet leaves turn brown without antioxidants within minutes), the addition of antioxidants becomes a key step for reducing negative secondary metabolite effects, i.e., uneven staining leading to unreproducible results.
3.1.4. Addition of a DNA-Specific Fluorescent Dye
- Add the fluorescent dye to the lysis buffer.
![Mps 06 00018 i001]() CRITICAL STEP. There should be saturating dye concentration in the solution to prevent variation in the dye uptake due to different numbers of nuclei in different samples. The final concentration for Propidium iodide (PI) is 50 µg/mL (CAUTION: MUTAGEN). 4′,6-diamidino-2-phenylindole (DAPI) is used at 4 µg/mL concentration. Other DNA-specific fluorescent dyes can also be considered [4].
CRITICAL STEP. There should be saturating dye concentration in the solution to prevent variation in the dye uptake due to different numbers of nuclei in different samples. The final concentration for Propidium iodide (PI) is 50 µg/mL (CAUTION: MUTAGEN). 4′,6-diamidino-2-phenylindole (DAPI) is used at 4 µg/mL concentration. Other DNA-specific fluorescent dyes can also be considered [4].
3.1.5. Isolation of Nuclei
- Put a small piece of plant tissue (5–50 mg) on a Petri dish. Add an ice-cold buffer (300 to 1000 µL). Keep the sample on ice.
- Mechanically disrupt tissues to isolate nuclei.
 CRITICAL STEP. The blade must be sharp to cut the tissue in fine slices because squeezing or crushing damages the nuclei. Keep chopping in one direction like cutting bread and do not go back and forth to avoid damage to the nuclei. Use less material for chopping, since more tissue produces more debris. Thick leaves might need less chopping. For instance, fine chopping of cabbage leaves produces a lot of debris, but cutting the leaf a few times is enough for peak quality.
 ![Mps 06 00018 i001]() CRITICAL STEP. Filter the sample through a 20–50 µm nylon mesh or a filter (the smaller pore size can be used for smaller nuclei). This is a required to prevent the cytometer clogging.
CRITICAL STEP. Filter the sample through a 20–50 µm nylon mesh or a filter (the smaller pore size can be used for smaller nuclei). This is a required to prevent the cytometer clogging.- OPTIONAL STEP. Recalcitrant samples can be gently centrifuged and resuspended in a fresh buffer to remove secondary metabolites.
3.1.6. Sample Incubation
- OPTIONAL STEP. Add a DNA-specific fluorescent dye to the sample if it was not added to the buffer prior to isolation of nuclei (Section 3.1.4).
- Incubate the sample on ice from a few minutes to 1 h. Some samples should be analyzed immediately after preparation to avoid sample oxidation.
![Mps 06 00018 i001]() CRITICAL STEP. Incubation time has to be determined for each species experimentally. If incubation time is too short, the staining of nuclei will be incomplete. If incubation time is too long, staining can decline due to secondary metabolites.
CRITICAL STEP. Incubation time has to be determined for each species experimentally. If incubation time is too short, the staining of nuclei will be incomplete. If incubation time is too long, staining can decline due to secondary metabolites.
3.2. Instrument Setup and Maintenance
3.2.1. Instrument Startup
- Record the session in the instrument use journal or online calendar.
- Refill Sheath fluid container (for some machines this has to be done on working machines in a standby position).
- Empty waste container (for some machines this has to be done on working machines in a standby position).
- Switch uninterruptible power supply if applicable (recommended if power shortage is possible in the area).
- Switch the cytometer button on.
- Switch the computer on.
- Start the flow cytometry program.
- Run the System Startup Program (or Priming/Initialization). Follow the instrument instructions.
3.2.2. Instrument Quality Control (QC)
CRITICAL STEP. Perform QC every time the instrument is used to ensure accuracy and sensitivity of the instrument.- Start QC/Standardization function in the cytometer program or a separate calibration software (for BD Biosystems cytometers).
- Prepare the instrument manufacturer recommended fluorescent beads. Vortex the beads and add them to distilled water or bead dilution buffer according to manufacturer’s instructions.
- Vortex or tap the tube with the beads and load them into the tube holder.
- Enter lot-specific target values for the calibration beads.
- Run the quality control.
3.2.3. Daily Clean
3.2.4. Daily Shut Down
- Perform Daily Clean (or a specialized Shutdown function for some instruments) according to the manual instructions.
- Empty the waste bottle and add bleach, refill sheath fluid.
- Exit the program and switch off the system.
3.2.5. System Decontamination
- Regularly perform System Deep Clean (or System Flush, Decontaminate System function for some machines) to remove debris and microbial growth.
CRITICAL STEP. Deep Clean can be carried out if acquisition problems occur. If populations are drifting, their amplitudes are decreasing and CV is increasing, it is possible that the flow cell needs decontamination, or bubbles are present in the system. Run Priming and Deep Clean.- Sheath fluid and waste bottle should be decontaminated regularly according to manufacturer’s guidelines.
3.3. Acquisition Settings and Plot Setup
3.3.1. Creating Experiment from a Template
- The settings from a previous experiment can be used: the experiment can be saved as a template. Then create a new experiment from template. This will have all the settings from the previous experiment. Alternatively, open a pre-existing experiment, start recording new data, delete data from the previous experiment, save under a new name.
- If there is no template available, follow the instructions below.
- Prepare the samples (see the protocol in Sample preparation section).
3.3.2. Creating a New Experiment
- Create a New Experiment, select a location for the experiment file.
- Select channels that will be used. Use detection from a single laser that is closer to the dye excitation wavelength (535 or 358 nm for PI or DAPI, respectively).
- No compensation is needed since the single fluorescent channel is used.
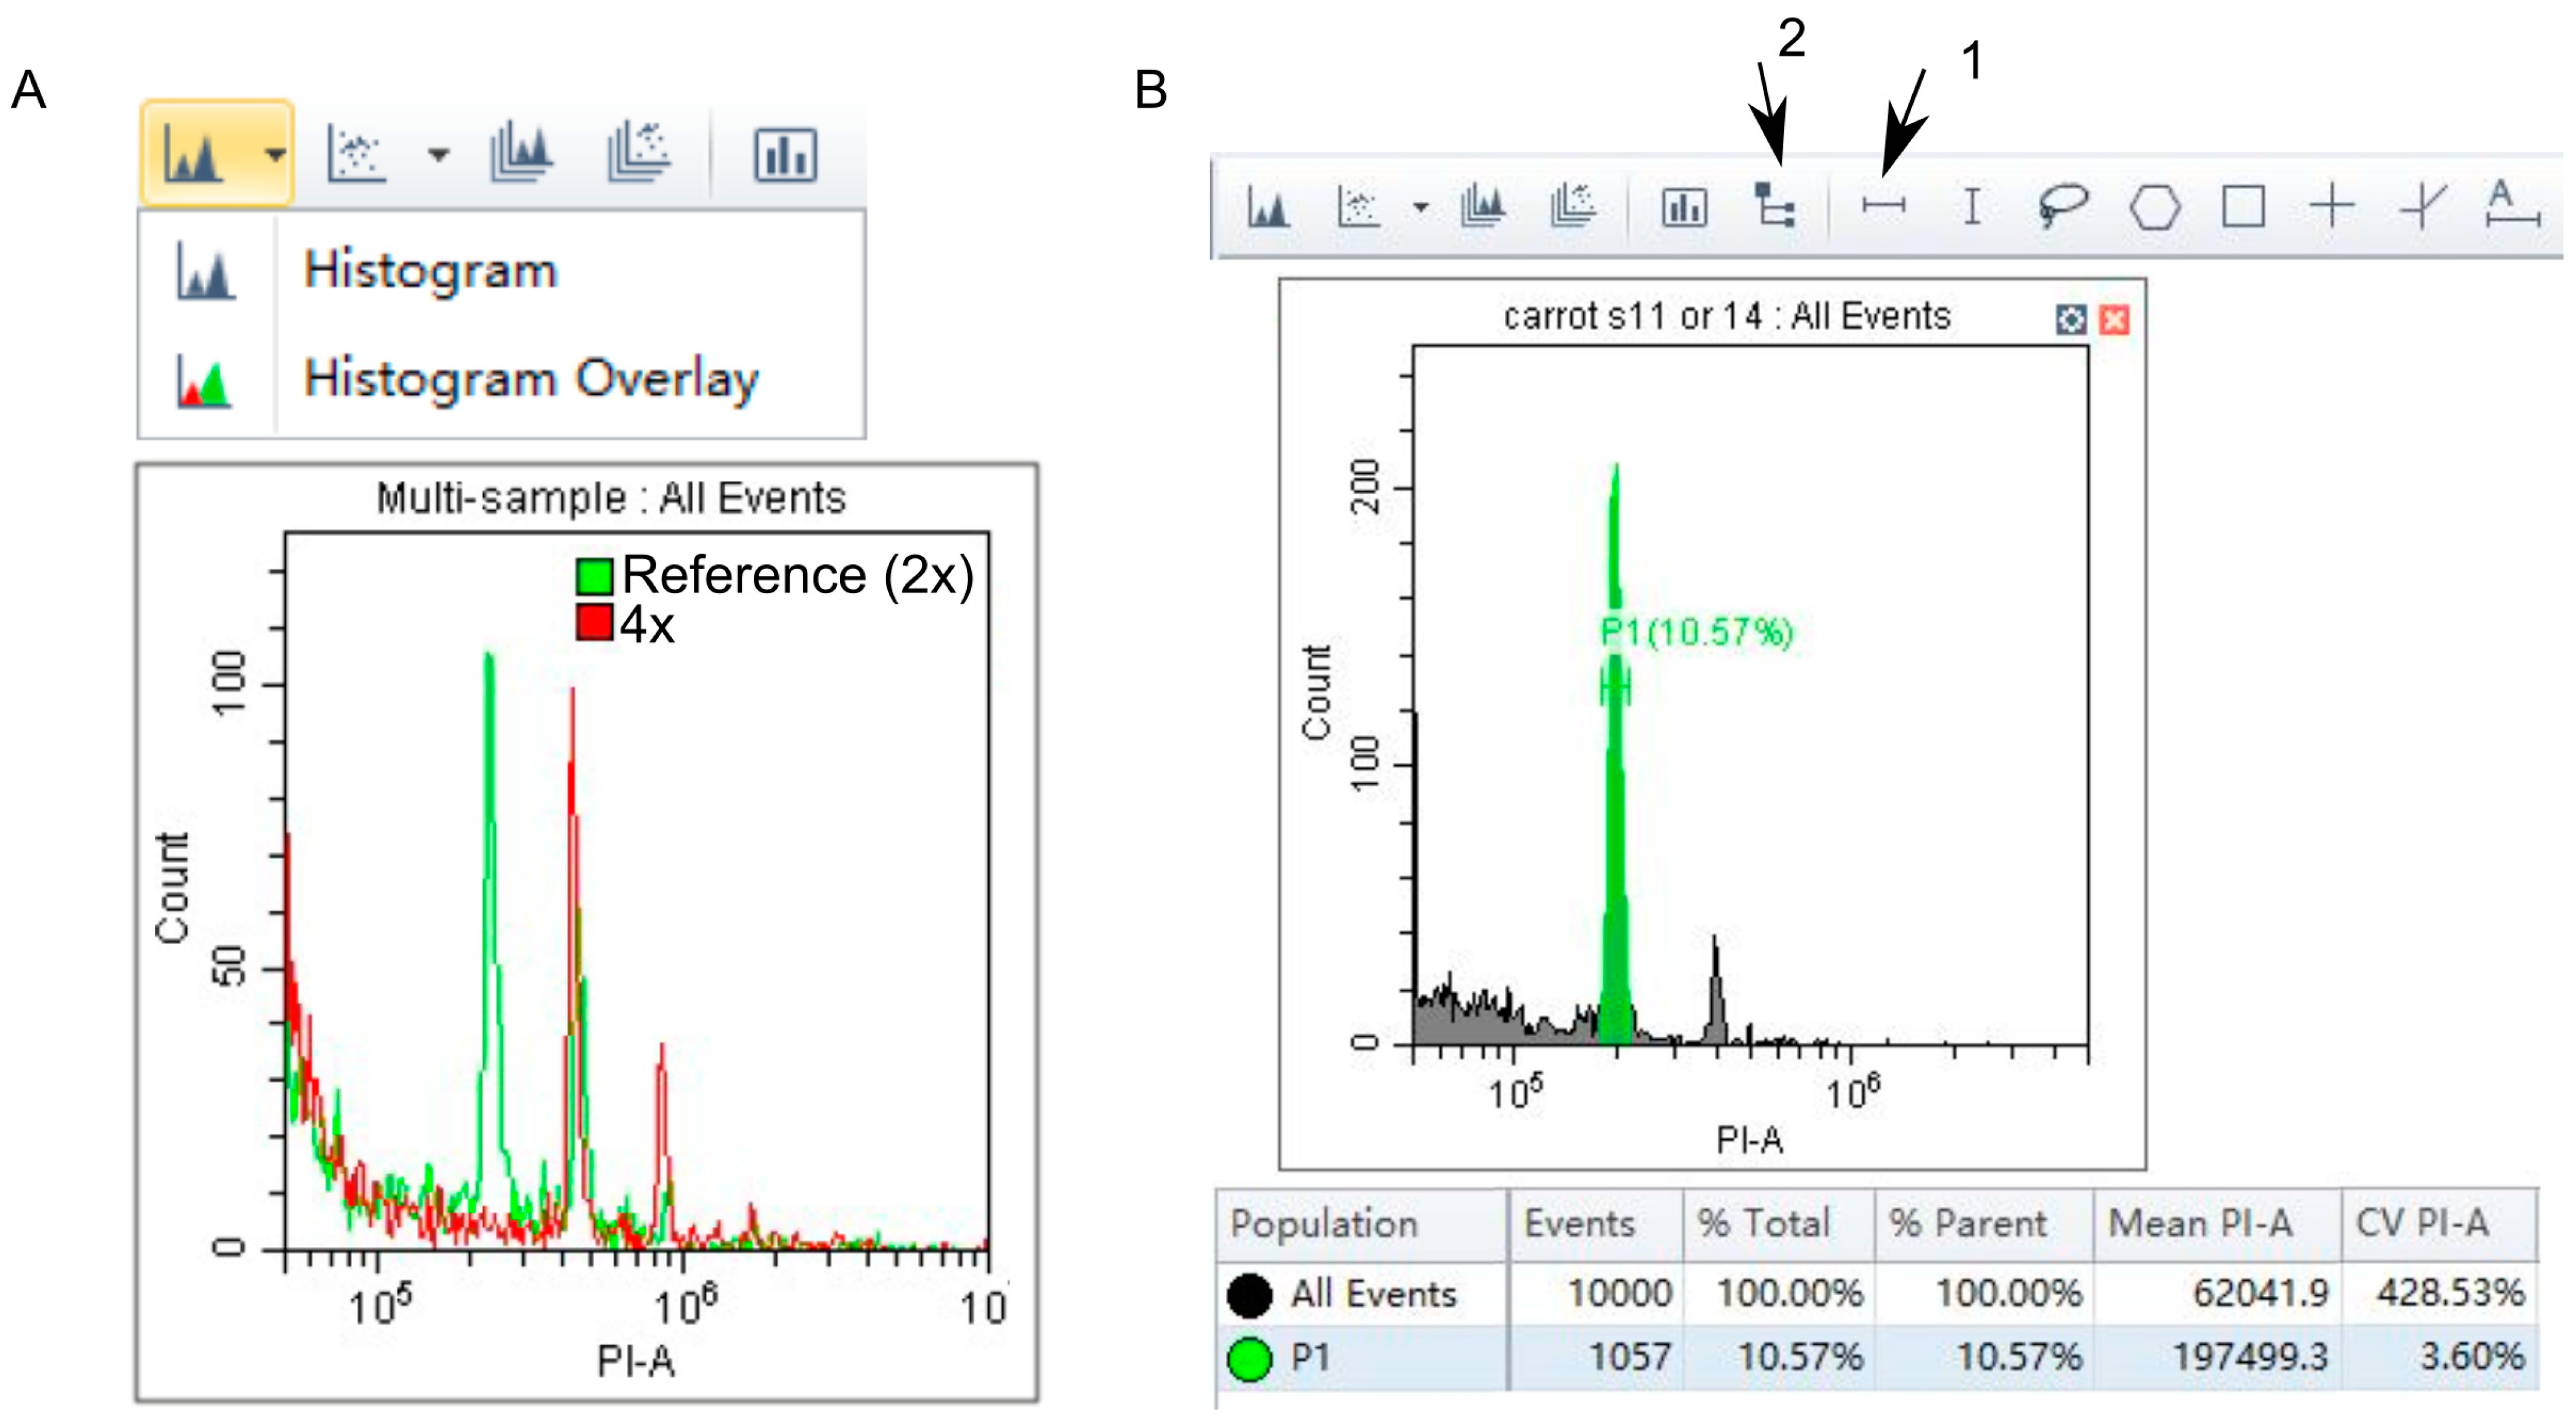
- Create two dot plots and a histogram (Figure 1A).
- Adjust Acq. Settings.
CRITICAL STEP. To find the population of interest, adjust gain, threshold and plot properties (min, max, log/linear scale).- Set Gain settings as follows: FSC = 81, SSC = 20, PI = 25.
- These settings work well for Cytoflex machine by Beckman Coulter [18]. Adjustments might be needed for a different machine. Change gain values to move most events to the center of the plot.
- Set Threshold: select fluorescent channel as a primary threshold, Manual, 10,000, Area. Further adjust the threshold if results are not optimal.
- These settings are different from typical settings used for animal cells. Triggering is carried out on the fluorescent channel instead of FSC and SSC because a large proportion of the particles in a sample is debris and organelles that need to be eliminated from the analysis. The threshold cuts off non-fluorescent objects.
- Adjust plot properties to better visualize the nuclei: right click the plot and choose properties.
- Set up min values to further cut off debris and organelles. 10,000–50,000 and 160 for X and Y, respectively, can be used as a starting point.
- On the acquisition window Choose slow speed for better data quality.
- Adjust Events to Record so that the number of nuclei for each G0/G1 peak is ≥1000 nuclei [1].
- Tap the sample to mix and load it into the cytometer tube holder.
- Press Run to observe the events; press Record to save data from particles running through the cytometer.
- Do not change acquisition settings between samples.
- If a new species or tissue is tested, run a preliminary experiment with a couple of samples to test different staining times. Run the same sample at different timepoints to check when the DNA is saturated with the dye (Figure 1C).
- If DNA peaks are partially masked by debris or absent (Figure 1D), try to repeat the isolation of nuclei. If this does not help, a different buffer, antioxidants or a different plant tissue can be tried.
3.4. Data Processing in a Cytometry Program
3.4.1. Visual Data Assessment by Histogram Overlay
- Overlay the reference standard and unknown sample histograms if external standard was used.
- Export results or print them to a pdf file.
3.4.2. DNA Ploidy/Content Quantifications
- Select G0/G1 peaks at the acquisition screen for the reference standard (same or separate plot for internal and external reference standard, respectively) and analyzed sample (Figure 2B).
![Mps 06 00018 i001]() CRITICAL STEP. To improve CV values, try different amounts of leaf tissue and different intensity of razor chopping. Use fresh sample with high turgor. Test different buffer and antioxidants. Deep clean and de-bubble the instrument.
CRITICAL STEP. To improve CV values, try different amounts of leaf tissue and different intensity of razor chopping. Use fresh sample with high turgor. Test different buffer and antioxidants. Deep clean and de-bubble the instrument.
- Calculate DNA ploidy or DNA content.
- Obtain DNA content values from three measurements performed on different days.
- Calculate mean and SD from three measurements.
![Mps 06 00018 i001]() CRITICAL STEP. If unexpected ploidy or DNA content results are observed or the same samples give different results (more than 2% difference) on the same or different days, the results must be treated with caution. The instrument deep clean and/or de-bubbling should be performed. Antioxidant addition should be tried. If results are reproducible, unexpected ploidy results and ploidy variability in different tissues of the same plant should be confirmed with microscopic analysis of samples stained for DNA.
CRITICAL STEP. If unexpected ploidy or DNA content results are observed or the same samples give different results (more than 2% difference) on the same or different days, the results must be treated with caution. The instrument deep clean and/or de-bubbling should be performed. Antioxidant addition should be tried. If results are reproducible, unexpected ploidy results and ploidy variability in different tissues of the same plant should be confirmed with microscopic analysis of samples stained for DNA.- Compare DNA content results to published C-values available in Plant DNA C-values Database [27].
4. Conclusions
Supplementary Materials
Author Contributions
Funding
Institutional Review Board Statement
Data Availability Statement
Conflicts of Interest
References
- Sliwinska, E.; Loureiro, J.; Leitch, I.J.; Šmarda, P.; Bainard, J.; Bureš, P.; Chumová, Z.; Horová, L.; Koutecký, P.; Lučanová, M.; et al. Application-Based Guidelines for Best Practices in Plant Flow Cytometry. Cytom. Part A 2022, 101, 749–781. [Google Scholar] [CrossRef]
- Ochatt, S.J. Flow Cytometry in Plant Breeding. Cytom. Part A J. Int. Soc. Anal. Cytol. 2008, 73, 581–598. [Google Scholar] [CrossRef]
- Loureiro, J.; Trávníček, P.; Rauchova, J.; Urfus, T.; Vit, P.; Štech, M.; Castro, S.; Suda, J. The Use of Flow Cytometry in the Biosystematics, Ecology and Population Biology of Homoploid Plants. Preslia 2010, 82, 3–21. [Google Scholar]
- Galbraith, D.; Loureiro, J.; Antoniadi, I.; Bainard, J.; Bureš, P.; Cápal, P.; Castro, M.; Castro, S.; Čertner, M.; Čertnerová, D. Best Practices in Plant Cytometry. Cytom. Part A 2021, 99, 311–317. [Google Scholar] [CrossRef]
- Doležel, J.; Greilhuber, J.; Suda, J. Flow Cytometry with Plants: An Overview. Flow Cytom. Plant Cells Anal. Genes Chromosom. Genomes 2007, 41–65. [Google Scholar] [CrossRef]
- Galbraith, D.W.; Harkins, K.R.; Maddox, J.M.; Ayres, N.M.; Sharma, D.P.; Firoozabady, E. Rapid Flow Cytometric Analysis of the Cell Cycle in Intact Plant-Tissues. Science 1983, 220, 1049–1051. [Google Scholar] [CrossRef]
- Galbraith, D.W. Protoplast Analysis Using Flow Cytometry and Sorting. Flow Cytom. Plant Cells Anal. Genes Chromosom. Genomes 2007, 231–250. [Google Scholar] [CrossRef]
- Doležel, J.; Greilhuber, J.; Suda, J. Estimation of Nuclear DNA Content in Plants Using Flow Cytometry. Nat. Protoc. 2007, 2, 2233–2244. [Google Scholar] [CrossRef]
- Loureiro, J.; Rodriguez, E.; Doležel, J.; Santos, C. Two New Nuclear Isolation Buffers for Plant DNA Flow Cytometry: A Test with 37 Species. Ann. Bot. 2007, 100, 875–888. [Google Scholar] [CrossRef]
- Cousin, A.; Heel, K.; Cowling, W.A.; Nelson, M.N. An Efficient High-Throughput Flow Cytometric Method for Estimating DNA Ploidy Level in Plants. Cytom. Part A 2009, 75, 1015–1019. [Google Scholar] [CrossRef]
- Temsch, E.M.; Koutecký, P.; Urfus, T.; Šmarda, P.; Doležel, J. Reference Standards for Flow Cytometric Estimation of Absolute Nuclear DNA Content in Plants. Cytom. Part A 2022, 101, 710–724. [Google Scholar] [CrossRef]
- Johnston, J.S.; Bennett, M.D.; Rayburn, A.L.; Galbraith, D.W.; Price, H.J. Reference Standards for Determination of DNA Content of Plant Nuclei. Am. J. Bot. 1999, 86, 609–613. [Google Scholar] [CrossRef] [PubMed]
- Skaptsov, M.V.; Smirnov, S.V.; Kutsev, M.G.; Shmakov, A.I. Problems of a Standardization in Plant Flow Cytometry. Turczaninowia 2016, 19, 120–122. [Google Scholar] [CrossRef]
- Loureiro, J.; Rodriguez, E.; Doležel, J.; Santos, C. Comparison of Four Nuclear Isolation Buffers for Plant DNA Flow Cytometry. Ann. Bot. 2006, 98, 679–689. [Google Scholar] [CrossRef] [PubMed]
- Suda, J.; Trávníček, P. Reliable DNA Ploidy Determination in Dehydrated Tissues of Vascular Plants by DAPI Flow Cytometry–New Prospects for Plant Research. Cytom. Part A 2006, 69, 273–280. [Google Scholar] [CrossRef] [PubMed]
- Loureiro, J.; Kron, P.; Temsch, E.M.; Koutecký, P.; Lopes, S.; Castro, M.; Castro, S. Isolation of Plant Nuclei for Estimation of Nuclear DNA Content: Overview and Best Practices. Cytom. Part A 2021, 99, 318–327. [Google Scholar] [CrossRef] [PubMed]
- Roberts, A.V. The Use of Bead Beating to Prepare Suspensions of Nuclei for Flow Cytometry from Fresh Leaves, Herbarium Leaves, Petals and Pollen. Cytom. Part A 2007, 71, 1039–1044. [Google Scholar] [CrossRef] [PubMed]
- Galbraith, D.; Villalobos-Menuey, E. Analysis of Plant Genome Sizes Using Flow Cytometry: A Case Study Demonstrating Dynamic Range and Measurement Linearity. Available online: https://www.mybeckman.ru/resources/reading-material/application-notes/plant-genome-size-flow-cytometry-analysis (accessed on 1 December 2022).
- Greilhuber, J.; Temsch, E.M.; Loureiro, J.C. Nuclear DNA Content Measurement. Flow Cytom. Plant Cells Anal. Genes Chromosom. Genomes 2007, 67–101. [Google Scholar] [CrossRef]
- Chiatante, D.; Brusa, P.; Levi, M.; Sgorbati, S.; Sparvoli, E. A Simple Protocol to Purify Fresh Nuclei from Milligram Amounts of Meristematic Pea Root Tissue for Biochemical and Flow Cytometry Applications. Physiol Plant. 1990, 78, 501–506. [Google Scholar] [CrossRef]
- Hopping, M.E. Preparation and Preservation of Nuclei from Plant-Tissues for Quantitative DNA Analysis by Flow Cytometry. N. Z. J. Bot. 1993, 31, 391–401. [Google Scholar] [CrossRef]
- Sgorbati, S.; Levi, M.; Sparvoli, E.; Trezzi, F.; Lucchini, G. Cytometry and Flow Cytometry of 4′,6-Diamidino-2-Phenylindole (DAPI)-Stained Suspensions of Nuclei Released from Fresh and Fixed Tissues of Plants. Physiol. Plant. 1986, 68, 471–476. [Google Scholar] [CrossRef]
- Goetz, C.; Hammerbeck, C.; Bonnevier, J. Flow Cytometry Basics for the Non-Expert, 1st ed.; Springer International Publishing: New York, NY, USA, 2019. [Google Scholar]
- Shapiro, H. Practical Flow Cytometry, 4th ed.; Alan, R., Ed.; Wiley-Liss. Inc.: New York, NY, USA, 2003. [Google Scholar]
- Suda, J.; Krahulcová, A.; Trávníček, P.; Krahulec, F. Ploidy Level versus DNA Ploidy Level: An Appeal for Consistent Terminology. Taxon 2006, 55, 447–450. [Google Scholar] [CrossRef]
- Greilhuber, J.; Doležel, J.; Lysák, M.A.; Bennett, M.D. The Origin, Evolution and Proposed Stabilization of the Terms ‘Genome Size’and ‘C-Value’to Describe Nuclear DNA Contents. Ann. Bot. 2005, 95, 255–260. [Google Scholar] [CrossRef] [PubMed]
- Pellicer, J.; Leitch, I.J. The Plant DNA C-values Database (Release 7.1): An Updated Online Repository of Plant Genome Size Data for Comparative Studies. New Phytol. 2019, 226, 301–305. [Google Scholar] [CrossRef] [Green Version]


Disclaimer/Publisher’s Note: The statements, opinions and data contained in all publications are solely those of the individual author(s) and contributor(s) and not of MDPI and/or the editor(s). MDPI and/or the editor(s) disclaim responsibility for any injury to people or property resulting from any ideas, methods, instructions or products referred to in the content. |
© 2023 by the authors. Licensee MDPI, Basel, Switzerland. This article is an open access article distributed under the terms and conditions of the Creative Commons Attribution (CC BY) license (https://creativecommons.org/licenses/by/4.0/).
Share and Cite
Fomicheva, M.; Domblides, E. Mastering DNA Content Estimation by Flow Cytometry as an Efficient Tool for Plant Breeding and Biodiversity Research. Methods Protoc. 2023, 6, 18. https://doi.org/10.3390/mps6010018
Fomicheva M, Domblides E. Mastering DNA Content Estimation by Flow Cytometry as an Efficient Tool for Plant Breeding and Biodiversity Research. Methods and Protocols. 2023; 6(1):18. https://doi.org/10.3390/mps6010018
Chicago/Turabian StyleFomicheva, Maria, and Elena Domblides. 2023. "Mastering DNA Content Estimation by Flow Cytometry as an Efficient Tool for Plant Breeding and Biodiversity Research" Methods and Protocols 6, no. 1: 18. https://doi.org/10.3390/mps6010018