
Computed Tomography Urography: State of the Art and Beyond
 , ,
, ,
Abstract
:1. Introduction
2. Acquisition Technique
2.1. Single Bolus
2.2. Split Bolus
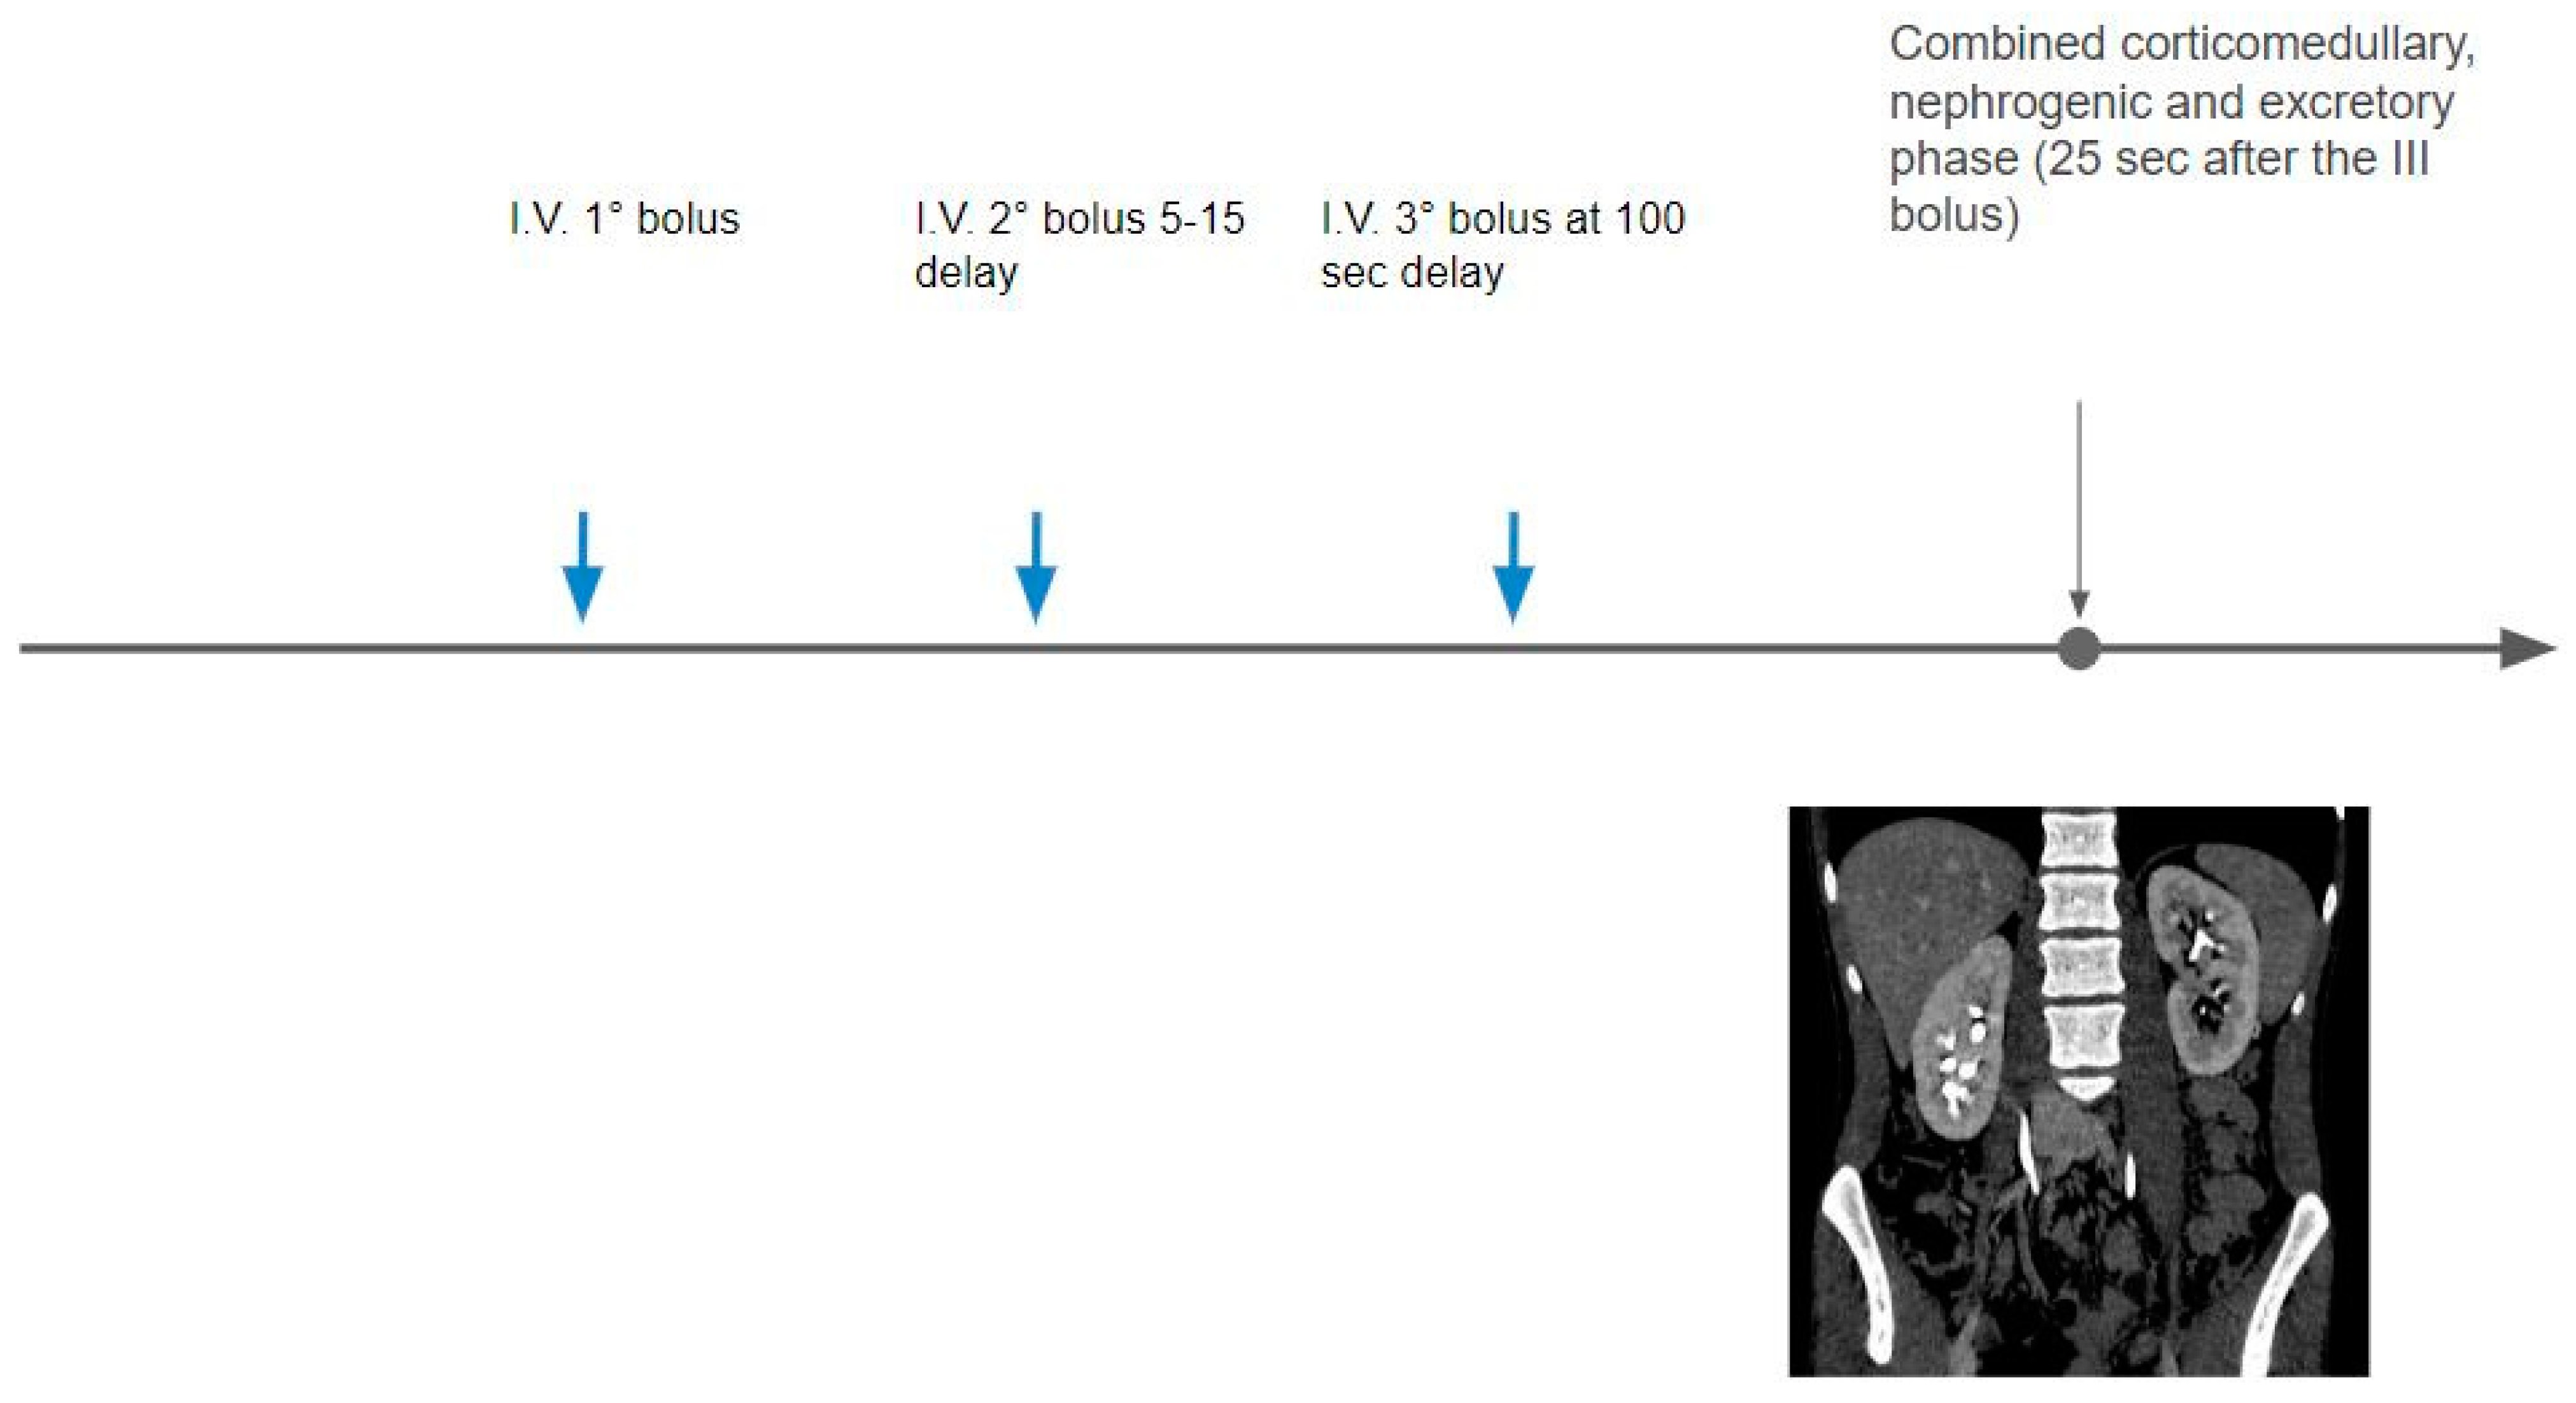
2.3. Triple Bolus
2.4. Attempts to Optimize the Excretory Phase
3. Image Reconstruction and Post-Processing
3.1. Iterative Reconstruction (IR)
3.2. Deep Learning Image Reconstruction
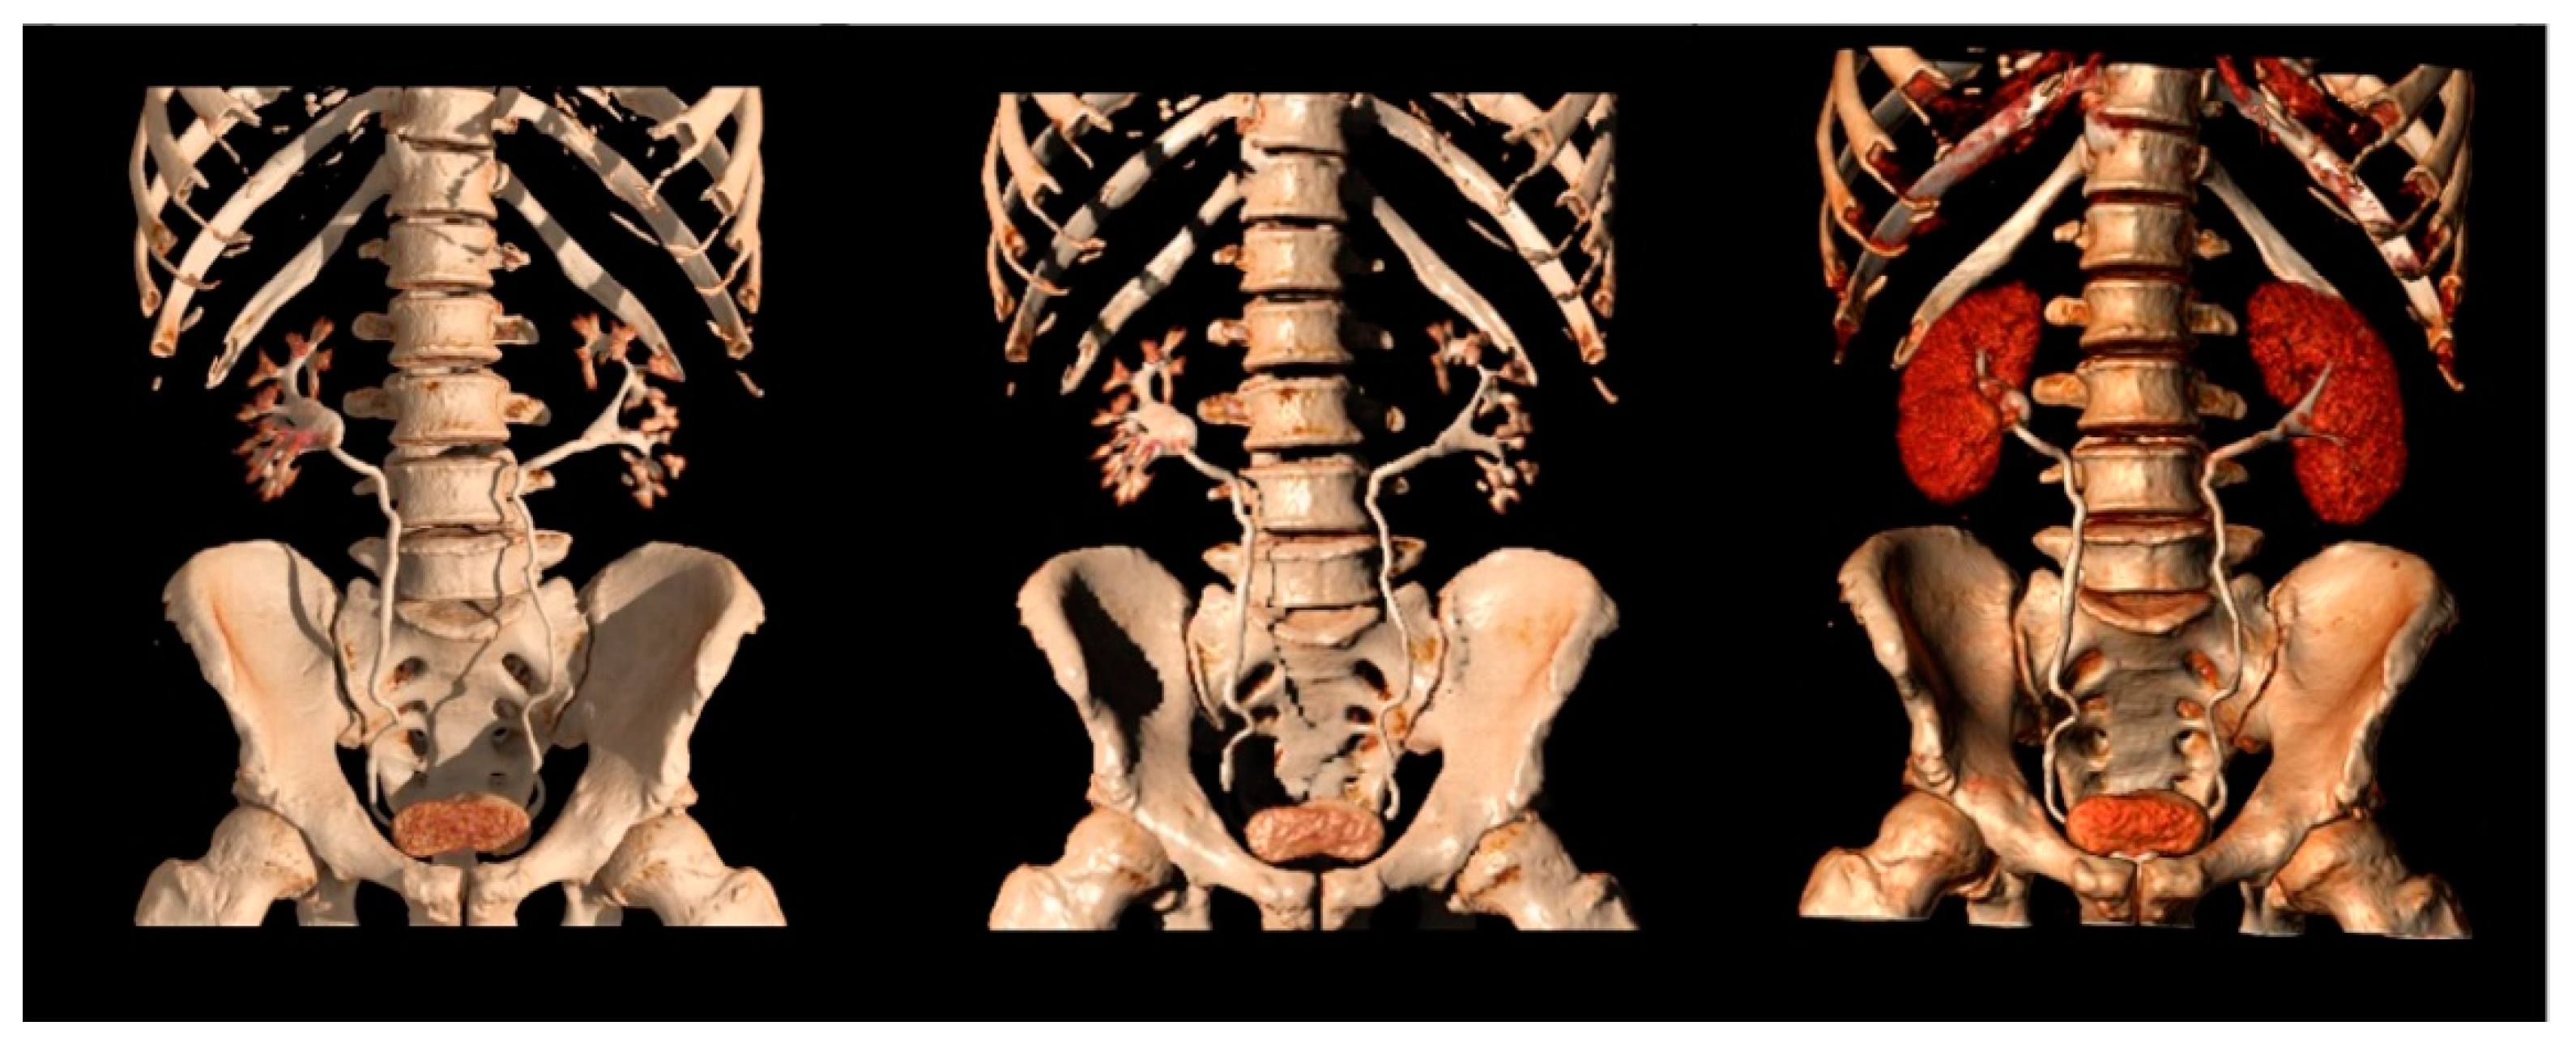
3.3. Post-Processing
4. Dual-Energy CT (DECT)
4.1. DECT Basic Concepts
4.2. DECT Virtual Non-Contrast Images
4.3. DECT Contrast Media Reduction
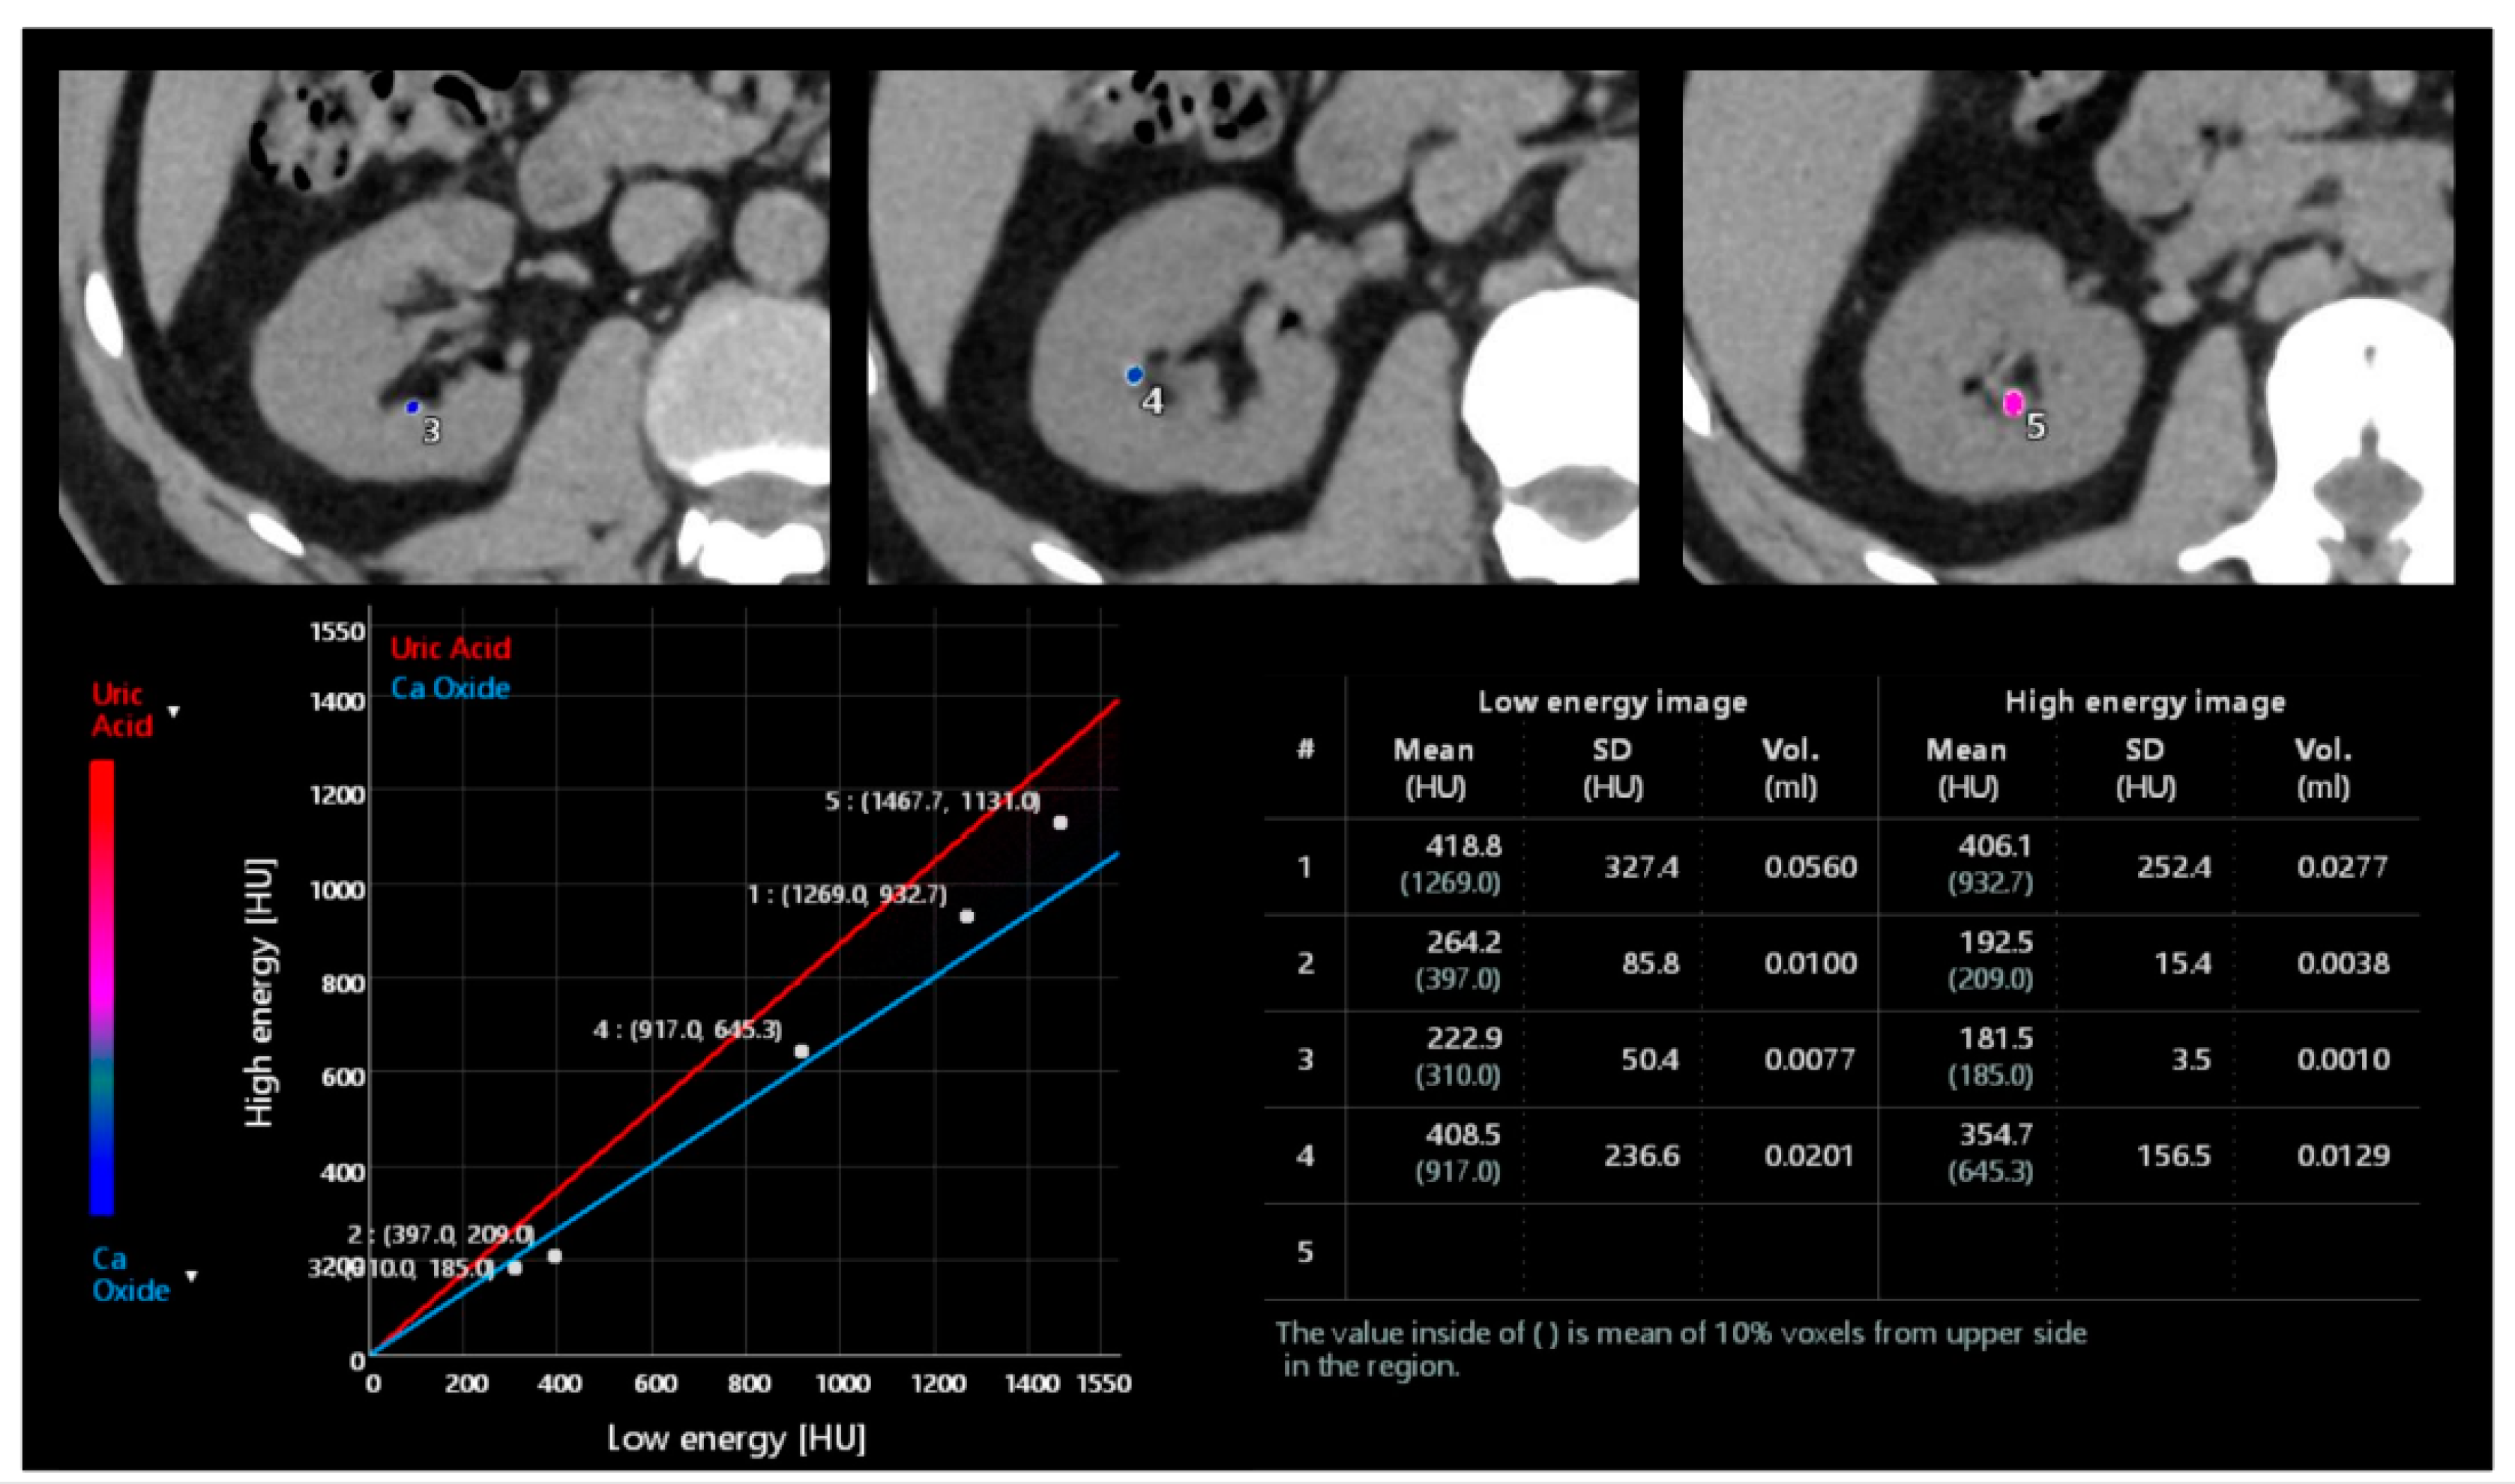
4.4. DECT Stone Composition Analysis
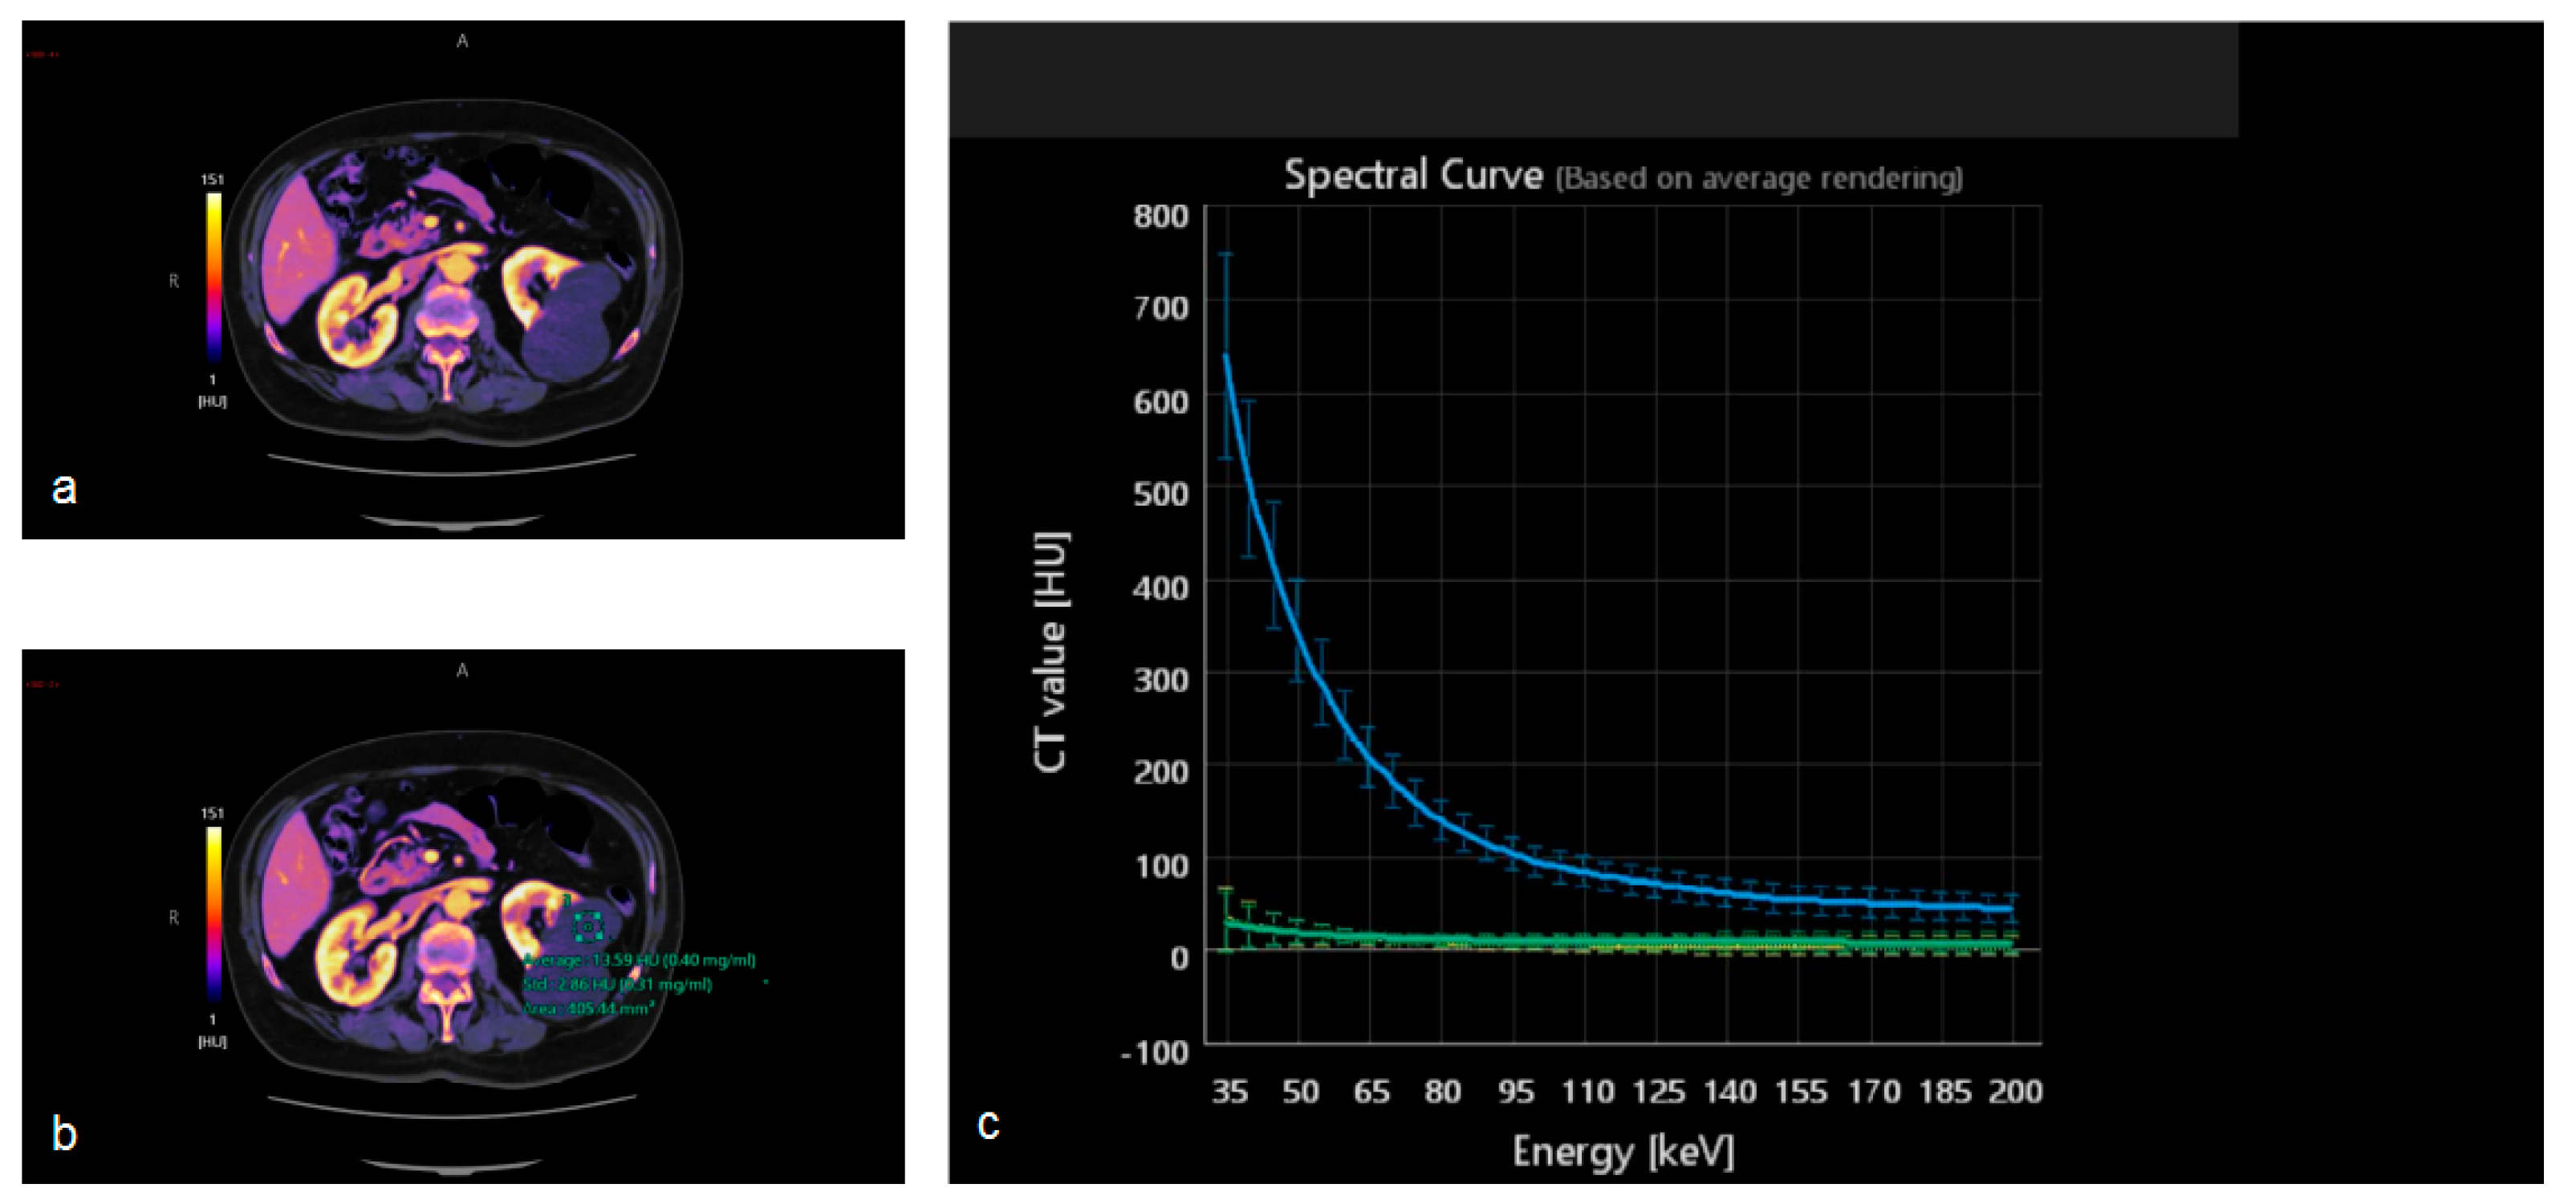
4.5. DECT Iodine Maps
5. Artificial Intelligence
5.1. Computer-Aided Detection
5.2. Segmentation
5.3. Texture Analysis and Radiomics
5.4. Tumor Staging and Grading
5.5. Prediction of Treatment Response
6. Limitations
7. Conclusions
Author Contributions
Funding
Institutional Review Board Statement
Informed Consent Statement
Data Availability Statement
Conflicts of Interest
References
- Molen, A.J.; Cowan, N.C.; Mueller-Lisse, U.G.; Nolte-Ernsting, C.C.A.; Takahashi, S.; Cohan, R.H. CT urography: Definition, indications and techniques. A guideline for clinical practice. Eur. Radiol. 2008, 18, 4–17. [Google Scholar] [CrossRef] [PubMed]
- Ciccarese, F.; Brandi, N.; Corcioni, B.; Golfieri, R.; Gaudiano, C. Complicated pyelonephritis associated with chronic renal stone disease. Radiol. Med. 2021, 126, 505–516. [Google Scholar] [CrossRef] [PubMed]
- Wolfman, D.J.; Marko, J.; Nikolaidin, P.; Khatri, G.; Dogra, V.S.; Ganeshan, D.; Goldfarb, S.; Gore, J.L.; Gupta, R.T.; Expert Panel on Urological Imaging; et al. ACR Appropriateness Criteria® Hematuria. J. Am. Coll. Radiol. 2020, 17, 91–103. [Google Scholar] [CrossRef] [PubMed]
- Davis, R.; Jones, J.S.; Barocas, D.A.; Castle, E.P.; Lang, E.K.; Leveillee, R.J.; Messing, E.M.; Miller, S.D.; Peterson, A.C.; Turk, T.M.; et al. Diagnosis, evaluation and follow-up of asymptomatic microhematuria (AMH) in adults: AUA guideline. J. Urol. 2012, 188, 2473–2481. [Google Scholar] [CrossRef]
- Nielsen, M.; Qaseem, A. Hematuria as a marker of occult urinary tract cancer: Advice for high-value care from the American college of physicians. Ann. Intern. Med. 2016, 164, 488–497. [Google Scholar] [CrossRef]
- Potenta, S.E.; D’Agostino, R.; Sternberg, K.M.; Tatsumi, K.; Perusse, K. CT urography for evaluation of the ureter. Radiographics 2015, 35, 709–726. [Google Scholar] [CrossRef] [Green Version]
- Raman, S.P.; Fishman, E.K. Upper and Lower Tract Urothelial Imaging Using Computed Tomography Urography. Urol. Clin. N. Am. 2018, 45, 389–405. [Google Scholar] [CrossRef]
- Sofia, C.; Solazzo, A.; Cattafi, A.; Chimenz, R.; Cicero, G.; Marino, M.A.; D’angelo, T.; Manti, L.; Condorelli, E.; Ceravolo, G.; et al. Contrast-enhanced voiding urosonography in the assessment of vesical-ureteral reflux: The time has come. Radiol. Med. 2021, 126, 901–909. [Google Scholar] [CrossRef]
- Silva, M.; Picozzi, G.; Sverzellati, N.; Anglesio, S.; Bartolucci, M.; Cavigli, E.; Deliperi, A.; Falchini, M.; Falaschi, F.; Ghio, D.; et al. Low-dose CT for lung cancer screening: Position paper from the Italian college of thoracic radiology. Radiol. Med. 2022, 127, 543–559. [Google Scholar] [CrossRef]
- Gershan, V.; Homayounieh, F.; Singh, R.; Avramova-Cholakova, S.; Faj, D.; Georgiev, E.; Girjoaba, O.; Griciene, B.; Gruppetta, E.; Hadnadjev Šimonji, D.; et al. CT protocols and radiation doses for hematuria and urinary stones: Comparing practices in 20 countries. Eur. J. Radiol. 2020, 126, 108923. [Google Scholar] [CrossRef]
- Ascenti, G.; Cicero, G.; Bertelli, E.; Papa, M.; Gentili, F.; Ciccone, V.; Manetta, R.; Gandolfo, N.; Cardone, G.; Miele, V. CT-urography: A nationwide survey by the Italian Board of Urogenital Radiology. Radiol. Med. 2022, 127, 577–588. [Google Scholar] [CrossRef]
- Hélénon, O.; Crosnier, A.; Verkarre, V.; Merran, S.; Méjean, A.; Correas, J.M. Simple and complex renal cysts in adults: Classification system for renal cystic masses. Diagn. Interv. Imaging 2018, 99, 189–218. [Google Scholar] [CrossRef]
- Ljungberg, A.; Segelsjö, M.; Dahlman, P.; Helenius, M.; Magnusson, M.; Magnusson, A. Comparison of quality of urinary bladder filling in CT urography with different doses of furosemide in the work-up of patients with macroscopic hematuria. Radiography 2021, 27, 136–141. [Google Scholar] [CrossRef]
- Rud, E.; Galtung, K.F.; Lauritzen, P.M.; Baco, E.; Flatabø, T.; Sandbæk, G. Examining the upper urinary tract in patients with hematuria—Time to revise the CT urography protocol? Eur. Radiol. 2020, 30, 1664–1670. [Google Scholar] [CrossRef]
- Metser, U.; Goldstein, M.A.; Chawla, T.P.; Fleshner, N.E.; Jacks, L.M.; O’Malley, M.E. Detection of urothelial tumors: Comparison of urothelial phase with excretory phase CT urography—A prospective study. Radiology 2012, 264, 110–118. [Google Scholar] [CrossRef]
- Park, J.J.; Park, B.K.; Kim, C.K. Single-phase DECT with VNCT compared with three-phase CTU in patients with haematuria. Eur. Radiol. 2016, 26, 3550–3557. [Google Scholar] [CrossRef]
- Noorbakhsh, A.; Aganovic, L.; Vahdat, N.; Fazeli, S.; Chung, R.; Cassidy, F. What a difference a delay makes! CT urogram: A pictorial essay. Abdom. Radiol. 2019, 44, 3919–3934. [Google Scholar] [CrossRef]
- Cheng, K.; Cassidy, F.; Aganovic, L.; Taddonio, M.; Vahdat, N. CT urography: How to optimize the technique. Abdom. Radiol. 2019, 44, 3786–3799. [Google Scholar] [CrossRef]
- Raman, S.P.; Horton, K.M.; Fishman, E.K. MDCT evaluation of ureteral tumors: Advantages of 3D reconstruction and volume visualization. Am. J. Roentgenol. 2013, 201, 1239–1247. [Google Scholar] [CrossRef]
- Kawashima, A.; Vrtiska, T.J.; LeRoy, A.J.; Hartman, R.P.; McCollough, C.H.; King, B.F., Jr. CT Urography. RadioGraphics 2004, 24, S35–S54. [Google Scholar] [CrossRef]
- Kopka, L.; Fischer, U.; Zoeller, G.; Schmidt, C.; Ringert, R.H.; Grabbe, E. Dual-Phase Helical CT of the Kidney: Value of the Corticomedullary and Nephrographic Phase for Evaluation of Renal Lesions and Preoperative Staging of Renal Cell Carcinoma. Am. J. Roentgenol. 1997, 169, 1573–1578. [Google Scholar] [CrossRef] [PubMed] [Green Version]
- Helenius, M.; Dahlman, P.; Lonnemark, M.; Brekkan, E.; Wernroth, L.; Magnusson, A. Comparison of post contrast CT urography phases in bladder cancer detection. Eur. Radiol. 2016, 26, 585–591. [Google Scholar] [CrossRef] [PubMed]
- Helenius, M.; Dahlman, P.; Magnusson, M.; Lönnemark, M.; Magnusson, A. Contrast enhancement in bladder tumors examined with CT urography using traditional scan phases. Acta Radiol. 2014, 55, 1129–1136. [Google Scholar] [CrossRef] [PubMed]
- Joffe, S.A.; Servaes, S.; Okon, S.; Horowitz, M. Multi-Detector Row CT Urography in the Evaluation of Hematuria. Radiographics 2003, 23, 1441–1456. [Google Scholar] [CrossRef] [Green Version]
- Sheth, S.; Fishman, E.K. Multi-detector row CT of the kidneys and urinary tract: Techniques and applications in the diagnosis of benign diseases. Radiographics 2004, 24, e20. [Google Scholar] [CrossRef]
- Nolte-Ernsting, C.; Cowan, N. Understanding multislice CT urography techniques: Many roads lead to Rome. Eur. Radiol. 2006, 16, 2670–2686. [Google Scholar] [CrossRef]
- Kemper, J.; Regier, M.; Stork, A.; Adam, G.; Nolte-Ernsting, C. Improved visualization of the urinary tract in multidetector CT urography (MDCTU): Analysis of individual acquisition delay and opacification using furosemide and low-dose test images. J. Comput. Assist. Tomogr. 2006, 30, 751–757. [Google Scholar] [CrossRef]
- Johnson, P.T.; Horton, K.M.; Fishman, E.K. Optimizing detectability of renal pathology with MDCT: Protocols, pearls, and pitfalls. Am. J. Roentgenol. 2010, 194, 1001–1012. [Google Scholar] [CrossRef]
- Kupershmidt, M.; Margolis, M.; Jang, H.J.; Massey, C.; Metser, U. Evaluation of upper urinary tract tumors with portal venous phase MDCT: A case-control study. Am. J. Roentgenol. 2011, 197, 424–428. [Google Scholar] [CrossRef] [Green Version]
- Lee, D.; Cho, E.S.; Kim, J.H.; Kim, Y.P.; Lee, H.K.; Yu, J.S.; Chung, J.J. Optimization of split-bolus CT urography: Effect of differences in allocation of contrast medium and prolongation of imaging delay. Am. J. Roentgenol. 2017, 209, W10–W17. [Google Scholar] [CrossRef]
- Morrison, N.; Bryden, S.; Costa, A.F. Split vs. Single Bolus CT Urography: Comparison of Scan Time, Image Quality and Radiation Dose. Tomography 2021, 7, 210–218. [Google Scholar] [CrossRef]
- Silverman, S.G.; Leyendecker, J.R.; Amis, E.S. What is the current role of CT urography and MR urography in the evaluation of the urinary tract? Radiology 2009, 250, 309–323. [Google Scholar] [CrossRef]
- Caoili, E.M.; Cohan, R.H. CT urography in evaluation of urothelial tumors of the kidney. Abdom. Radiol. 2016, 41, 1100–1107. [Google Scholar] [CrossRef]
- Dillman, J.R.; Caoili, E.M.; Cohan, R.H.; Ellis, J.H.; Francis, I.R.; Nan, B.; Zhang, Y. Comparison of urinary tract distension and opacification using single-bolus 3-phase vs split-bolus 2-phase multidetector row CT urography. J. Comput. Assist. Tomogr. 2007, 31, 750–757. [Google Scholar] [CrossRef]
- Silverman, S.G.; Akbar, S.A.; Mortele, K.J.; Tuncali, K.; Bhagwat, J.G.; Seifter, J.L. Multi-detector row CT urography of normal urinary collecting system: Furosemide versus saline as adjunct to contrast medium. Radiology 2006, 240, 749–755. [Google Scholar] [CrossRef]
- Sanyal, R.; Deshmukh, A.; Singh Sheorain, V.; Taori, K. CT urography: A comparison of strategies for upper urinary tract opacification. Eur. Radiol. 2007, 17, 1262–1266. [Google Scholar] [CrossRef]
- Caoili, E.M.; Cohan, R.H.; Korobkin, M.; Platt, J.F.; Francis, I.R.; Faerber, G.J.; Montie, J.E.; Ellis, J.H. Urinary tract abnormalities: Initial experience with multi-detector row CT urography. Radiology 2002, 222, 353–360. [Google Scholar] [CrossRef]
- Fusco, R.; Setola, S.V.; Raiano, N.; Granata, V.; Cerciello, V.; Pecori, B.; Petrillo, A. Analysis of a monocentric computed tomography dosimetric database using a radiation dose index monitoring software: Dose levels and alerts before and after the implementation of the adaptive statistical iterative reconstruction on CT images. Radiol. Med. 2022, 127, 733–742. [Google Scholar] [CrossRef]
- Shinagare, A.B.; Sahni, V.A.; Sadow, C.A.; Erturk, S.M.; Silverman, S.G. Feasibility of low-tube-voltage excretory phase images during CT urography: Assessment using a dual-energy CT scanner. Am. J. Roentgenol. 2011, 197, 1146–1151. [Google Scholar] [CrossRef]
- Kim, S.H.; Kim, M.J.; Lee, H.J.; Cho, S.H. Comparison of full- and half-dose image reconstruction with filtered back projection or sinogram-affirmed iterative reconstruction in dual-source single-energy MDCT urography. Am. J. Roentgenol. 2018, 211, 641–648. [Google Scholar] [CrossRef]
- Tagliati, C.; Lanza, C.; Pieroni, G.; Amici, L.; Carotti, M.; Giuseppetti, G.M.; Giovagnoni, A. Ultra-low-dose chest CT in adult patients with cystic fibrosis using a third-generation dual-source CT scanner. Radiol. Med. 2021, 126, 544–552. [Google Scholar] [CrossRef] [PubMed]
- Agostini, A.; Borgheresi, A.; Carotti, M.; Ottaviani, L.; Badaloni, M.; Floridi, C.; Giovagnoni, A. Third-generation iterative reconstruction on a dual-source, high-pitch, low-dose chest CT protocol with tin filter for spectral shaping at 100 kV: A study on a small series of COVID-19 patients. Radiol. Med. 2021, 126, 388–398. [Google Scholar] [CrossRef] [PubMed]
- Seyal, A.R.; Arslanoglu, A.; Abboud, S.F.; Sahin, A.; Horowitz, J.M.; Yaghmai, V. CT of the abdomen with reduced tube voltage in adults: A practical approach. Radiographics 2015, 35, 1922–1939. [Google Scholar] [CrossRef] [PubMed] [Green Version]
- Sun, J.; Li, H.; Gao, J.; Li, J.; Li, M.; Zhou, Z.; Peng, Y. Performance evaluation of a deep learning image reconstruction (DLIR) algorithm in “double low” chest CTA in children: A feasibility study. Radiol. Med. 2021, 126, 1181–1188. [Google Scholar] [CrossRef]
- Cheng, Y.; Han, Y.; Li, J.; Fan, G.; Cao, L.; Li, J.; Jia, X.; Yang, J.; Guo, J. Low-dose CT urography using deep learning image reconstruction: A prospective study for comparison with conventional CT urography. Br. J. Radiol. 2021, 94, 20201291. [Google Scholar] [CrossRef]
- Raman, S.P.; Fishman, E.K. Bladder malignancies on CT: The underrated role of CT in diagnosis. Am. J. Roentgenol. 2014, 203, 347–354. [Google Scholar] [CrossRef]
- Cicero, G.; Mazziotti, S.; Silipigni, S.; Blandino, A.; Cantisani, V.; Pergolizzi, S.; D’Angelo, T.; Stagno, A.; Maimone, S.; Squadrito, G.; et al. Dual-energy CT quantification of fractional extracellular space in cirrhotic patients: Comparison between early and delayed equilibrium phases and correlation with oesophageal varices. Radiol. Med. 2021, 126, 761–767. [Google Scholar] [CrossRef]
- Kaza, R.K.; Ananthakrishnan, L.; Kambadakone, A.; Platt, J.F. Update of dual-energy CT applications in the genitourinary tract. Am. J. Roentgenol. 2017, 208, 1185–1192. [Google Scholar] [CrossRef]
- Foti, G.; Mantovani, W.; Faccioli, N.; Crivellari, G.; Romano, L.; Zorzi, C.; Carbognin, G. Identification of bone marrow edema of the knee: Diagnostic accuracy of dual-energy CT in comparison with MRI. Radiol. Med. 2021, 126, 405–413. [Google Scholar] [CrossRef]
- Nakamura, Y.; Higaki, T.; Honda, Y.; Tatsugami, F.; Tani, C.; Fukumoto, W.; Narita, K.; Kondo, S.; Akagi, M.; Awai, K. Advanced CT techniques for assessing hepatocellular carcinoma. Radiol. Med. 2021, 126, 925–935. [Google Scholar] [CrossRef]
- Dalpiaz, G.; Gamberini, L.; Carnevale, A.; Spadaro, S.; Mazzoli, C.A.; Piciucchi, S.; Allegri, D.; Capozzi, C.; Neziri, E.; Bartolucci, M.; et al. Clinical implications of microvascular CT scan signs in COVID-19 patients requiring invasive mechanical ventilation. Radiol. Med. 2022, 127, 162–173. [Google Scholar] [CrossRef]
- Yang, L.; Sun, J.; Li, J.; Peng, Y. Dual-energy spectral CT imaging of pulmonary embolism with Mycoplasma pneumoniae pneumonia in children. Radiol. Med. 2022, 127, 154–161. [Google Scholar] [CrossRef]
- Takeuchi, M.; Kawai, T.; Ito, M.; Ogawa, M.; Ohashi, K.; Hara, M.; Shibamoto, Y. Split-bolus CT-urography using dual-energy CT: Feasibility, image quality and dose reduction. Eur. J. Radiol. 2012, 81, 3160–3165. [Google Scholar] [CrossRef]
- Cheng, Y.; Sun, J.; Li, J.; Han, Y.; Zhang, X.; Zhang, L.; Zheng, J.; He, H.; Yang, J.; Guo, J. The Added Value of Virtual Unenhanced Images Obtained From Dual-energy CT Urography in the Detection and Measurement of Urinary Stone. Urology 2022, 166, 118–125. [Google Scholar] [CrossRef]
- Dodig, D.; Matić, T.S.; Žuža, I.; Pavlović, I.; Miletić, D.; Markić, D. Side-by-side evaluation of virtual non-contrast and post-contrast images improves detection of clinically significant urolithiasis on single-phase split bolus dual-energy CT urography. Br. J. Radiol. 2021, 94, 20210013. [Google Scholar] [CrossRef]
- Chen, C.Y.; Hsu, J.; Jaw, T.S.; Shih, M.C.P.; Lee, L.J.; Tsai, T.H.; Liu, G.C. Split-Bolus portal venous phase dual-energy CT urography: Protocol design, image quality, and dose reduction. Am. J. Roentgenol. 2015, 205, W492–W501. [Google Scholar] [CrossRef]
- Mangold, S.; Thomas, C.; Fenchel, M.; Vuust, M.; Krauss, B.; Ketelsen, D.; Tsiflikas, I.; Claussen, C.D.; Heuschmid, M. Virtual nonenhanced dual-energy CT urography with tin-filter technology: Determinants of detection of urinary calculi in the renal collecting system. Radiology 2012, 264, 119–125. [Google Scholar] [CrossRef]
- Wang, J.; Qu, M.; Duan, X.; Takahashi, N.; Kawashima, A.; Leng, S.; McCollough, C.H. Characterisation of urinary stones in the presence of iodinated contrast medium using dual-energy CT: A phantom study. Eur. Radiol. 2012, 22, 2589–2596. [Google Scholar] [CrossRef] [Green Version]
- Botsikas, D.; Hansen, C.; Stefanelli, S.; Becker, C.D.; Montet, X. Urinary stone detection and characterisation with dual-energy CT urography after furosemide intravenous injection: Preliminary results. Eur. Radiol. 2014, 24, 709–714. [Google Scholar] [CrossRef]
- Manoharan, D.; Sharma, S.; Das, C.J.; Kumar, R.; Singh, G.; Kumar, P. Single-acquisition triple-bolus dual-energy ct protocol for comprehensive evaluation of renal masses: A single-center randomized noninferiority trial. Am. J. Roentgenol. 2018, 211, W22–W32. [Google Scholar] [CrossRef]
- Takahashi, N.; Vrtiska, T.J.; Kawashima, A.; Hartman, R.P.; Primak, A.N.; Fletcher, J.G.; McCollough, C.H. Detectability of urinary stones on virtual nonenhanced images generated at pyelographic-phase dual-energy CT. Radiology 2010, 256, 184–190. [Google Scholar] [CrossRef] [PubMed] [Green Version]
- Sahni, V.A.; Shinagare, A.B.; Silverman, S.G. Virtual unenhanced CT images acquired from dual-energy CT urography: Accuracy of attenuation values and variation with contrast material phase. Clin. Radiol. 2013, 68, 264–271. [Google Scholar] [CrossRef] [PubMed]
- Saade, C.; Karout, L.; El Asmar, K.; Naffaa, L.; El Merhi, F.; Salman, R.; Abi-Ghanem, A.S. Impact of various iodine concentrations of iohexol and iodixanol contrast media on image reconstruction techniques in a vascular-specific contrast media phantom: Quantitative and qualitative image quality assessment. Radiol. Med. 2021, 126, 221–230. [Google Scholar] [CrossRef] [PubMed]
- Orlacchio, A.; Guastoni, C.; Beretta, G.D.; Cosmai, L.; Galluzzo, M.; Gori, S.; Grassedonio, E.; Incorvaia, L.; Marcantoni, C.; Netti, G.S.; et al. SIRM-SIN-AIOM: Appropriateness criteria for evaluation and prevention of renal damage in the patient undergoing contrast medium examinations—Consensus statements from Italian College of Radiology (SIRM), Italian College of Nephrology (SIN) and Italian Association of Medical Oncology (AIOM). Radiol. Med. 2022, 127, 534–542. [Google Scholar] [CrossRef]
- Zhou, K.; He, J.; Qu, F.; Fan, H.; Ma, Y.; Shi, T.; Zhou, Z.; Zhu, B. Comparison of 270 Versus 320 mg I/mL of Iodixanol in 1 Image Assessment of Both Renal Arteries and Veins with Dual-Energy Spectral CT Imaging in Late Arterial Phase and Their Influence on Renal Function. J. Comput. Assist. Tomogr. 2017, 41, 798–803. [Google Scholar] [CrossRef]
- Shuman, W.P.; Mileto, A.; Busey, J.M.; Desai, N.; Koprowicz, K.M. Dual-Energy CT urography with 50% reduced iodine dose versus single-energy CT urography with standard iodine dose. Am. J. Roentgenol. 2019, 212, 117–123. [Google Scholar] [CrossRef]
- Ascenti, G.; Mileto, A.; Gaeta, M.; Blandino, A.; Mazziotti, S.; Scribano, E. Single-phase dual-energy CT urography in the evaluation of haematuria. Clin. Radiol. 2013, 68, e87–e94. [Google Scholar] [CrossRef]
- Hidas, G.; Eliahou, R.; Duvdevani, M.; Coulon, P.; Lemaitre, L.; Gofrit, O.N.; Pode, D.; Sosna, J. Determination of renal stone composition with dual-energy CT: In vivo analysis and comparison with X-ray diffraction. Radiology 2010, 257, 394–401. [Google Scholar] [CrossRef]
- Leng, S.; Shiung, M.; Ai, S.; Qu, M.; Vrtiska, T.J.; Grant, K.L.; Krauss, B.; Schmidt, B.; Lieske, J.C.; McCollough, C.H. Feasibility of discriminating uric acid from non-uric acid renal stones using consecutive spatially registered low-and high-energy scans obtained on a conventional CT scanner. Am. J. Roentgenol. 2015, 204, 92–97. [Google Scholar] [CrossRef] [Green Version]
- Ferrero, A.; Montoya, J.C.; Vaughan, L.E.; Huang, A.E.; McKeag, I.O.; Enders, F.T.; Williams, J.C., Jr.; McCollough, C.H. Quantitative Prediction of Stone Fragility From Routine Dual Energy CT: Ex vivo proof of Feasibility. Acad. Radiol. 2016, 23, 1545–1552. [Google Scholar] [CrossRef] [Green Version]
- Singh, A.; Khanduri, S.; Khan, N.; Yadav, P.; Husain, M.; Khan, A.U.; Khan, M.; Jain, S. Role of Dual-Energy Computed Tomography in Characterization of Ureteric Calculi and Urinary Obstruction. Cureus 2020, 12, e8002. [Google Scholar] [CrossRef]
- Jepperson, M.A.; Cernigliaro, J.G.; Sella, D.; Ibrahim, E.; Thiel, D.D.; Leng, S.; Haley, W.E. Dual-energy CT for the evaluation of urinary calculi: Image interpretation, pitfalls and stone mimics. Clin. Radiol. 2013, 68, 707–714. [Google Scholar] [CrossRef]
- Ascenti, G.; Mazziotti, S.; Mileto, A.; Racchiusa, S.; Donato, R.; Settineri, N.; Gaeta, M. Dual-source dual-energy CT evaluation of complex cystic renal masses. Am. J. Roentgenol. 2012, 199, 1026–1034. [Google Scholar] [CrossRef]
- Mileto, A.; Nelson, R.; Samei, E.; Jaffe, T.A.; Paulson, E.K.; Barina, A.; Choudhury, K.R.; Wilson, J.M.; Marin, D. Impact of dual-energy multi-detector row CT with virtual monochromatic imaging on renal cyst pseudoenhancement: In vitro and in vivo study. Radiology 2014, 272, 767–776. [Google Scholar] [CrossRef]
- Mileto, A.; Marin, D.; Alfaro-Cordoba, M.; Ramirez-Giraldo, J.C.; Eusemann, C.D.; Scribano, E.; Blandino, A.; Mazziotti, S.; Ascenti, G. Iodine quantification to distinguish clear cell from papillary renal cell carcinoma at dual-energy multidetector CT: A multireader diagnostic performance study. Radiology 2014, 273, 813–820. [Google Scholar] [CrossRef]
- Kaza, R.K.; Platt, J.F.; Megibow, A.J. Dual-energy CT of the urinary tract. Abdom. Imaging 2013, 38, 167–179. [Google Scholar] [CrossRef]
- Park, S.Y.; Kim, C.K.; Park, B.K. Dual-energy CT in assessing therapeutic response to radiofrequency ablation of renal cell carcinomas. Eur. J. Radiol. 2014, 83, e73–e79. [Google Scholar] [CrossRef]
- Brunese, L.; Brunese, M.C.; Carbone, M.; Ciccone, V.; Mercaldo, F.; Santone, A. Automatic PI-RADS assignment by means of formal methods. Radiol. Med. 2022, 127, 83–89. [Google Scholar] [CrossRef]
- Zerunian, M.; Pucciarelli, F.; Caruso, D.; Polici, M.; Masci, B.; Guido, G.; De Santis, D.; Polverari, D.; Principessa, D.; Benvenga, A.; et al. Artificial intelligence based image quality enhancement in liver MRI: A quantitative and qualitative evaluation. Radiol. Med. 2022, 127, 1098–1105. [Google Scholar] [CrossRef]
- Cha, K.H.; Hadjiiski, L.; Samala, R.K.; Chan, H.P.; Caoili, E.M.; Cohan, R.H. Urinary bladder segmentation in CT urography using deep-learning convolutional neural network and level sets. Med. Phys. 2016, 43, 1882–1896. [Google Scholar] [CrossRef] [Green Version]
- Chen, M.; Yin, F.; Yu, Y.; Zhang, H.; Wen, G. CT-based multi-phase Radiomic models for differentiating clear cell renal cell carcinoma. Cancer Imaging 2021, 21, 42. [Google Scholar] [CrossRef] [PubMed]
- Karmazanovsky, G.; Gruzdev, I.; Tikhonova, V.; Kondratyev, E.; Revishvili, A. Computed tomography-based radiomics approach in pancreatic tumors characterization. Radiol. Med. 2021, 126, 1388–1395. [Google Scholar] [CrossRef] [PubMed]
- Liu, J.; Wang, C.; Guo, W.; Zeng, P.; Liu, Y.; Lang, N.; Yuan, H. A preliminary study using spinal MRI-based radiomics to predict high-risk cytogenetic abnormalities in multiple myeloma. Radiol. Med. 2021, 126, 1226–1235. [Google Scholar] [CrossRef] [PubMed]
- Ma, X.; Hadjiiski, L.M.; Wei, J.; Chan, H.P.; Cha, K.H.; Cohan, R.H.; Caoili, E.M.; Samala, R.; Zhou, C.; Lu, Y. U-Net based deep learning bladder segmentation in CT urography. Med. Phys. 2019, 46, 1752–1765. [Google Scholar] [CrossRef] [PubMed]
- Liu, J.; Wang, S.; Linguraru, M.G.; Yao, J.; Summers, R.M. Computer-aided detection of exophytic renal lesions on non-contrast CT images. Med. Image Anal. 2015, 19, 15–29. [Google Scholar] [CrossRef] [Green Version]
- Liu, J.; Wang, S.; Yao, J.; Linguraru, M.G.; Summers, R.M. Manifold diffusion for exophytic kidney lesion detection on non-contrast CT images. Med. Image Comput. Comput. Assist. Interv. 2013, 16, 340–347. [Google Scholar] [CrossRef] [Green Version]
- Kim, D.Y.; Park, J.W. Computer-aided detection of kidney tumor on abdominal computed tomography scans. Acta Radiol. 2004, 45, 791–795. [Google Scholar] [CrossRef]
- Calace, F.P.; Napolitano, L.; Arcaniolo, D.; Stizzo, M.; Barone, B.; Crocetto, F.; Olivetta, M.; Amicuzi, U.; Cirillo, L.; Rubinacci, A.; et al. Micro-Ultrasound in the Diagnosis and Staging of Prostate and Bladder Cancer: A Comprehensive. Medicina 2022, 58, 1624. [Google Scholar] [CrossRef]
- Chianca, V.; Albano, D.; Messina, C.; Vincenzo, G.; Rizzo, S.; Del Grande, F.; Sconfienza, L.M. An update in musculoskeletal tumors: From quantitative imaging to radiomics. Radiol. Med. 2021, 126, 1095–1105. [Google Scholar] [CrossRef]
- Xu, X.; Zhou, F.; Liu, B. Automatic bladder segmentation from CT images using deep CNN and 3D fully connected CRF-RNN. Int. J. Comput. Assist. Radiol. Surg. 2018, 13, 967–975. [Google Scholar] [CrossRef]
- Gordon, M.N.; Hadjiiski, L.M.; Cha, K.H.; Samala, R.K.; Chan, H.P.; Cohan, R.H.; Caoili, E.M. Deep-learning convolutional neural network: Inner and outer bladder wall segmentation in CT urography. Med. Phys. 2019, 46, 634–648. [Google Scholar] [CrossRef]
- Granata, V.; Fusco, R.; De Muzio, F.; Cutolo, C.; Setola, S.V.; Dell’Aversana, F.; Grassi, F.; Belli, A.; Silvestro, L.; Ottaiano, A.; et al. Radiomics and machine learning analysis based on magnetic resonance imaging in the assessment of liver mucinous colorectal metastases. Radiol. Med. 2022, 127, 763–772. [Google Scholar] [CrossRef]
- Xue, K.; Liu, L.; Liu, Y.; Guo, Y.; Zhu, Y.; Zhang, M. Radiomics model based on multi-sequence MR images for predicting preoperative immunoscore in rectal cancer. Radiol. Med. 2022, 127, 702–713. [Google Scholar] [CrossRef]
- Masci, G.M.; Ciccarelli, F.; Mattei, F.I.; Grasso, D.; Accarpio, F.; Catalano, C.; Laghi, A.; Sammartino, P.; Iafrate, F. Role of CT texture analysis for predicting peritoneal metastases in patients with gastric cancer. Radiol. Med. 2022, 127, 251–258. [Google Scholar] [CrossRef]
- Castellano, G.; Bonilha, L.; Li, L.M.; Cendes, F. Texture analysis of medical images. Clin. Radiol. 2004, 59, 1061–1069. [Google Scholar] [CrossRef]
- Lambin, P.; Rios-Velazquez, E.; Leijenaar, R.; Carvalho, S.; Van Stiphout, R.G.P.M.; Granton, P.; Zegers, C.M.; Gillies, R.; Boellard, R.; Dekker, A.; et al. Radiomics: Extracting more information from medical images using advanced feature analysis. Eur. J. Cancer 2012, 48, 441–446. [Google Scholar] [CrossRef] [Green Version]
- Cellina, M.; Pirovano, M.; Ciocca, M.; Gibelli, D.; Floridi, C.; Oliva, G. Radiomic analysis of the optic nerve at the first episode of acute optic neuritis: An indicator of optic nerve pathology and a predictor of visual recovery? Radiol. Med. 2021, 126, 698–706. [Google Scholar] [CrossRef]
- Varghese, B.A.; Cen, S.Y.; Hwang, D.H.; Duddalwar, V.A. Texture analysis of imaging: What radiologists need to know. Am. J. Roentgenol. 2019, 212, 520–528. [Google Scholar] [CrossRef]
- Wang, Z.; He, Y.; Wang, N.; Zhang, T.; Wu, H.; Jiang, X.; Mo, L. Clinical value of texture analysis in differentiation of urothelial carcinoma based on multiphase computed tomography images. Medicine 2020, 99, e20093. [Google Scholar] [CrossRef]
- Santone, A.; Brunese, M.C.; Donnarumma, F.; Guerriero, P.; Mercaldo, F.; Reginelli, A.; Miele, V.; Giovagnoni, A.; Brunese, L. Radiomic features for prostate cancer grade detection through formal verification. Radiol. Med. 2021, 126, 688–697. [Google Scholar] [CrossRef]
- Fan, T.W.; Malhi, H.; Varghese, B.; Cen, S.; Hwang, D.; Aron, M.; Rajarubendra, N.; Desai, M.; Duddalwar, V. Computed tomography-based texture analysis of bladder cancer: Differentiating urothelial carcinoma from micropapillary carcinoma. Abdom. Radiol. 2019, 44, 201–208. [Google Scholar] [CrossRef] [PubMed]
- Evrimler, S.; Ali Gedik, M.; Ahmet Serel, T.; Ertunc, O.; Alperen Ozturk, S.; Soyupek, S. Bladder Urothelial Carcinoma: Machine Learning-based Computed Tomography Radiomics for Prediction of Histological Variant. Acad. Radiol. 2022, 29, 1682–1689. [Google Scholar] [CrossRef] [PubMed]
- Han, D.; Yu, N.; Yu, Y.; He, T.; Duan, X. Performance of CT radiomics in predicting the overall survival of patients with stage III clear cell renal carcinoma after radical nephrectomy. Radiol. Med. 2022, 127, 837–847. [Google Scholar] [CrossRef] [PubMed]
- Armstrong, A.J.; Halabi, S.; Eisen, T.; Broderick, S.; Stadler, W.M.; Jones, R.J.; Garcia, J.A.; Vaishampayan, U.N.; Picus, J.; Hawkins, R.E.; et al. Everolimus versus sunitinib for patients with metastatic non-clear cell renal cell carcinoma (ASPEN): A multicentre, open-label, randomised phase 2 trial. Lancet Oncol. 2016, 17, 378–388. [Google Scholar] [CrossRef] [PubMed]
- Fernández-Pello, S.; Hofmann, F.; Tahbaz, R.; Marconi, L.; Lam, T.B.; Albiges, L.; Bensalah, K.; Canfield, S.E.; Dabestani, S.; Giles, R.H.; et al. A Systematic Review and Meta-analysis Comparing the Effectiveness and Adverse Effects of Different Systemic Treatments for Non-clear Cell Renal Cell Carcinoma. Eur. Urol. 2017, 71, 426–436. [Google Scholar] [CrossRef]
- Palatresi, D.; Fedeli, F.; Danti, G.; Pasqualini, E.; Castiglione, F.; Messerini, L.; Massi, D.; Bettarini, S.; Tortoli, P.; Busoni, S.; et al. Correlation of CT radiomic features for GISTs with pathological classification and molecular subtypes: Preliminary and monocentric experience. Radiol. Med. 2022, 127, 117–128. [Google Scholar] [CrossRef]
- Kim, T.M.; Ahn, H.; Lee, H.J.; Kim, M.G.; Cho, J.Y.; Hwang, S.I.; Kim, S.Y. Differentiating renal epithelioid angiomyolipoma from clear cell carcinoma: Using a radiomics model combined with CT imaging characteristics. Abdom. Radiol. 2022, 47, 2867–2880. [Google Scholar] [CrossRef]
- Li, X.; Ma, Q.; Tao, C.; Liu, J.; Nie, P.; Dong, C. A CT-based radiomics nomogram for differentiation of small masses (<4 cm) of renal oncocytoma from clear cell renal cell carcinoma. Abdom. Radiol. 2021, 46, 5240–5249. [Google Scholar] [CrossRef]
- Bhandari, A.; Ibrahim, M.; Sharma, C.; Liong, R.; Gustafson, S.; Prior, M. CT-based radiomics for differentiating renal tumours: A systematic review. Abdom. Radiol. 2021, 46, 2052–2063. [Google Scholar] [CrossRef]
- Qin, H.; Que, Q.; Lin, P.; Li, X.; Wang, X.R.; He, Y.; Chen, J.Q.; Yang, H. Magnetic resonance imaging (MRI) radiomics of papillary thyroid cancer (PTC): A comparison of predictive performance of multiple classifiers modeling to identify cervical lymph node metastases before surgery. Radiol. Med. 2021, 126, 1312–1327. [Google Scholar] [CrossRef]
- Shariat, S.F.; Palapattu, G.S.; Karakiewicz, P.I.; Rogers, C.G.; Vazina, A.; Bastian, P.J.; Schoenberg, M.P.; Lerner, S.P.; Sagalowsky, A.I.; Lotan, Y. Discrepancy between Clinical and Pathologic Stage: Impact on Prognosis after Radical Cystectomy. Eur. Urol. 2007, 51, 137–149. [Google Scholar] [CrossRef]
- Mariappan, P.; Zachou, A.; Grigor, K.M. Detrusor Muscle in the First, Apparently Complete Transurethral Resection of Bladder Tumour Specimen Is a Surrogate Marker of Resection Quality, Predicts Risk of Early Recurrence, and Is Dependent on Operator Experience. Eur. Urol. 2010, 57, 843–849. [Google Scholar] [CrossRef]
- Zhang, G.; Wu, Z.; Xu, L.; Zhang, X.; Zhang, D.; Mao, L.; Li, X.; Xiao, Y.; Guo, J.; Ji, Z.; et al. Deep Learning on Enhanced CT Images Can Predict the Muscular Invasiveness of Bladder Cancer. Front. Oncol. 2021, 11, 654685. [Google Scholar] [CrossRef]
- Garapati, S.S.; Hadjiiski, L.; Cha, K.H.; Chan, H.P.; Caoili, E.; Cohan, R.H.; Weizer, A.; Alva, A.; Paramagul, C.; Wei, J.; et al. Urinary bladder cancer staging in CT urography using machine learning. Med. Phys. 2017, 44, 5814–5823. [Google Scholar] [CrossRef]
- Zhang, G.M.Y.; Sun, H.; Shi, B.; Jin, Z.Y.; Xue, H.D. Quantitative CT texture analysis for evaluating histologic grade of urothelial carcinoma. Abdom. Radiol. 2017, 42, 561–568. [Google Scholar] [CrossRef]
- Delahunt, B.; Cheville, J.C.; Martignoni, G.; Humphrey, P.A.; Magi-Galluzzi, C.; McKenney, J.; Egevad, L.; Algaba, F.; Moch, H.; Grignon, D.J.; et al. The International Society of Urological Pathology (ISUP) grading system for renal cell carcinoma and other prognostic parameters. Am. J. Surg. Pathol. 2013, 37, 1490–1504. [Google Scholar] [CrossRef] [Green Version]
- Fuhrman, S.A.; Lasky, L.C.; Limas, C. Prognostic significance of morphologic parameters in renal cell carcinoma. Am. J. Surg. Pathol. 1982, 6, 655–663. [Google Scholar] [CrossRef]
- Warren, A.Y.; Harrison, D. WHO/ISUP classification, grading and pathological staging of renal cell carcinoma: Standards and controversies. World J. Urol. 2018, 36, 1913–1926. [Google Scholar] [CrossRef] [Green Version]
- Bektas, C.T.; Kocak, B.; Yardimci, A.H.; Turkcanoglu, M.H.; Yucetas, U.; Koca, S.B.; Erdim, C.; Kilickesmez, O. Clear Cell Renal Cell Carcinoma: Machine Learning-Based Quantitative Computed Tomography Texture Analysis for Prediction of Fuhrman Nuclear Grade. Eur. Radiol. 2019, 29, 1153–1163. [Google Scholar] [CrossRef]
- Wang, R.; Hu, Z.; Shen, X.; Wang, Q.; Zhang, L.; Wang, M.; Feng, Z.; Chen, F. Computed Tomography-Based Radiomics Model for Predicting the WHO/ISUP Grade of Clear Cell Renal Cell Carcinoma Preoperatively: A Multicenter Study. Front. Oncol. 2021, 11, 543854. [Google Scholar] [CrossRef]
- Demirjian, N.L.; Varghese, B.A.; Cen, S.Y.; Hwang, D.H.; Aron, M.; Siddiqui, I.; Fields, B.K.K.; Lei, X.; Yap, F.Y.; Rivas, M.; et al. CT-based radiomics stratification of tumor grade and TNM stage of clear cell renal cell carcinoma. Eur. Radiol. 2022, 32, 2552–2563. [Google Scholar] [CrossRef] [PubMed]
- Han, D.; Yu, Y.; He, T.; Yu, N.; Dang, S.; Wu, H.; Ren, J.; Duan, X. Effect of radiomics from different virtual monochromatic images in dual-energy spectral CT on the WHO/ISUP classification of clear cell renal cell carcinoma. Clin. Rad. 2021, 76, e23–e627. [Google Scholar] [CrossRef] [PubMed]
- Nardone, V.; Reginelli, A.; Grassi, R.; Boldrini, L.; Vacca, G.; D’Ippolito, E.; Annunziata, S.; Farchione, A.; Belfiore, M.P.; Desideri, I.; et al. Delta radiomics: A systematic review. Radiol. Med. 2021, 126, 1571–1583. [Google Scholar] [CrossRef] [PubMed]
- Meeks, J.J.; Bellmunt, J.; Bochner, B.H.; Clarke, N.W.; Daneshmand, S.; Galsky, M.D.; Hahn, N.M.; Lerner, S.P.; Mason, M.; Powles, T.; et al. A systematic review of neoadjuvant and adjuvant chemotherapy for muscle-invasive bladder cancer. Eur. Urol. 2012, 62, 523–533. [Google Scholar] [CrossRef]
- Witjes, J.A.; Wullink, M.; Oosterhof, G.O.N.; De Mulder, P. Toxicity and results of MVAC (methotrexate, vinblastine, adriamycin and cisplatin) chemotherapy in advanced urothelial carcinoma. Eur. Urol. 1997, 31, 414–419. [Google Scholar] [CrossRef]
- Caruso, D.; Polici, M.; Rinzivillo, M.; Zerunian, M.; Nacci, I.; Marasco, M.; Magi, L.; Tarallo, M.; Gargiulo, S.; Iannicelli, E.; et al. CT-based radiomics for prediction of therapeutic response to Everolimus in metastatic neuroendocrine tumors. Radiol. Med. 2022, 127, 691–701. [Google Scholar] [CrossRef]
- Sun, D.; Hadjiiski, L.; Alva, A.; Zakharia, Y.; Joshi, M.; Chan, H.P.; Garje, R.; Pomerantz, L.; Elhag, D.; Cohan, R.H. Computerized decision support for bladder cancer treatment response assessment in CT urography: Effect on diagnostic accuracy in multi-institution multi-specialty study. Tomography 2022, 8, 644–656. [Google Scholar]
- Wu, E.; Hadjiiski, L.M.; Samala, R.K.; Chan, H.P.; Cha, K.H.; Richter, C.; Cohan, R.H.; Caoili, E.M.; Paramagul, C.; Alva, A.; et al. Deep learning approach for assessment of bladder cancer treatment response. Tomography 2019, 5, 201–208. [Google Scholar] [CrossRef]
- Cha, K.H.; Hadjiiski, L.; Chan, H.P.; Weizer, A.Z.; Alva, A.; Cohan, R.H.; Caoili, E.M.; Paramagul, C.; Samala, R.K. Bladder Cancer Treatment Response Assessment in CT using Radiomics with Deep-Learning. Sci. Rep. 2017, 7, 8738. [Google Scholar] [CrossRef]
- Park, K.J.; Lee, J.L.; Yoon, S.K.; Heo, C.; Park, B.W.; Kim, J.K. Radiomics-based prediction model for outcomes of PD-1/PD-L1 immunotherapy in metastatic urothelial carcinoma. Eur. Radiol. 2020, 30, 5392–5403. [Google Scholar] [CrossRef]
- Rundo, F.; Bersanelli, M.; Urzia, V.; Friedlaender, A.; Cantale, O.; Calcara, G.; Addeo, A.; Banna, G.L. Three-Dimensional Deep Noninvasive Radiomics for the Prediction of Disease Control in Patients With Metastatic Urothelial Carcinoma treated with Immunotherapy. Clin. Genitourin. Cancer 2021, 19, 396–404. [Google Scholar] [CrossRef]
- Vicini, S.; Bortolotto, C.; Rengo, M.; Ballerini, D.; Bellini, D.; Carbone, I.; Preda, L.; Laghi, A.; Coppola, F.; Faggioni, L. A narrative review on current imaging applications of artificial intelligence and radiomics in oncology: Focus on the three most common cancers. Radiol. Med. 2022, 127, 819–836. [Google Scholar] [CrossRef]


| Clinical Indications for CTU |
|---|
| Micro and/or macrohematuria suspicious for urologic malignancy |
| Staging and follow-up for urothelial malignancy |
| Iatrogenic or traumatic injuries |
| Congenital abnormalities |
| Urinary tract obstruction |
| Infiltration by pelvic and abdominal tumors |
| Pre-operative assessment of kidney donors |
| Post-operative urinary tract anatomy |
| Technique | Scanning Protocol |
|---|---|
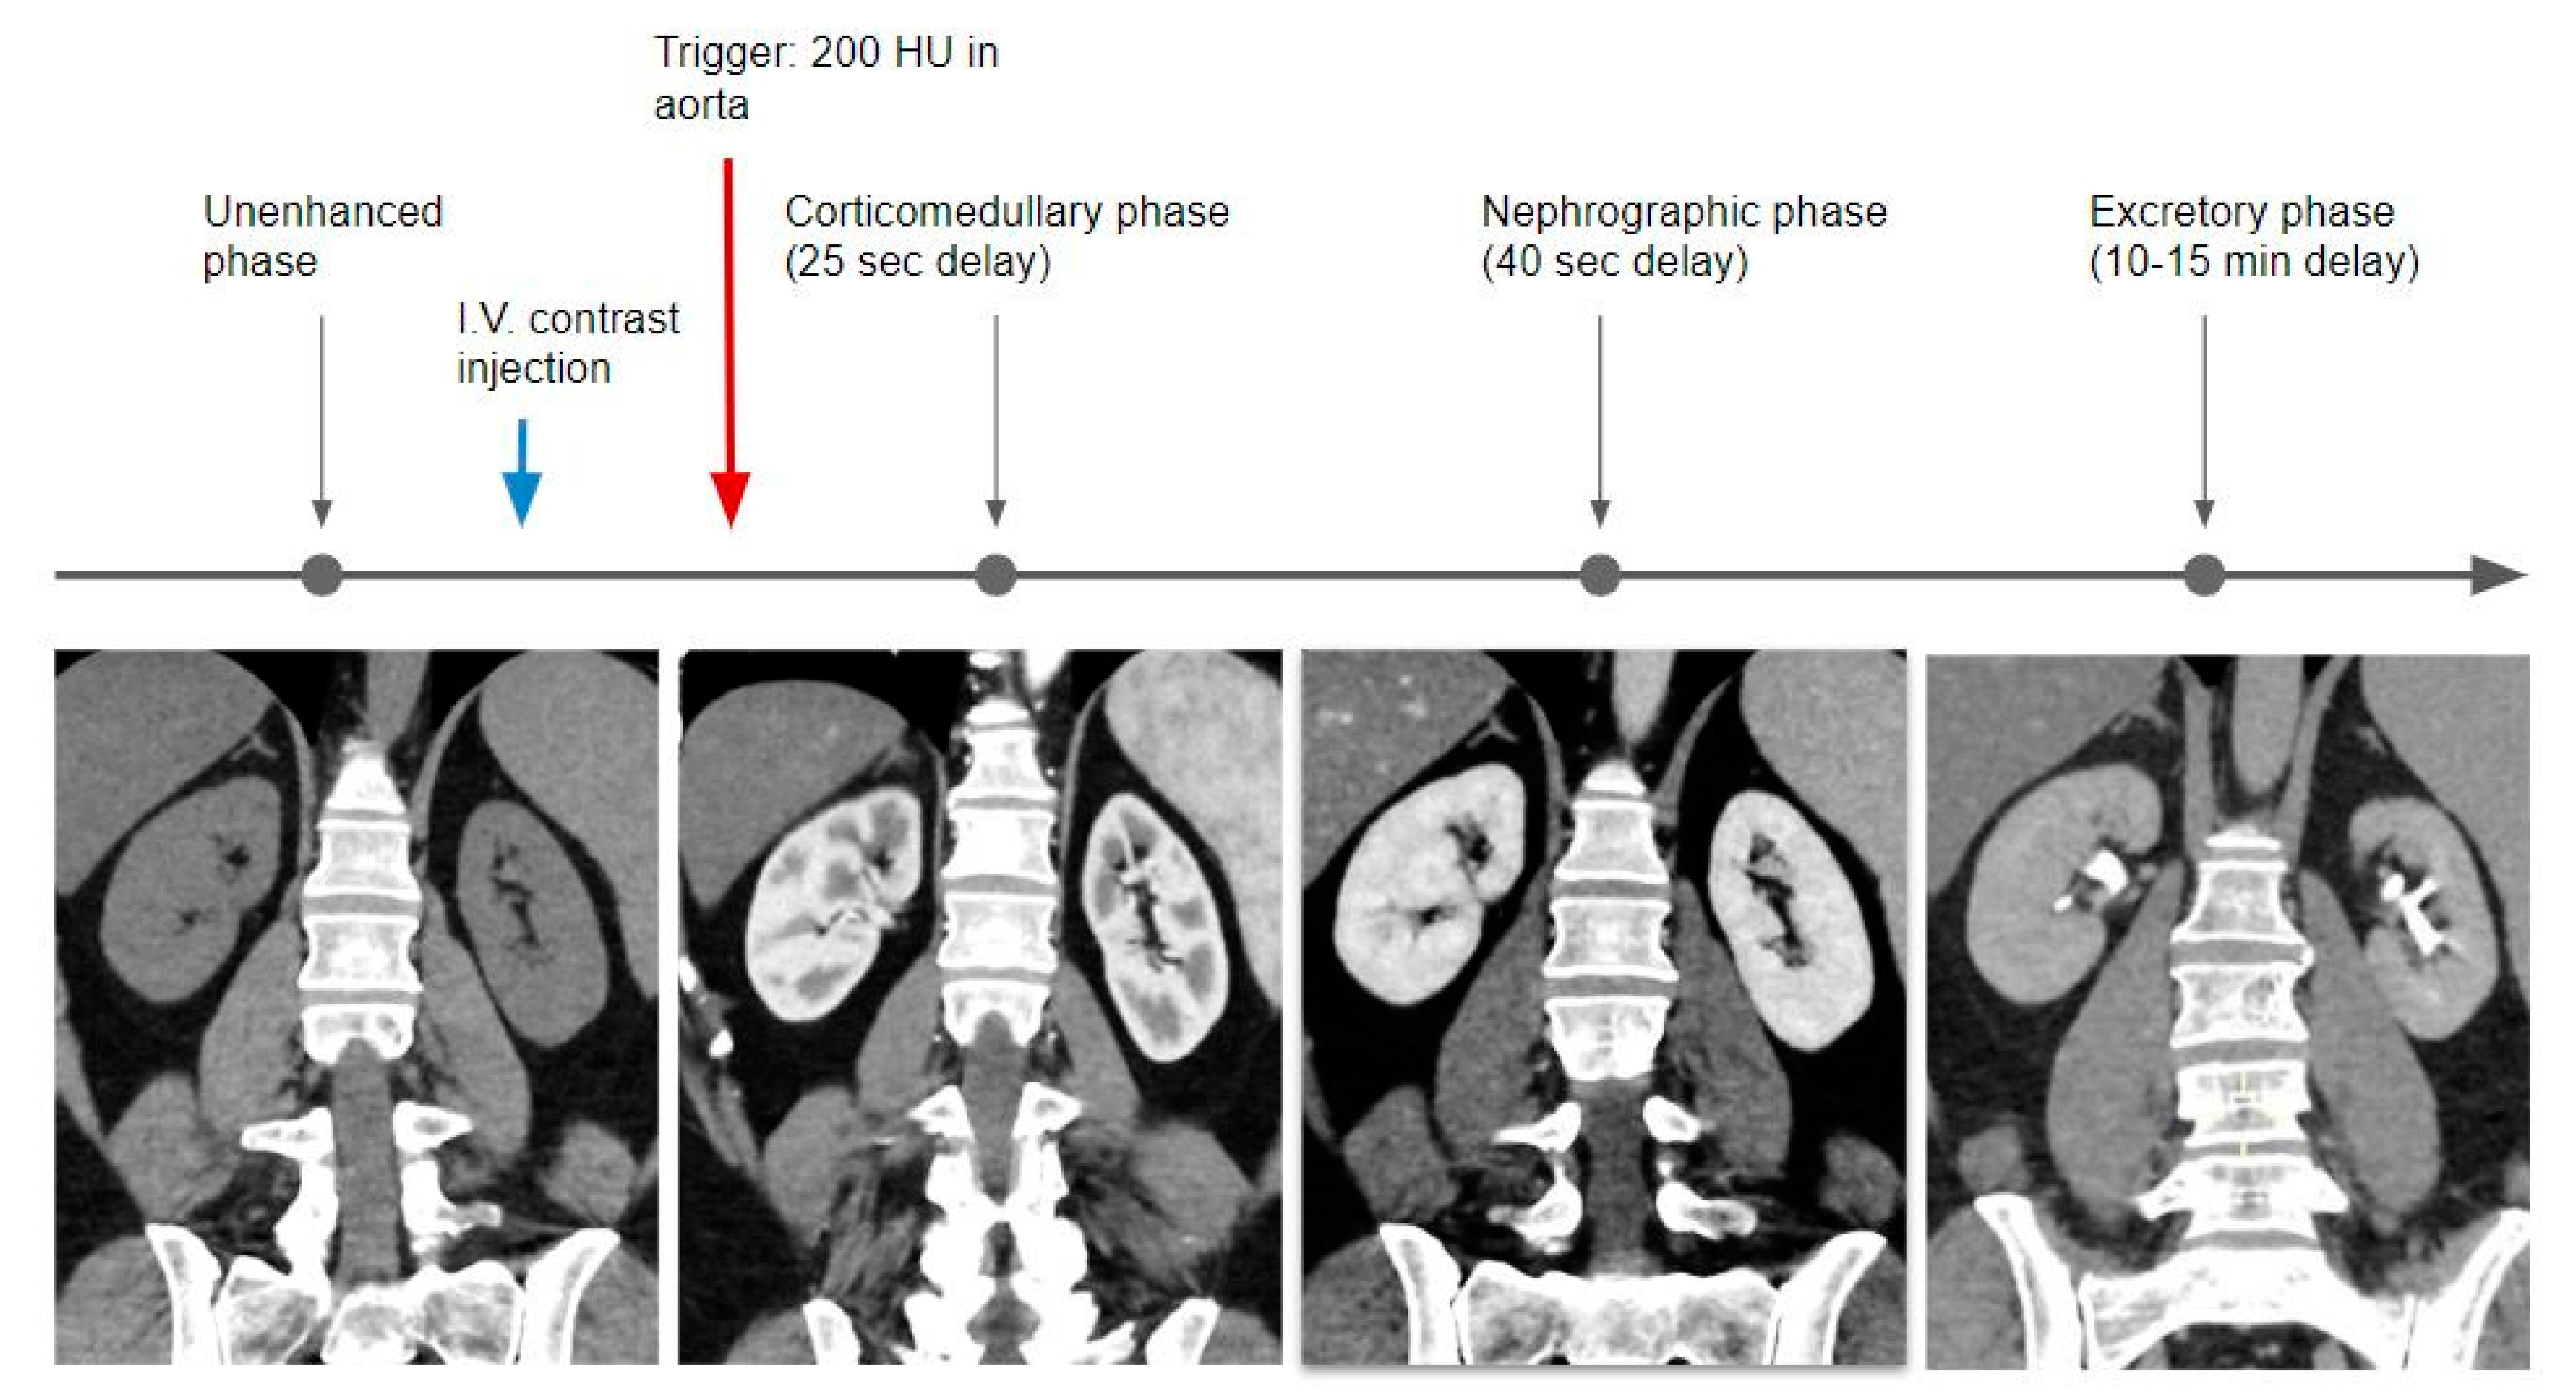
| Triple phase (conventional single-energy CT) |
|
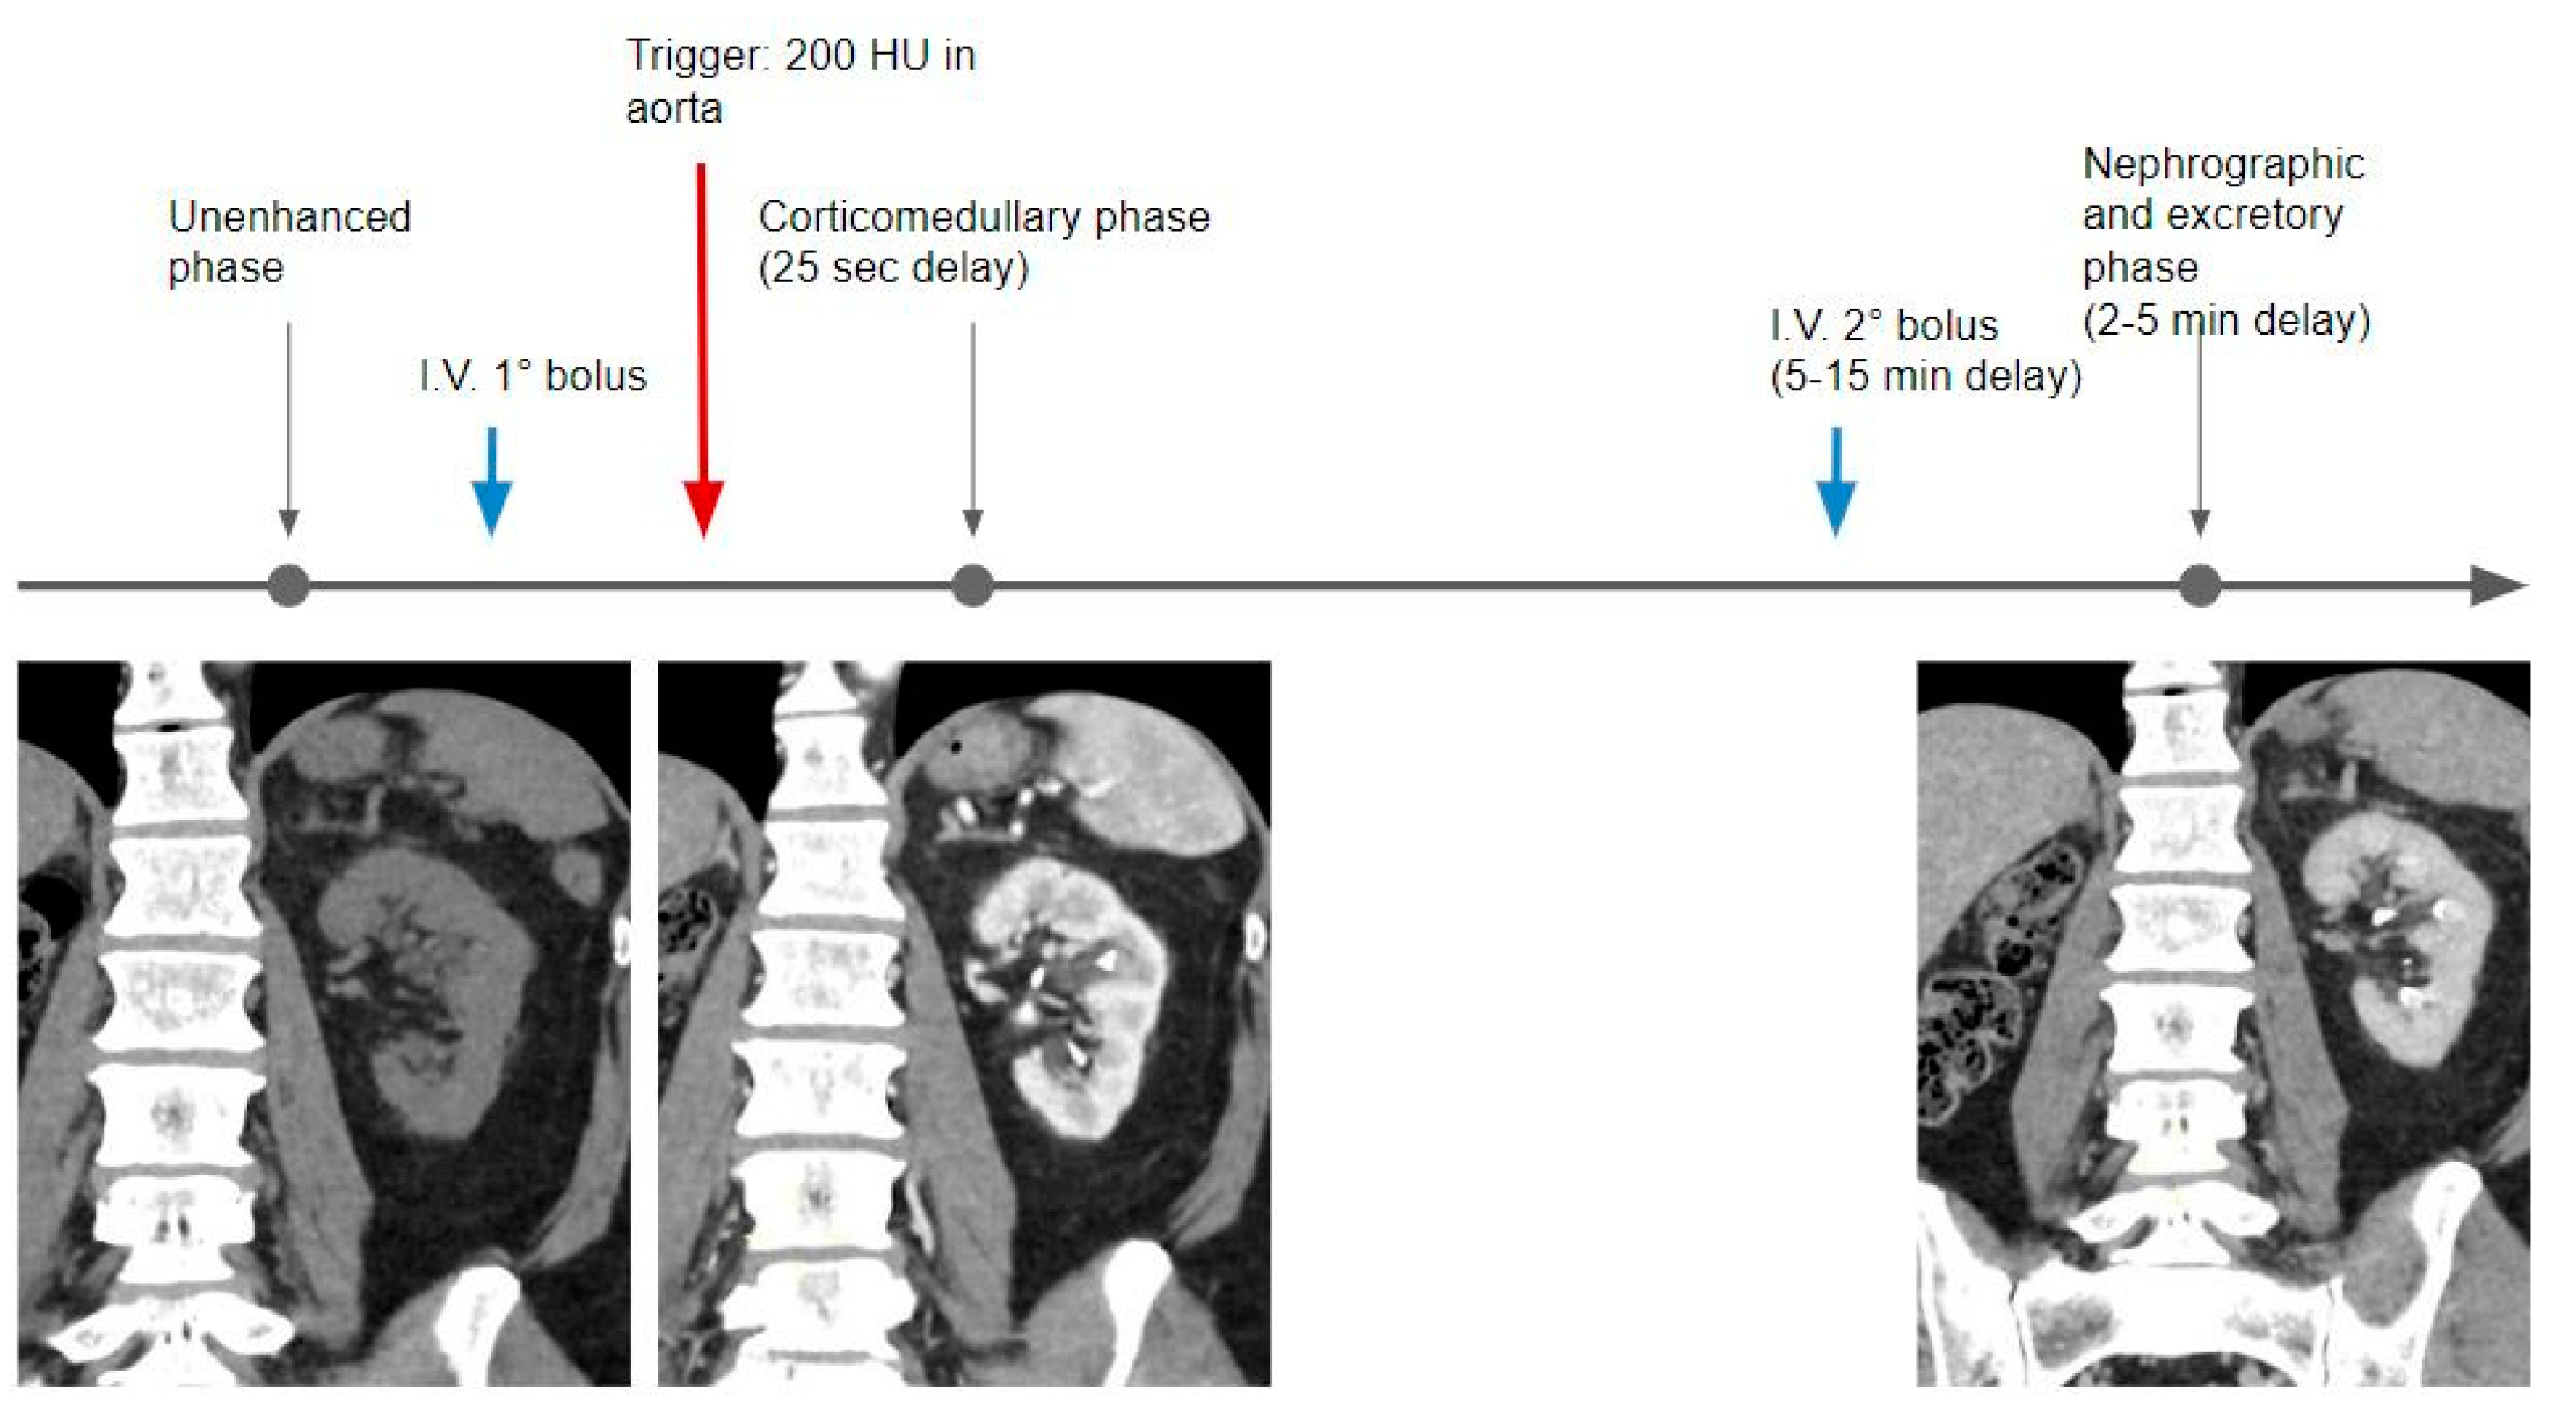
| Dual-phase split bolus (conventional single-energy CT) |
Combined nephrogenic and excretory phase (2–5 min after the second bolus) |
| Single-phase triple bolus (conventional single-energy CT) |
After 100 s, the third intravenous contrast agent injection (third bolus) Combined cortico-medullary, nephrogenic, and excretory phase (25 s after the third bolus) |
| Single-phase Dual-Energy CT |
|
| Benefits Provided by DECT |
|---|
| Dose reduction |
| Reduction of the administered contrast medium |
| Stone composition analysis |
| Availability of iodine maps |
Disclaimer/Publisher’s Note: The statements, opinions and data contained in all publications are solely those of the individual author(s) and contributor(s) and not of MDPI and/or the editor(s). MDPI and/or the editor(s) disclaim responsibility for any injury to people or property resulting from any ideas, methods, instructions or products referred to in the content. |
© 2023 by the authors. Licensee MDPI, Basel, Switzerland. This article is an open access article distributed under the terms and conditions of the Creative Commons Attribution (CC BY) license (https://creativecommons.org/licenses/by/4.0/).
Share and Cite
Cellina, M.; Cè, M.; Rossini, N.; Cacioppa, L.M.; Ascenti, V.; Carrafiello, G.; Floridi, C. Computed Tomography Urography: State of the Art and Beyond. Tomography 2023, 9, 909-930. https://doi.org/10.3390/tomography9030075
Cellina M, Cè M, Rossini N, Cacioppa LM, Ascenti V, Carrafiello G, Floridi C. Computed Tomography Urography: State of the Art and Beyond. Tomography. 2023; 9(3):909-930. https://doi.org/10.3390/tomography9030075
Chicago/Turabian StyleCellina, Michaela, Maurizio Cè, Nicolo’ Rossini, Laura Maria Cacioppa, Velio Ascenti, Gianpaolo Carrafiello, and Chiara Floridi. 2023. "Computed Tomography Urography: State of the Art and Beyond" Tomography 9, no. 3: 909-930. https://doi.org/10.3390/tomography9030075