
Toward Practical Integration of Omic and Imaging Data in Co-Clinical Trials
 , , , , , , , , and
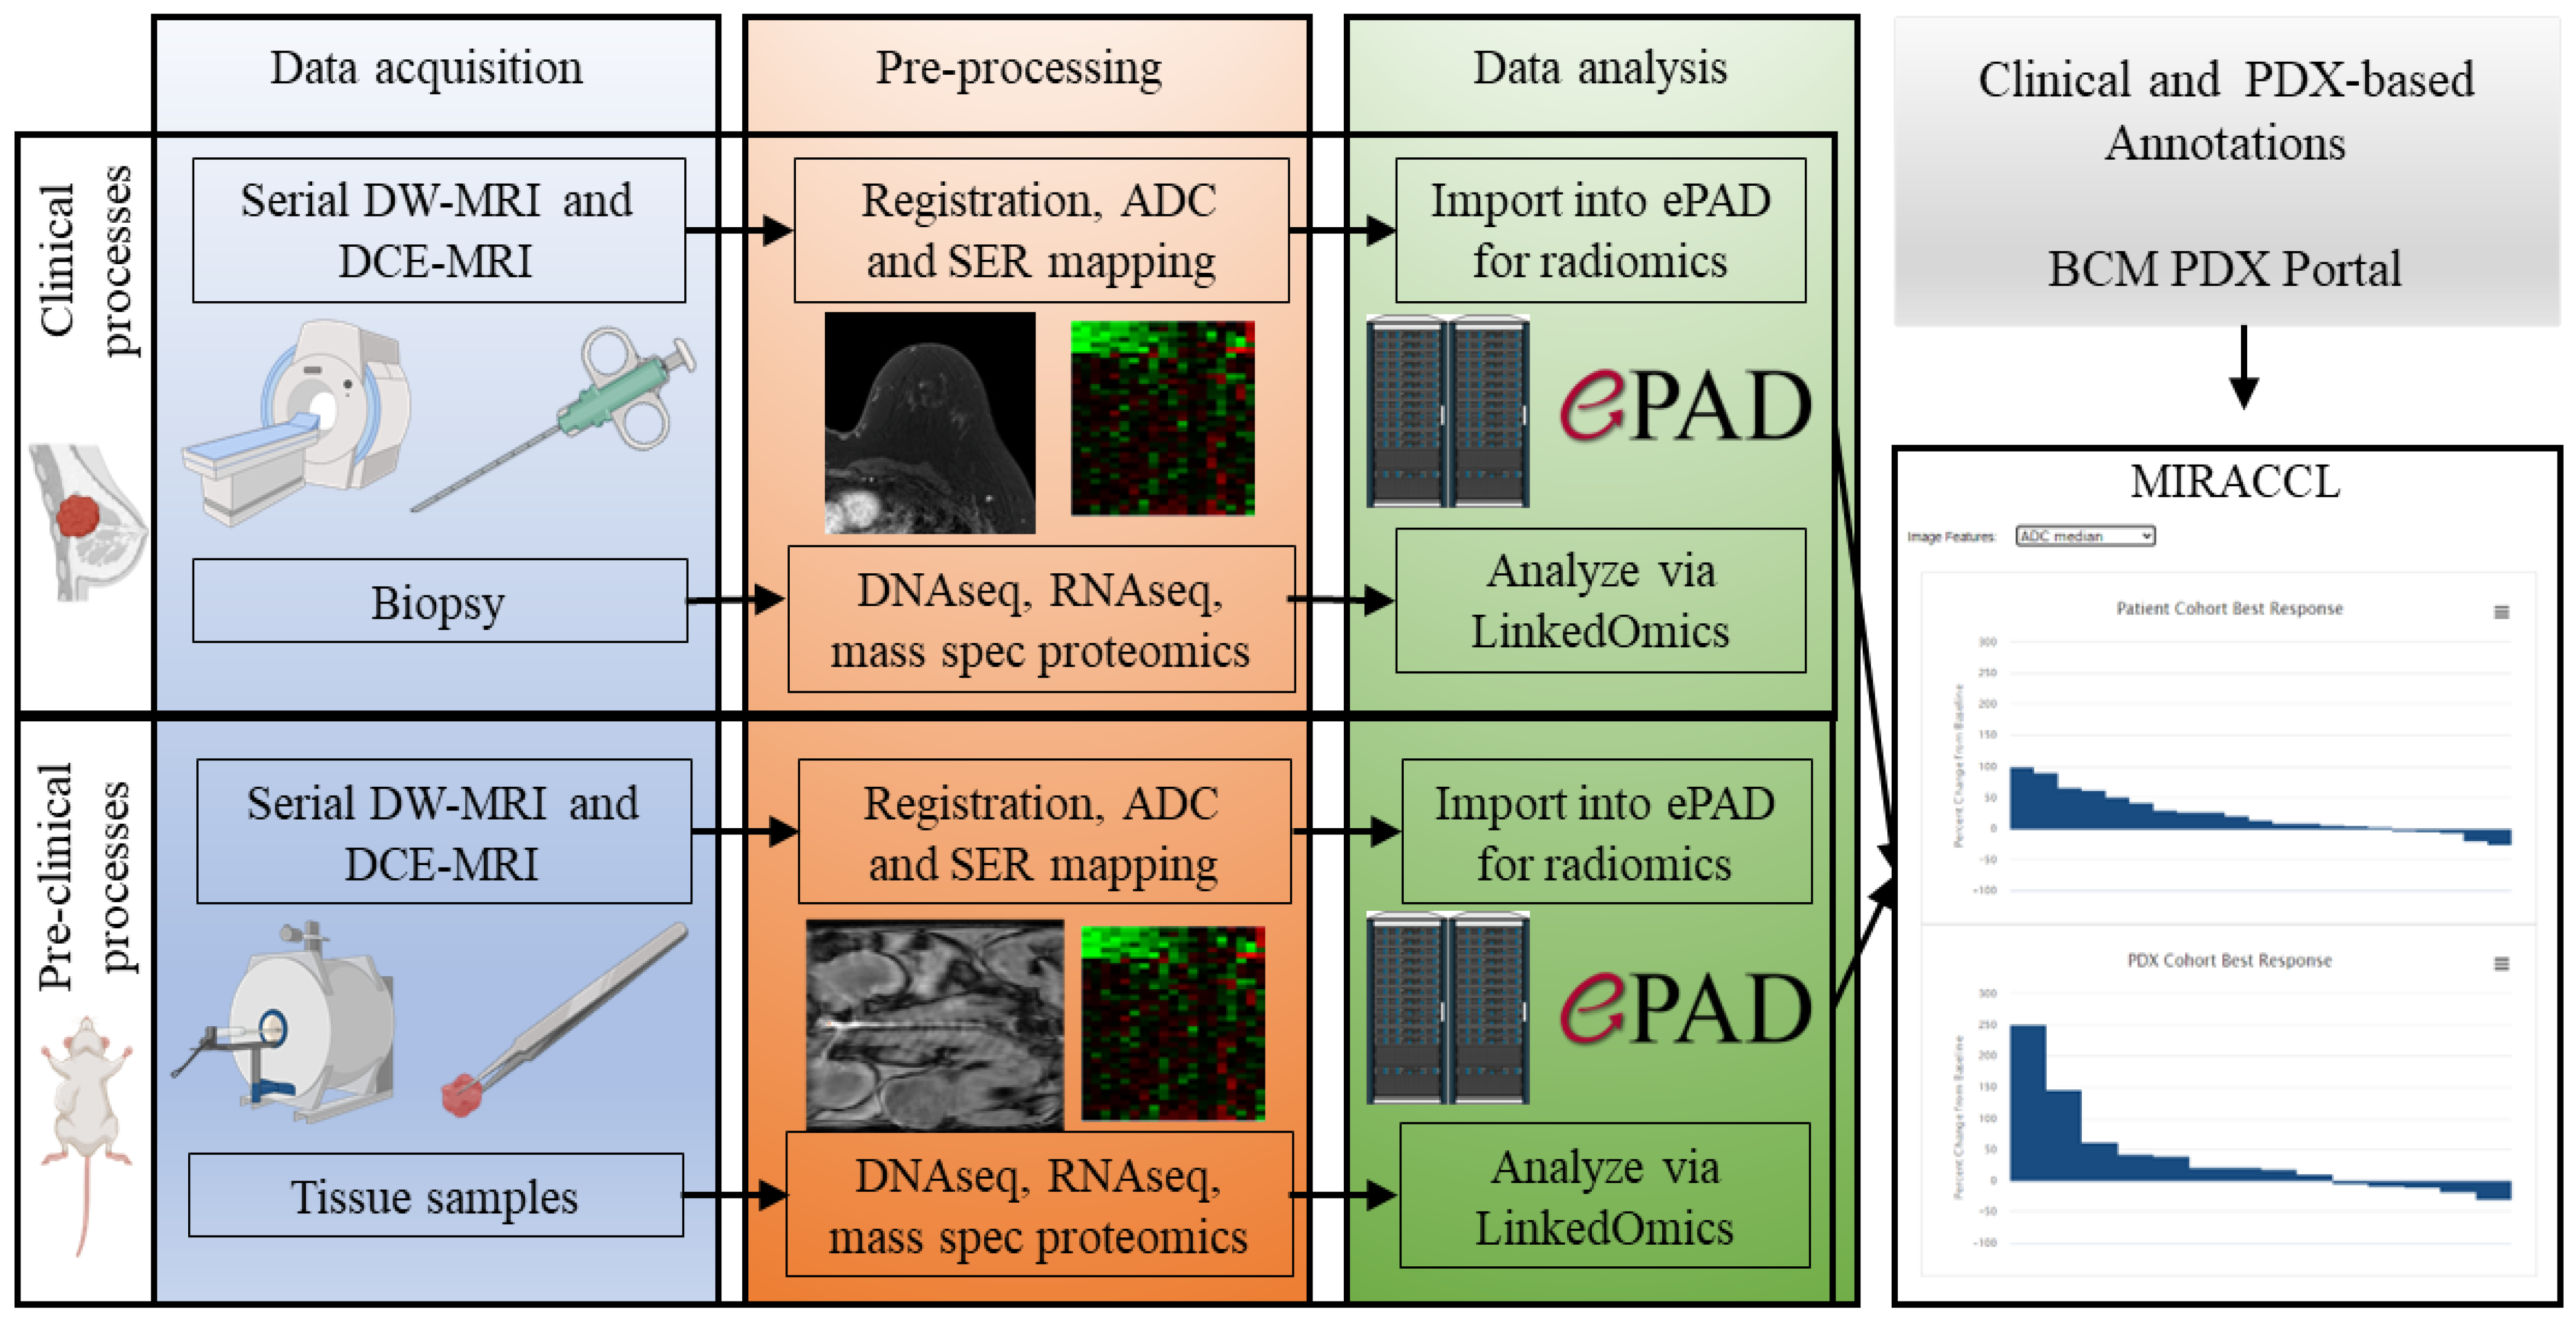
Abstract
:1. Introduction
1.1. Central Challenges in Co-Clinical Trials
1.2. “Credentialling” of PDX Models Is Essential for Co-Clinical Trials to Be Translationally Relevant
1.3. Data Challenges and the Conception of MIRACCL
1.4. Conceptualization of MIRACCL
1.5. The Original Impetus for Developing MIRACCL
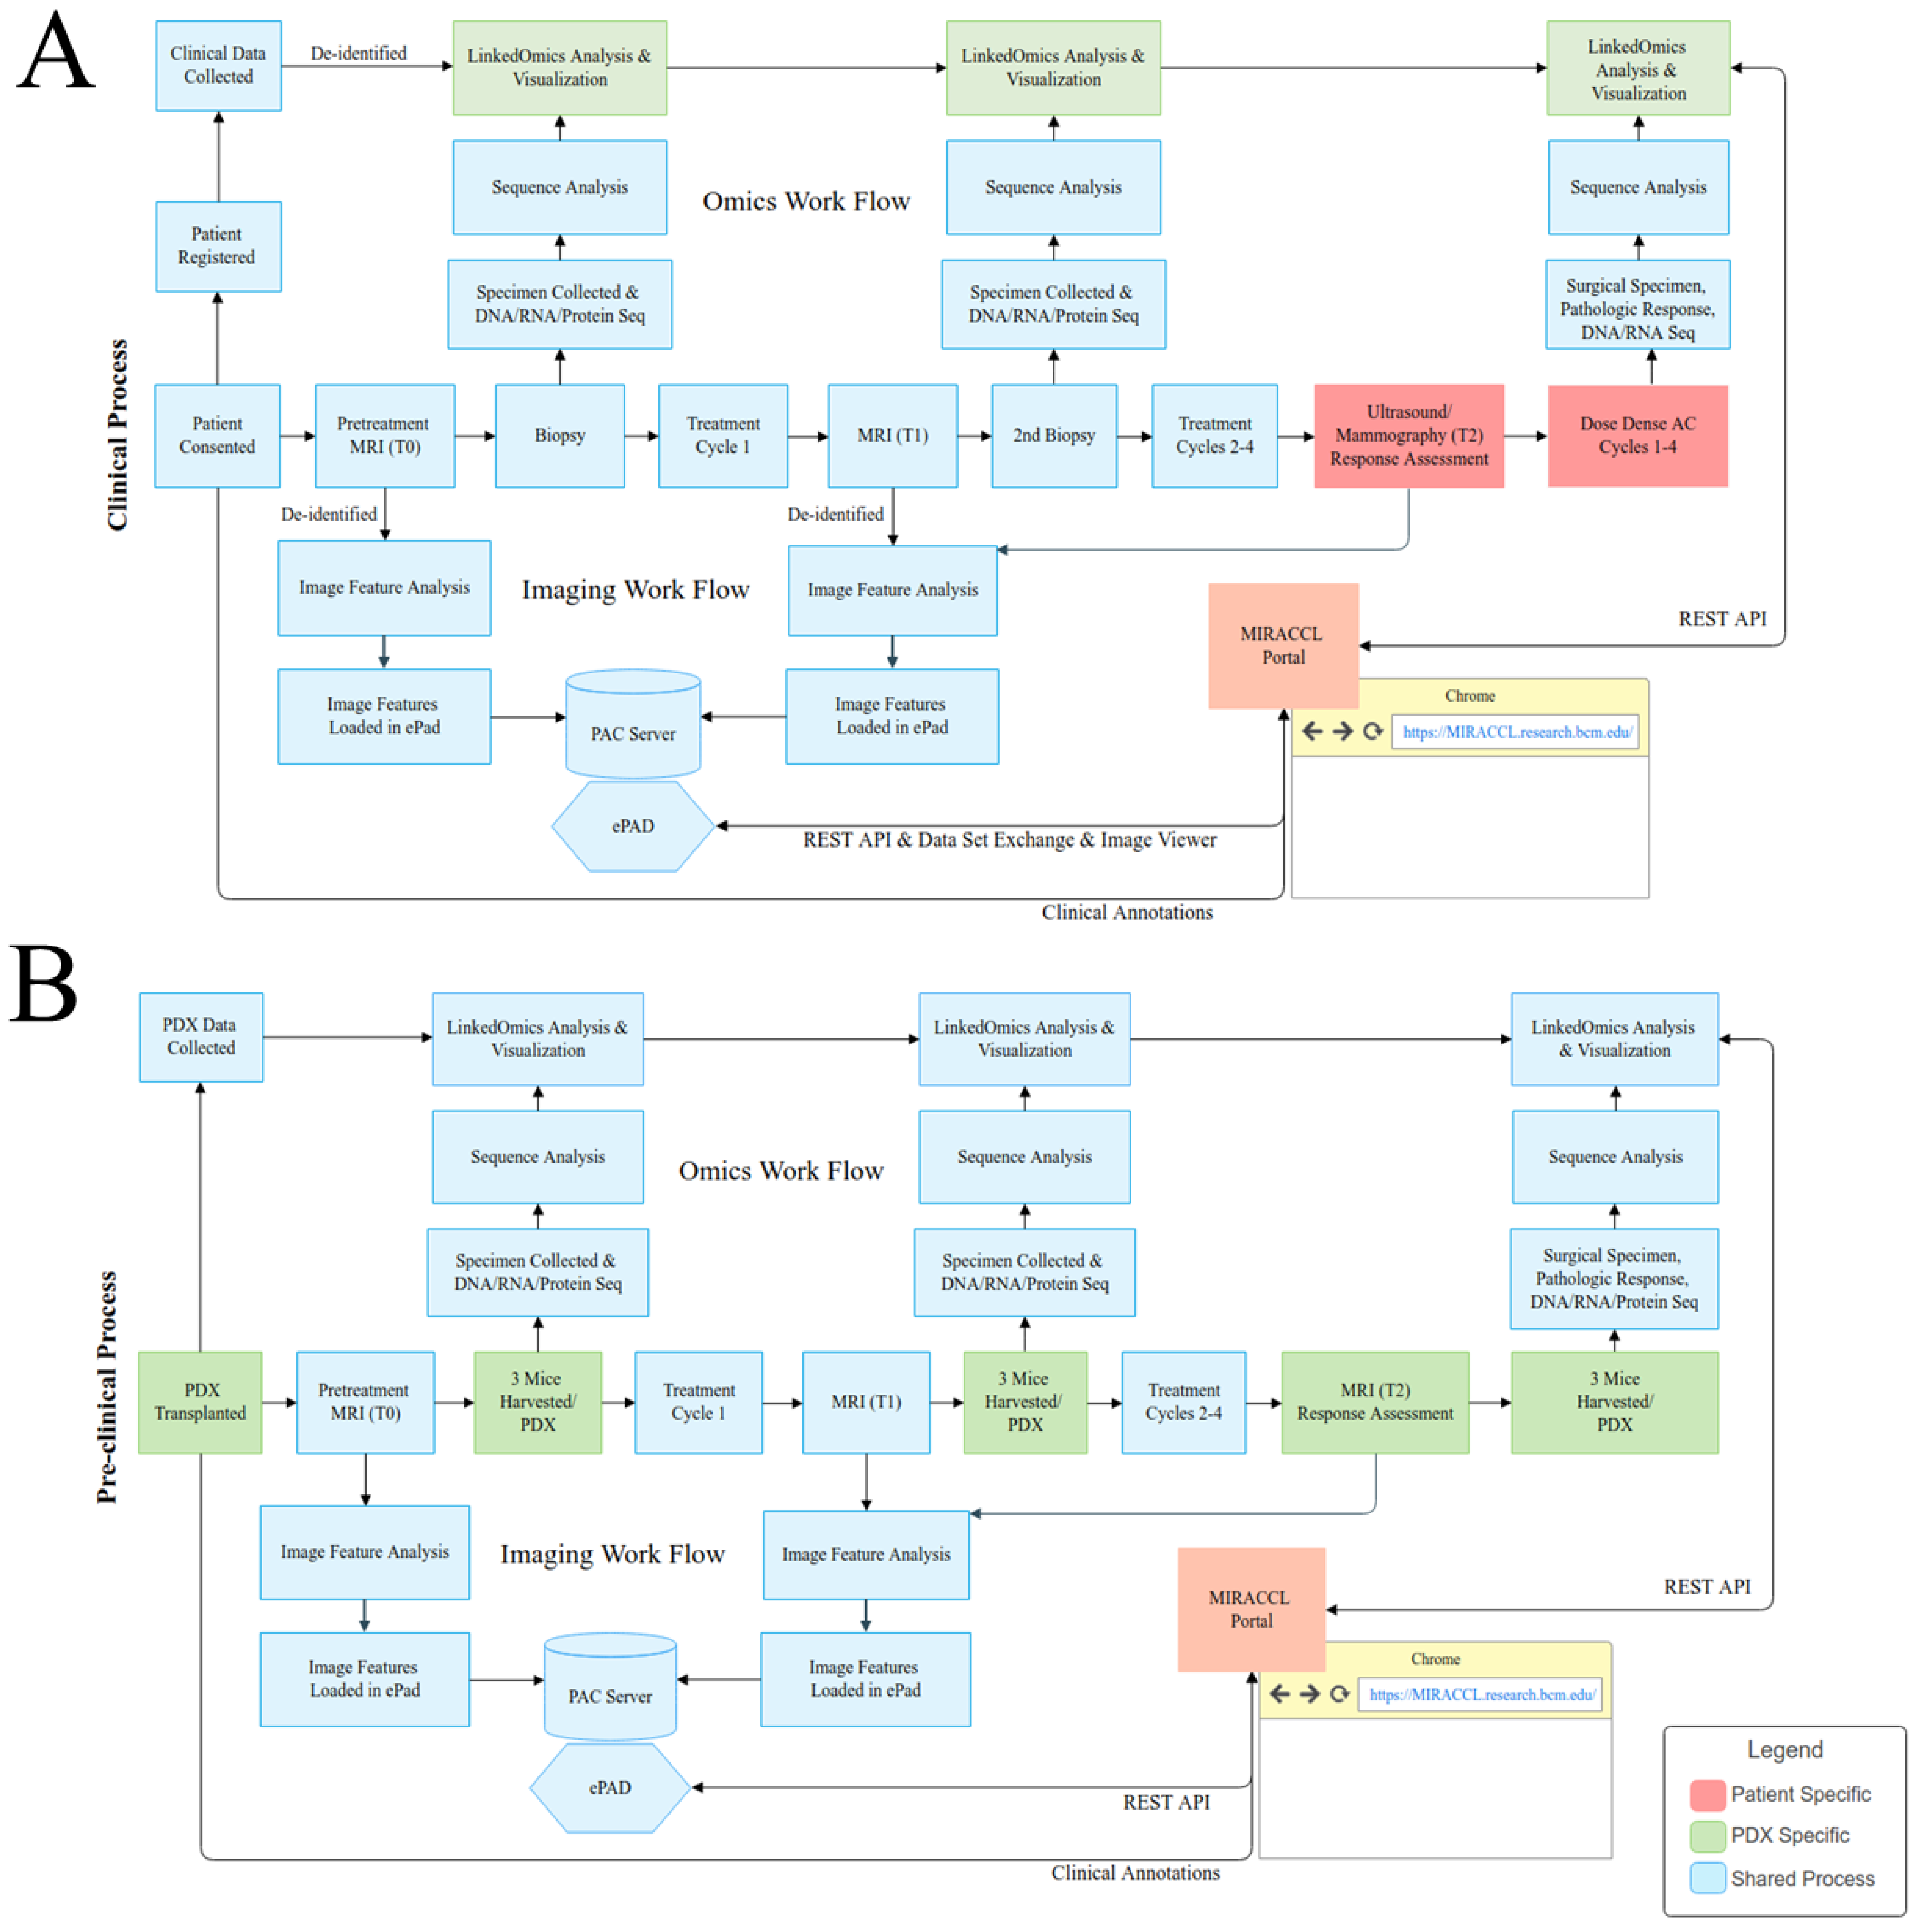
2. Approach and Methods
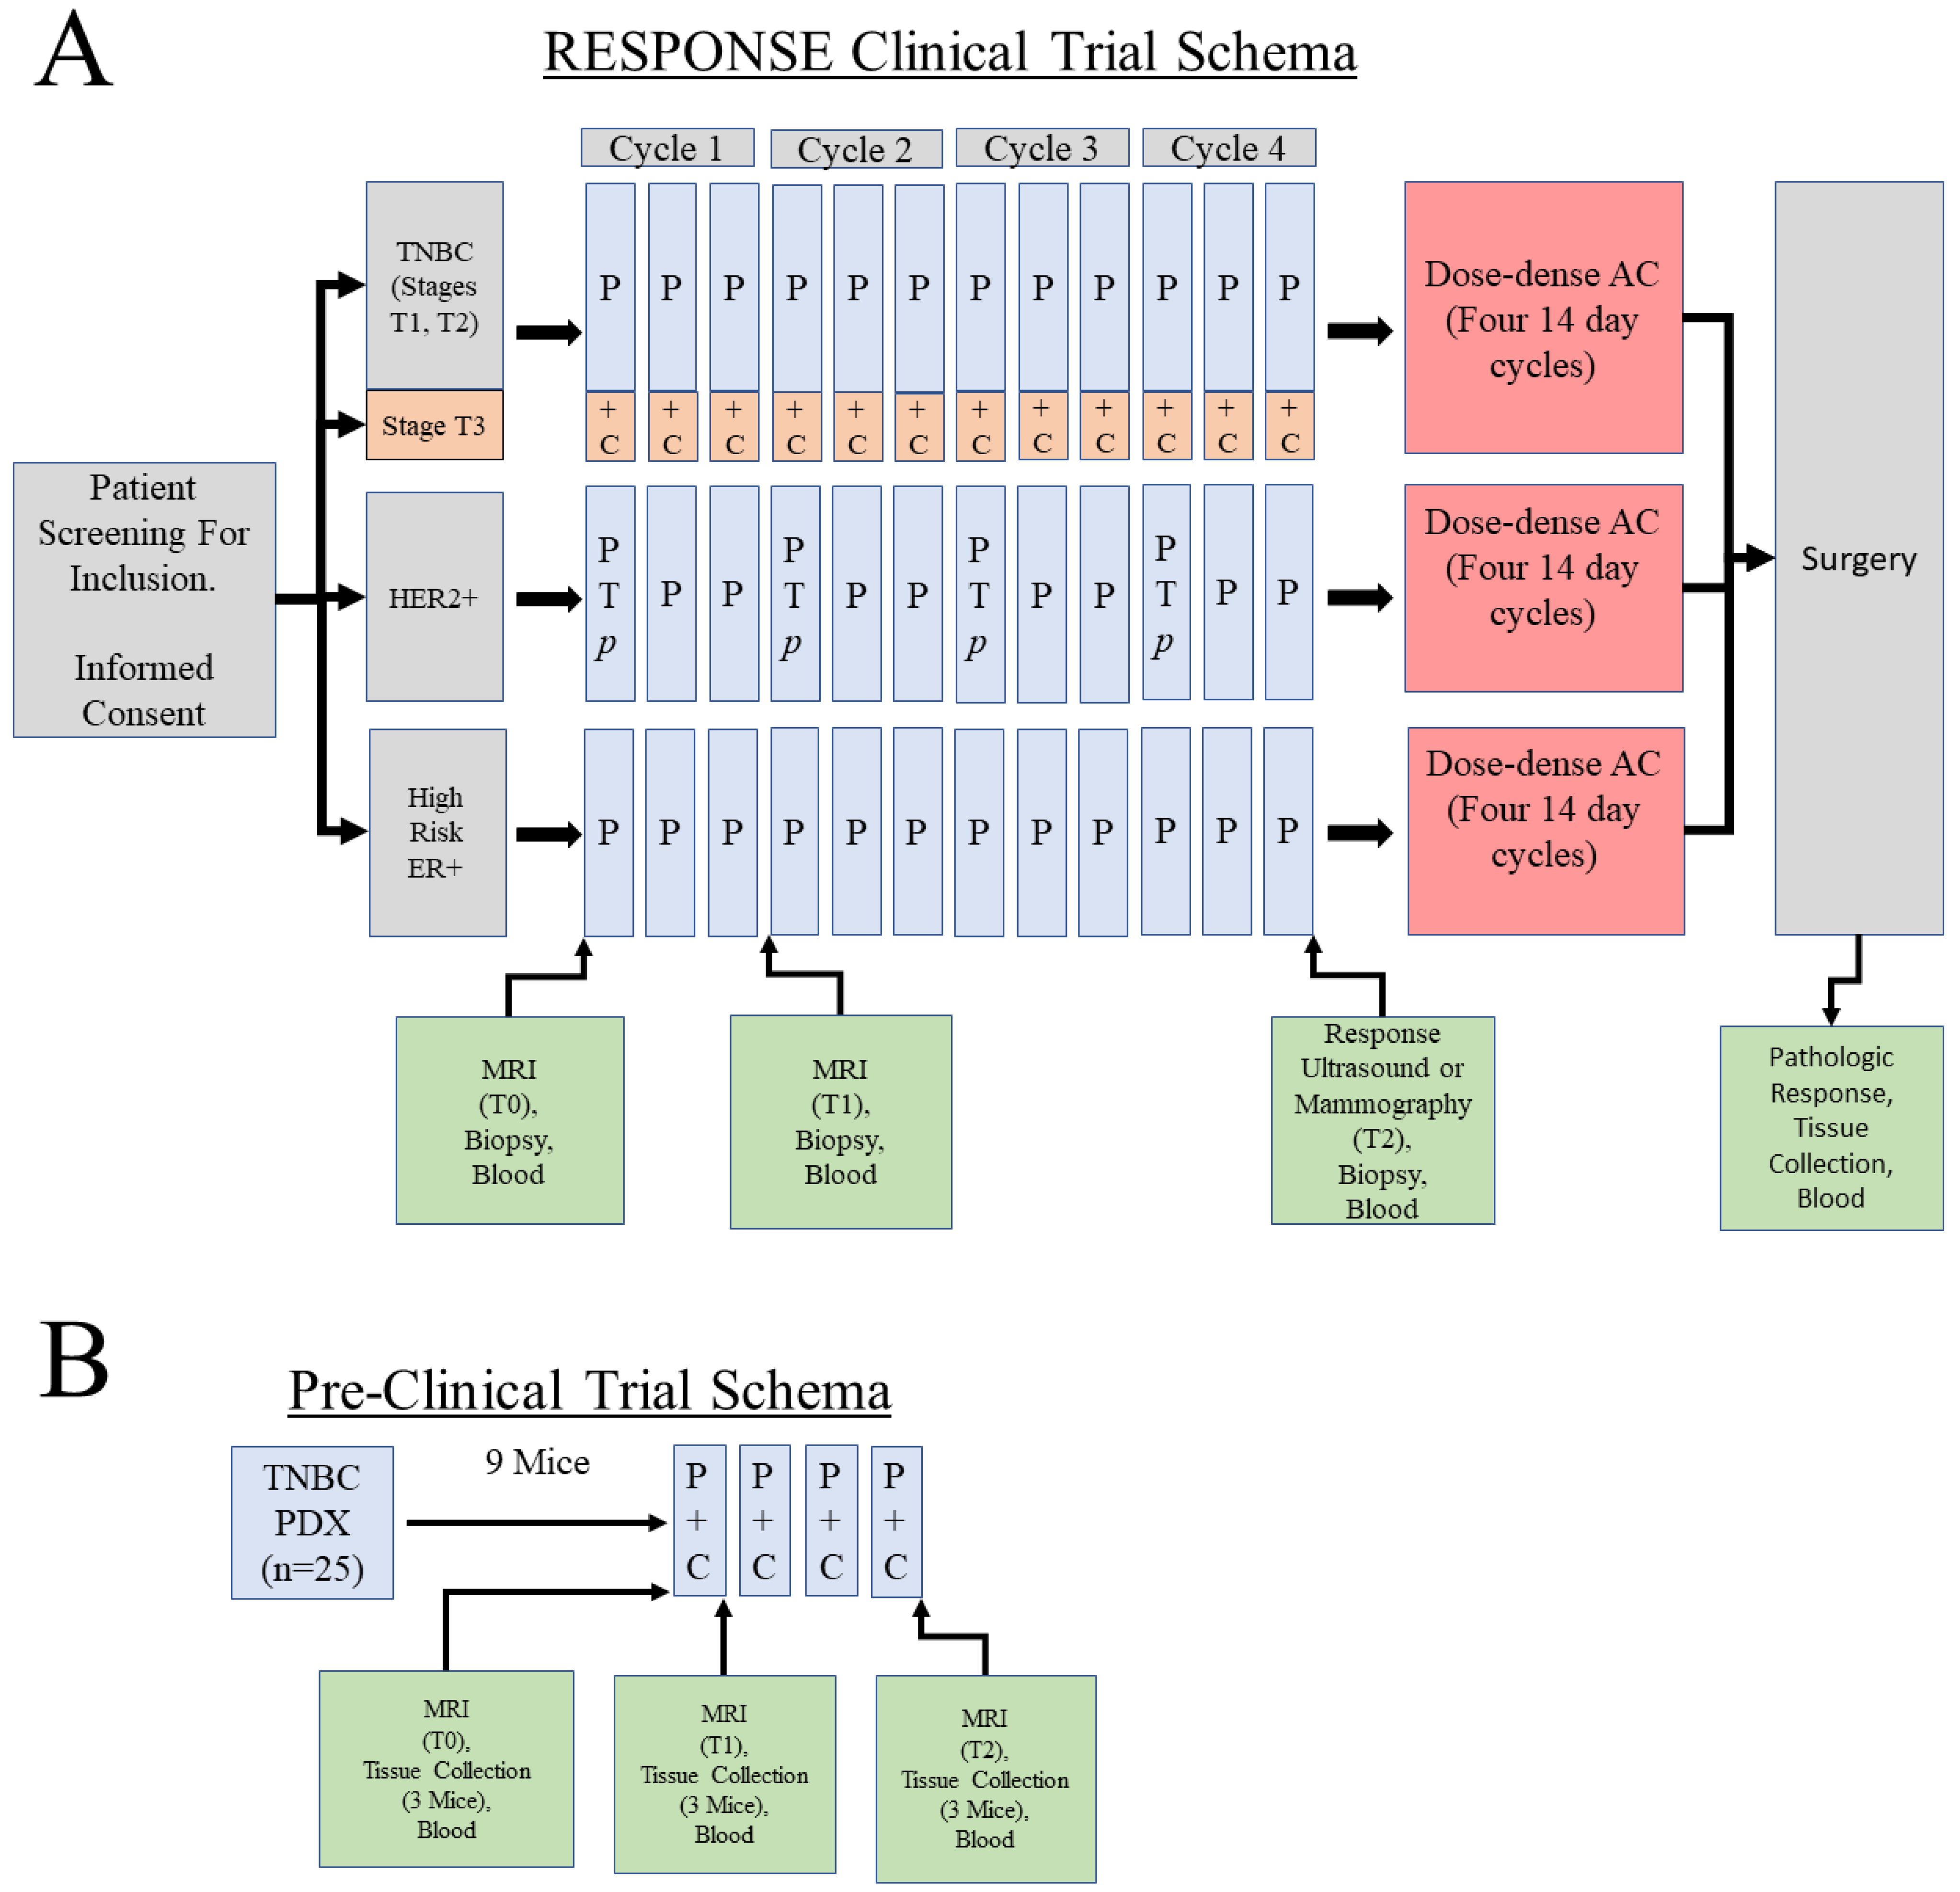
2.1. Clinical Cohort Selection for Generation of Data for MIRRACL Prototyping
2.2. PDX Selection and Chemotherapy Treatment
2.3. PDX MRI Acquisition and Analysis
2.3.1. Diffusion Weighted MRI (DW-MRI)
2.3.2. Dynamic Contrast-Enhanced MRI (DCE-MRI)
2.3.3. Image Analysis and Feature Determination
2.4. Human Breast Cancer Image Selection and Analysis
2.5. Image and Feature Curation and Display in the ePAD System
2.6. Simulation of Pre- and On-Treatment Human and PDX RNAseq Datasets by Random Permutation of Baseline mRNA Expression
2.7. Omic Data Management and Storage via Inclusion into LinkedOmics
3. Results
3.1. Overall Design of MIRRACL: A Web-Based Tool Enabling the Analysis and Display of Co-Clinical Trial Data
3.2. MIRACCL Architecture and Distributed Data Model
3.2.1. Application Architecture
- Input Controls—JSF (Java Servlet Faces—Primefaces)
- Navigation Components—Bootstrap
- Informational Components—HTML, CSS
- Interconnectivity with other applications—ReactJS, JavaScript, jQuery
- Graphs and Datatables—Highcharts, JSF datatable
3.2.2. Data Interaction with the BCM PDX Portal
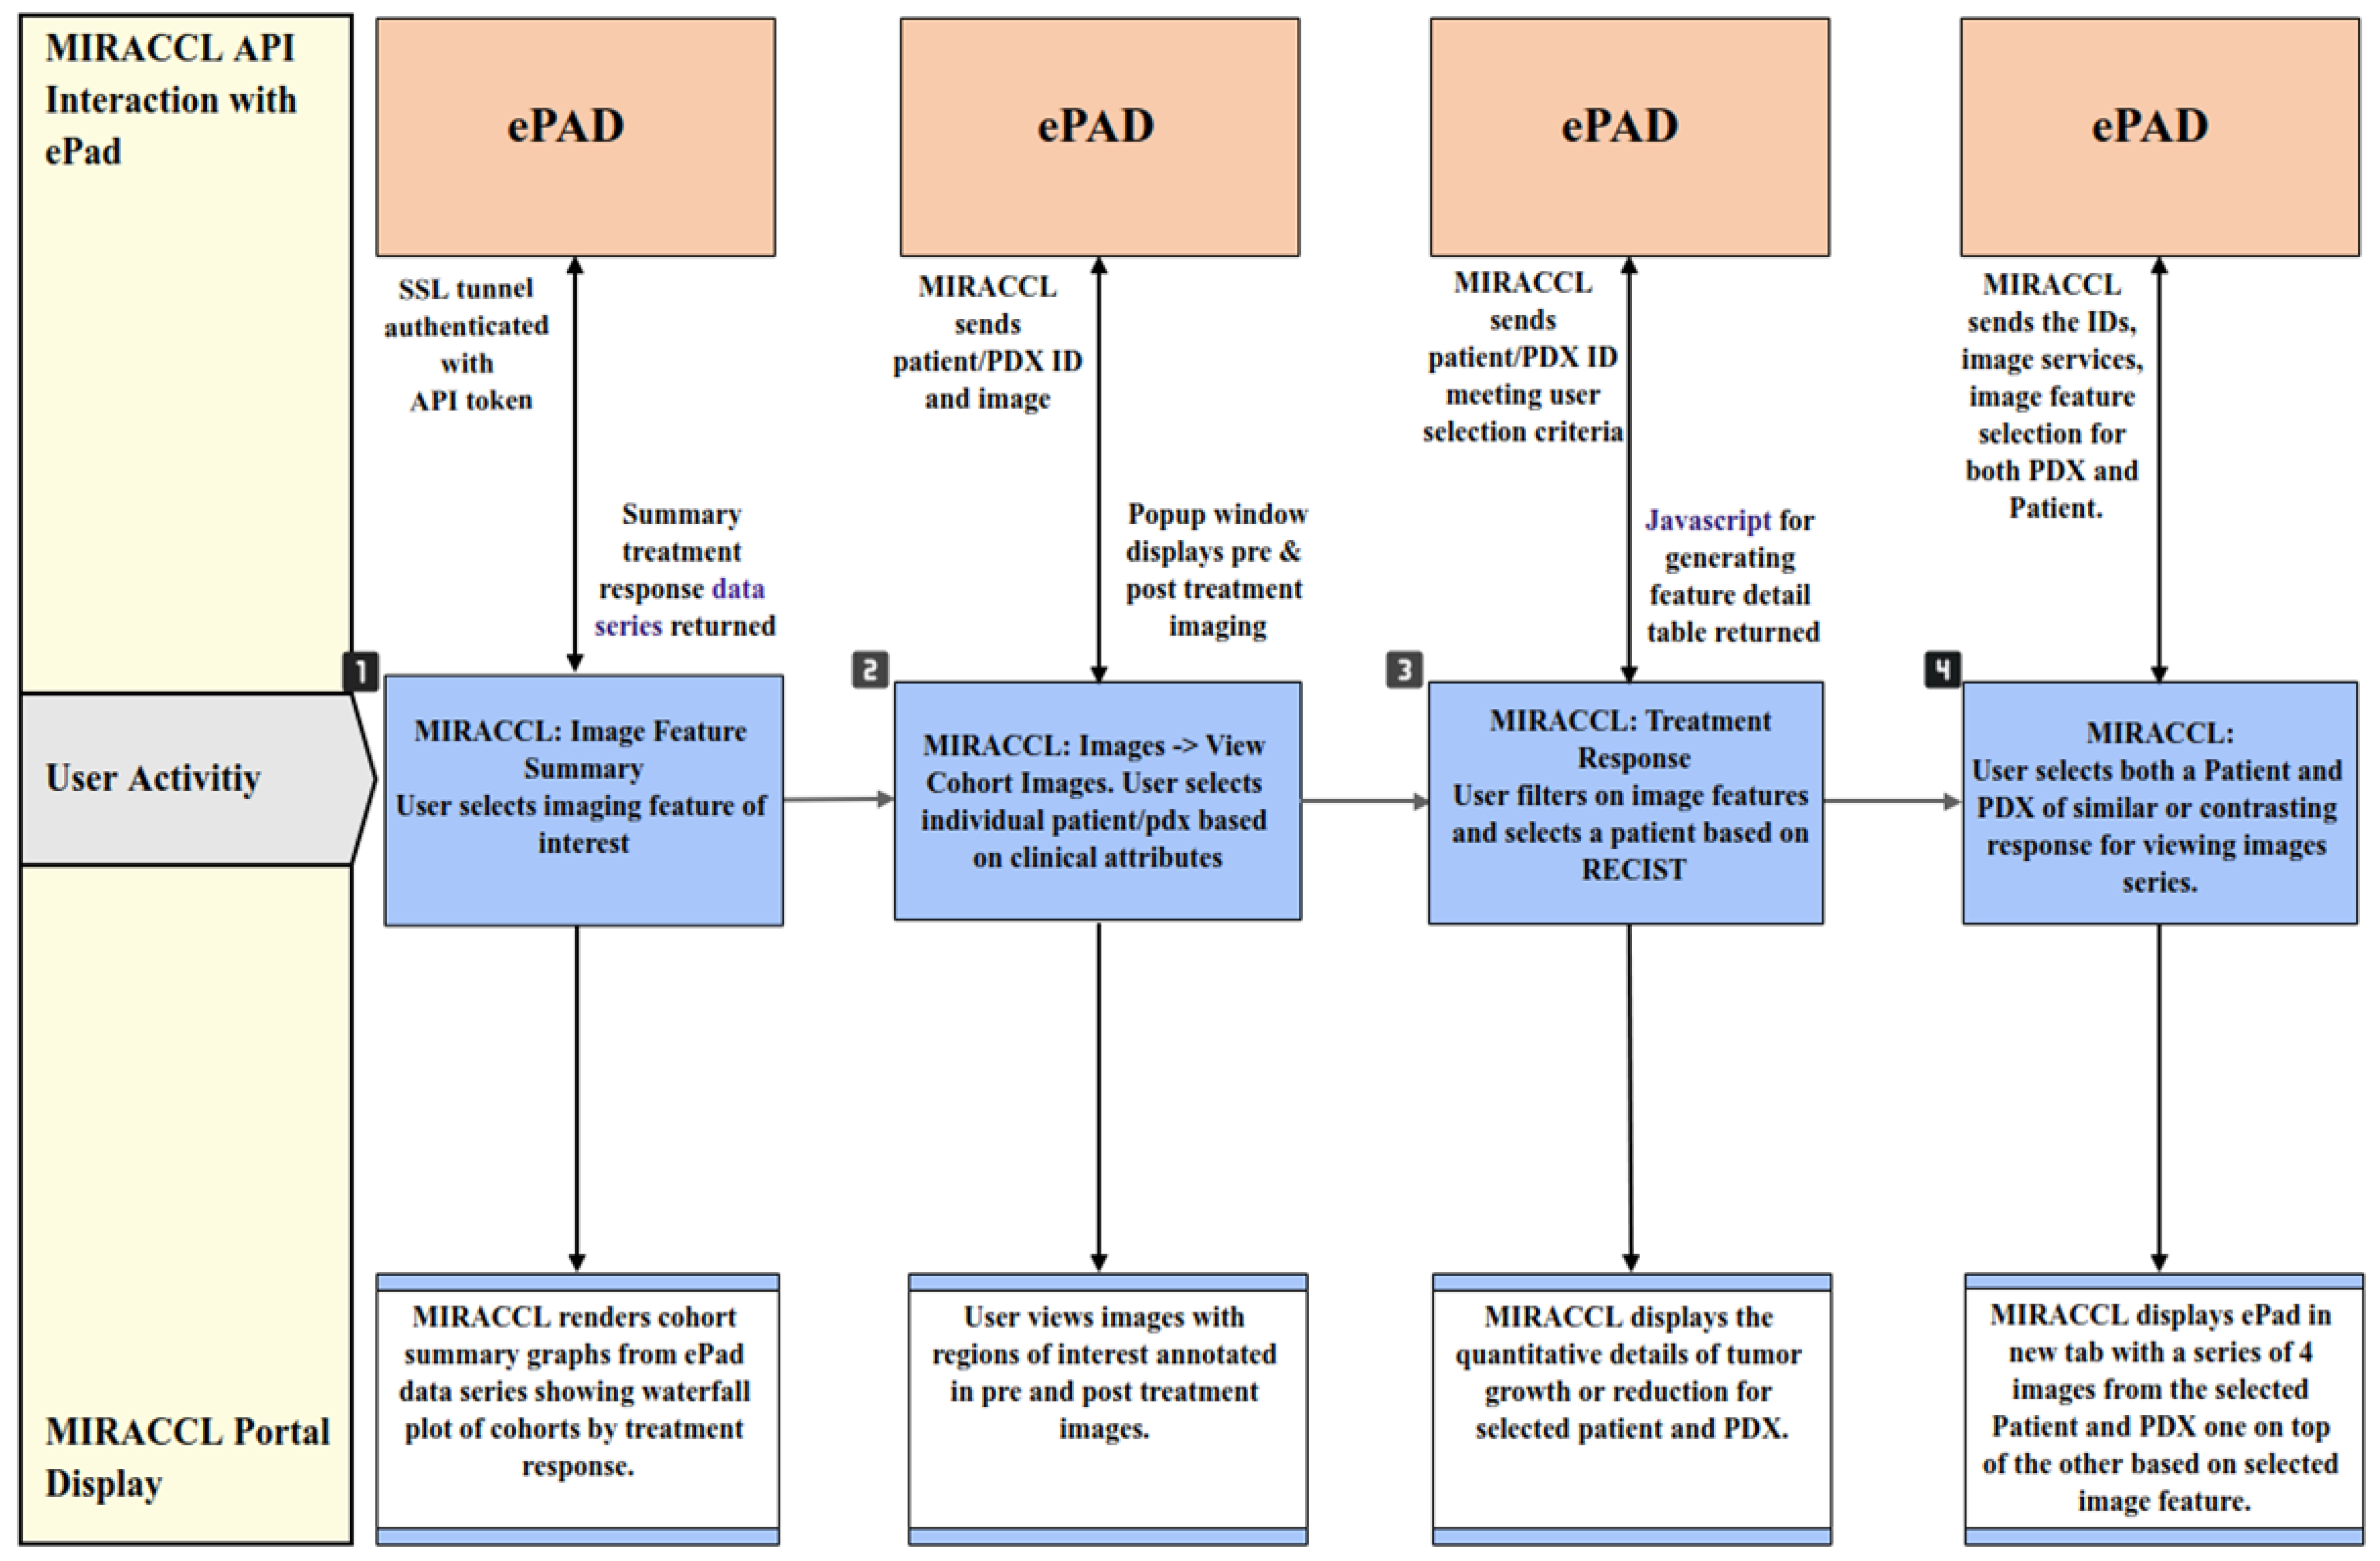
3.2.3. Data Interaction with ePAD
3.2.4. Interaction with LinkedOmics
3.3. Data Display and Analyses in MIRACCL
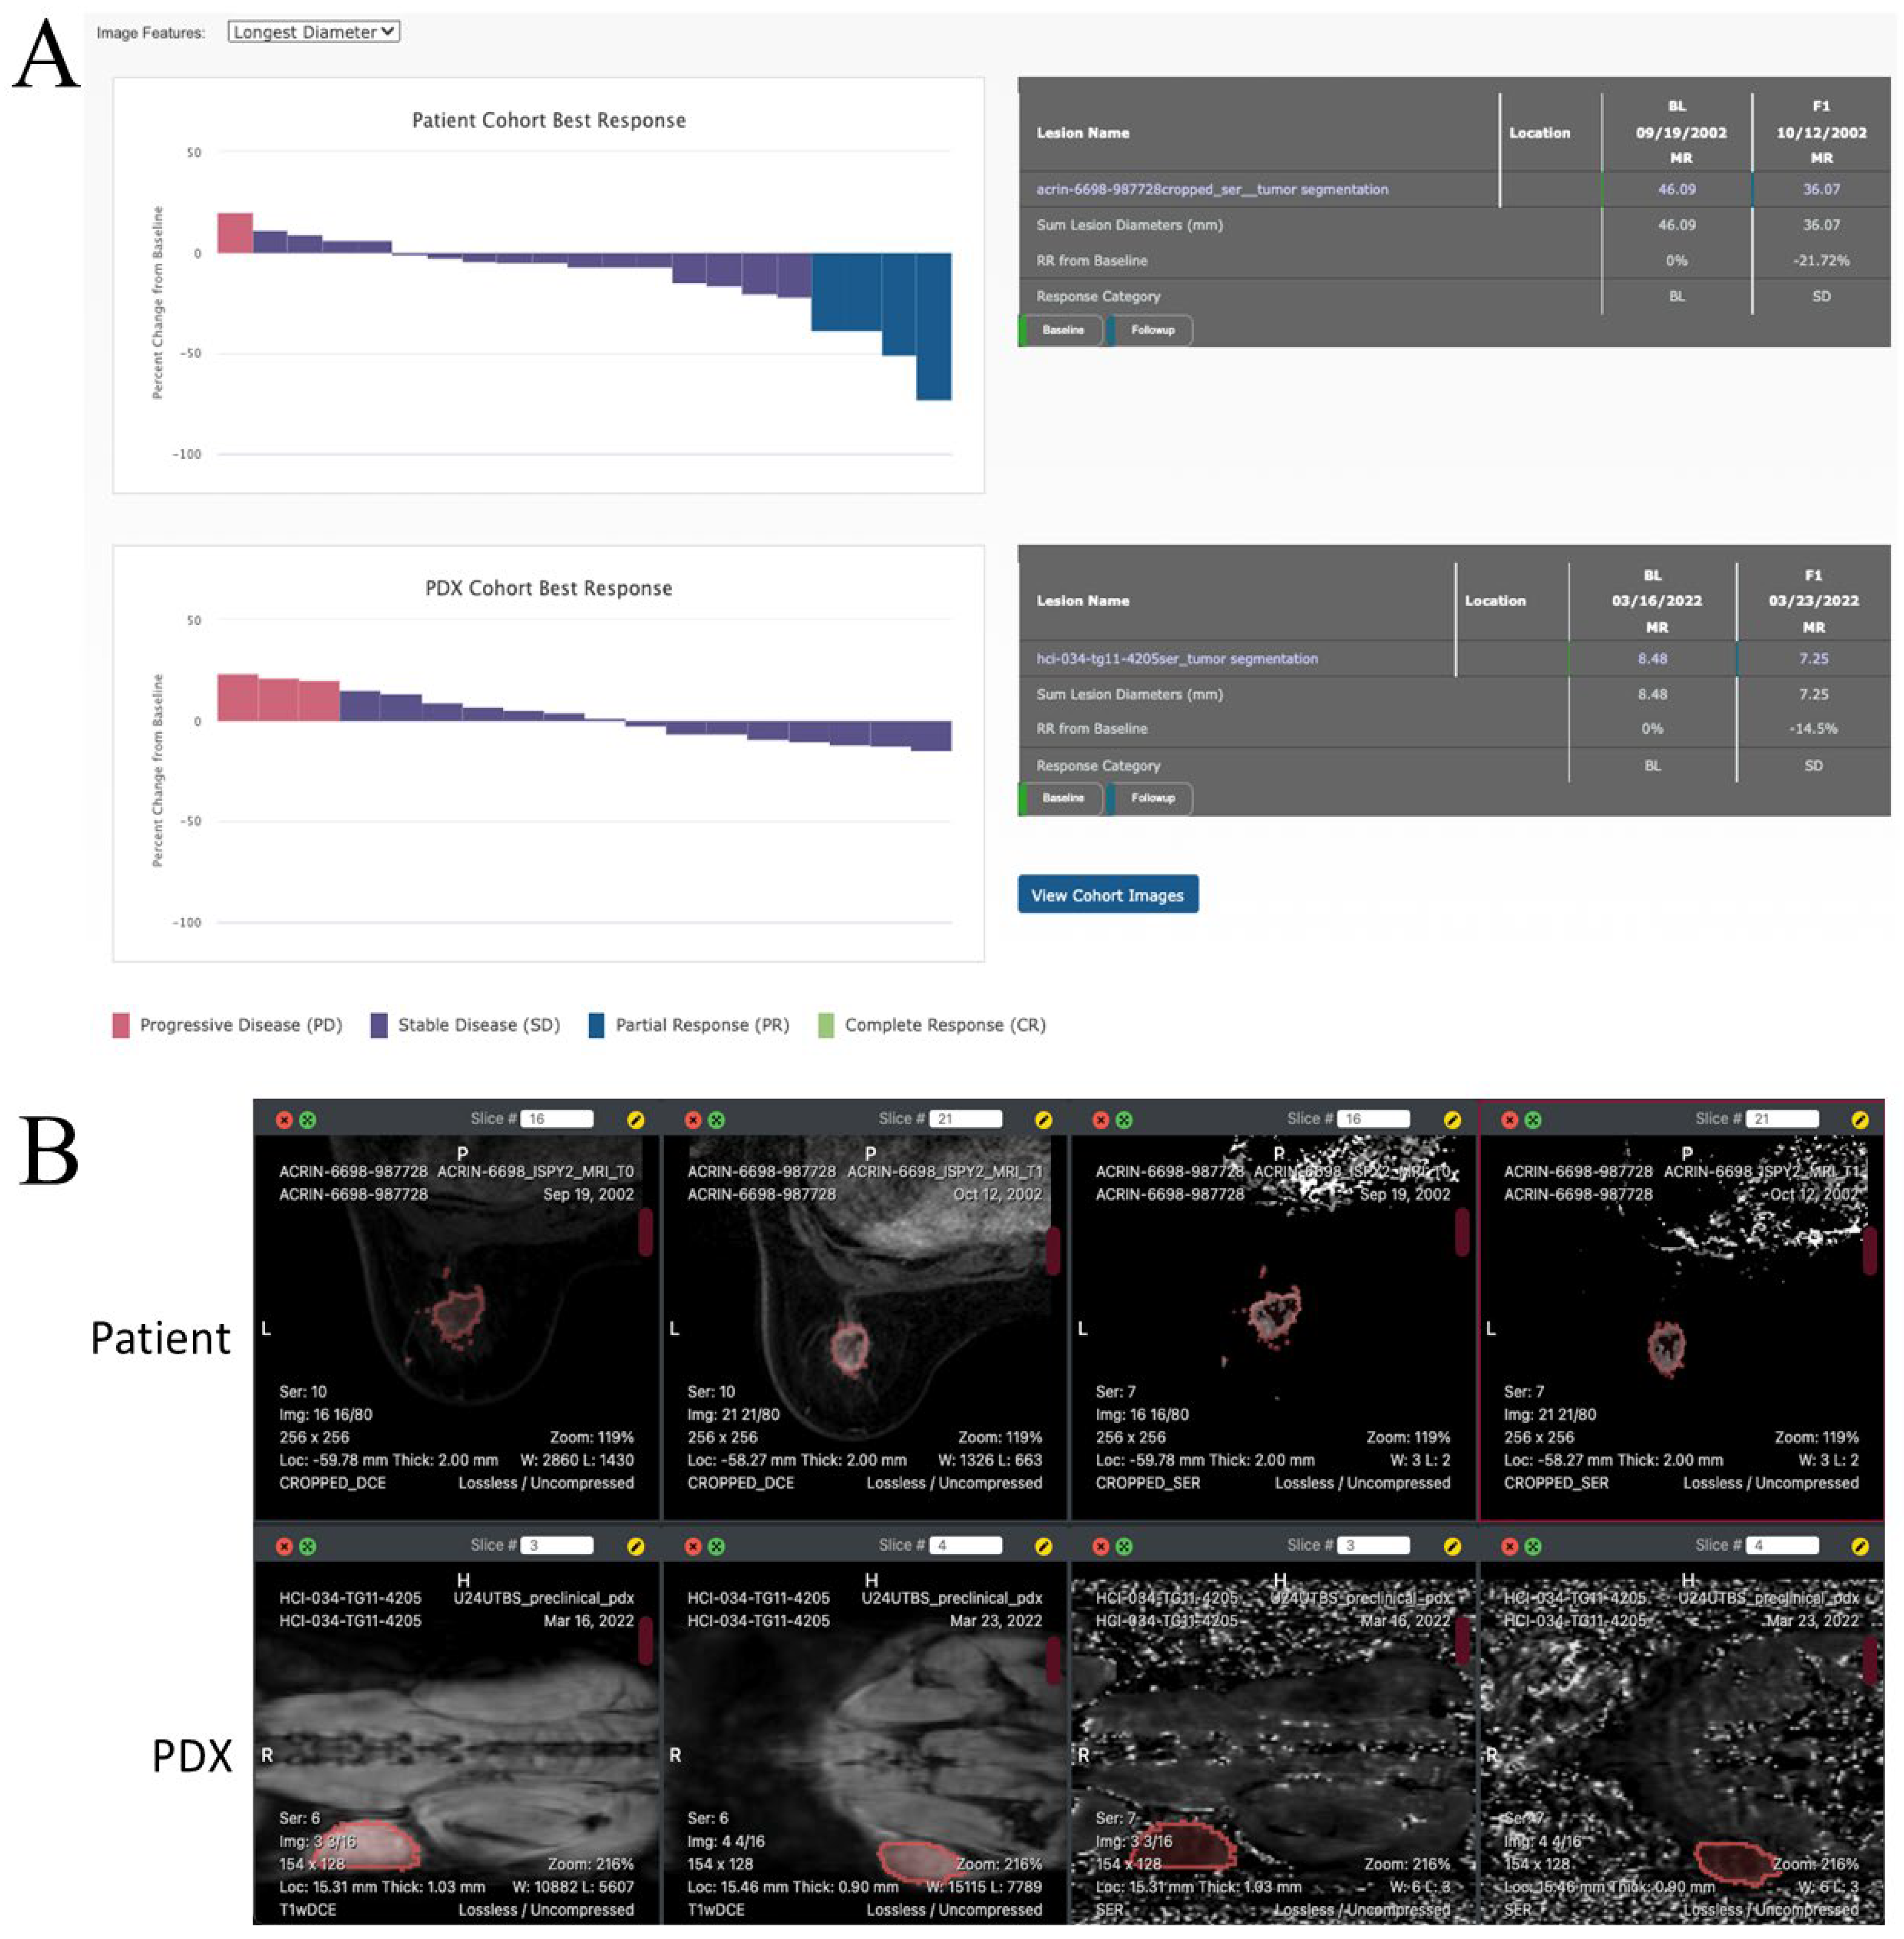
3.3.1. Evaluating Treatment Response
3.3.2. Evaluating Treatment Response in Clinical and Pre-Clinical Cohorts
3.3.3. Image Viewing
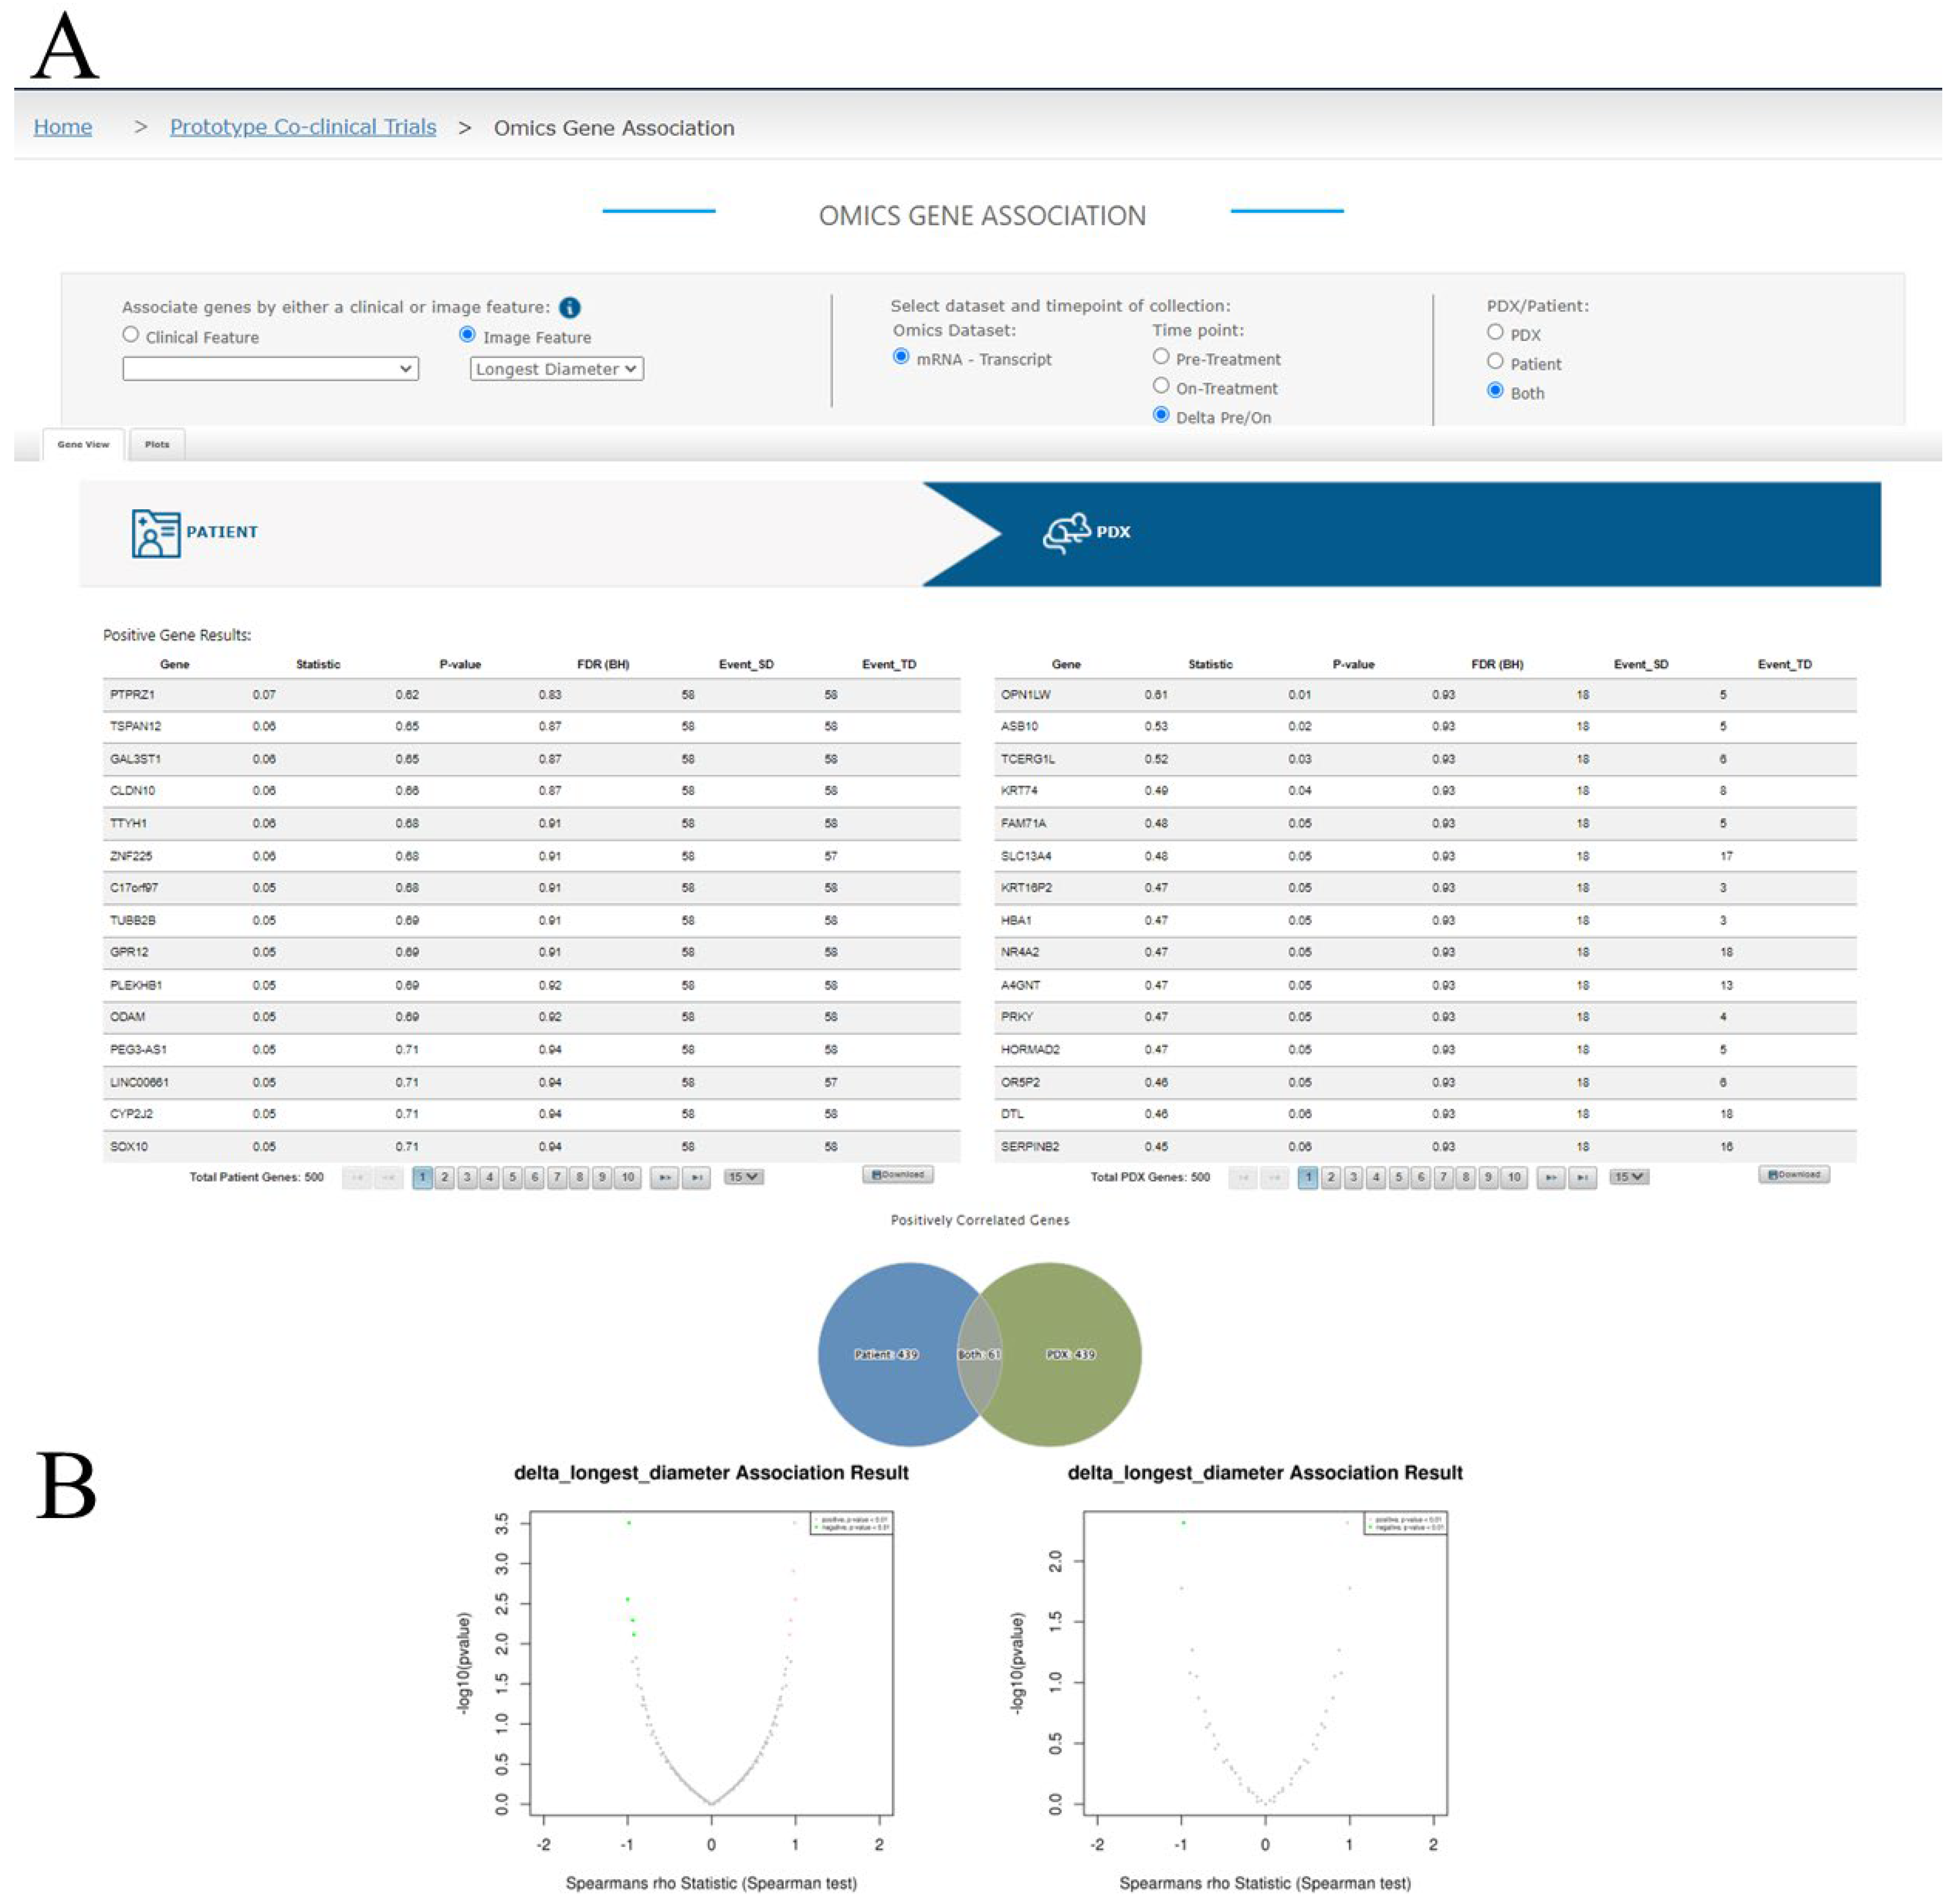
3.3.4. Omics Association Results Viewing
4. Discussion and Future Plans for MIRACCL
4.1. A Focus on Breast Cancer for Prototyping MIRACCL
4.2. Opportunities and Challenges in Multi-Omics Analysis and Future Goals for MIRACCL
4.3. Opportunities and Challenges with Imaging and Future Plans for MIRACCL
5. Conclusions
Supplementary Materials
Author Contributions
Funding
Institutional Review Board Statement
Informed Consent Statement
Data Availability Statement
Conflicts of Interest
References
- Petrosyan, V.; Dobrolecki, L.E.; Thistlethwaite, L.; Lewis, A.N.; Sallas, C.; Srinivasan, R.R.; Lei, J.T.; Kovacevic, V.; Obradovic, P.; Ellis, M.J.; et al. Identifying biomarkers of differential chemotherapy response in TNBC patient-Derived xenografts with a CTD/WGCNA approach. iScience 2023, 26, 105799. [Google Scholar] [CrossRef] [PubMed]
- Shoghi, K.I.; Badea, C.T.; Blocker, S.J.; Chenevert, T.L.; Laforest, R.; Lewis, M.T.; Luker, G.D.; Manning, H.C.; Marcus, D.S.; Mowery, Y.M.; et al. Co-Clinical imaging resource program (CIRP): Bridging the translational divide to advance precision medicine. Tomography 2020, 6, 273–287. [Google Scholar] [CrossRef] [PubMed]
- Ding, L.; Ellis, M.J.; Li, S.; Larson, D.E.; Chen, K.; Wallis, J.W.; Harris, C.C.; McLellan, M.D.; Fulton, R.S.; Fulton, L.L.; et al. Genome remodelling in a basal-Like breast cancer metastasis and xenograft. Nature 2010, 464, 999–1005. [Google Scholar] [CrossRef] [Green Version]
- Li, S.; Shen, D.; Shao, J.; Crowder, R.; Liu, W.; Prat, A.; He, X.; Liu, S.; Hoog, J.; Lu, C.; et al. Endocrine-Therapy-Resistant ESR1 variants revealed by genomic characterization of breast-Cancer-Derived xenografts. Cell. Rep. 2013, 4, 1116–1130. [Google Scholar] [CrossRef] [Green Version]
- Koc, S.; Lloyd, M.W.; Grover, J.W.; Xiao, N.; Seepo, S.; Subramanian, S.L.; Ray, M.; Frech, C.; DiGiovanna, J.; Webster, P.; et al. PDXNet portal: Patient-Derived xenograft model, data, workflow and tool discovery. NAR Cancer 2022, 4, zcac014. [Google Scholar] [CrossRef]
- Sun, H.; Cao, S.; Mashl, R.J.; Mo, C.K.; Zaccaria, S.; Wendl, M.C.; Davies, S.R.; Bailey, M.H.; Primeau, T.M.; Hoog, J.; et al. Comprehensive characterization of 536 patient-Derived xenograft models prioritizes candidatesfor targeted treatment. Nat. Commun. 2021, 12, 5086. [Google Scholar] [CrossRef]
- Dudova, Z.; Conte, N.; Mason, J.; Stuchlik, D.; Pesa, R.; Halmagyi, C.; Perova, Z.; Mosaku, A.; Thorne, R.; Follette, A.; et al. The EurOPDX data portal: An open platform for patient-Derived cancer xenograft data sharing and visualization. BMC Genom. 2022, 23, 156. [Google Scholar] [CrossRef]
- Byrne, A.T.; Alferez, D.G.; Amant, F.; Annibali, D.; Arribas, J.; Biankin, A.V.; Bruna, A.; Budinska, E.; Caldas, C.; Chang, D.K.; et al. Interrogating open issues in cancer precision medicine with patient-Derived xenografts. Nat. Rev. Cancer 2017, 17, 254–268. [Google Scholar] [CrossRef]
- Woo, X.Y.; Giordano, J.; Srivastava, A.; Zhao, Z.M.; Lloyd, M.W.; de Bruijn, R.; Suh, Y.S.; Patidar, R.; Chen, L.; Scherer, S.; et al. Conservation of copy number profiles during engraftment and passaging of patient-Derived cancer xenografts. Nat. Genet. 2021, 53, 86–99. [Google Scholar] [CrossRef]
- Menghi, F.; Banda, K.; Kumar, P.; Straub, R.; Dobrolecki, L.; Rodriguez, I.V.; Yost, S.E.; Chandok, H.; Radke, M.R.; Somlo, G.; et al. Genomic and epigenomic BRCA alterations predict adaptive resistance and response to platinum-Based therapy in patients with triple-Negative breast and ovarian carcinomas. Sci. Transl. Med. 2022, 14, eabn1926. [Google Scholar] [CrossRef]
- Zhou, J.Y.; Chen, L.; Zhang, B.; Tian, Y.; Liu, T.; Thomas, S.N.; Chen, L.; Schnaubelt, M.; Boja, E.; Hiltke, T.; et al. Quality assessments of long-Term quantitative proteomic analysis of breast cancer xenograft tissues. J. Proteome Res. 2017, 16, 4523–4530. [Google Scholar] [CrossRef] [PubMed] [Green Version]
- Guillen, K.P.; Fujita, M.; Butterfield, A.J.; Scherer, S.D.; Bailey, M.H.; Chu, Z.; DeRose, Y.S.; Zhao, L.; Cortes-Sanchez, E.; Yang, C.H.; et al. A human breast cancer-Derived xenograft and organoid platform for drug discovery and precision oncology. Nat. Cancer 2022, 3, 232–250. [Google Scholar] [CrossRef] [PubMed]
- Zhang, X.; Claerhout, S.; Prat, A.; Dobrolecki, L.E.; Petrovic, I.; Lai, Q.; Landis, M.D.; Wiechmann, L.; Schiff, R.; Giuliano, M.; et al. A renewable tissue resource of phenotypically stable, biologically and ethnically diverse, patient-Derived human breast cancer xenograft models. Cancer Res. 2013, 73, 4885–4897. [Google Scholar] [CrossRef] [Green Version]
- Rubin, D.L.; Ugur Akdogan, M.; Altindag, C.; Alkim, E. ePAD: An image annotation and analysis platform for quantitative imaging. Tomography 2019, 5, 170–183. [Google Scholar] [CrossRef]
- Vasaikar, S.V.; Straub, P.; Wang, J.; Zhang, B. LinkedOmics: Analyzing multi-Omics data within and across 32 cancer types. Nucleic Acids Res. 2018, 46, D956–D963. [Google Scholar] [CrossRef] [Green Version]
- Jiagge, E.M.; Ulintz, P.J.; Wong, S.; McDermott, S.P.; Fossi, S.I.; Suhan, T.K.; Hoenerhoff, M.J.; Bensenhaver, J.M.; Salem, B.; Dziubinski, M.; et al. Multiethnic PDX models predict a possible immune signature associated with TNBC of african ancestry. Breast Cancer Res. Treat. 2021, 186, 391–401. [Google Scholar] [CrossRef]
- Boughey, J.C.; Suman, V.J.; Yu, J.; Santo, K.; Sinnwell, J.P.; Carter, J.M.; Kalari, K.R.; Tang, X.; McLaughlin, S.A.; Moreno-Aspitia, A.; et al. Patient-Derived xenograft engraftment and breast cancer outcomes in a prospective neoadjuvant study (BEAUTY). Clin. Cancer Res. 2021, 27, 4696–4699. [Google Scholar] [CrossRef]
- Lv, X.; Dobrolecki, L.E.; Ding, Y.; Rosen, J.M.; Lewis, M.T.; Chen, X. Orthotopic transplantation of breast tumors as preclinical models for breast cancer. J. Vis. Exp. 2020, 159, e61173. [Google Scholar] [CrossRef]
- Deome, K.B.; Faulkin, L.J., Jr.; Bern, H.A.; Blair, P.B. Development of mammary tumors from hyperplastic alveolar nodules transplanted into gland-Free mammary fat pads of female C3H mice. Cancer Res. 1959, 19, 515–520. [Google Scholar]
- Partridge, S.C.; Zhang, Z.; Newitt, D.C.; Gibbs, J.E.; Chenevert, T.L.; Rosen, M.A.; Bolan, P.J.; Marques, H.S.; Romanoff, J.; Cimino, L.; et al. Diffusion-Weighted MRI findings predict pathologic response in neoadjuvant treatment of breast cancer: The ACRIN 6698 multicenter trial. Radiology 2018, 289, 618–627. [Google Scholar] [CrossRef] [Green Version]
- Channin, D.S.; Mongkolwat, P.; Kleper, V.; Sepukar, K.; Rubin, D.L. The caBIG annotation and image markup project. J. Digit. Imaging 2010, 23, 217–225. [Google Scholar] [CrossRef] [PubMed] [Green Version]
- Conway, T.; Wazny, J.; Bromage, A.; Tymms, M.; Sooraj, D.; Williams, E.D.; Beresford-Smith, B. Xenome—a tool for classifying reads from xenograft samples. Bioinformatics 2012, 28, i172–i178. [Google Scholar] [CrossRef] [PubMed] [Green Version]
- Ahdesmaki, M.J.; Gray, S.R.; Johnson, J.H.; Lai, Z. Disambiguate: An open-Source application for disambiguating two species in next generation sequencing data from grafted samples. F1000Res 2016, 5, 2741. [Google Scholar] [CrossRef] [PubMed]
- Saltzman, A.B.; Leng, M.; Bhatt, B.; Singh, P.; Chan, D.W.; Dobrolecki, L.; Chandrasekaran, H.; Choi, J.M.; Jain, A.; Jung, S.Y.; et al. gpGrouper: A peptide grouping algorithm for gene-Centric inference and quantitation of bottom-Up proteomics data. Mol. Cell. Proteomics 2018, 17, 2270–2283. [Google Scholar] [CrossRef] [Green Version]
- Yankeelov, T.E.; Luci, J.J.; Lepage, M.; Li, R.; Debusk, L.; Lin, P.C.; Price, R.R.; Gore, J.C. Quantitative pharmacokinetic analysis of DCE-MRI data without an arterial input function: A reference region model. Magn. Reson. Imaging 2005, 23, 519–529. [Google Scholar] [CrossRef]
- Hormuth, D.A., 2nd; Sorace, A.G.; Virostko, J.; Abramson, R.G.; Bhujwalla, Z.M.; Enriquez-Navas, P.; Gillies, R.; Hazle, J.D.; Mason, R.P.; Quarles, C.C.; et al. Translating preclinical MRI methods to clinical oncology. J. Magn. Reson. Imaging 2019, 50, 1377–1392. [Google Scholar] [CrossRef]
- Yankeelov, T.E.; Mankoff, D.A.; Schwartz, L.H.; Lieberman, F.S.; Buatti, J.M.; Mountz, J.M.; Erickson, B.J.; Fennessy, F.M.; Huang, W.; Kalpathy-Cramer, J.; et al. Quantitative imaging in cancer clinical trials. Clin. Cancer Res. 2016, 22, 284–290. [Google Scholar] [CrossRef] [Green Version]
- Eisenhauer, E.A.; Therasse, P.; Bogaerts, J.; Schwartz, L.H.; Sargent, D.; Ford, R.; Dancey, J.; Arbuck, S.; Gwyther, S.; Mooney, M.; et al. New response evaluation criteria in solid tumours: Revised RECIST guideline (version 1.1). Eur. J. Cancer 2009, 45, 228–247. [Google Scholar] [CrossRef]
- Yankeelov, T.E.; Gore, J.C. Dynamic contrast enhanced magnetic resonance imaging in oncology: Theory, data acquisition, analysis, and examples. Curr. Med. Imaging Rev. 2009, 3, 91–107. [Google Scholar] [CrossRef] [Green Version]
- Padhani, A.R.; Liu, G.; Koh, D.M.; Chenevert, T.L.; Thoeny, H.C.; Takahara, T.; Dzik-Jurasz, A.; Ross, B.D.; Van Cauteren, M.; Collins, D.; et al. Diffusion-Weighted magnetic resonance imaging as a cancer biomarker: Consensus and recommendations. Neoplasia 2009, 11, 102–125. [Google Scholar] [CrossRef] [Green Version]


Disclaimer/Publisher’s Note: The statements, opinions and data contained in all publications are solely those of the individual author(s) and contributor(s) and not of MDPI and/or the editor(s). MDPI and/or the editor(s) disclaim responsibility for any injury to people or property resulting from any ideas, methods, instructions or products referred to in the content. |
© 2023 by the authors. Licensee MDPI, Basel, Switzerland. This article is an open access article distributed under the terms and conditions of the Creative Commons Attribution (CC BY) license (https://creativecommons.org/licenses/by/4.0/).
Share and Cite
Alkim, E.; Dowst, H.; DiCarlo, J.; Dobrolecki, L.E.; Hernández-Herrera, A.; Hormuth, D.A., II; Liao, Y.; McOwiti, A.; Pautler, R.; Rimawi, M.; et al. Toward Practical Integration of Omic and Imaging Data in Co-Clinical Trials. Tomography 2023, 9, 810-828. https://doi.org/10.3390/tomography9020066
Alkim E, Dowst H, DiCarlo J, Dobrolecki LE, Hernández-Herrera A, Hormuth DA II, Liao Y, McOwiti A, Pautler R, Rimawi M, et al. Toward Practical Integration of Omic and Imaging Data in Co-Clinical Trials. Tomography. 2023; 9(2):810-828. https://doi.org/10.3390/tomography9020066
Chicago/Turabian StyleAlkim, Emel, Heidi Dowst, Julie DiCarlo, Lacey E. Dobrolecki, Anadulce Hernández-Herrera, David A. Hormuth, II, Yuxing Liao, Apollo McOwiti, Robia Pautler, Mothaffar Rimawi, and et al. 2023. "Toward Practical Integration of Omic and Imaging Data in Co-Clinical Trials" Tomography 9, no. 2: 810-828. https://doi.org/10.3390/tomography9020066