
Evaluation of Apparent Diffusion Coefficient Repeatability and Reproducibility for Preclinical MRIs Using Standardized Procedures and a Diffusion-Weighted Imaging Phantom
 , , , , , , , and
Abstract
:1. Introduction
2. Materials and Methods
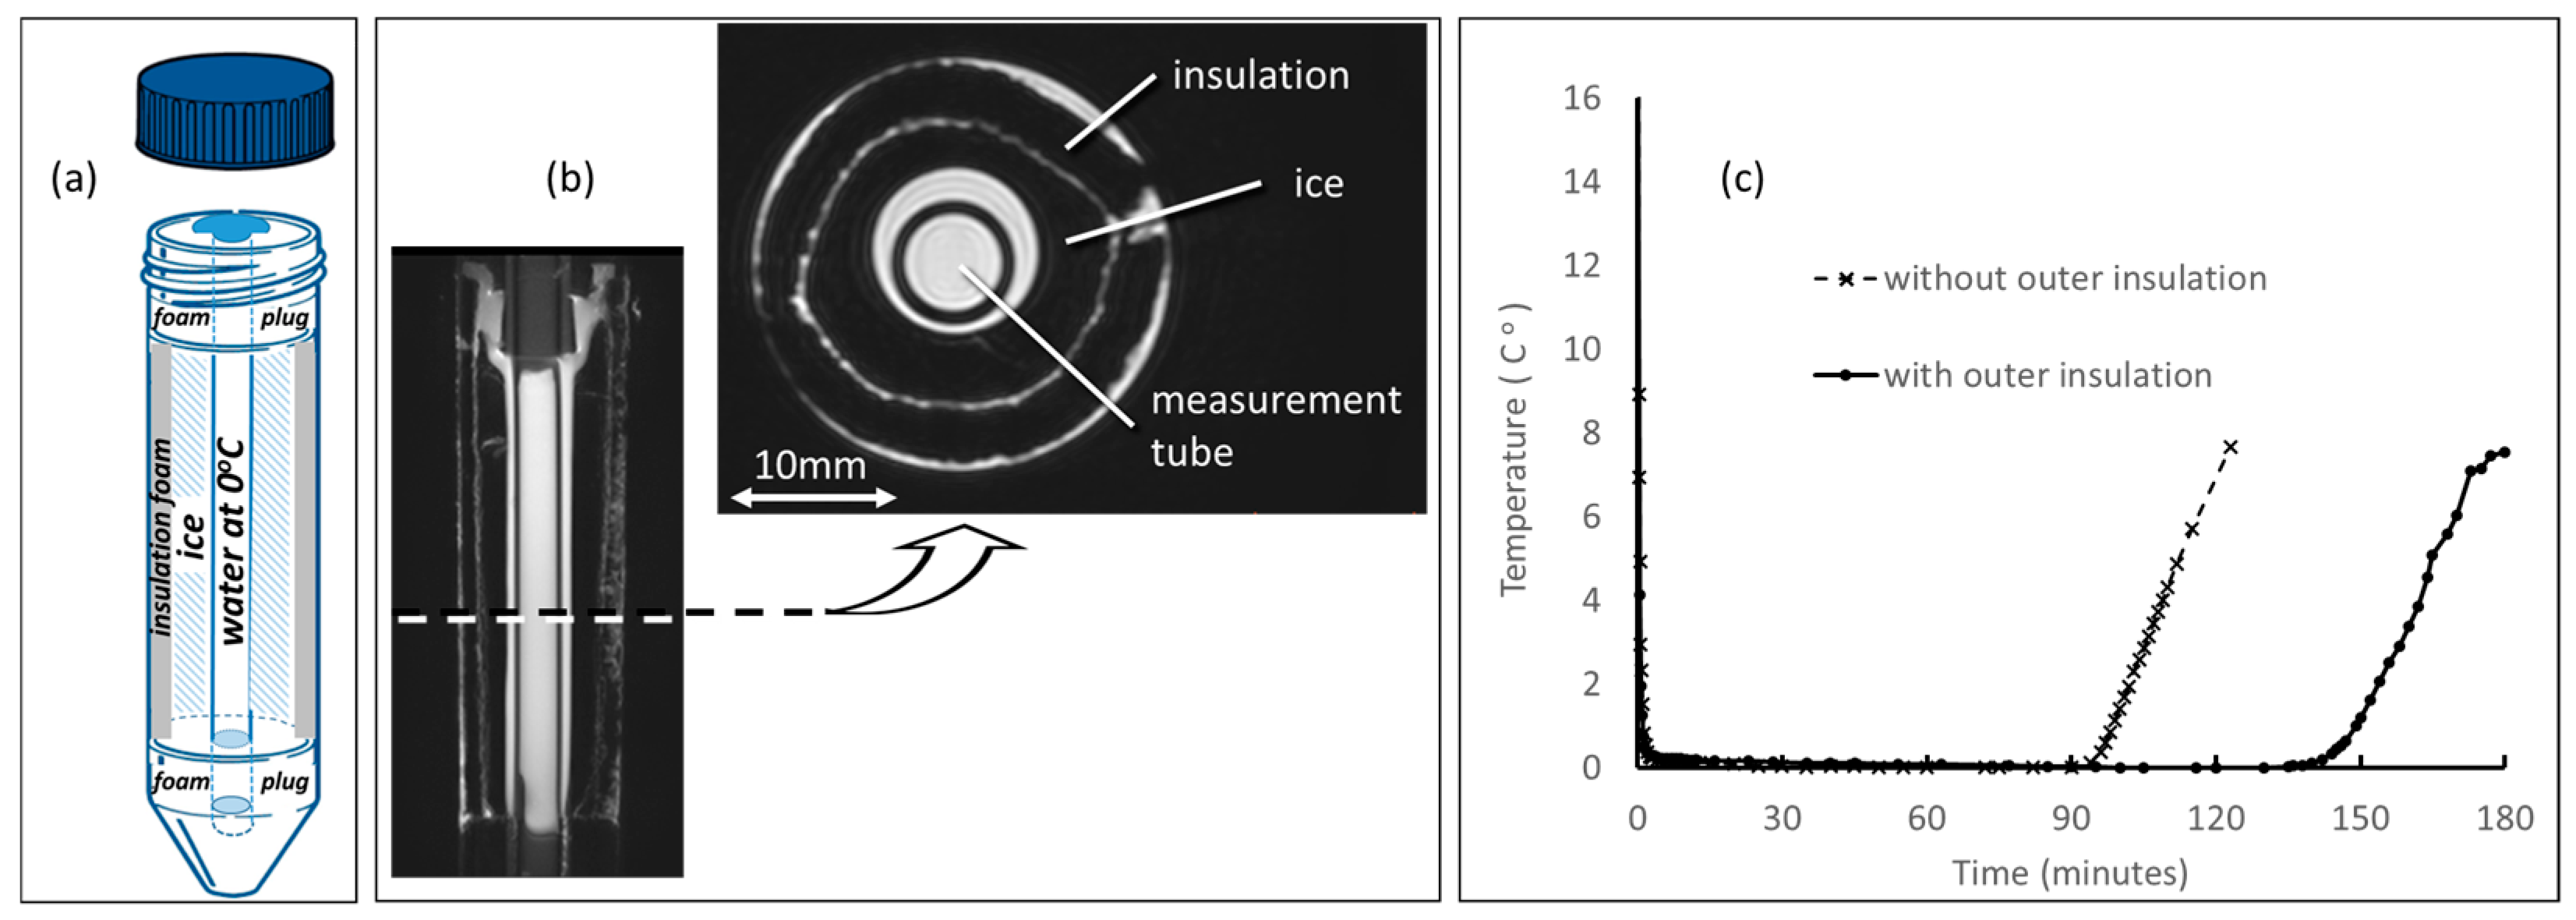
2.1. DWI Phantom
2.2. DWI Acquisition Protocol
2.3. Participating Site Procedures
2.4. Core Lab Processing
2.5. Statistics
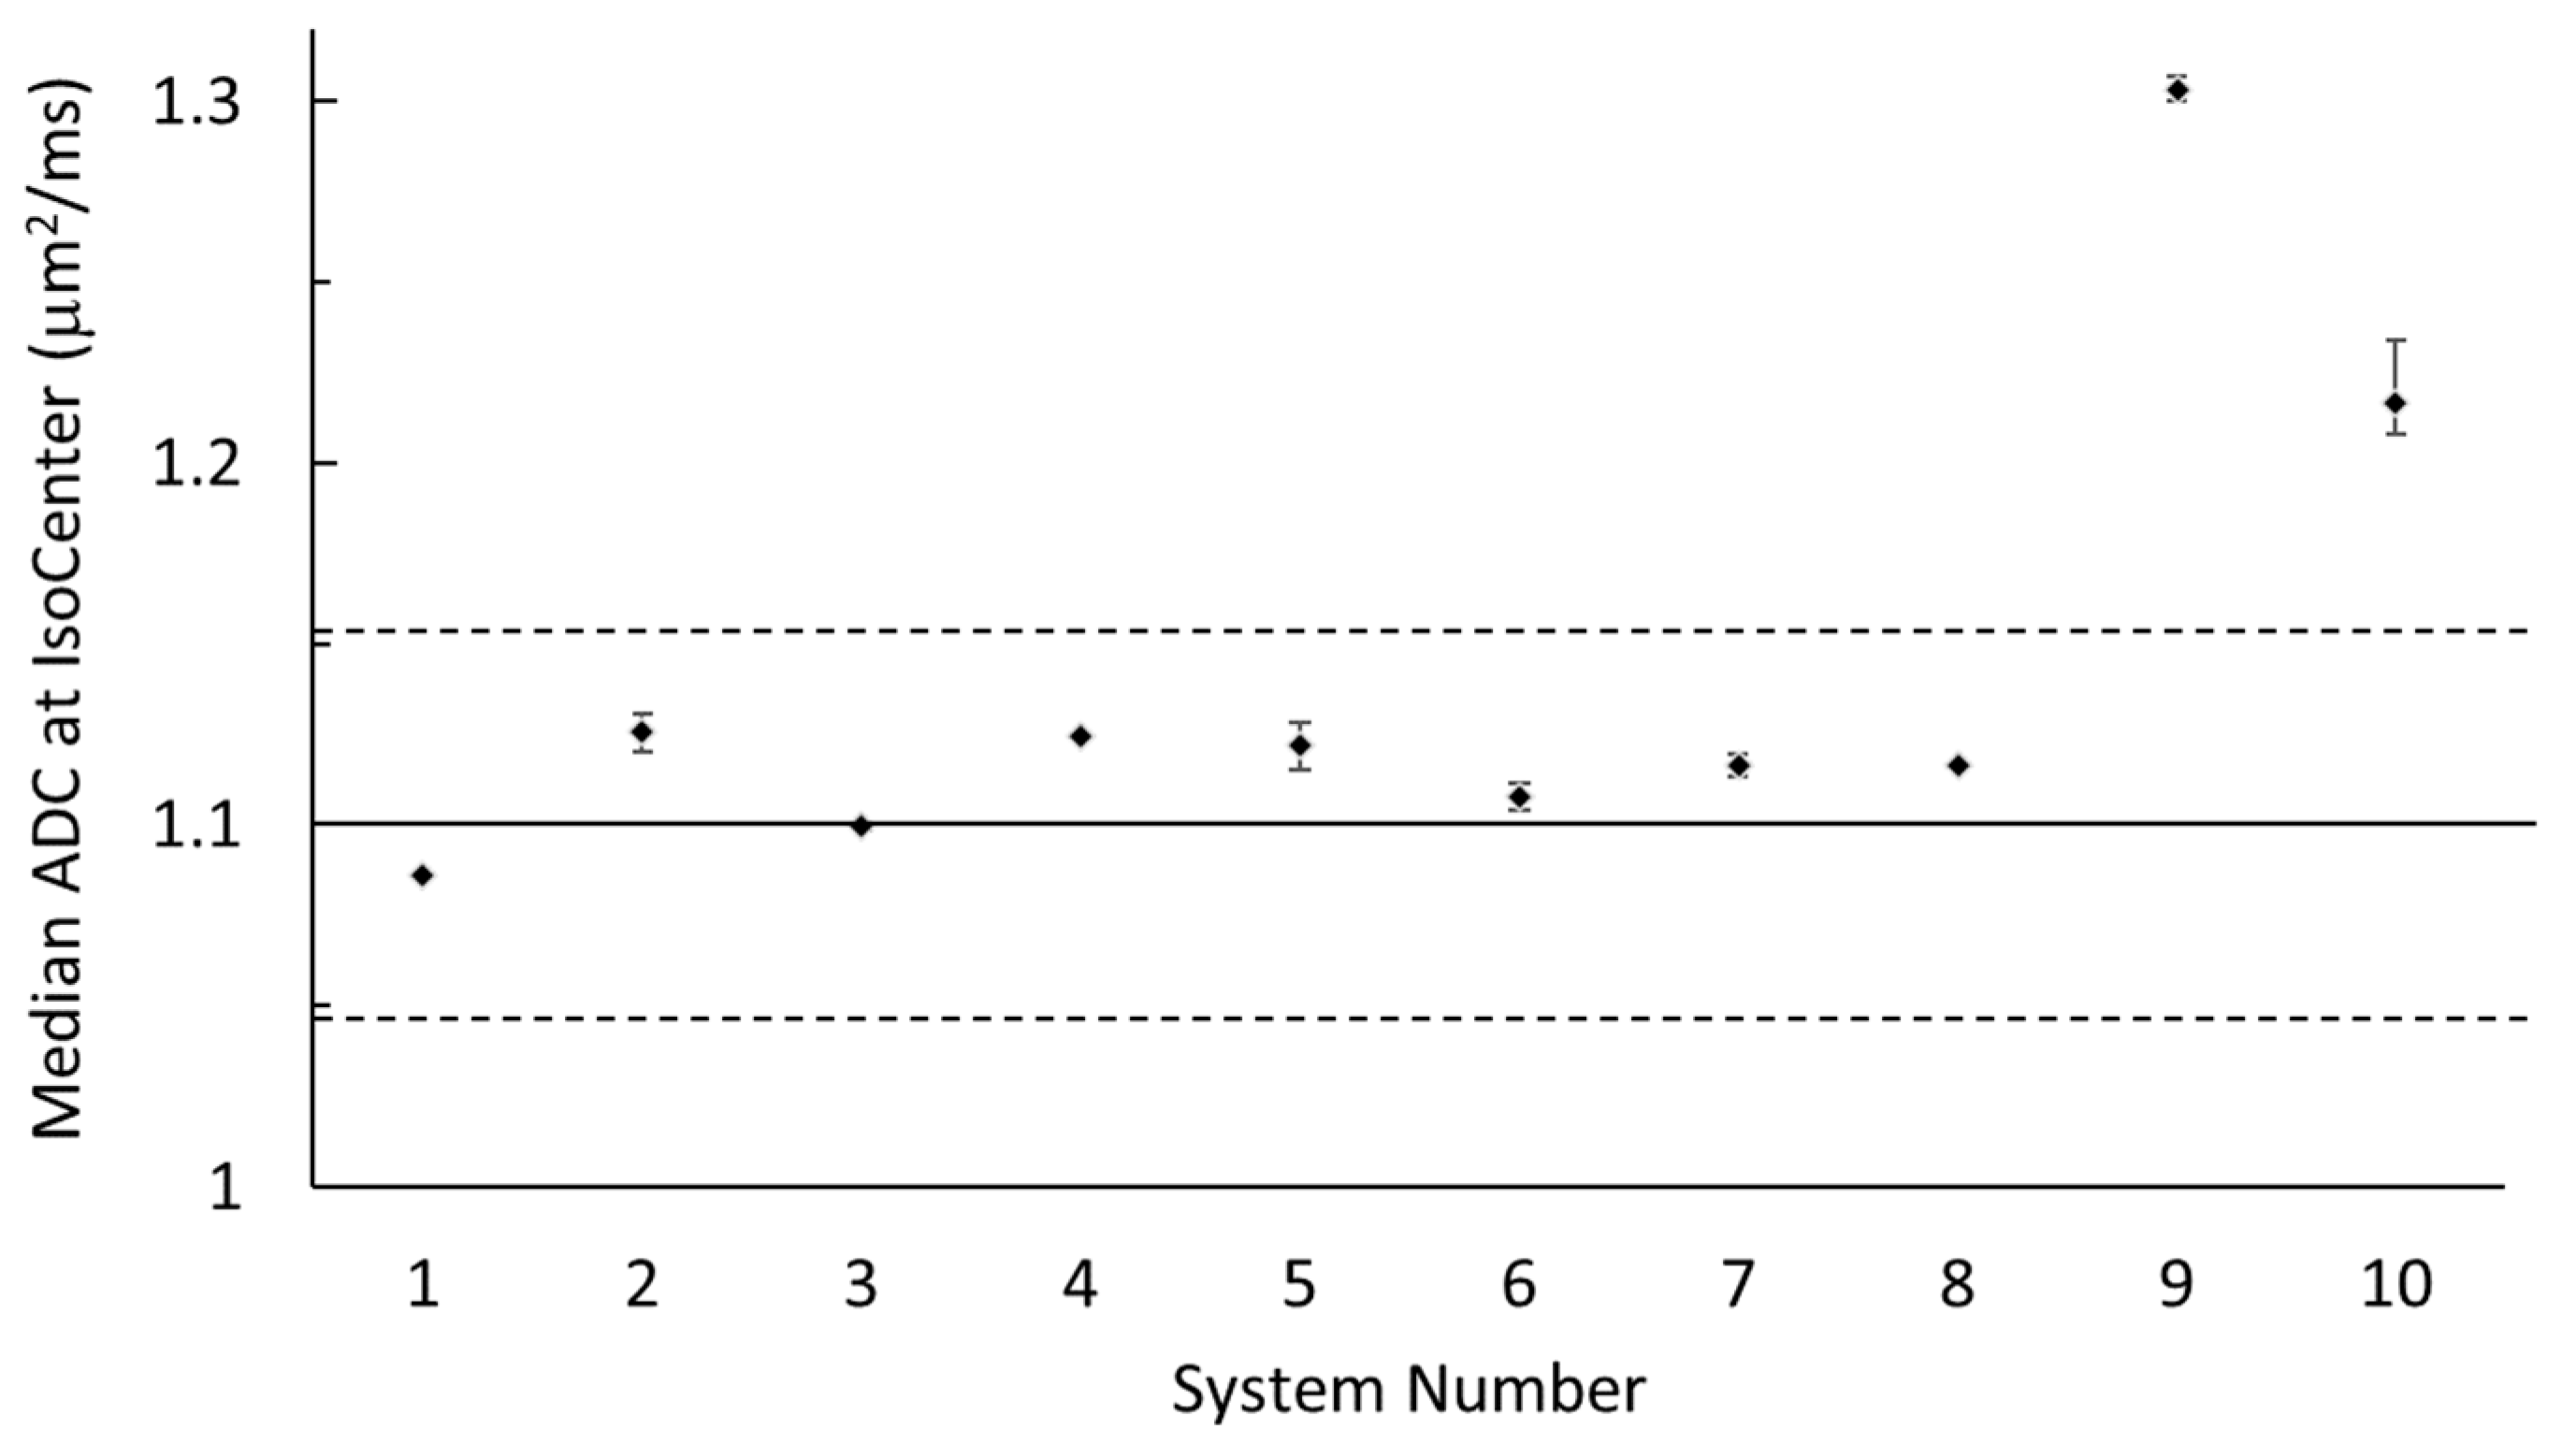
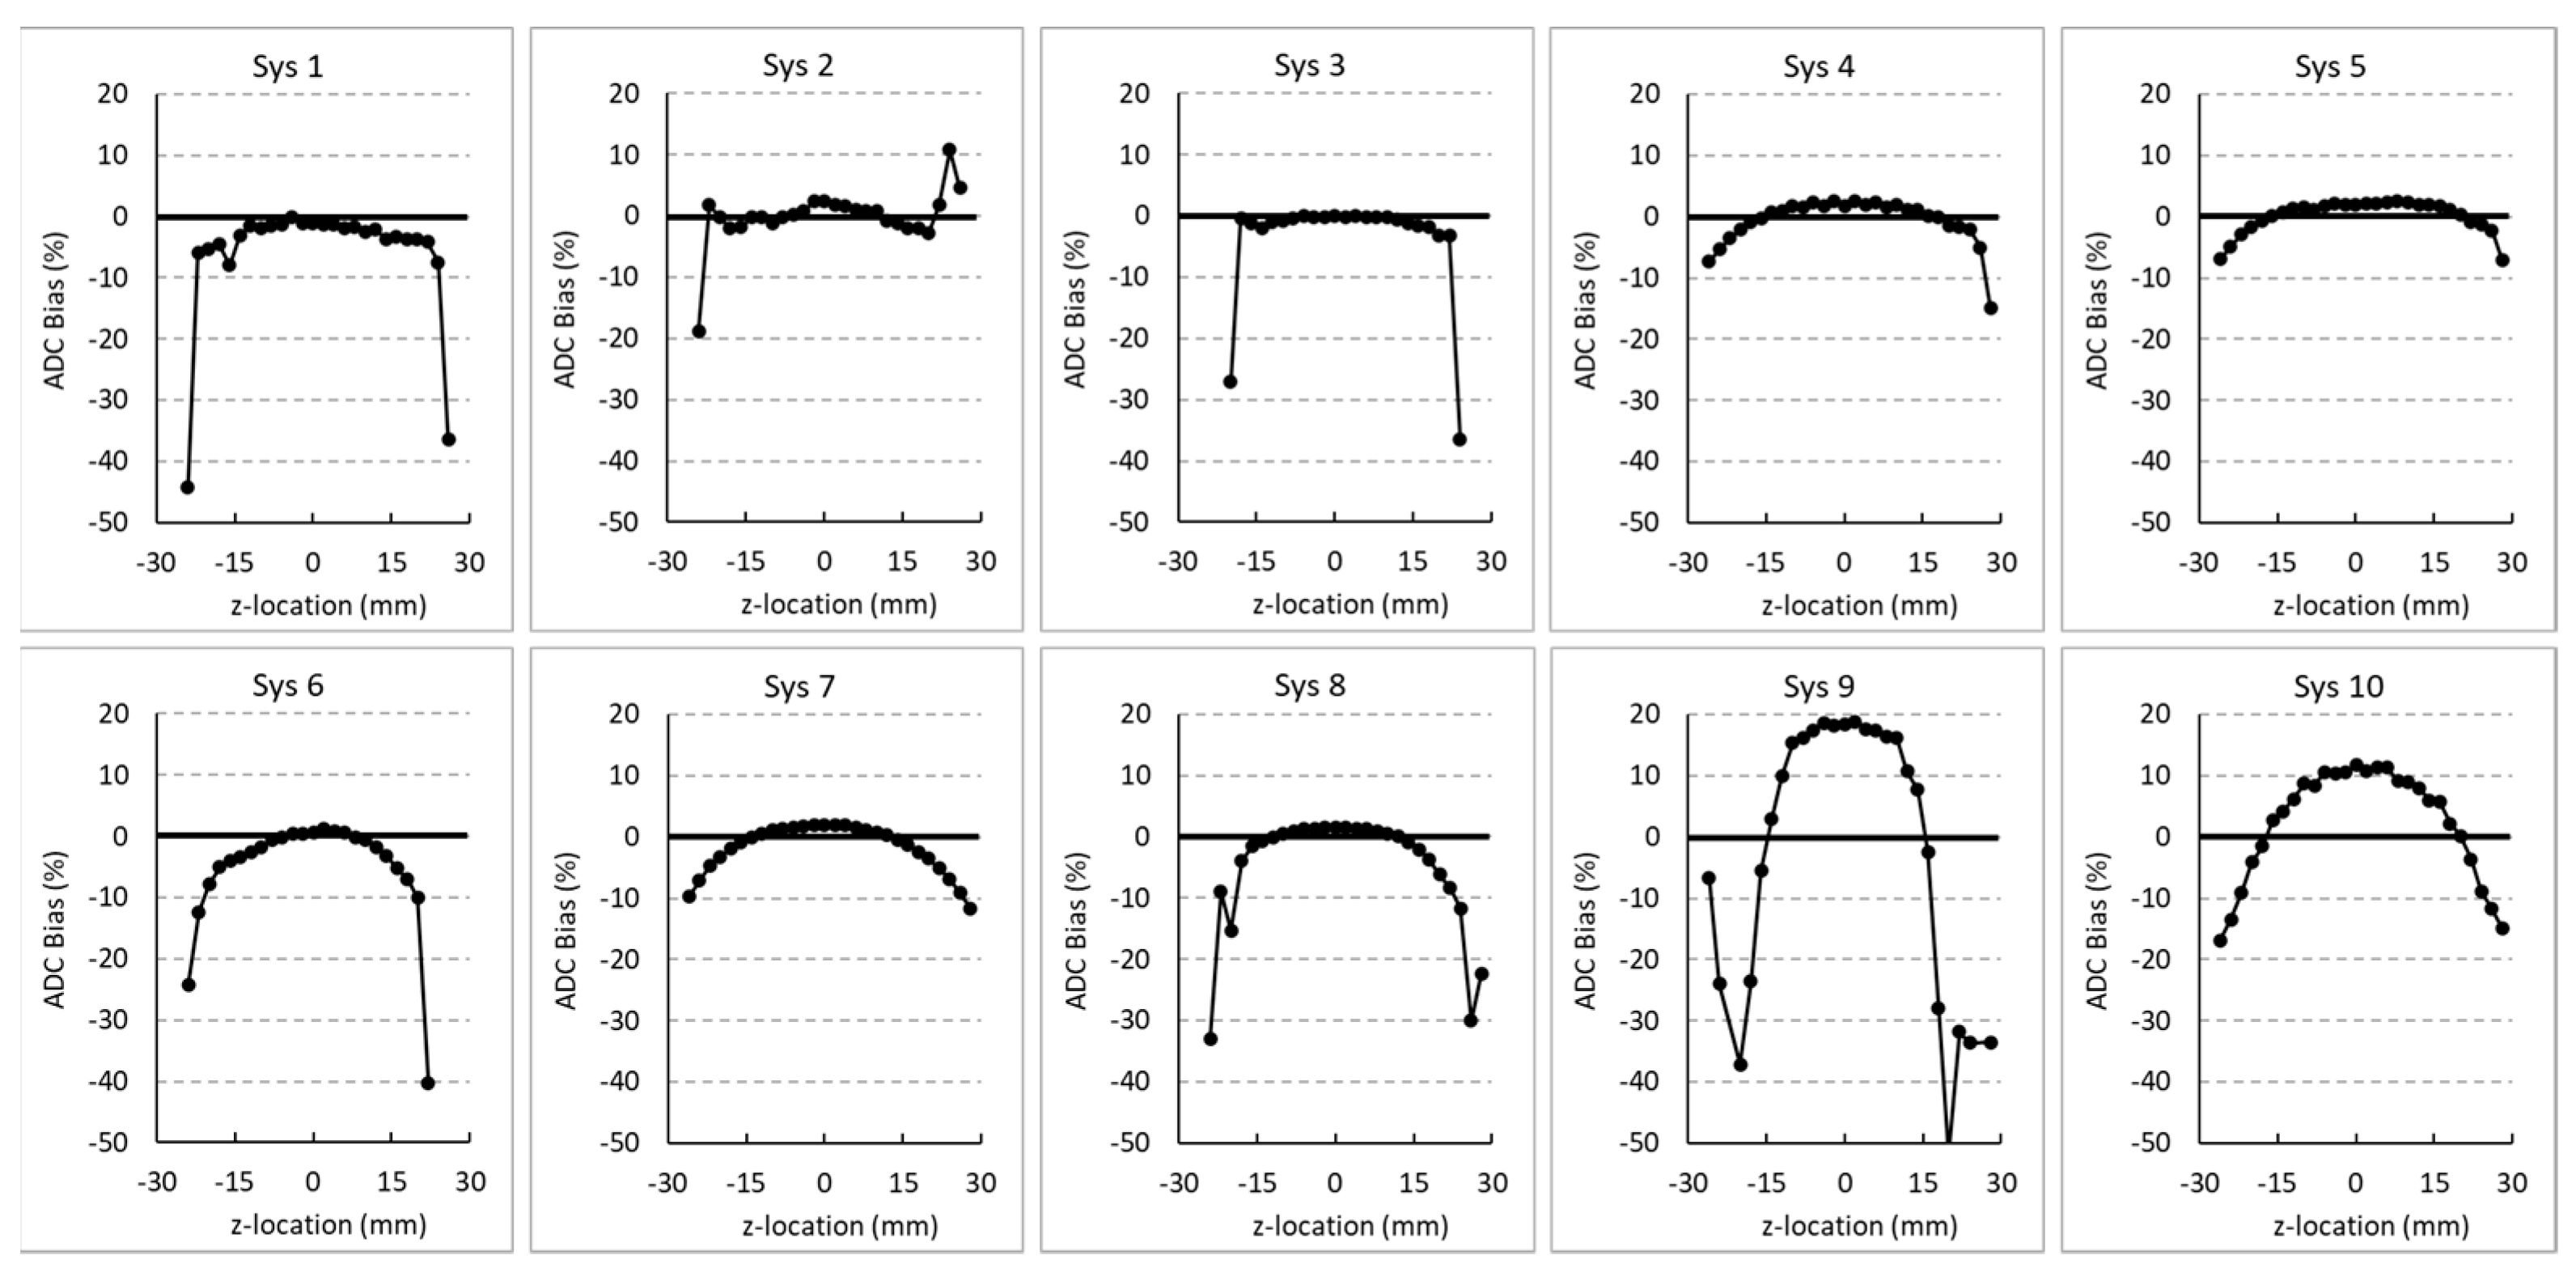
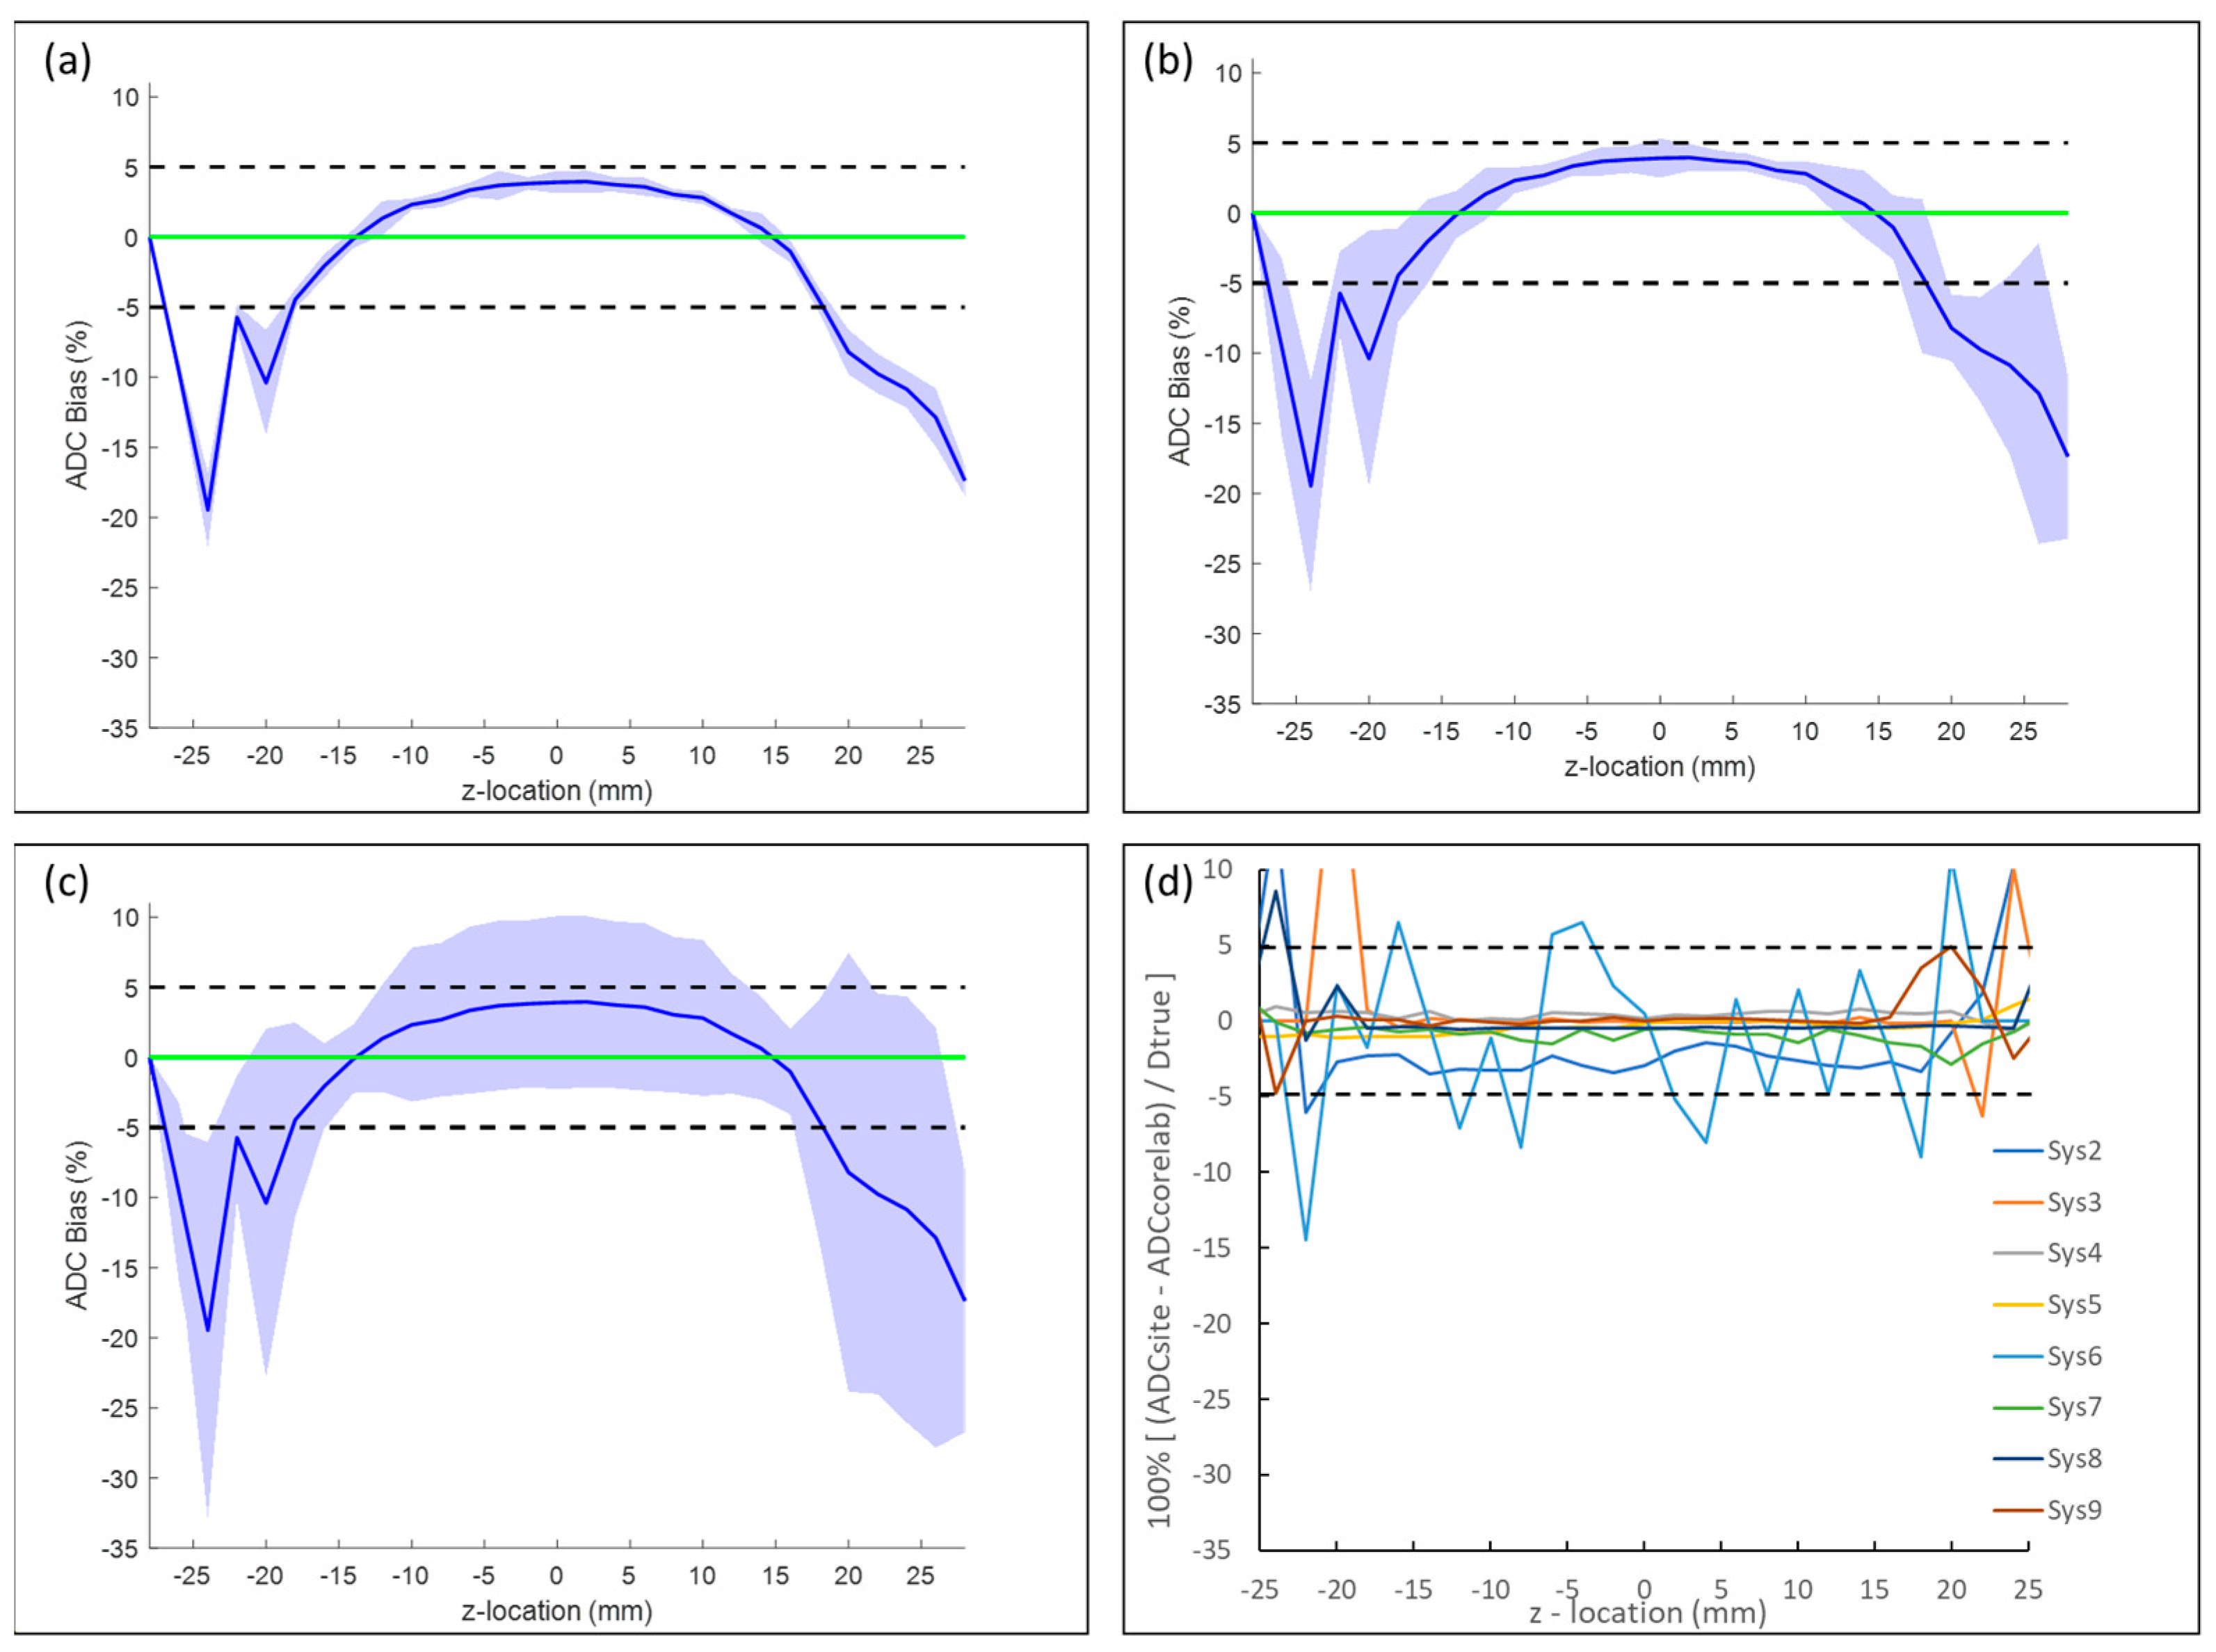
3. Results
4. Discussion
5. Conclusions
Supplementary Materials
Author Contributions
Funding
Institutional Review Board Statement
Informed Consent Statement
Data Availability Statement
Conflicts of Interest
References
- Fiordelisi, M.F.; Auletta, L.; Meomartino, L.; Basso, L.; Fatone, G.; Salvatore, M.; Mancini, M.; Greco, A. Preclinical Molecular Imaging for Precision Medicine in Breast Cancer Mouse Models. Contrast Media Mol. Imaging 2019, 2019, 8946729. [Google Scholar] [CrossRef] [PubMed]
- Hormuth, D.A.; Sorace, A.G.; Virostko, J.; Abramson, R.G.; Bhujwalla, Z.M.; Enriquez-Navas, P.; Gillies, R.; Hazle, J.D.; Mason, R.P.; Quarles, C.C.; et al. Translating preclinical MRI methods to clinical oncology. J. Magn. Reson. Imaging 2019, 50, 1377–1392. [Google Scholar] [CrossRef] [PubMed]
- Mendez, A.M.; Fang, L.K.; Meriwether, C.H.; Batasin, S.J.; Loubrie, S.; Rodríguez-Soto, A.E.; Rakow-Penner, R.A. Diffusion Breast MRI: Current Standard and Emerging Techniques. Front. Oncol. 2022, 12, 844790. [Google Scholar] [CrossRef] [PubMed]
- Sorace, A.G.; Elkassem, A.A.; Galgano, S.J.; Lapi, S.E.; Larimer, B.M.; Partridge, S.C.; Quarles, C.C.; Reeves, K.; Napier, T.S.; Song, P.N.; et al. Imaging for Response Assessment in Cancer Clinical Trials. Semin. Nucl. Med. 2020, 50, 488–504. [Google Scholar] [CrossRef] [PubMed]
- DeSouza, N.M.; Winfield, J.M.; Waterton, J.C.; Weller, A.; Papoutsaki, M.-V.; Doran, S.J.; Collins, D.J.; Fournier, L.; Sullivan, D.; Chenevert, T.; et al. Implementing diffusion-weighted MRI for body imaging in prospective multicentre trials: Current considerations and future perspectives. Eur. Radiol. 2018, 28, 1118–1131. [Google Scholar] [CrossRef]
- Keenan, K.E.; Peskin, A.P.; Wilmes, L.J.; Aliu, S.O.; Jones, E.F.; Li, W.; Kornak, J.; Newitt, D.C.; Hylton, N.M. Variability and bias assessment in breast ADC measurement across multiple systems. J. Magn. Reson. Imaging 2016, 44, 846–855. [Google Scholar] [CrossRef]
- O’Connor, J.P.B.; Aboagye, E.; Adams, J.E.; Aerts, H.J.W.L.; Barrington, S.F.; Beer, A.J.; Boellaard, R.; Bohndiek, S.; Brady, M.; Brown, G.; et al. Imaging biomarker roadmap for cancer studies. Nat. Rev. Clin. Oncol. 2017, 14, 169–186. [Google Scholar] [CrossRef]
- Doot, R.K.; Kurland, B.F.; Kinahan, P.E.; Mankoff, D.A. Design Considerations for using PET as a Response Measure in Single Site and Multicenter Clinical Trials. Acad. Radiol. 2012, 19, 184–190. [Google Scholar] [CrossRef]
- Shukla-Dave, A.; Obuchowski, N.A.; Chenevert, T.L.; Jambawalikar, S.; Schwartz, L.H.; Malyarenko, D.; Huang, W.; Noworolski, S.M.; Young, R.J.; Shiroishi, M.S.; et al. Quantitative imaging biomarkers alliance (QIBA) recommendations for improved precision of DWI and DCE-MRI derived biomarkers in multicenter oncology trials. J. Magn. Reson. Imaging 2019, 49, e101–e121. [Google Scholar] [CrossRef]
- Sullivan, D.C.; Obuchowski, N.A.; Kessler, L.G.; Raunig, D.L.; Gatsonis, C.; Huang, E.P.; Kondratovich, M.; McShane, L.M.; Reeves, A.P.; Barboriak, D.P.; et al. Metrology Standards for Quantitative Imaging Biomarkers. Radiology 2015, 277, 813–825. [Google Scholar] [CrossRef] [Green Version]
- Keenan, K.E.; Ainslie, M.; Barker, A.J.; Boss, M.A.; Cecil, K.M.; Charles, C.; Chenevert, T.L.; Clarke, L.; Evelhoch, J.L.; Finn, P.; et al. Quantitative magnetic resonance imaging phantoms: A review and the need for a system phantom. Magn. Reson. Med. 2018, 79, 48–61. [Google Scholar] [CrossRef] [PubMed]
- Keenan, K.E.; Biller, J.R.; Delfino, J.; Boss, M.; Does, M.D.; Evelhoch, J.L.; Griswold, M.A.; Gunter, J.L.; Hinks, R.S.; Hoffman, S.W.; et al. Recommendations towards standards for quantitative MRI (qMRI) and outstanding needs. J. Magn. Reson. Imaging 2019, 49, e26–e39. [Google Scholar] [CrossRef] [PubMed]
- Stupic, K.F.; Ainslie, M.; Boss, M.A.; Charles, C.; Dienstfrey, A.M.; Evelhoch, J.L.; Finn, P.; Gimbutas, Z.; Gunter, J.L.; Hill, D.L.G.; et al. A standard system phantom for magnetic resonance imaging. Magn. Reson. Med. 2021, 86, 1194–1211. [Google Scholar] [CrossRef] [PubMed]
- Padhani, A.R.; Liu, G.; Mu-Koh, D.; Chenevert, T.L.; Thoeny, H.C.; Takahara, T.; Dzik-Jurasz, A.; Ross, B.D.; Van Cauteren, M.; Collins, D.; et al. Diffusion-Weighted Magnetic Resonance Imaging as a Cancer Biomarker: Consensus and Recommendations. Neoplasia 2009, 11, 102–125. [Google Scholar] [CrossRef] [PubMed]
- Amouzandeh, G.; Chenevert, T.L.; Swanson, S.D.; Ross, B.D.; Malyarenko, D.I. Technical note: Temperature and concentration dependence of water diffusion in polyvinylpyrrolidone solutions. Med. Phys. 2022, 49, 3325–3332. [Google Scholar] [CrossRef]
- Keenan, K.E.; Wilmes, L.J.; Aliu, S.O.; Newitt, D.C.; Jones, E.F.; Boss, M.A.; Stupic, K.F.; Russek, S.E.; Hylton, N.M. Design of a breast phantom for quantitative MRI. J. Magn. Reson. Imaging 2016, 44, 610–619. [Google Scholar] [CrossRef] [PubMed]
- Pierpaoli, C.; Sarlls, J.; Nevo, U.; Basser, P.J.; Horkay, F. Polyvinylpyrrolidone (PVP) water solutions as isotropic phantoms for diffusion MRI studies. Intl. Soc. Magn. Reson. Med. 2009, 17, 1414. [Google Scholar]
- Pullens, P.; Bladt, P.; Sijbers, J.; Maas, A.I.; Parizel, P.M. Technical Note: A safe, cheap, and easy-to-use isotropic diffusion MRI phantom for clinical and multicenter studies. Med. Phys. 2017, 44, 1063–1070. [Google Scholar] [CrossRef]
- Keenan, K.E.; Stupic, K.F.; Russek, S.E.; Mirowski, E. MRI-visible liquid crystal thermometer. Magn. Reson. Med. 2020, 84, 1552–1563. [Google Scholar] [CrossRef]
- Chenevert, T.L.; Galbán, C.J.; Ivancevic, M.K.; Rohrer, S.E.; Londy, F.J.; Kwee, T.C.; Meyer, C.R.; Johnson, T.D.; Rehemtulla, A.; Ross, B.D. Diffusion coefficient measurement using a temperature-controlled fluid for quality control in multicenter studies. J. Magn. Reson. Imaging 2011, 34, 983–987. [Google Scholar] [CrossRef]
- Jerome, N.P.; Papoutsaki, M.-V.; Orton, M.R.; Parkes, H.G.; Winfield, J.M.; Boss, M.A.; Leach, M.O.; Desouza, N.M.; Collins, D.J. Development of a temperature-controlled phantom for magnetic resonance quality assurance of diffusion, dynamic, and relaxometry measurements. Med. Phys. 2016, 43, 2998–3007. [Google Scholar] [CrossRef] [PubMed] [Green Version]
- Malyarenko, D.; Galbán, C.J.; Londy, F.J.; Meyer, C.R.; Johnson, T.D.; Rehemtulla, A.; Ross, B.D.; Chenevert, T.L. Multi-system repeatability and reproducibility of apparent diffusion coefficient measurement using an ice-water phantom. J. Magn. Reson. Imaging 2013, 37, 1238–1246. [Google Scholar] [CrossRef] [PubMed]
- Newitt, D.C.; Malyarenko, D.; Chenevert, T.L.; Quarles, C.C.; Bell, L.; Fedorov, A.; Fennessy, F. Multisite concordance of apparent diffusion coefficient measurements across the NCI Quantitative Imaging Network. J. Med. Imaging 2018, 5, 011003. [Google Scholar] [CrossRef]
- Palacios, E.; Martin, A.; Boss, M.; Ezekiel, F.; Chang, Y.; Yuh, E.; Vassar, M.; Schnyer, D.; MacDonald, C.; Crawford, K.; et al. Toward Precision and Reproducibility of Diffusion Tensor Imaging: A Multicenter Diffusion Phantom and Traveling Volunteer Study. Am. J. Neuroradiol. 2017, 38, 537–545. [Google Scholar] [CrossRef] [PubMed]
- Buus, T.W.; Jensen, A.B.; Pedersen, E.M. Diffusion gradient nonlinearity bias correction reduces bias of breast cancer bone metastasis ADC values. J. Magn. Reson. Imaging 2020, 51, 904–911. [Google Scholar] [CrossRef]
- Malyarenko, D.I.; Newitt, D.; Wilmes, L.J.; Tudorica, A.; Helmer, K.G.; Arlinghaus, L.R.; Jacobs, M.A.; Jajamovich, G.; Taouli, B.; Yankeelov, T.E.; et al. Demonstration of nonlinearity bias in the measurement of the apparent diffusion coefficient in multicenter trials. Magn. Reson. Med. 2016, 75, 1312–1323. [Google Scholar] [CrossRef]
- Doblas, S.; Almeida, G.S.; Blé, F.-X.; Garteiser, P.; Hoff, B.A.; McIntyre, D.J.; Wachsmuth, L.; Chenevert, T.L.; Faber, C.; Griffiths, J.R.; et al. Apparent diffusion coefficient is highly reproducible on preclinical imaging systems: Evidence from a seven-center multivendor study. J. Magn. Reson. Imaging 2015, 42, 1759–1764. [Google Scholar] [CrossRef]
- Shoghi, K.I.; Badea, C.; Blocker, S.J.; Chenevert, T.L.; Laforest, R.; Lewis, M.T.; Luker, G.D.; Manning, H.C.; Marcus, D.S.; Mowery, Y.M.; et al. Co-Clinical Imaging Resource Program (CIRP): Bridging the Translational Divide to Advance Precision Medicine. Tomography 2020, 6, 273–287. [Google Scholar] [CrossRef]
- CIRP IADP DWI Phantom Preparation and Scan Procedure. Available online: https://drive.google.com/file/d/1ryA_6YY3zwWOOQSKTmCbMah5fitLDS1n/view (accessed on 30 January 2023).
- Stejskal, E.O.; Tanner, J.E. Spin Diffusion Measurements: Spin Echoes in the Presence of a Time-Dependent Field Gradient. J. Chem. Phys. 1965, 42, 288–292. [Google Scholar] [CrossRef]
- Digital Imaging and Communications in Medicine (DICOM) Standard. Available online: http://www.dicomstandard.org/ (accessed on 30 January 2023).
- Enhanced MR Image Module. Available online: https://dicom.nema.org/medical/dicom/2020b/output/chtml/part03/sect_C.8.13.html (accessed on 30 January 2023).
- Neuroimaging Informatics Technology Initiative. Available online: https://nifti.nimh.nih.gov/ (accessed on 30 January 2023).
- Metaimage MHD Format. Available online: https://itk.org/Wiki/ITK/MetaIO/Documentation#:~:text=MetaImage%20is%20the%20text%2Dbased,library%20is%20known%20at%20MetaIO (accessed on 30 January 2023).
- 3D Slicer. Available online: https://www.slicer.org/#what-is-3d-slicer (accessed on 30 January 2023).
- Dietrich, O.; Heiland, S.; Sartor, K. Noise correction for the exact determination of apparent diffusion coefficients at low SNR. Magn. Reson. Med. 2001, 45, 448–453. [Google Scholar] [CrossRef]
- Kristoffersen, A. Optimal estimation of the diffusion coefficient from non-averaged and averaged noisy magnitude data. J. Magn. Reson. 2007, 187, 293–305. [Google Scholar] [CrossRef]
- Dietrich, O.; Raya, J.G.; Reeder, S.B.; Reiser, M.F.; Schoenberg, S.O. Measurement of signal-to-noise ratios in MR images: Influence of multichannel coils, parallel imaging, and reconstruction filters. J. Magn. Reson. Imaging 2007, 26, 375–385. [Google Scholar] [CrossRef]
- Holz, M.; Heil, S.R.; Sacco, A. Temperature-dependent self-diffusion coefficients of water and six selected molecular liquids for calibration in accurate 1H NMR PFG measurements. Phys. Chem. Chem. Phys. 2000, 2, 4740–4742. [Google Scholar] [CrossRef]
- Raunig, D.L.; McShane, L.M.; Pennello, G.; Gatsonis, C.; Carson, P.L.; Voyvodic, J.T.; Wahl, R.L.; Kurland, B.F.; Schwarz, A.J.; Gönen, M.; et al. Quantitative imaging biomarkers: A review of statistical methods for technical performance assessment. Stat. Methods Med. Res. 2015, 24, 27–67. [Google Scholar] [CrossRef] [PubMed]
- Malyarenko, D.I.; Chenevert, T.L. Practical estimate of gradient nonlinearity for implementation of apparent diffusion coefficient bias correction. J. Magn. Reson. Imaging 2014, 40, 1487–1495. [Google Scholar] [CrossRef] [PubMed]
- Malyarenko, D.I.; Ross, B.D.; Chenevert, T.L. Analysis and correction of gradient nonlinearity bias in apparent diffusion coefficient measurements. Magn. Reson. Med. 2014, 71, 1312–1323. [Google Scholar] [CrossRef]
- Barnett, A.S.; Irfanoglu, M.O.; Landman, B.; Rogers, B.; Pierpaoli, C. Mapping gradient nonlinearity and miscalibration using diffusion-weighted MR images of a uniform isotropic phantom. Magn. Reson. Med. 2021, 86, 3259–3273. [Google Scholar] [CrossRef]
- Fang, L.K.; Keenan, K.E.; Carl, M.; Ojeda-Fournier, H.; Rodríguez-Soto, A.E.; Rakow-Penner, R.A. Apparent Diffusion Coefficient Reproducibility Across 3 T Scanners in a Breast Diffusion Phantom. J. Magn. Reson. Imaging 2022, e28355. [Google Scholar] [CrossRef]
- Pang, Y.; Malyarenko, D.I.; Wilmes, L.J.; Devaraj, A.; Tan, E.T.; Marinelli, L.; Endt, A.V.; Peeters, J.; Jacobs, M.A.; Newitt, D.C.; et al. Long-Term Stability of Gradient Characteristics Warrants Model-Based Correction of Diffusion Weighting Bias. Tomography 2022, 8, 30. [Google Scholar] [CrossRef]
- Wang, J.; Ma, C.; Yang, P.; Wang, Z.; Chen, Y.; Bian, Y.; Shao, C.; Lu, J. Diffusion-Weighted Imaging of the Abdomen: Correction for Gradient Nonlinearity Bias in Apparent Diffusion Coefficient. J. Magn. Reson. Imaging 2022. [Google Scholar] [CrossRef]
- Chenevert, T.L.; Malyarenko, D.I.; Newitt, D.; Li, X.; Jayatilake, M.; Tudorica, A.; Fedorov, A.; Kikinis, R.; Liu, T.T.; Muzi, M.; et al. Errors in Quantitative Image Analysis due to Platform-Dependent Image Scaling. Transl. Oncol. 2014, 7, 65–71. [Google Scholar] [CrossRef] [PubMed] [Green Version]


| System | Vendor | Field Strength (T) | Gradient Inner Diameter (mm) | SW Version | Day 1 Scan1 Scan2 | Day 2 Scan1 Scan2 | ITK Format | ||
|---|---|---|---|---|---|---|---|---|---|
| 1 | Bruker | 7 | 114 | PV7.0.0 | ✓ | ✓ | ✓ | ✓ | MHD |
| 2 | Bruker | 9.4 | 120 | PV6.0.1 | ✓ | ✓ | ✓ | ✓ | MHD and Classic DICOM |
| 3 | Bruker | 7 | 120 | PV6.0.1 | ✓ | ✓ | ✓ | ✓ | Classic DICOM |
| 4 | Bruker | 9.4 | 114 | PV360 v2.0 | ✓ | ✓ | ✓ | ✓ | Enhanced DICOM |
| 5 | Agilent | 11.74 | 80 | VnmrJ4.2revA | ✓ | ✓ | ✓ | ✓ | Classic DICOM |
| 6 | Bruker | 3 | 105 | PV6.0.1 | ✓ | ✓ | ✓ | ✓ | Classic DICOM |
| 7 | Bruker | 9.4 | 60 | PV360 v3.0 | ✓ | ✓ | ✓ | ✓ | NIFTI |
| 8 | Bruker | 4.7 | 90 | PV6.0.1 | ✓ | ✓ | Classic DICOM | ||
| 9 | Bruker | 14 | 40 | PV5.1 | ✓ | ✓ | Classic DICOM | ||
| 10 | MR Solutions | 3 | 95 | V4.0.2.4 | ✓ | ✓ | ✓ | ✓ | MHD and Classic DICOM |
| Short-Term Repeatability | Long-Term Repeatability | Cross-System Reproducibility | |||||
|---|---|---|---|---|---|---|---|
| wSD (µm2/ms) | RC (µm2/ms) | wCV (%) | wSD (µm2/ms) | RC (µm2/ms) | wCV (%) | SD (µm2/ms) | RDC (µm2/ms) |
| 0.009 [0.007, 0.014] | 0.025 [0.018, 0.038] | 0.73 [0.54, 1.12] | 0.015 [0.011, 0.023] | 0.042 [0.032, 0.064] | 1.26 [0.94, 1.89] | 0.068 [0.047, 0.124] | 0.188 [0.129, 0.343] |
Disclaimer/Publisher’s Note: The statements, opinions and data contained in all publications are solely those of the individual author(s) and contributor(s) and not of MDPI and/or the editor(s). MDPI and/or the editor(s) disclaim responsibility for any injury to people or property resulting from any ideas, methods, instructions or products referred to in the content. |
© 2023 by the authors. Licensee MDPI, Basel, Switzerland. This article is an open access article distributed under the terms and conditions of the Creative Commons Attribution (CC BY) license (https://creativecommons.org/licenses/by/4.0/).
Share and Cite
Malyarenko, D.; Amouzandeh, G.; Pickup, S.; Zhou, R.; Manning, H.C.; Gammon, S.T.; Shoghi, K.I.; Quirk, J.D.; Sriram, R.; Larson, P.; et al. Evaluation of Apparent Diffusion Coefficient Repeatability and Reproducibility for Preclinical MRIs Using Standardized Procedures and a Diffusion-Weighted Imaging Phantom. Tomography 2023, 9, 375-386. https://doi.org/10.3390/tomography9010030
Malyarenko D, Amouzandeh G, Pickup S, Zhou R, Manning HC, Gammon ST, Shoghi KI, Quirk JD, Sriram R, Larson P, et al. Evaluation of Apparent Diffusion Coefficient Repeatability and Reproducibility for Preclinical MRIs Using Standardized Procedures and a Diffusion-Weighted Imaging Phantom. Tomography. 2023; 9(1):375-386. https://doi.org/10.3390/tomography9010030
Chicago/Turabian StyleMalyarenko, Dariya, Ghoncheh Amouzandeh, Stephen Pickup, Rong Zhou, Henry Charles Manning, Seth T. Gammon, Kooresh I. Shoghi, James D. Quirk, Renuka Sriram, Peder Larson, and et al. 2023. "Evaluation of Apparent Diffusion Coefficient Repeatability and Reproducibility for Preclinical MRIs Using Standardized Procedures and a Diffusion-Weighted Imaging Phantom" Tomography 9, no. 1: 375-386. https://doi.org/10.3390/tomography9010030