
T1-Weighted Contrast Enhancement, Apparent Diffusion Coefficient, and Cerebral-Blood-Volume Changes after Glioblastoma Resection: MRI within 48 Hours vs. beyond 48 Hours
 ,
, 
Abstract
:1. Introduction
2. Materials and Methods
2.1. Patients
- (1)
- Patients who underwent either first-time, partial, or total surgery and had an MRI examination.
- (2)
- Availability of pre-operative MRI studies performed with a 1.5 T scanner, within 30 days before the surgery.
- (3)
- Availability of post-operative MRI studies performed with a 1.5 T scanner, no later than 90 h post-surgery.
- (1)
- Image quality adequate to accurately perform all image analysis (for example, patients with evident movement artifacts) (5 patients excluded).
- (2)
- Glioblastoma multiforme (GBM) characterized by relevant contrast enhancement, evaluated on preoperative MRI (0 patients excluded).
2.2. Image Protocol
2.3. Image Analysis
2.4. Statistical Analysis
3. Results
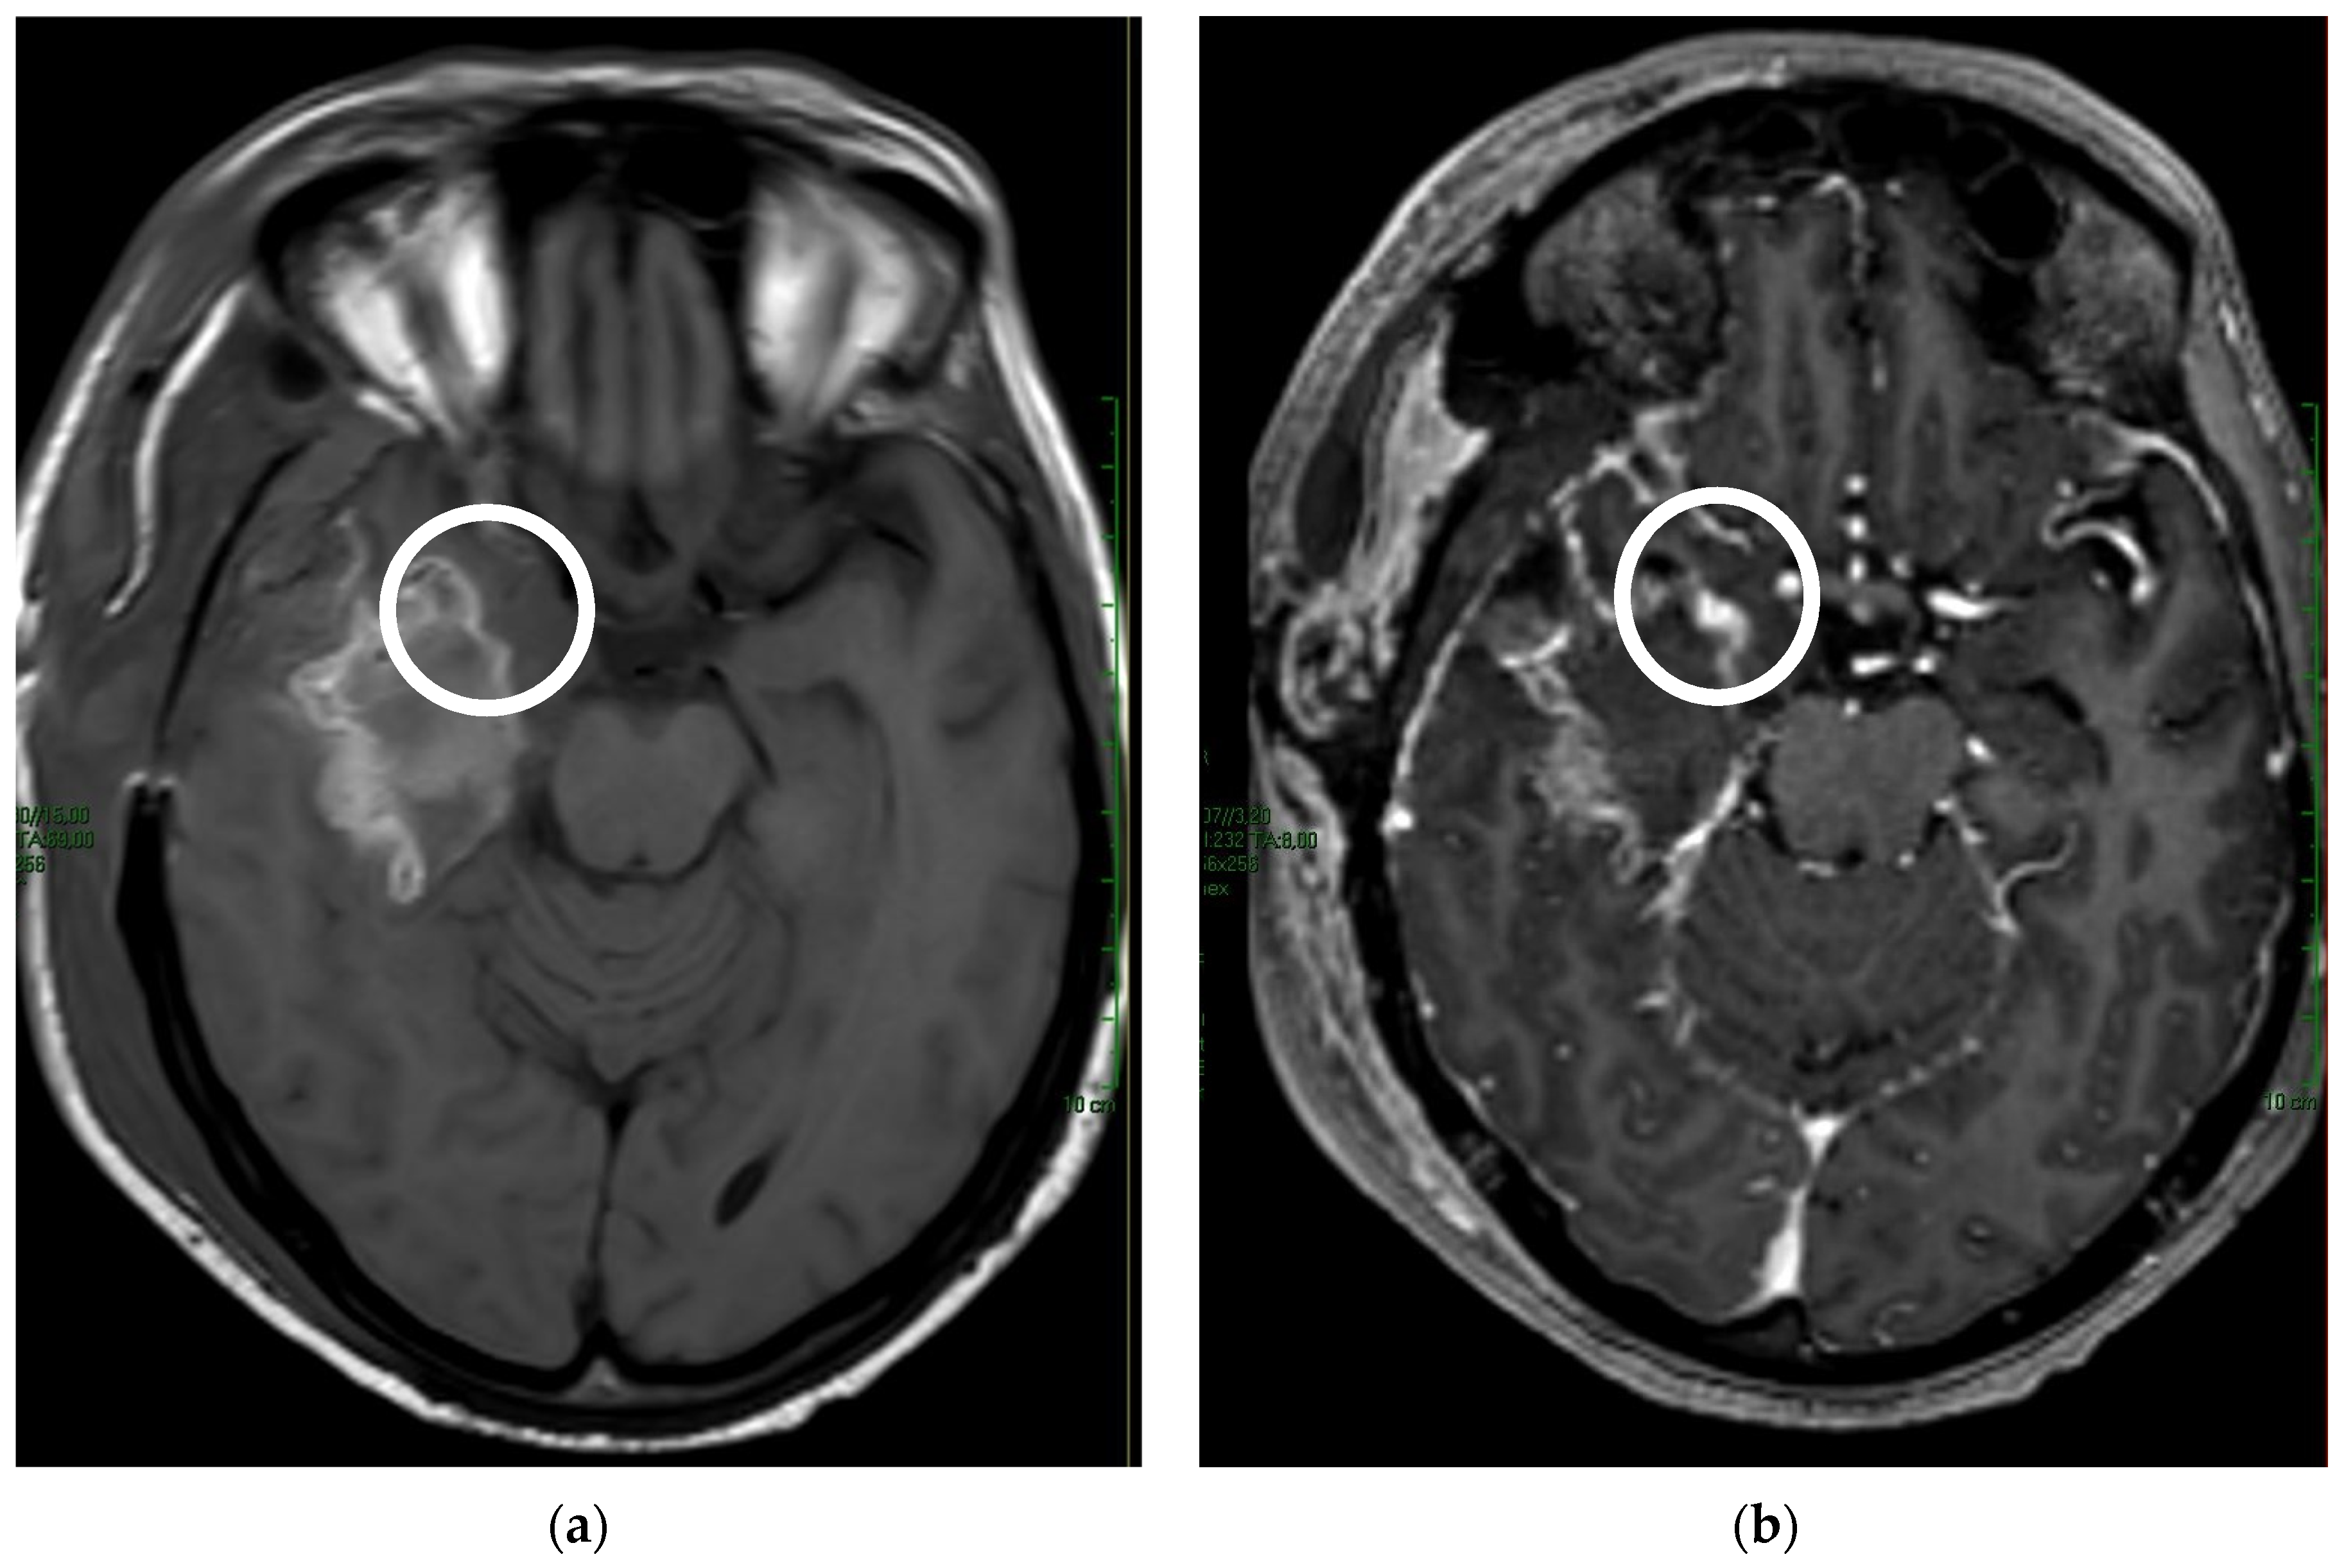
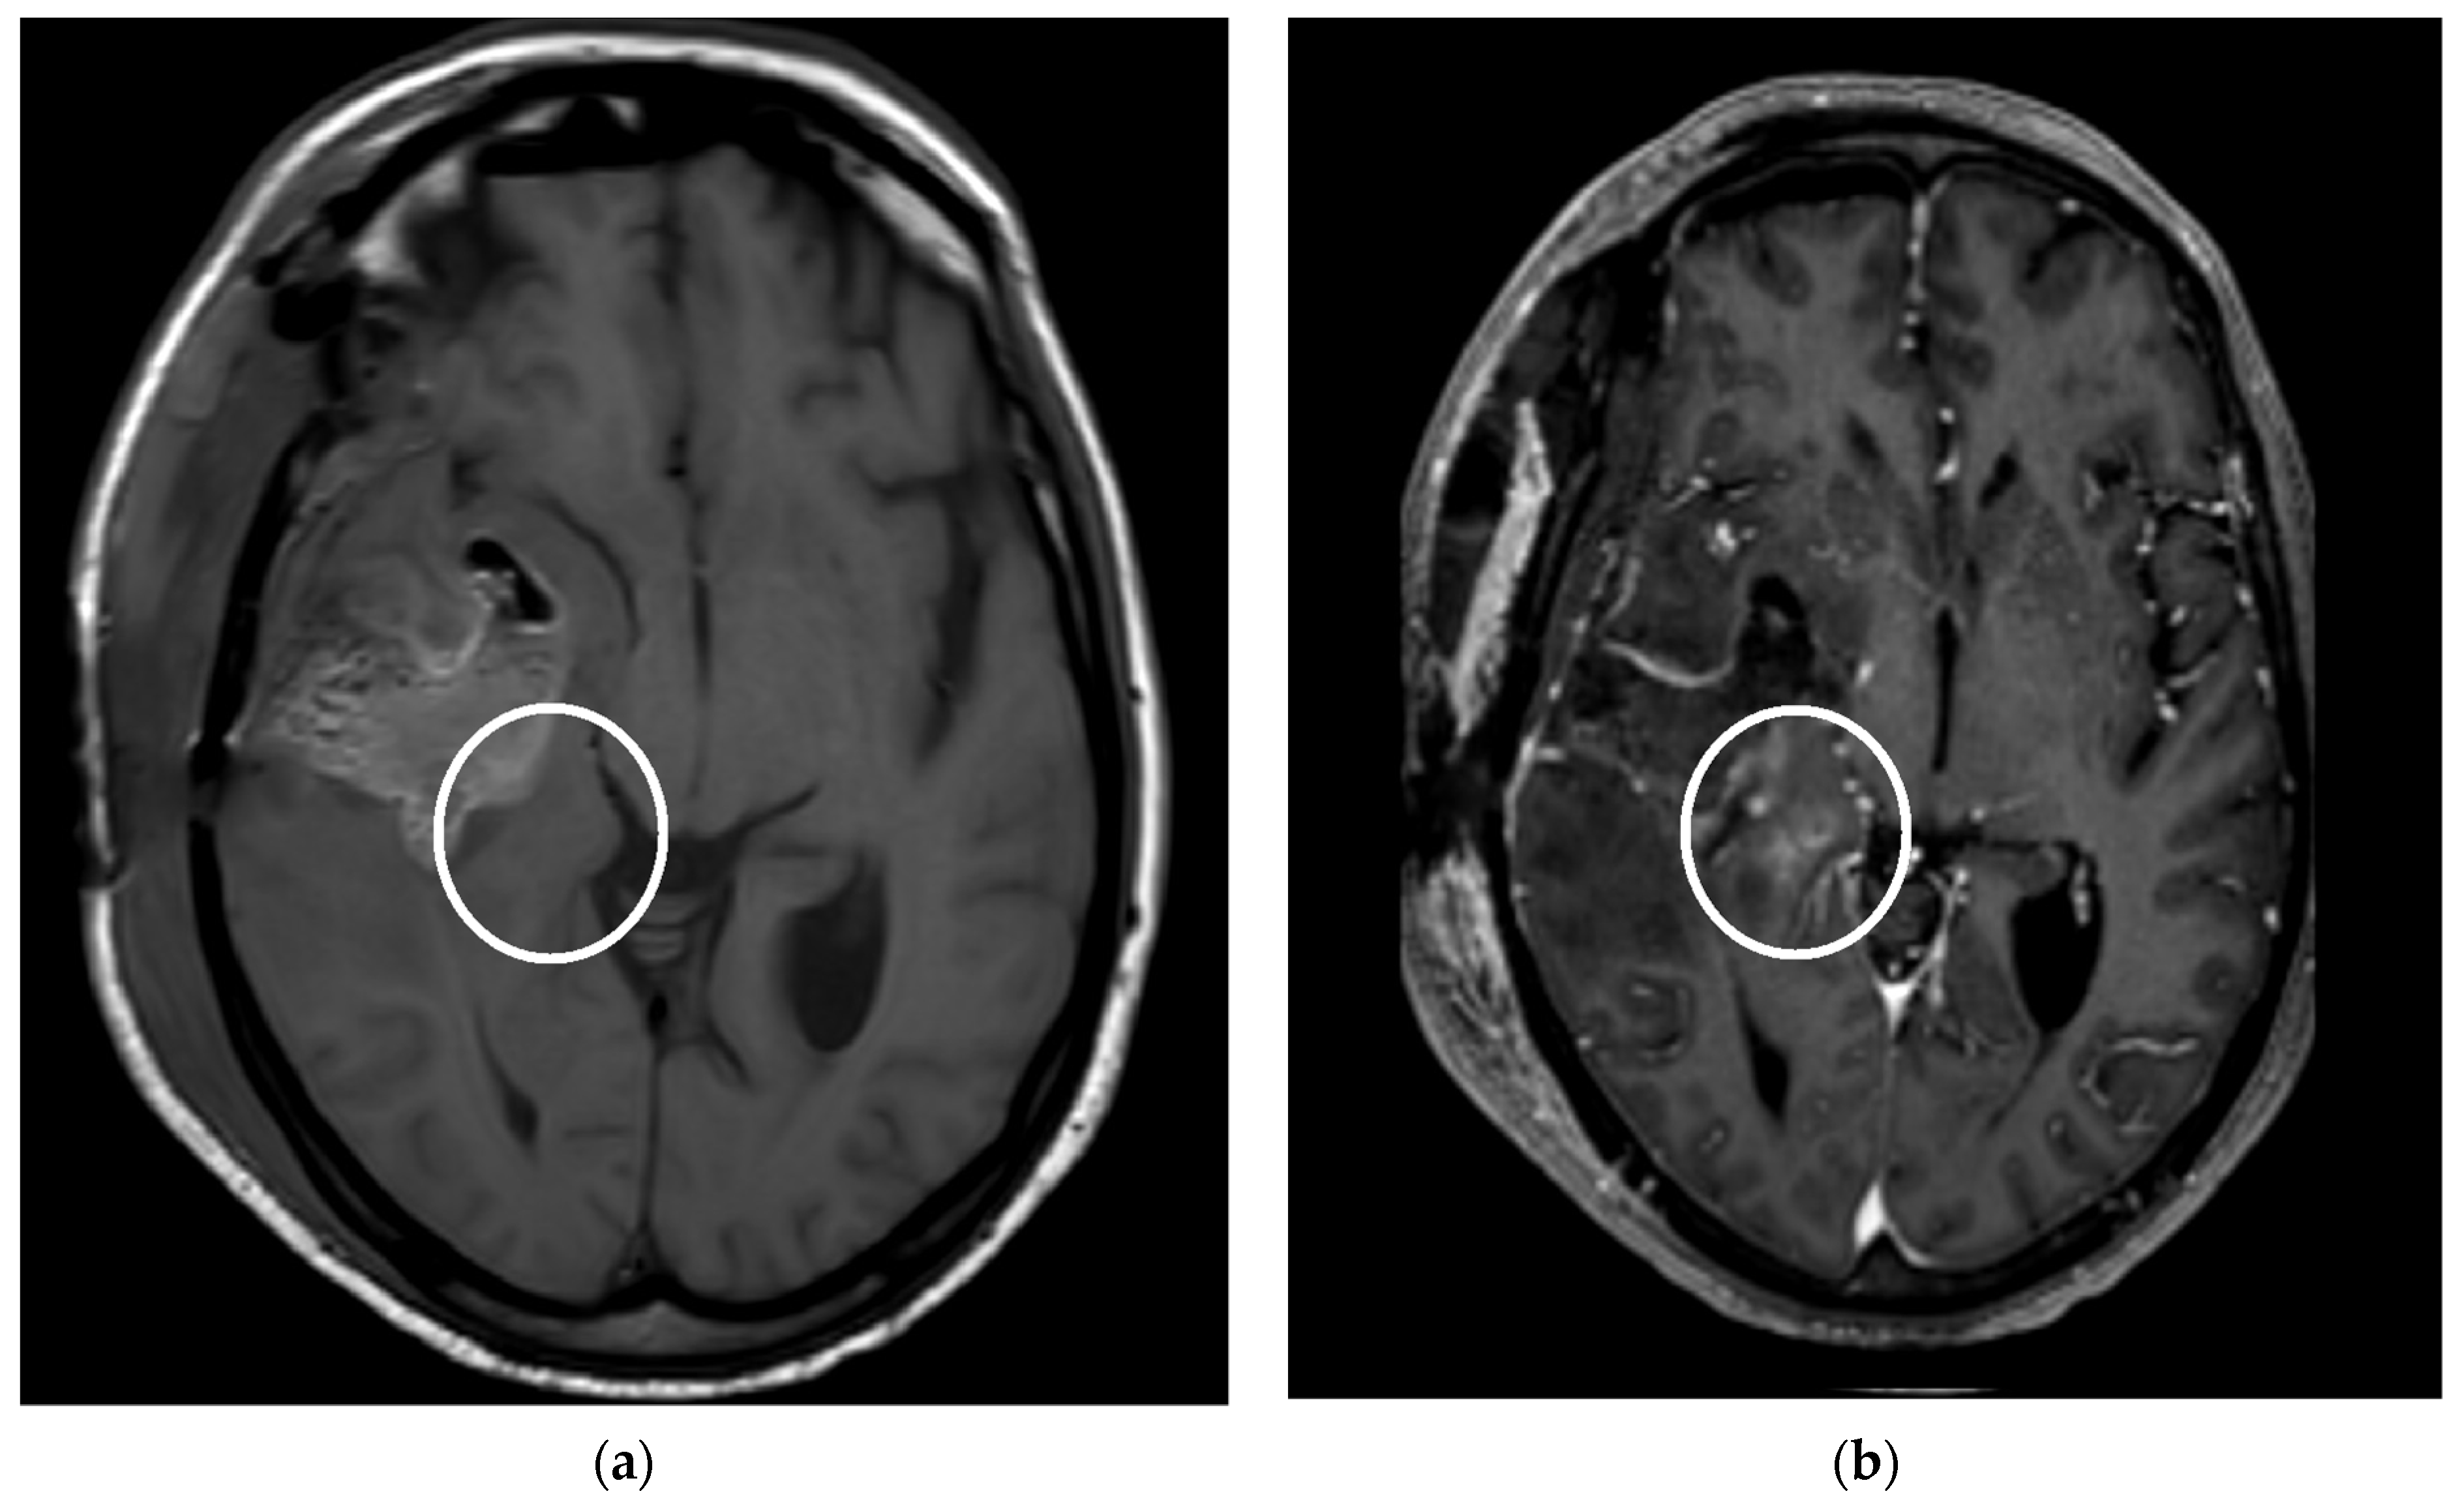
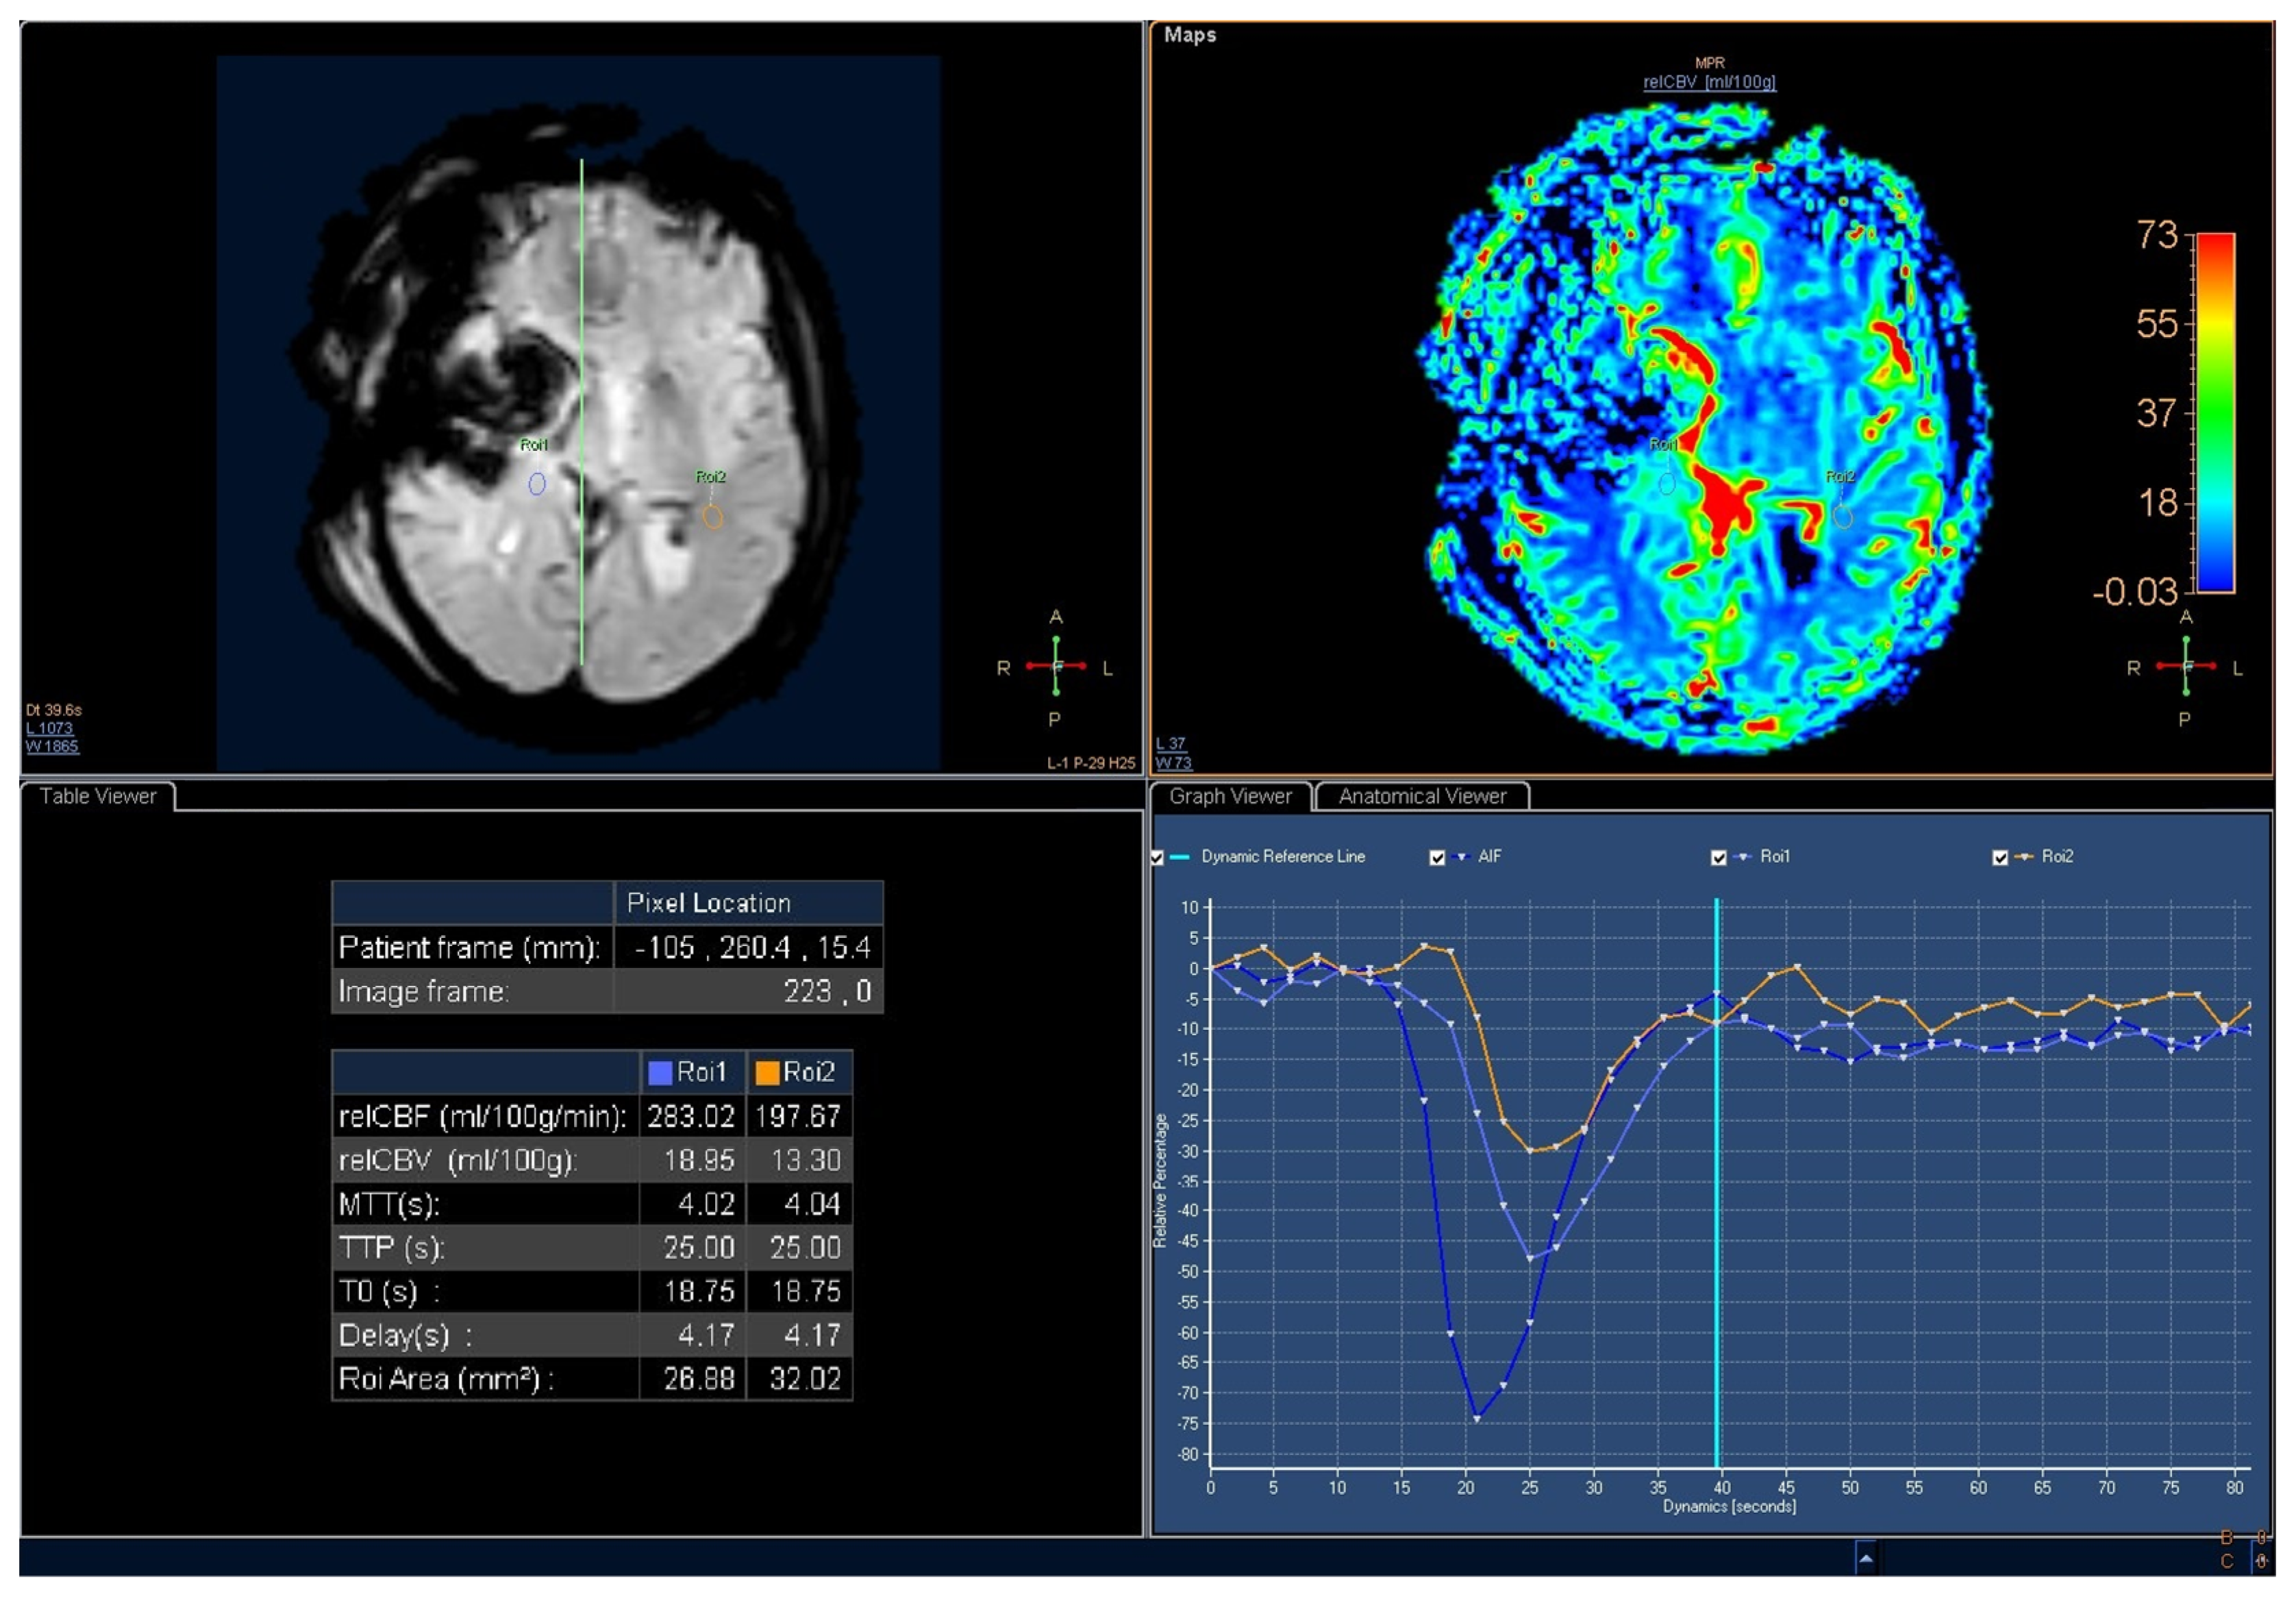
Imaging Results
4. Discussion
Study Limitations
5. Conclusions
Author Contributions
Funding
Institutional Review Board Statement
Informed Consent Statement
Data Availability Statement
Acknowledgments
Conflicts of Interest
References
- Omuro, A.; DeAngelis, L.M. Glioblastoma and other malignant gliomas: A clinical review. JAMA 2013, 310, 1842–1850. [Google Scholar] [CrossRef] [PubMed]
- Dolecek, T.A.; Propp, J.M.; Stroup, N.E.; Kruchko, C. CBTRUS statistical report: Primary brain and central nervous system tumors diagnosed in the United States in 2005–2009. Neuro-Oncology 2012, 14, v1–v49. [Google Scholar] [CrossRef]
- Louis, D.N.; Perry, A.; Reifenberger, G.; Von Deimling, A.; Figarella, D.; Cavenee, W.K.; Ellison, D.W.; Webster, B.; Kleihues, P.; Wiestler, O.D.; et al. The 2016 World Health Organization Classification of Tumors of the Central Nervous System: A summary. Acta Neuropathol. 2016, 131, 803–820. [Google Scholar] [CrossRef] [PubMed]
- Tan, A.C.; Ashley, D.M.; López, G.Y.; Malinzak, M.; Friedman, H.S.; Khasraw, M. Management of glioblastoma: State of the art and future directions. CA Cancer J. Clin. 2020, 70, 299–312. [Google Scholar] [CrossRef] [PubMed]
- Strauss, S.B.; Meng, A.; Ebani, E.J.; Chiang, G.C. Imaging Glioblastoma Posttreatment: Progression, Pseudoprogression, Pseudoresponse, Radiation Necrosis. Neuroimaging Clin. 2021, 31, 103–120. [Google Scholar] [CrossRef]
- Qin, D.; Yang, G.; Jing, H.; Tan, Y.; Zhao, B.; Zhang, H. Tumor Progression and Treatment-Related Changes: Radiological Diagnosis Challenges for the Evaluation of Post Treated Glioma. Cancers 2022, 14, 3771. [Google Scholar] [CrossRef]
- Garcia-Ruiz, A.; Naval-Baudin, P.; Ligero, M.; Pons-Escoda, A.; Bruna, J.; Plans, G.; Calvo, N.; Cos, M.; Majós, C.; Perez-Lopez, R. Precise enhancement quantification in post-operative MRI as an indicator of residual tumor impact is associated with survival in patients with glioblastoma. Sci. Rep. 2021, 11, 695. [Google Scholar] [CrossRef]
- Kuhnt, D.; Becker, A.; Ganslandt, O.; Bauer, M.; Buchfelder, M.; Nimsky, C. Correlation of the extent of tumor volume resection and patient survival in surgery of glioblastoma multiforme with high-field intraoperative MRI guidance. Neuro Oncol. 2011, 13, 1339–1348. [Google Scholar] [CrossRef]
- Suchorska, B.; Weller, M.; Tabatabai, G.; Senft, C.; Hau, P.; Sabel, M.C.; Herrlinger, U.; Ketter, R.; Schlegel, U.; Marosi, C.; et al. Complete resection of contrast-enhancing tumor volume is associated with improved survival in recurrent glioblastoma—Results from the DIRECTOR trial. Neuro Oncol. 2016, 18, 549–556. [Google Scholar] [CrossRef]
- White, M.L.; Zhang, Y.; Yu, F.; Shonka, N.; Aizenberg, M.R.; Adapa, P.; Kazmi, S.A.J. Post-operative perfusion and diffusion MR imaging and tumor progression in high-grade gliomas. PLoS ONE 2019, 14, e0213905. [Google Scholar] [CrossRef] [Green Version]
- Booth, T.C.; Luis, A.; Brazil, L.; Thompson, G.; Daniel, R.A.; Shuaib, H.; Ashkan, K.; Pandey, A. Glioblastoma post-operative imaging in neuro-oncology: Current UK practice (GIN CUP study). Eur. Radiol. 2021, 31, 2933–2943. [Google Scholar] [CrossRef] [PubMed]
- Mrowczynski, O.D.; Zammar, S.; Bourcier, A.J.; Langan, S.T.; Liao, J.; Specht, C.S.; Rizk, E.B. Utility of Early Postoperative Magnetic Resonance Imaging After Glioblastoma Resection: Implications on Patient Survival. World Neurosurg. 2018, 120, e1171–e1174. [Google Scholar] [CrossRef] [PubMed]
- Albert, F.K.; Forsting, M.; Sartor, K.; Adams, H.P.; Kunze, S. Early Postoperative Magnetic Resonance Imaging after Resection of Malignant Glioma: Objective Evaluation of Residual Tumor and Its Influence on Regrowth and Prognosis. Neurosurgery 1994, 34, 45–61. Available online: http://journals.lww.com/00006123-199401000-00008 (accessed on 25 June 2021). [CrossRef] [PubMed]
- Sato, N.; Abronen, R.; Sze, G.; Kawamura, Y.; Coughlin, W.; Putman, C.M.; Spencer, D.D. Postoperative changes in the brain: MR imaging findings in patients without neoplasms. Radiology 1997, 204, 839–846. Available online: http://pubs.rsna.org/doi/10.1148/radiology.204.3.9280269 (accessed on 25 June 2021). [CrossRef]
- Henegar, M.M.; Moran, C.J.; Silbergeld, D.L. Early postoperative magnetic resonance imaging following nonneoplastic cortical resection. J. Neurosurg. 1996, 84, 174–179. [Google Scholar] [CrossRef]
- Sui, Z.; Zhang, X.; Li, H.; Xu, D.; Li, G. Magnetic resonance imaging evaluation of brain glioma before postoperative radiotherapy. Clin. Transl. Oncol. 2021, 23, 820–826. [Google Scholar] [CrossRef]
- Masuda, Y.; Akutsu, H.; Ishikawa, E.; Matsuda, M.; Masumoto, T.; Hiyama, T.; Yamamoto, T.; Kohzuki, H.; Takano, S.; Matsumura, A. Evaluation of the extent of resection and detection of ischemic lesions with intraoperative MRI in glioma surgery: Is intraoperative MRI superior to early postoperative MRI? J. Neurosurg. 2019, 131, 209–216. [Google Scholar] [CrossRef]
- Wen, P.Y.; Macdonald, D.R.; Reardon, D.A.; Cloughesy, T.F.; Sorensen, A.G.; Galanis, E.; DeGroot, J.; Wick, W.; Gilbert, M.R.; Lassman, A.B.; et al. Updated response assessment criteria for high-grade gliomas: Response assessment in neuro-oncology working group. J. Clin. Oncol. 2010, 28, 1963–1972. [Google Scholar] [CrossRef]
- Rykkje, A.M.; Li, D.; Skjøth-Rasmussen, J.; Larsen, V.A.; Nielsen, M.B.; Hansen, A.E.; Carlsen, J.F. Surgically induced contrast enhancements on intraoperative and early postoperative MRI following high-grade glioma surgery: A systematic review. Diagnostics 2021, 11, 1344. [Google Scholar] [CrossRef]
- Aprile, I.; Armadori, M.; Conti, G.; Ottaviano, I.; Ranaldi, A.; Ottaviano, P. MR Perfusion Imaging of Intracranial Tumors. A Retrospective Study of 218 Patients. Neuroradiol. J. 2008, 21, 472–489. Available online: www.centauro.it (accessed on 16 March 2021). [CrossRef]
- Lindner, T.; Ahmeti, H.; Juhasz, J.; Helle, M.; Jansen, O.; Synowitz, M.; Ulmer, S. A comparison of arterial spin labeling and dynamic susceptibility perfusion imaging for resection control in glioblastoma surgery. Oncotarget 2018, 9, 18570. Available online: www.oncotarget.com (accessed on 16 March 2021). [CrossRef] [PubMed]
- Ulmer, S.; Helle, M.; Jansen, O.; Mehdorn, H.M.; Nabavi, A. Intraoperative dynamic susceptibility contrast weighted magnetic resonance imaging (iDSC-MRI)—Technical considerations and feasibility. Neuroimage 2009, 45, 38–43. [Google Scholar] [CrossRef] [PubMed]
- Arvinda, H.R.; Kesavadas, C.; Sarma, P.S.; Thomas, B.; Radhakrishnan, V.V.; Gupta, A.K.; Kapilamoorthy, T.R.; Nair, S. Glioma grading: Sensitivity, specificity, positive and negative predictive values of diffusion and perfusion imaging. J. Neurooncol. 2009, 94, 87–96. [Google Scholar] [CrossRef] [PubMed]
- Majós, C.; Cos, M.; Castañer, S.; Gil, M.; Plans, G.; Lucas, A.; Bruna, J.; Aguilera, C. Early post-operative magnetic resonance imaging in glioblastoma: Correlation among radiological findings and overall survival in 60 patients. Eur. Radiol. 2016, 26, 1048–1055. [Google Scholar] [CrossRef]
- Bette, S.; Gempt, J.; Huber, T.; Boeckh-Behrens, T.; Ringel, F.; Meyer, B.; Zimmer, C.; Kirscheke, J.S. Patterns and Time Dependence of Unspecific Enhancement in Postoperative Magnetic Resonance Imaging After Glioblastoma Resection. World Neurosurg. 2016, 90, 440–447. Available online: https://linkinghub.elsevier.com/retrieve/pii/S1878875016004502 (accessed on 24 May 2021). [CrossRef]
- Kong, D.S.; Kim, S.T.; Kim, E.H.; Lim, D.H.; Kim, W.S.; Suh, Y.L.; Nam, D.H. Diagnostic Dilemma of Pseudoprogression in the Treatment of Newly Diagnosed Glioblastomas: The Role of Assessing Relative Cerebral Blood Flow Volume and Oxygen-6-Methylguanine-DNA Methyltransferase Promoter Methylation Status. Am. J. Neuroradiol. 2011, 32, 382–387. [Google Scholar] [CrossRef]
- Neska-matuszewska, M.; Bladowska, J.; Marek, S.; Zimny, A. Differentiation of glioblastoma multiforme, metastases and primary central nervous system lymphomas using multiparametric perfusion and diffusion MR imaging of a tumor core and a peritumoral zone—Searching for a practical approach. PLoS ONE 2018, 13, e0191341. [Google Scholar] [CrossRef]
- Fei, Q.; Qian, L.-X.; Zhang, Y.-J.; Guo, W.-J.; Bian, X.-H.; Yin, L.; Yan, P.-W.; Wang, T.-T.; Qian, P.-D.; Guo, Z.; et al. The Utility of Diffusion and Perfusion Magnetic Resonance Imaging in Target Delineation of High-Grade Gliomas. Biomed Res. Int. 2020, 2020, 8718097. [Google Scholar] [CrossRef]
- Durand-Muñoz, C.; Flores-Alvarez, E.; Moreno-Jimenez, S.; Roldan-Valadez, E. Pre-operative apparent diffusion coefficient values and tumour region volumes as prognostic biomarkers in glioblastoma: Correlation and progression-free survival analyses. Insights Imaging 2019, 10, 36. [Google Scholar] [CrossRef]
- Strand, P.S.; Berntsen, E.M.; Fyllingen, E.H.; Sagberg, L.M.; Reinertsen, I.; Gulati, S. Brain infarctions after glioma surgery: Prevalence, radiological characteristics and risk factors. Acta Neurochir. 2021, 163, 3097–3108. [Google Scholar] [CrossRef]
- Bette, S.; Gempt, J.; Wiestler, B.; Huber, T.; Specht, H.; Meyer, B.; Zimmer, C.; Kirschke, J.S.; Boeckh-Behrens, T. Increase in FLAIR Signal of the Fluid Within the Resection Cavity as Early Recurrence Marker: Also Valid for Brain Metastases? RöFo—Fortschr. Geb. Röntgenstrahlen Bildgeb. Verfahr. 2016, 189, 63–70. [Google Scholar] [CrossRef] [PubMed]
- Forsyth, P.A.J.; Petrov, E.; Mahallati, H.; Cairncross, J.G.; Brasher, P.; Macrae, M.E.; Hagen, N.A.; Barnes, P.; Sevick, R.J. Prospective Study of Postoperative Magnetic Resonance Imaging in Patients With Malignant Gliomas. J. Clin. Oncol. 1997, 13, 2076–2081. [Google Scholar] [CrossRef] [PubMed]
- Miskin, N.; Unadkat, P.; Carlton, M.E.; Golby, A.J.; Young, G.S.; Huang, R.Y. Frequency and evolution of new postoperative enhancement on 3 Tesla intraoperative and early postoperative magnetic resonance imaging. Neurosurgery 2020, 87, 238–246. [Google Scholar] [CrossRef]
- Ulmer, S. Intraoperative perfusion magnetic resonance imaging: Cutting-edge improvement in neurosurgical procedures. World J. Radiol. 2014, 6, 538. Available online: http://www.wjgnet.com/1949-8470/full/v6/i8/538.htm (accessed on 6 November 2021). [CrossRef]
- Toh, C.H.; Castillo, M. Early-Stage Glioblastomas: MR Imaging—Based Classification and Imaging Evidence of Progressive Growth. Am. J. Neuroradiol. 2017, 38, 288–293. [Google Scholar] [CrossRef] [PubMed]
- Meyding-Lamadé, U.; Forsting, M.; Albert, F.; Kunze, S.; Sartor, K. Accelerated methaemoglobin formation: Potential pitfall in early postoperative MRI. Neuroradiology 1993, 35, 178–180. [Google Scholar] [CrossRef]
- Belhawi, S.M.; Hoefnagels, F.W.; Baaijen, J.C.; Aliaga, E.S.; Reijneveld, J.C.; Heimans, J.J.; Barkhof, F.; Vandertop, W.P.; Hamer, P.C. Early postoperative MRI overestimates residual tumour after resection of gliomas with no or minimal enhancement. Eur. Radiol. 2011, 21, 1526–1534. [Google Scholar] [CrossRef]
- Hegi, M.E.; Diserens, A.-C.; Gorlia, T.; Hamou, M.-F.; De Tribolet, N.; Weller, M.; Kros, J.M.; Hainfellner, J.A.; Mason, W.; Mariani, L.; et al. MGMT Gene Silencing and Benefit from Temozolomide in Glioblastoma. N. Engl. J. Med. 2005, 352, 997–1003. Available online: http://www.nejm.org/doi/abs/10.1056/NEJMoa043331 (accessed on 25 June 2021). [CrossRef]
- Wick, W.; Platten, M.; Meisner, C.; Felsberg, J.; Tabatabai, G.; Simon, M.; Nikkhah, G.; Papsdorf, K.; Steinbach, J.P.; Sabel, M.; et al. Temozolomide chemotherapy alone versus radiotherapy alone for malignant astrocytoma in the elderly: The NOA-08 randomised, phase 3 trial. Lancet Oncol. 2012, 13, 707–715. Available online: https://linkinghub.elsevier.com/retrieve/pii/S147020451270164X (accessed on 28 February 2022). [CrossRef] [Green Version]


| TOT | ≤48 h | >48 h | p-Value | |
|---|---|---|---|---|
| Sample | 139 (100%) | 71 (51.1%) | 68 (48.9%) | p = 0.31 |
| Age (SD) | 59.2 (13.9) | 63.5 (11.4) | 54.6 (14.9) | p = 0.01 |
| Female | 46/139 (33.1%) | 27/71 (58.7%) | 19/68 (41.3%) | p = 0.11 |
| Male | 93/139 (61.2%) | 41/71 (44.1%) | 52/68 (55.9%) |
| TOT | ≤48 h | >48 h | p-Value | |
|---|---|---|---|---|
| MRIs | 139 (100%) | 71 (56.0%) | 68 (44.0%) | |
| Reactive enhancement | 33/139 | 9 | 24 | p = 0.02 |
| Nodular enhancement | 106/139 | 62 | 44 | |
| Ground Truth | TOT or Mean (SD) | ≤48 h | >48 h | p-value |
| 6-month MRI relapse | 125/139 | 60 | 65 | p = 0.12 |
| Gross total surgery | 104/139 | 55 | 54 | p = 0.41 |
| MGMT methylation | 57/139 | 32 | 25 | p = 0.26 |
| ADC estimable | 99/139 | 57 | 42 | |
| ADC Value | 0.90 (SD = 0.33) | 1.02 (SD = 0.36) | 0.74 (SD = 0.20) | p < 0.01 |
| ADC not estimable | 40/139 | 14 | 26 | p = 0.02 |
| rCBV estimable | 118/139 | 65 | 53 | |
| rCBV white matter | 147.8 (SD = 104.8) | 151.1 (SD = 110.3) | 143.3 (SD = 96.9) | p = 0.36 |
| rCBV ratio value | 2.31 (SD = 1.08) | 2.09 (SD = 0.79) | 2.56 (SD = 0.18) | p < 0.01 |
| rCBV not estimable | 21/139 | 6 | 15 | p = 0.03 |
Disclaimer/Publisher’s Note: The statements, opinions and data contained in all publications are solely those of the individual author(s) and contributor(s) and not of MDPI and/or the editor(s). MDPI and/or the editor(s) disclaim responsibility for any injury to people or property resulting from any ideas, methods, instructions or products referred to in the content. |
© 2023 by the authors. Licensee MDPI, Basel, Switzerland. This article is an open access article distributed under the terms and conditions of the Creative Commons Attribution (CC BY) license (https://creativecommons.org/licenses/by/4.0/).
Share and Cite
Negroni, D.; Bono, R.; Soligo, E.; Longo, V.; Cossandi, C.; Carriero, A.; Stecco, A. T1-Weighted Contrast Enhancement, Apparent Diffusion Coefficient, and Cerebral-Blood-Volume Changes after Glioblastoma Resection: MRI within 48 Hours vs. beyond 48 Hours. Tomography 2023, 9, 342-351. https://doi.org/10.3390/tomography9010027
Negroni D, Bono R, Soligo E, Longo V, Cossandi C, Carriero A, Stecco A. T1-Weighted Contrast Enhancement, Apparent Diffusion Coefficient, and Cerebral-Blood-Volume Changes after Glioblastoma Resection: MRI within 48 Hours vs. beyond 48 Hours. Tomography. 2023; 9(1):342-351. https://doi.org/10.3390/tomography9010027
Chicago/Turabian StyleNegroni, Davide, Romina Bono, Eleonora Soligo, Vittorio Longo, Christian Cossandi, Alessandro Carriero, and Alessandro Stecco. 2023. "T1-Weighted Contrast Enhancement, Apparent Diffusion Coefficient, and Cerebral-Blood-Volume Changes after Glioblastoma Resection: MRI within 48 Hours vs. beyond 48 Hours" Tomography 9, no. 1: 342-351. https://doi.org/10.3390/tomography9010027