

Facts to Consider in Developing Materials That Emulate the Upper Jawbone: A Microarchitecture Study Showing Unique Characteristics at Four Different Sites


Abstract
:1. Introduction
2. Materials and Methods
3. Results
4. Discussion
5. Conclusions
Author Contributions
Funding
Institutional Review Board Statement
Informed Consent Statement
Data Availability Statement
Acknowledgments
Conflicts of Interest
References
- Cheah, C.W.; Al-Namnam, N.M.; Lau, M.N.; Lim, G.S.; Raman, R.; Fairbairn, P.; Ngeow, W.C. Synthetic Material for Bone, Periodontal, and Dental Tissue Regeneration: Where Are We Now, and Where Are We Heading Next? Materials 2021, 14, 6123. [Google Scholar] [CrossRef]
- Labrés, X.R.; Camps, À.R.; Salas, E.J.; Alburquerque, R.; Ortega, E.V.; López, J.L. Graft materials in oral surgery: Revision. Biomim. Biomater. Tissue Eng. 2014, 19, 150–154. [Google Scholar]
- Misch, C.M. Autogenous Bone is Still the Gold Standard of Graft Materials in 2022; The American Academy of Implant Dentistry: Chicago, IL, USA, 2022; Volume 48, pp. 169–170. [Google Scholar]
- Wu, Y.; Chen, R.; Chen, X.; Yang, Y.; Qiao, J.; Liu, Y. Development of Strong and Tough β-TCP/PCL Composite Scaffolds with Interconnected Porosity by Digital Light Processing and Partial Infiltration. Materials 2023, 16, 947. [Google Scholar] [CrossRef]
- Zins, J.E.; Whitaker, L.A.; Enlow, D.H. Membranous versus endochondral bone: Implications for craniofacial reconstruction. Plast. Reconstr. Surg. 1983, 72, 785. [Google Scholar] [CrossRef]
- Sàndor, G.K.; Nish, I.A.; Carmichael, R.P. Comparison of conventional surgery with motorized trephine in bone harvest from the anterior iliac crest. Oral Surg. Oral Med. Oral Pathol. Oral Radiol. Endodontology 2003, 95, 150–155. [Google Scholar] [CrossRef]
- Borstlap, W.A.; Heidbuchel, K.L.; Freihofer, H.P.M.; Kuijpers-Jagtman, A.M. Early secondary bone grafting of alveolar cleft defects: A comparison between chin and rib grafts. J. Cranio-Maxillofac. Surg. 1990, 18, 201–205. [Google Scholar] [CrossRef]
- Misch, C.M. Comparison of intraoral donor sites for onlay grafting prior to implant placement. Int. J. Oral Maxillofac. Implant. 1997, 12, 767–776. [Google Scholar]
- Bassil, J.; Abi Sleiman, A.; Mrad, S.; Noujeim, Z. The Zygomatic Buttress as an Efficient Intraoral Donor Site for Limited Maxillary Reconstructions: A Case Series and Brief Literature Review. Case Rep. Dent. 2021, 2021, 5539185. [Google Scholar] [CrossRef] [PubMed]
- Abdeltawab, A.R.; Dahaba, M.; Belal, S. Volumetric and linear assessment of maxillary, mandibular and zygomatic bone as donor sites for alveolar ridge augmentation using CBCT: A cross sectional study. Int. J. Health Sci. 2022, 6 (Suppl. S4), 1185–1193. [Google Scholar] [CrossRef]
- Emodi, O.; Nseir, S.; Shilo, D.; Srouji, H.; Rachmiel, A. Antral Wall Approach for Reconstruction of Orbital Floor Fractures Using Anterior Maxillary Sinus Bone Grafts. J. Craniofacial Surg. 2018, 29, e421–e426. [Google Scholar] [CrossRef]
- Hwang, J.W.; Han, M.S.; Kang, S.H.; Kwak, J.W.; Kim, H.K.; Kim, T.H.; Lee, S.H. Long-term outcomes of nasoseptal perforation repair using anterior maxillary sinus wall as an interpositional graft. Am. J. Rhinol. Allergy 2022, 36, 238–244. [Google Scholar] [CrossRef] [PubMed]
- Cho, Y.S.; Hwang, K.G.; Park, C.J. Postoperative effects of anterior nasal spine bone harvesting on overall nasal shape. Clin. Oral Implant. Res. 2013, 24, 618–622. [Google Scholar] [CrossRef] [PubMed]
- Mayordomo, R.B.; Martínez, R.G.; Alfaro, F.H. The anterior maxilla as a potential source of bone grafts: A morphometric cone beam computed tomography analysis of different anatomical areas. Int. J. Oral Maxillofac. Surg. 2016, 45, 1049–1056. [Google Scholar] [CrossRef]
- Safi, Y.; Behzadi, S.; Shafizadeh, M.; Amid, R.; Kadkhodazadeh, M. CBCT Evaluation of the maxillary palatine process as a donor site for the regeneration of periodontal defects. J. Adv. Periodontol. Implant. Dent. 2022, 14, 20. [Google Scholar] [CrossRef]
- Joshi, S.; Desai, S.; Mudda, J.; Patil, V.; Mustafa, M. Estimation of height and width of bone in anterior hard palate as a donor site for autogenous bone graft using IOPA by long cone paralleling technique. Niger. J. Clin. Pract. 2020, 23, 1487. [Google Scholar] [PubMed]
- Misch, C.E.; Qu, Z.; Bidez, M.W. Mechanical properties of trabecular bone in the human mandible: Implications for dental implant treatment planning and surgical placement. J. Oral Maxillofac. Surg. 1999, 57, 700–706. [Google Scholar] [CrossRef]
- Burghardt, A.J.; Link, T.M.; Majumdar, S. High-resolution computed tomography for clinical imaging of bone microarchitecture. Clin. Orthop. Relat. Res. 2011, 469, 2179–2193. [Google Scholar] [CrossRef] [Green Version]
- Lee, J.H.; Kim, H.J.; Yun, J.H. Three-dimensional microstructure of human alveolar trabecular bone: A micro-computed tomography study. J. Periodontal Implant. Sci. 2017, 47, 20–29. [Google Scholar] [CrossRef] [Green Version]
- Misch, C.E. Contemporary Implant Dentistry; Elsevier Health Sciences: New York, NY, USA, 2007. [Google Scholar]
- Müller, R.; Van Campenhout, H.; Van Damme, B.; Van der Perre, G.; Dequeker, J.; Hildebrand, T.; Rüegsegger, P. Morphometric analysis of human bone biopsies: A quantitative structural comparison of histological sections and micro-computed tomography. Bone 1998, 23, 59–66. [Google Scholar] [CrossRef]
- Giesen, E.; Van Eijden, T. The three-dimensional cancellous bone architecture of the human mandibular condyle. J. Dent. Res. 2000, 79, 957–963. [Google Scholar] [CrossRef]
- Moon, H.-S.; Won, Y.-Y.; Kim, K.-D.; Ruprecht, A.; Kim, H.-J.; Kook, H.-K.; Chung, M.-K. The three-dimensional microstructure of the trabecular bone in the mandible. Surg. Radiol. Anat. 2004, 26, 466–473. [Google Scholar] [CrossRef] [PubMed] [Green Version]
- Kato, Y.; Kizu, Y.; Tonogi, M.; Ide, Y.; Yamane, G.-Y. Internal structure of zygomatic bone related to zygomatic fixture. J. Oral Maxillofac. Surg. 2005, 63, 1325–1329. [Google Scholar] [CrossRef]
- Siddiqi, A.; Kieser, J.A.; De Silva, R.K.; McNaughton, A.; Zafar, S.; Duncan, W.J. Trabecular bone microarchitecture in the median palate and maxillary premolar alveolar sites of edentulous elderly cadavers. J. Oral Maxillofac. Surg. 2013, 71, 1852.e1–1852.e11. [Google Scholar] [CrossRef] [PubMed]
- Ulm, C.; Tepper, G.; Blahout, R.; Rausch-Fan, X.; Hienz, S.; Matejka, M. Characteristic features of trabecular bone in edentulous mandibles. Clin. Oral Implant. Res. 2009, 20, 594–600. [Google Scholar] [CrossRef] [PubMed]
- Blok, Y.; Gravesteijn, F.; Van Ruijven, L.; Koolstra, J. Micro-architecture and mineralization of the human alveolar bone obtained with microCT. Arch. Oral Biol. 2013, 58, 621–627. [Google Scholar] [CrossRef]
- Kim, J.E.; Shin, J.M.; Oh, S.O.; Yi, W.J.; Heo, M.S.; Lee, S.S.; Choi, S.C.; Huh, K.H. The three-dimensional microstructure of trabecular bone: Analysis of site-specific variation in the human jaw bone. Imaging Sci. Dent. 2013, 43, 227–233. [Google Scholar] [CrossRef] [Green Version]
- González-García, R.; Monje, F. Is micro-computed tomography reliable to determine the microstructure of the maxillary alveolar bone? Clin. Oral Implant. Res. 2013, 24, 730–737. [Google Scholar] [CrossRef]
- Kim, Y.J.; Henkin, J. Micro-computed tomography assessment of human alveolar bone: Bone density and three-dimensional micro-architecture. Clin. Implant. Dent. Relat. Res. 2015, 17, 307–313. [Google Scholar] [CrossRef]
- Bertl, K.; Heimel, P.; Rökl-Riegler, M.; Hirtler, L.; Ulm, C.; Zechner, W. MicroCT-based evaluation of the trabecular bone quality of different implant anchorage sites for masticatory rehabilitation of the maxilla. J. Cranio-Maxillofac. Surg. 2015, 43, 961–968. [Google Scholar] [CrossRef]
- Parsa, A.; Ibrahim, N.; Hassan, B.; van der Stelt, P.; Wismeijer, D. Bone quality evaluation at dental implant site using multislice CT, micro-CT, and cone beam CT. Clin. Oral Implant. Res. 2015, 26, e1–e7. [Google Scholar] [CrossRef]
- Kim, J.-E.; Yi, W.-J.; Heo, M.-S.; Lee, S.-S.; Choi, S.-C.; Huh, K.-H. Three-dimensional evaluation of human jaw bone microarchitecture: Correlation between the microarchitectural parameters of cone beam computed tomography and micro-computer tomography. Oral Surg. Oral Med. Oral Pathol. Oral Radiol. 2015, 120, 762–770. [Google Scholar] [CrossRef]
- Hsu, P.-Y.; Tsai, M.-T.; Wang, S.-P.; Chen, Y.-J.; Wu, J.; Hsu, J.-T. Cortical bone morphological and trabecular bone microarchitectural changes in the mandible and femoral neck of ovariectomized rats. PLoS ONE 2016, 11, e0154367. [Google Scholar] [CrossRef] [Green Version]
- Suttapreyasri, S.; Suapear, P.; Leepong, N. The accuracy of cone-beam computed tomography for evaluating bone density and cortical bone thickness at the implant site: Micro-computed tomography and histologic analysis. J. Craniofacial Surg. 2018, 29, 2026–2031. [Google Scholar] [CrossRef]
- Kulah, K.; Gulsahi, A.; Kamburoğlu, K.; Geneci, F.; Ocak, M.; Celik, H.H.; Ozen, T. Evaluation of maxillary trabecular microstructure as an indicator of implant stability by using 2 cone beam computed tomography systems and micro-computed tomography. Oral Surg. Oral Med. Oral Pathol. Oral Radiol. 2019, 127, 247–256. [Google Scholar] [CrossRef] [PubMed]
- Ibrahim, N.; Parsa, A.; Hassan, B.; van der Stelt, P.; Rahmat, R.A.; Ismail, S.M.; Aartman, I.H. Comparison of anterior and posterior trabecular bone microstructure of human mandible using cone-beam CT and micro CT. BMC Oral Health 2021, 21, 249. [Google Scholar] [CrossRef] [PubMed]
- Tabassum, A.; Chainchel Singh, M.K.; Ibrahim, N.; Ramanarayanan, S.; Mohd Yusof, M.Y.P. Quantifications of Mandibular Trabecular Bone Microstructure Using Cone Beam Computed Tomography for Age Estimation: A Preliminary Study. Biology 2022, 11, 1521. [Google Scholar] [CrossRef] [PubMed]
- Tayman, M.A.; Kamburoğlu, K.; Ocak, M.; Özen, D. Effect of different voxel sizes on the accuracy of CBCT measurements of trabecular bone microstructure: A comparative micro-CT study. Imaging Sci. Dent. 2022, 52, 171. [Google Scholar] [CrossRef] [PubMed]
- El-Gizawy, A.S.; Ma, X.; Pfeiffer, F.; Schiffbauer, J.D.; Selly, T. Characterization of Microarchitectures, Stiffness and Strength of Human Trabecular Bone Using Micro-Computed Tomography (Micro-CT) Scans. BioMed 2023, 3, 89–100. [Google Scholar] [CrossRef]
- Al-Khatib, A.; Rajion, Z.; Masudi, S.; Hassan, R.; Anderson, P.; Townsend, G. Tooth size and dental arch dimensions: A stereophotogrammetric study in Southeast Asian Malays. Orthod. Craniofacial Res. 2011, 14, 243–253. [Google Scholar] [CrossRef]
- Lim, E.L.; Ngeow, W.C.; Lim, D. The implications of different lateral wall thicknesses on surgical access to the maxillary sinus. Braz. Oral Res. 2017, 31, e97. [Google Scholar] [CrossRef] [Green Version]
- Hassani, A.; Khojasteh, A.; Shamsabad, A.N. The anterior palate as a donor site in maxillofacial bone grafting: A quantitative anatomic study. J. Oral Maxillofac. Surg. 2005, 63, 1196–1200. [Google Scholar] [CrossRef]
- Carter, D.R.; Spengler, D.M. Mechanical properties and composition of cortical bone. Clin. Orthop. Relat. Res. (1976–2007) 1978, 135, 192–217. [Google Scholar] [CrossRef]
- Parfitt, A.M.; Drezner, M.K.; Glorieux, F.H.; Kanis, J.A.; Malluche, H.; Meunier, P.J.; Ott, S.M.; Recker, R.R. Bone histomorphometry: Standardization of nomenclature, symbols, and units: Report of the ASBMR Histomorphometry Nomenclature Committee. J. Bone Miner. Res. 1987, 2, 595–610. [Google Scholar] [CrossRef] [PubMed]
- Cömert, A.; Kökat, A.M.; Akkocaoğlu, M.; Tekdemir, İ.; Akça, K.; Çehreli, M.C. Fresh-frozen vs. embalmed bone: Is it possible to use formalin-fixed human bone for biomechanical experiments on implants? Clin. Oral Implant. Res. 2009, 20, 521–525. [Google Scholar] [CrossRef]
- Holm, M.A.; Iaizzo, P.A. Importance of Human Cadaver Studies in Education and Medical Device Research: Insights Derived from Various Imaging Studies and Modalities. In Engineering in Medicine; Elsevier: Amsterdam, The Netherlands, 2019; pp. 255–280. [Google Scholar]
- Viidik, A.; Lewin, T. Changes in tensile strength characteristics and histology of rabbit ligaments induced by different modes of postmortal storage. Acta Orthop. Scand. 1966, 37, 141–155. [Google Scholar] [CrossRef] [Green Version]
- Kivovics, M.; Szabó, B.T.; Németh, O.; Tari, N.; Dőri, F.; Nagy, P.; Dobó-Nagy, C.; Szabó, G. Microarchitectural study of the augmented bone following ridge preservation with a porcine xenograft and a collagen membrane: Preliminary report of a prospective clinical, histological, and micro-computed tomography analysis. Int. J. Oral Maxillofac. Surg. 2017, 46, 250–260. [Google Scholar] [CrossRef] [PubMed]
- Trimmel, B.; Gyulai-Gaál, S.; Kivovics, M.; Jákob, N.P.; Hegedűs, C.; Szabó, B.T.; Dobó-Nagy, C.; Szabó, G. Evaluation of the histomorphometric and micromorphometric performance of a serum albumin-coated bone allograft combined with A-PRF for early and conventional healing protocols after maxillary sinus augmentation: A randomized clinical trial. Materials 2021, 14, 1810. [Google Scholar] [CrossRef] [PubMed]
- Vasconcellos, L.M.R.D.; Leite, D.O.; Oliveira, F.N.D.; Carvalho, Y.R.; Cairo, C.A.A. Evaluation of bone ingrowth into porous titanium implant: Histomorphometric analysis in rabbits. Braz. Oral Res. 2010, 24, 399–405. [Google Scholar] [CrossRef] [PubMed] [Green Version]
- Hildebrand, T.; Rüegsegger, P. Quantification of bone microarchitecture with the structure model index. Comput. Methods Biomech. Bio Med. Eng. 1997, 1, 15–23. [Google Scholar] [CrossRef]
- Singh, I. The architecture of cancellous bone. J. Anat. 1978, 127, 305. [Google Scholar] [PubMed]
- Goodchild, S.; Black, D.S.; Cunningham, C. A Qualitative and Quantitative Analysis of the Developing Human Lumbar Vertebral Column. Ph.D. Thesis, University of Dundee, Dundee, UK, 2019. [Google Scholar]
- Ngeow, W.C.; Lim, D.; Tan, C.C.; Shetty, N.; Marla, V. 14-Dental Implant modifications for medically compromised patients. In Dental Implants: Materials, Coatings, Surface Modifications and Interfaces with Oral Tissues; Series in Biomaterials; Woodhead Publishing: Cambridge, UK, 2020; pp. 255–286. [Google Scholar]
- Fanuscu, M.I.; Chang, T.L. Three-dimensional morphometric analysis of human cadaver bone: Microstructural data from maxilla and mandible. Clin. Oral Implant. Res. 2004, 15, 213–218. [Google Scholar] [CrossRef] [PubMed]


| Abbreviation | Variable | Description | Standard Unit |
|---|---|---|---|
| TV | Total volume | Volume of the entire region of interest | mm3 |
| BV | Bone volume | Volume of the region segmented as bone | mm3 |
| BV/TV | Bone volume fraction | Ratio of the segmented bone volume to the total volume of the region of interest | % |
| Tb.N | Trabecular number | Measure of the average number of trabeculae per unit length | mm−1 |
| Tb.Th | Trabecular thickness | Mean thickness of trabeculae, assessed using direct 3D methods | mm |
| Tb.Sp | Trabecular separation | Mean distance between trabeculae, assessed using direct 3D methods | mm |
| SMI | Structure model index | An indicator of the structure of trabeculae | none |
| Donor Site | Mean ± SD | Minimum | Maximum | F | p-Value |
|---|---|---|---|---|---|
| Tissue Volume (mm3) | 1.310 | 0.304 | |||
| ZYGOMA | 102.07 ± 52.83 | 27.21 | 199.57 | ||
| AMSW | 76.31 ± 31.92 | 49.09 | 135.50 | ||
| AP | 83.56 ± 26.79 | 51.09 | 113.23 | ||
| ANS | 50.96 ± 24.63 | 27.21 | 76.38 | ||
| Overall | 82.1 ± 38.32 | 27.21 | 199.57 | ||
| Bone Volume (mm3) | 2.959 | 0.062 | |||
| ZYGOMA | 58.98 ± 29.17 | 23.25 | 93.17 | ||
| AMSW | 44.31 ± 13.48 | 29.23 | 64.21 | ||
| AP | 37.37 ± 12.09 | 23.27 | 51.47 | ||
| ANS | 21.29 ± 8.08 | 15.03 | 30.40 | ||
| Overall | 43.23 ± 21.41 | 15.03 | 93.17 | ||
| Bone Volume/Tissue Volume (%) | 2.179 | 0.128 | |||
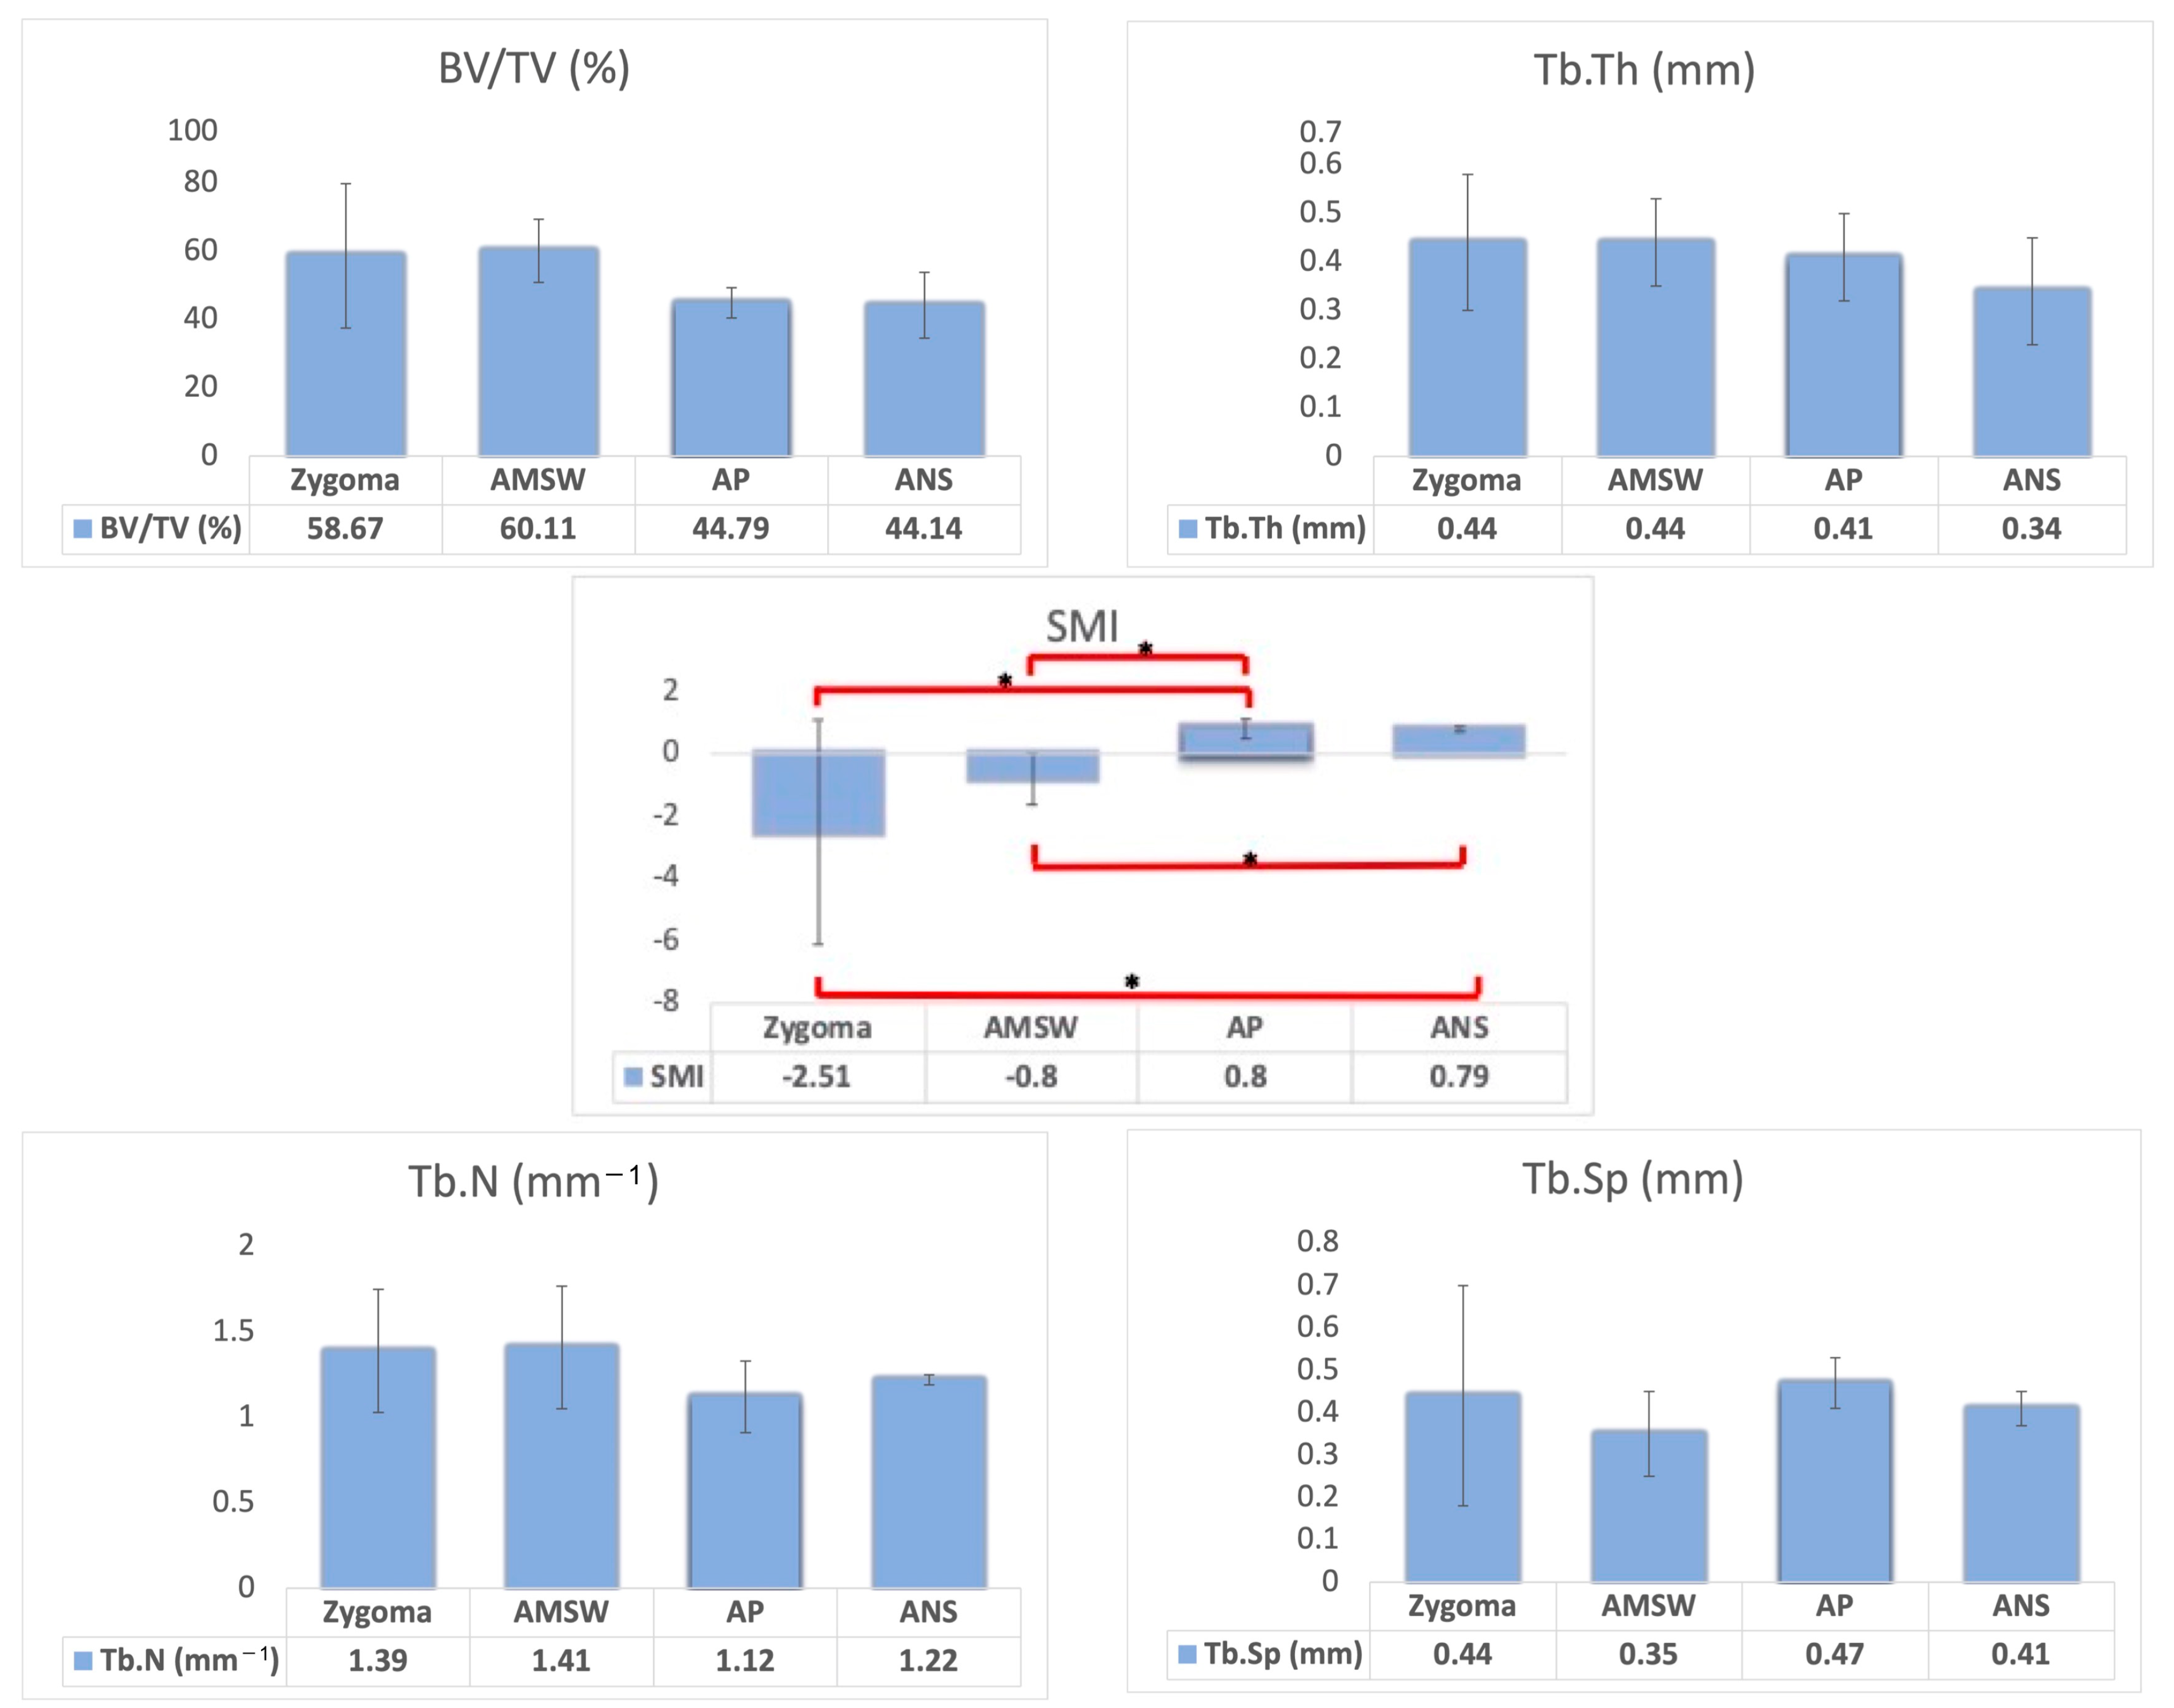
| ZYGOMA | 58.67 ± 21.16 | 38.59 | 85.83 | ||
| AMSW | 60.11 ± 9.30 | 47.38 | 70.01 | ||
| AP | 44.79 ± 4.43 | 38.38 | 52.08 | ||
| ANS | 44.14 ± 9.68 | 37.38 | 55.23 | ||
| Overall | 53.04 ±14.31 | 37.38 | 85.83 | ||
| Structural Model Index | 3.248 | 0.048 * | |||
| ZYGOMA | −2.51 ± 3.60 | −7.11 | 0.46 | ||
| AMSW | −0.80 ± 0.83 | −1.47 | 0.52 | ||
| AP | 0.80 ± 0.31 | 0.46 | 1.27 | ||
| ANS | 0.79 ± 0.14 | 0.63 | 0.87 | ||
| Overall | −0.63 ± 2.33 | −7.11 | 1.27 | ||
| Trabecular Thickness (mm) | |||||
| ZYGOMA | 0.44 ± 0.14 | 0.25 | 0.57 | 0.669 | 0.583 |
| AMSW | 0.44 ± 0.09 | 0.33 | 0.56 | ||
| AP | 0.41 ± 0.09 | 0.27 | 0.53 | ||
| ANS | 0.34 ± 0.11 | 0.24 | 0.45 | ||
| Overall | 0.42 ± 0.11 | 0.24 | 0.57 | ||
| Trabecular Number (mm−1) | 1.238 | 0.327 | |||
| ZYGOMA | 1.39 ± 0.36 | 0.71 | 1.74 | ||
| AMSW | 1.41 ± 0.36 | 1.03 | 1.86 | ||
| AP | 1.12 ± 0.21 | 0.86 | 1.40 | ||
| ANS | 1.22 ± 0.03 | 1.19 | 1.23 | ||
| Overall | 1.29 ± 0.30 | 0.71 | 1.86 | ||
| Trabecular Separation (mm) | 0.692 | 0.570 | |||
| ZYGOMA | 0.44 ± 0.26 | 0.22 | 0.92 | ||
| AMSW | 0.35 ± 0.10 | 0.23 | 0.50 | ||
| AP | 0.47 ± 0.06 | 0.39 | 0.55 | ||
| ANS | 0.41 ± 0.04 | 0.39 | 0.46 | ||
| Overall | 0.42 ± 0.15 | 0.22 | 0.92 |
| Authors (Year) | Population | Mean Age (Range) | n */N ** | Method | Site(s) | Variable (If Any) | BV/TV (%) | Tb.N (1/mm) | Tb.Th (mm) | Tb.Sp (mm) |
|---|---|---|---|---|---|---|---|---|---|---|
| Muller et al., 1998 [21] | American | 68 ± 16 (23–92) | 70 | micro-CT | Transiliac bone | 14.48 ± 5.34 | - | 0.11 ± 0.02 | 0.77 ± 0.35 | |
| Giesen & Van Eijden, 2000 [22] | Dutch | 72.6 ± 11.2 (56–89) | 99 (11) | micro-CT | Condyles | 17.00 ± 5.00 | 1.66 ± 0.26 | 0.10 ± 0.02 | 0.52 ± 0.13 | |
| Moon et al., 2004 [23] | Korean | 55.1 (29–75) | 10 | micro-CT | Mandible (Alveolar Bone) | 43.74 ± 16.04 | 1.27 ± 0.24 | 0.31 ± 0.08 | 0.51 ± 0.14 | |
| Mandible (Basal Bone superior to mandibular canal) | 20.39 ± 6.45 | 0.90 ± 0.23 | 0.28 ± 0.09 | 0.88 ± 0.20 | ||||||
| Mandible (Basal Bone inferior to mandibular canal) | 9.24 ± 7.11 | 0.70 ± 0.20 | 0.22 ± 0.05 | 1.31 ± 0.42 | ||||||
| Kato et al., 2005 [24] | Japanese | 79.6 | 56 (28) | micro-CT | Jugale | 23.2 ± 4.3 | 0.16 ± 0.05 | 1.53 ± 0.48 | 0.56 ± 0.20 | |
| Middle point | 19.9 ± 5.4 | 0.15 ± 0.05 | 1.38 ± 0.33 | 0.62 ± 0.28 | ||||||
| Zygomaxillae | 20.5 ± 6.5 | 0.15 ± 0.06 | 1.49 ± 0.40 | 0.58 ± 0.20 | ||||||
| Siddiqi et al., 2013 [25] | New Zealander | 80 (65–94) | 16 | micro-CT | Median Palate | Palate | 42.9 ± 13.8 | 1.1 ± 0.3 | 0.4 ± 0.2 | 7.5 ± 4.7 |
| Maxillary Premolar | Premolar | 38.1 ± 12.5 | 1.0 ± 0.6 | 0.5 ± 0.3 | 8.1 ± 5.6 | |||||
| Ulm et al., 2009 [26] | Austrian | 77.58 ± 10.09 | 278 (128) | micro-CT | Mandible (lateral incisor) | Female | 30.70 ± 9.91 | 1.50 ± 0.34 | 0.19 ± 0.05 | 0.46 ± 0.14 |
| Male | 36.90 ± 12.40 | 1.77 ± 0.39 | 0.21 ± 0.06 | 0.38 ± 0.14 | ||||||
| Mandible (first premolar) | Female | 24.50 ± 8.45 | 1.47 ± 0.43 | 0.17 ± 0.04 | 0.57 ± 0.20 | |||||
| Male | 35.90 ± 13.62 | 1.58 ± 0.32 | 0.22 ± 0.06 | 0.82 ± 0.27 | ||||||
| Mandible (first molar) | Female | 20.90 ± 9.65 | 1.22 ± 0.37 | 0.17 ± 0.04 | 0.72 ± 0.28 | |||||
| Male | 24.50 ± 7.93 | 1.38 ± 0.30 | 0.17 ± 0.04 | 0.58 ± 0.18 | ||||||
| Blok et al., 2012 [27] | Dutch | 73.7 ± 12.5 | 10 | micro-CT | Maxilla | 24.0 ± 13.0 | 1.57 ± 0.56 | 0.20 ± 0.05 | 0.69 ± 0.24 | |
| Mandible | 37.0 ± 18.0 | 1.50 ± 0.42 | 0.29 ± 0.11 | 0.71 ± 0.25 | ||||||
| Kim et al., 2013 [28] | Korean | NA | 69 (4) | micro-CT | Anterior Maxilla | 21.35 ± 5.18 | 0.99 ± 0.23 | 0.22 ± 0.05 | 0.72 ± 0.16 | |
| Posterior Maxilla | 17.68 ± 6.21 | 0.89 ± 0.27 | 0.20 ± 0.07 | 0.79 ± 0.14 | ||||||
| Anterior Mandible | 23.87 ± 7.68 | 0.72 ± 0.312 | 0.33 ± 0.05 | 0.85 ± 0.13 | ||||||
| Posterior Mandible | 18.46 ± 9.44 | 0.78 ± 0.26 | 0.23 ± 0.07 | 0.82 ± 0.27 | ||||||
| González-García & Monje, 2013 [29] | Spanish | 51.56 ± 13.78 (20–79) | 52 (31) | micro-CT | Maxilla | 48.70 ± 17.85 | 2.19 ± 0.71 | 0.22 ± 0.06 | 0.31 ± 0.10 | |
| Kim & Henkin, 2015 [30] | American | NA | 34 (12) | micro-CT | Maxilla | 14.59 ± 7.68 | 2.07 ± 0.80 | 0.10 ± 0.02 | 0.63 ± 0.18 | |
| Mandible | 27.28 ± 10.19 | 3.76 ± 1.99 | 0.09 ± 0.02 | 0.42 ± 0.18 | ||||||
| Bertl et al., 2015 [31] | Austrian | NA | 36 (12) | micro-CT | Anterior Maxilla | 27.15 ± 7.90 | 1.051 ± 0.20 | 0.26 ± 0.04 | 0.59 ± 0.13 | |
| Posterior Maxilla | 13.54 ± 3.40 | 0.624 ± 0.14 | 0.22 ± 0.03 | 0.89 ± 0.14 | ||||||
| Zygoma | 26.79 ± 7.40 | 1.024 ± 0.20 | 0.26 ± 0.04 | 0.63 ± 0.13 | ||||||
| Parsa et al., 2015 [32] | Dutch | NA | 20 | micro-CT | Mandible | micro-CT | 32.35 ± 18.81 | - | - | - |
| CBCT | CBCT | 36.79 ± 23.17 | - | - | - | |||||
| Kim et al., 2015 [33] | Korean | NA | 68 (4) | micro-CT | Maxilla | Imaging Protocol | ||||
| Mandible | 19.37 µm | 18.53 ± 8.17 | 0.24 ± 0.07 | 0.77 ± 0.27 | 0.83 ± 0.17 | |||||
| 96.87 µm | 18.15 ± 8.60 | 0.38 ± 0.11 | 0.47 ± 0.17 | 0.95 ± 0.19 | ||||||
| Lee et al., 2017 [19] | Korean | 75.7 | 116 | micro-CT | Maxilla | Bone Density | ||||
| (67–96) | (30) | Mandible | D1 | 37.29 ± 17.96 | 1.21 ± 0.45 | 0.30 ± 0.08 | 0.59 ± 0.22 | |||
| D2 | 27.46 ± 9.58 | 0.99 ± 0.24 | 0.28 ± 0.06 | 0.68 ± 0.14 | ||||||
| D3 | 18.40 ± 10.20 | 0.71 ± 0.26 | 0.25 ± 0.05 | 0.82 ± 0.19 | ||||||
| D4 | 9.83 ± 8.02 | 0.41± 0.27 | 0.22 ± 0.06 | 1.20 ± 0.48 | ||||||
| Suttapreyasri et al., 2018 [35] | Thailand | >20 | 62 (41) | micro-CT | Maxilla | Location | ||||
| CBCT | Mandible | Anterior Maxilla | 35.23 ± 10.68 | - | - | - | ||||
| Posterior Maxilla | 36.11 ± 9.15 | - | - | - | ||||||
| Anterior Mandible | 63.25 ± 19.85 | - | - | - | ||||||
| Posterior Mandible | 46.74 ± 13.14 | - | - | - | ||||||
| Kulah et al., 2019 [36] | Turkish | NA | 17 | micro-CT | Maxilla | 32.65 ± 7.46 | 1.83 ± 0.05 | 0.28 ± 0.05 | 0.57 ± 0.13 | |
| Kivovics et al., 2020 [49] | Hungarian | 54.7 ± 6.5 | 16 (9) | micro-CT | Maxilla * Augmented sinus | micro-CT | 12.25 | - | 0.15 | 0.88 |
| CBCT | (grafted with allograft) | CBCT | 81.29 | - | 1.82 | 0.85 | ||||
| Ibrahim et al., 2021 [37] | Dutch | NA | 25 | micro-CT | Mandible | micro-CT | ||||
| Anterior Posterior | 0.008 ± 0.003 0.007 ± 0.004 | 0.005 ± 0.008 0.004 ± 0.001 | 0.007 ± 0.008 0.009 ± 0.001 | - - | ||||||
| CBCT | CBCT | |||||||||
| Anterior Posterior | 0.006 ± 0.002 0.005 ± 0.003 | 0.007 ± 0.002 0.006 ± 0.002 | 0.009 ± 0.003 0.010 ± 0.004 | - - | ||||||
| Tabassum et al., 2022 [38] | Malaysian | 26.6 ± 5.9 (22–43) | 20 | CBCT | Mandible | CBCT | 44.40 ± 14.77 | 0.44 ± 0.15 | 1.25 ± 0.55 | 2.05 ± 0.75 |
| Tayman et al., 2022 [39] | Turkey | NA | 12 | micro-CT CBCT | Posterior mandible | Micro CT (Std) Micro CT (Hi) CBCT (Std) CBCT (Hi) | 46.01 ± 8.48 44.28 ± 8.47 57.13 ± 11.10 54.45 ± 11.98 | 2.05 ± 0.46 2.04 ± 0.47 1.43 ± 0.25 1.43 ± 0.29 | 0.24 ± 0.06 0.23 ± 0.06 0.46 ± 0.09 0.44 ± 0.09 | 0.53 ± 0.11 0.51 ± 0.11 0.48 ± 0.12 0.46 ± 0.12 |
| El-Gizawy et al., 2023 [40] | USA | 21 | 4 (1) | micro-CT | Distal femoral condyle | 21.01 ± 4.72 | - | 1.25 ± 0.55 | 0.35 ± 0.03 | |
| Current study | Malaysian | Elderly | 49 (7) | micro-CT | Maxilla | Location | ||||
| Zygoma | 58.67 ± 21.16 | 1.39 ± 0.36 | 0.44 ± 0.14 | 0.44 ± 0.26 | ||||||
| AMSW | 60.11 ± 9.30 | 1.41 ± 0.36 | 0.44 ± 0.09 | 0.35 ± 0.10 | ||||||
| AP | 44.79 ± 4.43 | 1.12 ± 0.21 | 0.41 ± 0.09 | 0.47 ± 0.06 | ||||||
| ANS | 44.14 ± 9.68 | 1.22 ± 0.03 | 0.34 ± 0.11 | 0.41 ± 0.04 | ||||||
| Mean | 53.04 ±14.31 | 1.29 ± 0.30 | 0.42 ± 0.11 | 0.42 ± 0.15 |
Disclaimer/Publisher’s Note: The statements, opinions and data contained in all publications are solely those of the individual author(s) and contributor(s) and not of MDPI and/or the editor(s). MDPI and/or the editor(s) disclaim responsibility for any injury to people or property resulting from any ideas, methods, instructions or products referred to in the content. |
© 2023 by the authors. Licensee MDPI, Basel, Switzerland. This article is an open access article distributed under the terms and conditions of the Creative Commons Attribution (CC BY) license (https://creativecommons.org/licenses/by/4.0/).
Share and Cite
Lim, E.L.; Ngeow, W.C.; Kadir, K.; Naidu, M. Facts to Consider in Developing Materials That Emulate the Upper Jawbone: A Microarchitecture Study Showing Unique Characteristics at Four Different Sites. Biomimetics 2023, 8, 115. https://doi.org/10.3390/biomimetics8010115
Lim EL, Ngeow WC, Kadir K, Naidu M. Facts to Consider in Developing Materials That Emulate the Upper Jawbone: A Microarchitecture Study Showing Unique Characteristics at Four Different Sites. Biomimetics. 2023; 8(1):115. https://doi.org/10.3390/biomimetics8010115
Chicago/Turabian StyleLim, Ee Lian, Wei Cheong Ngeow, Kathreena Kadir, and Murali Naidu. 2023. "Facts to Consider in Developing Materials That Emulate the Upper Jawbone: A Microarchitecture Study Showing Unique Characteristics at Four Different Sites" Biomimetics 8, no. 1: 115. https://doi.org/10.3390/biomimetics8010115