
Exploration of the Design of Spiderweb-Inspired Structures for Vibration-Driven Sensing

Abstract
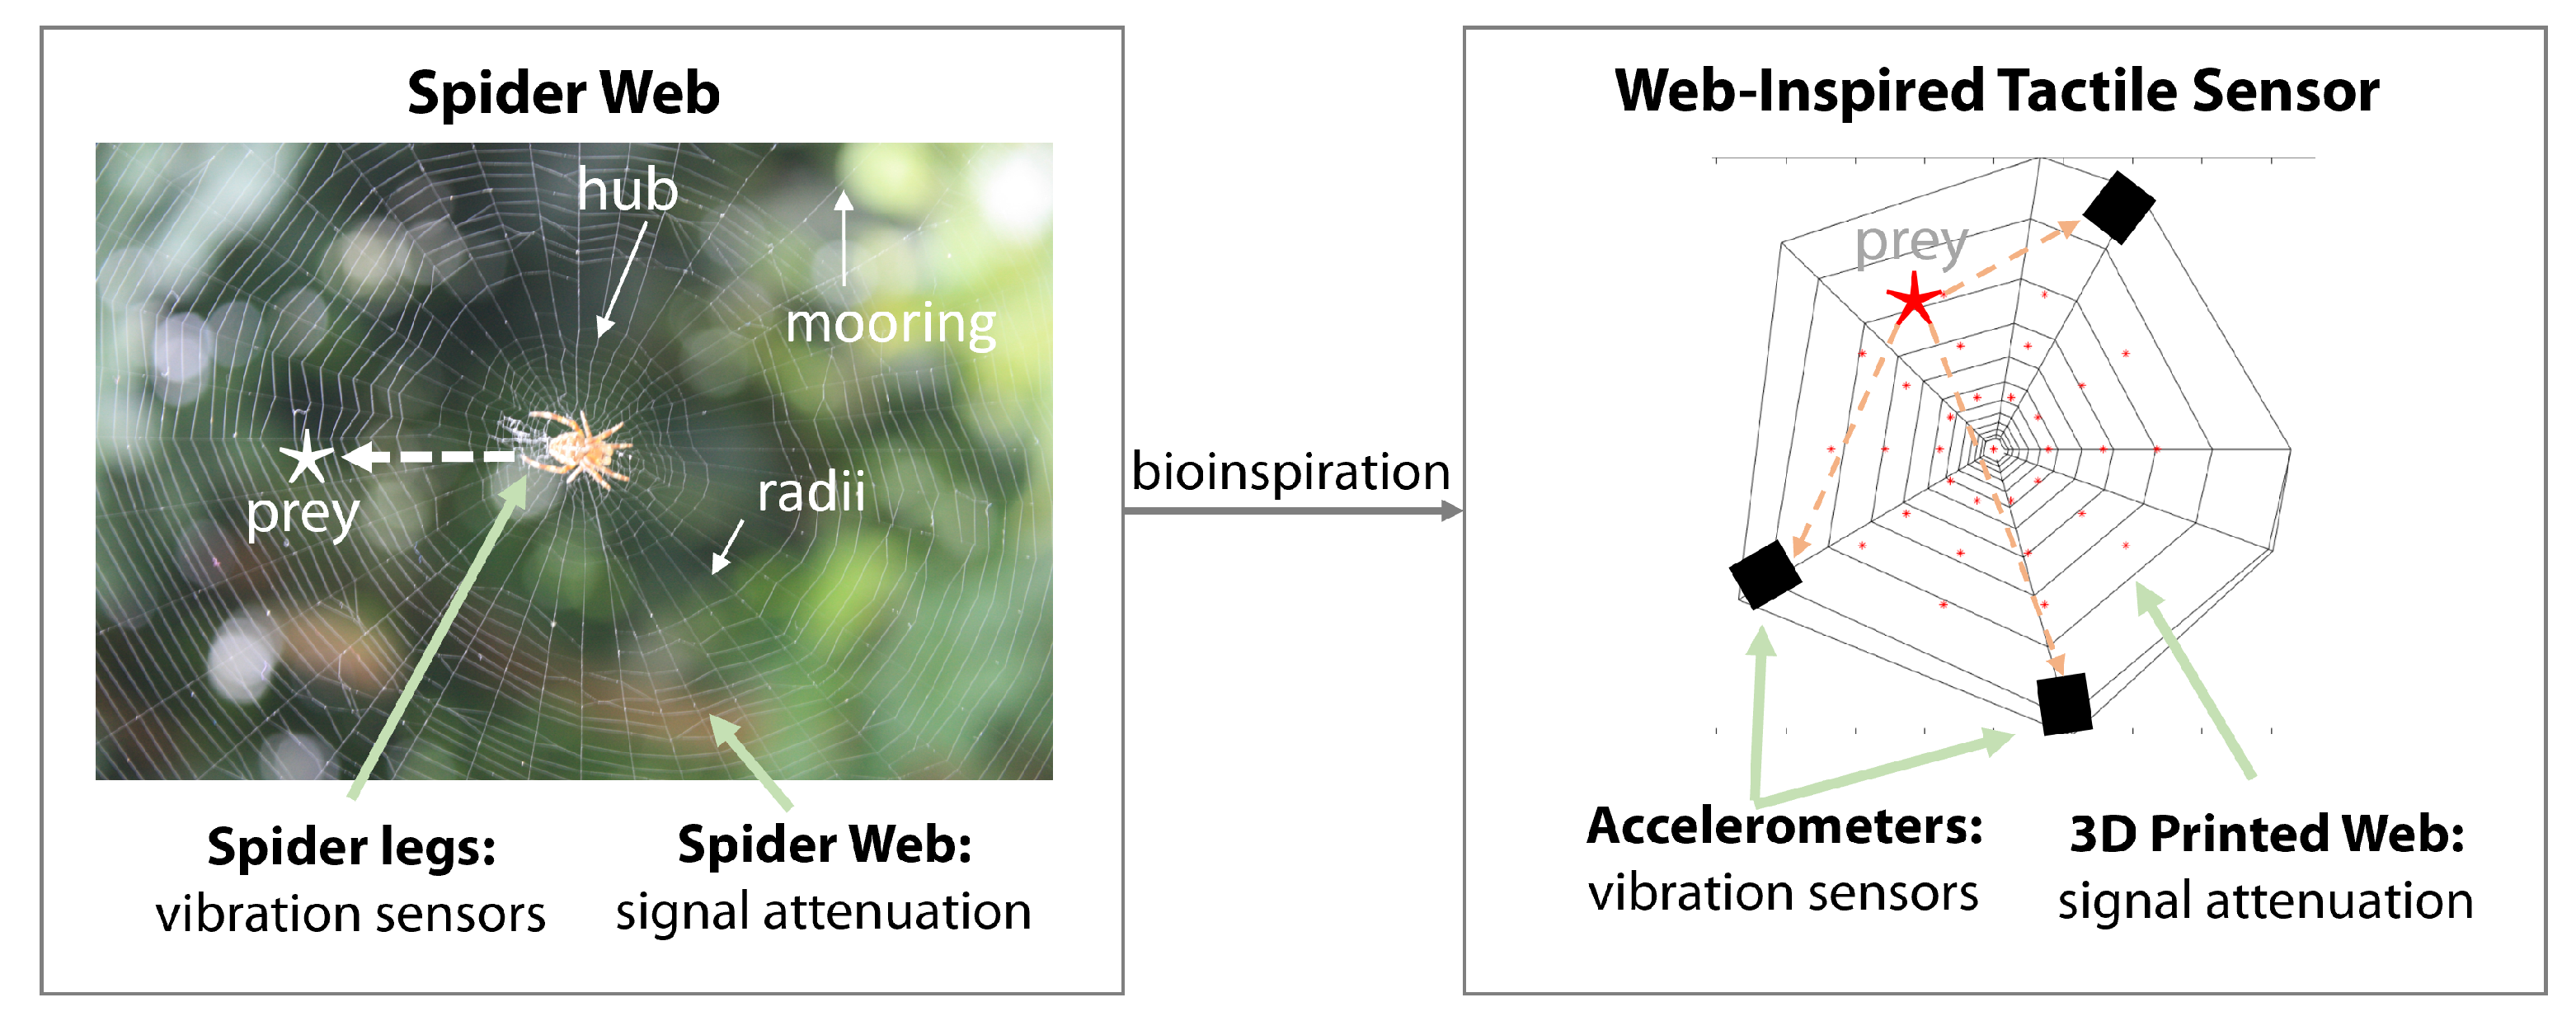
:1. Introduction
2. Materials and Methods
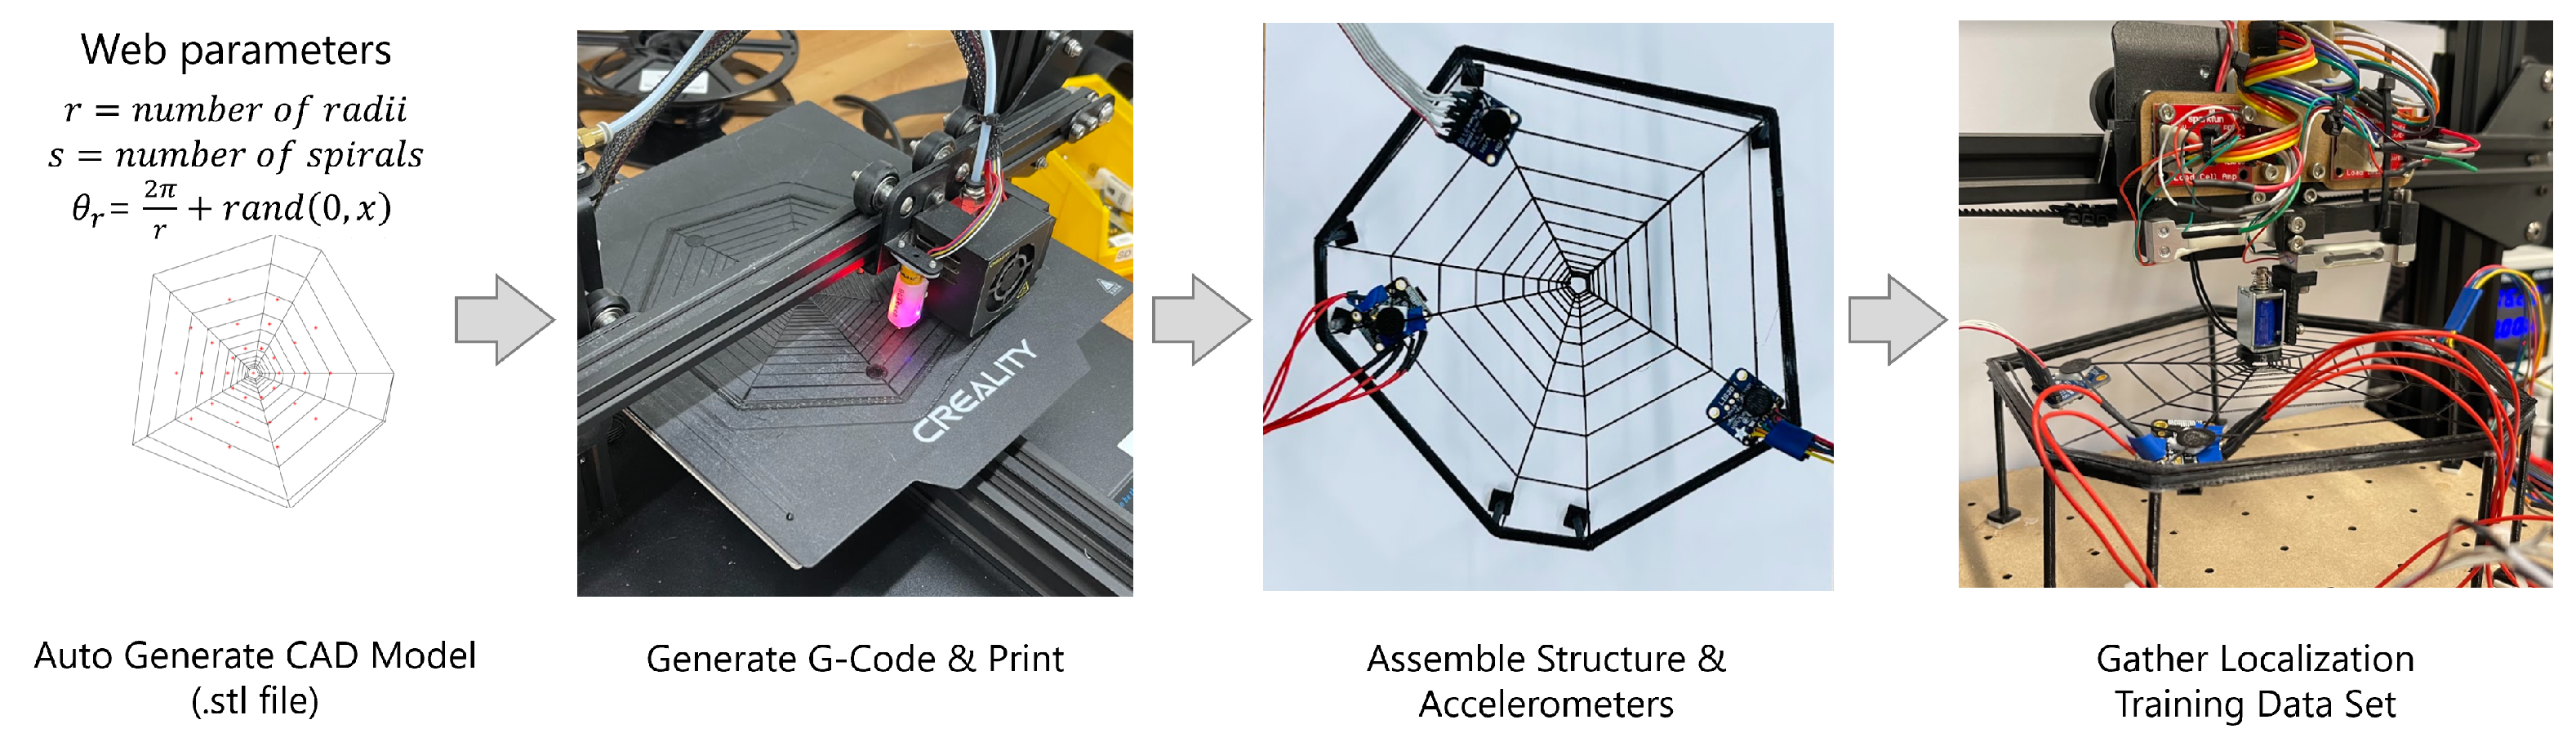
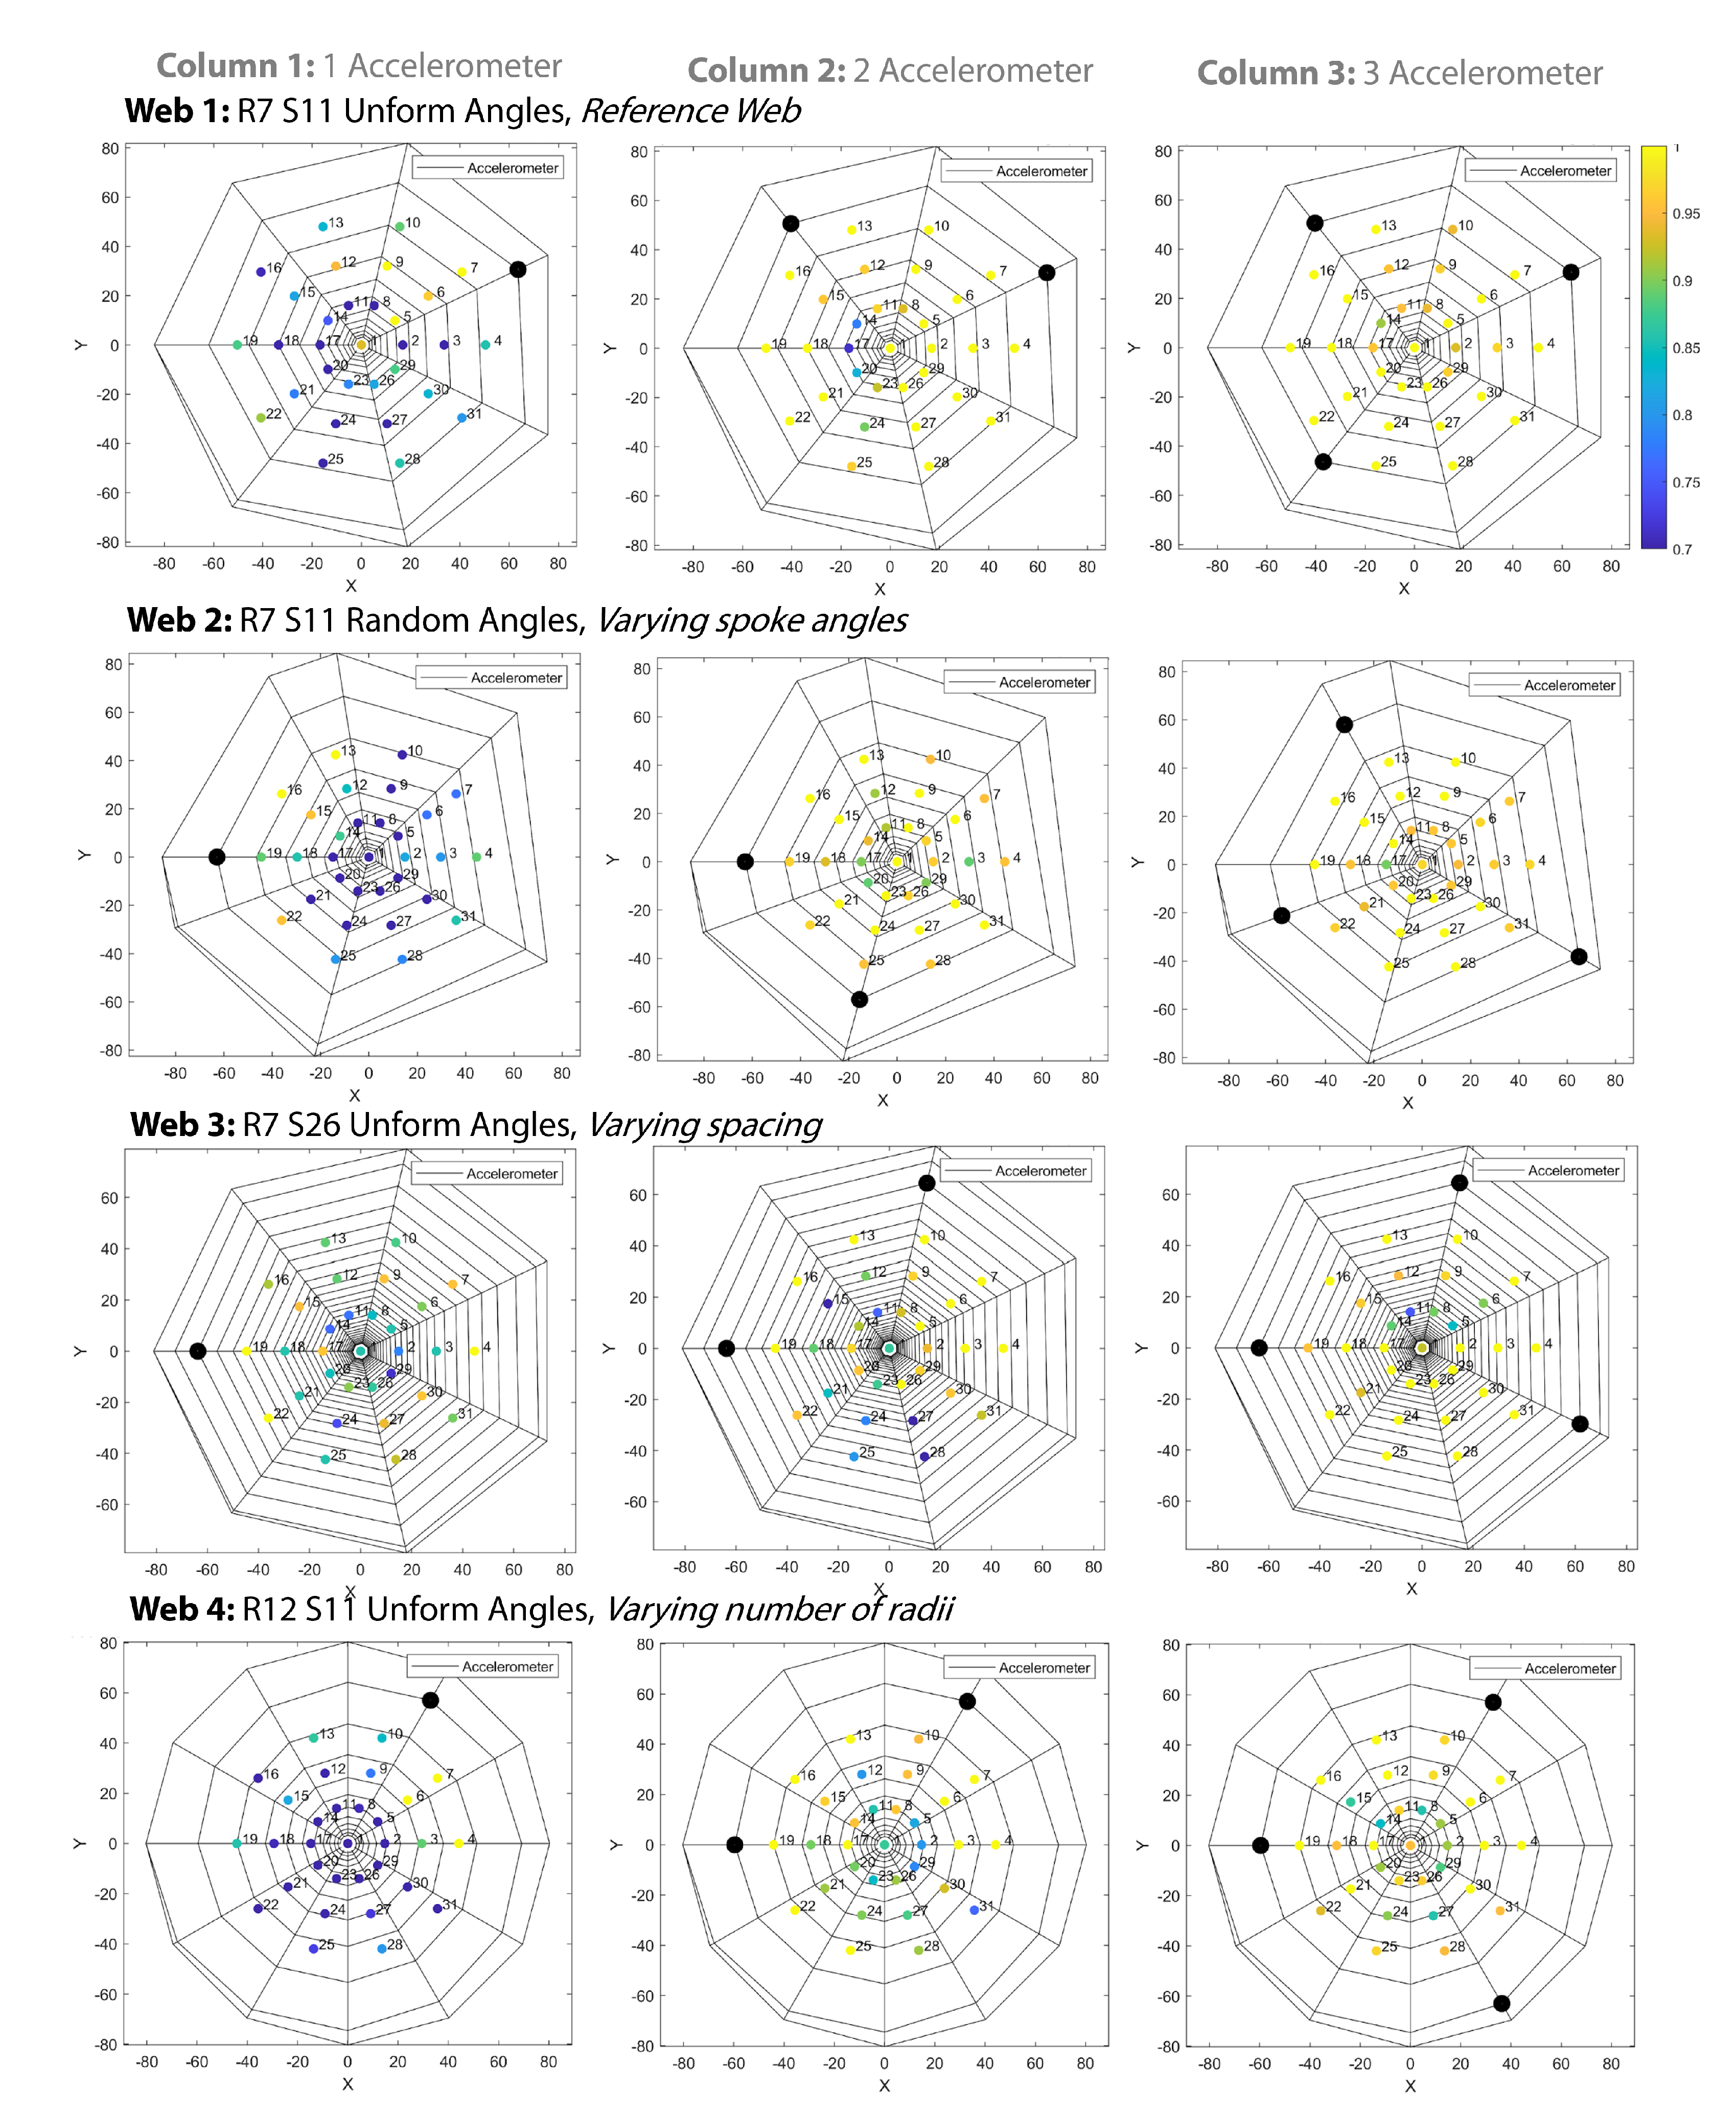
2.1. Web Design
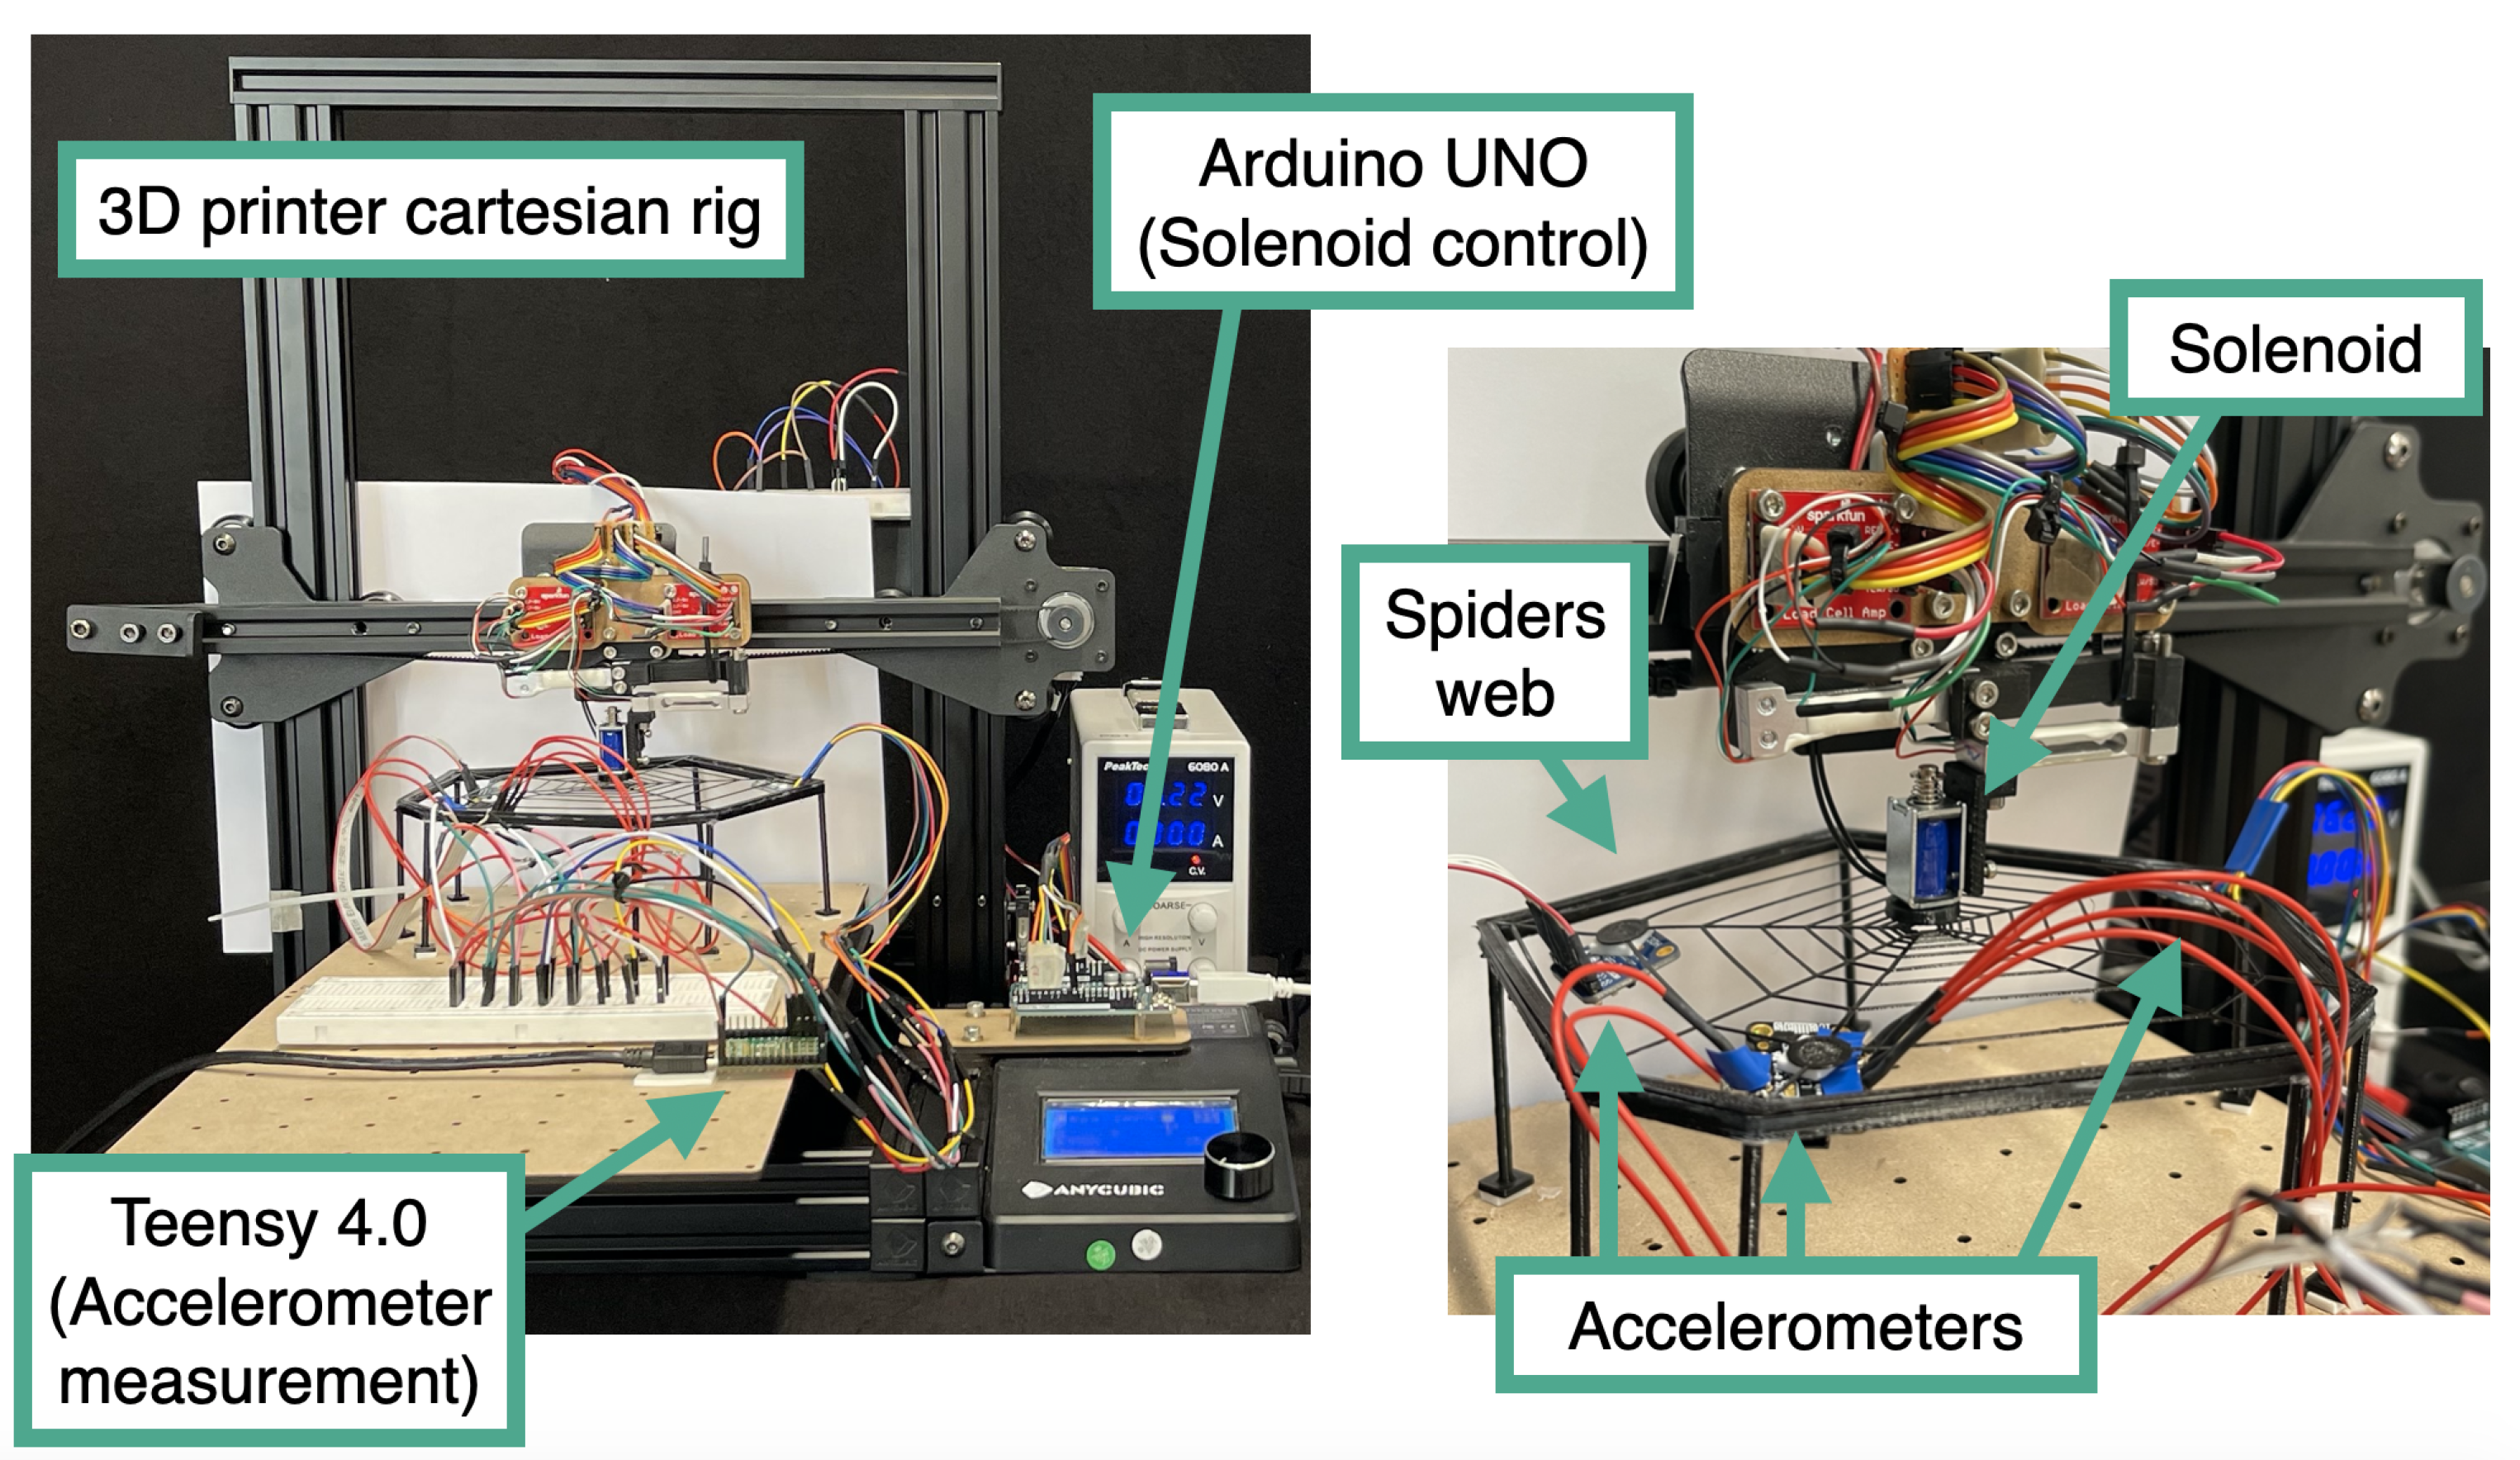
2.2. Fabrication and Sensing
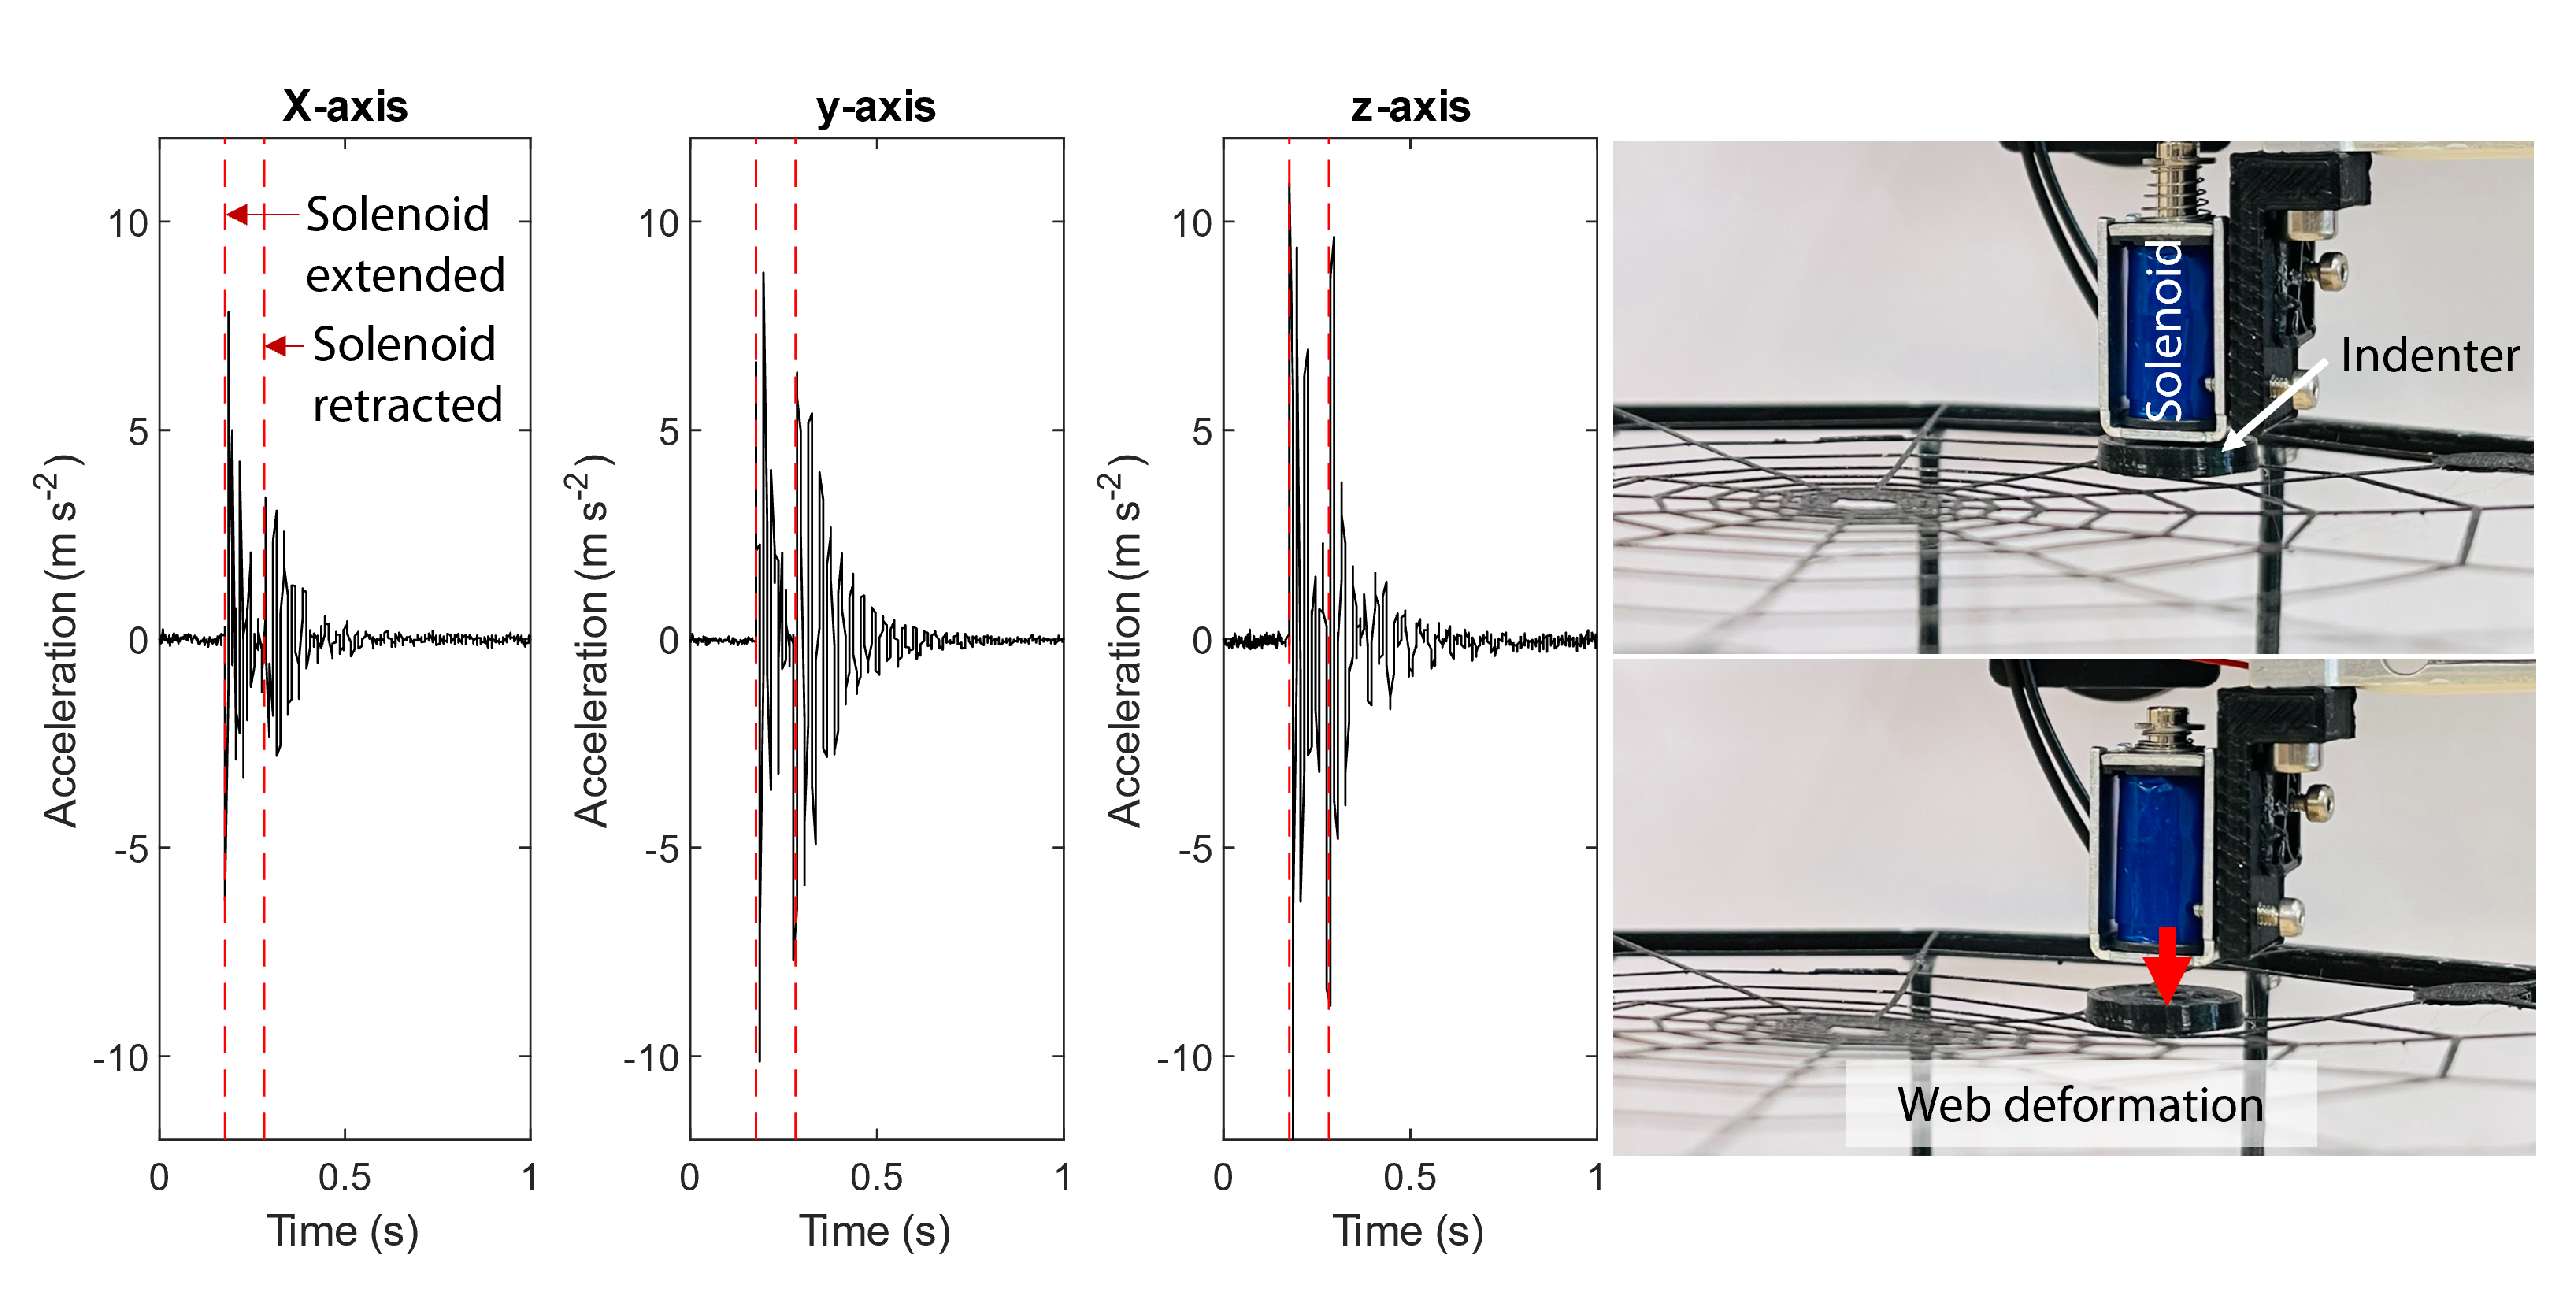
2.3. Experimental Data Collection
2.4. Localization Estimation
2.5. Information Theory Metrics
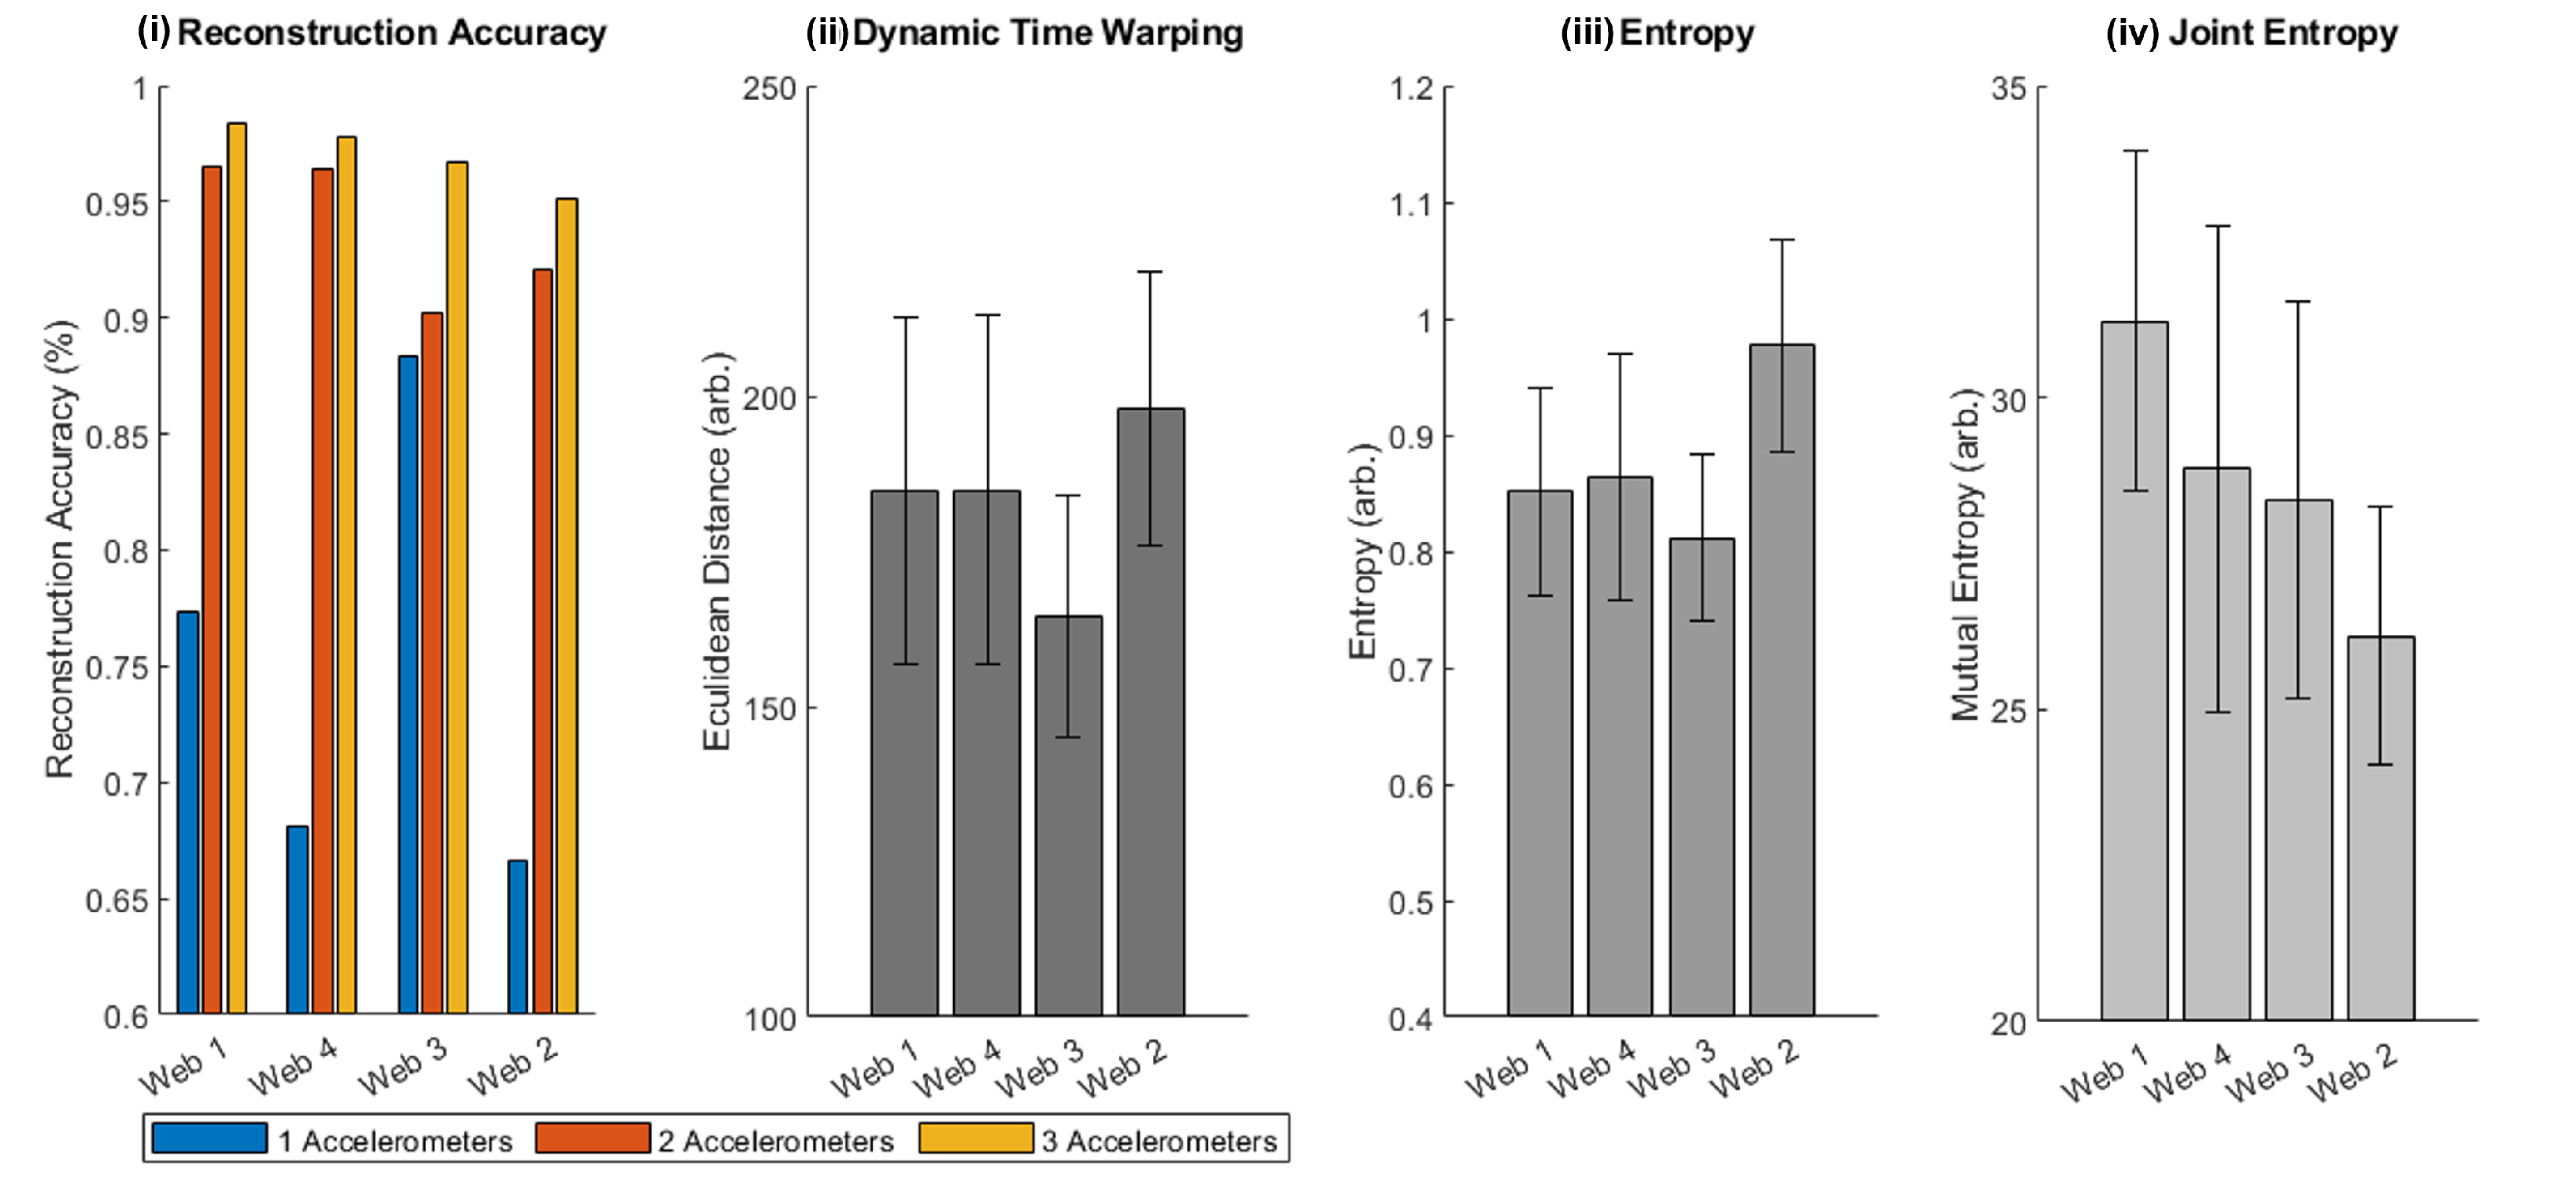
- Euclidean distance after dynamic time warping (DTW). Dynamic time warping is a time-series analysis that aligns and warps two time series to achieve the best match [33]. After performing the time warping to align and ‘stretch’ two time series, the Euclidean distance between these two aligned time series could then be determined as a measure of closeness or similarity. For each web and each point, we computed the Euclidean distance after time warping for all repeats to obtain a quantitative metric of the similarity or repeatability of the time series that were generated. DTW ensured that the time series were appropriately aligned. We used this to assess how the web structure could affect the repeatability or reliability of the response.
- Entropy. This provides a measure of the amount of information held in data [34]. For each web, we computed the average entropy across all samples to determine how the web structure affected the web’s information content.
- Joint entropy. This metric provides a measure of the uncertainty between two random variables. This can be used in the context of time series to understand the amount of certainty or the lack of mutual information between two time series. The higher the joint entropy is, the lower the mutual information or the mutual entropy between two variables or time series will be. For each web, we computed the average joint entropy between all possible pairs of points. This is a metric that was previously explored as a means of optimizing sensor morphology [35].
3. Results
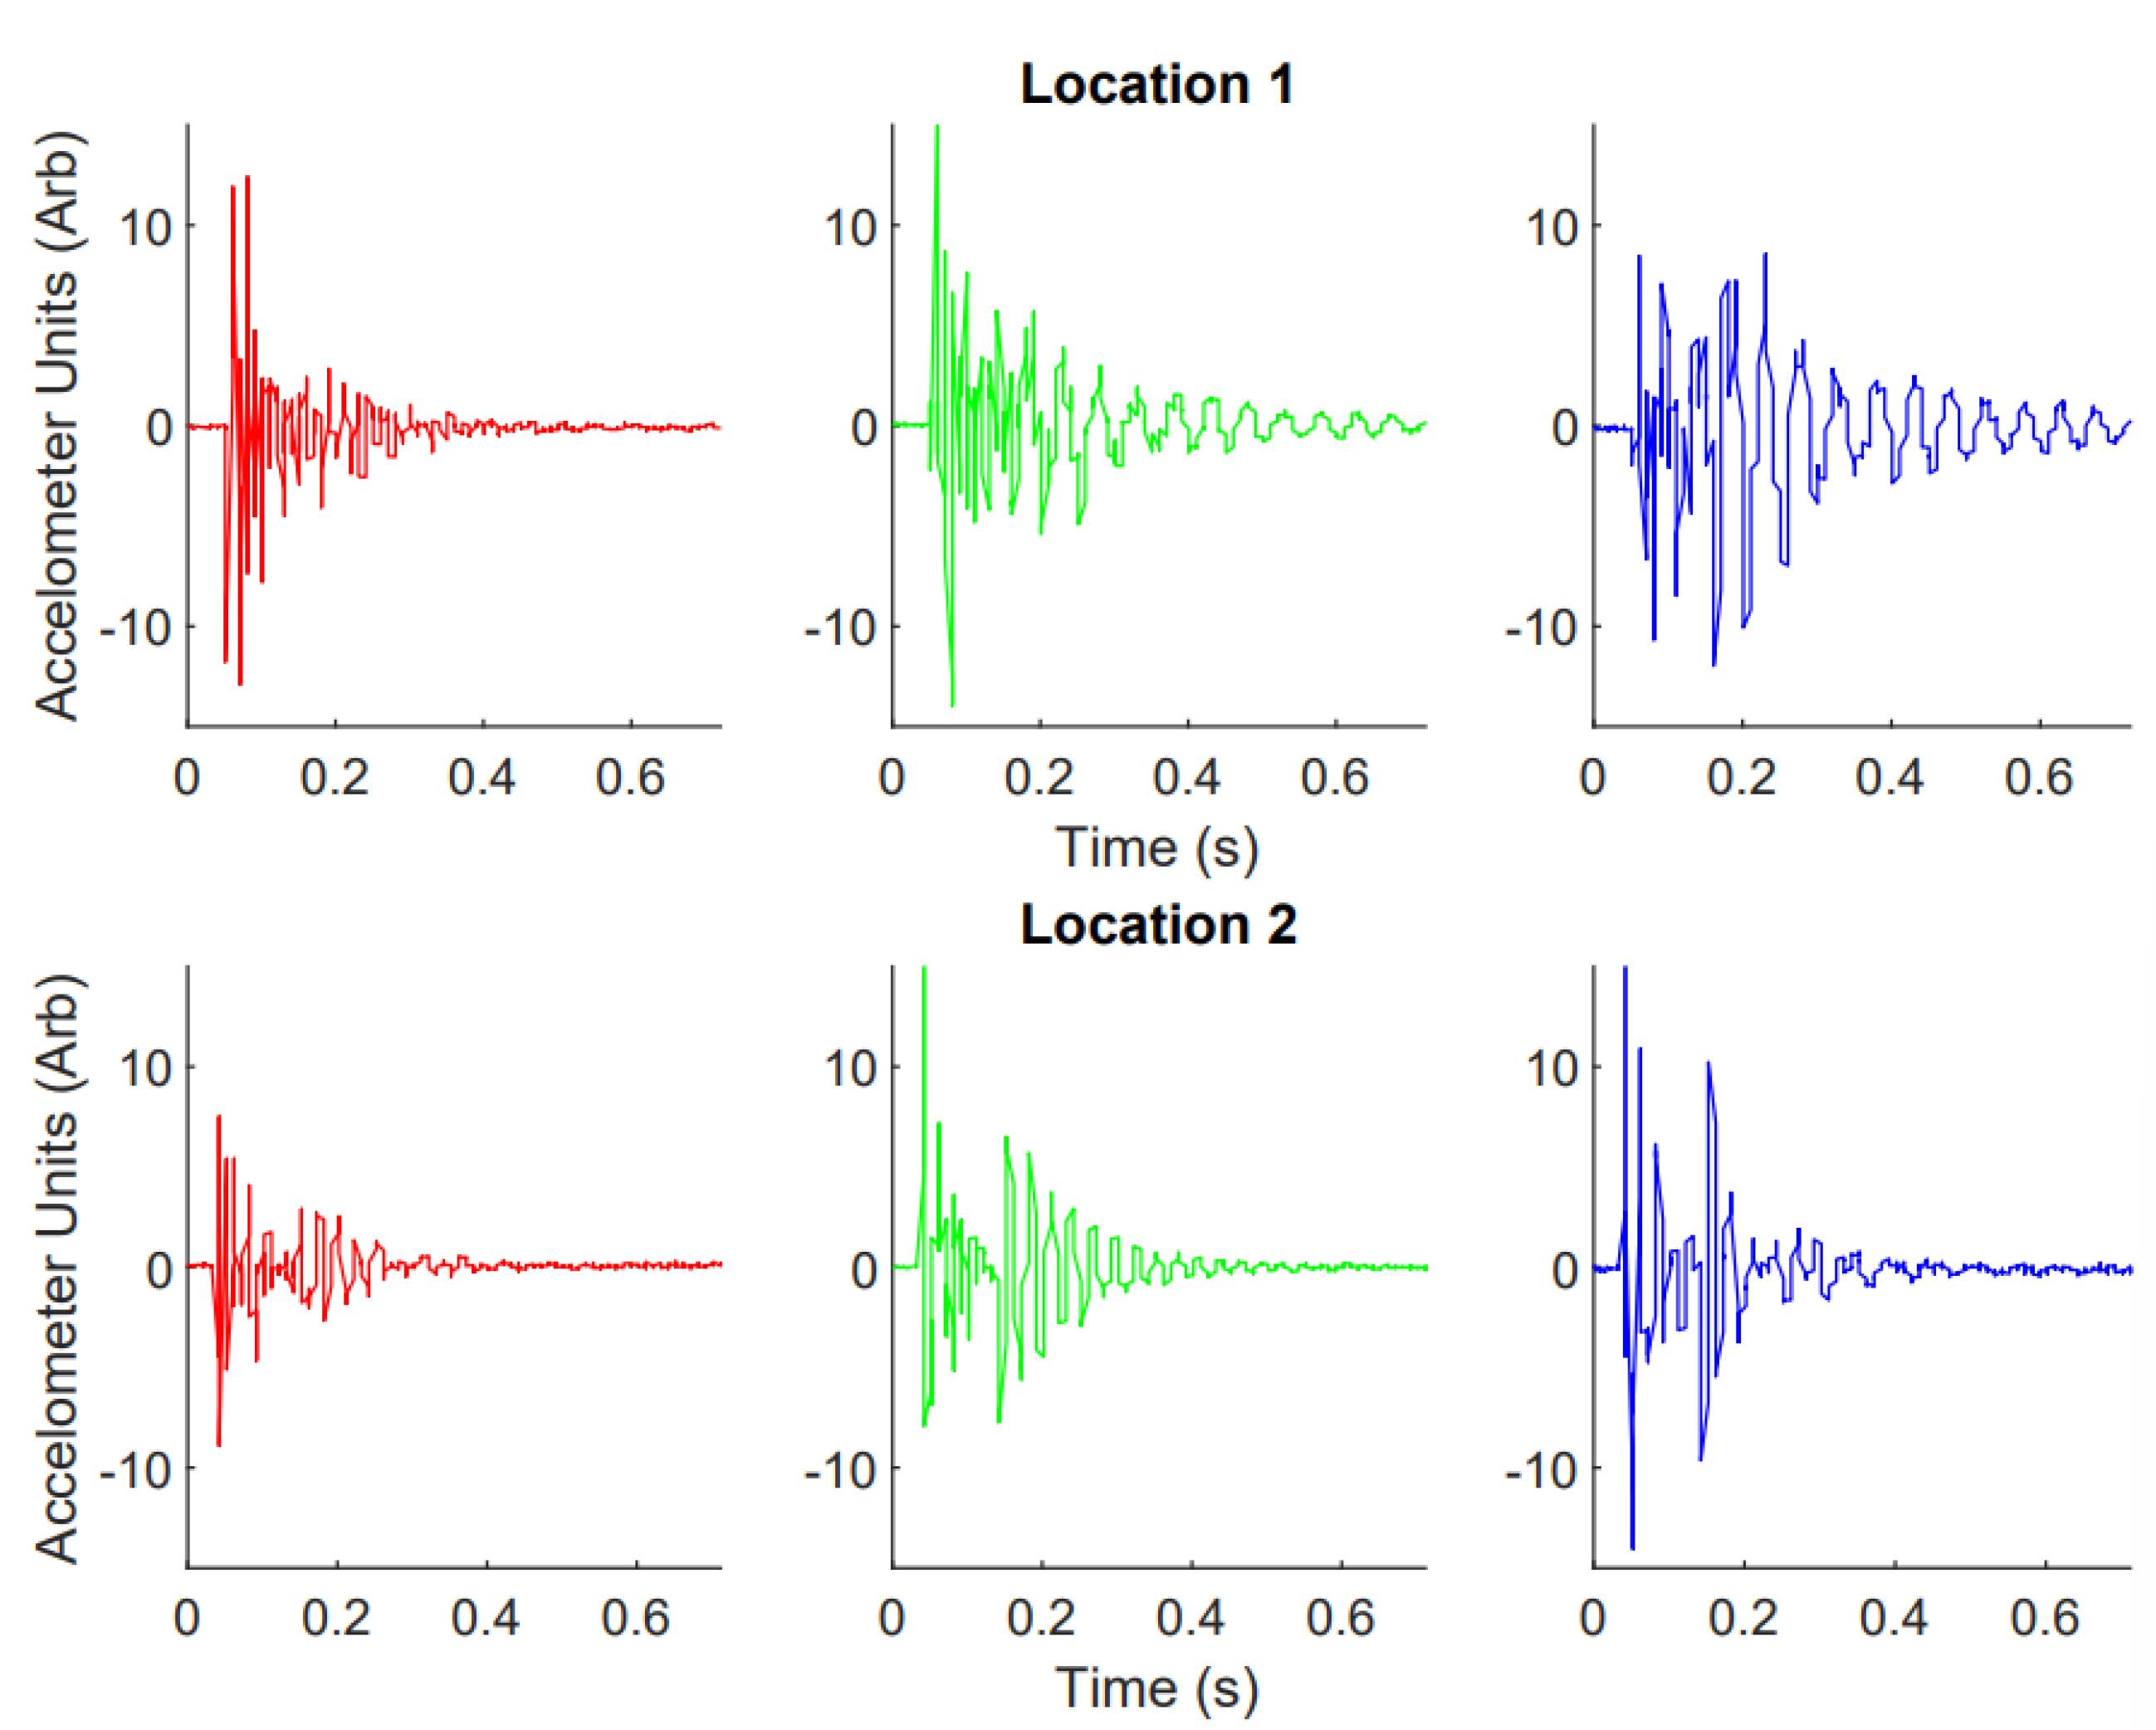
3.1. Exemplary Response
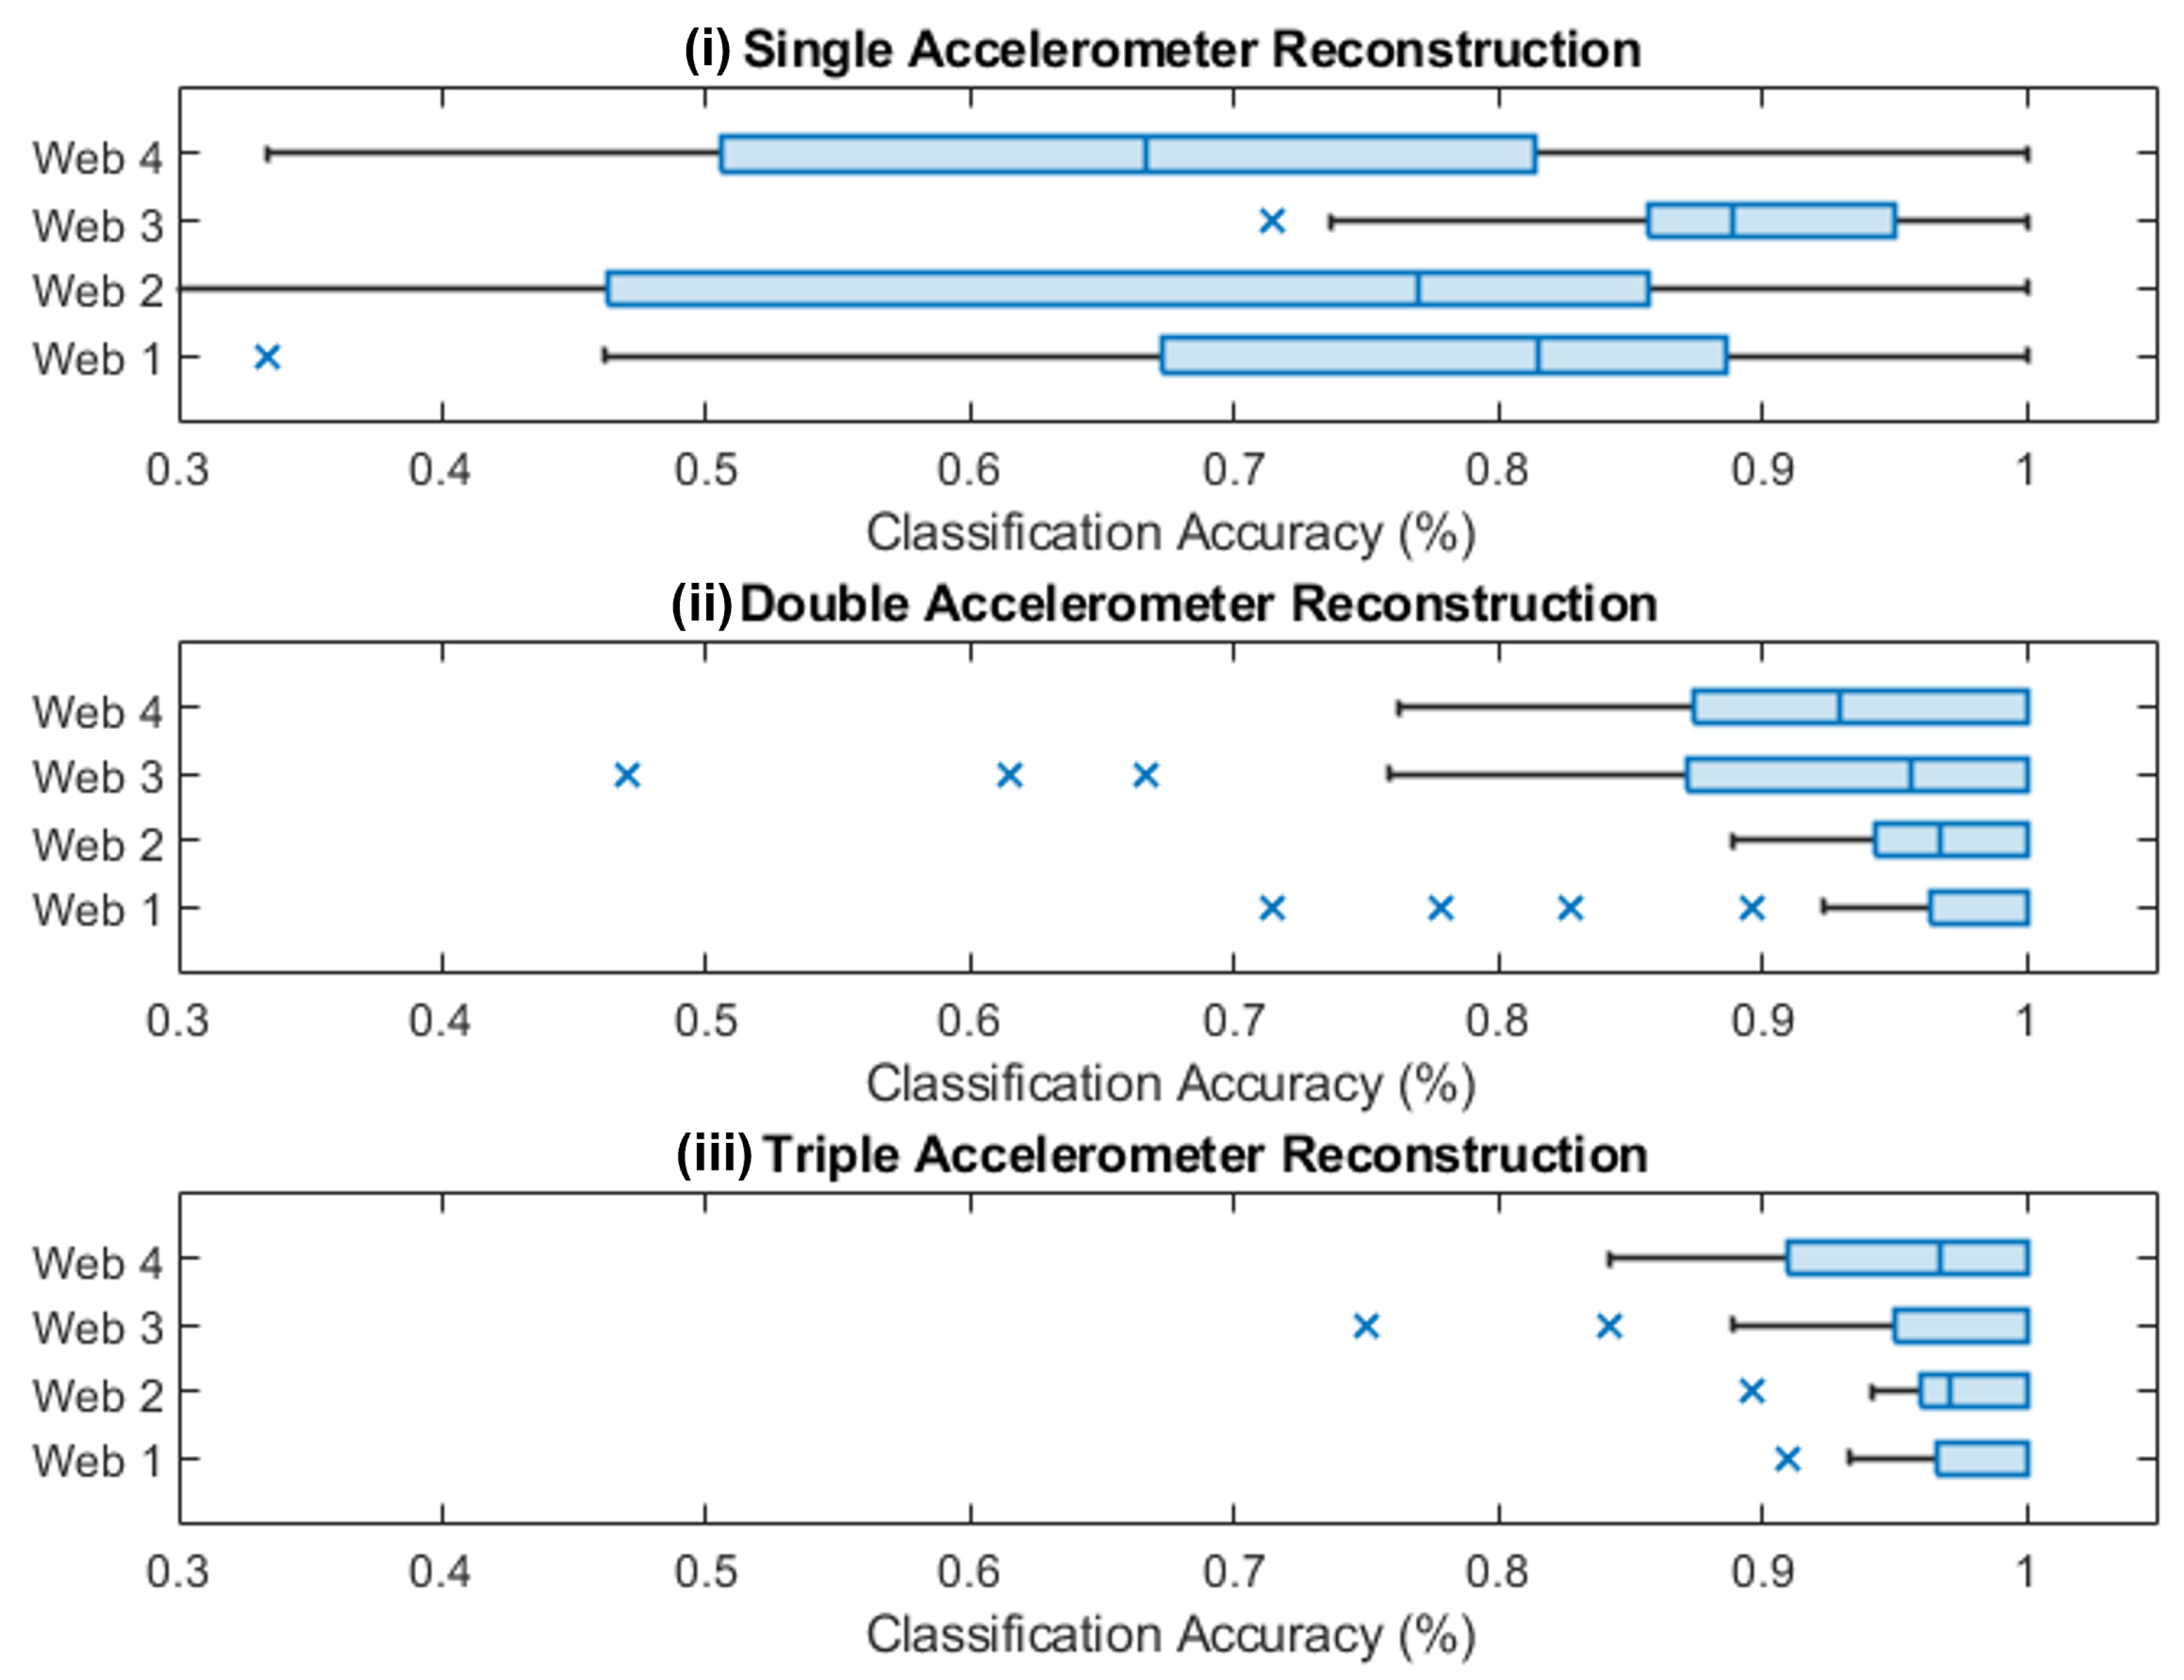
3.2. Classification Accuracy
3.3. Information Content Metrics
4. Conclusions
Author Contributions
Funding
Conflicts of Interest
References
- Lee, M.H. Tactile sensing: New directions, new challenges. Int. J. Robot. Res. 2000, 19, 636–643. [Google Scholar] [CrossRef]
- Wan, Y.; Wang, Y.; Guo, C.F. Recent progresses on flexible tactile sensors. Mater. Today Phys. 2017, 1, 61–73. [Google Scholar] [CrossRef]
- Silvera-Tawil, D.; Rye, D.; Soleimani, M.; Velonaki, M. Electrical impedance tomography for artificial sensitive robotic skin: A review. IEEE Sensors J. 2014, 15, 2001–2016. [Google Scholar] [CrossRef] [Green Version]
- Hughes, J.; Iida, F. Localized differential sensing of soft deformable surfaces. In Proceedings of the 2017 IEEE International Conference on Robotics and Automation (ICRA), Singapore, 29 May–3 June 2017; pp. 4959–4964. [Google Scholar]
- Barth, F.G. The vibrational sense of spiders. In Comparative Hearing: Insects; Springer: Berlin/Heidelberg, Germany, 1998; pp. 228–278. [Google Scholar]
- Eberhard, W. Spider webs. In Spider Webs; University of Chicago Press: Chicago, IL, USA, 2020. [Google Scholar]
- Mortimer, B. A spider’s vibration landscape: Adaptations to promote vibrational information transfer in orb webs. Integr. Comp. Biol. 2019, 59, 1636–1645. [Google Scholar] [CrossRef]
- Lin, L.H.; Edmonds, D.T.; Vollrath, F. Structural engineering of an orb-spider’s web. Nature 1995, 373, 146–148. [Google Scholar] [CrossRef]
- Masters, W.M.; Markl, H. Vibration signal transmission in spider orb webs. Science 1981, 213, 363–365. [Google Scholar] [CrossRef]
- Lott, M.; Poggetto, V.F.D.; Greco, G.; Pugno, N.M.; Bosia, F. Prey localization in spider orb webs using modal vibration analysis. Sci. Rep. 2022, 12, 19045. [Google Scholar] [CrossRef]
- Eberhard, W.G. Function and phylogeny of spider webs. Annu. Rev. Ecol. Syst. 1990, 21, 341–372. [Google Scholar] [CrossRef]
- Vollrath, F.; Downes, M.; Krackow, S. Design variability in web geometry of an orb-weaving spider. Physiol. Behav. 1997, 62, 735–743. [Google Scholar] [CrossRef]
- Vollrath, F.; Selden, P. The Role of Behavior in the Evolution of Spiders, Silks, and Webs. Annu. Rev. Ecol. Evol. Syst. 2007, 38, 819–846. [Google Scholar] [CrossRef] [Green Version]
- Alam, M.; Jenkins, C. Damage tolerance in naturally compliant structures. Int. J. Damage Mech. 2005, 14, 365–384. [Google Scholar] [CrossRef]
- Sadati, S.; Williams, T. Toward computing with spider webs: Computational setup realization. In Proceedings of the Conference on Biomimetic and Biohybrid Systems, Paris, France, 17–20 July 2018; pp. 391–402. [Google Scholar]
- Jeong, E.; Kim, D. Detecting the vibration in the artificial web inspired by the spider. In Proceedings of the International Conference on Simulation of Adaptive Behavior, Castellón, Spain, 22–25 July 2014; pp. 43–52. [Google Scholar]
- Garrad, M.S.; Renson, L.; Hauser, H. Nonlinear dynamics of a synthetic spider web. In Proceedings of the NODYCON 2021, Rome, Italy, 16–19 February 2021. [Google Scholar]
- Liu, L.; Huang, Y.; Li, F.; Ma, Y.; Li, W.; Su, M.; Qian, X.; Ren, W.; Tang, K.; Song, Y. Spider-web inspired multi-resolution graphene tactile sensor. Chem. Commun. 2018, 54, 4810–4813. [Google Scholar] [CrossRef]
- Zhao, X.F.; Wen, X.H.; Sun, P.; Zeng, C.; Liu, M.Y.; Yang, F.; Bi, H.; Li, D.; Ma, R.G.; Wang, J.C.; et al. Spider web-like flexible tactile sensor for pressure-strain simultaneous detection. ACS Appl. Mater. Interfaces 2021, 13, 10428–10436. [Google Scholar] [CrossRef]
- Zheng, H.; Wang, H.; Yi, K.; Lin, J.; Chen, A.; Chen, L.; Zou, Z.; Liu, M.; Ji, Y.; Dong, L.; et al. Wearable LIG Flexible Stress Sensor Based on Spider Web Bionic Structure. Coatings 2023, 13, 155. [Google Scholar] [CrossRef]
- Chathuranga, K.; Hirai, S. A bio-mimetic fingertip that detects force and vibration modalities and its application to surface identification. In Proceedings of the 2012 IEEE International Conference on Robotics and Biomimetics (ROBIO), Guangzhou, China, 11–14 December 2012; pp. 575–581. [Google Scholar]
- Zöller, G.; Wall, V.; Brock, O. Active acoustic contact sensing for soft pneumatic actuators. In Proceedings of the 2020 IEEE International Conference on Robotics and Automation (ICRA), Paris, France, 31 May–31 August 2020; pp. 7966–7972. [Google Scholar]
- Blanes, C.; Mellado, M.; Beltrán, P. Tactile sensing with accelerometers in prehensile grippers for robots. Mechatronics 2016, 33, 1–12. [Google Scholar] [CrossRef]
- Tanaka, Y.; Fukuda, T.; Fujiwara, M.; Sano, A. Tactile sensor using acoustic reflection for lump detection in laparoscopic surgery. Int. J. Comput. Assist. Radiol. Surg. 2015, 10, 183–193. [Google Scholar] [CrossRef] [PubMed]
- Fukuda, T.; Tanaka, Y.; Fujiwara, M.; Sano, A. Softness measurement by forceps-type tactile sensor using acoustic reflection. In Proceedings of the 2015 IEEE/RSJ International Conference on Intelligent Robots and Systems (IROS), Hamburg, Germany, 28 September–3 October 2015; pp. 3791–3796. [Google Scholar]
- McMahan, W.; Romano, J.M.; Kuchenbecker, K.J. Using accelerometers to localize tactile contact events on a robot arm. In Proceedings of the Workshop on Advances in Tactile Sensing and Touch-Based Human-Robot Interaction, ACM/IEEE International Conference on Human-Robot Interaction, Boston, MA, USA, 5–8 March 2012. [Google Scholar]
- Trinh, H.X.; Iwamoto, Y.; Ho, V.A.; Shibuya, K. Localization of sliding movements using soft tactile sensing systems with three-axis accelerometers. Sensors 2019, 19, 2036. [Google Scholar] [CrossRef] [PubMed] [Green Version]
- Vollrath, F.; Krink, T. Spider webs inspiring soft robotics. J. R. Soc. Interface 2020, 17, 20200569. [Google Scholar] [CrossRef]
- Gotts, N.; Vollrath, F. Artificial intelligence modelling of web-building in the garden cross spider. J. Theor. Biol. 1991, 152, 485–511. [Google Scholar] [CrossRef]
- Graves, A.; Schmidhuber, J. Framewise phoneme classification with bidirectional LSTM networks. In Proceedings of the 2005 IEEE International Joint Conference on Neural Networks, Montreal, QC, Canada, 31 July–4 August 2005; Volume 4, pp. 2047–2052. [Google Scholar] [CrossRef] [Green Version]
- Hughes, J.; Spielberg, A.; Chounlakone, M.; Chang, G.; Matusik, W.; Rus, D. A Simple, Inexpensive, Wearable Glove with Hybrid Resistive-Pressure Sensors for Computational Sensing, Proprioception, and Task Identification. Adv. Intell. Syst. 2020, 2, 2000002. [Google Scholar] [CrossRef]
- Obayashi, N.; Vicari, A.; Junge, K.; Shakir, K.; Hughes, J. Control and Morphology Optimization of Passive Asymmetric Structures for Robotic Swimming. arXiv 2022, arXiv:2211.13705. [Google Scholar] [CrossRef]
- Senin, P. Dynamic time warping algorithm review. Inf. Comput. Sci. Dep. Univ. Hawaii Manoa Honolulu USA 2008, 855, 40. [Google Scholar]
- Lin, J. Divergence measures based on the Shannon entropy. IEEE Trans. Inf. Theory 1991, 37, 145–151. [Google Scholar] [CrossRef] [Green Version]
- Thuruthel, T.G.; Hughes, J.; Iida, F. Joint entropy-based morphology optimization of soft strain sensor networks for functional robustness. IEEE Sensors J. 2020, 20, 10801–10810. [Google Scholar] [CrossRef]


| Web 1 | Web 2 | Web 3 | Web 4 | |
|---|---|---|---|---|
| Number of Radii | 7 | 7 | 7 | 12 |
| Spirals | 11 | 11 | 26 | 11 |
| Angles | Uniform | Random | Uniform | Uniform |
| Number of Sensors | 3 | 3 | 3 | 3 |
Disclaimer/Publisher’s Note: The statements, opinions and data contained in all publications are solely those of the individual author(s) and contributor(s) and not of MDPI and/or the editor(s). MDPI and/or the editor(s) disclaim responsibility for any injury to people or property resulting from any ideas, methods, instructions or products referred to in the content. |
© 2023 by the authors. Licensee MDPI, Basel, Switzerland. This article is an open access article distributed under the terms and conditions of the Creative Commons Attribution (CC BY) license (https://creativecommons.org/licenses/by/4.0/).
Share and Cite
Naderinejad, M.; Junge, K.; Hughes, J. Exploration of the Design of Spiderweb-Inspired Structures for Vibration-Driven Sensing. Biomimetics 2023, 8, 111. https://doi.org/10.3390/biomimetics8010111
Naderinejad M, Junge K, Hughes J. Exploration of the Design of Spiderweb-Inspired Structures for Vibration-Driven Sensing. Biomimetics. 2023; 8(1):111. https://doi.org/10.3390/biomimetics8010111
Chicago/Turabian StyleNaderinejad, Mahdi, Kai Junge, and Josie Hughes. 2023. "Exploration of the Design of Spiderweb-Inspired Structures for Vibration-Driven Sensing" Biomimetics 8, no. 1: 111. https://doi.org/10.3390/biomimetics8010111