1. Introduction
Road traffic crashes stand out among the main negative externalities that derive from transportation activities, along with air pollution, noise, and traffic congestion. In the case of road traffic crashes, direct and indirect expenses strictly transcend private expenses with high social costs. The loss of human lives involves costs in opportunities, economic transfers, insurance compensations, material damage, and funeral expenses, which intensify the effects on the well-being of victims’ families and relatives.
The official figures of international entities concerned with public health problems are revealing. They show that road events are among the top 8 causes of death in the world, with costs exceeding USD 500 million, 1.24 million deaths per year, and 20–50 million people injured. According to the World Health Organization (WHO), this is the main cause of death among young people aged 15 to 29 [
1].
In Colombia, 85% of road traffic crashes are urban, and more than half of the events are concentrated in the cities of Bogotá, Medellín, and Cali [
2,
3]. In 2015, the National Institute of Legal Medicine and Forensic Sciences (in Spanish, INMLCF: Instituto Nacional de Medicina Legal y Ciencias Forenses) reported more than 50,000 injured people, with a cumulative lethality of 13.1% (6887 individuals) and physical–mental injuries in 86.9% of cases, thus constituting the second leading cause of death by external causes in Colombia [
4].
In recent years, the average incidence of fatalities in Cali has reached 13 per 100,000 inhabitants, and an average of 332 injured per 100,000 inhabitants [
5]. These values are high in comparison with other capitals, such as Medellín and Bogotá. These events mainly affect pedestrians, cyclists, and motorcyclists, placing Cali in 21st place in the Latin American Ranking of road traffic fatal cities for 2017 [
6].
From 2003–2014, 3247 deaths were recorded (43.4% were pedestrians, and 29.3% were passengers and drivers of motorcycles). The number of monthly deaths varied in this same period between 13 and 39 cases. In 2003, a total of 224 fatalities was recorded, and the number of fatalities increased in subsequent years, with 335 deaths in 2007 (the year with the highest number) and 328 deaths in 2009. In the following years, there was a break in the trend of fatal events; when comparing the periods 2007–2010 and 2011–2014, the number of victims fell by 23.4% in the intervened areas and by 26.1% in the non-intervened areas [
7].
From 2004–2015, the city carried out infrastructure projects in the different phases of the Integrated Mass Transportation System–MIO (in Spanish: Sistema Integrado de Transporte Masivo–Masivo Integrado de Occidente (SITM-MIO)) and a set of specific and linear road infrastructure works, executed within the framework of the value-added work plan that included mobility, public space, and collective equipment interventions (‘Megaobras Plan’, in charge of the Infrastructure and Mobility Secretariats of Cali, Colombia). The first phase of construction of the SITM-MIO, which began operating in March 2009, was between May 2004 and March 2010, and the second phase lasted from December 2009 to April 2015.
This research studies the spatial variability of the relationship between transport infrastructure investments in the city and the distribution of traffic fatalities. Geostatistical contrasts are made between intervened and non-intervened areas using a geographically weighted model that explores the factors associated with intra-urban traffic fatalities, controlling for infrastructure interventions and some indicators of urban structure. Although this is not strictly an impact evaluation, the findings and the structure of the proposed model provide results for future assessments.
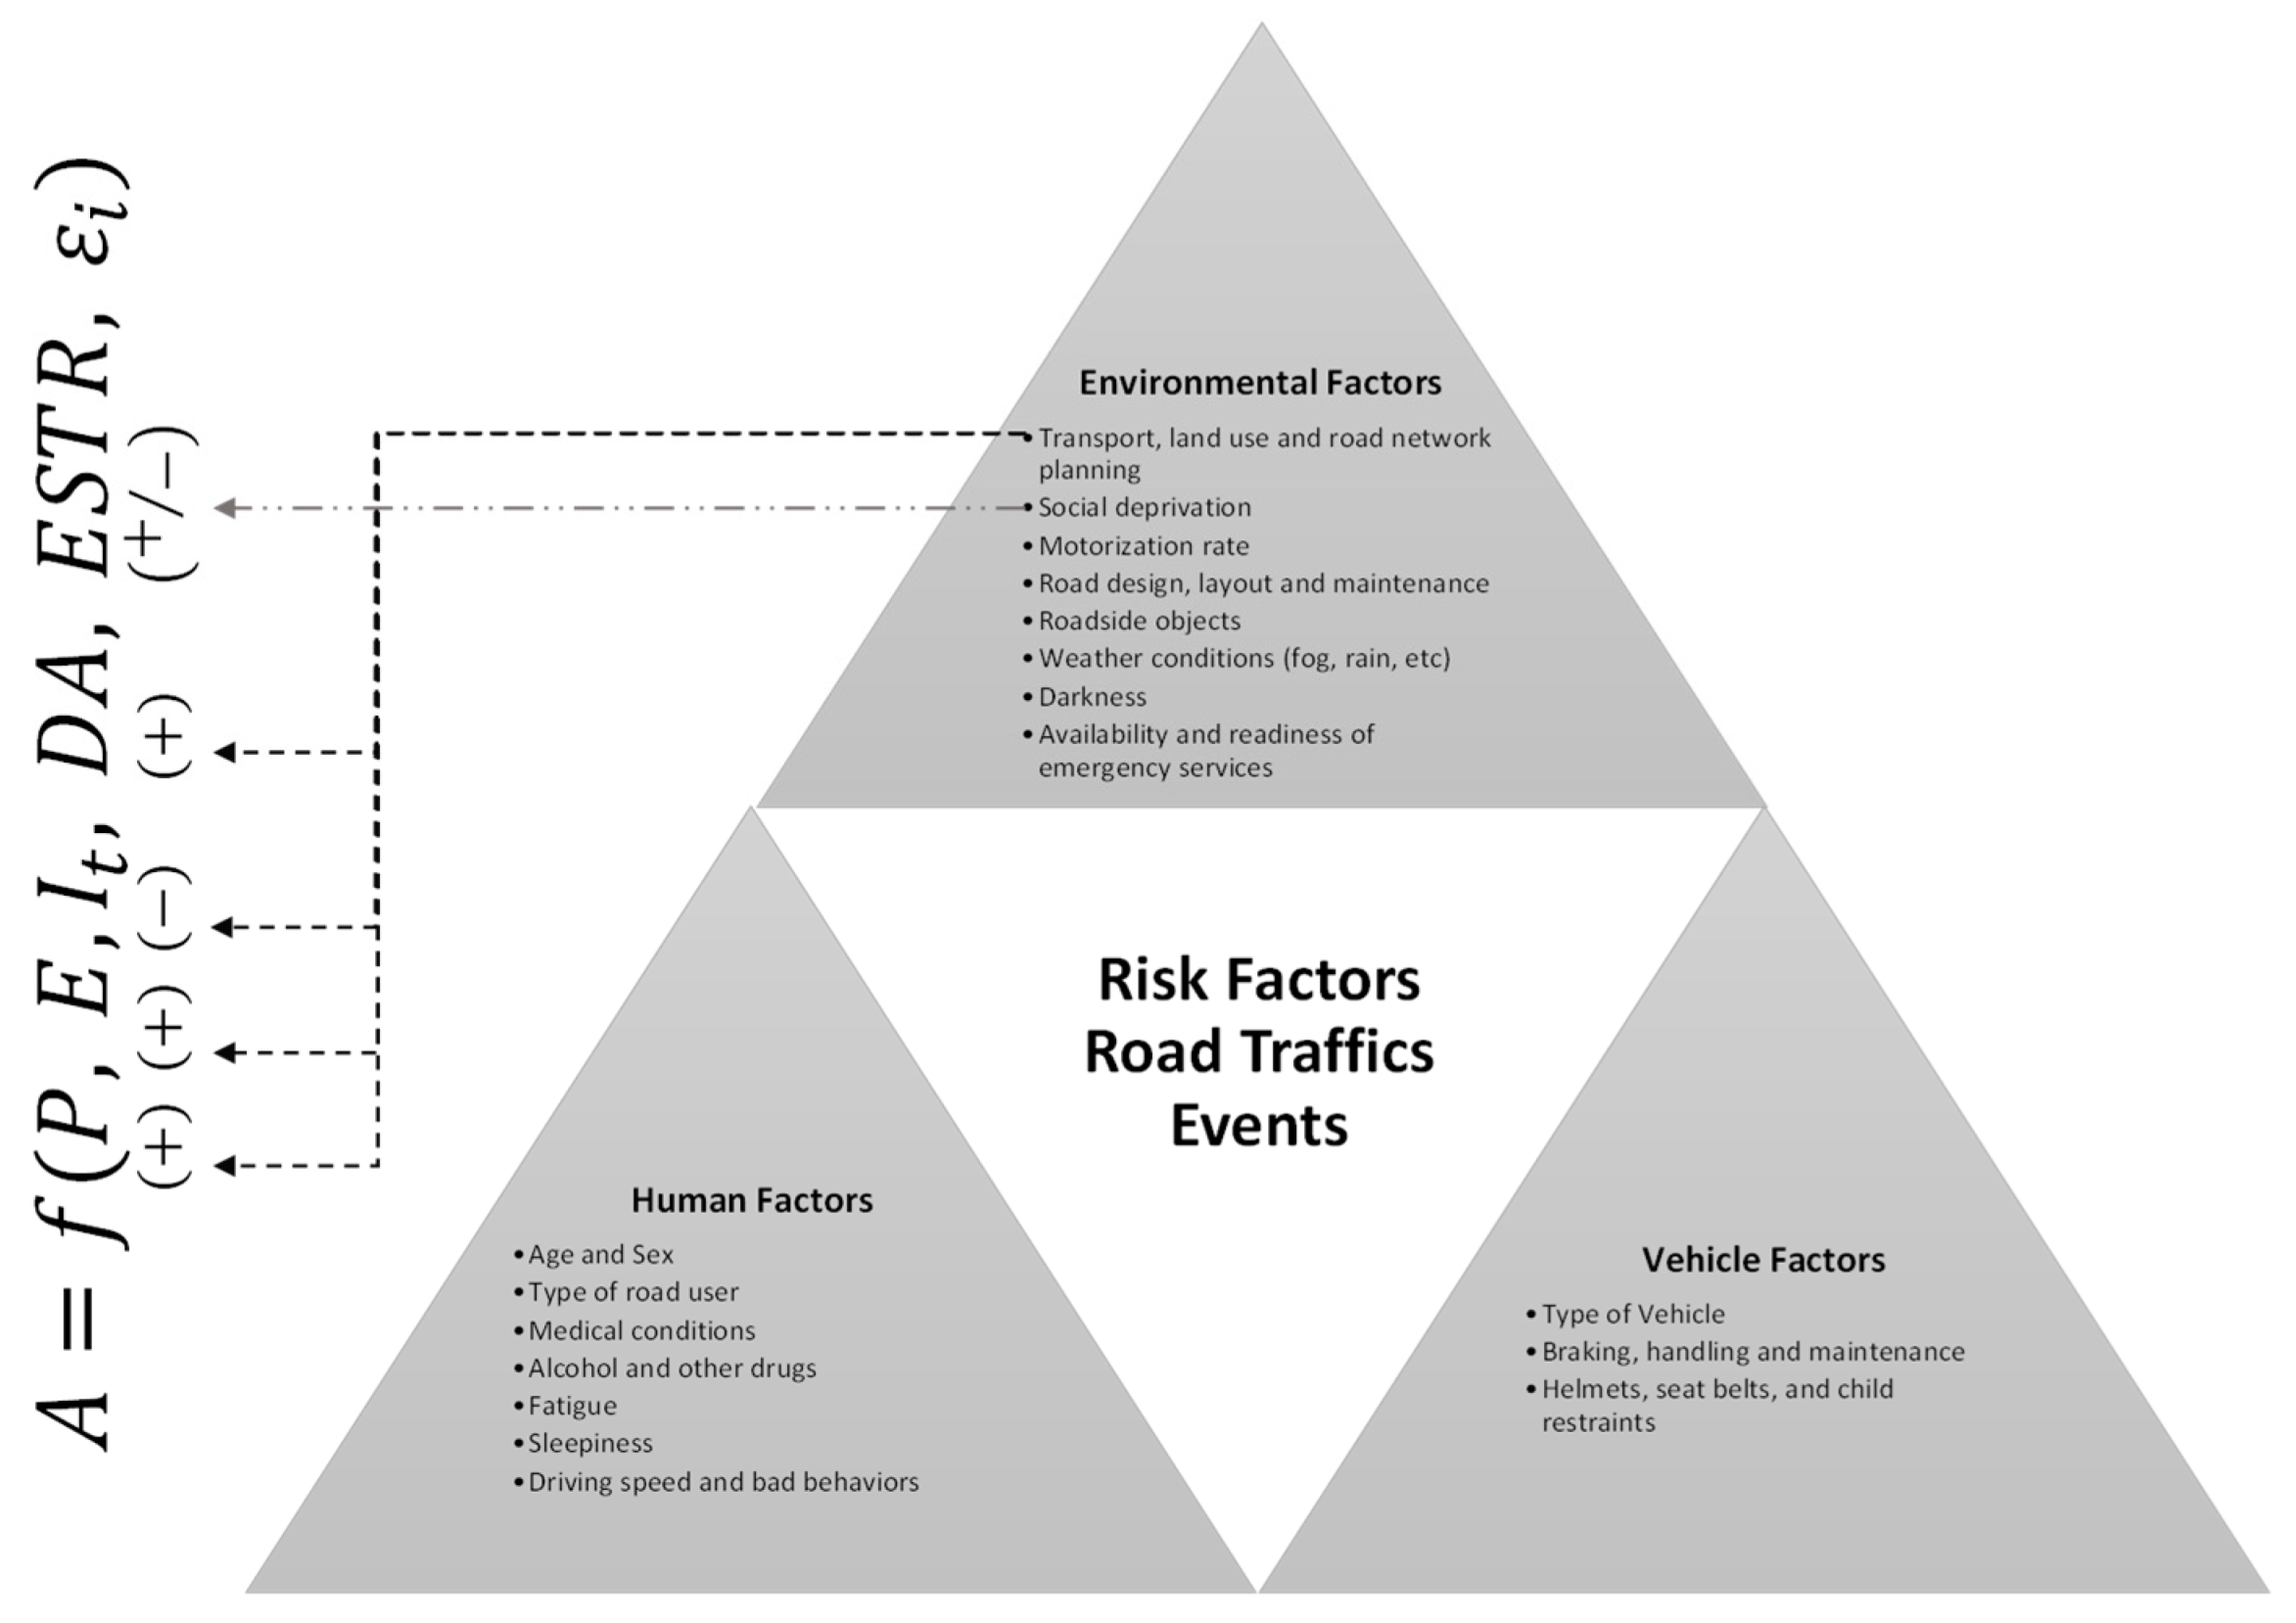
Considering that traffic fatalities are a public health problem, this article adopts the perspective of the epidemiological triad [
8] that conceives a road traffic crash as the combined effect of human [
9], vehicle, and environmental risk factors [
10]. The methodological strategy of this article emphasizes three components associated with the physical and social environment factors: (i) land use (employment and population), (ii) social disadvantage (socioeconomic stratification and previous road traffic crashes or inertia), and (iii) planning of the transportation network (construction of new infrastructure).
The urban dynamics of the innovations in infrastructure and in the mass transit system led us to think that fatal events due to road traffic crashes would decrease significantly. However, the values achieved after the interventions did not represent significant changes in fatal events. When identifying the relative effect of infrastructure projects, controlling for variables of urban structure and the inertia of the critical points of previous periods, the estimated differential effects were relatively small, and in many cases, the exposure was even greater in the intervention zones and in some critical points.
Cali, like other cities in Latin America, has critical points of road traffic crashes that have persisted over the past two decades and that—despite investments in transportation infrastructure and the introduction of the SITM-MIO—are closely linked to the urban structure, to the city’s patterns of economic activity, and to intersections and population densities, as is the case in the historic center and some arterial roads and neighborhoods in the northeast area of the city. For these reasons, it is important to identify the role played by factors associated with the urban structure, which will undoubtedly affect any future impact assessment exercise.
Recent studies have conducted a comprehensive review of the literature to explore the effectiveness of road interventions in reducing crashes and fatal traffic events; these studies have noted the positive impacts of traffic calming, radars, cameras’ detection of violations to stop for a red light, the physical separation of pedestrians and vehicular traffic, regulation programs and penalties for alcohol, and infrastructure investments at risky intersections (hot spots), among other interventions [
11,
12]. Systematic reviews of cost–benefit analyses [
13] show the detailed balance of 29 different types of road safety interventions in European countries, although the authors note that caution should be taken in extending the results in other settings. However, studies on the effects of investments in infrastructure and urban structure are not very common, and far less so in Latin America, except for local experiences related to the evaluation of the impact of camera enforcement for traffic violations in Cali and Medellín [
14,
15,
16].
2. Materials and Methods
We used official information from Cali’s municipal public administration and specialized research centers. We performed statistical comparisons between intervened areas and non-intervened areas to estimate a geographically weighted Poisson regression (GWPR) model that captures the spatial variability of the factors associated with the intraurban road traffic crash rate.
2.1. Data
The georeferenced data come from official statistical sources, such as the Administrative Department of Municipal Planning (Departamento Administrativo de Planeación Municipal [DAPM]), the Secretariats of Infrastructure and Mobility of Cali, MetroCali SA, and the Universidad del Valle (Cali, Colombia).
We obtained records on deaths by road traffic events through the interinstitutional committee of violent deaths in Cali, with the participation of the Cisalva Institute of the Universidad del Valle. The data on the infrastructure projects in the different phases of the SITM-MIO and the specific and linear infrastructure works—executed within the framework of an ambitious project called the ‘Megaobras’ Plan, which was aimed at mobility, public space, and collective equipment—come from the Infrastructure and Mobility Secretariats of Cali and MetroCali SA. The latter is responsible for managing the SITM-MIO. We derived the economic, sociodemographic, and technical variables and indicators of transportation from research carried out by the Regional and Urban Economics Group (Grupo de Economía Regional y Urbana [GERA]) and the Transportation, Traffic and Roads Research Group (Grupo de Investigación en Transporte, Tránsito y Vías [GITTV]) of the Universidad del Valle (Cali, Colombia).
2.2. Zoning and Temporal Aggregation
We grouped the fatal events into two equivalent observation windows, 2007–2010 (W1) and 2011–2014 (W2), due to the urban dynamics generated by changes in infrastructure. The specific and linear interventions in urban infrastructure correspond to those recorded from 2004–2014.
Based on the city’s distribution in urban sectors, we grouped the statistics using Thiessen polygons as the unit of observation, defined based on the centroids of the city’s neighborhoods. We performed this procedure due to the conflicts and ambiguities generated by distributing events on roads that operate in many cases as neighborhood delimiters. However, the detailed review of spatial approaches in road safety studies [
17] shows the wide dispersion of findings due to the use of different spatial scales. The inherent difficulties in defining the boundaries of the units of analysis means that caution must be taken when comparing results with other research (the problem of boundaries and modifiable areal units).
For these reasons, we built the database with 338 Thiessen polygons, in which the fatal events, sociodemographic variables, and infrastructure interventions were distributed. Of the total polygons (338), 254 (75.1%) had some intervention during the entire study period, and 84 (24.9%) polygons, which operated as a reference group, did not receive any intervention in infrastructure by the municipal administration. As such, we defined a binary variable that allowed us to approximate the differential impacts. The models estimated consider the distribution of fatal events, employment, and population within the polygons (these last two variables as proxy variables in logarithms for trip attractiveness and trip production in each polygon). Indicators of socioeconomic stratification and other control variables are also included in the regressions.
2.3. Analytical Model and Methods
The expected value of the fatal events (discrete counting variable) recorded in each of the spatial units (Aj) is associated with the resident population located in each polygon (Pj); commercial, industrial, and service employment as a proxy for the capacity of a given area’s attraction (Ej); and a pair of infrastructure investment indicators (I0914j, I0608j) that measure the proportions invested in each polygon (in the years 2006–2008 and 2009–2014) with respect to the city’s total during the different phases of the SITM-MIO project and the ‘
Megaobras’. The model also considers the distribution of fatal events during the observation window (inertial or previous fatal events count, DA2007–2010) and their total effect on the parametric variability in the 2011–2014 observation window (
Figure 1). The initial specification considers that the number of fatal road events is the expression of a Poisson stochastic variable [
18,
19].
Unlike other studies that have used global methods to estimate fatal traffic events, such as the Poisson global regression models and the generalized Binomial-Negative model [
20,
21,
22,
23,
24,
25], we proposed a local regression estimation strategy that assumes a nonstationary spatial process, in which the regressors locally affect the mortality events through traffic events [
26,
27,
28,
29,
30,
31,
32]. This technique permitted us to model the parametric variability in the city’s geographic space. Although some research has suggested using negative binomial regression models with geographical weights [
33] instead of Poisson specifications, in this paper, we have adopted GWPR models.
2.4. Modeling Strategy
We thus specified a GWPR model that considers the discrete character (spatial count model) of the endogenous variable and allowed us to analyze the distribution of the effects of each regressor of the
Z vector in the city’s geographic space around the centroids of the respective polygons, with (
xj,
yj) latitude and longitude at location
i, as outlined in Equation (1).
In this equation, the parameters
α and
β are a function of the polygon’s location. The variable
ε is the stochastic error term. To capture the parametric variability in the geographic space, we weighted the observations of each neighborhood using a distance or spatial kernel function. In this case, such a function determined the optimal size of the zones of influence (bandwidth) through cross-validation procedures (or via information criteria, such as Akaike) and operated through the square matrix of locational weights, as seen in the main diagonal W (
xj, yj). See Equation (2).
We used an adaptive bisquare kernel in this study [
29,
34] that considers the variability of the zones of influence (
h) around the centroids and takes a value of zero when di (
xj,
yj) >
h. Equation (3) is as follows.
The results obtained for each of the spatial units in the relevant variables can be expressed as weighted means, with the respective robustness and correlation statistics of the regressors with the response variable. Additionally, the estimated models provide the local determination coefficient (R2), which measures the models’ goodness of fit.
The calibration of the GWPR models considers a corrected information criterion (Akaike, cAIC) that is sufficiently low, such that it helps in the decision of the kernel, in addition to its utility as a criterion of bandwidth choice regarding adaptive kernels [
35].
3. Results
In accordance with the analytical model and methodological strategy described in
Figure 1, we now analyze the estimation results.
Section 3.1 presents the estimates of the global models, without considering parametric variability in urban space, and
Section 3.2 the local regression models, GWPR, considering parametric variability and capturing the spatial heterogeneity of the relationships between fatal events and the factors studied in this paper.
3.1. Global Estimates
Between the 2 periods, fatal events declined in the entire city by 23.8%, dropping from 1216 cases between 2007 and 2010 to 926 cases from 2011 to 2014. We observed the greatest aggregate effect in the non-intervention polygons with 26.1%, while in the intervention polygons, the decrease was 23.4%.
The interventions in infrastructure and the SITM-MIO predicted strong impacts in the reduction of road traffic crashes. However, although the mean differences of the spatial tests (p-value ≤ 0.05), ANOVA, were significant in the two observation windows of our study, when identifying the relative responsibility of infrastructure projects, controlling for the variables of urban structure and the inertia factor observed in previous periods, the marginal effects were relatively small, and in many cases, the risk of road traffic crashes in some critical points of the city increased. The marginal means estimated with the Poisson model, controlling for the urban structure factors, showed that the average number of fatal events was 2.42 in the intervened areas and 1.87 in the non-intervened areas; these values are very close to what was effectively observed.
The aggregate coefficients (Poisson global) of the estimation with the dummy intervention variable suggest average values (elasticities) of the effect of polygon attraction potential of 3.7% and trip generation potential of 5.2% (travel production and travel attraction in logs). The greatest effect was found in the inertia variable (previous road traffic crashes count observed in the defined observation window 2007–2010), which reached a mean value of 12.7% when the interaction effect was introduced according to the intervention variable (
Table 1).
In line with what was stated in the introduction, the expected results of infrastructure investments in Cali did not contribute to mitigate fatal road traffic crashes in their areas of influence. Although there was indeed a reduction in fatal road events throughout the city during the period studied, the spatial variability observed is not largely explained by the road infrastructure interventions.
3.2. Local Estimates
After various estimates and considerations of a wide range of predictors of fatal road traffic crashes in Cali (Colombia), we present the results of two GWPR models, calibrated with a semiparametric variant [
36] and an adaptive kernel. We considered the final estimated specifications to be a response variable to fatal road traffic crashes from 2011–2014. The vector of regressors can be expressed using the covariate form (GWPR), with the logarithm as the canonical link function of the population and employment variable in each polygon
j, fatal events from 2007–2010, the variables of intervention, and the dummy variables of socioeconomic strata (Equation (4)) (
Table 1).
One of the models evaluates the marginal effects of the interventions through the interaction between the investment indicators in infrastructure with the dichotomous variable that takes the value 1 in intervened polygons and 0 in non-intervened polygons. The other model estimates the differential effects of the intervened zones with respect to the non-intervened zones through the fixed effects on the fatal events.
In general, the resident population and employment density—as indicator variables of the urban structure through potential travel production and attraction in each of the polygons—were significant in explaining fatal traffic events in Cali. The relative weight of the resident population and the ability to concentrate employment increased the expected value of fatal events (median elasticities in GWPR with fixed effects, and GWPR model with interaction in
Table 1). Nevertheless, in some polygons, the effects were not statistically significant and showed opposite signs to those expected. The deviance percentage, explained based on the local models, which can be assimilated into the coefficient of determination in the Gaussian regression models, was greater than 45%, a relatively high value if we consider that there are omitted variables (such as flow or technical indicators) that are frequently used in traffic engineering and could provide greater explanatory power regarding the expected value of fatal events.
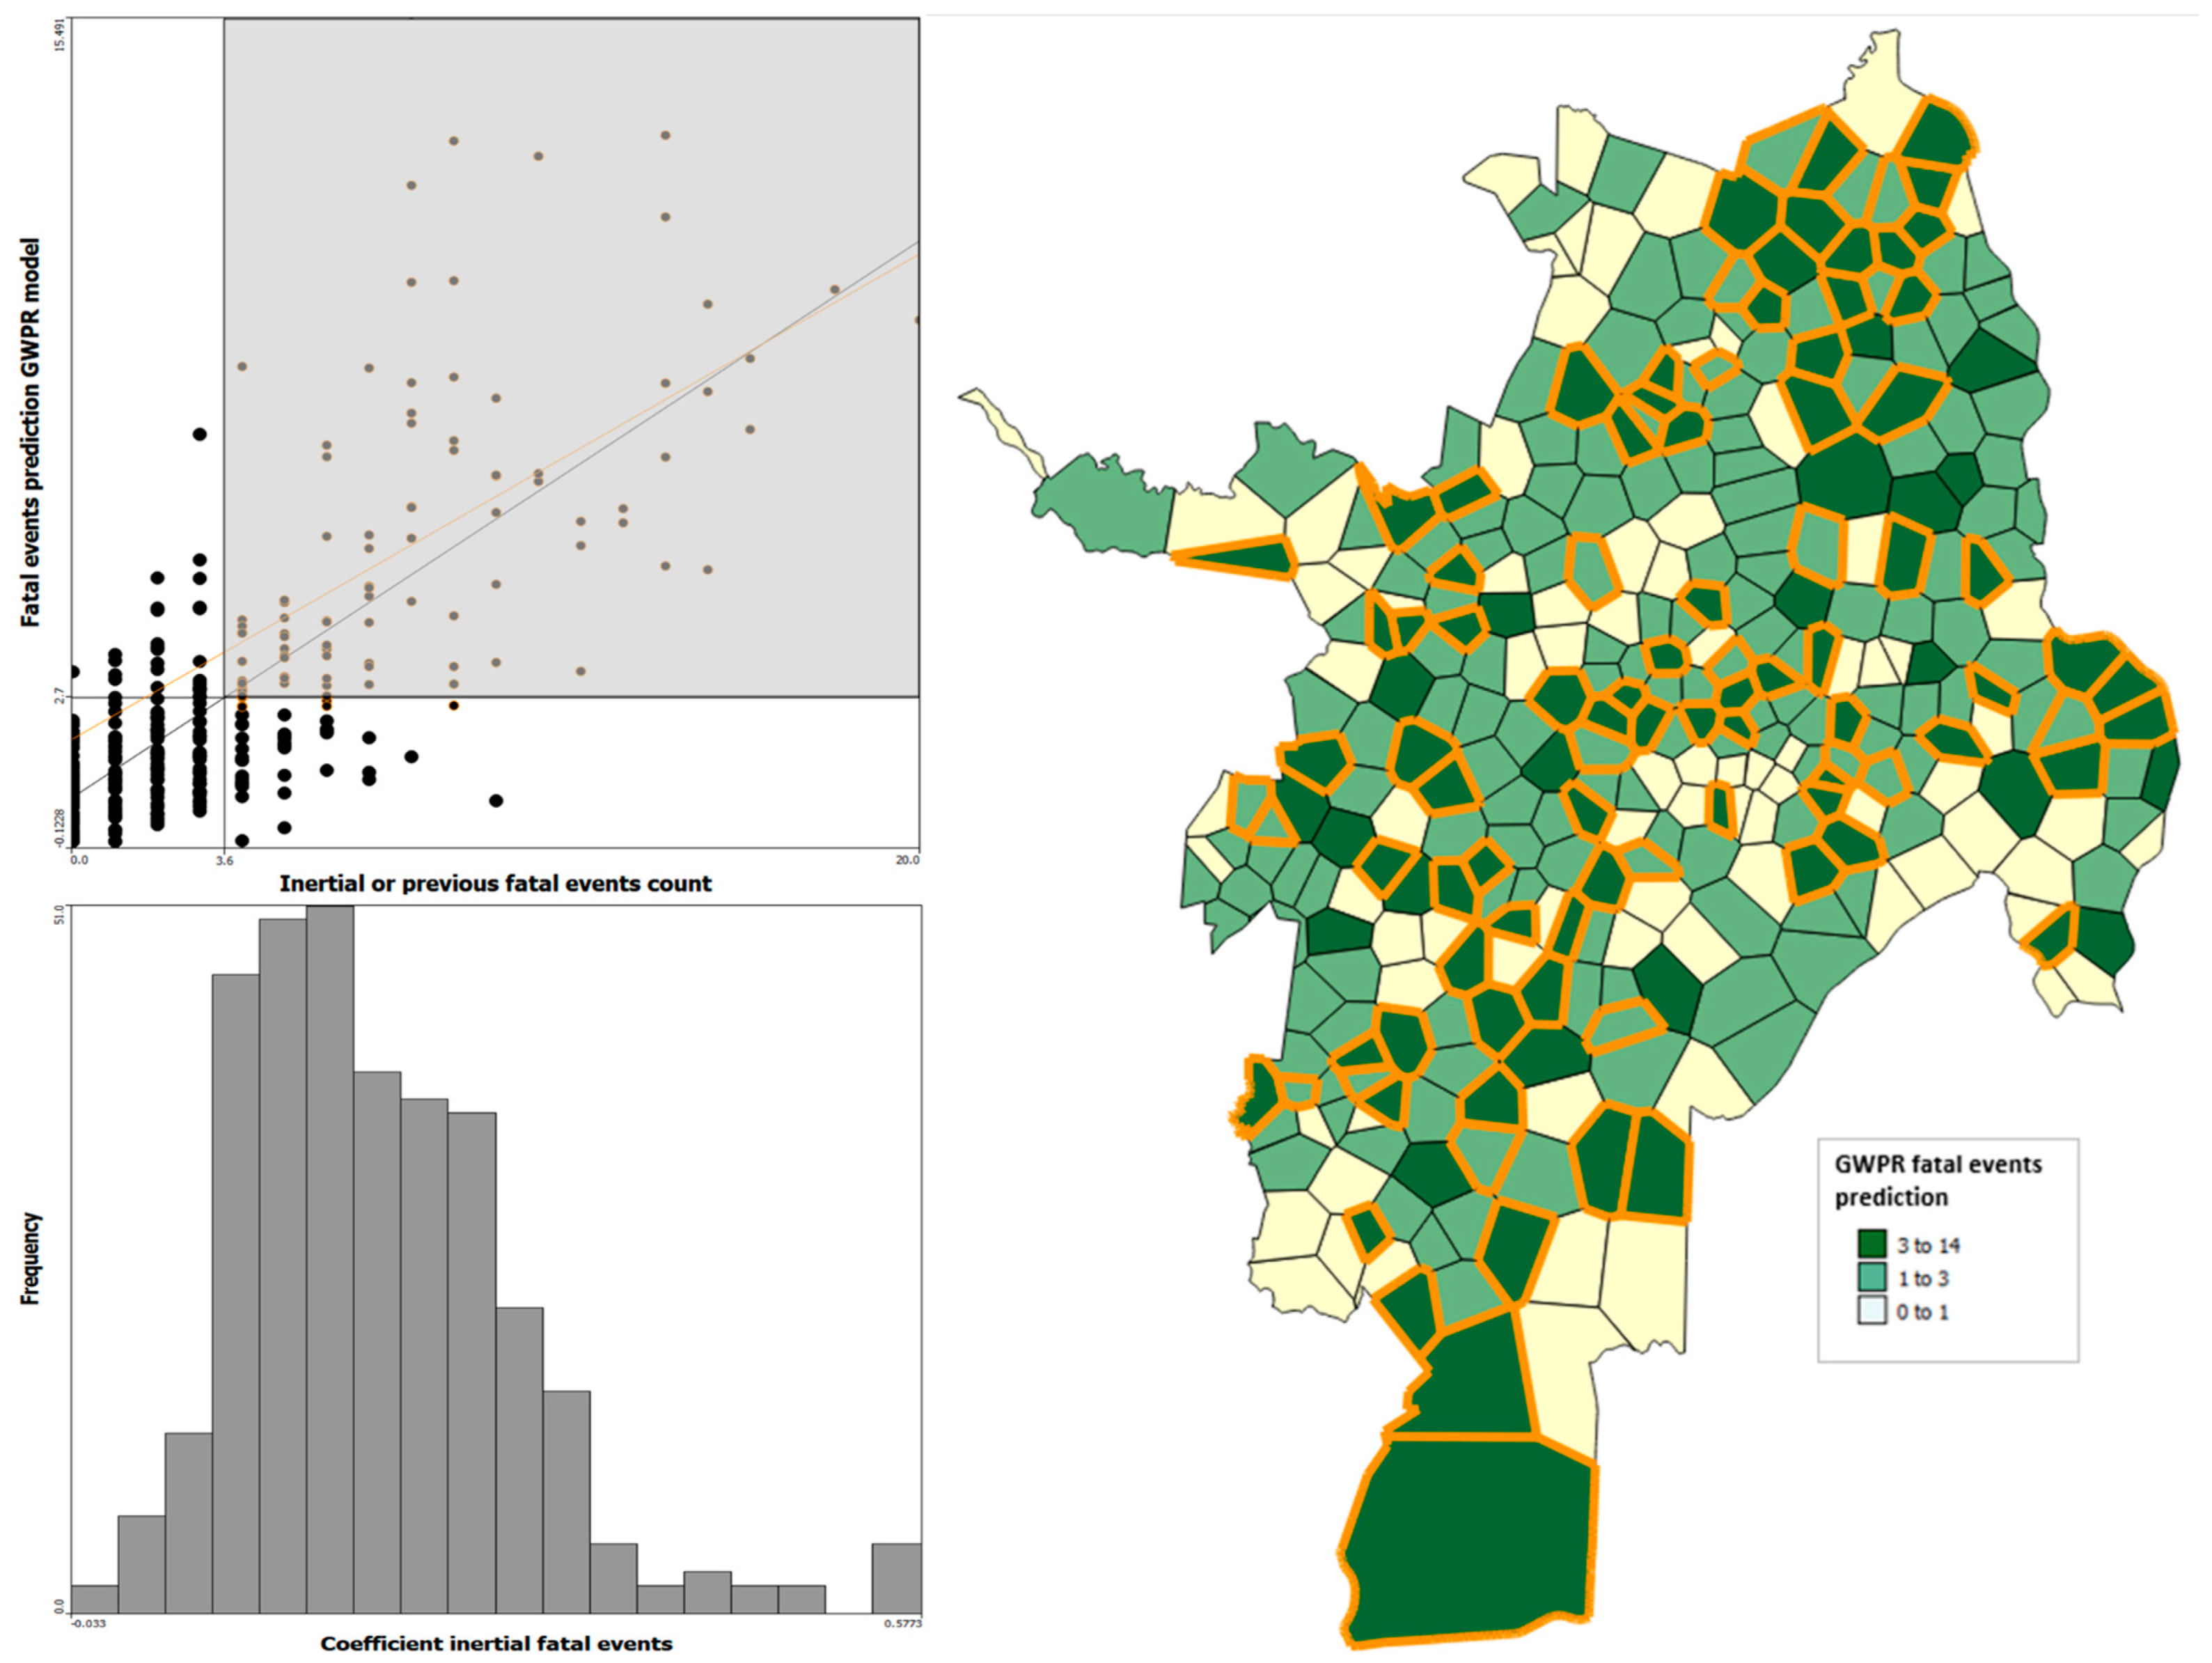
The GWPR model with interaction (
Table 1) estimates showed that the temporal inertia coefficient (previous fatalities in the observation window 2007–2010) presents the greatest differential effects in the intraurban space (
Figure 2). The median effects were 13.6% and 15.8% in the 2 GWPR models, with variabilities that can be seen in the estimated values for quartiles 1 and 3 of the distribution (
Table 1). The variability in the coefficients of travel production and attraction was also wide throughout the city’s geographic space.
For the coefficients associated with the marginal effects of the investments of 2011–2014, we obtained values with a positive sign (contrary to what was expected), although with very low values, that were significant only in some polygons of the city’s traditional center and other critical points. The intervention variable for 2007–2010 was not significant. In terms of the other factors considered in the regression, the effects of the investment variables were very small and, in many cases, not significant, thus suggesting a low contribution to reducing road traffic crashes.
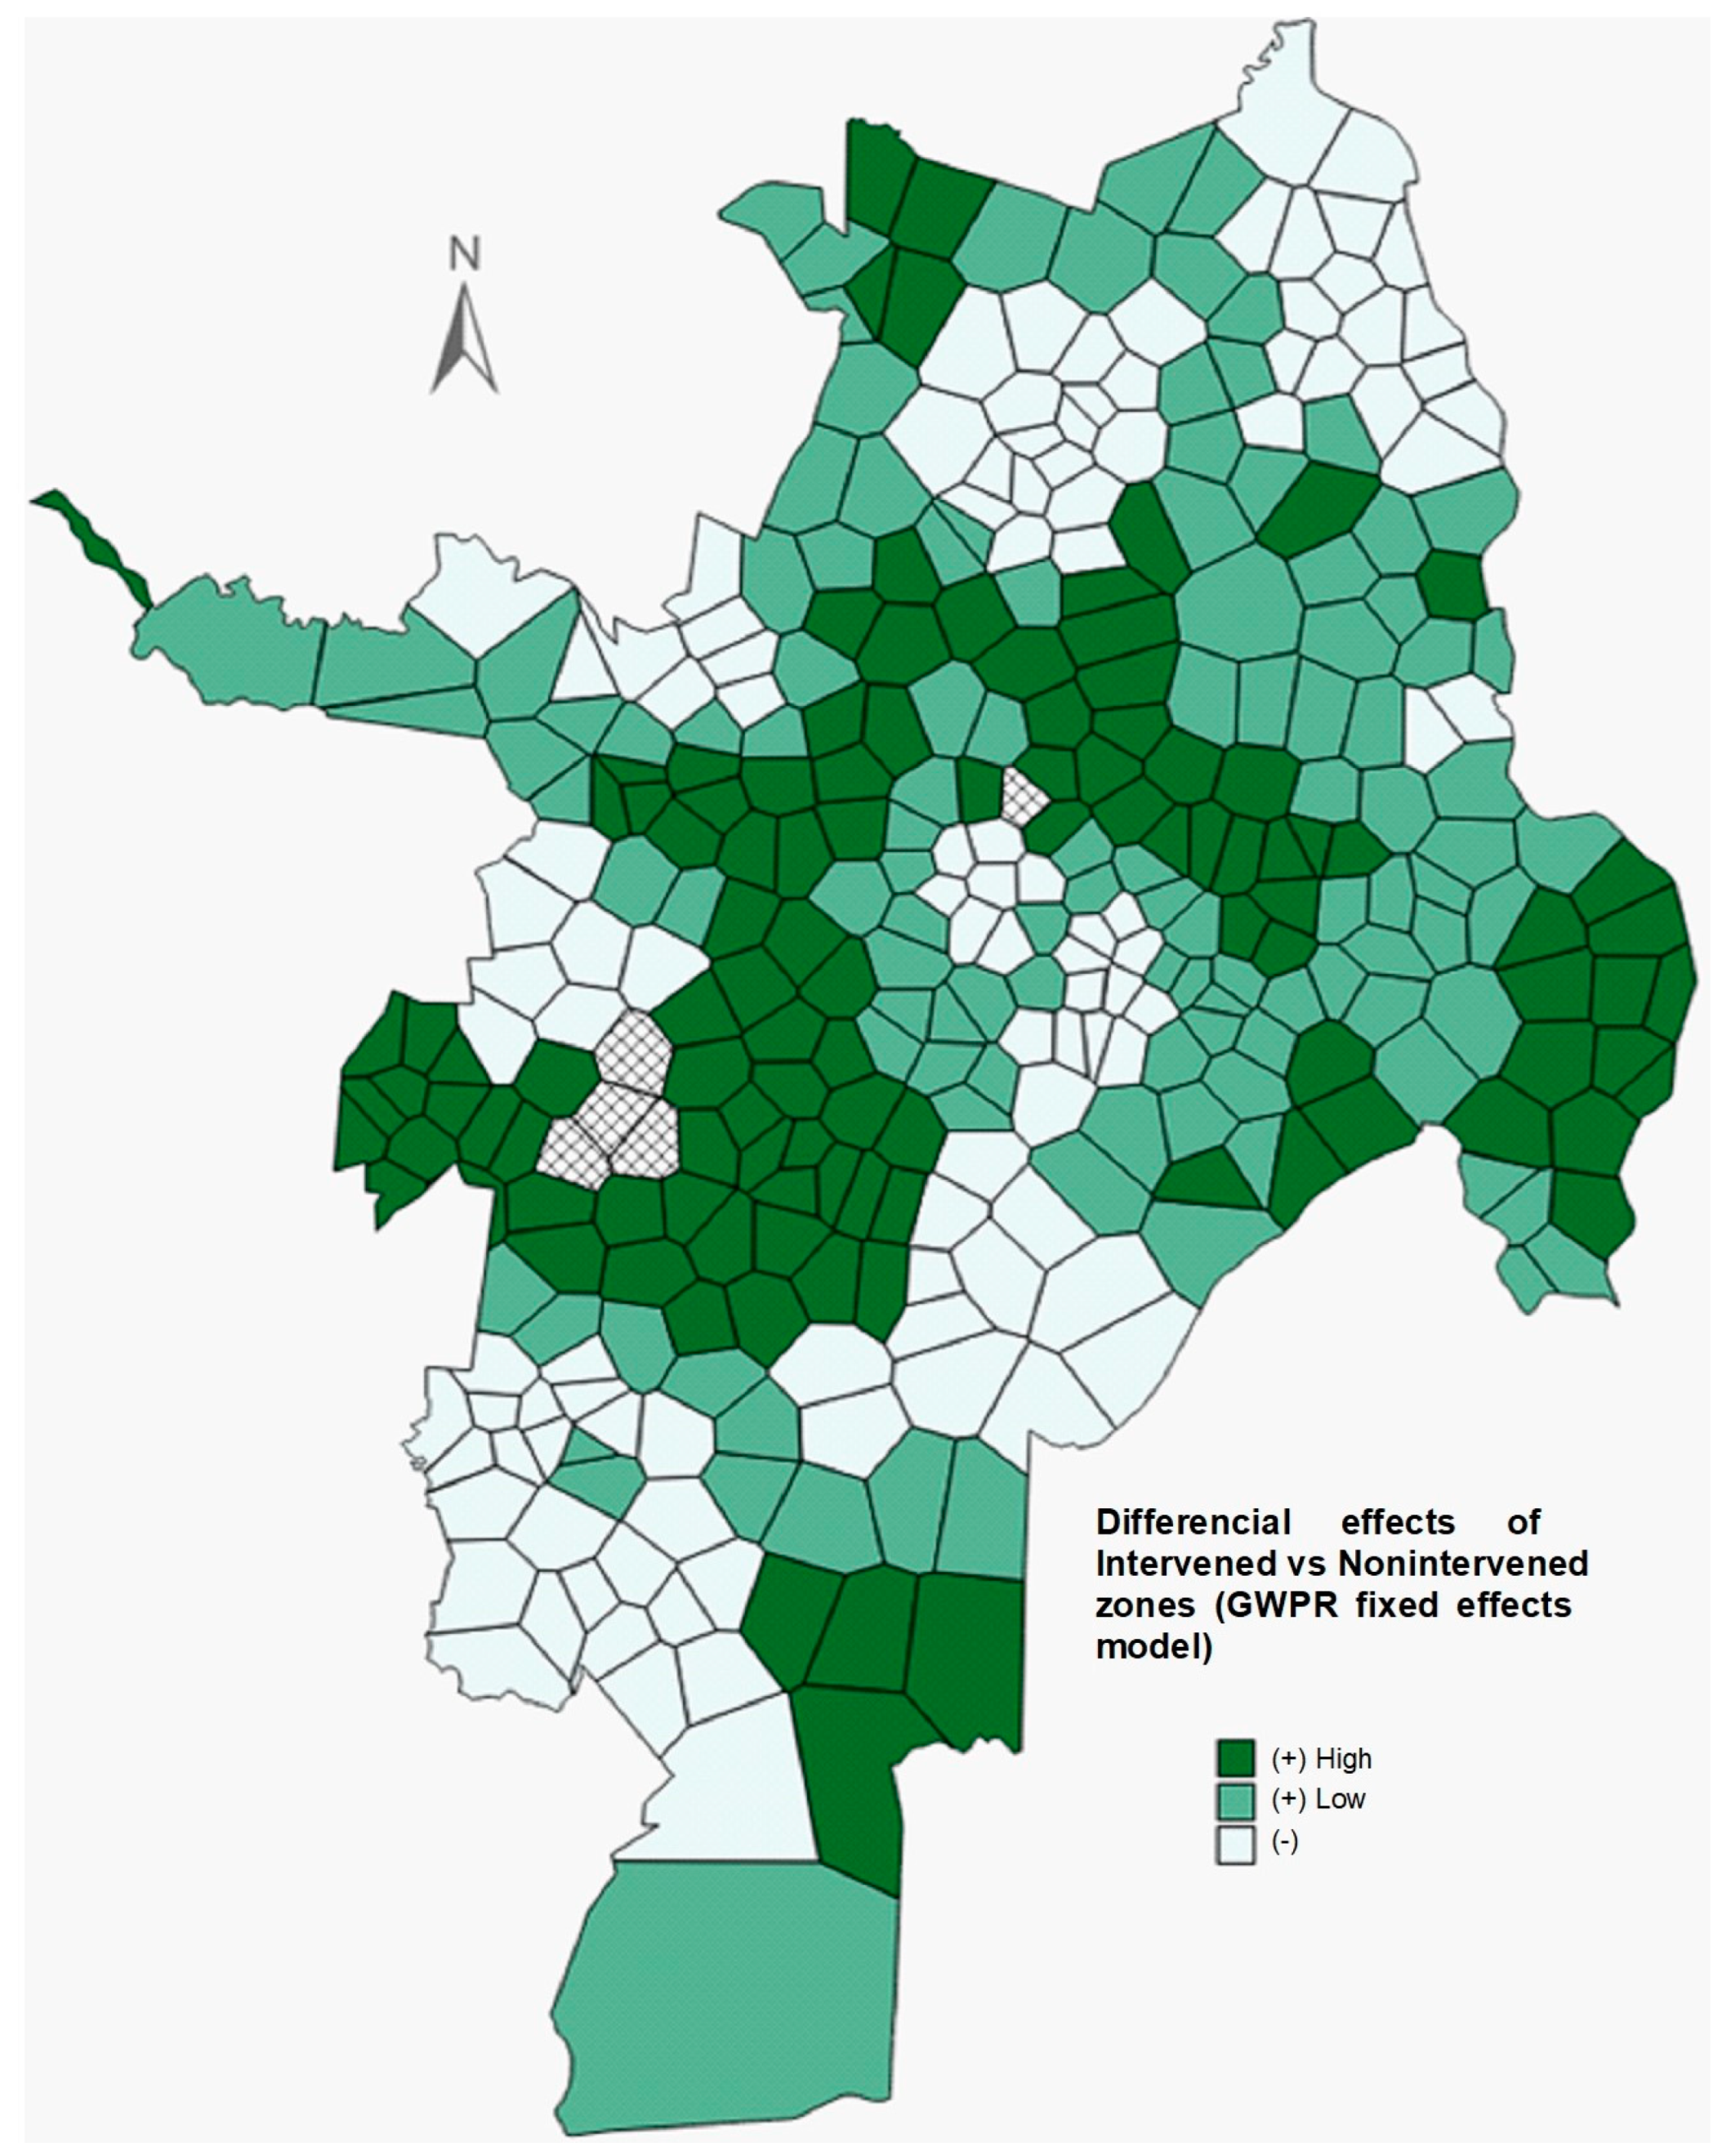
When introducing the dummy variable (indicating intervention through GWPR fixed effects,
Table 1), the result was counterintuitive. The differential effects (median) have a positive sign, indicating that lethal events occurred in a greater proportion in the intervened areas compared to the non-intervened areas in the municipal administration’s investment projects.
Figure 3 shows the distribution of the interventions’ local differential effects. The darker values correspond to the polygons with impacts opposite to the expected effect (positive signs).
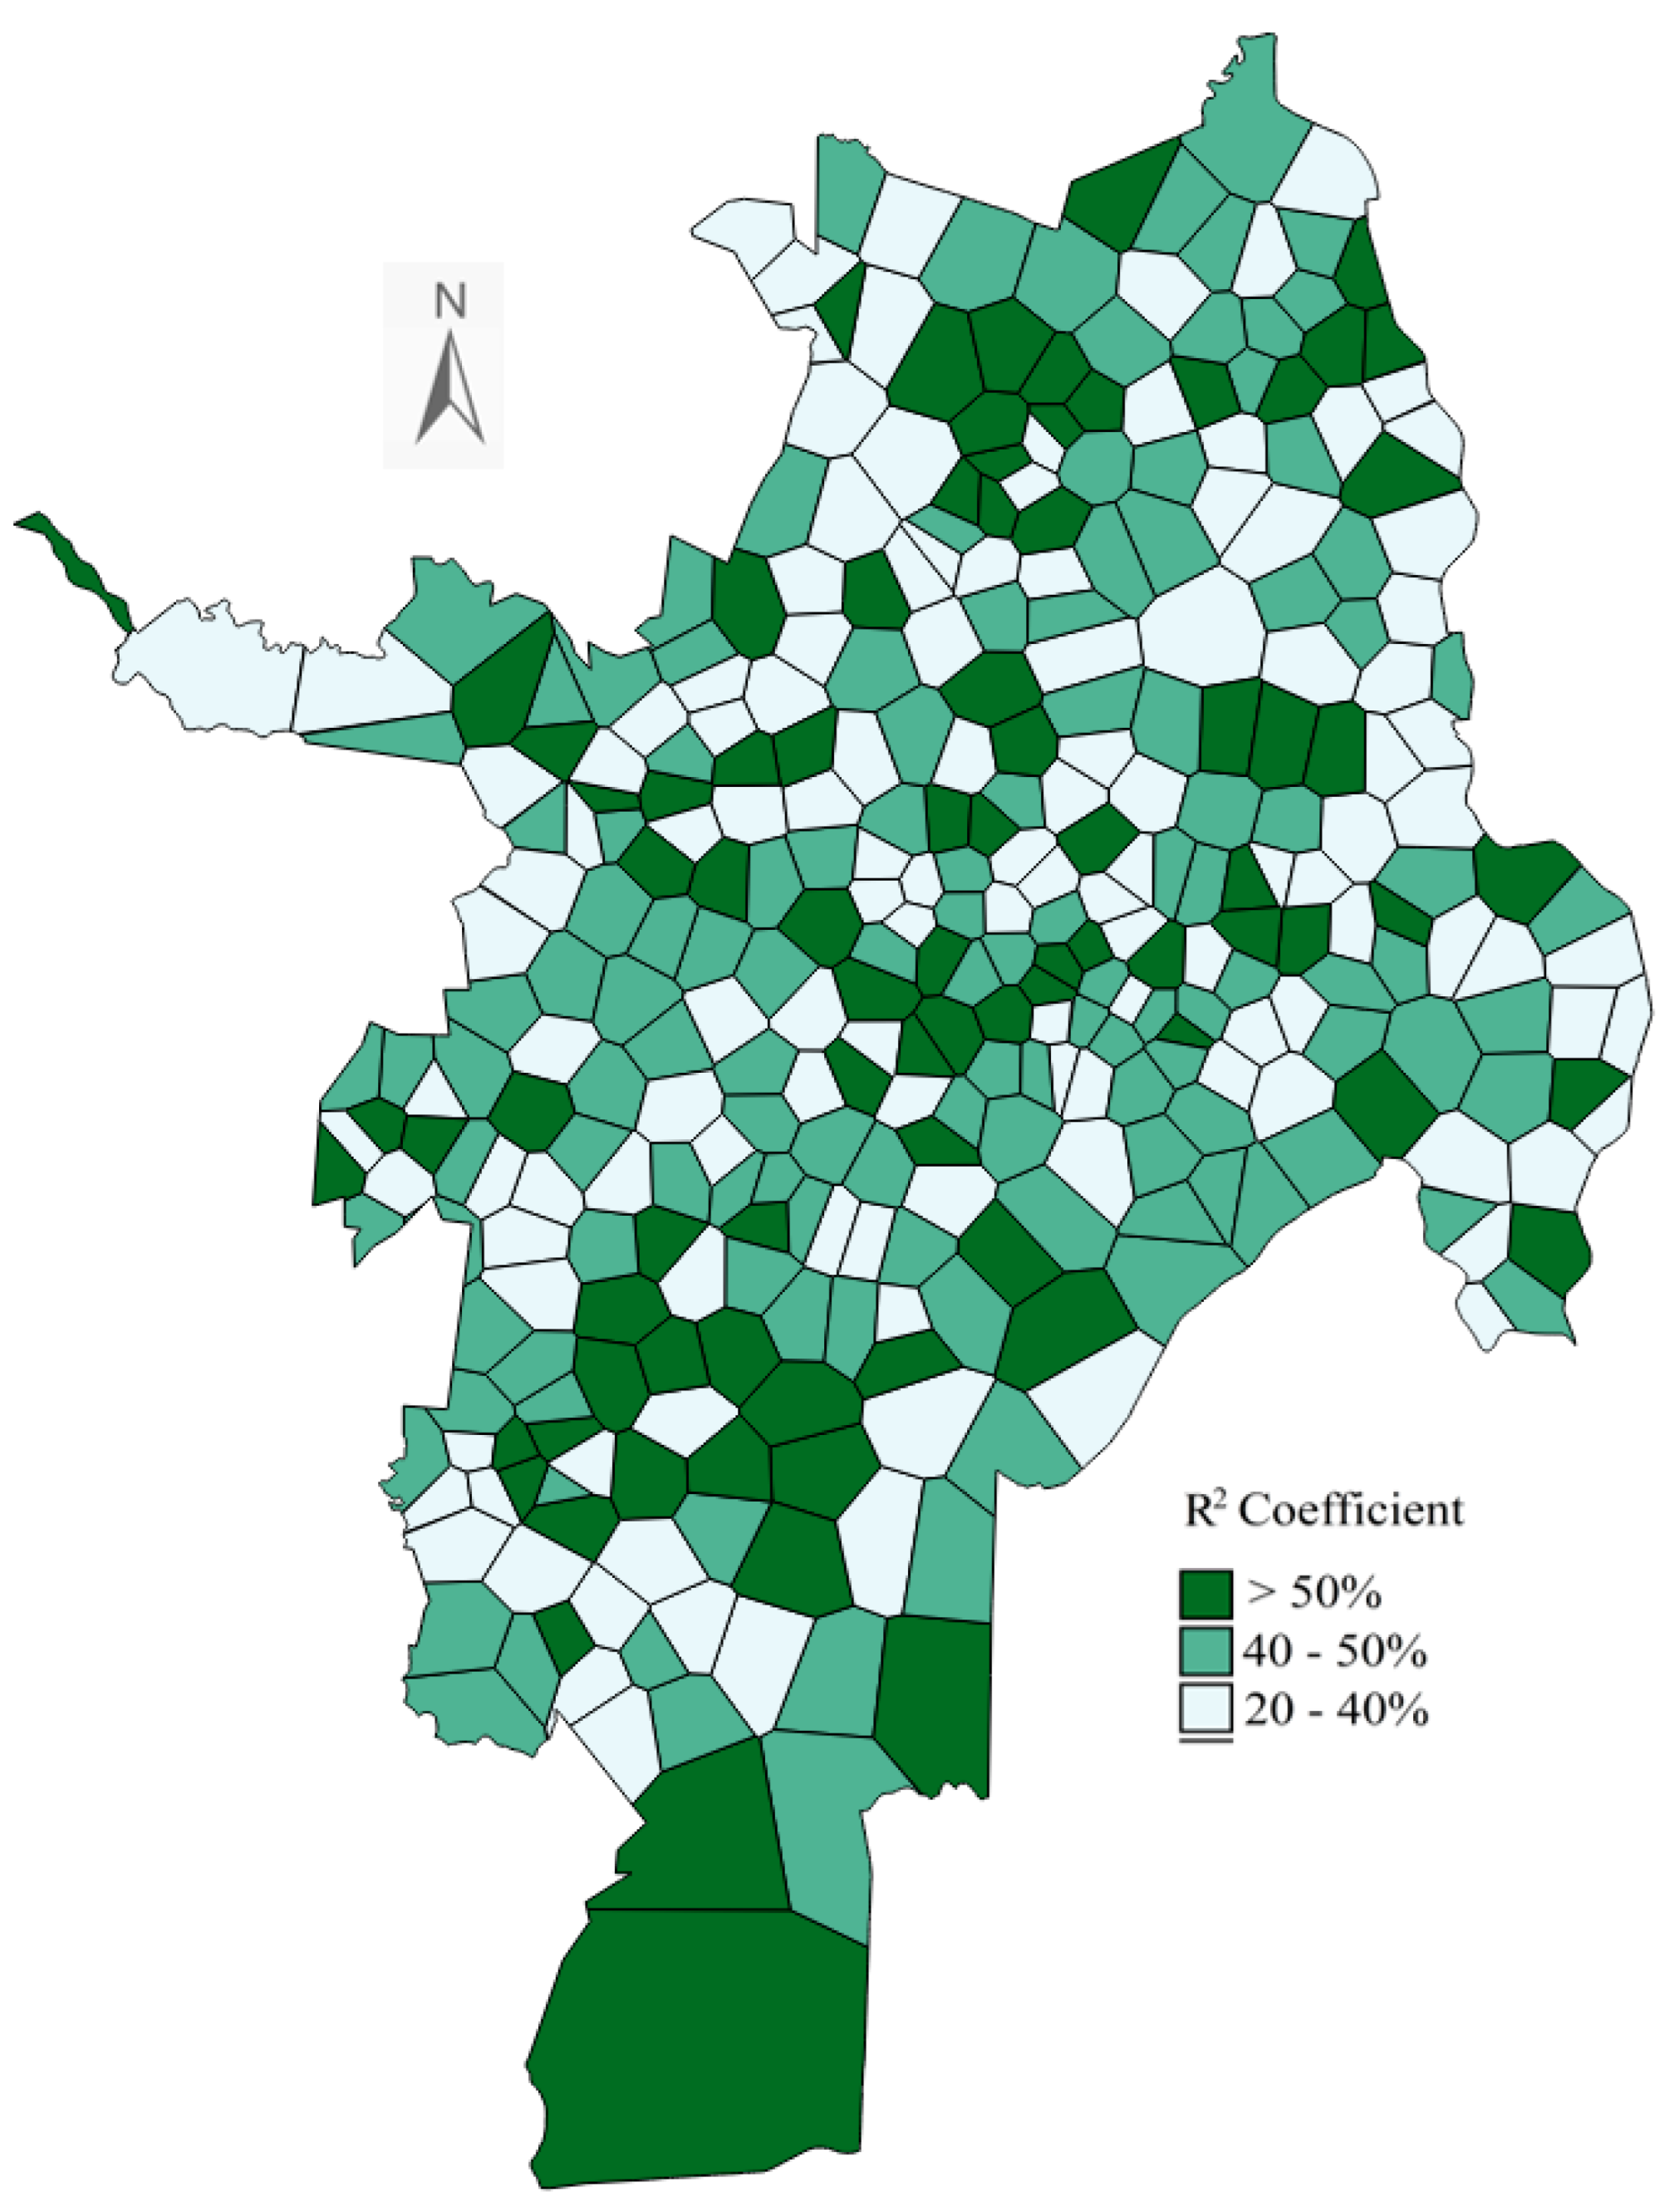
Finally, the results for local estimates of the degree of goodness of fit are acceptable throughout the city’s geographic space, and there are no severe collinearity problems (multicollinearity), as is often expected in these models and discussed extensively in the spatial econometrics literature [
37]. This result facilitates the interpretability and validity of the proposed GWPR models. The spatial distribution of pseudo-R
2, measured based on local deviance, ranges from 24–57%. These values are high if we consider the omission of physical traffic flow variables and indicators regarding the technical characteristics of the routes that could provide greater explanatory content for the response variable (fatal events) (
Figure 4).
These R2 results show that in a large proportion of the polygons of the urban space, the relationship between fatal events and the regressors was significant in the explanation modeled with the GWPR models. The spatial variability of fatal events is explained on average 43.8% (local R2-average) by the systematic and significant part of the model. This is a satisfactory result considering that, according to the epidemiological triad model referred to above, variables of great relevance in the explanation of the response variable are omitted.
Finally, it should be noted that in the polygons marked with light color, inferences should be made with caution due to the relatively low R2 values (126 polygons with an average local R2 of 35.4%).
4. Discussion and Concluding Remarks
We have studied the relationship between investments in transportation infrastructure and the urban structure of the city with the distribution of traffic fatalities. As we note, this is not an impact evaluation, but the contributions on the spatial variability of factors associated with intra-urban road traffic crash rates, controlling for infrastructure interventions and some proxy indicators of urban structure, can provide valuable knowledge for future studies attempting to elucidate the impacts of public interventions on road traffic crashes and fatality rates.
In relative terms, the effects of the construction of urban infrastructure or new highways and ‘Megaobras’ did not offer the results expected by planners and policymakers. The main findings imply that investments in transportation infrastructure did not significantly affect the reduction of fatal road traffic events in the period studied. These outcomes reinforce the contributions of other studies [
38,
39].
The results of the local regression estimations, GWPR, showed that the expected relationships between infrastructure investments and road traffic crash rates are not significant in many polygons of the urban grid. The strategy used with local parametric variability, as opposed to global estimation, is much more convenient and allows capturing the spatial heterogeneity of the relationships derived from the analytical model used in the study.
The estimates effectively show that the urban structure, with its residential, commercial, industrial, and service location patterns, drives the probability of road traffic events occurring in the interior of cities [
40]. These findings were consistent with those of various studies [
26,
32], and the predictions reproduced the spatial distribution of the observed events, again highlighting the central zone and some locations of the longitudinal and eastern axes of the city as critical points.
The differential effects of the intervened areas (compared to the non-intervened areas) were small. In contrast, in some polygons, mega-infrastructure projects and some SITM-MIO crossings generated a greater risk of road traffic crashes, perhaps as an effect derived from the same works and the mismanagement of mobility alternatives.
As can be seen from the analytical model of the study, the interactions between the factors associated with the occurrence of traffic events are complex [
41]. Assuming that investments in infrastructure [
42,
43] contribute significantly to reducing road traffic crash rates is a hypothesis that has not been demonstrated in our study. These findings are consistent with those reported by some authors in the literature, in which the greatest effects are attributed to human factors [
44] (see
Figure 1).
The predictions of the GWPR model fit very well with the observed events, and after controlling for the variables of travel production and attraction, the net aggregate effect of infrastructure investments in the city was very low or nonsignificant when comparing the two windows of observation.
We attributed the greatest effects on road traffic crashes to the inertia variables of the traffic crash hot spots noted in the previous periods and to the variables of travel production and generation, although with great spatial variability in the overall urban area. This finding provides new evidence that the urban structure plays a decisive role in explaining mortality due to road traffic events.
In addition to behavioral factors, the absence or weakness of adequate regulatory frameworks and other factors associated with road insecurity (which are not the topic of this study)—as seen in the pattern observed in our research—reinforces the idea that the configuration of urban spaces, the areas of activity, the potential for travel attraction, and work and service production increase exposure rates and the risk of road traffic crashes in cities that do not have comprehensive planning systems, as is the case of Cali and many municipalities in Latin America.
It is also necessary to recognize that the results could reflect the weak segregation of motorized from non-motorized modes of transport in Cali (pedestrians and cyclists) [
45] or, perhaps, reveal deficiencies in the geometric design of roads [
46], the presence of fixed objects [
47] near traffic lanes, and deficiencies in victim care services (ambulances and intensive care units) [
48].
The findings suggest that large problems require high-cost solutions and large investments [
49]. However, when effective impacts do not match expectations and public spending (which involve high economic and social costs in complex infrastructure projects), serious doubts remain about the correct intervention mechanisms. Such is the case of Cali, which implemented road interventions to expand main roads and to build intersections with overpasses and down lanes, which were undoubtedly necessary, but not accompanied by road education strategies, control, and constant monitoring. In terms of constant monitoring, the evaluation of the cameras for automatic traffic infraction detection in Cali showed positive impacts, with decreases in road traffic crashes in both the intervened areas and the comparison areas [
16]. However, it is necessary to carry out and evaluate other interventions for education and road control in Colombia.
Finally, it is necessary to recognize that we provided inputs for the modeling of fatal events in the city and revealed the benefits of local estimates, particularly regarding the design of geographic weights, compared to other global modeling strategies, in which the coefficients are assumed to be stationary in the intraurban space. The performance of GWPR has been compared with that of a traditional generalized linear model (GLM), and the results have shown that the former is more efficient in estimating the nonstationary spatial relationships between fatal traffic events and the independent variables. The incorporation of spatial heterogeneity through the GWPR surpasses the GLM in predicting fatal road traffic events, considering the low number of events in each spatial observation unit, while reducing the spatial correlation of the residuals of predictions of fatal traffic events [
29].
These findings lead us to deduce that the reduction of fatal road traffic events is not associated per se with investments in road infrastructure and that investments do not contribute to greatly reducing tragic events on city roads. In line with other studies, there are associated factors that generate greater effects in reducing road traffic crashes. In a systematic review, Lefio and co-workers [
11] indicated that the interventions with the greatest impact on the reduction of road traffic crashes and the injuries they produce are national programs on alcohol control, control cameras, speed control, and the use of helmets and protective equipment, among other factors associated with educational programs and some specific infrastructure interventions aimed at high-risk areas.
However, several points remain unresolved in terms of more complex modeling structures that manage to integrate the municipality’s socioeconomic and intervention variables, including physical indicators and vehicular flows in the main areas along arterial roads and at intersections. In addition, a more complete design with new information could be considered to carry out a real impact assessment of public interventions on road traffic crashes and fatalities. Such advancements would allow us to estimate new prediction models that are more accurate and robust than those proposed in this article.
Finally, it is necessary to emphasize that we do not have information on the traffic management plans (TMPs) implemented during the process of constructing road interventions. Despite the complexity of the projects and their implications for vehicular flow in other road corridors, we noted a limited technical rigor in these TMPs, which was probably associated with the effects generated by the interventions in their areas of influence. Nevertheless, in recent years, the municipal administration has made remarkable efforts to improve the conditions of the presentation and review of these TMPs and their systematization and filing, which will allow for more rigorous evaluations of future interventions and their impacts during all phases of implementation [
50].
The experience provided in this article suggests that investment in infrastructure per se is insufficient when it is intended to generate a significant reduction on road traffic mortality. The infrastructure indicators did not show conclusive results, which merits future research to elucidate the true role that these interventions play in preventing road traffic crashes.
Based on the main findings and implications, we concluded the following: (a) In Cali (Colombia), inertia persists in some critical points with patterns of recurring fatal road traffic crashes, as is the case of the downtown area, in which economic activities are concentrated and where they produce and attract a significant proportion of travel for work, trade, and services. (b) The modest effects of road infrastructure projects on fatal road traffic events did not correspond to the high social and economic costs involved in the investments. (c) Our results imply that it is necessary for the public administration to adopt a comprehensive planning approach that considers the complexity of the urban structure, for rational resource use in current and future interventions. (d) In terms of the potential for travel attraction and generation in monocentric cities or those that move toward polycentric structures (as is the case of Cali, which stands as a regional epicenter of great hierarchy), the patterns of urban land use have shifted dramatically in recent years [
51]. These shifts require rethinking the intraurban model of transport mobility to influence the externalities it generates on the environment, congestion, and road traffic crashes.
Despite the contributions and findings of this article, it is necessary to recognize that there are still limitations that need to be overcome in future research: (i) due to the restrictions of more disaggregated information, the models did not include variables such as motorization rate and age of the vehicle fleet; (ii) they did not consider the factors associated with the other dimensions [
52,
53,
54] of the epidemiological triad that inspired the analytical model of the study (human factors and vehicle factors); (iii) the global and local models were estimated, taking into account the polygon arrangement, which could be improved in the future with information disaggregated by events and zones.
With these findings and despite the limitations mentioned above, we seek to contribute to the understanding of fatal road traffic events as an essential basis for the design, planning, and formulation of public policies on sustainable urban mobility.


 ,
, 


