
Natech Accidents Triggered by Heat Waves


1
Laboratory of Industrial Safety and Environmental Sustainability—LISES, Department of Civil, Chemical, Environmental, and Material Engineering, Alma Mater Studiorum University of Bologna, Via Terracini 28, 40131 Bologna, Italy
2
Department of Civil and Industrial Engineering, University of Pisa, Largo Lucio Lazzarino 1, 56126 Pisa, Italy
*
Author to whom correspondence should be addressed.
Safety 2023, 9(2), 33; https://doi.org/10.3390/safety9020033
Submission received: 11 February 2023
/
Revised: 14 April 2023
/
Accepted: 18 May 2023
/
Published: 22 May 2023
(This article belongs to the Special Issue Worldwide Accidents: Trends, Investigation and Prevention)
Abstract
:Natech accidents have an increasing relevance due to the growing number of such events and to their severe consequences. Climate change and global warming are intensifying the occurrence and the magnitude of climate-related natural events, further increasing the risk of cascading sequences triggered by natural disasters impacting industrial installations. The present study focuses on Natech triggered by heat waves. The features of this specific category of Natech events were investigated by past accident analysis, collecting an extended dataset of past events. The dataset analysis allowed the identification of the key factors that characterize these accident scenarios, such as the direct causes, the technological scenario that occurred, the substance categories, and the equipment items more frequently involved. The main direct cause of accidents resulted in an internal pressure increase, exceeding equipment design limits. Fire scenarios represent the most important category of technological scenarios that occurred. Besides equipment items handling liquid and gaseous hydrocarbons, waste storage and processing systems also resulted frequently in accidents, due to the self-decomposition and self-ignition phenomena. The analysis of past accidents also allowed identifying some lessons learned, useful to identify specific actions aimed at preventing and/or mitigating the possible occurrence of these accident scenarios.
1. Introduction
Natural events are widely recognized as triggering factors of industrial accidents. Accidents initiated by the impact of a natural event on an industrial site are referred to as Natech (Natural event triggering a Technological disaster) scenarios [1]. The concern related to these peculiar events increased in recent decades due to the occurrence of severe accidents, such as those following the Kocaeli earthquake in 1999 [2], the hurricanes Rita and Katrina in 2005 [3], and the Great East Japan earthquake and tsunami in 2011 [4]. The number of severe natural events and disasters is growing over the years [5,6], making industrial sites more exposed to such events, thus increasing the frequency of Natech accidents [7,8]. Thus, growing attention is dedicated in the literature to Natech accidents, and several recent studies are contributing to building a clearer and complete understanding of the features of Natech scenarios. However, to date, the attention has mostly focused on intense natural disasters having a limited duration, such as earthquakes, floods, tsunamis, and hurricanes. For such events, the lessons learned were derived from the detailed analysis of relevant Natech accidents [9,10,11], and vulnerability models were developed to evaluate the failure probabilities of equipment items, as in the case of earthquakes [12,13], floods [14,15,16], and hurricanes [17]. Moreover, for these categories of natural events, several methodologies for the Natech quantitative risk assessment are available in the literature, based either on the extension of conventional QRA [18,19,20] or other innovative approaches [21,22]. Thus, the consolidated knowledge and quantitative approaches to risk assessment are present in the literature for Natech accidents triggered by such intense natural events.
Nevertheless, Natech accidents can be triggered in principle by any kind of natural event, even those characterized by “low” intensity, such as extreme temperatures, which caused a relevant number of accidents in the past [7,8,23]. However, limited attention was devoted to date to the interactions with industrial installations of these types of events [24,25].
When considering extreme temperatures, two different scenarios may be recognized. The first is related to the impact on industrial installations of cold waves, causing low temperatures, snow, and the formation of ice. The opposite is related to heat waves, resulting in high temperatures, drought, and related events. As suggested by a preliminary study carried out by Ricci et al. [26], these extremes may affect differently industrial installation, and a detailed analysis of the cascading events and resulting accident scenarios that may be triggered should be carried out separately. Recently, an in-depth analysis was carried out to assess the possible impacts of cold waves and industrial installations, considering both equipment items and safety barriers [27]. Nevertheless, limited attention was devoted in the literature to the study of heat wave-related accidents. Thus, the present contribution aims at filling this gap by focusing on cascading sequences and Natech scenarios triggered by heat waves.
According to the Intergovernmental Panel on Climate Change [28], climate change and global warming have increased the mean and the maximum ambient temperature, and similar trends are forecasted for future years. As a result, warm seasons are longer, and more severe drought conditions are experienced. These factors promote the conditions for development and the rapid spread of wildfires [29,30], which are one the most severe outcomes of this critical scenario. Indeed, extreme wildfires took place in recent years, such as those occurred in California in 2020 and 2021 [31,32,33], Canada in 2015 and 2016 [34], Portugal in 2017 [35], and Greece in 2018 [36], demonstrating the devastating consequences that the wildland–urban interface may suffer when hit by wildfires. In this framework, some studies focused on the hazards posed to industrial installations by wildfires spreading in wildland–urban [37,38] and wildland–industrial interfaces [39,40,41]. Nevertheless, limited attention was devoted in the literature to the direct effects of heat waves and of extremely high ambient temperatures on industrial installation [24,25]. Actually, climate change is enhancing the occurrences and the intensities of such natural events. Moreover, heat waves usually impact extended areas, thus potentially impacting on a high number of installations.
In the present study, a dataset of past Natech accidents triggered by heat waves was collected and analyzed, aiming at improving the understanding of such accident scenarios and at drawing lessons learned that may contribute to preventing their recurrence. Section 2 reports the methodology used for the data retrieval and describes the features of the dataset. Relevant aspects of the cause–consequences chain of cascading events triggered by heat waves are assessed in Section 3. Lessons learned are discussed in Section 4 identifying the specific pathways through which heat waves may affect industrial installation and providing recommendations that in perspective may be useful to prevent or mitigate Natech accidents caused by such events in the future. Some conclusions are drawn in Section 5, remarking the threat posed by heat waves to industrial installations and confirming the need to properly manage the hazard deriving from heat waves in industrial sites.
2. Past Accident Dataset
2.1. Data Collection
The database developed by Ricci et al. [7] was used as the main source of data in the present study. This database includes over 9000 accidents [42], incidents [42], and loss of containments [43] caused by different natural events. The events included in the database occurred in a time period ranging from 1950 to 2018 all over the world. The more important original sources of the data included in the database were the eMARS [44], MHIDAS [45,46], TAD IChemE [47], ARIA [48], NRC [49], and CONCAWE [50] industrial accident databases. The data contained in these databases are all openly accessible in the public domain. More information on these databases is reported elsewhere [7,51,52]. These sources are variegated and provide records with different levels of detail.
In the present study, data on Natech accidents caused by heat waves were extracted using specific queries including the keywords: “high temperature”, “hot weather”, and “heat wave”.
A specific literature search was then carried out, to update the dataset extracted from the database of Ricci et al. [7] and include also more recent events. The literature search was carried out adopting the same procedure used to build the database by Ricci et al. [7]. The data sources mentioned above were queried to retrieve additional records relevant to heat waves. The keywords used for the extraction are the same used to retrieve records from the generic Natech database [7]. Particular attention was devoted to the inclusion of near misses [42]. Indeed, the present study aims at the characterization of the cause-consequence chain in the case of heat waves. In this framework, near misses represent a useful source of details even if no consequence occurred. For the same reason, records that occurred in sea transport were excluded due to the peculiar characteristic of the sector.
2.2. Dataset Structure
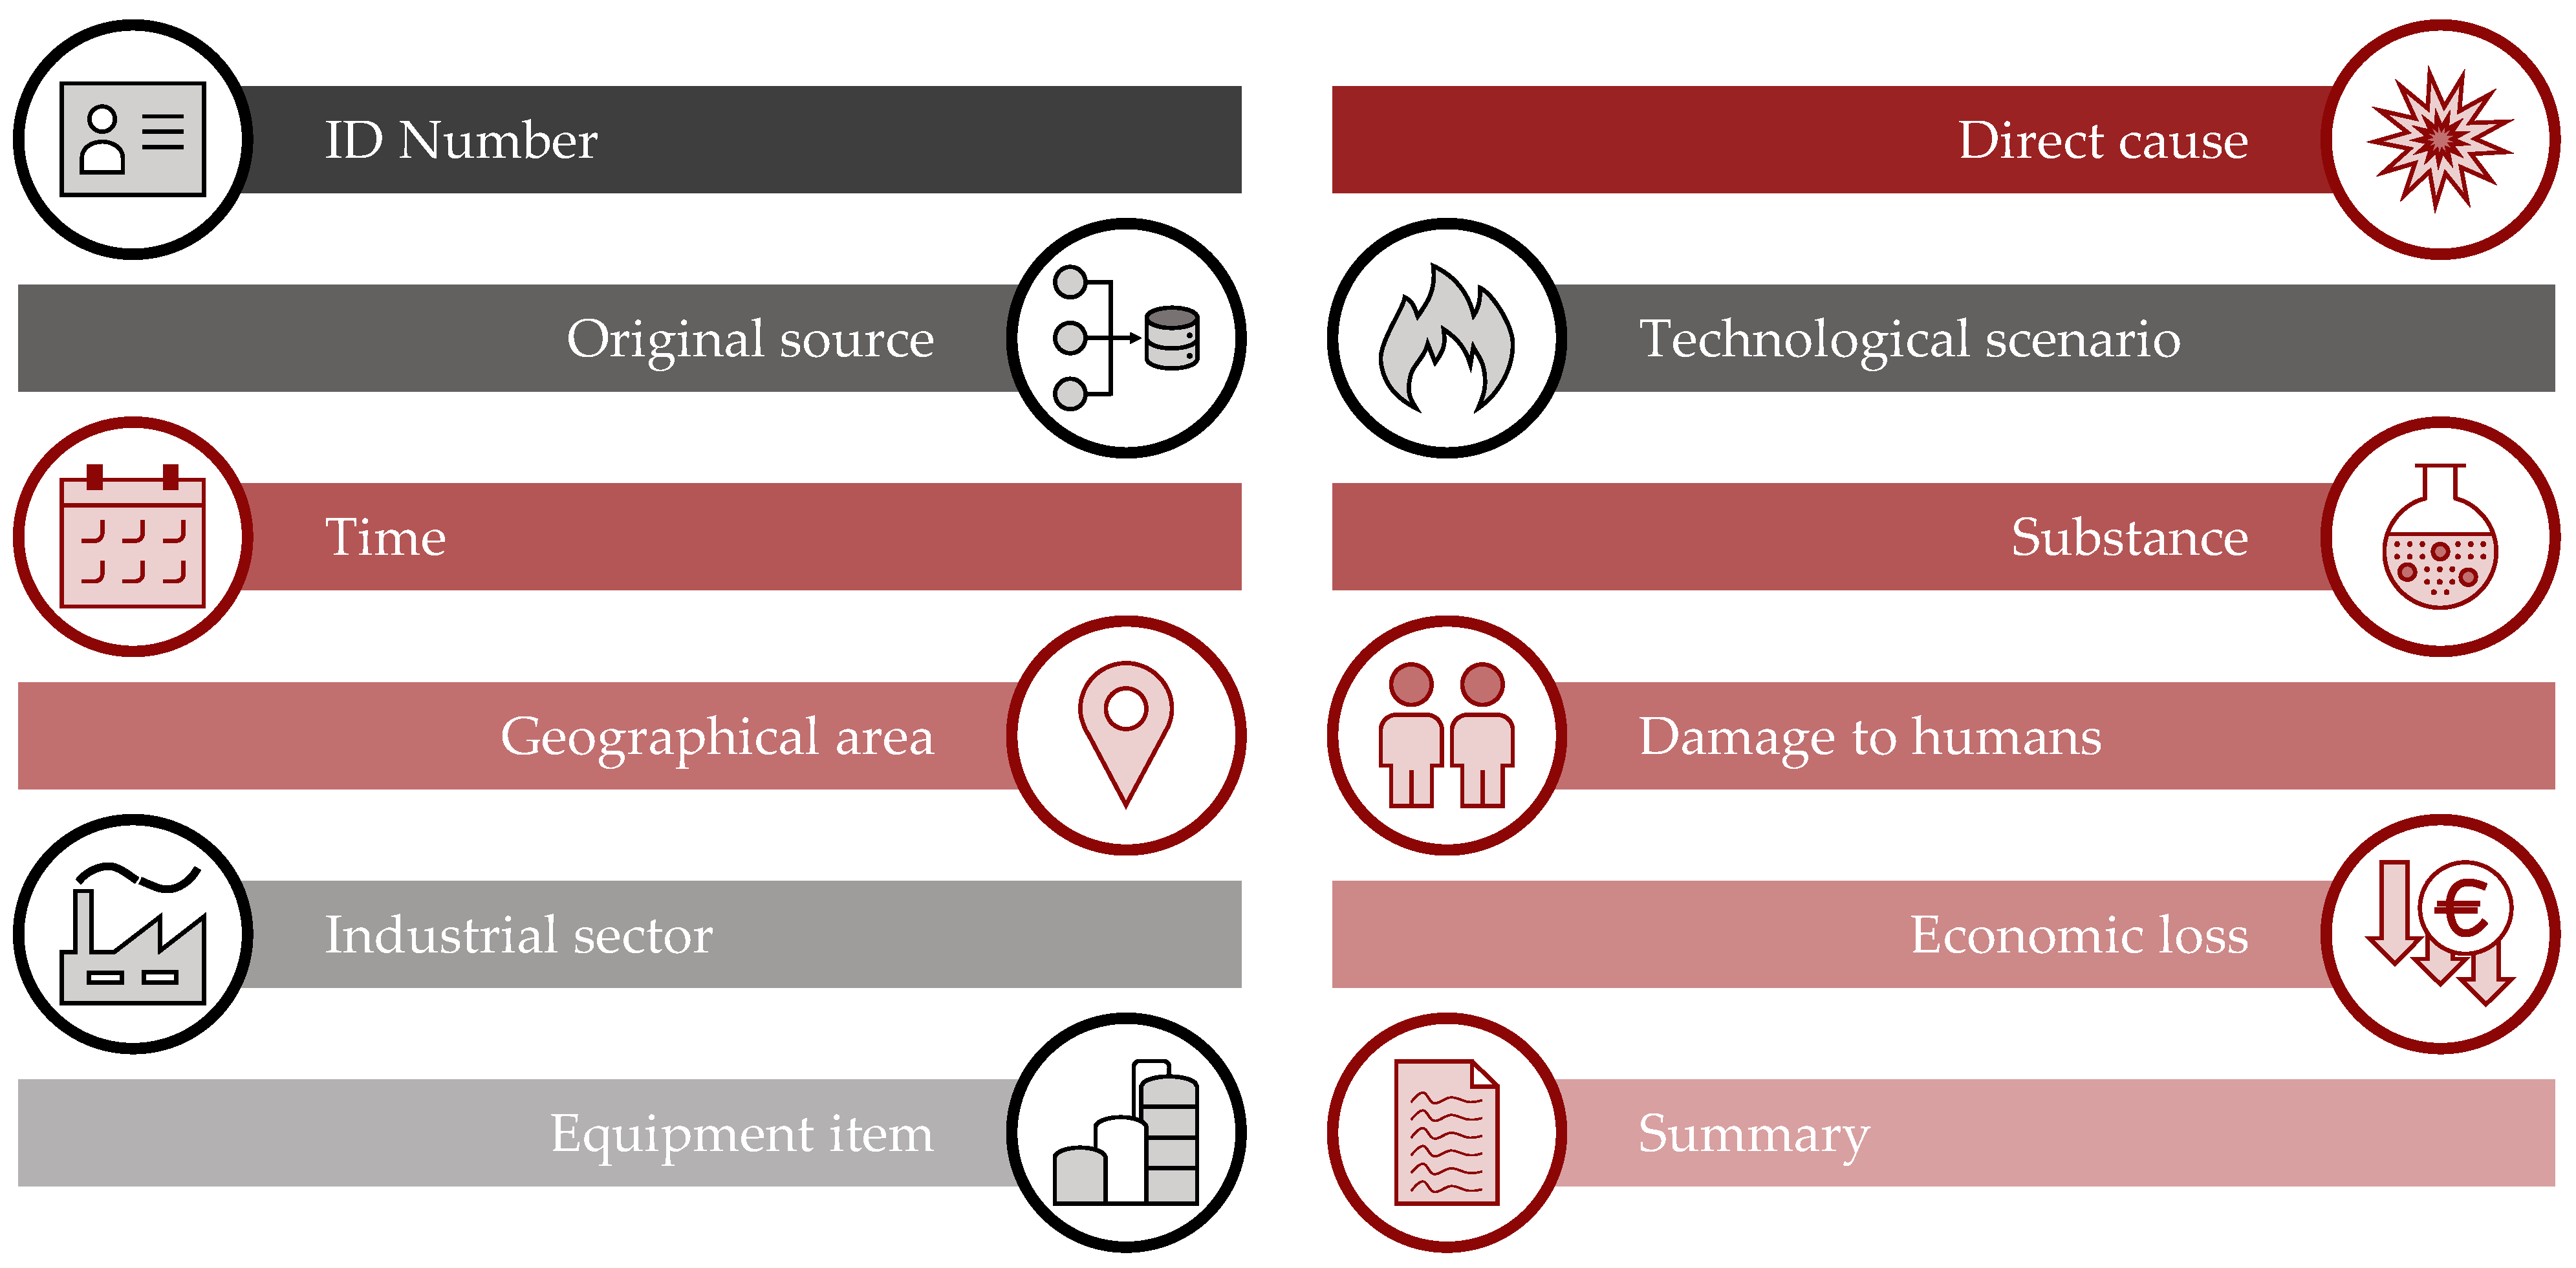
The events collected from both the original database of Ricci et al. [7] and the new search carried out were used to build a specific dataset. The dataset was structured as shown in Figure 1.
The structure of the dataset was derived from that used in the database of Ricci et al. [7]. However, some modifications were introduced to better represent the cause–consequence chain of the events. In particular, additional fields were created to allocate information related to the industrial sector involved in the event and to the equipment items affected by heat waves, as well as on the direct cause of the accident.
As shown in Figure 1, in some of the fields of the datasets, entries may only be selected from an itemized list. The itemized lists used to compile the dataset are reported in Appendix A.
3. Results and Discussion
3.1. Original Sources and Geographical Location of the Events
A total of 204 Natech accidents triggered by heat waves were collected based on the criteria described in Section 2. Table 1 reports the share among the original sources of the records included in the present study. The ARIA database represents the main source of information, providing around 70% of the events in the dataset (141 records). The second source is the NRC database, providing a total of 55 records included in the study (27% of the total). Although a limited number of records were collected from the other sources, a high level of detail, allowing the characterization of the cause-consequence chain of the accidents, is provided by the accident files obtained from the eMARS, the MHIDAS, and the TAD IChemE databases.
It is interesting to notice that the share among the original sources is quite different from that of the complete database of Ricci et al. [7]. Indeed, in the generic Natech database, the main data source is the NRC database (over 85%), while the ARIA database provides only about 12% of the information [7]. The different share among the original data sources is correlated to the differences in the geographical distribution of past accidents. Indeed, most of the accidents in the dataset occurred in Europe (144 records, 70.6% of the total) and in North America (59, 28.9%). The site of the accident was unknown in a single case. When considering the country, most of the accident records that occurred in North America took place in the United States of America, while France is the country where most of the past accidents recorded in Europe took place. Actually, these results are not surprising since most of the records in the ARIA database are based on events that occurred in France [7,48], while the NRC database only collects events that take place in the United States of America [23,49].
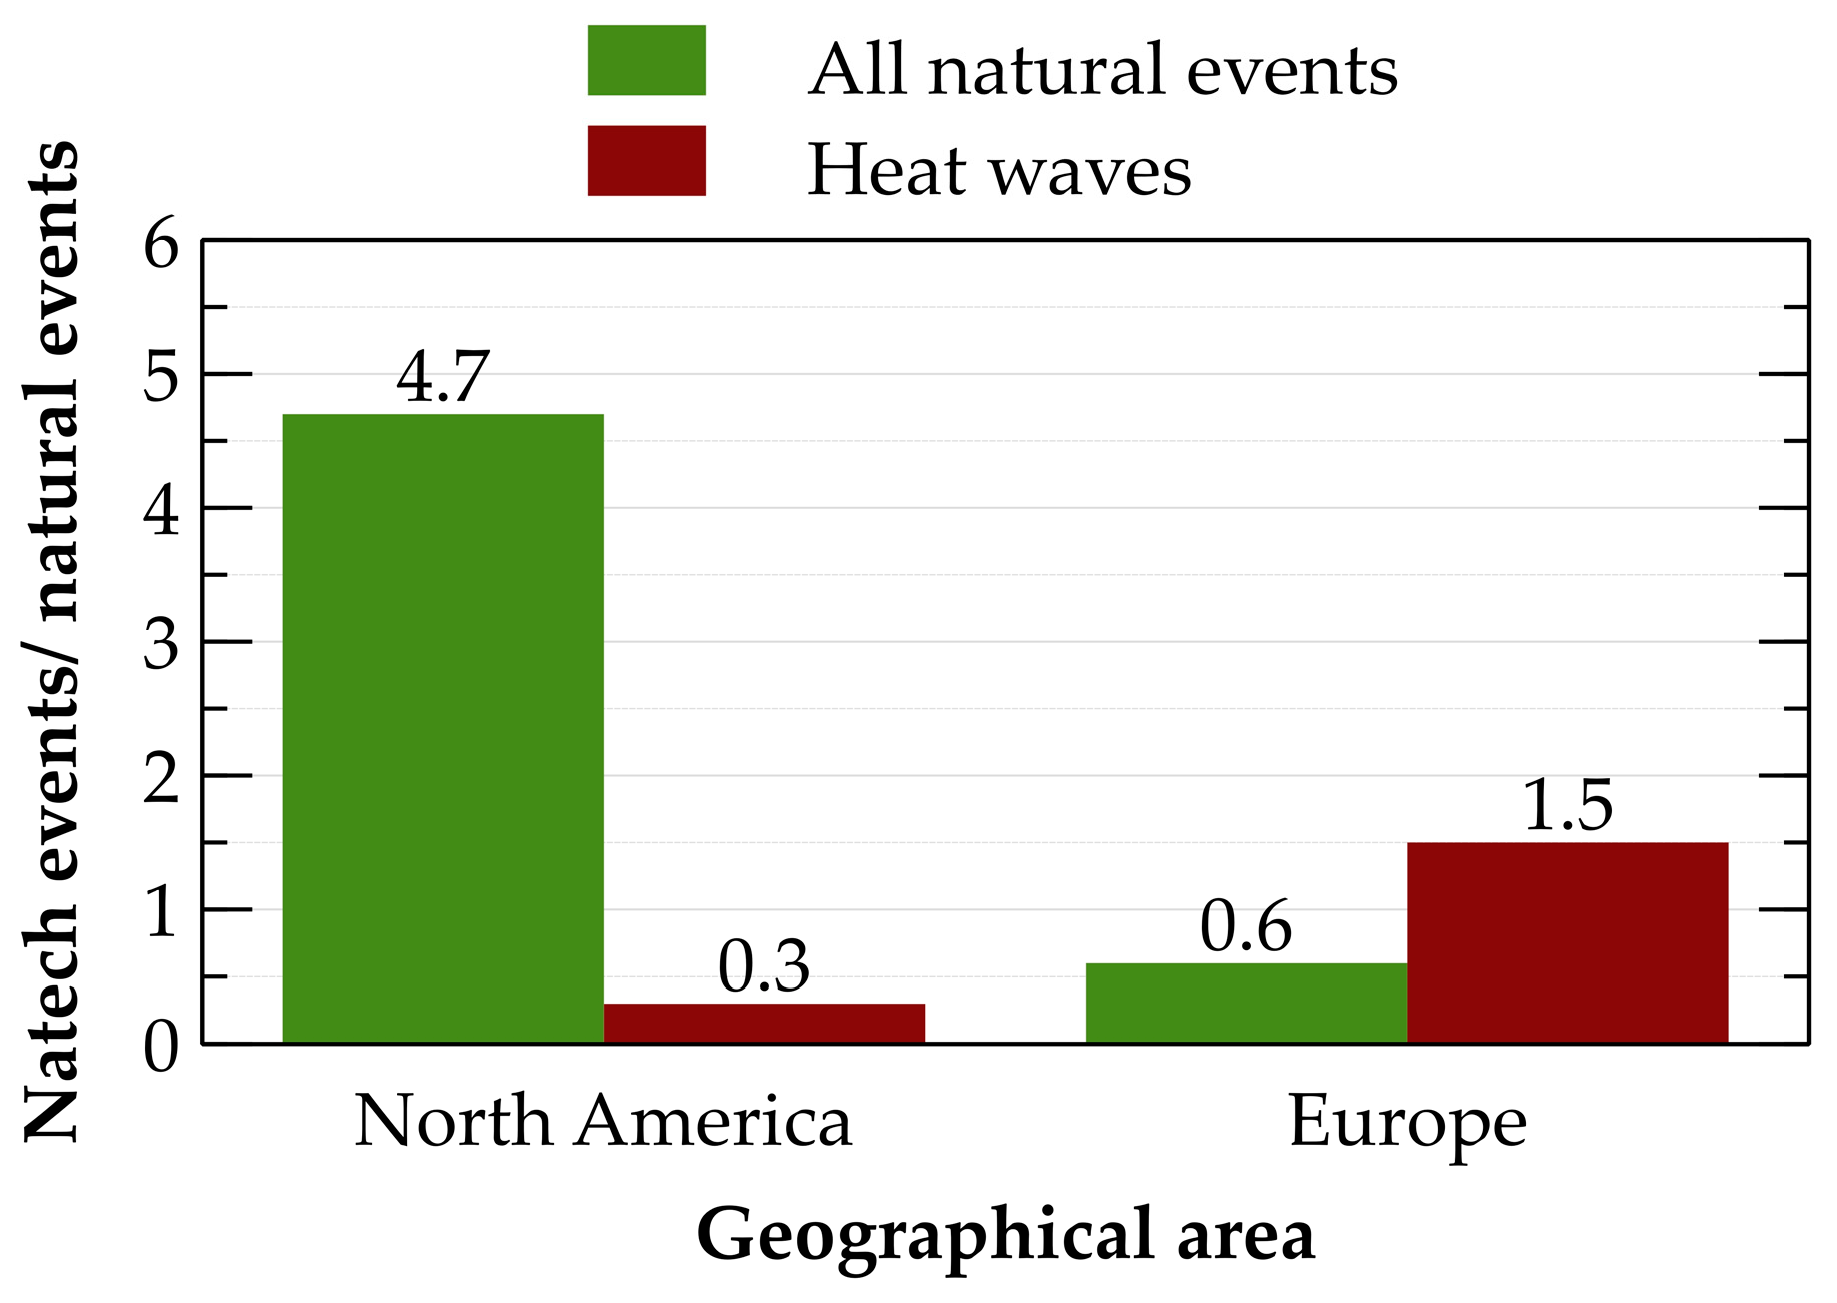
It is also relevant to compare the distribution of Natech accidents to that of natural events (i.e., extreme environmental phenomena that impact societies and the human environment [53]). Data on the number of natural events recorded in specific geographical areas are available from several sources. In the present study, data from the EM-DAT database developed by the Centre for Research on the Epidemiology of Disasters [5] were considered to compare the total number of natural events to that of Natech accidents in the last 30 years (1992–2022). Figure 2 shows the ratio between Natech accidents and recorded natural events. In the figure, the data for generic Natech accidents in the database of Ricci et al. [7] are compared to the specific data concerning Natech accidents caused by heat waves. The same categories of natural events that triggered the Natech accidents were considered when deriving the information on the number of natural events considered (i.e., all the natural events recorded and heat waves only). As shown in the figure, a different trend is obtained when considering North America and Europe. Data concerning North America suggest that heat waves are a minor cause of Natech accidents and the value of Natech accidents per natural event is far lower than 1. This result differs from the figures obtained for generic Natech accidents, that score an average of 4.7 accidents per natural event [7], which is a credible value considering the high industrialization, the intensity, and the extension of natural phenomena such as hurricanes that affect some regions of North America. On the contrary, the ratio for Natech events caused by heat waves is higher than 1 in Europe, and it is higher than that calculated for generic Natech events, which is around 0.5. These results suggest a higher vulnerability of the European framework to accidents triggered by heat waves, also in the light of the specific features of the original sources. Indeed, the NRC database, which represents the main source of data for North America, tends to include accidents with low severity that are usually not recorded by the ARIA database, the source from which most of the European data are taken. The discrepancies between the two geographical areas may thus be even more significant when considering the exposure of industrial installation to heat waves. Actually, the ratio between Natech accidents and natural events calculated for Europe in the present study may somehow represent an underestimation of the actual value, given that low severity accidents may be overlooked and not reported in the ARIA database.
3.2. Technological Scenarios
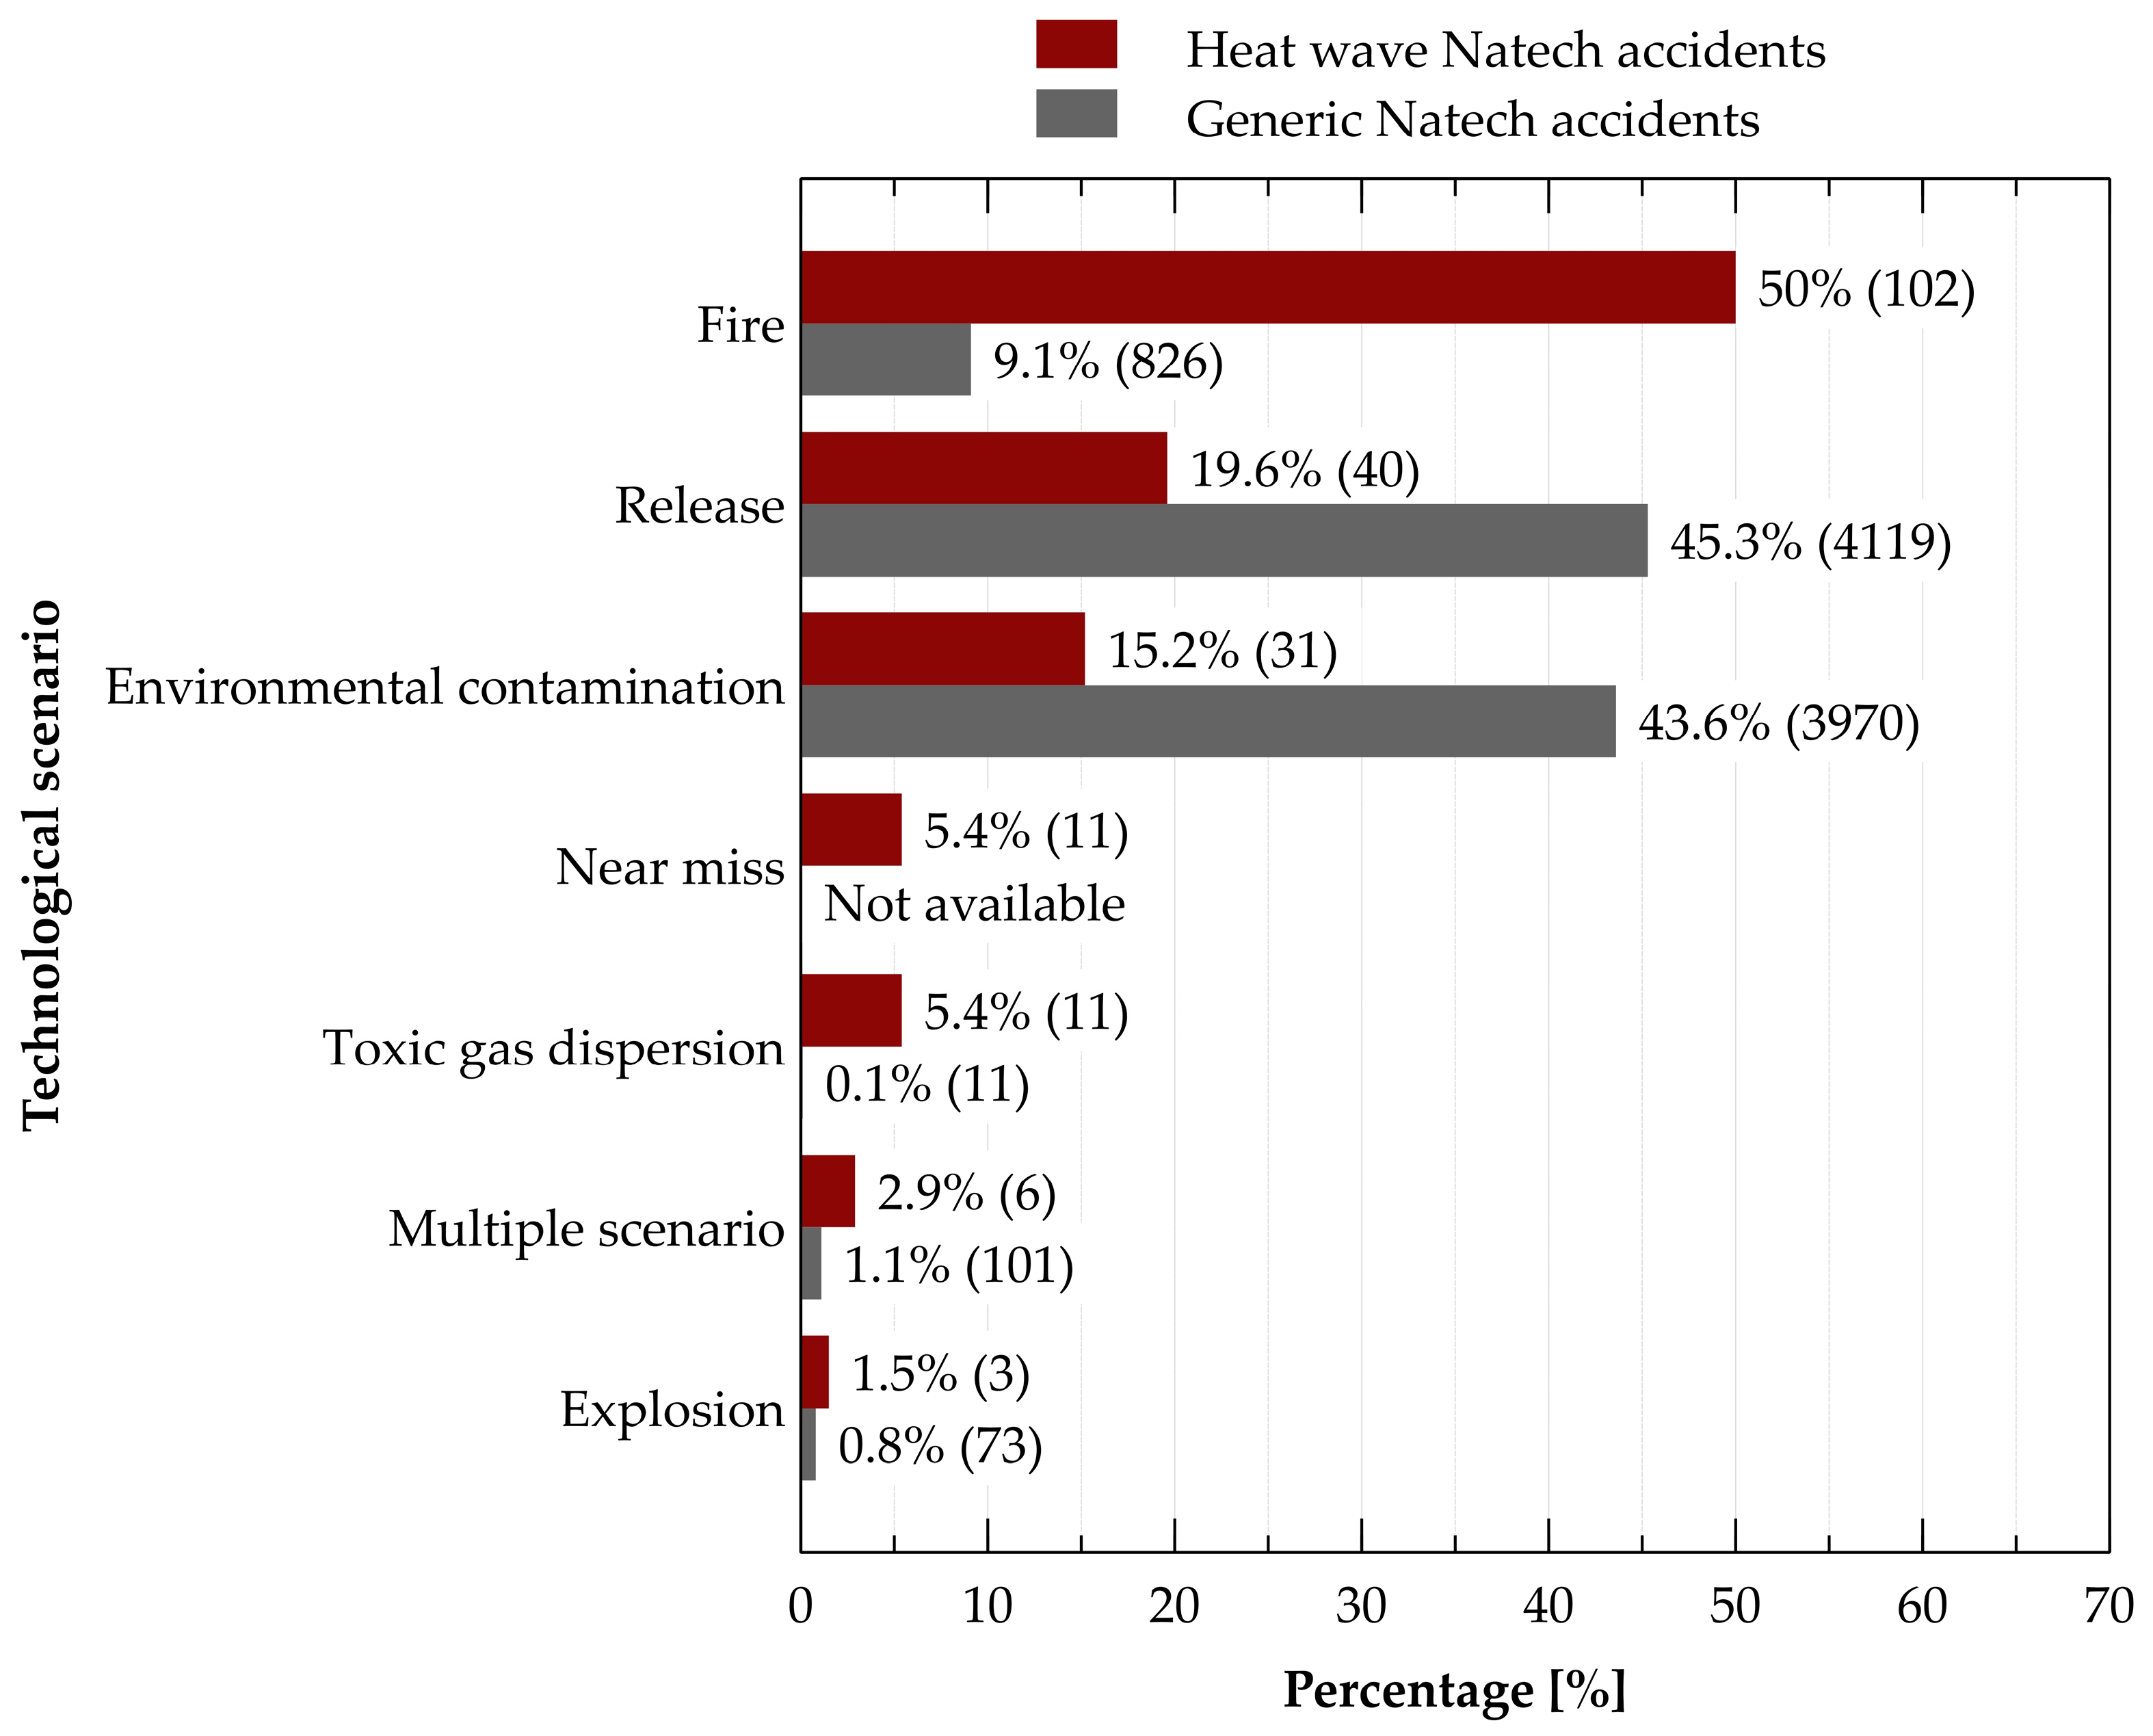
Figure 3 shows the technological scenarios that occurred in the Natech accidents collected in the present study (see Table A1 for the definition of the technological scenarios considered). For the sake of comparison, the figure also reports the data obtained for generic Natech accidents by Ricci et al. [7] (i.e., all the Natech accidents recorded regardless of the natural events that triggered them).
When Natech events triggered by heat waves are considered, a fire took place in more than half of the events (102 records). A release with no further consequences occurred in a more limited number of cases (40, 19.6%), as well as environmental contamination (31 records, 15.2% of the total). Multiple scenarios occurred only in six past accidents (2.9%). These were fires and explosions (three records), explosions and toxic gas dispersions (two), and in a single case the combination of all these three scenarios.
These figures present significant differences with respect to those obtained in previous studies addressing generic Natech accidents [7]. Actually, a much higher incidence of fire scenarios is obtained for Natech events triggered by heat waves: the share of fire scenarios is about five times higher with respect to generic Natech events. Conversely, a much lower incidence of releases with no further consequences and of environmental contamination is recorded for Natech events triggered by heat waves. This difference may be explained by considering the specific features of heat waves. Indeed, the extremely high temperatures experienced during heat waves may facilitate the ignition of the hazardous materials during a loss of containment and/or result in conditions where self-ignition of materials is possible.
3.3. Industrial Sectors Affected
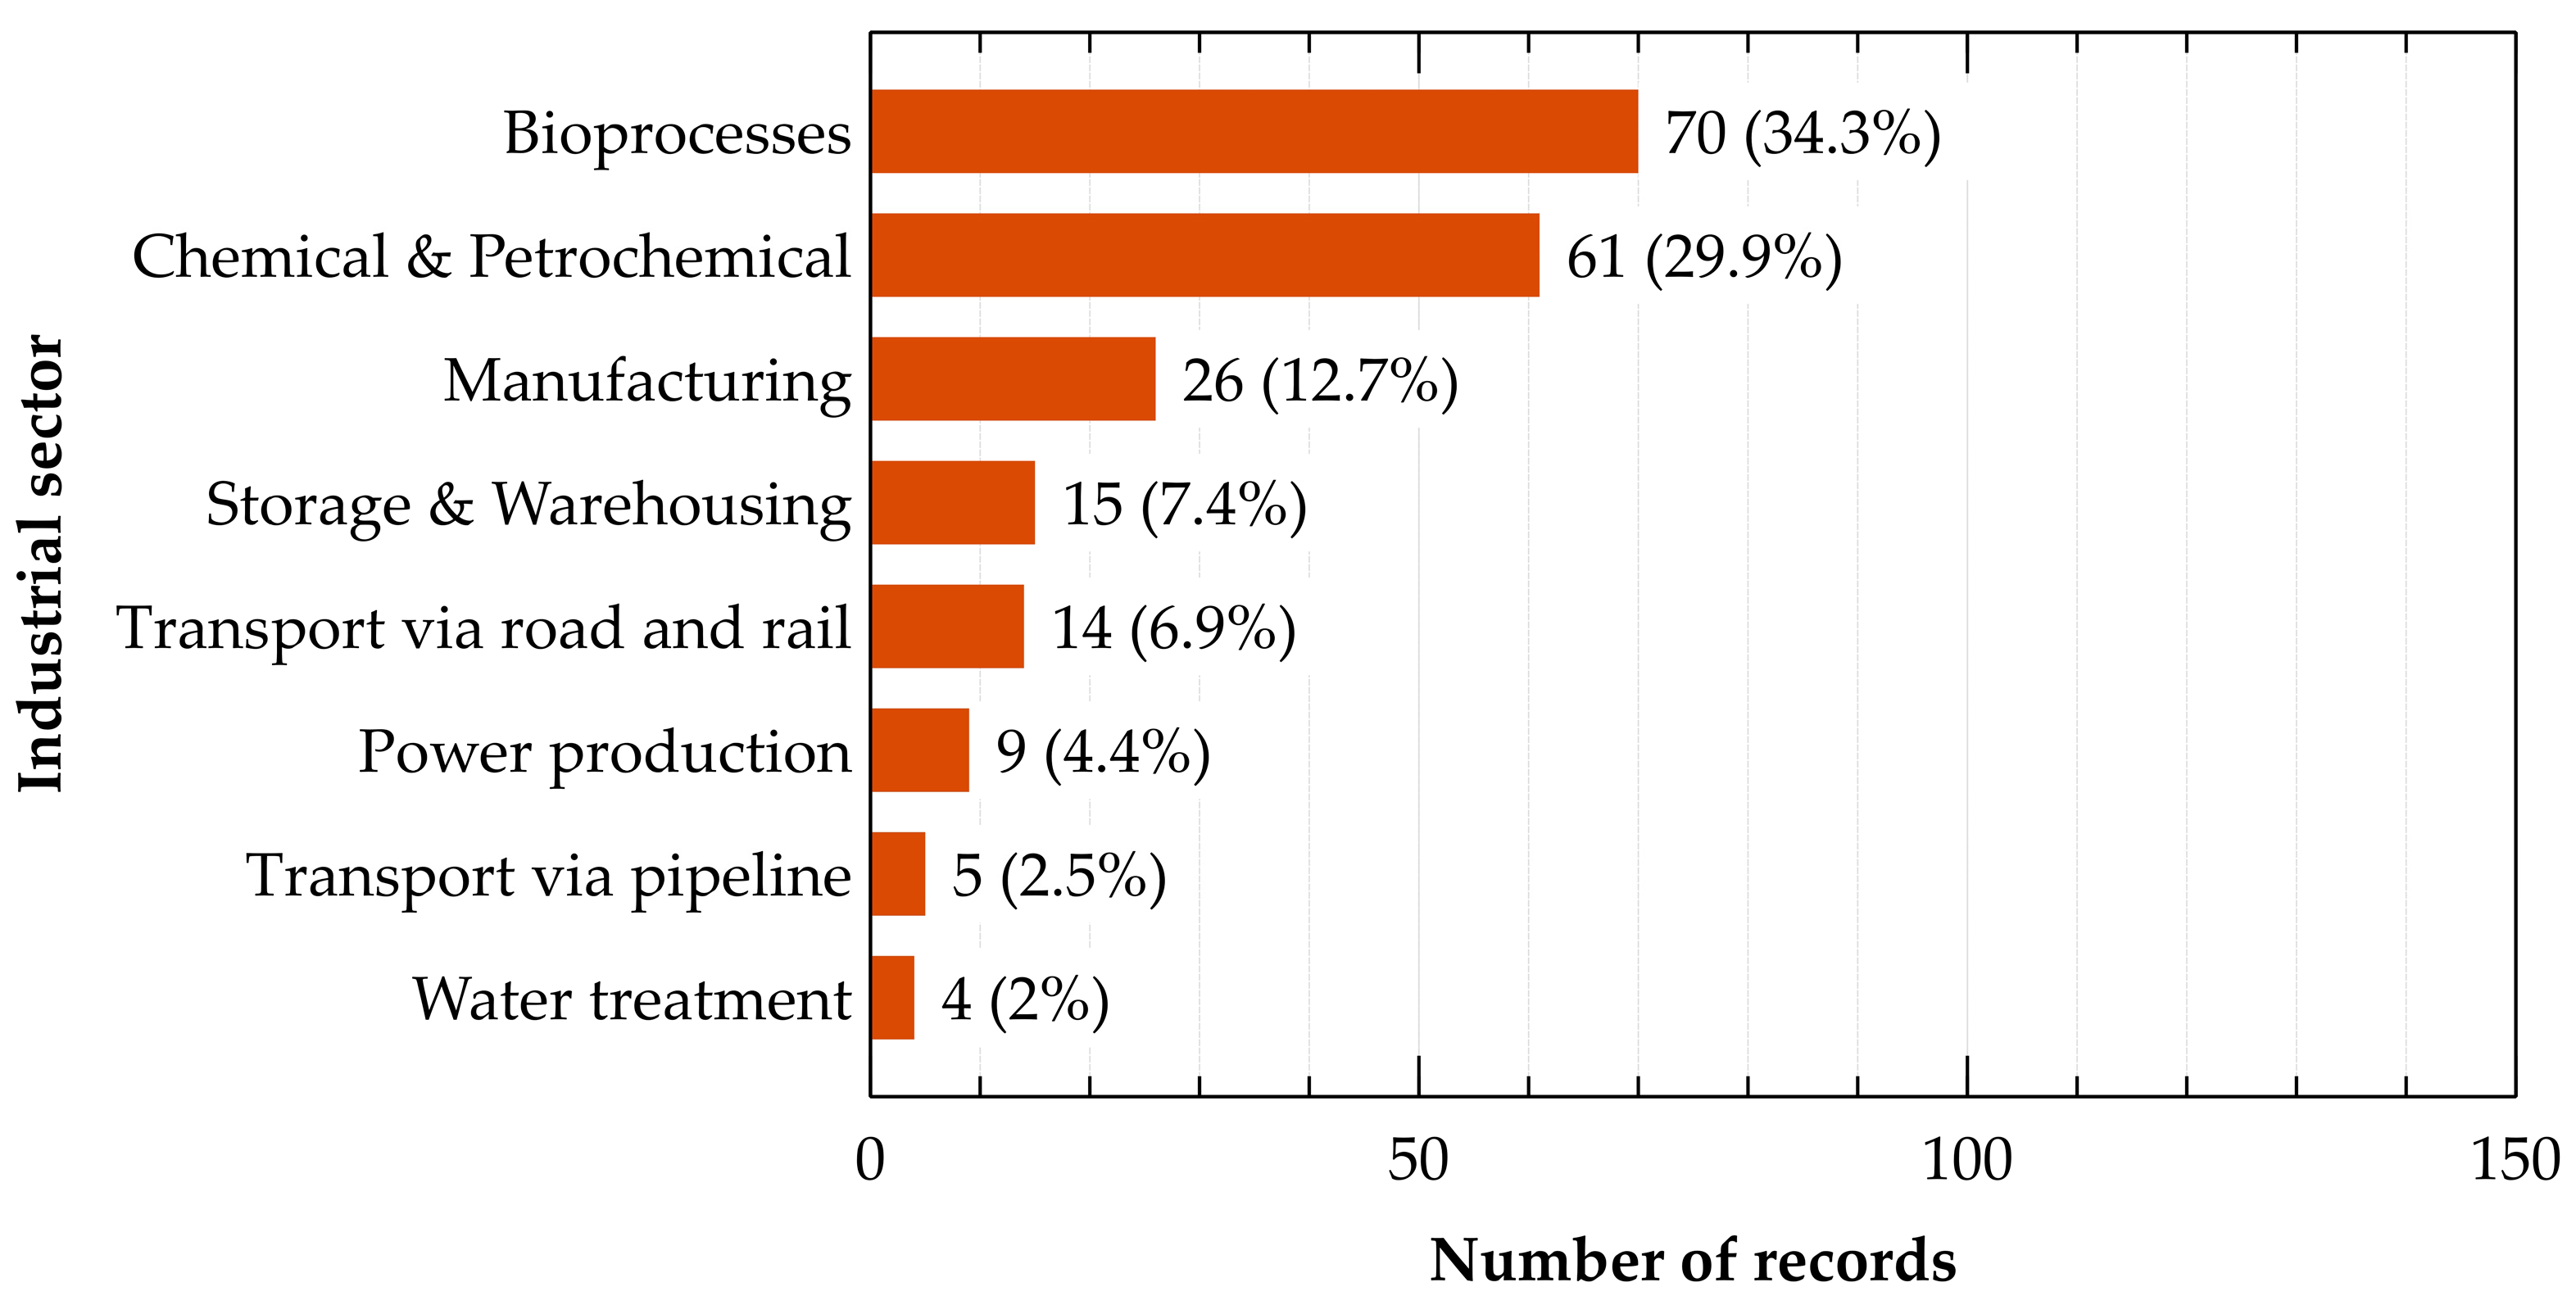
The industrial sectors involved in past Natech accidents triggered by heat waves are shown in Figure 4 (the definition of the industrial sectors considered in the present study is reported in Appendix A).
Bioprocesses and Chemical and Petrochemical industries seem to be the more vulnerable sectors to such accidents, being involved in around 65 % of the recorded events. Other industrial sectors of concern are those related to manufacturing (26 records, 12.7%), storage and warehousing (15, 7.4%), and transportation via rail and road (14, 6.9%). A limited number of accidents occurred in other industrial sectors, such as power production, transport via pipeline, and water treatment.
Within bioprocesses, two main types of industries are considered according to the definition provided in Table A2: the manufacture of food products and the solid waste treatment sector. The first is involved in about 15% of the events affecting bioprocesses. However, most of the accidents occurred in solid waste treatment plants and in landfills. Actually, these facilities are more involved in Natech accidents triggered by heat waves, suggesting the need for specific measures to reduce the vulnerability and mitigate this specific type of Natech scenario. The relevance of fire scenarios shown in Figure 3 may explain the high number of accidents reported for bioprocesses and for the chemical and petrochemical sectors. Indeed, these industrial sectors are vulnerable to fire scenarios due to the presence of high quantities of flammable and/or combustible substances. In this framework, it is worth considering that the increase of the ambient temperature may lead to self-ignition phenomena, as well as to changes in solid composition, with the possible release of flammable volatile substances (e.g., see [54]). Moreover, high ambient temperatures may exceed the flash point of combustible liquids, increasing the probability of ignition causing fire scenarios. Similarly, poor control of temperature profiles within warehouses may generate conditions favoring the thermal degradation and self-ignition of chemicals.
Another criticality concerning the waste treatment sector is related to the continuous variability in the composition of wastes, which makes the safety management for this sector even more complex. As an example, heat waves may lead to a reduction in the water content, thus increasing the probability of self-degradation and self-ignition. However, the temperatures at which such phenomena may occur are frequently unknown, due to the possible variability in the composition of the waste.
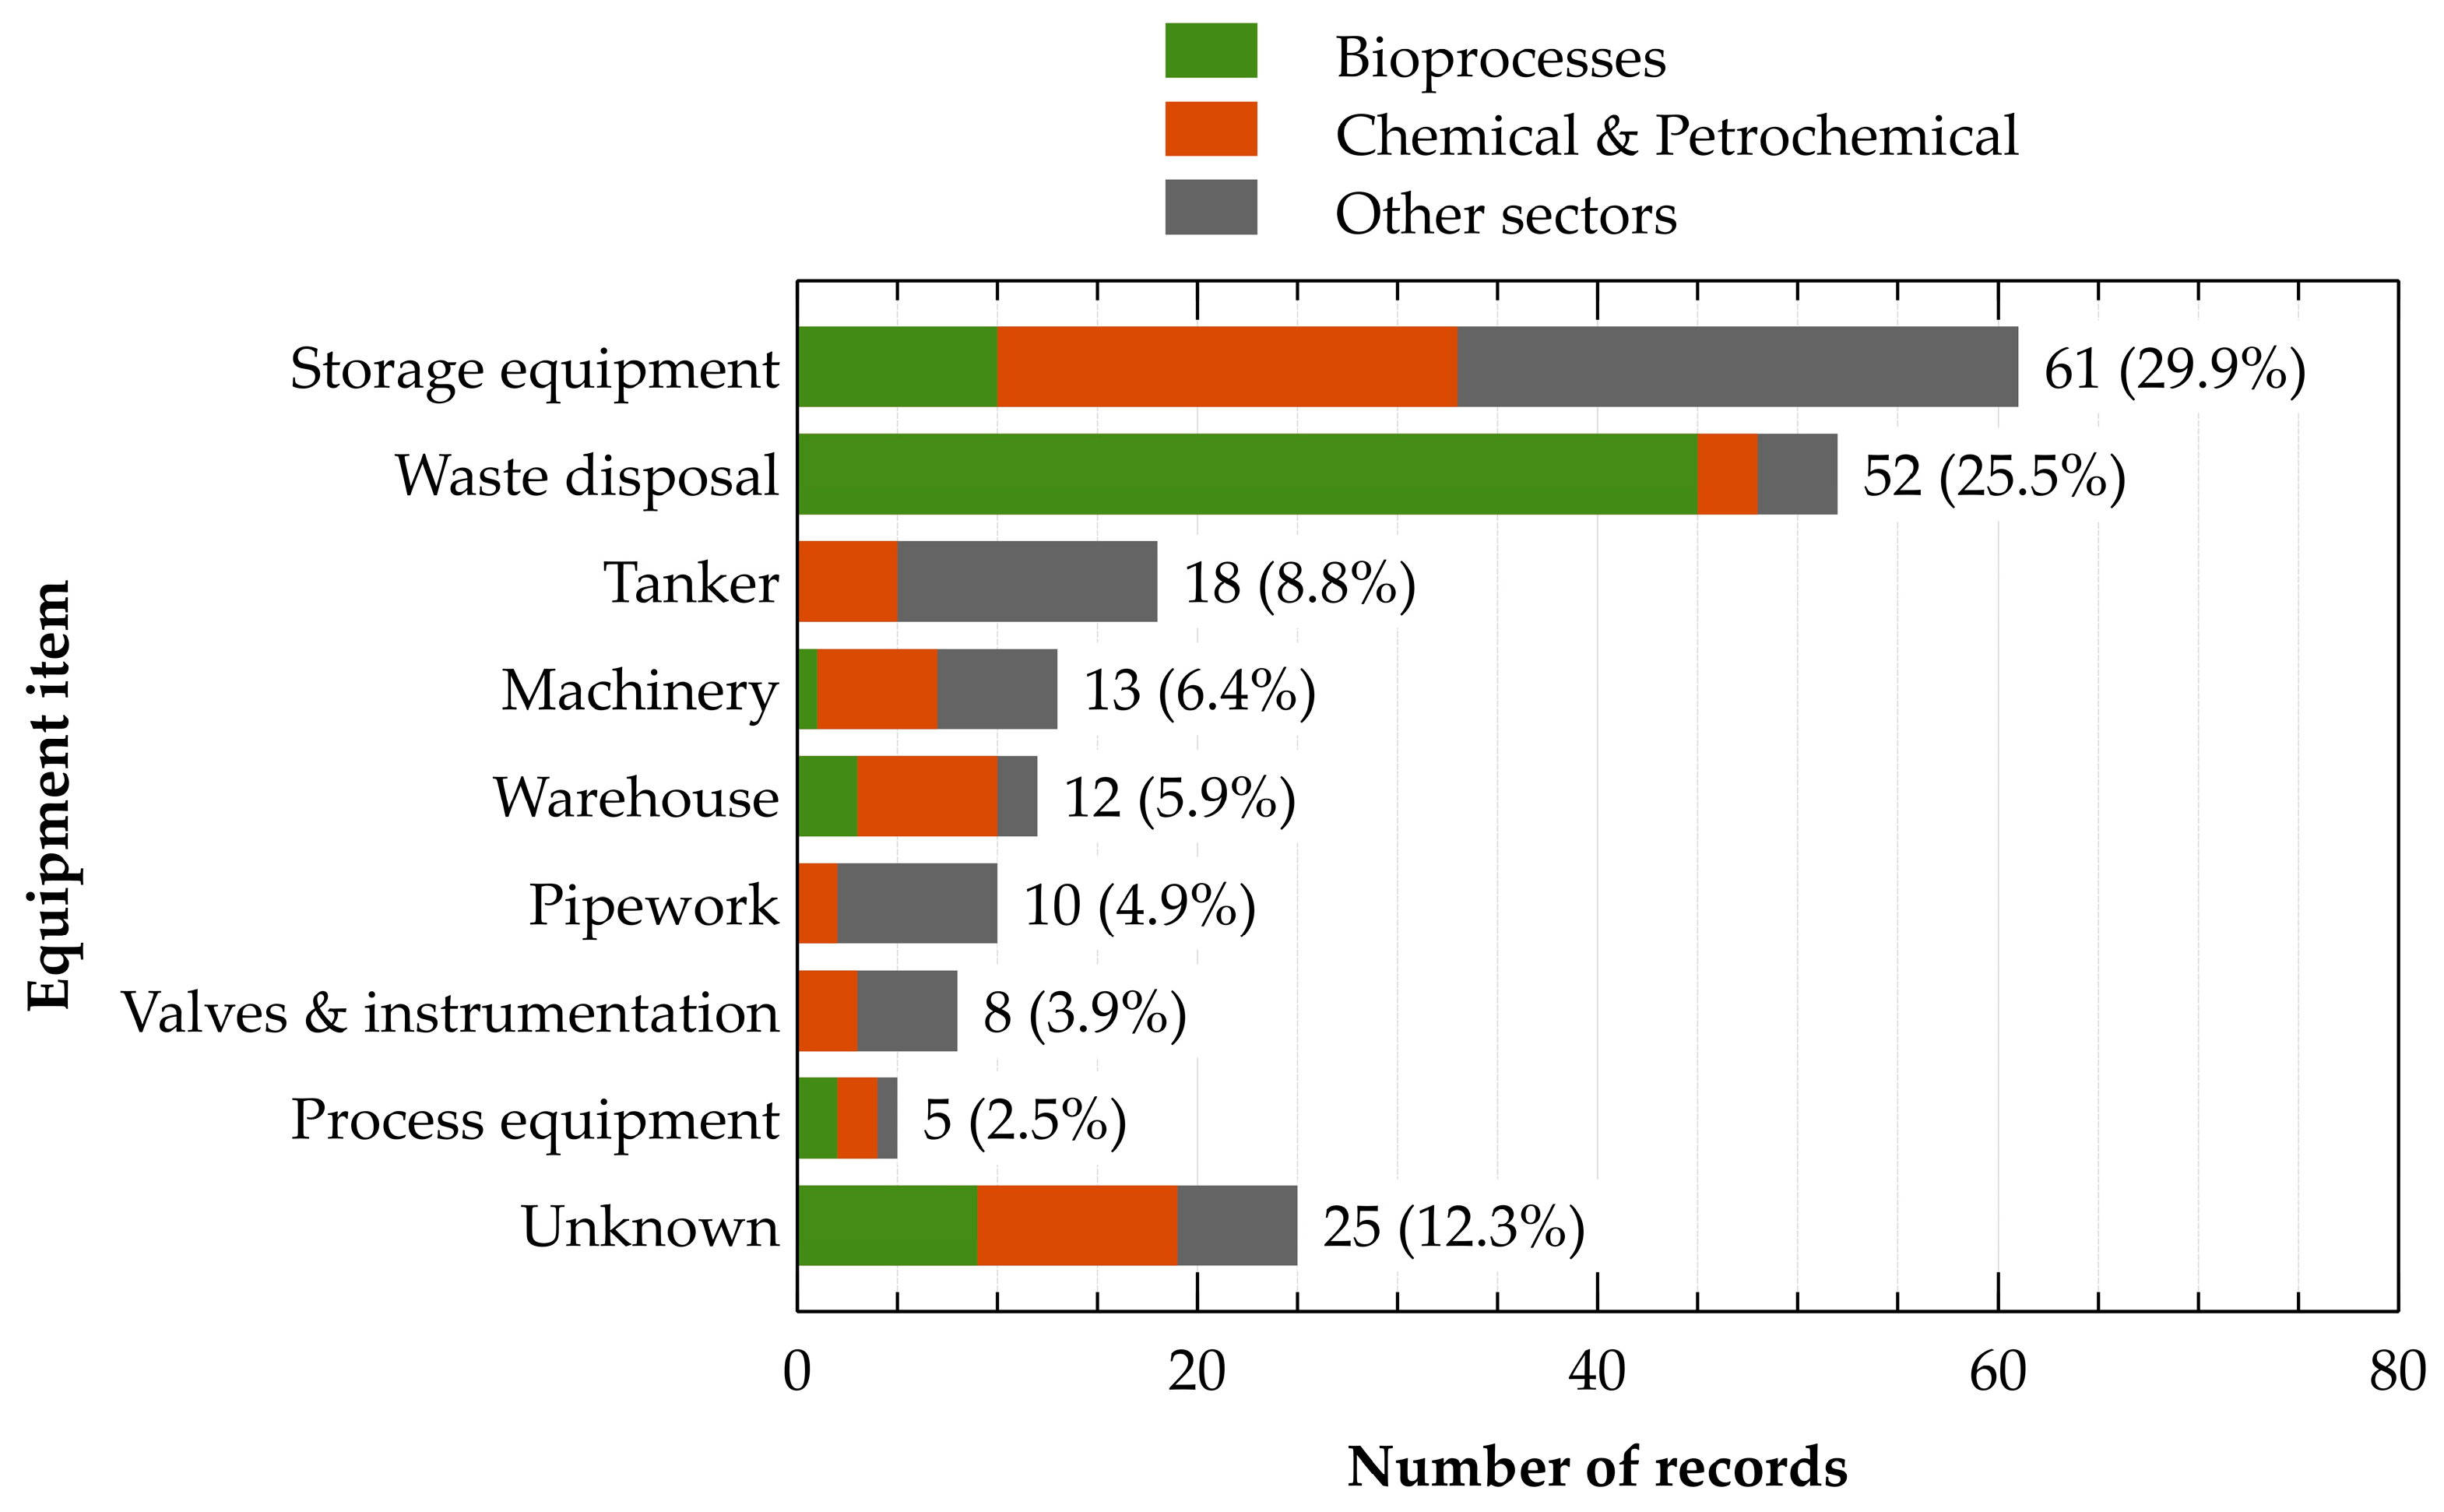
3.4. Equipment Items
Figure 5 shows the equipment items that were involved in the technological accidents triggered by heat waves. The classification of the equipment categories is reported in Table A3.
The results shown in Figure 5 allow a more effective characterization of the cause-consequence chain that occurred in the Natech events analyzed. Not surprisingly, storage equipment is the item category mainly affected in Natech accidents triggered by heat waves (61 records, 29.9% of the total). Actually, these equipment items are the more vulnerable ones considering their structural features.
Waste disposal represents the main critical section of the plant for the bioprocesses sectors. However, piles of waste materials and landfills were involved in Natech accidents triggered by heat waves. Clearly, piles of materials are not equipment items. Nevertheless, they were considered as solid waste storage systems in the present study, since they were involved in several past accidents and as a result were vulnerable to the hazards caused by high ambient temperatures.
Other categories of equipment items were affected by heat waves in a lower number of cases. Among these, warehouses are of specific concern, in particular when considering bioprocesses and in the chemical and petrochemical industry.
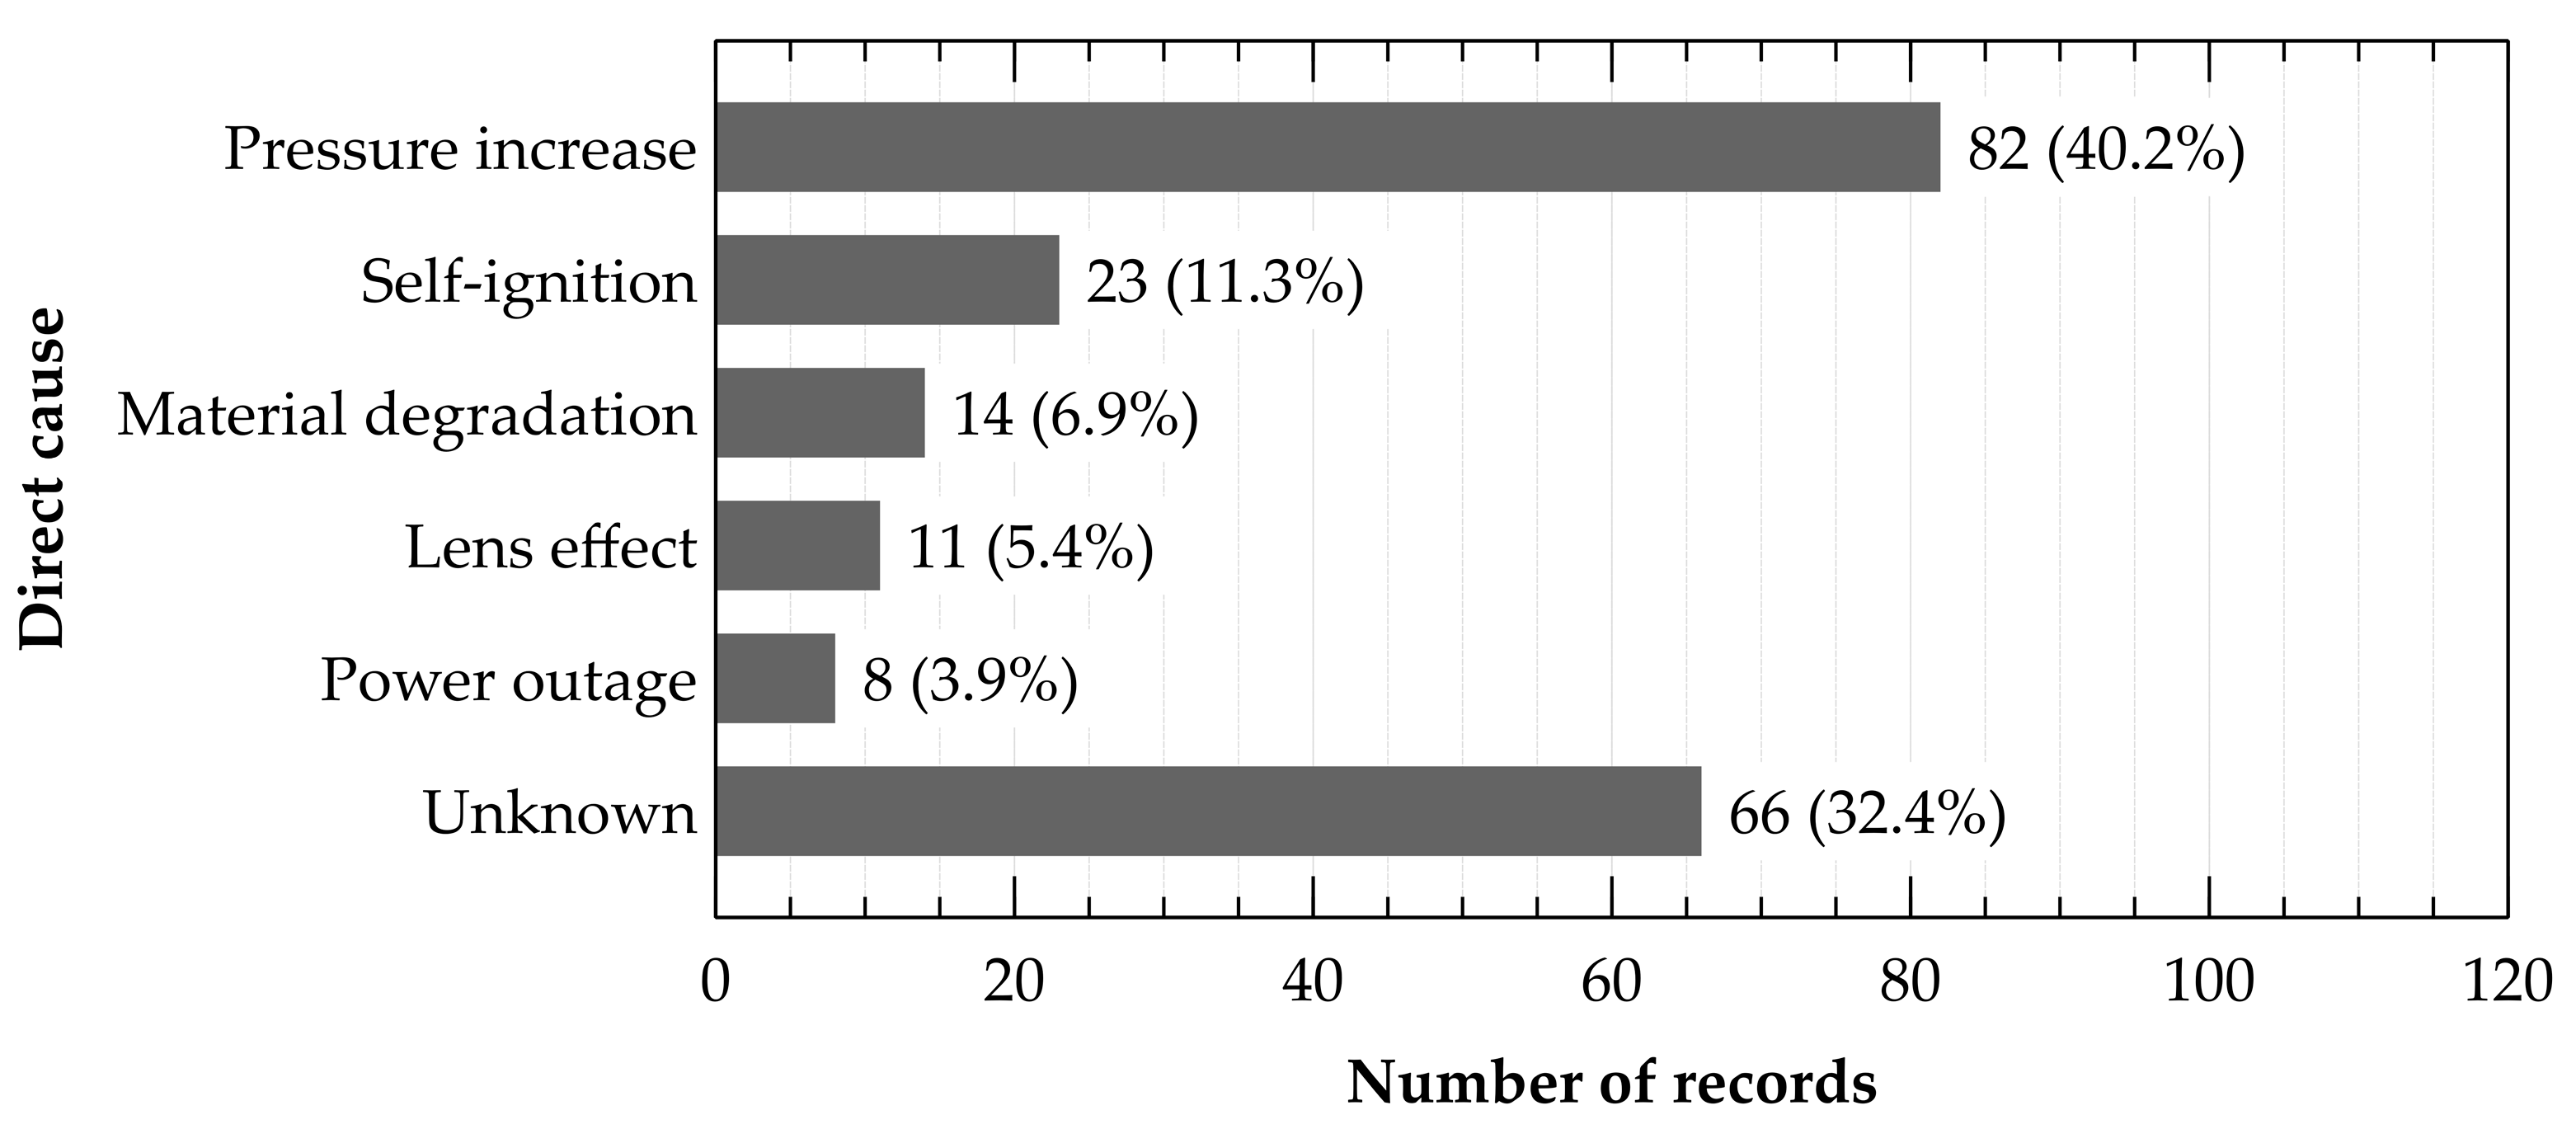
3.5. Direct Causes
Five main events were identified as direct causes of the past accident scenarios triggered by heat waves collected in the present study. Figure 6 shows the number of events in which the direct causes identified triggered the technological scenario responsible for the final consequence of the Natech accident.
In over 40% of the Natech accidents collected in the present study, loss of containment was caused by an uncontrolled increase of the internal pressure, exceeding design limits and leading to equipment failure. Usually, the internal pressure increase is generated by the high ambient temperature leading to an increase in the vapor pressure and/or of the vaporization rate of the liquid phase within the equipment involved.
The second more important direct cause of technological scenarios identified in this category of accidents is the self-ignition of materials and substances (23 records, 11.3% of the total), directly causing a fire scenario. Chemicals and/or materials degradation due to high temperatures were also a result of concern, causing a relevant number of recorded accidents (14, 6.9%). In such scenarios, continuous exposure to the heat by solar radiation was usually the starter of exothermic decomposition, polymerization, and other undesired reactions, which led to the self-ignition of the substance/material. In other cases, the lens effect was identified as the cause of the accident (11, 5.4%). The lens effect occurs when a glassy material converges sunrays into a narrow area, heating-up and finally igniting the surrounding materials. Power outages, resulting in anomalous process conditions, were recorded as the direct cause of eight accidents (3.9%).
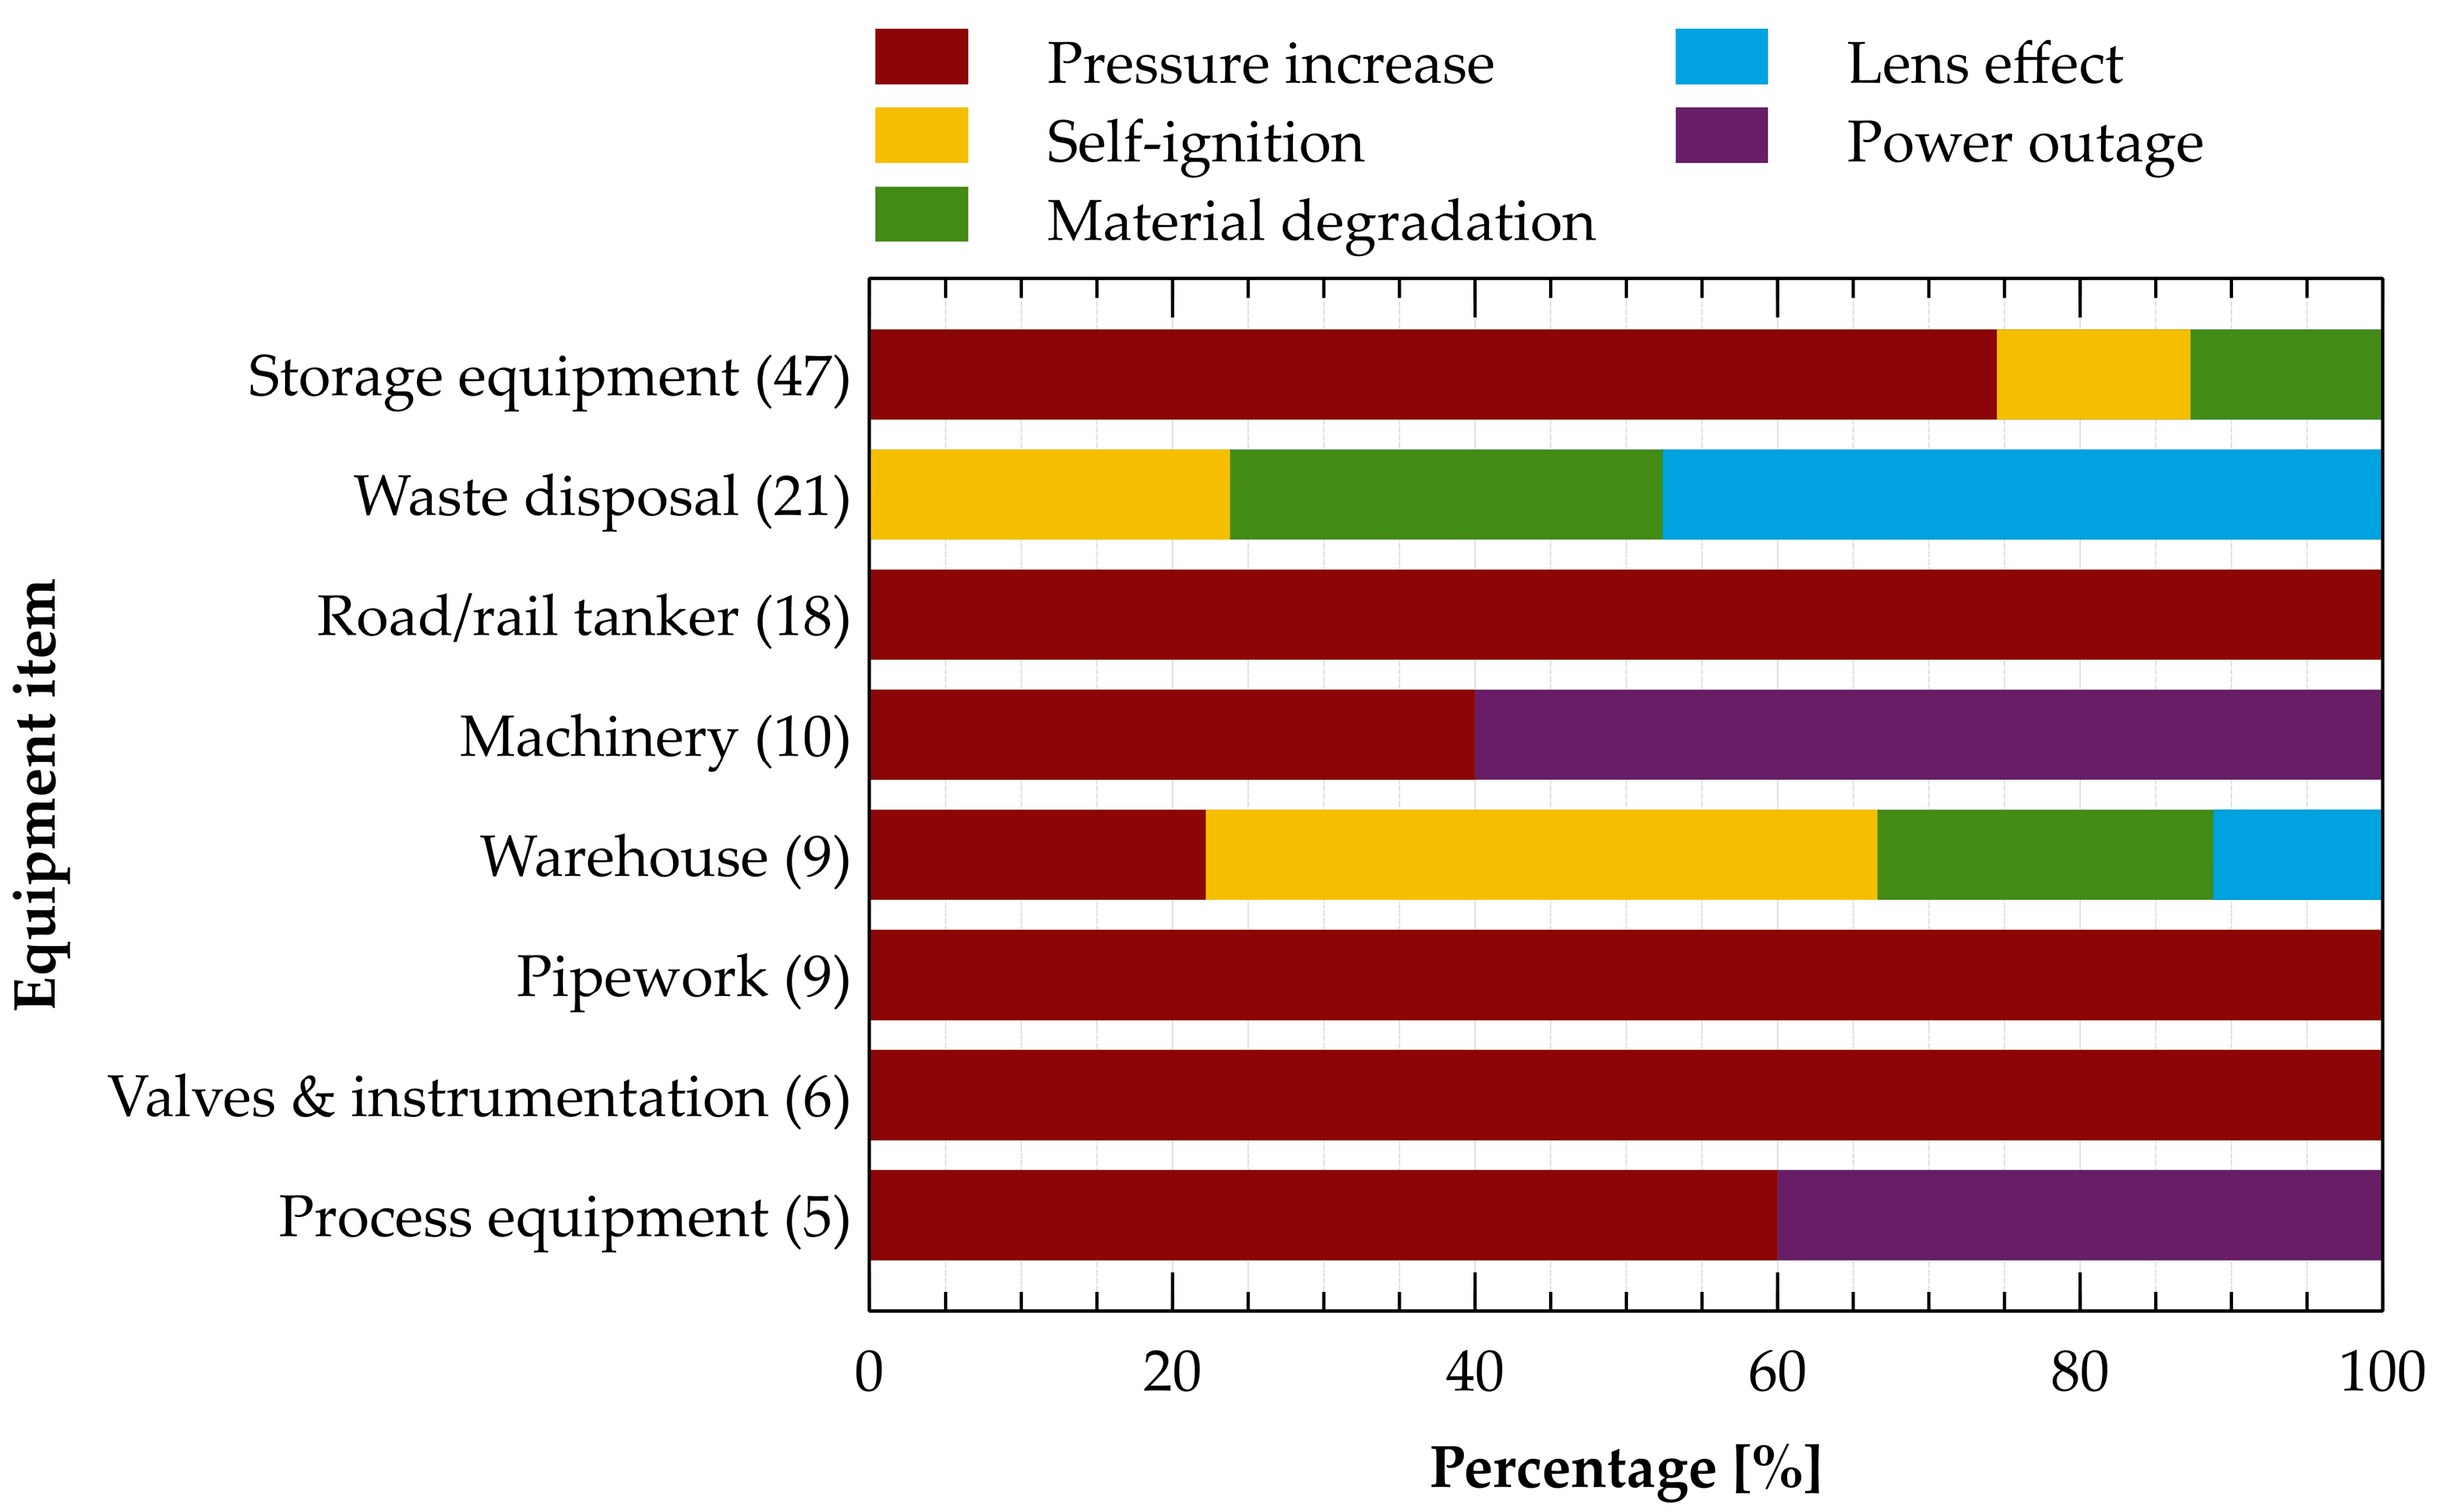
Figure 7 shows the distribution of the direct causes identified with respect to the equipment item involved in the accident. This information was available only for a total of 125 records. The figure evidences a non-homogeneous distribution of the direct causes of the accident for the different equipment categories considered. In particular, self-ignition and materials degradation are relevant causes of accidents in storage systems (tanks, warehouses, and piles of materials). More specifically, self-ignition has occurred in accidents involving only storage equipment (12.8%), waste disposal (23.8%), and warehouses (44.4%). Accidents caused by the lens effect occurred only in waste disposal and warehouses, with a probability much higher concerning the first one (47%) than the second (11%). The occurrence of ignition due to lens effects in these industrial activities was more relevant than the potential of glass materials to ignite wild vegetation reported in previous studies [55]. However, solid waste materials and biomass in the presence of high temperatures and dry weather reduce their humidity content. This may have enhanced their susceptibility to ignition due to the lens effect. These results highlight the importance of proper management of storage equipment, storage methods, and storage procedures during heat waves.
Differently, in the case of process equipment, pipework, and machinery, where the inventory and residence times are much lower, such causes are not relevant, and the main direct cause of failure is internal over-pressurization. The pressure increase is the most relevant direct cause considering storage equipment (75%), and process equipment (60%). Moreover, a pressure increase was the only identified direct cause for road and rail tankers, pipework, valves, and instrumentation.
Power outages resulted in a specific direct cause of accidents for machinery (60%) and process equipment (40%), not affecting the other equipment categories.
It should be remarked that the results shown in Figure 7 are not affected by the industrial sector in which the equipment categories are operating: similar trends were obtained for the different industrial sectors considered, showing no significant deviations from the overall data reported in the figure.
3.6. Substances Involved in the Natech Events
To better characterize the cause-consequence chain of Natech accidents triggered by heat waves, it is paramount to analyze the substances which were involved in the Natech accidents occurred. Actually, such substances are responsible for the technological scenario (i.e., fire, explosion, etc.) in the Natech accident. The technological scenario is triggered by the release of such substances (e.g., due to the damage of equipment items or storage vessels), by their ignition or by their self-degradation.
Information on the substances involved in the technological scenarios was reported only for about 65% of the events. Around 70 different substances were involved in the Natech events triggered by heat waves. Most of the substances were involved in a single or very few events. Only six substances and/or materials were involved in more than five events, as shown in Table 2.
Wastes (not better specified) together with liquid hydrocarbons (i.e., fuel oil, crude oil, and other liquid hydrocarbons) are the substance categories more frequently involved in the collected set of past accidents (about 30% of events). This is in line with the two sectors more frequently involved in the set of accidents collected: bioprocesses (including waste treatment as shown in Table A2) and the chemical and petrochemical industry.
Other two substances frequently involved in the past Natech events collected are ammonia (14, 6.5%) and propane (3.7%). Actually, these substances are frequently stored as liquefied gases under pressure at ambient temperature. Such storage conditions are inherently vulnerable to high temperatures, which lead to the increase of the vapor pressure of the liquid phase and thus of the internal pressure of the storage system, possibly causing the loss of containment of the substance. This is coherent also with the results obtained concerning the direct cause of accidents since internal pressure increase was found to be the most relevant cause of the recorded accidents.
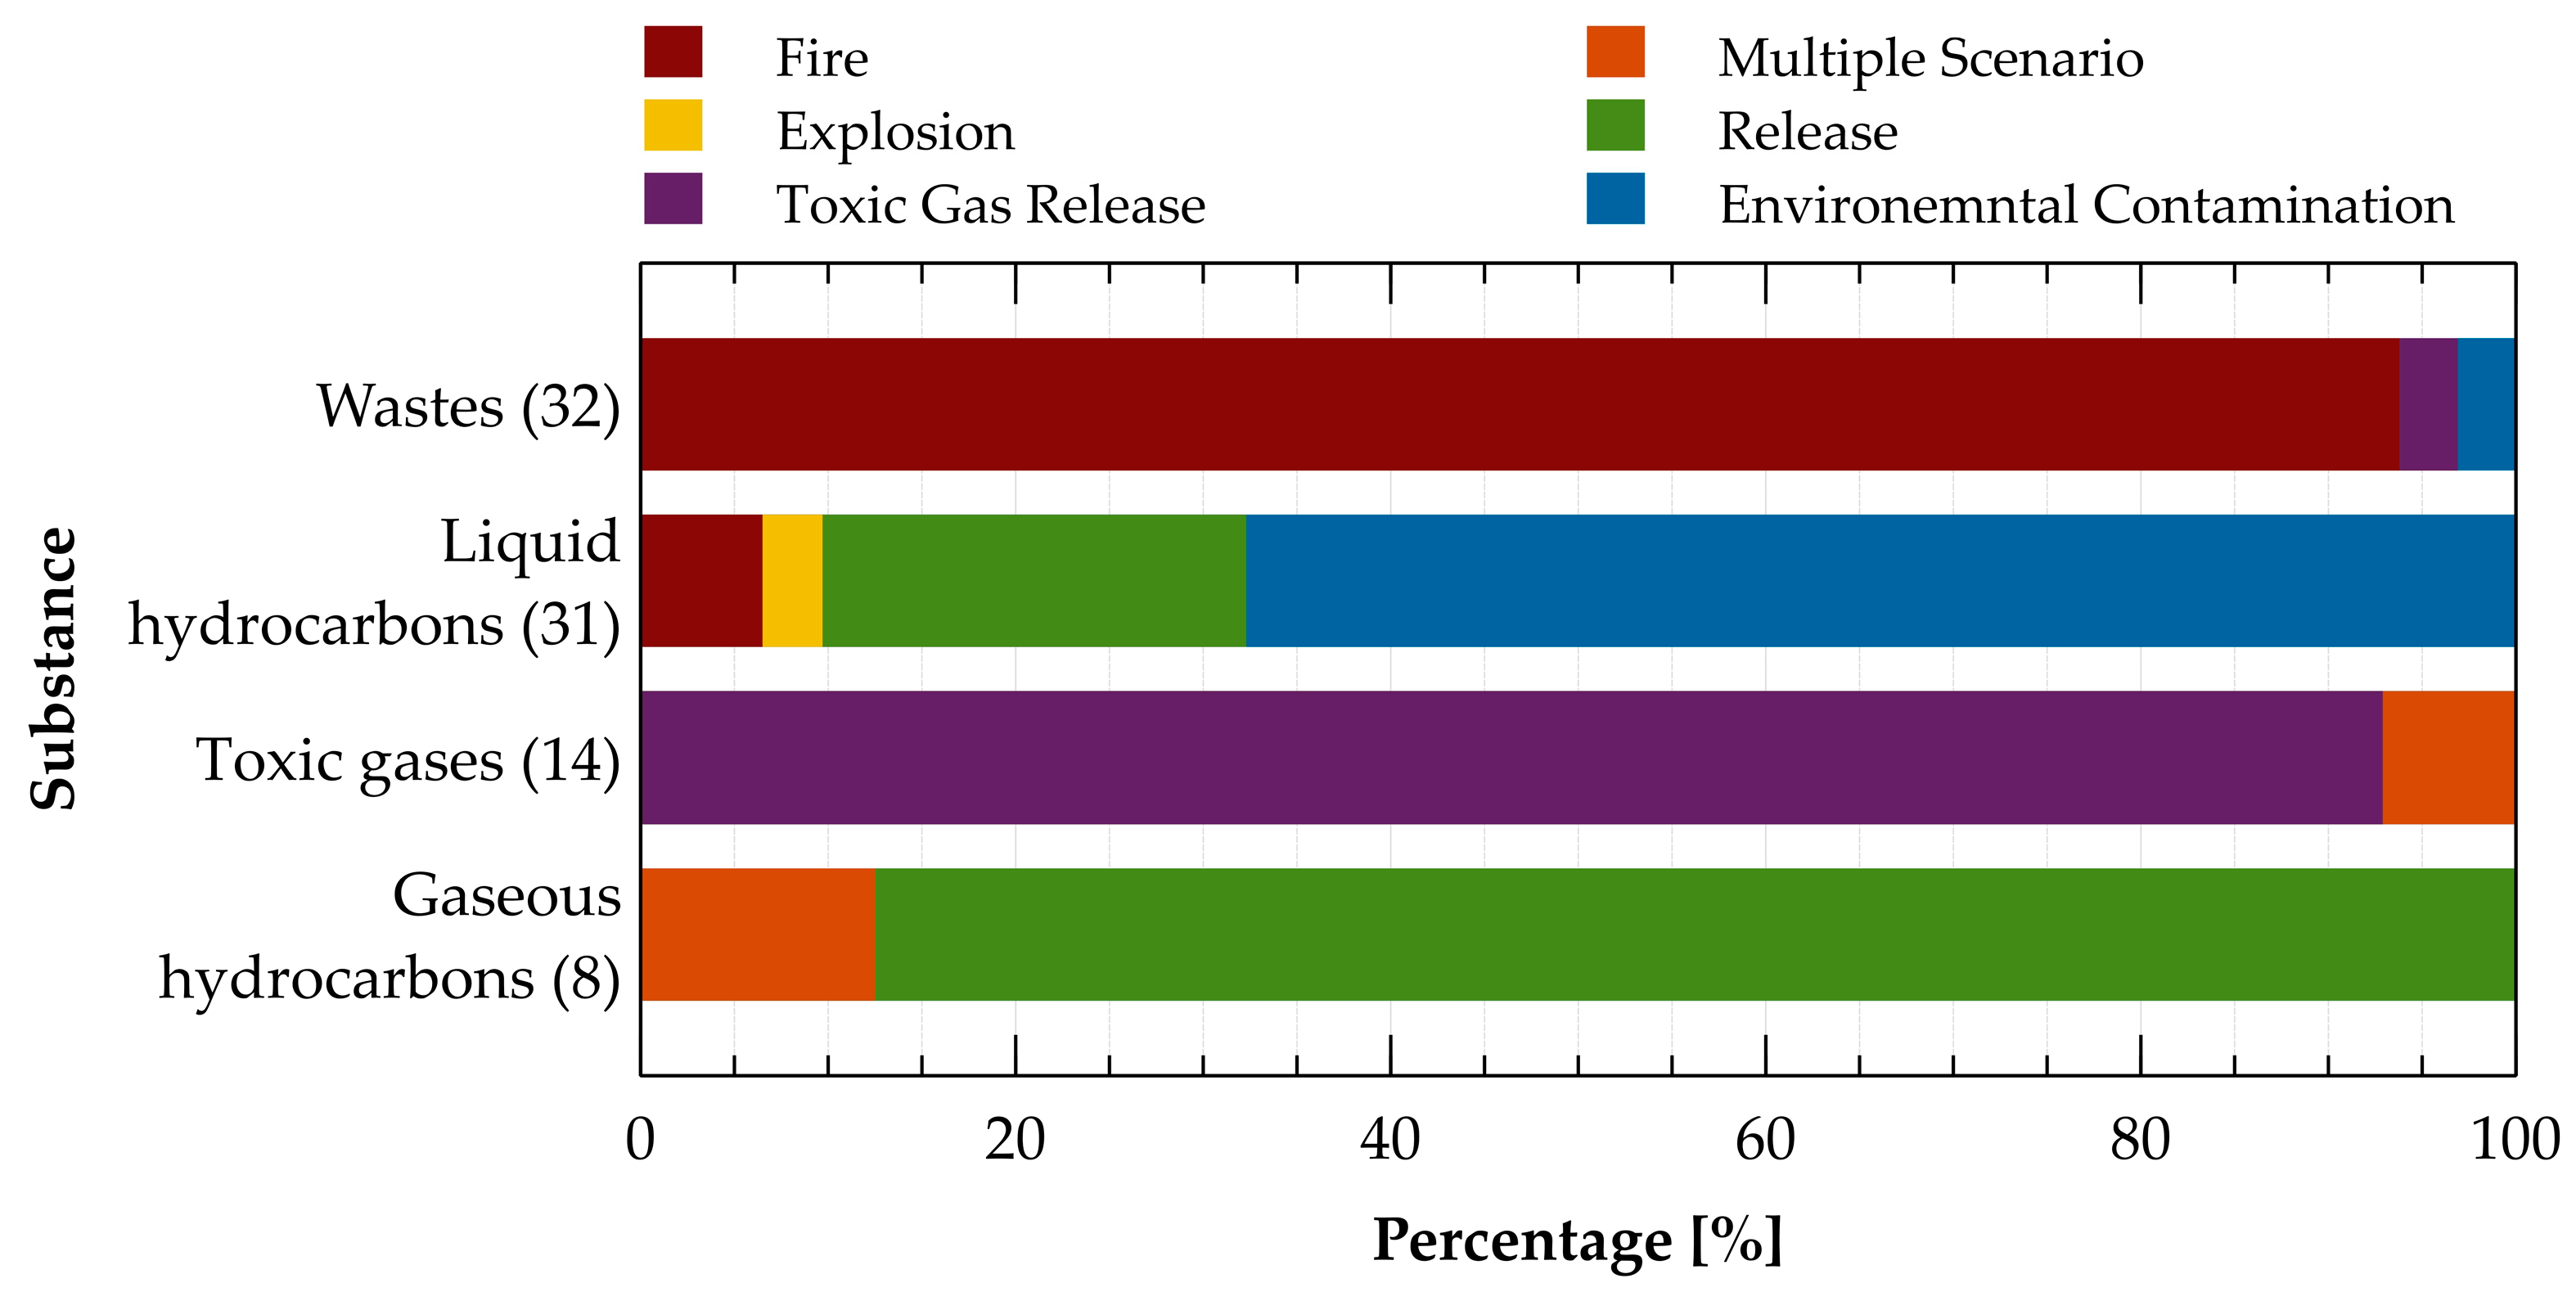
Figure 8 shows the technological scenarios involving the four main substance categories present in Table 2: Wastes, Liquid Hydrocarbons (including Crude Oil, Fuel Oil, and Other liquid hydrocarbons), Gaseous Hydrocarbons (including propane), and Toxic Gases (including Ammonia).
As shown in the figure, fire is almost the only scenario involving waste materials (94% of events). Toxic gas dispersion and environmental contamination took place only in a limited number of cases (3% of events each).
As for liquid hydrocarbons, scenarios that do not require ignition occurred in around 90% of the cases. These are environmental contamination (68%) and release with no other consequences (23%). Ignition leading to fire took place in around 6% of the events, and an explosion occurred in over 3% of the records in which a liquid hydrocarbon was released. Thus, the ignition probability of liquid hydrocarbons obtained from the analysis of the results reported in Figure 8 (around 9%) is comparable to the figures obtained by Ricci et al. [7] from the analysis of generic Natech accidents, as well as to the data reported for conventional accidents [43].
In spite of the flammability of ammonia, almost all events involving this substance concern the dispersion of an unignited toxic cloud. Indeed, in a single record ammonia caused multiple scenarios which consisted of the explosion of the storage vessel and the spread of the toxic gas over a residential area.
When gaseous hydrocarbons are considered, the scenario most frequently reported was a release with no other consequence. Only in a single record a multiple scenario took place, specifically an explosion followed by a fire.
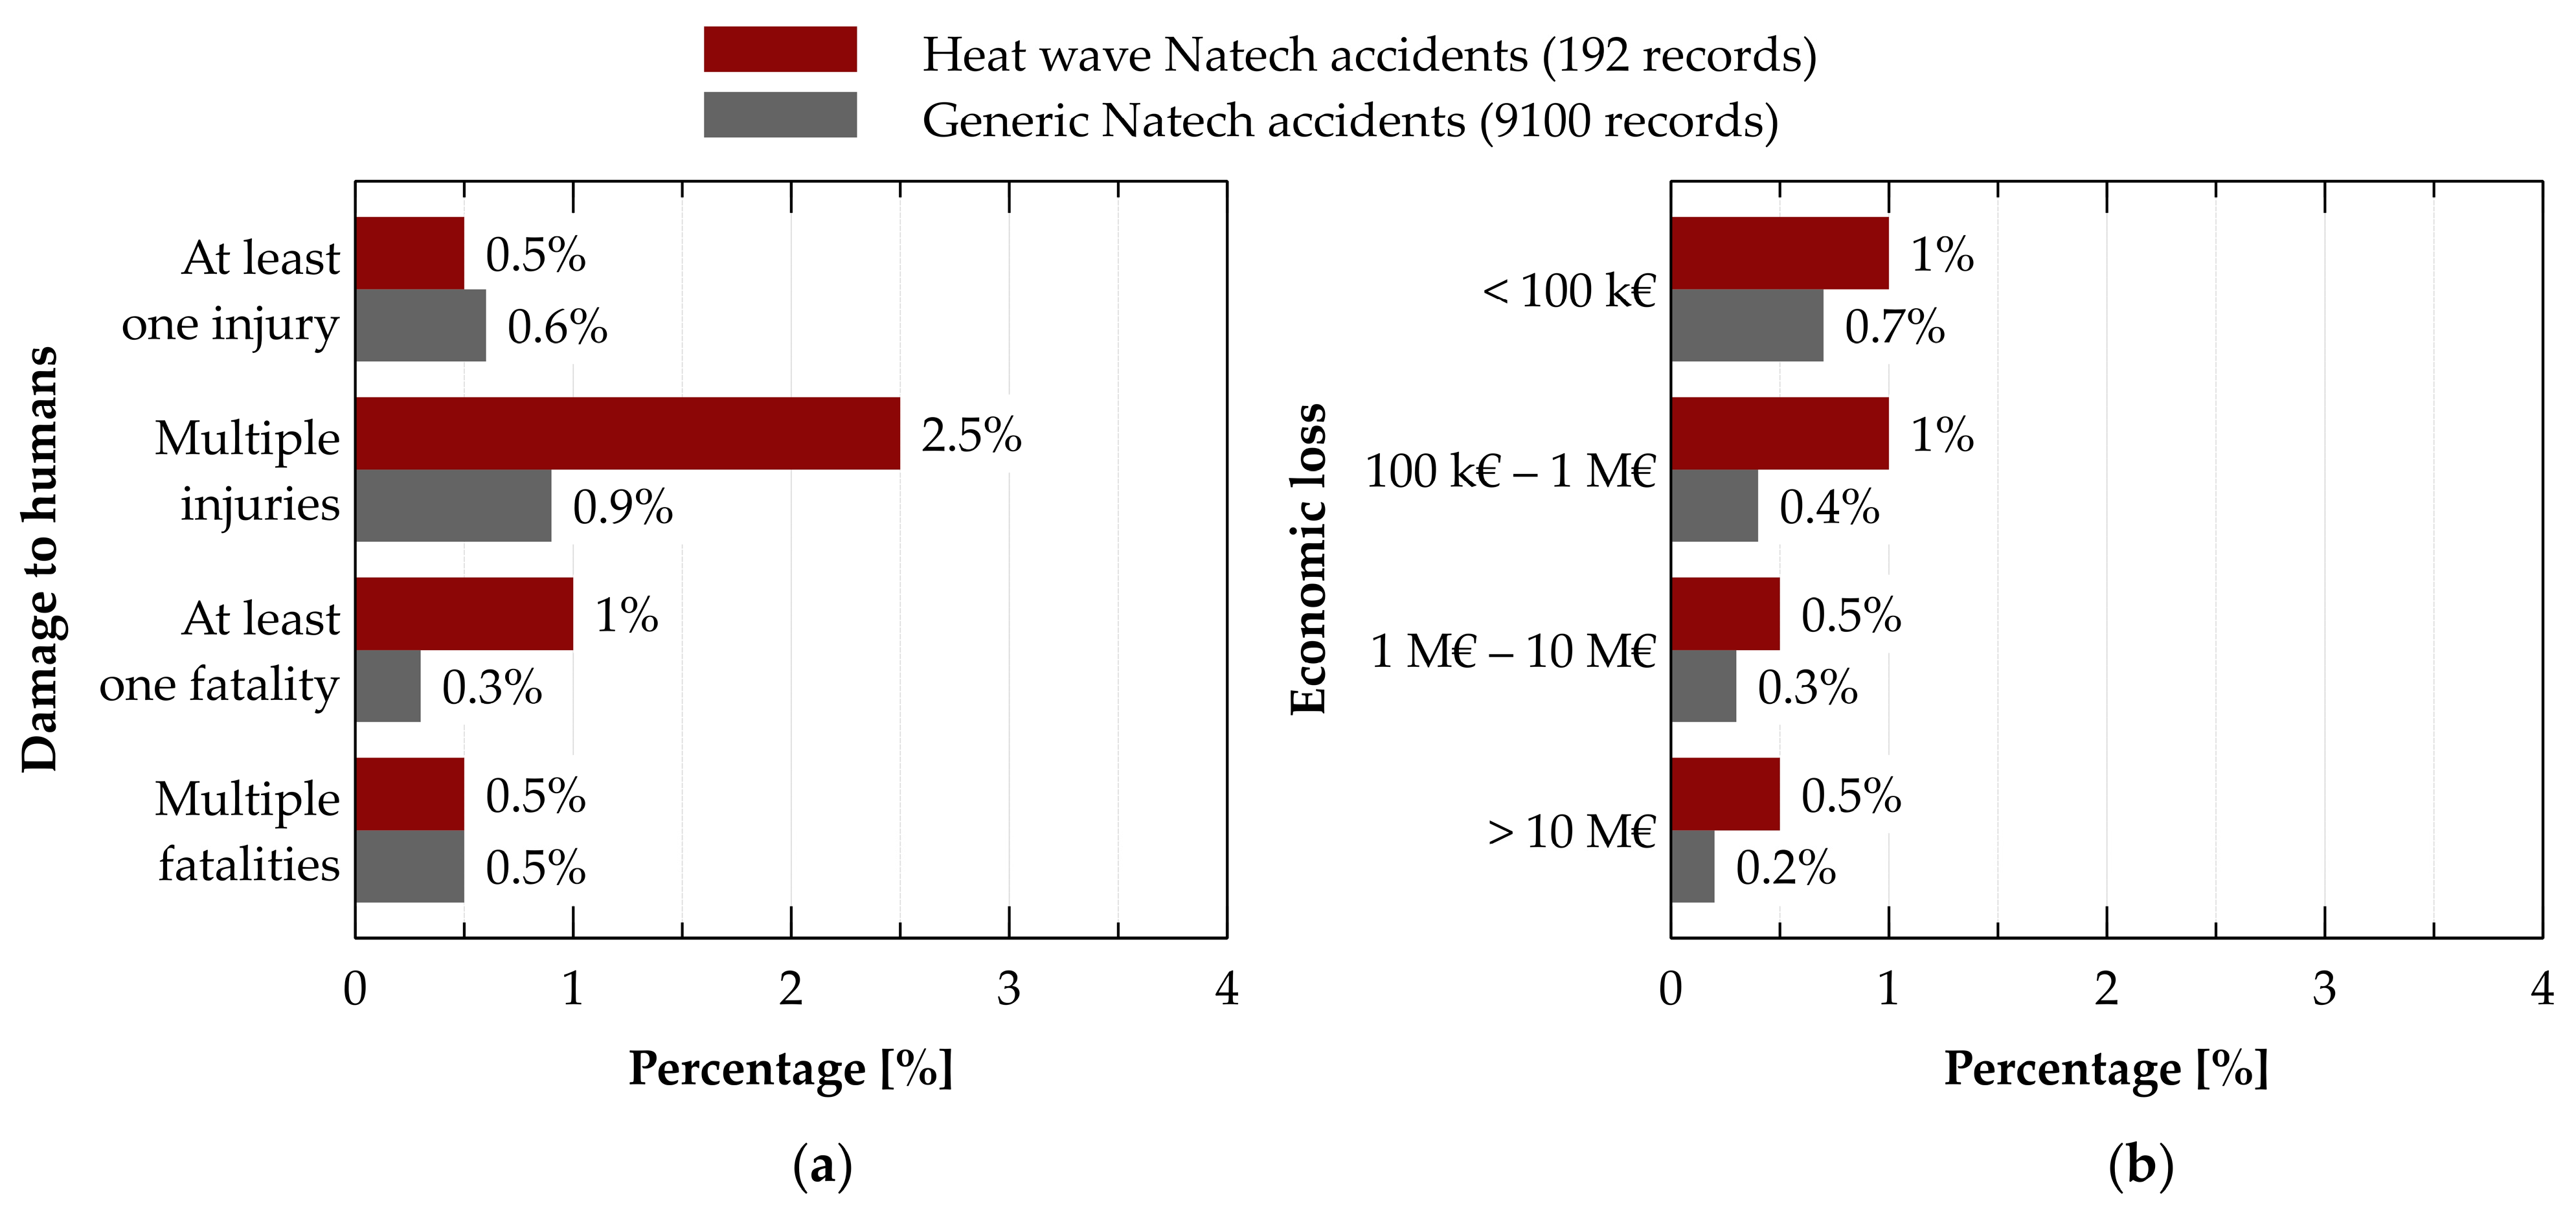
3.7. Severity of Consequences
The severity of the past accidents collected was assessed not considering near misses. Thus, a total of 192 records were included in the analysis. The severity was assessed in terms of damages to humans (fatalities and injuries) and economic losses. Notably, such information was available only for a limited number of records due to the lack of detail of the original sources (nine records reporting damages to humans and six records reporting economic losses). Nevertheless, a total of 243 injuries and 4 fatalities occurred in Natech accidents triggered by heat waves, and in total the economic losses amount to over EUR 25 million.
Figure 9a shows the results obtained for damage to humans, and Figure 9b shows those related to economic losses. As in the study of Ricci et al. [7], four classes of severity were defined and used to classify the data. In case an accident resulted in multiple effects (e.g., fatalities and injuries), the more severe consequence category was applied.
For the sake of comparison, Figure 9 also includes the results obtained for generic Natech events by Ricci et al. [7].
Figure 9 shows that Natech accidents triggered by heat waves seem to have a slightly higher severity with respect to the overall figures obtained for generic Natech events, even if in absolute terms the probability of damages to humans and economic losses is still rather low. This result is somehow surprising, since heat waves are considered a natural event of minor intensity with respect to hurricanes and earthquakes and are typically overlooked in the quantitative risk assessment of Natech accidents [24,25]. This may be possibly caused by a scarce awareness concerning this category of events, leading to the absence of specific actions aimed at their prevention and/or mitigation.
4. Lessons Learned
As shown in the previous sections, heat waves are a relevant cause of Natech accidents, and severe consequences may arise from the technological scenarios taking place. In Section 3, detailed information was obtained on the cause–consequence chains that characterize such accidents. The results reported above and the information retrieved from the past accident dataset also allow drawing some lessons learned that in perspective may be useful to prevent or mitigate such accidents in the future. These are summarized as follows.
- Identify critical equipment items (e.g., tanks storing liquid substances with a low boiling point) and consider protecting them from excessive internal temperature rises, avoiding their exposure to direct solar radiation by installing specific protection systems and by installing/activating permanent or temporary cooling systems (e.g., water spray systems). As shown above, the increase in the ambient temperature increases the vapor pressure of stored liquids, causing the rise of internal pressure. Pressurized vessels and cone roof tanks are specifically vulnerable to these phenomena. Concerning pressurized vessels, those featuring low ratios of design to operating pressure are the most critical ones. As for atmospheric storage tanks, small vessels have a higher surface-to-volume ratio, being thus more vulnerable to the consequences of solar radiation and of external temperature increase.
- Verify the appropriate sizing of venting systems, in particular in the case of atmospheric cone-roof tanks. The internal pressure increase resulted in the more important cause of Natech accidents triggered by heat waves. Thus, venting systems should be appropriately designed to manage breathing requirements and emergency venting in the case of extreme temperatures and intense solar radiation.
- Verify the position of the vents of atmospheric equipment storing or processing low-flammability combustible liquids. The possibility of release of flammable vapors from vents should be considered even in the case of high boiling point combustible liquids. Actually, in the case of extremely high temperatures, even high boiling point liquids stored or processed in atmospheric equipment may exceed the flash point, generating flammable vapors that may ignite during venting.
- Consider the installation of specific protections from rim-seal fires in the case of floating roof tanks. High temperatures may increase the generation of flammable vapors in floating roof tanks, which may leak through the gaps between the floating roof and the tank shell increasing the hazard of ignition and rim-seal fires. Specific gas and fire detectors and fire monitors, if not present, may be considered for installation.
- Verify the appropriateness of the storage and process equipment used for heat-sensitive substances. The direct ignition of such material leading to a fire was identified as the cause of accidents triggered by heat waves. Substances that should be classified as heat-sensitive are reported in Table 3. Storage systems and process equipment should have an appropriate design to manage the extreme ambient temperatures that may occur during heat waves without causing substance self-decomposition. Appropriate redundancy of the cooling system should be considered.
- Verify the appropriateness of fire detection and fire extinguishing systems in waste storage and processing. The waste treatment sector was as a result specifically vulnerable to fires during heat waves.
- Verify the appropriateness of the control of waste composition. In particular, depending on the type of waste, specific testing concerning stability, self-decomposition, and/or self-ignition are of particular importance during heat waves. The presence of glassy materials exposed to solar radiation in solid waste piles should be avoided since it resulted responsible of accidents due to the lens effect. The possible decrease of water/humidity content of wastes during heat waves should also be considered since it favors the occurrence of conditions leading to the self-ignition of materials.
5. Conclusions
A dataset of past Natech events triggered by heat waves was collected and analyzed. The results allowed the understanding of the features of such accident scenarios, with specific reference to the direct causes, to the cause–consequence sequence, and to the equipment items and substance categories more frequently involved. The main direct cause of accidents was the internal pressure increase, exceeding equipment design limits. Fire scenarios are the more important category of technological scenarios that occurred. Besides equipment handling liquid and gaseous hydrocarbons, waste storage and processing systems were also frequently involved in accidents, due to the self-decomposition and self-ignition phenomena. Overall, the analysis of past accidents carried out clearly evidences the threat posed by heat waves and by high ambient temperatures to industrial facilities where hazardous substances are present. In the perspective of climate change, the hazard posed by this category of accidents should be carefully considered. The lessons learned from past accidents allowed drawing several suggestions to support the adoption of specific actions to prevent or mitigate these accident scenarios. Thus, the results represent a step forward in the understanding and managing the risk of Natech accidents triggered by heat waves, providing key elements to avoid the occurrence of similar accidents in the future.
Author Contributions
Conceptualization, F.R. and V.C.; methodology, F.R. and V.C.M.; formal analysis, F.R.; data curation, F.R.; writing—original draft preparation, F.R.; writing—review and editing, V.C.; supervision, V.C. All authors have read and agreed to the published version of the manuscript.
Funding
This research was funded by MIUR—Italian Ministry for Scientific Research under the PRIN 2017 program, grant number 2017CEYPS8.
Institutional Review Board Statement
Not applicable.
Informed Consent Statement
Not applicable.
Data Availability Statement
The data presented in this study are available on request from the corresponding author.
Conflicts of Interest
The authors declare no conflict of interest. The funders had no role in the design of the study; in the collection, analyses, or interpretation of data; in the writing of the manuscript; or in the decision to publish the results.
Appendix A
The present section reports the itemized lists used to organize the information available on past accidents in the dataset.
Technological scenarios considered in the present study are reported in Table A1, which provides the list and the definition of possible outcomes including fires, explosions, toxic gas dispersions, environmental contaminations, and releases. Notably, also near misses are included in the list since these were considered in the present study. Modifications concerning the original classification proposed by Ricci et al. [7] are reported in italic.
The classification of the industrial sectors is provided in Table A2. The classification was done starting from the International Standard Industrial Classification of All Economic Activities [57]. As discussed in Section 2, transport via water was excluded in the present study. Table A2 is adapted from the classification provided by Ricci et al. [7]. Modifications concerning the original classification are reported in italic.
Table A3 reports the list of the categories of equipment items considered in the dataset.

Table A1.
Technological scenarios considered in the dataset (adapted from Ricci et al. [7]).
Table A1.
Technological scenarios considered in the dataset (adapted from Ricci et al. [7]).
| Technological Scenario | Definition |
|---|---|
| Fire | An uncontrolled combustion process characterized by the emission of heat and smoke. Includes all types of industrial fires, i.e., pool fires, flash fires, jet fires, and fireballs [58]. |
| Explosion | A sudden release of energy that causes a blast wave [58]. Includes all types of industrial explosions, i.e., unconfined and partially confined gas and vapor explosions (VCE), confined explosions, and mechanical explosions [59]. |
| Toxic gas dispersion | The dispersion of a toxic substance in the air [60]. |
| Environmental contamination | Contamination of surface waters (rivers, lakes, seas,...) or of the aquifer by substances harmful to the aquatic environment [60]. |
| Release | The release of a liquid or gas from its containment [58], in quantities and concentrations that have no short-term potential consequence for persons and the environment. |
| Multiple scenarios | Any combination of the previous technological scenario, when meaningful. |
| Near misses | An event that does not result in an actual loss but has the potential to do so [42]. |
Table A2.
Industrial sectors included in the dataset (adapted from Ricci et al. [7]).
Table A2.
Industrial sectors included in the dataset (adapted from Ricci et al. [7]).
| Industrial Sector | Definition |
|---|---|
| Chemical and Petrochemical | Chemical activities, including pesticide production, pharmaceutical industry, and production of basic chemicals. Petrochemical activities, including refineries. |
| Storage and Warehousing | Sites where chemicals are stored in appointed equipment (i.e., storage tanks) and storage buildings (e.g., warehouses and depots). |
| Power production | Power production plants using hydrocarbons (thermal power stations). Nuclear power plants were not included in the present analysis. |
| Bioprocesses | Treatment of organic waste and waste fermentation juices; food industry. |
| Water treatment | Treatment of water for industrial and domestic purposes (excluding bioprocesses-related waters and slurries). |
| Transport via road and rail | Transportation of hazardous materials via road and rail. |
| Transport via pipeline | Oil and gas transportation via pipelines. |
| Manufacturing | Metalworking, textile industry, and activities related to the automotive sector where hazardous substances are used. |
Table A3.
Categories of equipment items considered in the dataset.
| Equipment Category | Examples |
|---|---|
| Machinery | Pump and compressor. |
| Pipework | Pipelines and pipeworks. |
| Process equipment | Column, reactor, and heat exchanger. |
| Storage equipment | Atmospheric storage vessel and pressurized storage vessel. |
| Road/rail tanker | Road tanker and rail tanker. |
| Valves and instrumentation | Valves and control devices. |
| Warehouses | Packed materials and spare materials- |
| Waste disposal | Landfill cells and piles of wastes. |
References
- European Commission. Technological Accidents Triggered by Natural Disasters. Available online: https://ec.europa.eu/jrc/en/research-topic/technological-accidents-triggered-natural-disasters (accessed on 12 January 2023).
- Girgin, S. The Natech Events during the 17 August 1999 Kocaeli Earthquake: Aftermath and Lessons Learned. Nat. Hazards Earth Syst. Sci. 2011, 11, 1129–1140. [Google Scholar] [CrossRef]
- Cruz, A.M.; Krausmann, E. Damage to Offshore Oil and Gas Facilities Following Hurricanes Katrina and Rita: An Overview. J. Loss Prev. Process Ind. 2008, 21, 620–626. [Google Scholar] [CrossRef]
- Krausmann, E.; Cruz, A.M. Impact of the 11 March 2011, Great East Japan Earthquake and Tsunami on the Chemical Industry. Nat. Hazards 2013, 67, 811–828. [Google Scholar] [CrossRef]
- Centre for Research on the Epidemiology of Disasters. EM-DAT: The Emergency Events Database; Centre for Research on the Epidemiology of Disasters, School of Public Health, Université catholique de Louvain: Brussels, Belgium. Available online: https://www.emdat.be/ (accessed on 12 January 2023).
- NOAA National Centers for Environmental Information. Storm Events Database. Available online: https://www.ncdc.noaa.gov/stormevents/ (accessed on 12 January 2023).
- Ricci, F.; Casson Moreno, V.; Cozzani, V. A Comprehensive Analysis of the Occurrence of Natech Events in the Process Industry. Process Saf. Environ. Prot. 2021, 147, 703–713. [Google Scholar] [CrossRef]
- Casson Moreno, V.; Ricci, F.; Sorichetti, R.; Misuri, A.; Cozzani, V. Analysis of Past Accidents Triggered by Natural Events in the Chemical and Process Industry. Chem. Eng. Trans. 2019, 74, 1405–1410. [Google Scholar] [CrossRef]
- Krausmann, E.; Cruz, A.M.; Affeltranger, B. The Impact of the 12 May 2008 Wenchuan Earthquake on Industrial Facilities. J. Loss Prev. Process Ind. 2010, 23, 242–248. [Google Scholar] [CrossRef]
- Zama, S.; Nishi, H.; Hatayama, K.; Yamada, M.; Yoshihara, H. On Damage of Oil Storage Tanks Due to the 2011 off the Pacific Coast of Tohoku Earthquake (Mw 9.0), Japan. In Proceedings of the 15th World Conference on Earthquake Engineering (WCEE), Lisbon, Portugal, 24–28 September 2012. [Google Scholar]
- Misuri, A.; Casson Moreno, V.; Quddus, N.; Cozzani, V. Lessons Learnt from the Impact of Hurricane Harvey on the Chemical and Process Industry. Reliab. Eng. Syst. Saf. 2019, 190, 106521. [Google Scholar] [CrossRef]
- Salzano, E.; Garcia Agreda, A.; Di Carluccio, A.; Fabbrocino, G. Risk Assessment and Early Warning Systems for Industrial Facilities in Seismic Zones. Reliab. Eng. Syst. Saf. 2009, 94, 1577–1584. [Google Scholar] [CrossRef]
- Lanzano, G.; Salzano, E.; de Magistris, F.S.; Fabbrocino, G. Seismic Vulnerability of Natural Gas Pipelines. Reliab. Eng. Syst. Saf. 2013, 117, 73–80. [Google Scholar] [CrossRef]
- Landucci, G.; Antonioni, G.; Tugnoli, A.; Cozzani, V. Release of Hazardous Substances in Flood Events: Damage Model for Atmospheric Storage Tanks. Reliab. Eng. Syst. Saf. 2012, 106, 200–216. [Google Scholar] [CrossRef]
- Caratozzolo, V.; Misuri, A.; Cozzani, V. A Generalized Equipment Vulnerability Model for the Quantitative Risk Assessment of Horizontal Vessels Involved in Natech Scenarios Triggered by Floods. Reliab. Eng. Syst. Saf. 2022, 223, 108504. [Google Scholar] [CrossRef]
- Khakzad, N.; Van Gelder, P. Fragility Assessment of Chemical Storage Tanks Subject to Floods. Process Saf. Environ. Prot. 2017, 111, 75–84. [Google Scholar] [CrossRef]
- Qin, R.; Zhu, J.; Khakzad, N. Multi-Hazard Failure Assessment of Atmospheric Storage Tanks during Hurricanes. J. Loss Prev. Process Ind. 2020, 68, 104325. [Google Scholar] [CrossRef]
- Cozzani, V.; Antonioni, G.; Landucci, G.; Tugnoli, A.; Bonvicini, S.; Spadoni, G. Quantitative Assessment of Domino and NaTech Scenarios in Complex Industrial Areas. J. Loss Prev. Process Ind. 2014, 28, 10–22. [Google Scholar] [CrossRef]
- Antonioni, G.; Spadoni, G.; Cozzani, V. A Methodology for the Quantitative Risk Assessment of Major Accidents Triggered by Seismic Events. J. Hazard. Mater. 2007, 147, 48–59. [Google Scholar] [CrossRef]
- Antonioni, G.; Landucci, G.; Necci, A.; Gheorghiu, D.; Cozzani, V. Quantitative Assessment of Risk Due to NaTech Scenarios Caused by Floods. Reliab. Eng. Syst. Saf. 2015, 142, 334–345. [Google Scholar] [CrossRef]
- Khakzad, N.; Van Gelder, P. Vulnerability of Industrial Plants to Flood-Induced Natechs: A Bayesian Network Approach. Reliab. Eng. Syst. Saf. 2018, 169, 403–411. [Google Scholar] [CrossRef]
- Zeng, T.; Chen, G.; Reniers, G.; Yang, Y. Methodology for Quantitative Risk Analysis of Domino Effects Triggered by Flood. Process Saf. Environ. Prot. 2021, 147, 866–877. [Google Scholar] [CrossRef]
- Luo, X.; Cruz, A.M.; Tzioutzios, D. Extracting Natech Reports from Large Databases: Development of a Semi-Intelligent Natech Identification Framework. Int. J. Disaster Risk Sci. 2020, 11, 735–750. [Google Scholar] [CrossRef]
- Nascimento, K.R.D.S.; Alencar, M.H. Management of Risks in Natural Disasters: A Systematic Review of the Literature on NATECH Events. J. Loss Prev. Process Ind. 2016, 44, 347–359. [Google Scholar] [CrossRef]
- Suarez-Paba, M.C.; Perreur, M.; Munoz, F.; Cruz, A.M. Systematic Literature Review and Qualitative Meta-Analysis of Natech Research in the Past Four Decades. Saf. Sci. 2019, 116, 58–77. [Google Scholar] [CrossRef]
- Ricci, F.; Casson Moreno, V.; Cozzani, V. Analysis of NaTech Accidents Triggered by Extreme Temperatures in the Chemical and Process Industry. Chem. Eng. Trans. 2020, 82, 79–84. [Google Scholar] [CrossRef]
- Ricci, F.; Casson Moreno, V.; Cozzani, V. Natech Accidents Triggered by Cold Waves. Process Saf. Environ. Prot. 2023, 173, 106–119. [Google Scholar] [CrossRef]
- Intergovernmental Panel on Climate Change. Managing the Risks of Extreme Events and Disasters to Advance Climate Change Adaptation; A Special Report of Working Groups I and II of the Intergovernmental Panel on Climate Change; Field, C.B., Barros, V., Stocker, T.F., Qin, D., Dokken, D.J., Ebi, K.L., Mastrandrea, M.D., Mach, K.J., Plattner, G.-K., Allen, S.K., et al., Eds.; Cambridge University Press: Cambridge, UK; New York, NY, USA, 2012; 594p. [Google Scholar]
- Dimitrakopoulos, A.; Gogi, C.; Stamatelos, G.; Mitsopoulos, I. Statistical Analysis of the Fire Environment of Large Forest Fires (>1000 Ha) in Greece. Pol. J. Environ. Stud. 2011, 20, 327–332. [Google Scholar]
- Flannigan, M.D.; Wotton, B.M.; Marshall, G.A.; de Groot, W.J.; Johnston, J.; Jurko, N.; Cantin, A.S. Fuel Moisture Sensitivity to Temperature and Precipitation: Climate Change Implications. Clim. Chang. 2016, 134, 59–71. [Google Scholar] [CrossRef]
- Healy, J.; Taylor, K.; Penn, I. California Wildfires: Extreme Heat Turns State Into a Furnace. New York Times, 7 September 2020. [Google Scholar]
- California Department of Forestry and Fire Protection (CAL FIRE). 2020 Incident Archive. Available online: https://www.fire.ca.gov/incidents/2020 (accessed on 27 March 2023).
- California Department of Forestry and Fire Protection (CAL FIRE). 2021 Incident Archive. Available online: https://www.fire.ca.gov/incidents/2021 (accessed on 27 March 2023).
- Khakzad, N. Modeling Wildfire Spread in Wildland-Industrial Interfaces Using Dynamic Bayesian Network. Reliab. Eng. Syst. Saf. 2019, 189, 165–176. [Google Scholar] [CrossRef]
- Viegas, D.X.; Figueiredo, M.; Ribeiro, L.M. O Complexo de Incendios de Pedrógao Grande e Conchelos Limítrofes, Iniciado a 17 de Junho de 2017; Centro de Estudos sobre Incêndios Florestais, Departamento de Engenharia Mecânica, Faculdade de Ciências e Tecnologia, Universidade de Coimbra: Coimbra, Portugal, 2017. [Google Scholar]
- Efthimiou, N.; Psomiadis, E.; Panagos, P. Fire Severity and Soil Erosion Susceptibility Mapping Using Multi-Temporal Earth Observation Data: The Case of Mati Fatal Wildfire in Eastern Attica, Greece. Catena 2020, 187, 104320. [Google Scholar] [CrossRef]
- Scarponi, G.E.; Heymes, F. CFD Study of the Behavior of LPG Tanks Exposed to Forest Fires. Chem. Eng. Trans. 2018, 67, 181–186. [Google Scholar]
- Scarponi, G.E.; Pastor, E.; Planas, E.; Cozzani, V. Analysis of the Impact of Wildland-Urban-Interface Fires on LPG Domestic Tanks. Saf. Sci. 2020, 124, 104588. [Google Scholar] [CrossRef]
- Khakzad, N.; Dadashzadeh, M.; Reniers, G. Quantitative Assessment of Wildfire Risk in Oil Facilities. J. Environ. Manag. 2018, 223, 433–443. [Google Scholar] [CrossRef]
- Ricci, F.; Scarponi, G.E.; Pastor, E.; Planas, E.; Cozzani, V. Safety Distances for Storage Tanks to Prevent Fire Damage in Wildland-Industrial Interface. Process Saf. Environ. Prot. 2021, 147, 693–702. [Google Scholar] [CrossRef]
- Ricci, F.; Scarponi, G.E.G.E.; Pastor, E.; Muñoz, J.A.; Planas, E.; Cozzani, V. Vulnerability of Industrial Storage Tanks to Wildfire: A Case Study. Chem. Eng. Trans. 2021, 86, 235–240. [Google Scholar] [CrossRef]
- Rathnayaka, S.; Khan, F.; Amyotte, P. SHIPP Methodology: Predictive Accident Modeling Approach. Part I: Methodology and Model Description. Process Saf. Environ. Prot. 2011, 89, 151–164. [Google Scholar] [CrossRef]
- Uijt de Haag, P.A.M.; Ale, B.J.M. Guidelines for Quantitative Risk Assessment (Purple Book); Committee for the Prevention of Disasters: The Hague, The Netherlands, 2005. [Google Scholar]
- European Major Accident Hazards Bureau The EMARS (Major Accident Reporting System) Database. Available online: Emars.jrc.ec.europa.eu/en/emars/accident/ (accessed on 31 January 2020).
- U.K. Health and Safety Executive Major Hazard Incident Data Service (MHIDAS), United Kingdom. 2001.
- Harding, A.B. MHIDAS: The First Ten Years. In Institution of Chemical Engineers Symposium Series; Pergamon Press: Oxford, UK, 1997. [Google Scholar]
- Institution of Chemical Engineers. The TAD IChemE (The Accident Database, Institution of Chemical Engineers) Database. Available online: www.icheme.org/ (accessed on 31 January 2020).
- Bureau for Analysis of Industrial Risks and Pollutions. The ARIA (Analysis, Research and Information on Accidents) Database. Available online: www.aria.developpement-durable.gouv.fr/the-barpi/the-aria-database/ (accessed on 31 January 2020).
- U.S. Coast Guard. The NRC (National Response Center) Database. Available online: www.epa.gov/emergency-response/national-response-center (accessed on 31 January 2020).
- Cech, M.; Davis, P.; Gambardella, F.; Haskamp, A.; Herrero, P.; Spence, M.; Larivé, J.F. Performance of European Cross-Country Oil Pipelines; Concawe: Brussels, Belgium, 2019. [Google Scholar]
- Casson Moreno, V.; Cozzani, V. Major Accident Hazard in Bioenergy Production. J. Loss Prev. Process Ind. 2015, 35, 135–144. [Google Scholar] [CrossRef]
- Casson Moreno, V.; Reniers, G.; Salzano, E.; Cozzani, V. Analysis of Physical and Cyber Security-Related Events in the Chemical and Process Industry. Process Saf. Environ. Prot. 2018, 116, 621–631. [Google Scholar] [CrossRef]
- Federal Emergency Management Agency (FEMA). The National Risk Index. Available online: https://hazards.fema.gov/nri/ (accessed on 27 March 2023).
- Wienchol, P.; Korus, A.; Szlęk, A.; Ditaranto, M. Thermogravimetric and Kinetic Study of Thermal Degradation of Various Types of Municipal Solid Waste (MSW) under N2, CO2 and Oxy-Fuel Conditions. Energy 2022, 248, 123573. [Google Scholar] [CrossRef]
- Wittich, K.-P.; Müller, T. An Experiment to Test the Potential for Glass Fragments to Ignite Wildland Fuels. Int. J. Wildl. Fire 2009, 18, 885. [Google Scholar] [CrossRef]
- United Nations. Globally Harmonized System of Classification and Labelling of Chemicals (GHS), 9th ed.; United Nations: New York, NY, USA; Geneva, Switzerland, 2021. [Google Scholar]
- United Nations. International Standard Industrial Classification of All Economic Activities (ISIC), Revision 4; United Nations: New York, NY, USA; Geneva, Switzerland, 2008. [Google Scholar]
- Van Den Bosh, C.J.H.; Weterings, R.A.P.M. Methods for the Calculation of Physical Effects: Due to Releases of Hazardous Materials (Liquids and Gases) (Yellow Book), 3rd ed.; Committee for the Prevention of Disasters: The Hague, The Netherlands, 2005. [Google Scholar]
- Reniers, G.; Cozzani, V. Domino Effects in the Process Industries; Elsevier: Amsterdam, The Netherlands, 2013; ISBN 9780444543233. [Google Scholar]
- Andersen, H.; Casal, J.; Debray, B.; De Dianous, V.; Duijm, N.J. ARAMIS: Accidental Risk Assessment Methodology for Industries in the Context of the SEVESO II Directive. In User Guide; The European Commission: Brussels, Belgium, 2004. [Google Scholar]
Figure 1.
Structure of the dataset developed for the present study. Gray icons represent fields where itemized lists are used to codify information. Red icons identify free-text fields. Further details on itemized lists used to codify information are reported in Appendix A.
Figure 1.
Structure of the dataset developed for the present study. Gray icons represent fields where itemized lists are used to codify information. Red icons identify free-text fields. Further details on itemized lists used to codify information are reported in Appendix A.

Figure 2.
Ratio between the number of reported Natech accidents and recorded natural events considering all types of Natech accidents (green bars, data on generic Natech accidents from Ricci et al. [7] and data for natural events the EM-DAT database [5]) and Natech accidents triggered by heat waves only (red bars, data on heat waves Natech accidents from the present study, data on recorded number of heat waves from the EM-DAT database [5]) in North America and Europe considering the period 1992–2022.

Figure 3.
Technological scenarios that occurred in Natech accidents triggered by heat waves. Data obtained by Ricci et al. [7] for generic Natech accidents are also shown. See Table A1 for the definition of technological scenarios.

Figure 4.
Industrial sectors affected by Natech accidents triggered by heat waves occurred. See Table A2 for the definition of industrial sectors.
Figure 4.
Industrial sectors affected by Natech accidents triggered by heat waves occurred. See Table A2 for the definition of industrial sectors.

Figure 5.
Equipment items involved in heat waves Natech accidents. The categories considered for equipment items are defined in Table A3.
Figure 5.
Equipment items involved in heat waves Natech accidents. The categories considered for equipment items are defined in Table A3.

Figure 6.
Direct causes of the technological scenarios recorded in past Natech accidents triggered by heat waves.
Figure 6.
Direct causes of the technological scenarios recorded in past Natech accidents triggered by heat waves.

Figure 7.
Breakdown of direct causes with respect to the equipment items involved in the past Natech accidents triggered by heat waves analyzed. The number reported in brackets is the total number of accidents considered for each equipment category. See Table A3 for the categorization of equipment items.

Figure 8.
Technological scenarios occurred for the different substance categories involved in accidents (Liquid hydrocarbons include Crude Oil, Fuel Oil, and Other liquid hydrocarbons; Toxic gases include ammonia; Gaseous hydrocarbons include propane).
Figure 8.
Technological scenarios occurred for the different substance categories involved in accidents (Liquid hydrocarbons include Crude Oil, Fuel Oil, and Other liquid hydrocarbons; Toxic gases include ammonia; Gaseous hydrocarbons include propane).

Figure 9.
(a) Severity of Natech events with respect to damage to humans. (b) Severity of Natech events considering economic losses. Data for generic Natech events were obtained by Ricci et al. [7].
Figure 9.
(a) Severity of Natech events with respect to damage to humans. (b) Severity of Natech events considering economic losses. Data for generic Natech events were obtained by Ricci et al. [7].

Table 1.
Original sources of the data on the past accidents considered in the analysis.
| Source | Number of Records | Share (%) |
|---|---|---|
| ARIA | 141 | 69.1 |
| NRC | 55 | 27.0 |
| MHIDAS | 4 | 2.0 |
| TAD IChemE | 3 | 1.5 |
| eMARS | 1 | 0.5 |
Table 2.
Substances involved in Natech accidents triggered by heat waves.
| Source | Number of Records | Percentage |
|---|---|---|
| Waste | 32 | 15.7% |
| Fuel oil | 17 | 8.3% |
| Ammonia | 14 | 6.9% |
| Propane | 8 | 3.9% |
| Crude oil | 7 | 3.4% |
| Other liquid hydrocarbons | 7 | 3.4% |
| Other substances | 47 | 23% |
| Unknown | 72 | 35.3% |
Table 3.
Categories of heat-sensitive substances as classified by the GHS system [56].
Table 3.
Categories of heat-sensitive substances as classified by the GHS system [56].
| Hazard class | Code | Physical Hazard Statement |
|---|---|---|
| Flammable gases | H230 | May react explosively even in absence of air |
| H231 | May react explosively even in absence of air at elevated pressure and/or temperature | |
| Self-reactive substances and mixtures and organic peroxides | H240 | Heating may cause an explosion |
| H241 | Heating may cause a fire or explosion | |
| H242 | Heating may cause a fire | |
| Self-heating substances and mixture | H251 | Self-heating; may catch fire |
| H252 | Self-heating in large quantities; may catch fire |
Disclaimer/Publisher’s Note: The statements, opinions and data contained in all publications are solely those of the individual author(s) and contributor(s) and not of MDPI and/or the editor(s). MDPI and/or the editor(s) disclaim responsibility for any injury to people or property resulting from any ideas, methods, instructions or products referred to in the content. |
© 2023 by the authors. Licensee MDPI, Basel, Switzerland. This article is an open access article distributed under the terms and conditions of the Creative Commons Attribution (CC BY) license (https://creativecommons.org/licenses/by/4.0/).
Share and Cite
MDPI and ACS Style
Ricci, F.; Casson Moreno, V.; Cozzani, V. Natech Accidents Triggered by Heat Waves. Safety 2023, 9, 33. https://doi.org/10.3390/safety9020033
AMA Style
Ricci F, Casson Moreno V, Cozzani V. Natech Accidents Triggered by Heat Waves. Safety. 2023; 9(2):33. https://doi.org/10.3390/safety9020033
Chicago/Turabian StyleRicci, Federica, Valeria Casson Moreno, and Valerio Cozzani. 2023. "Natech Accidents Triggered by Heat Waves" Safety 9, no. 2: 33. https://doi.org/10.3390/safety9020033
Note that from the first issue of 2016, this journal uses article numbers instead of page numbers. See further details here.