
Comparing Machine Learning Techniques for Predictions of Motorway Segment Crash Risk Level
by
 , , ,
, , ,
Dimitrios Nikolaou
* ,
,
Apostolos Ziakopoulos
,
Anastasios Dragomanovits
,
Julia Roussou
and
George Yannis

Department of Transportation Planning and Engineering, National Technical University of Athens, 5 Heroon Polytechniou Str., GR-15773 Athens, Greece
*
Author to whom correspondence should be addressed.
Safety 2023, 9(2), 32; https://doi.org/10.3390/safety9020032
Submission received: 27 March 2023
/
Revised: 9 May 2023
/
Accepted: 18 May 2023
/
Published: 20 May 2023
Abstract
:Motorways are typically the safest road environment in terms of injury crashes per million vehicle kilometres; however, given the high severity of crashes occurring therein, there is still space for road safety improvements. The objective of this study is to compare the classification performance of five machine learning techniques for predictions of crash risk levels of motorway segments. To that end, data on crash risk levels, driving behaviour metrics, and road geometry characteristics of 668 motorway segments were exploited. The utilized dataset was divided into training and test subsets, with a proportion of 75% and 25%, respectively. The training subset was used to train the models, whereas the test subset was used for the evaluation of their performance. The response variable of the models was the crash risk level of the considered motorway segments, while the predictors were various road design characteristics and naturalistic driving behaviour metrics. The techniques considered were Logistic Regression, Decision Tree, Random Forest, Support Vector Machine, and K-Nearest Neighbours. Among the five techniques, the Random Forest model achieved the best classification performance (overall accuracy: 89.3%, macro-averaged precision: 89.0%, macro-averaged recall: 88.4%, macro-averaged F1 score: 88.6%). Moreover, the Shapley additive explanations were calculated in order to assist with the interpretation of the model’s outcomes. The findings of this study are particularly useful as the Random Forest model could be used as a highly promising proactive road safety tool for identifying potentially hazardous motorway segments.
1. Introduction and Background
Motorways, also referred to as freeways, exhibit much lower crash rates, in terms of injury crashes per million vehicle kilometres, than other road types. Studies comparing motorways to standard rural and urban roads indicate 50% to 90% lower crash rates for motorways [1]. It has also been found that the extension of the motorway network is associated with a reduction in road fatality rates, while other road types do not present the same positive safety effects [2]. During the last few years, motorway length has increased substantially in many European countries [3]. Elvik et al. evaluated the road safety effects of a new motorway in Norway through an Empirical Bayes before-after evaluation and found that injury severity was reduced markedly [4]. In the case of Greece, the considerable improvement of its main road network from 750 km of motorways in 2007 to 2200 km in 2018 was a key factor for the reduction in road fatalities by 54% during the period 2010–2020 [5].
Although motorways exhibit reduced crash rates compared to other road types, crashes still occur, and, due to high vehicle speeds, these crashes tend to be more severe. Therefore, there is still space for road safety improvements. In Greece, 50 road fatalities were recorded on motorways in 2019 and, towards this direction, a target of zero fatalities on motorways by 2030 has been set in the Greek Road Safety Strategic Plan for the period 2021–2030 [6]. Naturally, available funds for road safety interventions are not infinite. Consequently, decision-makers and stakeholders are forced to resolve their optimal allocation. Several quantitative techniques have been applied to enhance decision-making with regard to identification of segments’ crash frequencies or risk levels and their prioritization in terms of potential upgrades.
Indicatively, Montella et al. developed two generalized linear crash prediction models with a negative binomial distribution error structure for estimating the safety of rural motorway segments in Italy [7]. The first one considered total road crashes, while the second model considered only severe crashes. The key result of this research was that design consistency measures significantly affected road safety. La Torre et al. used a 5-year period dataset with fatal and injury crashes that occurred on 884 km of motorway segments in Italy, in order to develop two crash prediction models that could be applied and transferred to the entire Italian motorway network with proper calibration [8]. That research provided a tool that enables the dealing with potential safety issues and helping in selecting treatments.
Ambros et al. applied crash prediction models based on the Empirical Bayes method in order to identify potential for safety improvements of the examined road network elements, including motorways, with a priority list depicted in an online map [9]. Shah et al. proposed a two-stage framework for motorway segment risk evaluation [10]. Initially, the data envelopment analysis (DEA) technique was used in order to identify high-risk segments of two motorways. Then, artificial neural networks were applied as an analytical tool for risk prediction using speed, flow, and curvature data. The DEA technique was also used for the crash-risk ranking of 200 segments of a section of Motorway in Pakistan (M-2) Lahore-Islamabad [11]. During this process, DEA considered the safest motorway segment (i.e., lowest crashes/fatalities and highest traffic volume) as benchmark and compared the performance of the remaining segments with it, in order to identify the series of riskiest segments.
Xu et al. developed real-time crash risk prediction models to identify hazardous traffic conditions that could lead to crashes of different severity levels for the I-880 motorway in California, United States, using loop detector data [12]. Results indicated that crash prediction accuracy at each severity level was satisfactory, but traffic flow parameters affecting crash risk are different at various severity levels. In another research, Guo et al. used real-time traffic flow data and risky driving behaviour data, to investigate the crash risk on motorways and directly quantify the relationship between them and crashes in real-time crash prediction [13].
Studies on the field of road safety often utilize different Machine Learning (ML) algorithms in order to identify the best performing model for either crash injury severity or crash risk prediction. Santos et al. presented a review of the methods that have been applied to road crash injury severity modelling and mentioned Random Forest (RF) as a good approach for road traffic crash injury severity prediction, followed by Support Vector Machine (SVM), Decision Tree (DT), and K-Nearest Neighbour (K-NN) [14]. Ijaz et al. conducted a comparative study of ML classifiers for injury severity prediction of crashes involving three-wheeled motorized rickshaw and concluded that Decision Jungle (DJ) outperformed DT and RF [15]. In terms of segment-level crash risk segment prediction, Dimitrijevic et al. used road geometry characteristics, traffic flow parameters and weather condition data in order to compare the performance of models, such as Random effects Bayesian Logistic Regression (RBLR), Gaussian Naïve Bayes (GNB), K-NN, RF, and Gradient Boosting Machine (GBM) [16]. The estimation results of their study indicated that the RF model was the best performing approach among the investigated models.
Based on the aforementioned, the objective of this paper is to compare the classification performance of five well-known ML techniques for the prediction of the crash risk level of motorway segments in Greece. In order to achieve this aim, data on crash risk levels, driving behaviour metrics, and road geometry characteristics of 668 motorway segments were exploited. The techniques considered were Logistic Regression, Decision Tree, Random Forest, Support Vector Machine, and K-Nearest Neighbours. In addition, the Shapley additive explanations (SHAP) were estimated and provided as an attempt to deal with the interpretation of the best performing machine learning algorithm outcomes. It should be noted that the present research is an extension of the study that was conducted by Nikolaou et al., in which the motorway segments’ risk levels were determined and the comparison of various ML classification models was proposed as a future research direction [17].
After this Introduction, the rest of this paper is structured as follows. Section 2 describes the data used for the analyses. Section 3 provides the key components of the theoretical background of the ML methods used, the classification performance metrics and SHAP values. The analysis results are presented and discussed in Section 4, while Section 5 summarizes the key findings of this research and provides additional directions for further research.
2. Data
This study examines 668 road segments of the Olympia Odos motorway in Southern Greece. This motorway connects Athens to Patras and comprises 201.5 km of rural motorway in total. A unified database containing data on crash risk level, road design characteristics, and naturalistic driving behaviour metrics per examined segment was utilized. Four crash risk levels of the segments were defined based on the number of road crashes (injury and property-damage-only) by segment length and the respective traffic volume through an agglomerative hierarchical clustering approach, ranging from more risk-prone, potentially unsafe locations to more safe locations. The length of the considered segments varies from 200 m to 600 m. It is noted that tunnel and toll station segments were not included in the analysis. For further explanations on the hierarchical clustering process and the extraction of both road design characteristics and naturalistic driving behaviour data the reader is referred to Nikolaou et al. [17]. The variables that were considered in the analyses of this research are presented in Table 1.
It should be noted that for the number of through lanes the emergency lane present in all motorways is not counted. Furthermore, the average number of harsh events (brakings/accelerations) per trip was calculated as a percentage of the total number of trips that pass through each specific segment.
3. Methodological Background
In this paper, five ML classification models were developed. The techniques considered were Logistic Regression (LR), DT, RF, SVM, and K-NN. These algorithms were exploited in order to formulate classification models, which would predict the crash risk level of each segment by exploiting road design characteristics and naturalistic driving behaviour data. The unified database containing the variables of Table 1 was divided into training and test subsets with a proportion of 75% and 25%, respectively, using caTools R library [18]. The training subset was used to train the ML classification models, whereas the test subset was used for the evaluation of the performance of the developed models. It is underlined that the training and test subsets that were used for the five different ML classifiers were kept consistent to ensure consistency and avoid bias in the evaluation process. Moreover, it is noted that these two subsets are homogeneous, as all considered variables retained similar characteristics and properties (e.g., mean, variance, distribution, etc.). The following sub-sections provide a brief description of the key theoretical components of the ML methods used, including the classification performance metrics and SHAP values, which are crucial for evaluating and understanding the models, respectively.
3.1. Overview of Classification Algorithms
LR is a linear classification model, which employs the logistic function in order to evaluate the relationship between the input features and the output classes. In LR, a linear combination of the input features is passed through the logistic function to obtain a probability score for each class. It can deal with both binary and multiclass classification tasks and is widely used due to its simplicity and interpretability. For further information on its underlying theoretical background, the reader might consult Washington et al. [19].
DTs are a common class of non-parametric models that can be utilized for classification tasks and their concept was introduced by Quinlan in 1986 [20]. A DT is made out of nodes that represent a dataset’s features, branches for their possible values, and leaves for the classification labels. DTs are based on the concept of creating a model that can categorize new data based on a series of hierarchical decisions made on different features or attributes. This hierarchical structure is formed by repetitively partitioning the data into subsets, based on the values of the selected features until a stopping criterion is reached, such as maximum depth, minimum reduction in impurity, etc. The resulting tree structure can be easily plotted and interpreted, making it also a popular approach for road safety analyses. Yet, overfitting may occur when the trees become too complex. For more in-depth explanations, the reader is referred to Han et al. [21].
RF is a ML algorithm that was introduced by Ho in 1995 [22] and improved by Breiman in 2001 [23]. It is an ensemble learning technique that makes use of the idea of bagging to create a forest of independent DTs throughout the training phase. In this process, each tree is built using a random subset of the training data and a random subset of the features, which helps to reduce the correlation between the trees and improve their overall performance. The outcomes of each DT are combined by the RF classifier to provide the final prediction. Either a majority vote or a vote of confidence can be used to accomplish this aggregation. In contrast with the traditional DTs, RF classifier is less susceptible to overfitting, as the forest is composed of many trees that can grow to their maximum without pruning. Essentially, RFs contain multiple uncorrelated classifiers that can be combined and create a powerful classifier.
SVM is a potent ML algorithm that was introduced by Cortes and Vapnik in 1995 [24] and has gained popularity due to its promising accuracy and ability to handle both linear and non-linear decision boundaries. The main idea behind it is to find the solution hyperplane to each problem, which maximally separates the various classes of the data points in a high-dimensional feature space. This hyperplane is chosen in such a way that the margin between the two classes is maximized. Additionally, by using kernel functions, this approach can map the input data into a higher-dimensional feature space that allows for linear separation. SVMs are known for their ability to handle high-dimensional data and their effectiveness in binary and multiclass classification tasks. For further information, the reader can refer to Schölkopf et al. [25].
K-NN is a simple and intuitive classifier that assigns a label to a new data point based on the labels of its K nearest neighbours in the training set. The distance measure used to determine the nearest data points can be any of the standard related metrics, such as Euclidean distance or Manhattan distance. The value of K is a hyperparameter that regulates the model complexity and can be tuned using cross-validation. K-NN can be used for both binary and multiclass classification tasks and can handle non-linear decision boundaries. The reader is referred to [26] for additional explanations.
3.2. Classification Performance Metrics
The first step for the evaluation of the classification performance is the development of the confusion matrix, which gives insights into the distribution of the predictions and targets. A core classification performance indicator is the overall classification accuracy, which is specified as the fraction of predictions that are rightly classified. While overall classification accuracy is an important measure, it may not be enough for classifiers with response variables that contain more than two classes. In such cases, precision, recall, and the F1 score are insightful per-class performance metrics that can be calculated [27]. These metrics are particularly helpful in cases of not uniformly distributed class labels. In such cases, relying solely on accuracy can be misleading because it is possible to achieve a high overall accuracy score by simply predicting the dominant class most of the time. However, this approach could lead to low precision and recall scores for the remaining categories.
Precision indicates the fraction of right predictions for a particular category, which is calculated by dividing the number of true positives by the sum of true positives and false positives. Recall represents the fraction of cases of a category that were correctly predicted and is expressed by the number of true positives divided by the number of true positives plus the number of false negatives. In addition to precision and recall, the F1 score, which is calculated as their harmonic mean, is also commonly provided. Finally, it is mentioned that the aforementioned per-class metrics can be averaged across all classes, resulting in the respective macro-averaged scores.
3.3. Shapley Additive Explanations
SHAP values are a recent addition to the field of explainable and interpretable ML, drawing from coalitional game theory. These values provide a measure of contribution of each feature to the prediction of a particular instance in a model. The SHAP value for each feature is defined as the difference between the expected model output and the output when that feature is excluded. The SHAP values are a model-agnostic method, meaning it can be applied to explain the predictions of any machine learning model, including black-box models. In the case of multiclass classification models, SHAP values are calculated for each class separately as it allows the understanding of the contribution of each feature to the prediction of each class. For more in-depth explanations of SHAP values’ theoretical background, the reader is referred to Lundberg and Lee [28].
4. Results and Discussion
Five ML classification models were developed in R-studio [29]. The objective of these analyses was to identify the best performing model in terms of predicting crash risk level of the considered road segments. The response variable of these models was the multiclass variable “crash_risk_level” of Table 1, while the remaining variables which reflect various road design characteristics and naturalistic driving behaviour metrics were included in the models as independent predictors. The training subset was used to train the classification models and included 501 segments, while the test subset was used to evaluate the classification performance of the models and amounted to 167 motorway segments. The core parts of the five models’ training, including the R packages that were used for their development, are demonstrated in Table 2.
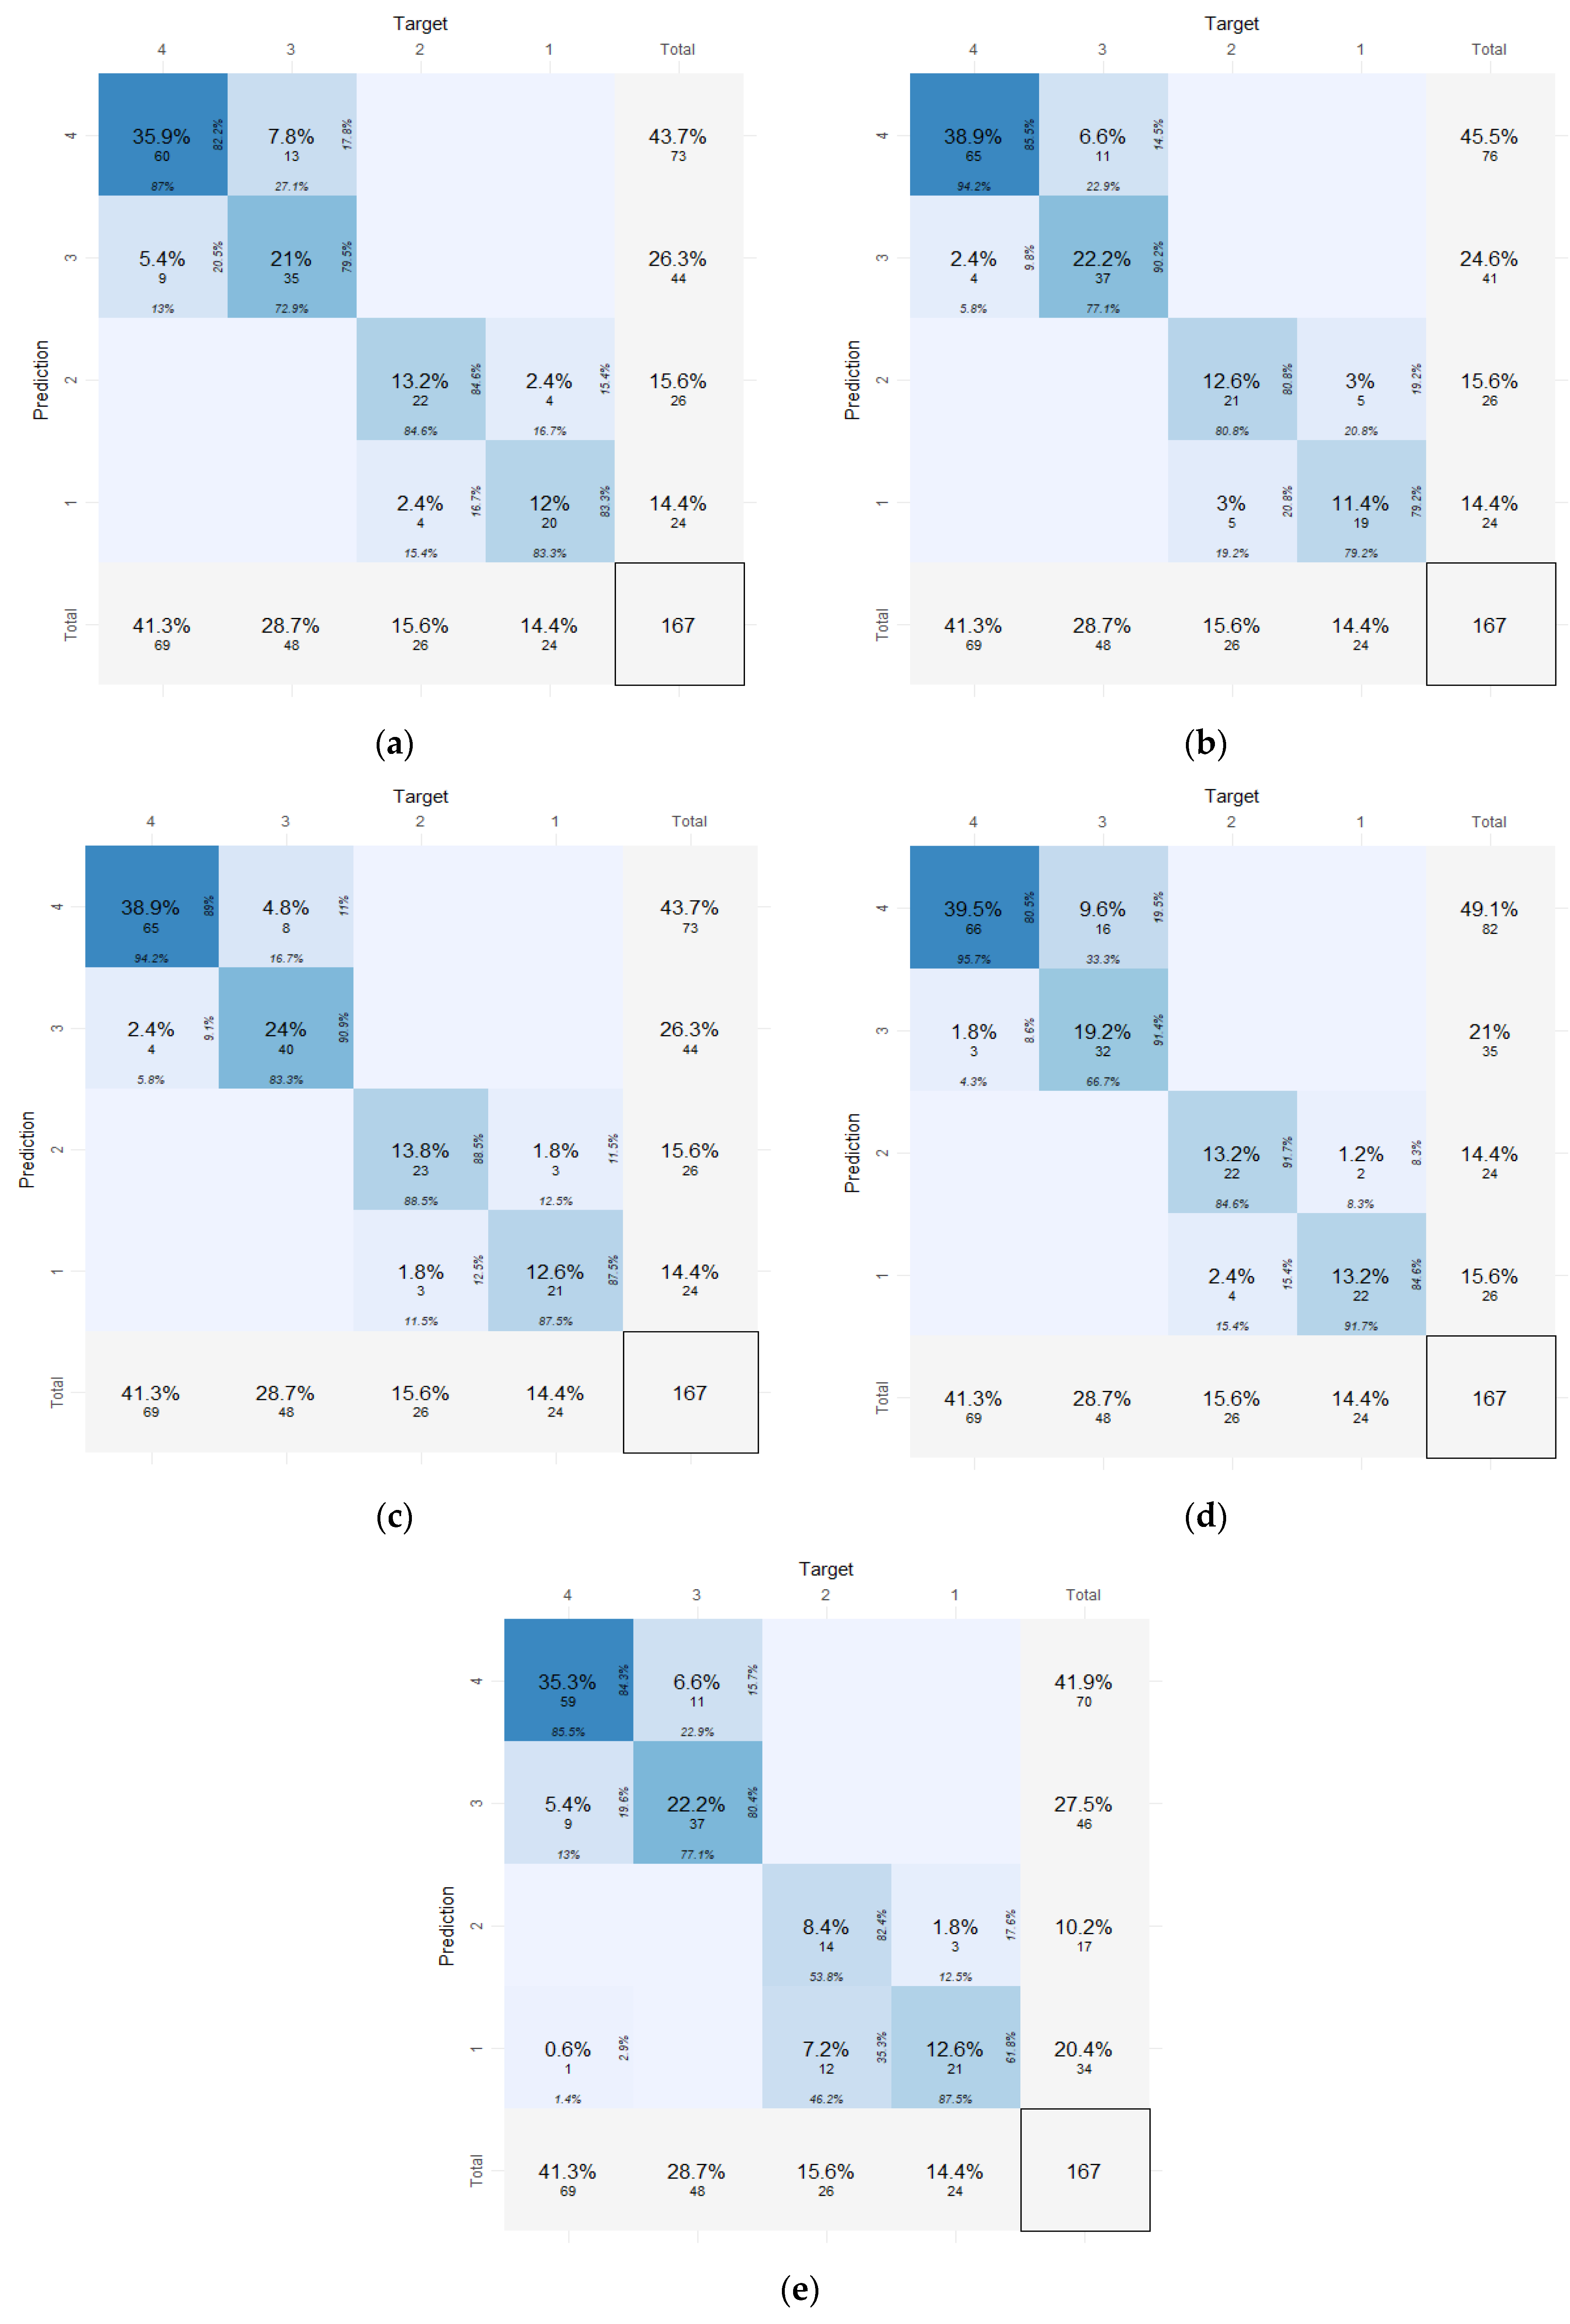
As mentioned previously, the test subset was used to evaluate the performance of the developed models. Figure 1 depicts the confusion matrixes for the test dataset specifically, which reveal the distribution of predictions and targets for the different models.
As a first outcome, it can be gleaned that the diagonals of the matrices are highly populated. This is an indication that the proposed methodology allows for overall accurate classification of crash risk levels without many losses due to misclassification in other categories (e.g., those on the secondary diagonal).
Regarding the quantification of accuracy performance, the sum of the cells of the diagonals indicates the overall accuracy of the five developed models. The resulting values in descending order are 89.3% for RF, 85.1% for DT, 85.1% for SVM, 82.1% for LR, and 78.4% for K-NN. However, in the developed classification models, the dependent variable includes four crash risk levels. Consequently, it is highly useful to investigate additional metrics for each particular category of the response variable, as overall accuracies may be misleading. To that end, Table 3 presents precision, recall, and the F1 score for each category, as well as the respective macro-averaged indicators for all the levels per developed ML classification model.
Based on Table 3 performance metrics, it can be observed that the RF classification model was the best performing model for the classification of the crash risk level of motorway segments, with very satisfactory metrics for all levels. This outcome demonstrates the noteworthy value and utility of the developed RF model, as it can predict with high accuracy the crash risk level of a motorway segment, by using road design and naturalistic driving behaviour data. Therefore, this model could serve as a reliable method to identify the most hazardous motorway sections before road crashes occur and prioritize them. This model could also aid in the efficient allocation of available resources towards targeted road safety actions and measures.
Moreover, it was also decided to calculate and provide SHAP values for the RF model as it demonstrated better classification performance than the other developed ML models. This approach was selected in order to overcome the difficult task of interpreting its outcomes. The DALEX R-package was used in order to calculate the SHAP values [30]. To create a representative instance of motorway segments, the median values of the continuous predictors were used. Medians were preferred instead of the mean values, as it can be concluded that the predictors are not normally distributed based on the outcomes of Shapiro–Wilk normality tests, skewness, and kurtosis values, which are presented in Table 4 for each predictor.
Regarding the outcome of the Shapiro–Wilk test, it can be concluded that if the test is non-significant (p-value > 0.05), the distribution of the sample is not significantly different from a normal distribution [31]. Moreover, a skewness value of 0 indicates a symmetric distribution, while positive or negative values indicate right or left skew, respectively. With regard to kurtosis, a value of 3 indicates a normal distribution, while higher or lower values indicate a more or less peaked distribution, respectively [32]. With regard to categorical predictors, their most prevalent class from the training dataset was used. This approach ensured that the new instance was representative of the data and can be used to understand the model’s prediction for similar instances.
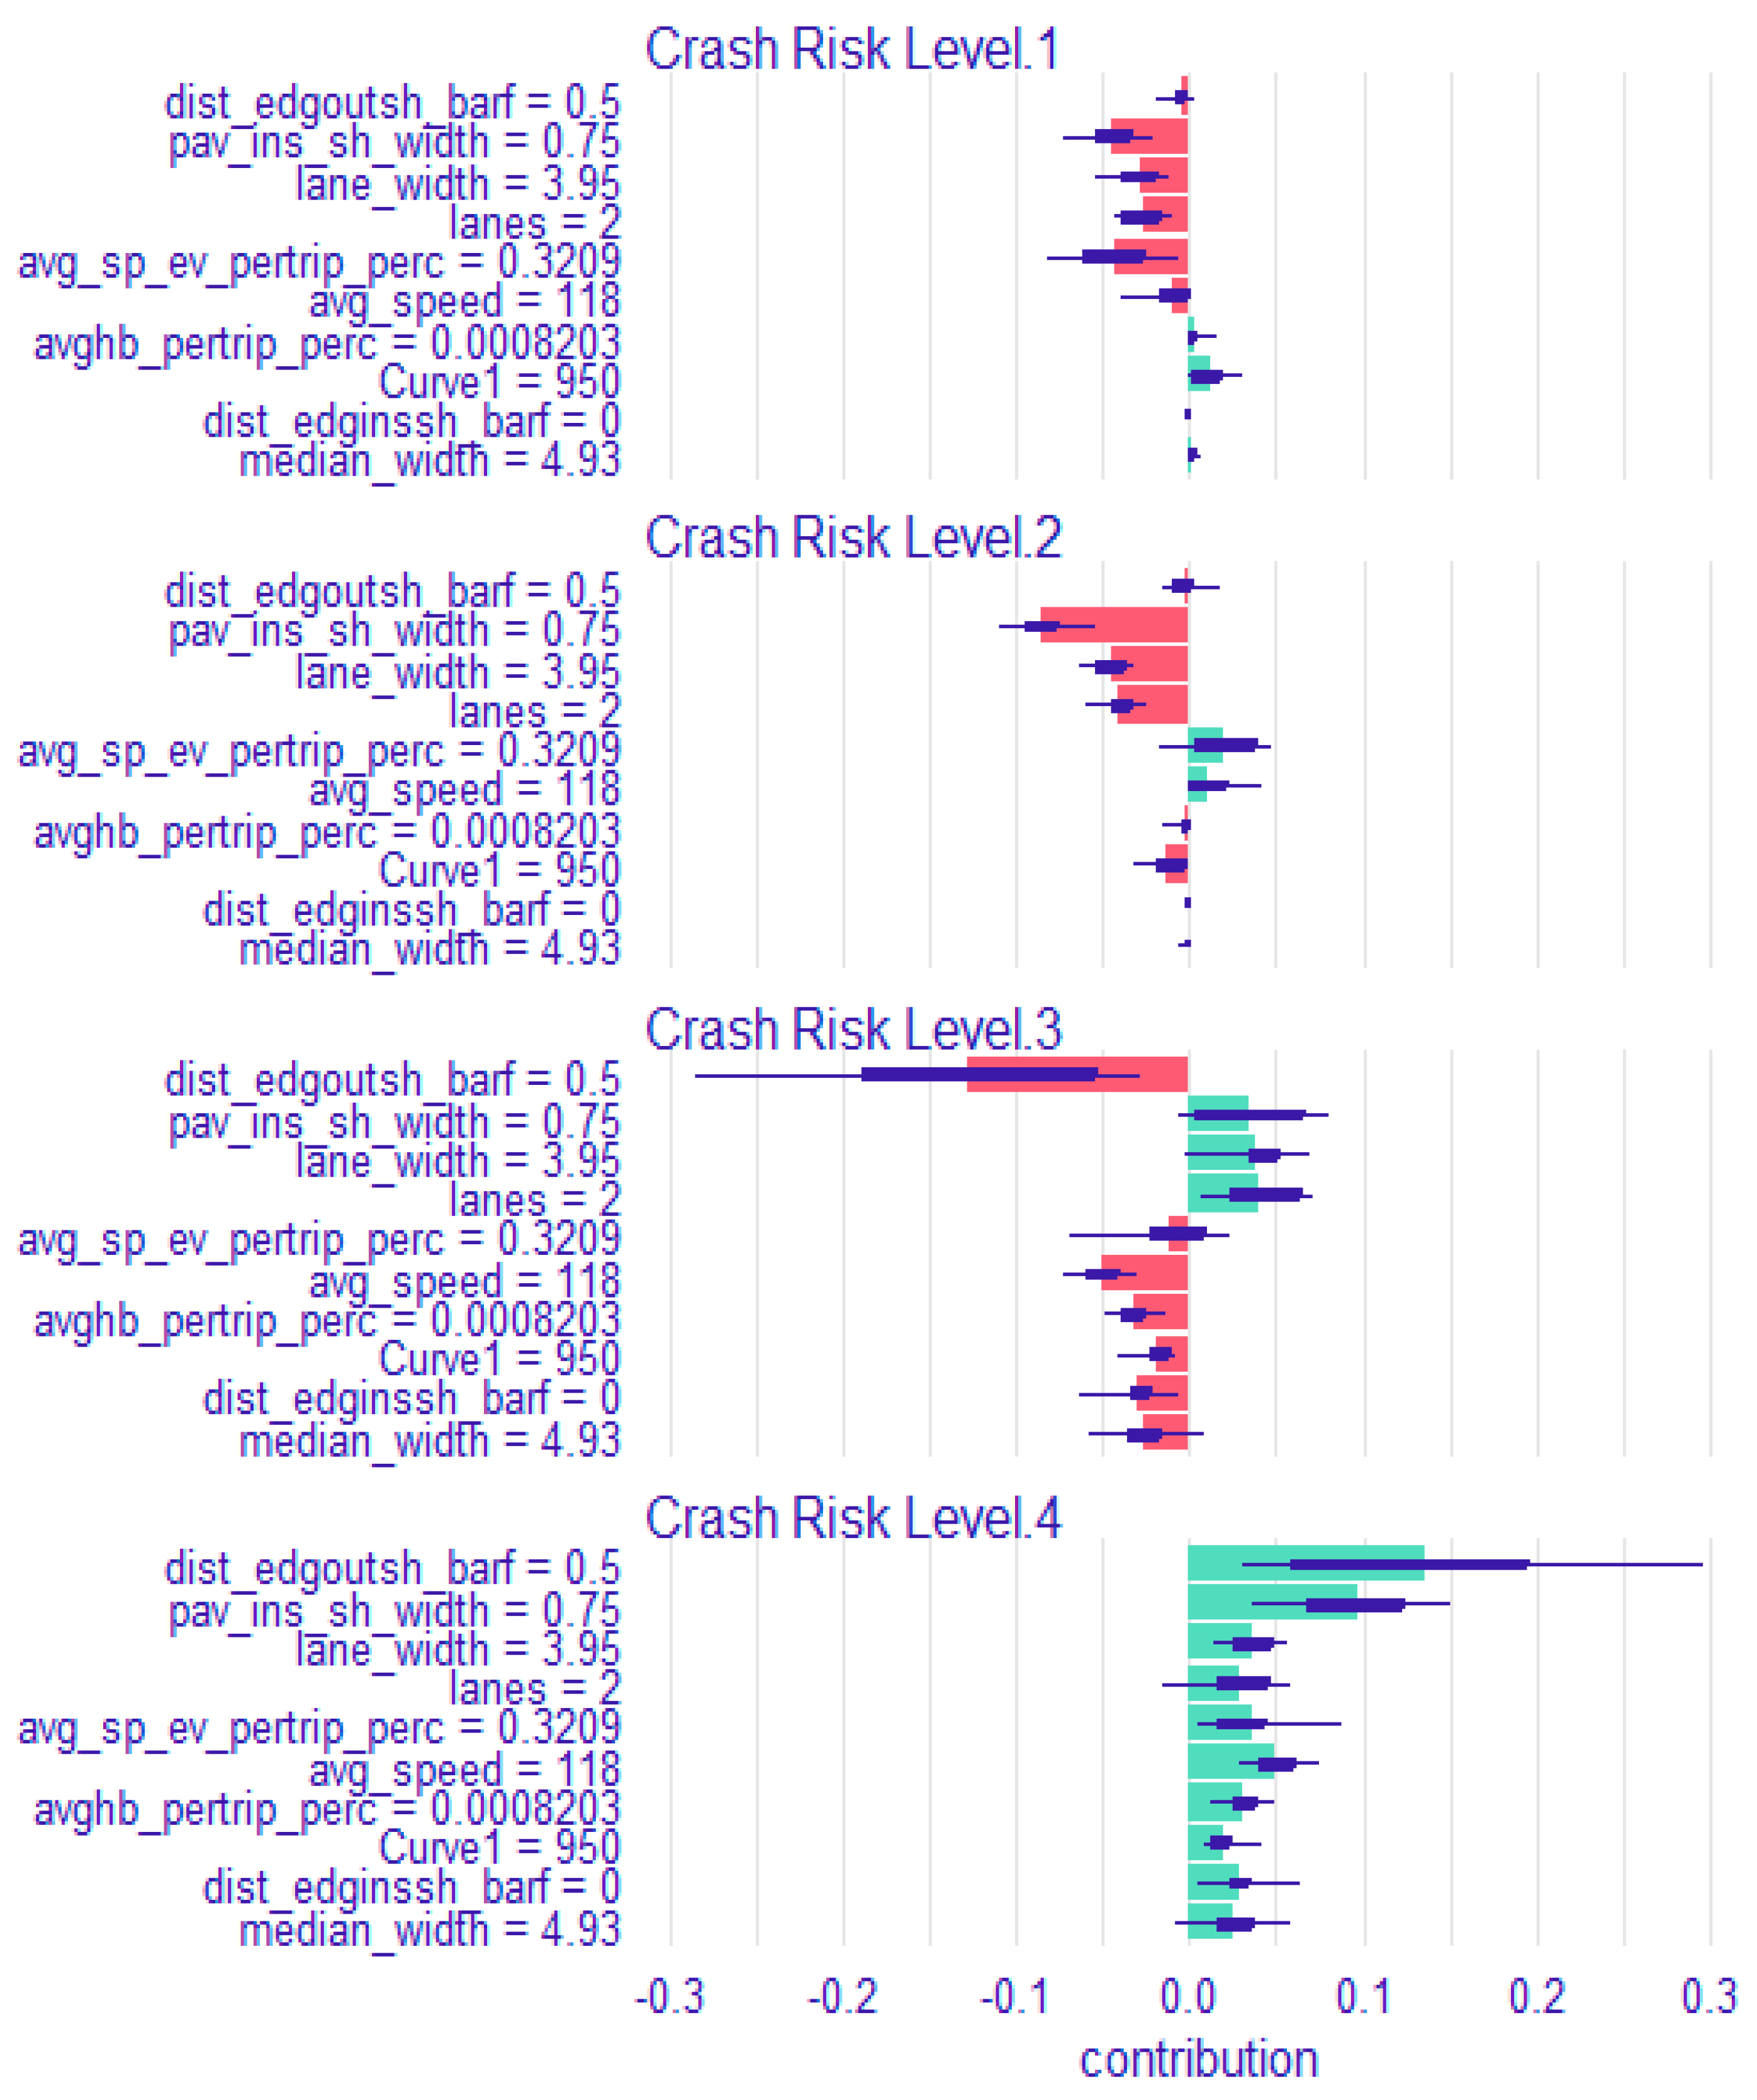
Figure 2 presents the SHAP values plot for the multi-class RF classification model, which was determined as the best performing model among the developed five models. SHAP values for each feature are computed separately for each class and the contribution of each feature to the model prediction for each class is displayed on the plot. The SHAP values can be positive (green bars) or negative (red bars) for each crash risk level, depending on whether the feature has a positive or negative contribution to the prediction for that class. It is noted that the purple boxplots of Figure 2 show the distribution of the attribution of a variable from every possible combination of variable layouts. It is also mentioned that Figure 2 demonstrates the SHAP values for a representative instance of motorway segments, which uses the median values of the numeric predictors.
It can be observed that this representative motorway segment is more likely to belong to the lowest crash risk level, as denoted by the positive (green) bars of all predictors for this specific class. This crash risk level corresponds to overall safer locations with lower traffic volumes and road crashes by segment length than the motorway segments between the first and the third crash risk level [17]. It is worth noting that Figure 2 shows the contribution of only a subset of the variables that have been included in the multiclass classification RF model, as the other variables are not contributing much to the model’s predictions and their contribution to the model’s output can be, therefore, considered negligible. A useful conclusion that can be drawn on this basis has to do with the fact that the harsh acceleration related variable does not make a significant contribution to the prediction of the segment crash risk level. Based on the literature, both harsh accelerations and harsh brakings constitute Surrogate Safety Measures that can be used in various road safety analyses [33,34,35,36]. However, the results of this investigation suggest that harsh brakings may be more pertinent than harsh accelerations for predicting the crash risk level of motorway segments overall.
Finally, a similar approach could be applied to a motorway segment with different characteristics from the representative motorway presented, in order to investigate the respective contribution of each feature to the model’s prediction for each class.
5. Conclusions
The objective of this research was to compare the classification performance of five ML techniques for the prediction of the crash risk level of motorway segments. To that end, data on crash risk levels, naturalistic driving behaviour metrics, and road design characteristics of 668 road segment of Olympia Odos motorway in Greece were used. The techniques considered were LR, DT, RF, SVM, and K-NN. The response variable of these models was the crash risk level of each motorway segment, while data on road geometry characteristics and unsafe driving behaviours, such as rates of harsh brakings, harsh accelerations, and speeding duration percentage, per trip in the considered segments were included as predictors in the developed models.
Among these models, RF achieved the best overall and per crash risk level classification performance with very high and consistent scores of more than 88% (overall accuracy: 89.3%, macro-averaged precision: 89.0%, macro-averaged recall: 88.4%, macro-averaged F1 score: 88.6%). This finding is in alignment with previous research papers, which report that RF is a promising modelling approach with high performance in either crash severity or crash risk prediction [14,16]. In addition, the SHAP values were calculated for a typical motorway segment in order to assist with the interpretation of the RF classification model, which is a black-box ML model. Based on the SHAP values of the naturalistic driving behaviour predictors, it was revealed that harsh brakings may serve as a more suitable Surrogate Safety Measure than harsh accelerations in terms of crash risk level prediction.
The findings of this research also suggest that the developed RF model could serve as a quite auspicious proactive road safety tool that could be used for the identification and prioritization of potentially hazardous motorway segments. Consequently, this approach could also assist to the best possible allocation of available resources for targeted interventions. Similar models could be applied to the rest of the motorway network in Greece, contributing to the achievement of the target of the Greek Road Safety Strategic Plan for the period 2021–2030, which aims at zero road fatalities on motorways by 2030 [6].
The inclusion of additional predictors that have not been considered in this research, such as the pavement conditions, may be beneficial towards the improved performance metrics of the ML models. Moreover, the prospect of extending the analyses included in this study to other types of road environments, such as urban and rural roads that are not motorways, is a quite challenging task that could be considered as well.
Based on the classification performance metrics of the developed models, it was found that the RF classifier outperformed the other developed classifiers in terms of predicting crash risk levels of the considered motorway segments. This is likely attributed to its ability to capture non-linear relationships, its robustness to hyperparameter choices, its ability to capture variable importance and its reduced risk of overfitting while remaining efficient. It should be mentioned that the performance of various ML models will probably vary across different datasets and the selection of the best performing approach that could serve as a proactive road safety approach should be completed with caution. The results of this research indicated that the RF classifier could be a strong candidate for this task. However, the development of additional classification models, such as Decision Jungle, which was found to outperform RF in a previous study [15], Gradient Boosting, and Linear Discriminant Analysis classifiers, could be considered in future research efforts.
Author Contributions
Conceptualization, D.N., A.Z. and G.Y.; methodology, D.N., A.Z. and G.Y.; software, D.N.; validation, D.N., A.D. and A.Z.; formal analysis, D.N.; investigation, D.N.; data curation, D.N. and A.D.; writing—original draft preparation, D.N. and A.Z.; writing—review and editing, D.N., A.Z. and J.R.; visualization, D.N.; supervision, G.Y. All authors have read and agreed to the published version of the manuscript.
Funding
This research was performed within the research project i-safemodels, been co-financed by the European Union and Greek national funds through the Operational Program Competitiveness, Entrepreneurship and Innovation, under the Call “Bilateral and Multilateral R&T Cooperation between Greece and China” (project code: Τ7ΔΚΙ00253).
Institutional Review Board Statement
The study was conducted in accordance with the Declaration of Helsinki, and approved by the Ethics Committee of National Technical University of Athens (protocol code 33496, 11 June 2019).
Informed Consent Statement
Not applicable.
Data Availability Statement
Not applicable.
Conflicts of Interest
The authors declare no conflict of interest.
References
- European Commission. Motorways; European Commission, Directorate General for Transport: Brussels, Belgium, 2018. [Google Scholar]
- Albalate, D.; Bel, G. Motorways, Tolls and Road Safety: Evidence from Europe. SERIEs 2012, 3, 457–473. [Google Scholar] [CrossRef]
- Papaioannou, D.; Kokkalis, A. Motorway Safety in Europe and Greece: A Comparative Analysis. Procedia Soc. Behav. Sci. 2012, 48, 3428–3440. [Google Scholar] [CrossRef]
- Elvik, R.; Ulstein, H.; Wifstad, K.; Syrstad, R.S.; Seeberg, A.R.; Gulbrandsen, M.U.; Welde, M. An Empirical Bayes Before-after Evaluation of Road Safety Effects of a New Motorway in Norway. Accid. Anal. Prev. 2017, 108, 285–296. [Google Scholar] [CrossRef] [PubMed]
- European Transport Safety Council. 15th Annual Road Safety Performance Index (PIN) Report; ETSC: Brussels, Belgium, 2021. [Google Scholar]
- Yannis, G.; Laiou, A.; Dragomanovits, A.; Nikolaou, D.; Folla, K.; Michelaraki, E.; Kallidoni, M.; Apostoleris, K.; Mavromatis, S.; Georgiopoulos, S.; et al. Development of the Road Safety Strategic Plan in Greece, 2021–2030. In Proceedings of the Transport Research Arena TRA 2022 Conference, Lisbon, Portugal, 14–17 November 2022. [Google Scholar]
- Montella, A.; Colantuoni, L.; Lamberti, R. Crash Prediction Models for Rural Motorways. Transp. Res. Rec. 2008, 2083, 180–189. [Google Scholar] [CrossRef]
- La Torre, F.; Meocci, M.; Domenichini, L.; Branzi, V.; Tanzi, N.; Paliotto, A. Development of an Accident Prediction Model for Italian Freeways. Accid. Anal. Prev. 2019, 124, 1–11. [Google Scholar] [CrossRef]
- Ambros, J.; Turek, R.; Brich, M.; Kubeček, J. Safety Assessment of Czech Motorways and National Roads. Eur. Transp. Res. 2019, 11, 1–21. [Google Scholar] [CrossRef]
- Shah, S.A.R.; Brijs, T.; Ahmad, N.; Pirdavani, A.; Shen, Y.; Basheer, M.A. Road Safety Risk Evaluation Using GIS-Based Data Envelopment Analysis-Artificial Neural Networks Approach. Appl. Sci. 2017, 7, 886. [Google Scholar] [CrossRef]
- Shah, S.A.R.; Ahmad, N. Accident Risk Analysis Based on Motorway Exposure: An Application of Benchmarking Technique for Human Safety. Int. J. Inj. Contr. Saf. Promot. 2020, 27, 308–318. [Google Scholar] [CrossRef]
- Xu, C.; Tarko, A.P.; Wang, W.; Liu, P. Predicting Crash Likelihood and Severity on Freeways with Real-Time Loop Detector Data. Accid. Anal. Prev. 2013, 57, 30–39. [Google Scholar] [CrossRef]
- Guo, M.; Zhao, X.; Yao, Y.; Yan, P.; Su, Y.; Bi, C.; Wu, D. A Study of Freeway Crash Risk Prediction and Interpretation Based on Risky Driving Behavior and Traffic Flow Data. Accid. Anal. Prev. 2021, 160, 106328. [Google Scholar] [CrossRef]
- Santos, K.; Dias, J.P.; Amado, C. A Literature Review of Machine Learning Algorithms for Crash Injury Severity Prediction. J. Saf. Res. 2022, 80, 254–269. [Google Scholar] [CrossRef]
- Ijaz, M.; Ian, L.; Zahid, M.; Jamal, A. A Comparative Study of Machine Learning Classifiers for Injury Severity Prediction of Crashes Involving Three-Wheeled Motorized Rickshaw. Accid. Anal. Prev. 2021, 154, 106094. [Google Scholar] [CrossRef]
- Dimitrijevic, B.; Khales, S.D.; Asadi, R.; Lee, J. Short-Term Segment-Level Crash Risk Prediction Using Advanced Data Modeling with Proactive and Reactive Crash Data. Appl. Sci. 2022, 12, 856. [Google Scholar] [CrossRef]
- Nikolaou, D.; Dragomanovits, A.; Ziakopoulos, A.; Deliali, A.; Handanos, I.; Karadimas, C.; Kostoulas, G.; Frantzola, E.K.; Yannis, G. Exploiting Surrogate Safety Measures and Road Design Characteristics towards Crash Investigations in Motorway Segments. Infrastructures 2023, 8, 40. [Google Scholar] [CrossRef]
- Tuszynski, J. caTools: Tools: Moving Window Statistics, GIF, Base64, ROC AUC, etc. R Package Version 1.18.0. 2020. Available online: https://CRAN.R-project.org/package=caTools (accessed on 20 March 2023).
- Washington, S.; Karlaftis, M.; Mannering, F.; Anastasopoulos, P. Statistical and Econometric Methods for Transportation Data Analysis, 3rd ed.; Chapman and Hall/CRC: London, UK, 2020. [Google Scholar]
- Quinlan, J.R. Induction of Decision Trees. Mach. Learn. 1986, 1, 81–106. [Google Scholar] [CrossRef]
- Han, J.; Pei, J.; Kamber, M. Data Mining: Concepts and Techniques; Elsevier: Amsterdam, The Netherlands, 2011. [Google Scholar]
- Ho, T.K. Random Decision Forests. In Proceedings of the 3rd International Conference on Document Analysis and Recognition, Montreal, QC, Canada, 14–16 August 1995. [Google Scholar]
- Breiman, L. Random Forests. Mach. Learn. 2001, 45, 5–32. [Google Scholar] [CrossRef]
- Cortes, C.; Vapnik, V. Support-Vector Networks. Mach. Learn. 1995, 20, 273–297. [Google Scholar] [CrossRef]
- Schölkopf, B.; Smola, A.J. Learning with Kernels: Support Vector Machines, Regularization, Optimization, and Beyond; MIT Press: Cambridge, MA, USA, 2002; ISBN 978-0-262-19475-4. [Google Scholar]
- Peterson, L. K-nearest neighbor. Scholarpedia 2009, 4, 1883. [Google Scholar] [CrossRef]
- Grandini, M.; Bagli, E.; Visani, G. Metrics for Multi-Class Classification: An Overview. arXiv 2020, arXiv:2008.05756. [Google Scholar]
- Lundberg, S.M.; Lee, S.-I. A Unified Approach to Interpreting Model Predictions. In Proceedings of the Advances in Neural Information Processing Systems (NIPS2017), Long Beach, CA, USA, 4–9 December 2017; Volume 30, pp. 4765–4774. [Google Scholar]
- R Core Team. R: A Language and Environment for Statistical Computing. 2023. Available online: https://www.r-project.org/ (accessed on 21 March 2023).
- Biecek, P. DALEX: Explainers for Complex Predictive Models in R. J. Mach. Learn. Res. 2018, 19, 3245–3249. [Google Scholar]
- Thode, H. Testing for Normality; Marcel Dekker, Inc.: New York, NY, USA, 2002. [Google Scholar]
- Ho, A.D.; Yu, C.C. Descriptive Statistics for Modern Test Score Distributions: Skewness, Kurtosis, Discreteness, and Ceiling Effects. Educ. Psychol. Meas. 2015, 75, 365–388. [Google Scholar] [CrossRef] [PubMed]
- Nikolaou, D.; Ziakopoulos, A.; Yannis, G. A Review of Surrogate Safety Measures Uses in Historical Crash Investigations. Sustainability 2023, 15, 7580. [Google Scholar] [CrossRef]
- Paleti, R.; Sahin, O.; Cetin, M. Modeling the Impact of Latent Driving Patterns on Traffic Safety Using Mobile Sensor Data. Accid. Anal. Prev. 2017, 107, 92–101. [Google Scholar] [CrossRef] [PubMed]
- Stipancic, J.; Miranda-Moreno, L.; Saunier, N. Vehicle Manoeuvers as Surrogate Safety Measures: Extracting Data from the Gps-Enabled Smartphones of Regular Drivers. Accid. Anal. Prev. 2018, 115, 160–169. [Google Scholar] [CrossRef]
- Ziakopoulos, A.; Vlahogianni, E.; Antoniou, C.; Yannis, G. Spatial Predictions of Harsh Driving Events Using Statistical and Machine Learning Methods. Saf. Sci. 2022, 150, 105722. [Google Scholar] [CrossRef]
Figure 1.
Confusion matrixes for the test dataset: (a) LR; (b) DT; (c) RF; (d) SVM; and (e) K-NN.

Figure 2.
SHAP values for the RF model and a representative motorway segment.


Table 1.
Variables per segment considered in the analyses and key descriptive statistics.
| Variable | Abbreviation | Descriptive Statistics |
|---|---|---|
| Crash Risk Level | crash_risk_level | Frequencies: 1: 96, 2: 104, 3: 193, 4: 275 |
| Number of through lanes | lanes | Frequencies: 2: 435, 3: 233 |
| Lane width [m] | lane_width | Min.: 3.55, Max.: 3.95, Mean: 3.92, Median: 3.95 |
| Curve 1—Radius R [m] | Curve1 | Min.: 0, Max.: 50,000, Mean: 2,129, Median: 950 |
| Curve 1—Length of curve in segment [m] | Lcurve1_in_seg | Min.: 0, Max.: 600, Mean: 218, Median: 196 |
| Median width (measured from near edges of travelled way in both directions) [m] | median_width | Min.: 2.25, Max.: 23.50, Mean: 4.96, Median: 4.88 |
| Paved inside shoulder width [m] | pav_ins_sh_width | Min.: 0.50, Max.: 1.75, Mean: 0.69, Median: 0.75 |
| Paved outside shoulder width [m] | pav_out_sh_width | Min.: 0.25, Max.: 4.50, Mean: 2.77, Median: 3.00 |
| Distance from edge of inside shoulder to barrier face [m] | dist_edginssh_barf | Min.: 0.00, Max.: 0.75, Mean: 0.04, Median: 0.00 |
| Distance from edge of outside shoulder to barrier face [m] | dist_edgoutsh_barf | Min.: 0.00, Max.: 3.25, Mean: 0.82, Median: 0.50 |
| Posted speed limit [km/h] | speed_limit | Min.: 90, Max.: 130, Mean: 121.7, Median: 130 |
| Average speed (all trips) [km/h] | avg_speed | Min.: 77, Max.: 153, Mean: 115.9, Median: 118 |
| Average number of speeding duration per trip [%] | avg_sp_ev_pertrip_perc | Min.: 1.28, Max.: 88.61, Mean: 25.79, Median: 31.80 |
| Average number of harsh brakings per trip [%] | avghb_pertrip_perc | Min.: 0.00, Max.: 3.90, Mean: 0.21, Median: 0.08 |
| Average number of harsh accelerations per trip [%] | avgha_pertrip_perc | Min.: 0.00, Max.: 9.83, Mean: 0.21, Median: 0.07 |
Table 2.
Basic elements of the five classification models’ training.
| Classification Model | Key Elements |
|---|---|
| LR | library(nnet), weights: 64 (45 variable) |
| DT | library(caret), Resampling: Cross-validated (5-fold), Method = rpart2, Maxdepth = 5 |
| RF | library(randomForest), Trees = 500, Variables tried at each split = 3, majority vote |
| SVM | library(e1071), Type: C-classification, Kernel: radial, Cost:1, gamma = 0.0667 |
| K-NN | library(caret), Pre-processing: centred (14), scaled (14), Resampling: Cross-validated (10-fold, repeated 3 times), K = 5 |
Table 3.
Performance evaluation metrics per crash risk level and developed model.
| LR | DT | RF | SVM | K-NN | |
|---|---|---|---|---|---|
| Crash Risk Level | Precision (%) | ||||
| 1 | 83.3 | 79.2 | 87.5 | 84.6 | 61.8 |
| 2 | 84.6 | 80.8 | 88.5 | 91.7 | 82.4 |
| 3 | 79.5 | 90.2 | 90.9 | 91.4 | 80.4 |
| 4 | 82.2 | 85.5 | 89.0 | 80.5 | 84.3 |
| Macro-averaged | 82.4 | 83.9 | 89.0 | 87.0 | 77.2 |
| Crash Risk Level | Recall (%) | ||||
| 1 | 83.3 | 79.2 | 87.5 | 91.7 | 87.5 |
| 2 | 84.6 | 80.8 | 88.5 | 84.6 | 53.8 |
| 3 | 72.9 | 77.1 | 83.3 | 66.7 | 77.1 |
| 4 | 87.0 | 94.2 | 94.2 | 95.7 | 85.5 |
| Macro-averaged | 82.0 | 82.8 | 88.4 | 84.7 | 76.0 |
| Crash Risk Level | F1 score (%) | ||||
| 1 | 83.3 | 79.2 | 87.5 | 88.0 | 72.4 |
| 2 | 84.6 | 80.8 | 88.5 | 88.0 | 65.1 |
| 3 | 76.1 | 83.1 | 87.0 | 77.1 | 78.7 |
| 4 | 84.5 | 89.7 | 91.5 | 87.4 | 84.9 |
| Macro-averaged | 82.1 | 83.2 | 88.6 | 85.1 | 75.3 |
Table 4.
Skewness, kurtosis, and median values of numeric predictors in the training dataset.
| Abbreviation | Shapiro–Wilk (p-Value) | Skewness | Kurtosis | Median |
|---|---|---|---|---|
| lane_width | <0.001 | −2.42 | 10.48 | 3.95 |
| Curve1 | <0.001 | 5.74 | 42.56 | 950.00 |
| Lcurve1_in_seg | <0.001 | 0.49 | 2.27 | 197.65 |
| median_width | <0.001 | 3.86 | 23.58 | 4.93 |
| pav_ins_sh_width | <0.001 | 1.63 | 11.43 | 0.75 |
| pav_out_sh_width | <0.001 | −0.85 | 3.68 | 3.00 |
| dist_edginssh_barf | <0.001 | 3.19 | 15.79 | 0.00 |
| dist_edgoutsh_barf | <0.001 | 0.96 | 3.13 | 0.50 |
| speed_limit | <0.001 | −1.16 | 2.82 | 130.00 |
| avg_speed | <0.001 | −1.27 | 6.31 | 118.00 |
| avg_sp_ev_pertrip_perc | <0.001 | 0.11 | 3.29 | 32.00% |
| avghb_pertrip_perc | <0.001 | 4.73 | 31.30 | 0.07% |
| avgha_pertrip_perc | <0.001 | 10.03 | 121.58 | 0.08% |
Disclaimer/Publisher’s Note: The statements, opinions and data contained in all publications are solely those of the individual author(s) and contributor(s) and not of MDPI and/or the editor(s). MDPI and/or the editor(s) disclaim responsibility for any injury to people or property resulting from any ideas, methods, instructions or products referred to in the content. |
© 2023 by the authors. Licensee MDPI, Basel, Switzerland. This article is an open access article distributed under the terms and conditions of the Creative Commons Attribution (CC BY) license (https://creativecommons.org/licenses/by/4.0/).
Share and Cite
MDPI and ACS Style
Nikolaou, D.; Ziakopoulos, A.; Dragomanovits, A.; Roussou, J.; Yannis, G. Comparing Machine Learning Techniques for Predictions of Motorway Segment Crash Risk Level. Safety 2023, 9, 32. https://doi.org/10.3390/safety9020032
AMA Style
Nikolaou D, Ziakopoulos A, Dragomanovits A, Roussou J, Yannis G. Comparing Machine Learning Techniques for Predictions of Motorway Segment Crash Risk Level. Safety. 2023; 9(2):32. https://doi.org/10.3390/safety9020032
Chicago/Turabian StyleNikolaou, Dimitrios, Apostolos Ziakopoulos, Anastasios Dragomanovits, Julia Roussou, and George Yannis. 2023. "Comparing Machine Learning Techniques for Predictions of Motorway Segment Crash Risk Level" Safety 9, no. 2: 32. https://doi.org/10.3390/safety9020032
Note that from the first issue of 2016, this journal uses article numbers instead of page numbers. See further details here.