Article

Safety Climate Assessment in Fuel Stations in the West Java Region

Occupational Health & Safety Department, Faculty of Public Health, Universitas Indonesia, Depok 16424, Indonesia
*
Authors to whom correspondence should be addressed.
Submission received: 7 December 2022 / Revised: 11 February 2023 / Accepted: 13 February 2023 / Published: 19 February 2023
(This article belongs to the Special Issue Resilient Safety Culture)

Abstract

:
Fuel station accidents still happen frequently all around the world. Accidents in fuel stations may cause harm to many. Fuel station environments must thus be managed well to maintain a high safety climate level. However, our literature review shows that research on the safety climate in fuel stations is scarce. This study attempts to assess the safety climate level in fuel stations in the West Java region, Indonesia. The aims of this research are to acquire the safety climate level of fuel stations, review safety climate dimensions which need serious improvement, and discover key aspects that impact the safety climate level. To achieve these goals, the Bahasa Indonesia version of the NOSACQ-50 questionnaire was used to assess the safety climate in 240 fuel stations; 678 responses were collected. The findings show that the safety climate level of fuel stations was, on average, 3.07, which is a fairly good score. Among all seven dimensions, workers’ safety priority and risk non-acceptance need the most improvement. Moreover, safety training is found to be the most influential aspect on safety climate because workers with training experience have higher safety climate perceptions. Ironically, more than 28% of respondents reported that they had not been properly trained. Therefore, fuel stations need to make sure that all employees have attended appropriate safety training. In this way, higher safety climate ratings can be achieved, hence moving forward to a safer working environment.

1. Introduction

In Indonesia, more than 50% of fossil fuels are utilized for road transportation [1]. By 2018, the total consumption of gasoline in the transportation sector reached almost 600,000 barrels/day, and this number is getting higher every year [2]. The consumption of larger volumes of oil means that more people come to gas stations each day, putting them at risk of incidents. Moreover, the location of fuel stations is usually just a stone’s throw away from dense residential areas. Therefore, once there is an accident, particularly a fire, the consequences will be dire. In fact, gas station accidents happen quite frequently. One of the most recent accidents occurred in Creeslough, Ireland, where ten people died and seven others were injured following a huge explosion at a gas station [3]. Years earlier, a heavy shower caused a flash flood in Accra, Ghana. People then took refuge at a nearby gas station, which subsequently exploded, claiming 152 lives [4]. To reduce the damage caused by natural events, the assessment and modeling of meteorological disasters have been performed [5]. The National Fire Protection Agency (NFPA) estimated an average of 4150 gas station fires in the United States each year [6]. Meanwhile, the Indonesian authority recorded 120 gas station accidents and fires between 2016 and 2018, with various causes [7]. Researchers are constantly finding more effective ways to extinguish fires, such as using water mist [8,9].
In an attempt to establish a safer environment, scholars have conducted various studies on fuel stations with different emphases. Mohsin et al. explored the occupational health risks encountered by gas station workers in China, which consisted of operational risk, chemical risk, biological risk, physiological risk, and psychological risk [10]. A study on the health risk assessment of Iranian fuel station workers, mainly based on the exposure to benzene, toluene, ethylbenzene, and xylene (BTEX), concluded that BTEX exposure was exceeding exposure limits [11]. Similar studies on BTEX exposure have also been carried out in Japan [12] and Indonesia [13,14]. Thorough assessments of fire and explosion risk at gas stations were undertaken by Ma and Huang [15], as well as Wang et al. [16] and Setyawan [17]. A study on hazard contributing factors for fuel stations revealed that human factors are the main element causing fuel station accidents [18]. More specifically, the work environment has been found to be the main cause of human factors, leading to 90% of accidents in the oil and gas industry [19]. Even so, research on safety behavior and the work environment in fuel stations are scarce.
One way to assess safety behavior and the related work environment is by evaluating the safety climate. The concept of the safety climate was first introduced by Dov Zohar in 1980 [20]. Although there is no consensus on the definition and dimensions of the safety climate, it is currently being studied extensively in various sectors [21].
The assessment of the safety climate among fuel station workers, however, is very limited. The authors searched for this particular subject in several research databases. To search more effectively, different terms referring to “fuel station” were also used, i.e., “gas station”, “petrol station”, and “service station”. The search on Scopus returned but one result. Searches on Taylor & Francis Online, Emerald Insight, and JSTOR returned five, five, and three results, respectively, but after careful examination of the content, none of them were actually related to fuel stations. Searches on IEEE Explore and Oxford Academic did not return any results at all. Detailed information on the only result can be found on Table 1.
The search results obtained earlier show a research gap on this subject. This research attempts to fill this gap by investigating the safety climate in Indonesia’s fuel stations. By looking at the safety climate constructs, it is possible to understand which areas are strongest (or weakest), thus enabling organizations to design a more specific program to improve safety in their workplaces. The research questions are as follows: (1) what is the safety climate level in Indonesian fuel stations? (2) Which of the safety climate dimensions need serious improvements? (3) What are the key aspects that impact safety climate level?

2. Literature Review

2.1. Safety Climate: Concept and Measurement

Research on the safety climate in various industries has been conducted since it was introduced by Dov Zohar in 1980 [20]. Since then, it has been explored by many other scholars throughout the years [22]. A plethora of research articles, as well as review articles, can be found across a wide range of scientific journals [23]. Even though there is no consensus among researchers on the definition of the safety climate, it is widely used to assess the safety level in an organization [21]. Furthermore, the safety climate is used as a tool to predict safety performance [24].
Many researchers conceptualized the safety climate as a higher order construct, with several dimensions supporting it. However, differences in these dimensions vary between study. One of the most representative and reliable measurement tools for the safety climate is NOSACQ-50 [25]. Kines et al. developed the NOSACQ-50 questionnaire in 2011 [26]. It has since been widely used as a tool to capture safety climate levels around the world. The NOSACQ-50 questionnaire is available in more than 40 languages, including Bahasa Indonesia [27], and is available for download.
The NOSACQ-50 questionnaire consists of 50 questions which are grouped into seven dimensions: management safety priority, commitment, and competence (Dim1); management safety empowerment (Dim2); management safety justice (Dim3); workers’ safety commitment (Dim4); workers’ safety priority and risk non-acceptance (Dim5); safety communication, learning, and trust in co-workers’ safety competence (Dim6); and trust in the efficacy of safety systems (Dim7). A four-point Likert scale was used, referring to the original questionnaire, with the terms strongly disagree, disagree, agree, and strongly agree. This score corresponds to a 1 to 4 rating for favorable statements and a reversed 4 to 1 rating for unfavorable statements. For analysis purposes, mean values of each dimension were calculated and interpreted according to NOSACQ-50 creators’ criteria [28], as shown in Table 2.

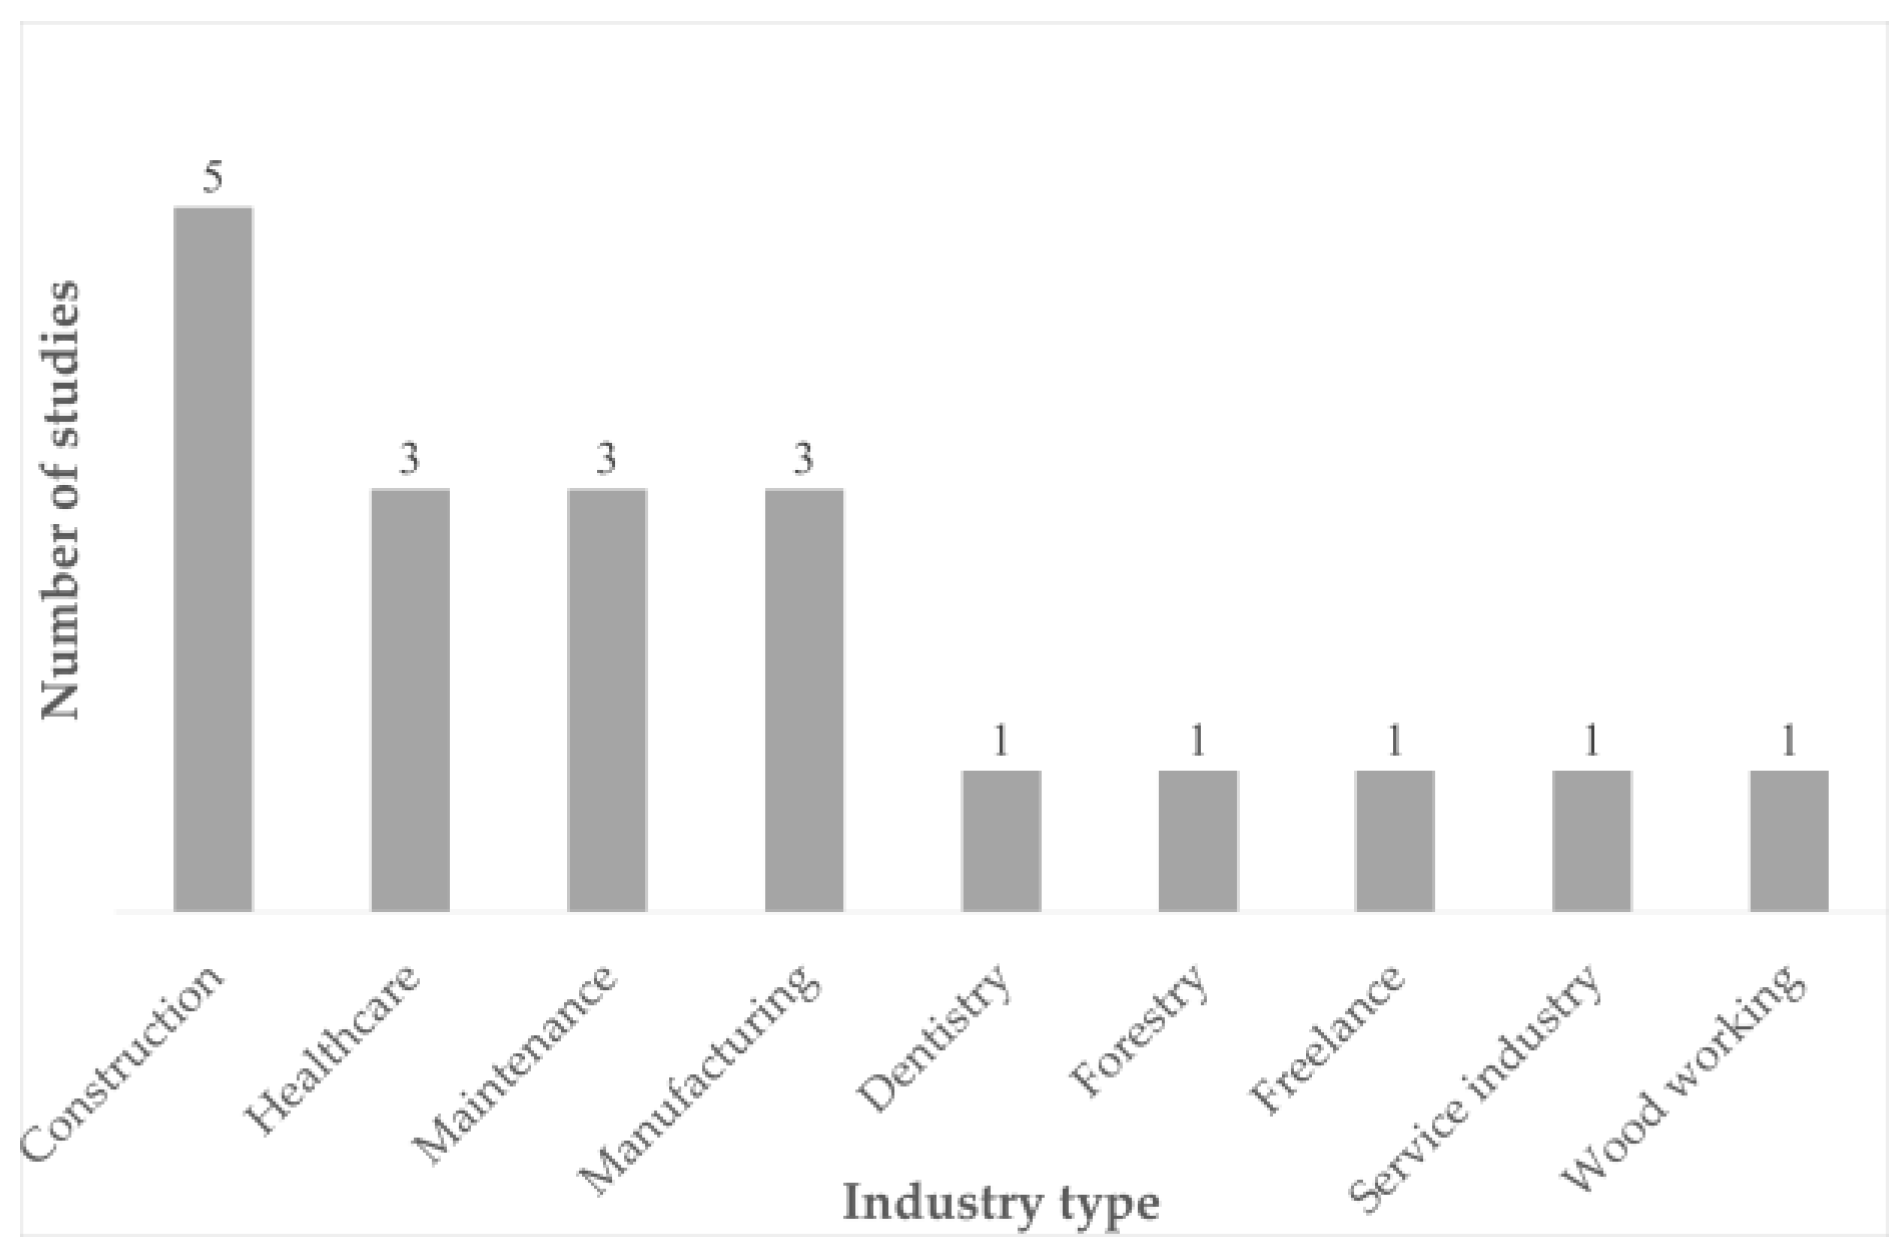
2.2. Research on Safety Climate and Fuel Stations in Indonesia

To review the current status of safety climate research in Indonesia, six research databases were searched with the terms “safety climate” and “Indonesia”. Scopus, IEEE Xplore, Emerald insight, Taylor & Francis Online, and Sage Publishing were explored. Scopus returned 19 results, while the others returned none, or the same results as those listed in Scopus. This proved that currently, research on the safety climate in Indonesia which have been published internationally is limited.
Studies on the safety climate in Indonesia have been performed on nine different industry sectors: five studies were found in the construction sector [29,30,31,32,33], while three studies each were found in the healthcare [34,35,36], maintenance [37,38,39], and manufacturing sectors [40,41]. Other sectors include dentistry [42], forestry [43], freelance [44], the services industry [45], and wood workers [46]. Refer to Figure 1 for a graphical representation of these results. A list of these research articles can be observed in Appendix A (Table A1).
The safety climate topic should be studied to a greater extent because comparative analyses have found a significant difference in safety climates between countries [30,31]. Moreover, Djastuti et al. emphasized the importance of conducting surveys to assess safety behavior on a regular basis [47]. Additionally, since the safety climate predicts safety behavior [38], this also implies that safety climate assessments should be repeated every year or so [48]. Regular assessment of the safety climate can detect which factors of safety climate require more improvement [26], and hence, organizations can design safety programs which can significantly improve safety. Lestari et al. emphasized that occupational health and safety improvement requires effort and collaboration of stakeholders at different levels, not only within the organization, but also external ones, such as the government and education institution [29]. Internally, managers and supervisors should undertake more initiatives to reinforce workers’ commitment to safety and prevent them from performing risk-taking behaviors [43]. Furthermore, Kadir et al. stressed that more efforts were required to ensure adequate safety planning and implementation, especially in complex projects [33]. In addition, Athaya et al. reviewed indicators of safety climate, safety behavior, safety awareness, and safety performance which were suitable for Indonesians [32].
From the literature review above, it is found that this study of the safety climate among fuel station workers is state-of-the-art, showing the importance of this research and its position in advancing safety climate studies in Indonesia.

2.3. Fuel Station Operations in Indonesia

2.3.1. Indonesia’s Regulation on Fuel Station Operations

In Indonesia, oil and gas resources are governed under Law No. 22/2001, which is known as the Oil and Gas Law [49]. This law regulates upstream as well as downstream oil and gas business. The Ministry of Energy and Mineral Resources (ESDM) is responsible for oil and gas administration in general. The distribution of oil and gas consumer products is performed by registered oil and gas commercial companies [50]. Indonesia’s oil and gas downstream business is considered an oligopoly market dominated by Pertamina, a national oil company (NOC). Other operators include Shell, BP-AKR, and Vivo [51]. In running fuel station operations, these companies must comply with the ESDM Minister Regulation No. 32/2021, which legislates fuel station facility requirements and inspections [52]. Therefore, all fuel stations operating in Indonesia must comply with these requirements.

2.3.2. Fuel Station Accidents

Unfortunately, fuel station accidents occasionally happen, especially fires. Most of these accidents involve consumer-owned vehicles [7]. In many cases, a fire starts from electrical short circuits inside a vehicle. Another major cause of fire is filling fuel into unapproved containers or modified vehicle tanks. There are also fires caused by safety procedure violations such as refueling with the engine running, driving at high speed inside a fuel station, and driving with the fuel nozzle still attached to the vehicle [53]. In 2022, these accidents have caused the death of two people and injured sixteen, all of which were fuel station consumers.

2.3.3. Fuel Station Operation Schemes

In terms of ownership and operations, the NOC has several schemes, the dominant two of which are Company Owned Company Operated (COCO) and Dealer Owned Dealer Operated (DODO). In the prior scheme, the fuel station is owned and operated by NOC, while in the latter, the fuel station is owned and operated by a private company as the franchisee [54]. The differences in ownership and operation schemes might affect management and working conditions, thus also affecting safety climate scores. Therefore, each of these schemes were also selected in this study.

3. Research Method

3.1. Questionnaire Development and Data Collection

This study used the Bahasa Indonesia version of NOSACQ-50 to assess the safety climate in Indonesia’s fuel stations. It was selected because it had been tested for validity and reliability [55,56]. All 50 questions were used with slight modifications for context familiarization.
Furthermore, additional background information was also gathered as variables to enrich the analysis and comparison of safety climate scores. These variables included age (in years), gender (male or female), position at work (manager, supervisor, operator, and other workers), education level (primary school, junior high school, high school, undergraduate, and graduate), length of work (in years), type of fuel station (COCO or DODO), fuel station location (city or rural), safety training received (yes or no), and incident experience (yes or no).
The first step of this research was building an online form for data collection. An online form was preferred to protect both researchers and respondents from COVID-19. Google Forms was used for easier access and familiarity, since most respondents were expected to be from rural areas.

3.2. Population and Sampling

As of April 2022, there are 6729 fuel stations operating in Indonesia [57]. The fuel station distribution across the country is in proportion to the population density in each area. Therefore, fuel stations are not distributed evenly among provinces. With three provinces: Jakarta, West Java, and Banten, the West Java Region is the most populated area in Indonesia, thus most fuel stations in operation reside within this area. With a total number of 1644 fuel stations, it accounts for 24.43% of all the fuel stations in Indonesia. For this reason, this area was selected for the current study.
Sample size was calculated using the Cochran formula with a 90% confidence interval and a 5% margin of error, returning a minimum sample size of 233. The questionnaire was then delivered to fuel station workers across the West Java Region. Convenient sampling was used to select 240 fuel stations and 699 fuel station workers answered the questionnaire.

3.3. Data Analysis

To answer the research questions, this study used a cross-sectional approach. Data were analyzed statistically using descriptive analysis (mean, standard deviation, variance), correlation analysis (for validity test), an unidimensional reliability test, and the Mann–Whitney U test for comparative analysis. The statistical calculations were performed on JASP for Windows (Version 0.16.4) [58].

4. Results

After the predefined time for completing the questionnaire had passed, data were checked for errors and outliers. Errors in data filling, such as respondents entering their year of birth instead of age, were corrected accordingly. Meanwhile, incomplete and blank data for general information were left blank and omitted from statistical calculations. Removal of outlier data was performed by calculating the standard deviation of each response. There were six responses that had zero standard deviation. This implies that all questions were answered with the same response, which is an indication of low engagement from respondents. Thus, these responses were removed. Standard deviation values lower than 0.25 were also removed because they showed very low variance in the response. Hence, another 15 responses were removed, and thus 678 responses were considered valid and remained for further analysis. The general information data of respondents are summarized and reported in Table 3.

4.1. Validity and Reliability Test Results

The validity of the instrument was tested using the Pearson correlation test, in which almost all of the statement items had a p-value < 0.001, showing the significance and validity of the instrument items. However, item number 20, which belongs to Dim3, and item number 35, which belongs to Dim7, both displayed a p-value larger than 0.05. Therefore, these two questions with low validity were excluded from analysis.
The reliability test using Cronbach’s alpha requires a minimum α value of 0.6 for an acceptable level of reliability. An α value of 0.6–0.7 is an indication of good reliability and values more than 0.8 indicate excellent reliability. Values more than 0.95, however, might not be good, since there might be redundancy between variables, which means that two or more variables have similar responses [59]. Five of the seven dimensions tested resulted in an α value more than 0.7, implying that indicators for expressing these dimensions were reliable. Dim3, which contained the invalid item, had an α value of 0.535, which meant that the reliability for this dimension was unacceptable. On the other hand, Dim5, which also contained an invalid item, had an α value of 0.627, which is within the range for good reliability.

4.2. Overall Safety Climate Result

The overall results of safety climate perception using the NOSACQ-50 questionnaire can be seen in Table 4. The average mean score is 3.07. This number is slightly above the analytical threshold for a fairly good safety climate. Of course, there is variation among each of the dimensions. For example, Dim4 (workers’ safety commitment) had the largest safety climate score, 3.31. The second largest score is 3.25, which belongs to Dim1 (management safety commitment). Furthermore, Dim6 and Dim7 had the next two highest scores, at 3.11 and 3.05, respectively. Dim2 and Dim3, which are measures of management safety empowerment and justice, had similar scores, 2.98 and 2.97 respectively, showing a need for improvement. The measure on workers’ safety priority and risk non-acceptance (Dim5) had the lowest score. The standard deviation ranged between 0.38 and 0.49, while the variance ranged between 0.17 and 0.24.

4.3. Safety Climate Scores Classified by Category

Values of safety climate scores based on the background characteristics of respondents are listed in Table 5 below. These results were obtained by calculating the general mean and means of each dimension while filtering variables according to the category. One thing to note is that there was only one response for the primary school and graduate categories.

4.4. Comparison of Safety Climate Scores between Different Groups

Safety climate scores were also compared between categories for further analysis. Comparison analysis was carried out using an independent sample t-test in JASP (Mann–Whitney test selected). Each dimension’s average was selected as the dependent variable and the background categories were set as the grouping variable. Due to the limitations of this method, in which statistical comparison can only be performed for two variables at once, background variables with more than two categories were compared as pairs. A p-value less than 0.05 is considered statistically significant, i.e., the comparison hypothesis is statistically confirmed. For example, when comparing results between age groups, three comparisons were made. The first comparison hypothesis is that respondents aged below 25 years (first age group) have a lower safety climate score than those aged between 25 and 29 (second age group). The results show a p-value less than 0.05 for the mean, Dim1, Dim2, and Dim3, while the other dimensions have a p-value greater than 0.05. This means that the hypothesis is confirmed for the mean, Dim1, Dim2, and Dim3, but rejected for the other dimensions. The results for other variables and groups are presented in Table 6. The table can be interpreted in a similar way to the example above. Results having p-values less than 0.05 are flagged with an asterisk.

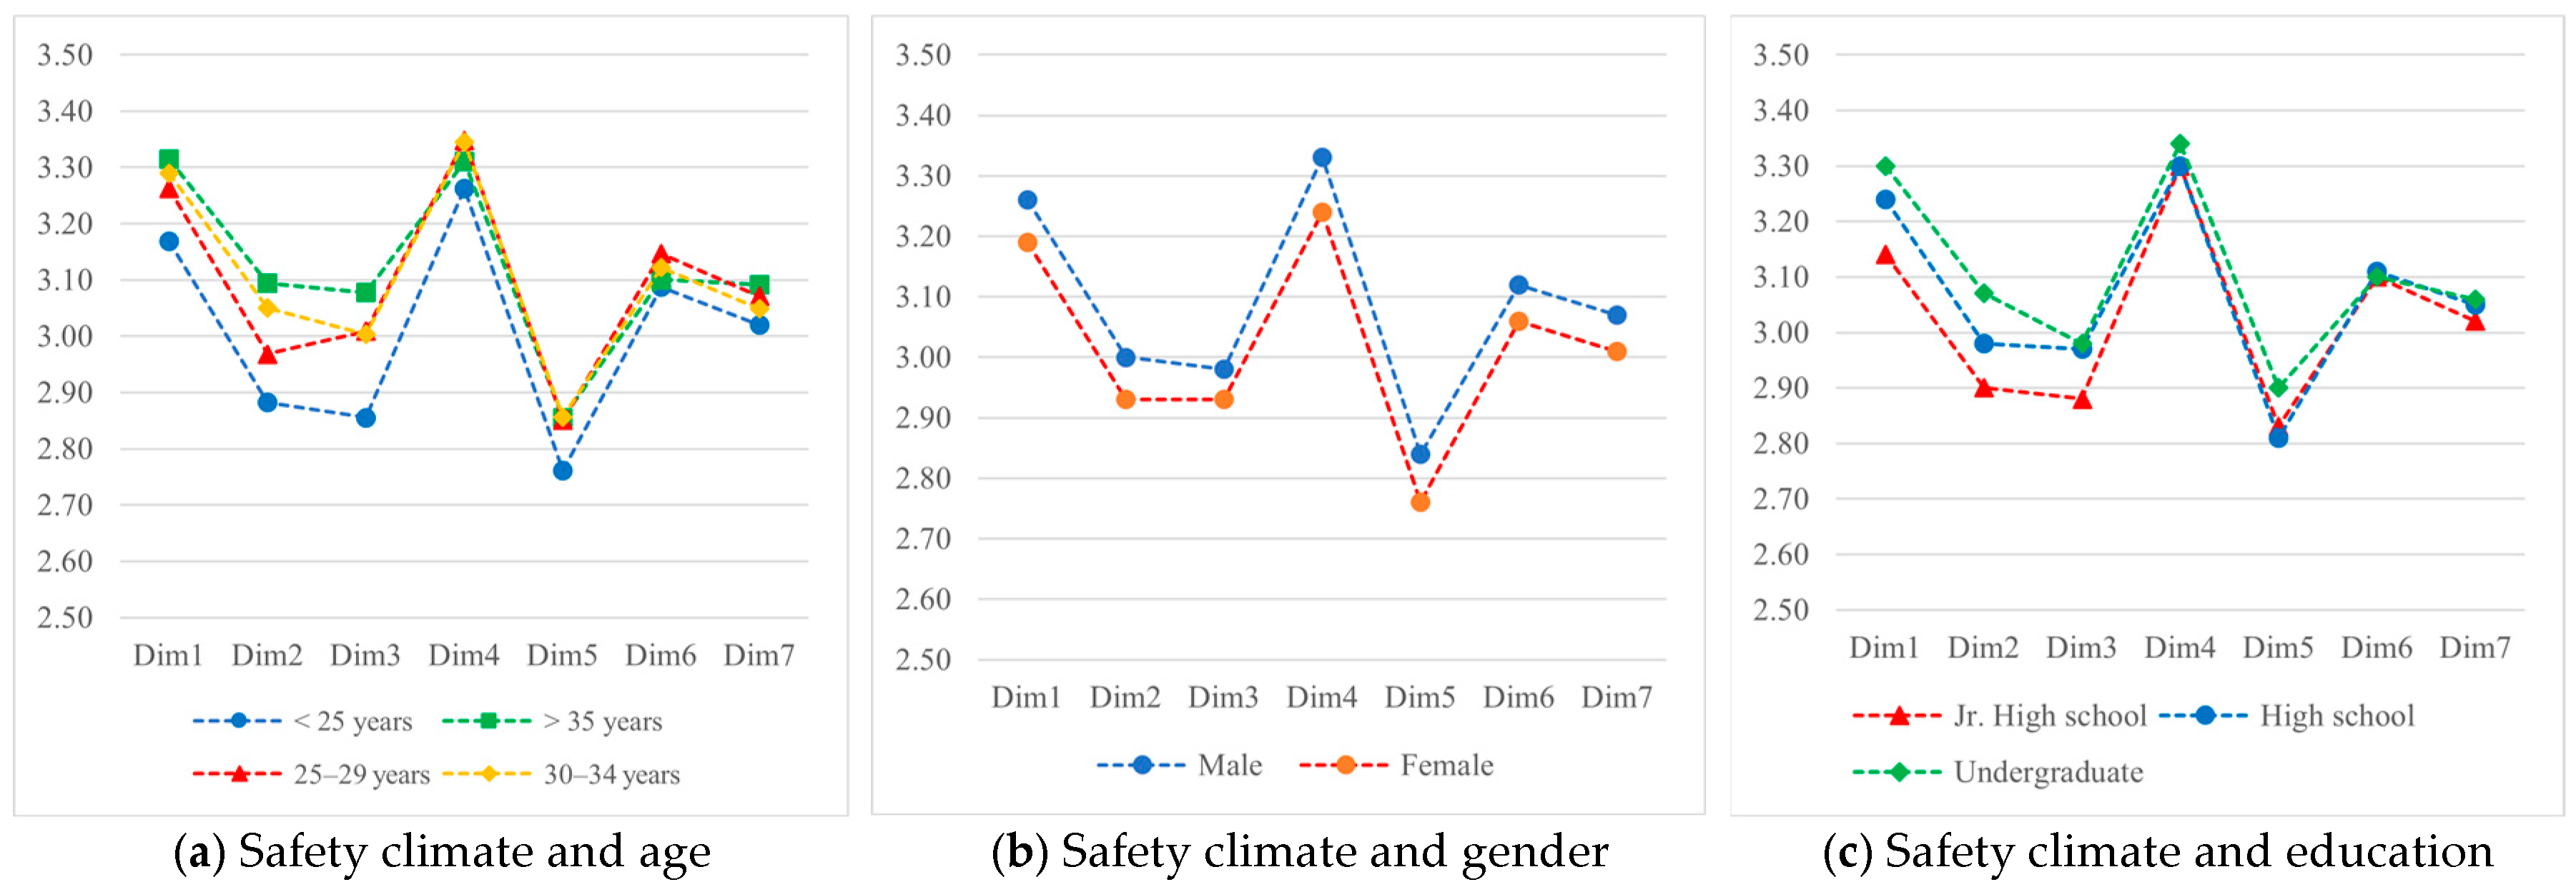
4.4.1. Results Based on Age, Gender, and Education

There are statistically significant differences between the younger group (less than 25 years old) and the other older groups, particularly in the dimensions related to management. The older group also has lower scores for safety priority and risk non-acceptance, which shows that they tend to overlook risks.
When comparing genders, male workers have greater safety climate perception than female workers. However, the differences are only significant (p-value < 0.05) for Dim1, Dim2, Dim4, and Dim5. Furthermore, the results also show that safety climate displays no significant differences (p-value > 0.05) between different education levels, except for Dim2, where workers with undergraduate education have a significantly greater (p-value < 0.05) safety climate perception compared to high school graduates. A graphical representation of safety climate ratings based on age, gender, and education level is depicted in Figure 2.

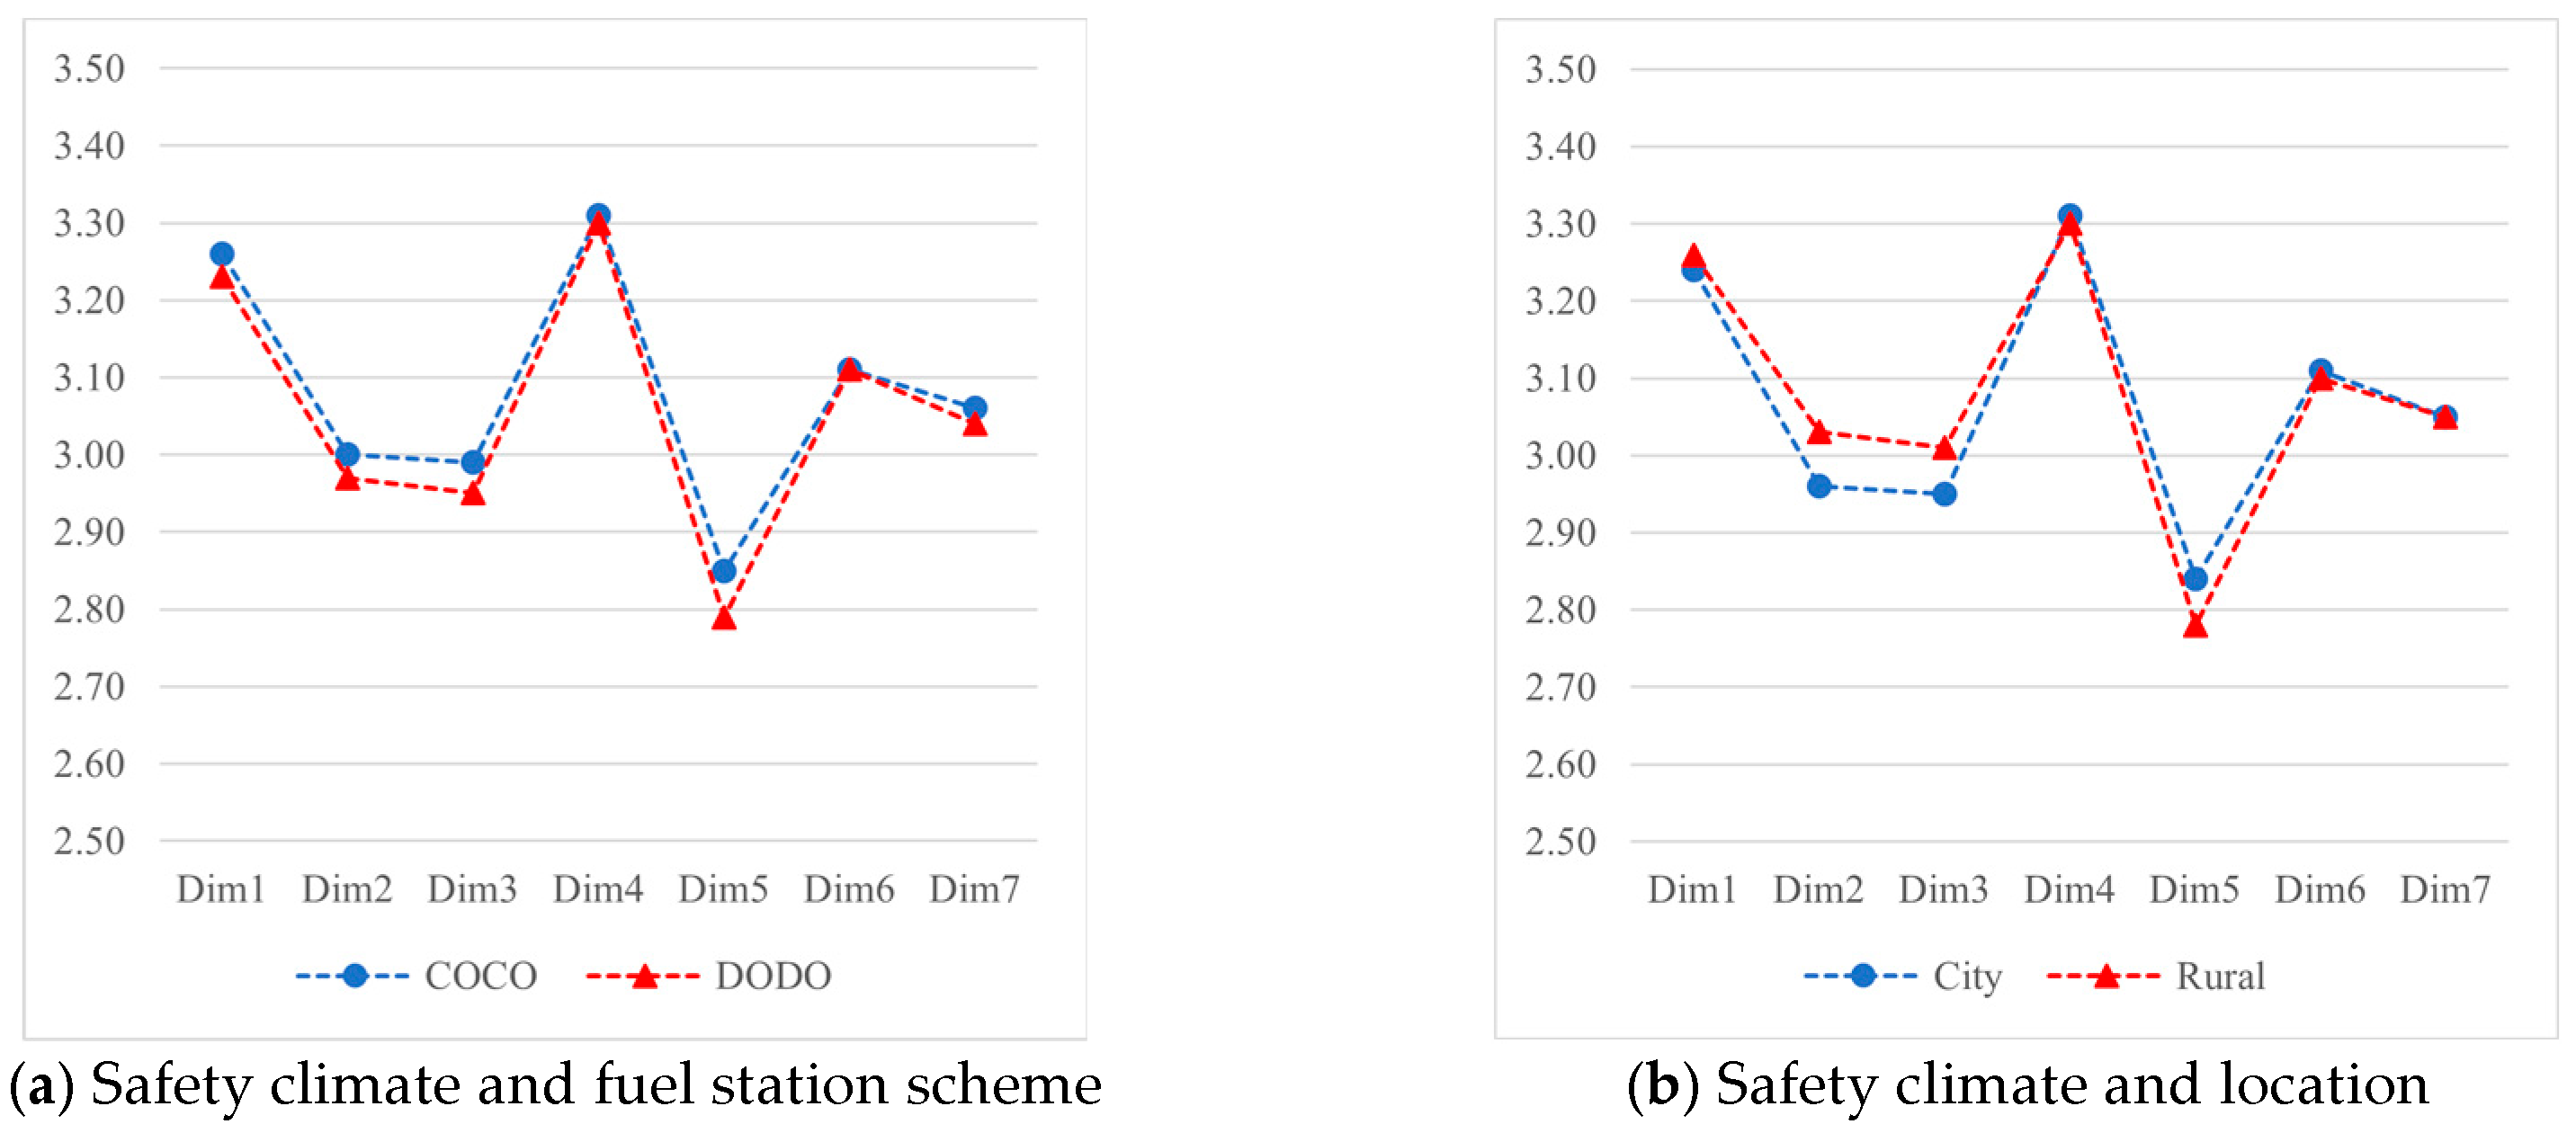
4.4.2. Results Based on Fuel Station Type and Location

The differences in fuel station management schemes, i.e., COCO versus DODO, do not have any significant impact on safety climate levels in any of the dimensions. The location of fuel stations, i.e., rural and city, also has no significant effect on overall safety climate level. When examining the safety climate in detail, rural fuel stations have a greater safety climate perception for dimension 2 (management safety empowerment), but a lower safety climate perception for dimension 5 (workers’ safety priority and risk non-acceptance). The graphs in Figure 3 illustrate the difference in safety climate based on fuel station type and location.

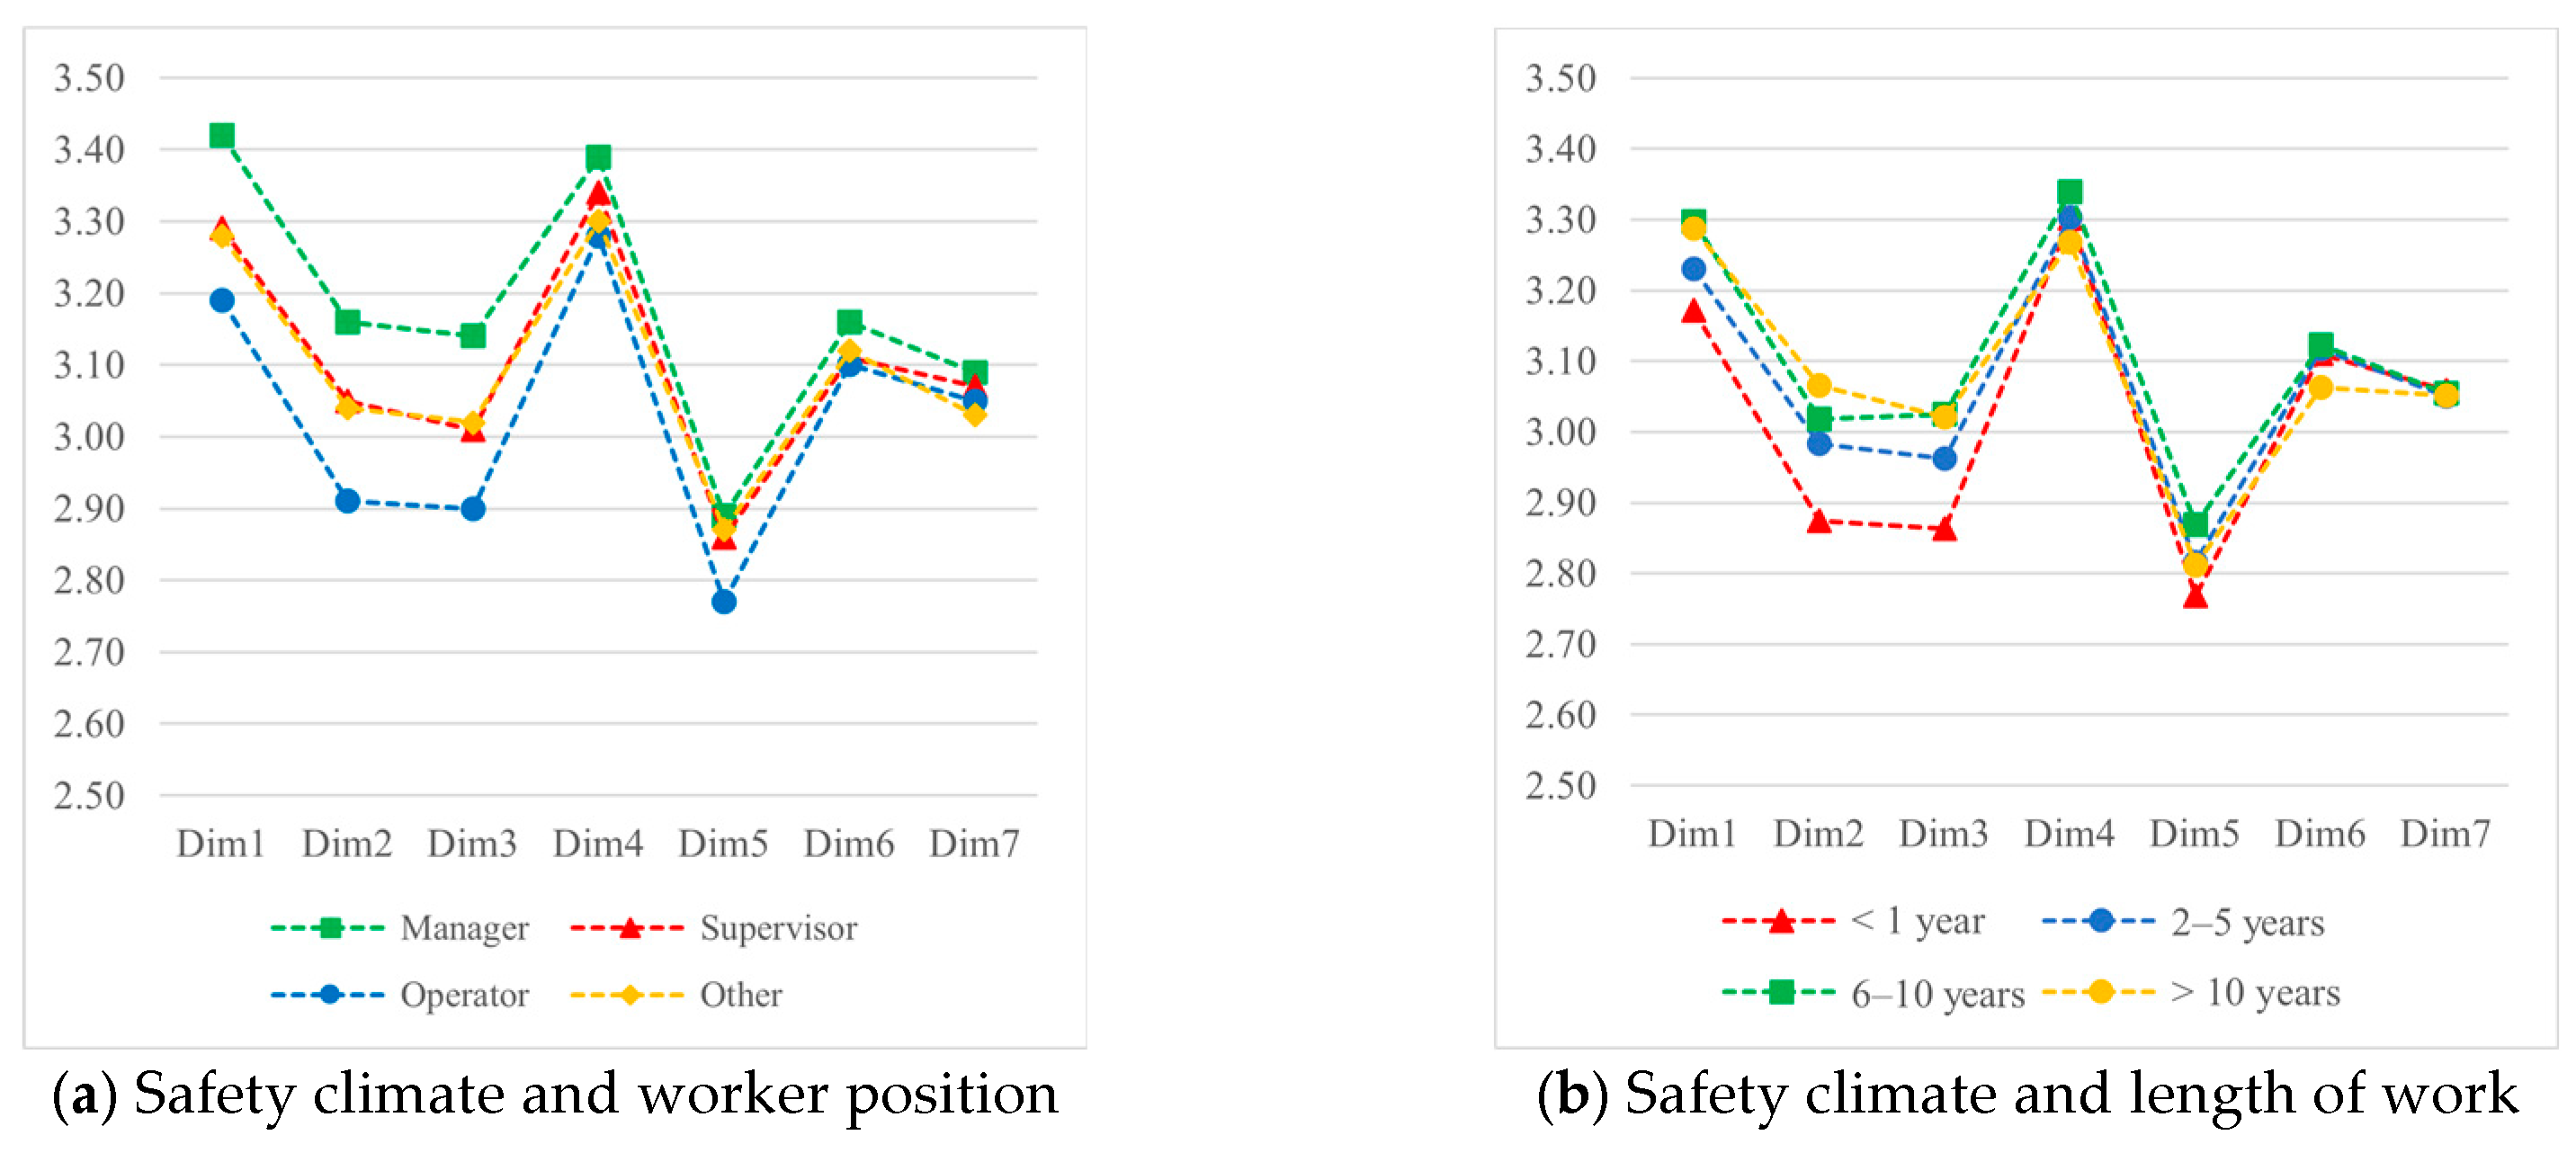
4.4.3. Results Based on Worker Position and Length of Work

Worker position and length of work both show significant effects on safety climate, especially for the first three dimensions, regarding management. Higher ranked employees obtained higher safety climate ratings than the others. Length of work also shows similar results, where workers with longer working experience in the fuel station tend to have a higher safety climate score. Refer to Figure 4 for a graphical representation of these results.

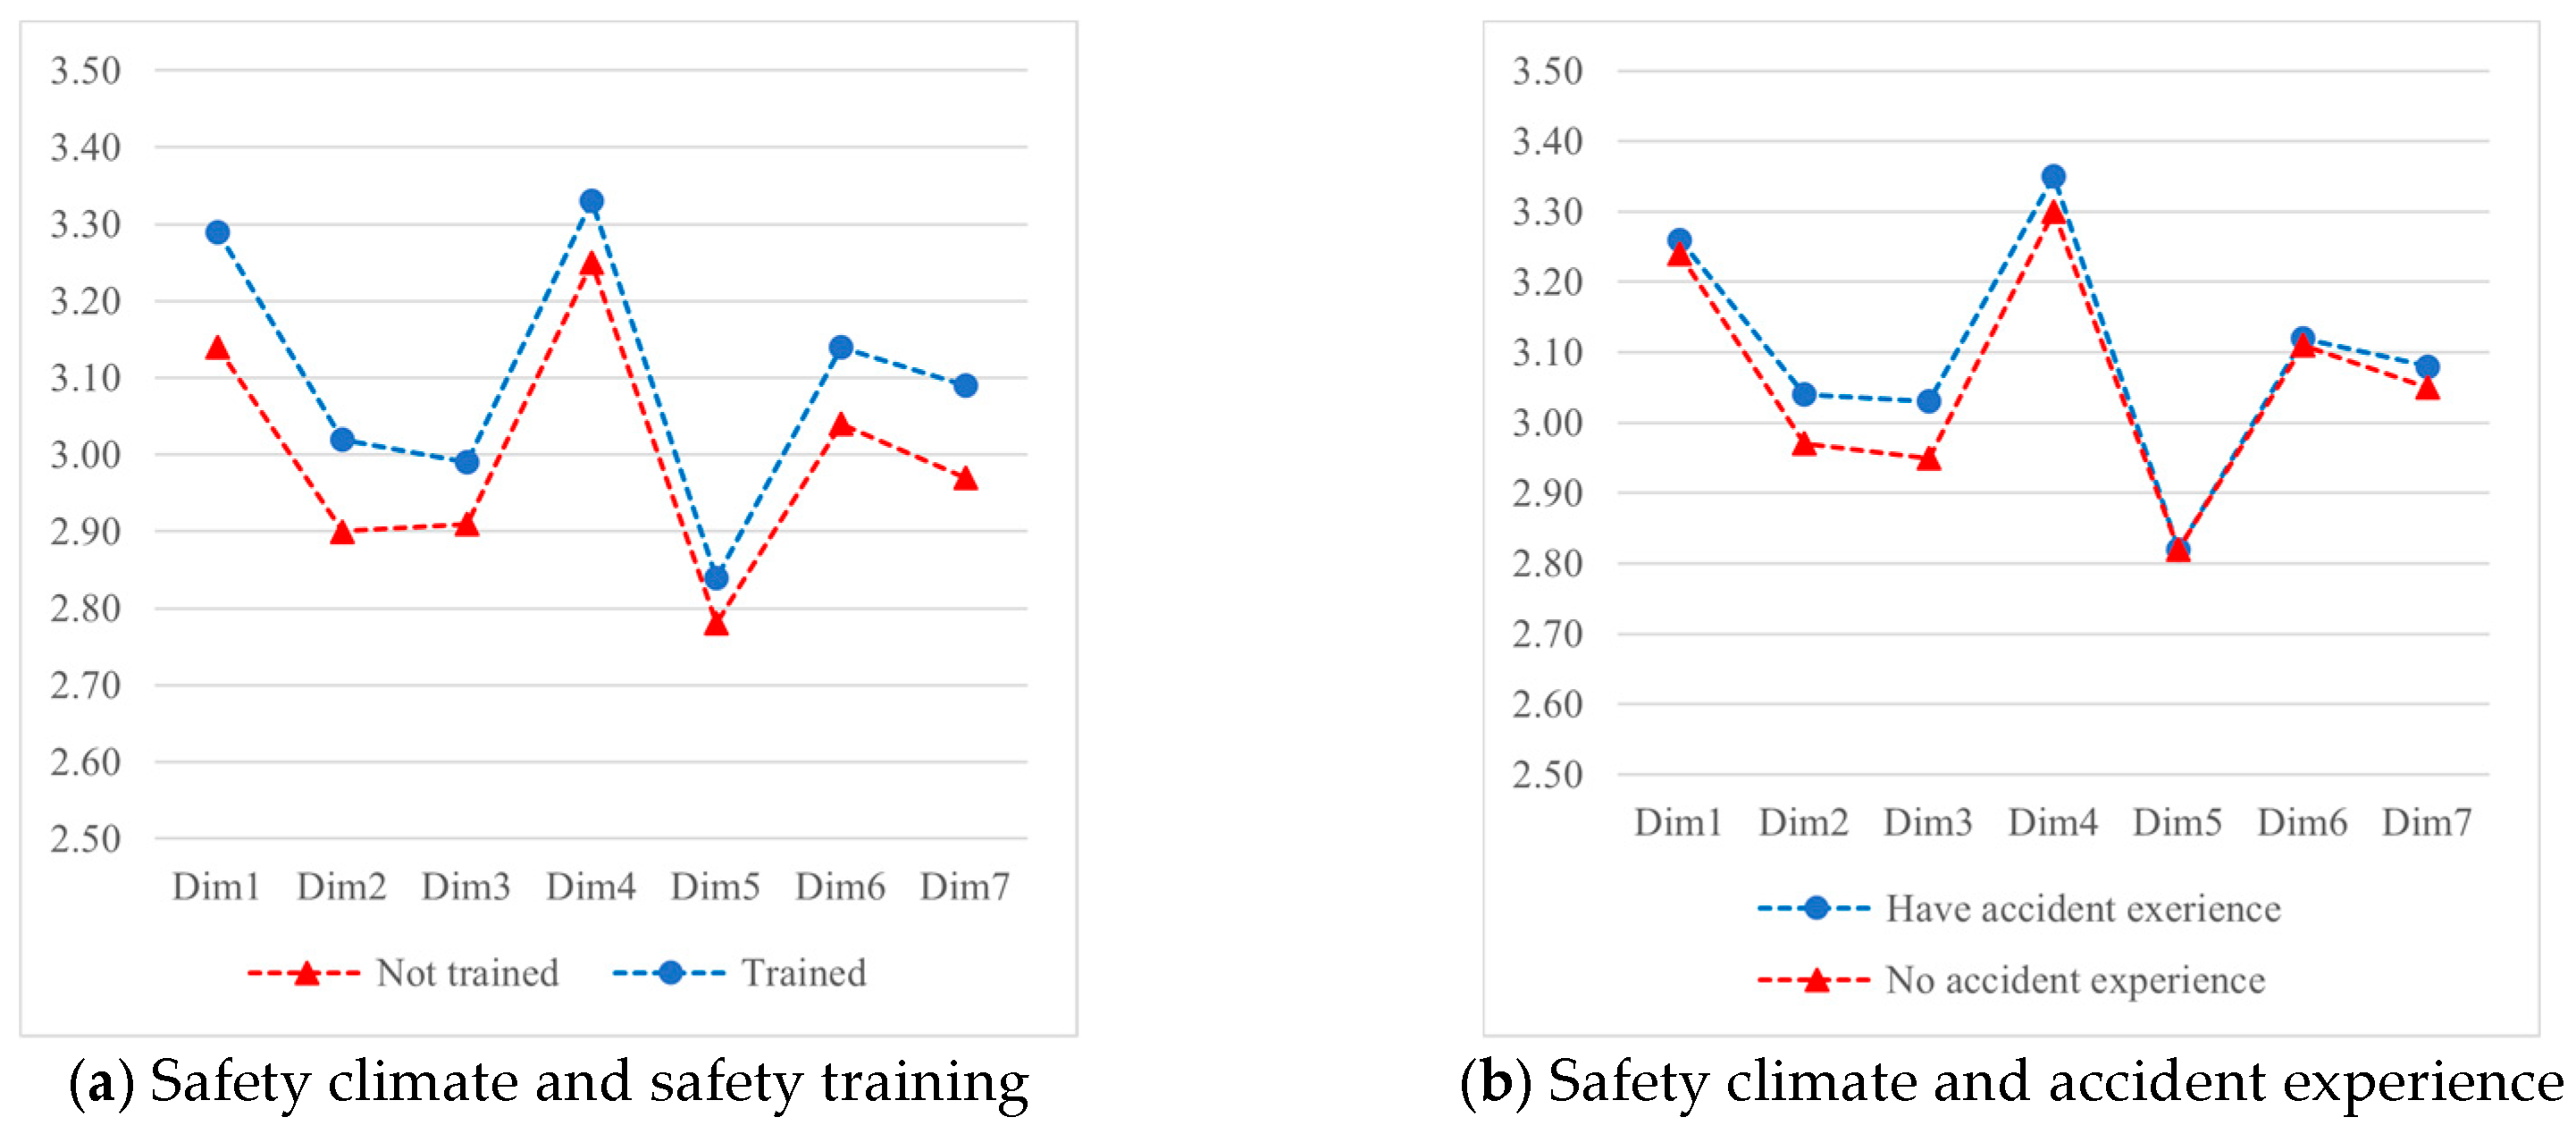
4.4.4. Results Based on Training and Accident Experience

The results show that employee training has a significant impact on safety climate. Workers with training experience exhibit a significantly higher level of safety perception across all seven dimensions. On the other hand, accident experience turns out to have no significant influence on safety climate. The significant difference between trained and non-trained worker is portrayed in Figure 5a, while Figure 5b represents the safety climate among workers with accident experience and those without.

5. Discussion

5.1. Overall Safety Climate Level and per Dimension Analysis

The findings from this study show that the safety climate level of fuel stations in the West Java region of Indonesia is fairly good. Workers strongly believe that management has the commitment and ability necessary to drive the organization towards a higher safety level [33]. However, managers need to improve on empowering people to think and act safely. Workers felt that they were not involved enough in conversations on safety issues. To improve in this area, management could provide more effective reciprocal safety communication [60], i.e., involving employees in active discussions and asking them to contribute on safety issues. Statement number 15: “Management never asks employees for their opinions before making decisions regarding safety.” had the lowest score for this dimension, and thus clearly requires improvement. Management should try to explain more clearly why some safety policies are mandatory and elaborate on the reasons behind such policies with simple and understandable means of communication [29]. As the demographic data shows, more than 90% of fuel station workers are high school graduates, and so it is important to use words that are simple and easy to comprehend. Moreover, supervisors need to make sure that all employees understand every piece of safety information [61]. Another aspect that fuel station managers need to improve is Dim2: management fairness regarding safety. Some workers expressed their concern regarding employees receiving negative consequences for reporting near-misses or any unsafe conditions [43]. In this context, negative consequences do not always mean formal sanctions or even penalties. As Narayan and Nair stated [62], “Using subjective language and ambiguous words could be counterproductive, which can live the workers in utter limbo and frustration.” The use of a negative response toward workers might have discouraging impacts and lower self-esteem. This emphasizes the importance of effective safety communication to workers.
On the workers’ side, the survey shows a high level of worker commitment, which is consistent with other NOSACQ-50 results [28,63]. The high scores may have been a product of bias, since the questionnaire is a form of self-report, and they may have answered based on how they want others to perceive them. On the other hand, these scores may be a genuine response expressing their desire for safety, but they are unable to accomplish the appropriate level of safety because of external conditions. On the contrary, Dim5, which assesses workers’ safety priority and risk non-acceptance, has the lowest score. A lower score for this dimension is an indication of higher risk-tolerance among respondents [33]. Aboramadan et al. [64] mentioned one of the elements of risk-tolerance: “employees’ willingness to risk themselves for the benefit of the organization.” In the case of fuel station workers, there is a need to establish a firm mindset on risk-taking that is aligned with organization goals. In this way, risk-taking behaviors are expected to be reduced, resulting in a safer working environment. Nevertheless, the large gap between workers’ safety commitment and workers’ safety priority and risk non-acceptance scores needs to be studied further to establish the relationship between these two dimensions.
Moving forward to dimension 6 on safety communication, learning, and trust in co-worker safety competence, there is a certain level of trust among workers, which boosts their confidence in safety. A fair and level learning environment should be encouraged, such as sharing incident experience between staff [55] and discussing prevention measures. However, fuel station management needs to intensify talks and discussions on safety issues. Workers need to be given more opportunities to talk freely about safety, without the fear of being responded to negatively [38]. Discussions shall end with a correction or improvement program and followed up on with proper execution. Furthermore, a review on dimension 7—workers’ trust in the efficacy of safety systems—reveals interesting findings. Respondents tend to believe in the importance of safety goals and safety training; however, some of them felt that early planning relating to safety and safety inspections are pointless (questions 47, 49, and 50). This translates to low follow-up of inspection recommendations [61]. Employees saw frequent inspections but were not informed of the correction measures taken and did not see any improvements made after inspections. One way to deal with this issue is for management to engage with all employees [44], announce the inspection results to employees, and distribute information on corrective actions taken to respond to inspection findings. This way, workers can develop the sense that inspections and audits do have positive implications on safety and are not routine, meaningless activities.
In the following subsections, the differences between variables based on respondents’ background information will be analyzed and discussed.

5.2. Age, Gender, and Education Level

The significant differences in safety perceptions between different age groups conform with previous studies, where younger workers were strongly associated with lower safety climate ratings [65] and had higher odds of experiencing safety climate problems [66]. Younger employees are more aware of their rights and management responsibilities. They also have less experience than older peers and receive more information about safety, thus providing them with higher expectations of a safer workplace [67]. Therefore, they expect to receive more attention regarding safety from management. On the other hand, older workers are usually more anxious about potentially experiencing workplace accidents [68]. This explains the higher score for safety priority and risk non-acceptance.
Gender, meanwhile, shows different effects on safety climate between studies. In most Asian countries, males have higher safety climate perceptions [69]. A study in Saudi Arabia showed that women have a better safety climate perception then men [70]. Some studies also reveal that gender has no role in differentiating safety climate perception [71,72,73]. Therefore, the implementation of safety management must be performed equally among all employees, regardless of their gender and age.
In terms of education, this study also conforms with other studies, which shows that workers with higher education levels tend to perceive safety climate better. People with a higher education level think more systematically and have better reasoning in unforeseen situations. However, a recent safety climate assessment in Indonesia’s construction industry showed the opposite [33].

5.3. Fuel Station Scheme and Location

Company-owned fuel stations are not necessarily better than privately owned ones, especially in terms of safety climate perception. Due to their franchise business nature, both types of fuel station receive and apply the same safety standards. Therefore, the difference in safety perceptions between these two groups was not significant.
The finding of better safety climate scores in rural areas was unforeseen. This might be affected by the research area of this study. West Java is home to the Sundanese people, who are known to have a friendly and affectionate personality [74]. The Sundanese ethnicity has also preserved the tradition of long-term relationships and high levels of collectivism [75]. Management/owners in rural areas in West Java are better at empowering their staff regarding safety, explaining the better perception of management among workers. On the other hand, a higher risk-taking attitude among rural fuel station workers might be an effect of the lower amount of information received compared to city workers.

5.4. Work Position and Length of Work

Job position’s effect on safety climate varies between studies. This study aligns with the international NOSACQ-50 results database, which shows that managers’ and supervisors’ safety climate scores are higher than those of workers [28]. On the contrary, there were studies that had the opposite results [33]. Employees with less working experience in the field have lower safety climate scores because of their lack of experience and thus demand a higher level of management commitment towards safety. More experienced workers have lower expectations since they have become accustomed to the safety culture in the organization. The mismatch in safety perceptions between leaders and workers should be investigated further and measures need to be taken to overcome this issue.

5.5. Training and Accident Experience

Safety training has been considered to be an important factor in safety implementation. It has been included as a factor in assessing safety climate. Some studies even put safety training as one of the dimensions of the safety climate [29,31,35,76]. Every research work noted the importance of safety training in establishing a better safety climate. This research conforms with those previous studies. However, an important finding in this study is that 28% of respondents admitted to not having received appropriate safety training. This is considered a major issue which needs immediate action.
In this research, however, accident experience shows no significant impact on safety perception. This result differs from research by Oah et al. [77], which indicated that accident experience has a positive influence on the perceived risk of accidents.

6. Research Limitations

This study provided advances in safety climate assessment; however, some limitations still exist. First, due to constraints on time and budget, the sampling method used was convenient sampling, i.e., selecting fuel stations accessible to the researchers. Therefore, the distribution of samples was potentially uneven and some areas were not well represented. Further research needs to take this into account. Next, the NOSACQ-50 questionnaire is a type of self-reporting tool, and so it also has limitations, such as the participants answering the questions perfunctorily. To overcome this, future research could attempt to combine the NOSACQ-50 questionnaire with observations and interviews to minimize biases. Another limitation regarding the use of the Indonesian version of the questionnaire is that some questions did not meet the minimum criteria for validity. It is possible that some questions are not easy to understand. Hence, there is a need to review the Indonesian version of NOSACQ-50.

7. Conclusions

Studies on the safety climate have been performed in a variety of fields and the NOSACQ-50 questionnaire has been used by many researchers to assess safety climate. However, only a handful of research works can be found assessing the safety climate in fuel stations. This study fills that gap and provides advances in the research area by assessing the safety climate in fuel stations using the NOSACQ-50 questionnaire in Indonesia. The novelty of this research lies on the fuel station sector and the West Java region of Indonesia as the study location. The results show that fuel stations in West Java have, on average, a “fairly good” safety climate rating of 3.07. Dimension 5—workers’ safety priority and risk non-acceptance—has the lowest mean score, implying that employees’ understanding of safety priorities and risk assessment needs to be greatly improved.
Comparative analyses revealed that younger workers have a lower safety climate perception than older workers. Gender-wise, male employees demonstrate higher safety climate perception compared to women. Similar to other studies, higher-ranked workers have better safety climate perception than those with a lower position. When comparing new employees and those with more years of service, the latter show significantly higher safety climate perception. Meanwhile, employee education background and fuel station type and location do not have a significant effect on differentiating safety climate.
The most significant difference in safety climate perception is visible between employees with safety training and those without. This shows the importance of safety training in improving the safety climate across all dimensions. However, this study also found that more than 28% of fuel station employees admitted to not receiving proper safety training in the last year. Therefore, immediate corrective action is urgently needed to provide all workers with appropriate safety training.
The findings in this research can be applied by organizations, specifically fuel stations and other similar businesses, to create a suitable program for implementing better safety in the workplace. By understanding the key aspects described herewith, programs can be aimed toward the most important issues, such as providing adequate safety training, improving management commitment and communication, and upgrading workers’ safety perception and risk awareness.

Author Contributions

Conceptualization, A.W., F.L. and R.M.; Formal analysis, A.W.; Methodology, A.W., F.L. and R.M.; Supervision, F.L. and R.M.; Validation, A.W., F.L. and R.M.; Writing—original draft, A.W.; Writing—review and editing, A.W., F.L. and R.M. All authors have read and agreed to the published version of the manuscript.

Funding

This research was funded by the Ministry of Education, Culture, Research Additionally, Technology (KEMDIKBUDRISTEK) grant number [091/E5/PG.02.00.PT/2022 and 172./PKS/WRIII-DRP/UI/2022] and grant number [NKB-949/UN2.RST/HKP.05.00/2022], Research and Development (Risbang), Universitas Indonesia.

Institutional Review Board Statement

The study was conducted in accordance with the Declaration of Helsinki and approved by the Research and Community Engagement Ethical Committee, Faculty of Public Health Universitas Indonesia (No. Ket-604/UN2.F10.D11/PPM.00.02/2022, 15 November 2022).

Informed Consent Statement

Informed consent was obtained from all subjects involved in the study.

Data Availability Statement

The dataset utilized and/or analyzed during the present study is available on reasonable request from the corresponding author.

Acknowledgments

The authors would like to thank the Occupational Safety and Health Department, Faculty of Public Health, Universitas Indonesia, Indonesian National Oil Company, and all the respondents participating in this study.

Conflicts of Interest

The authors declare no conflict of interest.

Appendix A

This appendix lists research articles on safety climate in Indonesia which have been published in international journals.
Table A1. List of research articles on safety climate in Indonesia.
NoTitleYearResearch SubjectDimension
1Patient Safety Culture in Dentistry Analysis Using the Safety Attitude Questionnaire in DKI Jakarta, Indonesia: A Cross-Cultural Adaptation and Validation Study [42]2022General dentists in health services in Jakarta
  • Teamwork climate
  • Safety climate
  • Job satisfaction
  • Stress recognition
  • Perception of management
  • Working condition
2Safety climate and risk perception of forestry workers: A case study of motor-manual tree felling in Indonesia motor-manual tree felling in Indonesia [43]2022Forestry workers at a large-scale teak plantation on Java Island
  • Management safety priority, commitment, and competence
  • Management safety empowerment
  • Management safety justice
  • Workers’ safety commitment
  • Workers’ safety priority and risk non-acceptance
  • Safety communication, learning and trust in co-worker safety competence
  • Workers’ trust in the efficacy of safety systems
3Identification Factors of Safety Climate, Awareness, and Behaviors to Improve Safety Performance in Telecommunication Tower Construction at PT X [32]2022Construction workers at a telecommunication tower company
  • Six dimensions of safety climate
4Safety Climate in the Indonesian Construction Industry: Strengths, Weaknesses, and Influential Demographic Characteristics [33]2022Workers in state-owned construction companies
  • Management Commitment
  • Priority of safety
  • Communication
  • OHS Rules
  • Supportive Environment
  • Involvement
  • Work environment
  • Personal priorities and need for safety
  • Personal appreciation of risk
5An empirical analysis of safety behavior A study in MRO business in Indonesia [39]2021Workers at a maintenance, repair and overhaul company
  • Safety behavior
  • Safety leadership
  • Safety communication
  • Safety commitment
  • Safety climate
6The Influence of Safety Climate, Motivation, and Knowledge on Worker Compliance and Participation: An Empirical Study of Indonesian SMEs [40]2021Workers in metal manufacturing small and medium enterprises
  • Safety climate
  • Safety motivation
  • Safety knowledge
  • Safety compliance
  • Safety participation
7Effects of Safety Climate and Employee Engagement towards Organizational Citizenship Behavior of Sewage Workers [44]2021Government-hired freelance workers
  • Safety climate
  • Employee engagement
  • Organizational Citizenship Behavior (OCB)
8Inclusive leadership and workers’ safety behavior during COVID-19 pandemic [45]2021Workers in the banking sector and education sector
  • Inclusive leadership
  • Safety climate
  • Management commitment to safety
  • Safety systems (rules and procedure)
  • Safety compliance
  • Safety participation
  • Risky behavior
9A Safety Climate Framework for Improving Health and Safety in the Indonesian Construction Industry [29]2020Construction workers, supervisors, and managers of tier-one contractors
  • Management commitment
  • Communication
  • Rules and procedures
  • Supportive Environment
  • Personal accountability
  • Training
10Comparative Analysis of Safety Climate in the Chinese, Australian, and Indonesian Construction Industries [31]2020Construction workers in Indonesia, Australia, and China
  • Management commitment
  • Communication
  • Rules and procedures
  • Supportive Environment
  • Personal accountability
  • Training
11Safety Behavior of Manufacturing Companies in Indonesia [47]2020Workers of manufacturing company in Semarang
  • Safety climate
  • Job satisfaction
  • Safety motivation
  • Safety behavior
12Improving Hand Hygiene Compliance Through WHO’s Multimodal Hand Hygiene Improvement Strategy [34]2020Healthcare workers at hospitals in Surabaya
  • System change initiative
  • Training and education
  • Evaluation and feedback
  • Reminders in the workplace
  • Institutional safety climate
13Safety Leadership and Safety Behavior in MRO Business: Moderating Role of Safety Climate in Garuda Maintenance Facility Indonesia [38]2020Workers at a maintenance, repair and overhaul company
  • Safety leadership
  • Safety communication
  • Safety climate
  • Safety behavior
14Comparing the safety climate of the Indonesian and Australian construction industries: Cultural and institutional relativity in safety research [30]2019Construction workers in Indonesia and Australia
  • Management commitment
  • Communication
  • Rules and procedures
  • Supportive Environment
  • Personal accountability
  • Training
15Relationship Model for Occupational Safety and Health Climate to Prevent Needlestick Injuries for Nurses [35] 2019Nurses at RSUP Dr. Sardjito, Yogyakarta
  • Attitude
  • Norm
  • Perceived Behavioral Control
  • Intention
  • Safety performance
16Validation of the Indonesian version of the Safety Attitudes Questionnaire: A Rasch analysis [36]2019Nurses in two hospitals
  • Teamwork climate
  • Safety climate
  • Perception of management
  • Job satisfaction
  • Working condition
  • Stress recognition
17Improving occupational health and safety and in the home-based footwear industry through implementation of ILO-PATRIS, NOSACQ-50 and participatory ergonomics: A case study [41]2019Workers in the home footwear industry in Cibaduyut
  • Management safety priority, commitment and competence
  • Management safety empowerment
  • Management safety justice
  • Workers’ safety commitment
  • Workers’ safety priority and risk non-acceptance
  • Safety communication, learning and trust in co-worker safety competence
  • Workers’ trust in the efficacy of safety systems
18Validity and Reliability Analysis of Safety Climate Factor at Small and Medium-sized Enterprises ( SMEs ) Wood Based Furniture [46]2018Wood workers in small and medium enterprise furniture industries
  • Management commitment and actions for safety
  • Worker’s attitudes toward safety
  • Worker’s knowledge and compliance to safety
  • Workers’ participation and commitment to safety
  • Safeness of work environment
  • Emergency preparedness in the organization
  • Priority for safety over production
  • Risk justification
19Developing a Conceptual Model of Organizational Safety Risk: Case Studies of Aircraft Maintenance Organizations in Indonesia [37]2017Workers at a maintenance, repair and overhaul company
  • Organizational design
  • Safety climate
  • Safety motivation
  • Safety outcome

References

  1. Imron, M.; Adriawan, A.M.; Hartanto, R.; Aryani, D.; Alsa, S.; Toruan, A.A. Statistics Oil and Gas; Directorate General of Oil and Gas Ministry of Energy and Mineral Resources: Jakarta, Indonesia, 2021; p. 59. [Google Scholar]
  2. Xie, Y.; Harjono, M. The Retail Fuels Market in Indonesia; International Council on Clean Transportation: Washington, DC, USA, 2020. [Google Scholar]
  3. Page, C. Creeslough: Ten Dead after Donegal Petrol Station Explosion. Available online: https://www.bbc.com/news/world-europe-63183510 (accessed on 20 November 2022).
  4. Bakidamteh, S.A.; Teye-kwadjo, E. Understanding the Role of Proactive Personality in Occupational Health and Safety at Oil and Gas Service Stations in Accra. SAGE Open 2022, 12. [Google Scholar] [CrossRef]
  5. Zhou, S.; Huang, A.; Wu, J.; Wang, Y.; Wang, L.; Zhai, J.; Xing, Z.; Jiang, J.; Huang, C. Establishment and Assessment of Urban Meteorological Disaster Emergency Response Capability Based on Modeling Methods. Int. J. Disaster Risk Reduct. 2022, 79, 103180. [Google Scholar] [CrossRef]
  6. Ahrens, M. Service or Gas Station Fires; National Fire Protection Association: Quincy, MA, USA, 2020; p. 2. [Google Scholar]
  7. Wachid, A.N.; Sampurna, B.; Rahman, A.F.; Octovia, A.; Sulistomo, T.R.; Kusumo, C.A.; Wibowo, M.A.; Murdaningsih, A.; Indriyaningsih, E. Keselamatan SPBU: Pedoman Teknis Dan Pembelajaran Dari Kejadian; Kementerian ESDM Direktorat Jenderal Minyak dan Gas Bumi: Jakarta, Indonesia, 2018; p. 9. [Google Scholar]
  8. Yin, X.-Y.; Liu, T.; Liu, Y.-C.; Tang, Y.; Huang, A.-C.; Dong, X.-L.; Liu, Y.-J. Feasibility Study of Fine Water Mist Applied to Cold Storage Fire Protection. Processes 2022, 10, 1533. [Google Scholar] [CrossRef]
  9. Liu, T.; Yin, X.; Liu, Y.; Tang, Y.; Huang, A.; Dong, X.; Liu, Y. Influence of Water Mist Temperature Approach on Fire Extinguishing Effect of Different Pool Fires. Processes 2022, 10, 1549. [Google Scholar] [CrossRef]
  10. Mohsin, M.; Yin, H.; Huang, W.; Zhang, S.; Zhang, L.; Mehak, A. Evaluation of Occupational Health Risk Management and Performance in China: A Case Study of Gas Station Workers. Int. J. Environ. Res. Public Health 2022, 19, 3762. [Google Scholar] [CrossRef]
  11. Soltanpour, Z.; Mohammadian, Y. The Concentration of Benzene, Toluene, Ethylbenzene, and Xylene in Ambient Air of the Gas Stations in Iran: A Systematic Review and Probabilistic Health Risk Assessment. Toxicol. Ind. Health 2021, 37, 134–141. [Google Scholar] [CrossRef]
  12. Shinohara, N.; Okazaki, Y.; Mizukoshi, A.; Wakamatsu, S. Exposure to Benzene, Toluene, Ethylbenzene, Xylene, Formaldehyde, and Acetaldehyde in and around Gas Stations in Japan. Chemosphere 2019, 222, 923–931. [Google Scholar] [CrossRef]
  13. Sulistyanto, R.A.; Hamid, A.; Aditya; Kusumaningrum, D.A.; Suaebo, N.M.; Tualeka, A.R. Safe Concentration of Benzene Exposure to Worker’s in Gas Station at the Area of Diponegoro University, Semarang. Indian J. Forensic Med. Toxicol. 2020, 14, 2049–2054. [Google Scholar]
  14. Almadiana, C.S.; Tualeka, A.R. Determination of Safe Benzene Concentration at Ciputat Gas Station. Indian J. Forensic Med. Toxicol. 2020, 14, 183–188. [Google Scholar] [CrossRef]
  15. Ma, G.; Huang, Y. Safety Assessment of Explosions during Gas Stations Refilling Process. J. Loss Prev. Process Ind. 2019, 60, 133–144. [Google Scholar] [CrossRef]
  16. Wang, W.; Jiang, F.; Jiang, Q.; Shen, H.; Zhang, R.; Liang, D. Characteristic and Fire Experiment of Gasoline Spraying in Gas Station. In Proceedings of the 9th International Conference on Fire Science and Fire Protection Engineering, ICFSFPE 2019, Guangzhou, China, 18–20 October 2019. [Google Scholar]
  17. Setyawan, H. The Determinant of Fire Disaster Mitigation (Fire Practices Study in Gas Station Operator Surakarta, Indonesia). In IOP Conference Series: Earth and Environmental Science; Institute of Physics Publishing: Bristol, UK, 2020; Volume 423. [Google Scholar]
  18. Ahmed, M.M.; Kutty, S.R.M.; Shariff, A.M.; Khamidi, M.F. Petrol Fuel Station Safety and Risk Assessment Framework. In Proceedings of the 2011 National Postgraduate Conference—Energy and Sustainability: Exploring the Innovative Minds, NPC 2011, Perak, Malaysia, 19–20 September 2011. [Google Scholar]
  19. Nwankwo, C.D.; Arewa, A.O.; Theophilus, S.C.; Esenowo, V.N. Analysis of Accidents Caused by Human Factors in the Oil and Gas Industry Using the HFACS-OGI Framework ABSTRACT. Int. J. Occup. Saf. Ergon. 2022, 28, 1642–1654. [Google Scholar] [CrossRef] [PubMed]
  20. Zohar, D. Safety Climate in Industrial Organizations: Theoretical and Applied Implications. J. Appl. Psychol. 1980, 65, 96–102. [Google Scholar] [CrossRef]
  21. Luo, T. Safety Climate: Current Status of the Research and Future Prospects. J. Saf. Sci. Resil. 2020, 1, 106–119. [Google Scholar] [CrossRef]
  22. Li, J.; Goerlandt, F.; Van Nunen, K.; Ponnet, K.; Reniers, G. Conceptualizing the Contextual Dynamics of Safety Climate and Safety Culture Research: A Comparative Scientometric Analysis. Int. J. Environ. Res. Public Health 2022, 19, 813. [Google Scholar] [CrossRef] [PubMed]
  23. Bamel, U.K.; Pandey, R.; Gupta, A. Safety Climate: Systematic Literature Network Analysis of 38 Years (1980-2018) of Research. Accid. Anal. Prev. 2020, 135, 105387. [Google Scholar] [CrossRef]
  24. Pousette, A.; Larsson, S.; Törner, M. Safety Climate Cross-Validation, Strength and Prediction of Safety Behaviour. Saf. Sci. 2008, 46, 398–404. [Google Scholar] [CrossRef]
  25. Han, B.; Son, S.; Kim, S. Measuring Safety Climate in the Construction Industry: A Systematic Literature Review. Sustainability 2021, 13, 603. [Google Scholar] [CrossRef]
  26. Kines, P.; Lappalainen, J.; Mikkelsen, K.L.; Olsen, E.; Pousette, A.; Tharaldsen, J.; Tómasson, K.; Törner, M. Nordic Safety Climate Questionnaire (NOSACQ-50): A New Tool for Diagnosing Occupational Safety Climate. Int. J. Ind. Ergon. 2011, 41, 634–646. [Google Scholar] [CrossRef]
  27. NOSACQ-50 Translations. Available online: https://nfa.dk/da/Vaerktoejer/Sporgeskemaer/Safety-Climate-Questionnaire-NOSACQ50/NOSACQ50-translations (accessed on 17 September 2022).
  28. Interpreting the Nordic Occupational Safety Climate Questionnaire NOSACQ-50 Results. Available online: https://nfa.dk/da/Vaerktoejer/Sporgeskemaer/Safety-Climate-Questionnaire-NOSACQ50/How-to-use-NOSACQ50/Interpreting-NOSACQ50-results (accessed on 28 November 2022).
  29. Lestari, F.; Sunindijo, R.Y.; Loosemore, M.; Kusminanti, Y. A Safety Climate Framework for Improving Health and Safety in the Indonesian Construction Industry. Int. J. Environ. Res. Public Health 2020, 17, 7462. [Google Scholar] [CrossRef]
  30. Loosemore, M.; Sunindijo, R.Y.; Lestari, F.; Kusminanti, Y.; Widanarko, B. Comparing the Safety Climate of the Indonesian and Australian Construction Industries: Cultural and Institutional Relativity in Safety Research. Eng. Constr. Archit. Manag. 2019, 26, 2206–2222. [Google Scholar] [CrossRef]
  31. Martin, L.; Yosia, S.R.; Shang, Z. Comparative Analysis of Safety Climate in the Chinese, Australian, and Indonesian Construction Industries. J. Constr. Eng. Manag. 2020, 146, 04020129. [Google Scholar] [CrossRef]
  32. Athaya, B.F.; Riantini, L.S.; Machfudiyanto, R.A. Identification Factors of Safety Climate, Awareness, and Behaviors to Improve Safety Performance in Telecommunication Tower Construction at PT X. In Proceedings of the 5th International Conference on Rehabilitation and Maintenance in Civil Engineering, Surakarta, Indonesia, 8–9 July 2022; pp. 651–658. [Google Scholar]
  33. Kadir, A.; Lestari, F.; Sunindijo, R.Y.; Erwandi, D.; Kusminanti, Y.; Modjo, R.; Widanarko, B.; Ramadhan, N.A. Safety Climate in the Indonesian Construction Industry: Strengths, Weaknesses, and Influential Demographic Characteristics. Buildings 2022, 12, 639. [Google Scholar] [CrossRef]
  34. Mustikawati, B.I.; Chalidyanto, D.; Syitharini, N. Improving Hand Hygiene Compliance Through WHO’s Multimodal Hand Hygiene Improvement Strategy. J. Health Transl. Med. 2020, 23, 212–219. [Google Scholar]
  35. Ismara, K.I.; Husodo, A.; Prabandari, Y.S.; Hariyono, W.; Engineering, F.; Yogyakarta, U.N.; Medicine, F.; Mada, U.G.; Health, P.; Dahlan, U.A. Relationship Model for Occupational Safety and Health Climate to Prevent Needlestick Injuries for Nurses. Kesmas Natl. Public Health J. 2019, 13, 144–149. [Google Scholar] [CrossRef] [Green Version]
  36. Ningrum, E.; Evans, S.; Soh, S.-E. Validation of the Indonesian Version of the Safety Attitudes Questionnaire: A Rasch Analysis. PLoS ONE 2019, 14, e0215128. [Google Scholar] [CrossRef] [PubMed] [Green Version]
  37. Lestiani, M.E.; Yudoko, G.; Yassierli; Purboyo, H. Developing a Conceptual Model of Organizational Safety Risk:Case Studies of Aircraft Maintenance Organizations in Indonesia. Transp. Res. Procedia 2017, 25, 136–148. [Google Scholar] [CrossRef]
  38. Adi, E.N.; Eliyana, A.; Hamidah; Mardiana, A.T. Safety Leadership and Safety Behavior in MRO Business: Moderating Role of Safety Climate in Garuda Maintenance Facility Indonesia. Syst. Rev. Pharm. 2020, 11, 151–163. [Google Scholar] [CrossRef]
  39. Adi, E.N.; Eliyna, A. Hamidah An Empirical Analysis of Safety Behaviour A Study in MRO Business in Indonesia. Heliyon 2021, 7, e06122. [Google Scholar] [CrossRef]
  40. Widyanti, A. The Influence of Safety Climate, Motivation, and Knowledge on Worker Compliance and Participation: An Empirical Study of Indonesian SMEs. Ingeneria Investig. 2021, 41, 1–9. [Google Scholar] [CrossRef]
  41. Sukapto, P.; Octavia, J.R.; Pundarikasutra, P.A.D.; Ariningsih, P.K.; Susanto, S. Improving Occupational Health and Safety and in the Home-Based Footwear Industry through Implementation of ILO-PATRIS, NOSACQ-50 and Participatory Ergonomics: A Case Study. Int. J. Technol. 2019, 10, 908–917. [Google Scholar] [CrossRef] [Green Version]
  42. Juliawati, M.; Darwita, R.R.; Adiatman, M.; Lestari, F. Patient Safety Culture in Dentistry Analysis Using the Safety Attitude Questionnaire in DKI Jakarta, Indonesia: A Cross-Cultural Adaptation and Validation Study. J. Patient Saf. 2022, 18, 486–493. [Google Scholar] [CrossRef] [PubMed]
  43. Yovi, E.Y.; Abbas, D.; Takahashi, T. Safety Climate and Risk Perception of Forestry Workers: A Case Study of Motor-Manual Tree Felling in Indonesia Motor-Manual Tree Felling in Indonesia. Int. J. Occup. Saf. Ergon. 2022, 28, 2193–2201. [Google Scholar] [CrossRef] [PubMed]
  44. Maryam, S.; Sule, E.T.; Ariawaty, R.N. Effects of Safety Climate and Employee Engagement towards Organisational Citizenship Behaviour of Sewage Workers. Asian J. Bus. Account. 2021, 14, 253–276. [Google Scholar] [CrossRef]
  45. Kusumawardani, K.A.; Arquisola, M.J.; Amin, G.; Restiawati, M. Inclusive Leadership and Workers’ Safety Behaviour during COVID-19 Pandemic. In Evidence-Based HRM: A Global Forum for Empirical Scholarship; Emerald Publishing Limited: Bingley, England, 2021. [Google Scholar] [CrossRef]
  46. Joanda, A.D.; Suhardi, B. Validity and Reliability Analysis of Safety Climate Factor at Small and Medium-Sized Enterprises ( SMEs ) Wood Based Furnitures. In Proceedings of the International Conference on Industrial Engineering and Operations Management, Bandung, Indonesia, 6–8 March 2018; pp. 420–425. [Google Scholar]
  47. Djastuti, I.; Perdhana, M.S.; Raharjo, S.T.; Udin, U. Safety Behavior of Manufacturing Companies in Indonesia. In Proceedings of the First Economics and Business Competitiveness International Conference (EBCICON 2018), Bali, Indonesia, 21–22 September 2018; pp. 147–152. [Google Scholar]
  48. Sexton, J.B.; Helmreich, R.L.; Neilands, T.B.; Rowan, K.; Vella, K.; Boyden, J.; Roberts, P.R.; Thomas, E.J. The Safety Attitudes Questionnaire: Psychometric Properties, Benchmarking Data, and Emerging Research. BMC Health Serv. Res. 2006, 6, 1–10. [Google Scholar] [CrossRef] [Green Version]
  49. Manurung, R.O.; Adiyanta, F.S.; Juliani, H. Kedudukan Hukum Satuan Kerja Khusus Migas Sebagai Pelaksana Kegiatan Usaha Hulu Minyak Dan Gas Bumi Bagi Tata Kelola Ketahanan Energi Nasional. Adm. Law Gov. J. 2022, 5, 135–152. [Google Scholar]
  50. Jonan, I. Peraturan Menteri ESDM Nomor 13 Tahun 2018 Tentang Kegiatan Penyaluran Bahan Bakar Minyak, Bahan Bakar Gas Dan Liquified Petroleum Gas; Kementerian Energi dan Sumber Daya Mineral: Jakarta, Indonesia, 2018. [Google Scholar]
  51. Japari, N.D.; Zafrullah TN, A.; Djoemadi, F.R. Peran PT Pertamina Sebagai Penyedia Pasokan Bahan Bakar Minyak Di Indonesia. Calyptra J. Ilm. Mhs. Univ. Surabaya 2019, 7, 4154–4163. [Google Scholar]
  52. Tasrif, A. Peraturan Menteri ESDM No. 32 Tahun 2021 Tentang Inspeksi Teknis Dan Pemeriksaan Keselamatan Instalasi Dan Peralatan Pada Kegiatan Usaha Minyak Dan Gas Bumi; Kementerian Energi dan Sumber Daya Mineral: Jakarta, Indonesia, 2021. [Google Scholar]
  53. Wibowo, A.; Lestari, F.; Modjo, R. Preventing Fuel Station Accidents: The Importance of Community Involvement. In IOP Conference Series: Earth and Environmental Science; IOP Publishing: Jakarta, Indonesia, 2022; Volume 1111, pp. 1–7. [Google Scholar] [CrossRef]
  54. Wulandari, R.M.; Uke, I.; Siahaan, M. Strategic Investment Analysis for the Gas Station Projects Using Build Operate and Transfer (Case Study: PT Pertamin, Besakih Bali). Int. J. Curr. Sci. Res. Rev. 2022, 05, 3394–3404. [Google Scholar] [CrossRef]
  55. Sukapto, P.; Djojosoebroto, H.; Susanto, S.; Ariningsih, P.K. A New Approach to the Assessment of the Safety Environment and Performance in the Footwear Industry. Int. J. Simul. Syst. Sci. Technol. 2018, 14, 5–12. [Google Scholar] [CrossRef]
  56. Wirawati, K.; Raksanagara, A.; Gondodiputro, S.; Sunjaya, D.K.; Sukandar, H.; Irdasari, Y. Safety Climate as a Risk Factor of Occupational Accidents in a Textile Industry. BKM J. Community Med. Public Health 2020, 36, 59–64. [Google Scholar] [CrossRef]
  57. Data Indonesia Berapa Jumlah SPBU Di Indonesia? Available online: https://dataindonesia.id/sektor-riil/detail/berapa-jumlah-spbu-di-indonesia (accessed on 13 October 2022).
  58. Wagenmakers, E.-J.; Ly, A.; Boutin, B.; Goosen, J.; van den Bergh, D.; Kucharský, Š.; Dofferhoff, R.; Derks, K.; van Doorn, J.; Bartoš, F.; et al. JASP, version 0.16.4; Computer Software; Department of Psychological Methods University of Amsterdam: Amsterdam, The Netherlands, 2022.
  59. Ursachi, G.; Horodnic, I.A.; Zait, A. How Reliable Are Measurement Scales? External Factors with Indirect Influence on Reliability Estimators. Procedia Econ. Financ. 2015, 20, 679–686. [Google Scholar] [CrossRef] [Green Version]
  60. Beus, J.M.; Payne, S.C.; Arthur, W., Jr.; Muñoz, G.J. The Development and Validation of a Cross-Industry Safety Climate Measure: Resolving Conceptual and Operational Issues. J. Manag. 2019, 45, 1987–2013. [Google Scholar] [CrossRef]
  61. Digmayer, C.; Jakobs, E.-M. Analyzing Safety Communication in Industrial Contexts. J. Tech. Writ. Commun. 2022, 52, 251–290. [Google Scholar] [CrossRef]
  62. Narayan, R.; Nair, V.K. The Roles of Communicative Language Mechanisms in Occupational Health and Safety Milieu in Reducing Workplace Hazards. J. Lang. Teach. Res. 2021, 12, 264–274. [Google Scholar] [CrossRef]
  63. Alamoudi, M. The Integration of NOSACQ-50 with Importance-Performance Analysis Technique to Evaluate and Analyze Safety Climate Dimensions in the Construction Sector in Saudi Arabia. Buildings 2022, 12, 1855. [Google Scholar] [CrossRef]
  64. Aboramadan, M.; Kundi, Y.M.; Elhamalawy, E.; Albashiti, B. The Effect of High-Performance Work Systems on Risk-Taking and Organizational Citizenship Behaviors: The Mediating Role of Perceived Safety Climate. Empl. Relations 2022, 44, 1428–1447. [Google Scholar] [CrossRef]
  65. Lagerstrom, E.; Magzamen, S.; Kines, P.; Brazile, W.; Rosecrance, J. Determinants of Safety Climate in the Professional Logging Industry. Safety 2019, 5, 35. [Google Scholar] [CrossRef] [Green Version]
  66. Ajslev, J.; Lali, E.; Dyreborg, J.; Kines, P.; Christiane, K.; Sundstrup, E.; Due, M.; Fallentin, N.; Louis, L. Safety Climate and Accidents at Work: Cross-Sectional Study among 15,000 Workers of the General Working Population. Saf. Sci. 2017, 91, 320–325. [Google Scholar] [CrossRef]
  67. Gümüş, R.; Ayhan, M.; Gümüş, B. Archives of Environmental & Occupational Health Safety Climate in Marble Industry and Its Influence on Safety Performance and Occupational Accidents. Arch. Environ. Occup. Health 2022, 78, 48–59. [Google Scholar] [CrossRef]
  68. Surbakti, F.S.; Lestari, F. Iklim K3 Pada Masa Pandemi COVID-19: Studi Kasus Perusahaan Migas. PREPOTIF J. Kesehat. Masy. 2022, 6, 178–187. [Google Scholar] [CrossRef]
  69. Memarbashi, E.; Mohammadizadeh, F.; Boroujeny, Z.A.; Lotfi, M.; Khodayari, M.T.; Nasiri, E.; Akhuleh, O.Z. The Relationship between Nurses’ Safety Climate in the Operating Room and Occupational Injuries: A Predictive Correlational Study. Perioper. Care Oper. Room Manag. 2021, 24, 100206. [Google Scholar] [CrossRef]
  70. Almousa, N.; Althabet, N.; Alsultan, S.; Albagmi, F.; Alnujaidi, H. Occupational Safety Climate and Hazards in the Industrial Sector: Gender Differences Perspective, Saudi Arabia. Front. Public Health 2022, 10, 3498. [Google Scholar] [CrossRef] [PubMed]
  71. Fargnoli, M.; Lombardi, M. NOSACQ-50 for Safety Climate Assessment in Agricultural Activities: A Case Study in Central Italy. Int. J. Environ. Res. Public Health 2020, 17, 9177. [Google Scholar] [CrossRef] [PubMed]
  72. Abidin, A.; Awang Lukman, K.; Sajali, H.; Syed Abdul Rahim, S.S.; Robinson, F.; Hassan, M.R.; Hayati, F.; Ibrahim, M.Y.; Jeffree, M.S. Prevalence of Occupational Injury and Determination of Safety Climate in Small Scale Manufacturing Industry: A Cross-Sectional Study. Ann. Med. Surg. 2021, 69, 102699. [Google Scholar] [CrossRef]
  73. Li, Z.; Man, S.S.; Hoi, A.; Chan, S.; Zhu, J. Integration of Theory of Planned Behavior, Sensation Seeking, and Risk Perception to Explain the Risky Driving Behavior of Truck Drivers. Sustainability 2021, 13, 5214. [Google Scholar] [CrossRef]
  74. Puspitasari, Y.; Zid, M.; Hardi, O.S. The Implementation of Teacher Strategies in Maintaining Sundanese Culture in The Senior High School Region I West Java. J. Geogr. Gea 2021, 21, 50–57. [Google Scholar] [CrossRef]
  75. Charina, A.; Kurnia, G.; Mulyana, A.; Mizuno, K. The Impacts of Traditional Culture on Small Industries Longevity and Sustainability: A Case on Sundanese in Indonesia. Sustainability 2022, 14, 4445. [Google Scholar] [CrossRef]
  76. Kim, N.K.; Rahim, N.F.A.; Iranmanesh, M.; Foroughi, B. The Role of the Safety Climate in the Successful Implementation of Safety Management Systems. Saf. Sci. 2019, 118, 48–56. [Google Scholar] [CrossRef]
  77. Oah, S.; Na, R.; Moon, K. The Influence of Safety Climate, Safety Leadership, Workload, and Accident Experiences on Risk Perception: A Study of Korean Manufacturing Workers. Saf. Health Work 2018, 9, 427–433. [Google Scholar] [CrossRef]
Figure 1. Number of safety climate studies in Indonesia by industry.
Safety 09 00009 g001
Figure 2. Safety climate scores based on (a) age, (b) gender, and (c) education level.
Safety 09 00009 g002
Figure 3. Safety climate scores based on fuel station (a) scheme and (b) location (rural/city).
Safety 09 00009 g003
Figure 4. Safety climate scores based on working (a) position and (b) length of work.
Safety 09 00009 g004
Figure 5. Safety climate scores based on (a) safety training and (b) accident experience.
Safety 09 00009 g005
Table 1. Search result on “safety climate” and “fuel station”.
AuthorSummaryDimensions
Bakidamteh et al. [4]A study in Accra, Ghana shows safety climate perceptions and proactive personality have significant effect on safety behavior, i.e., safety compliance and safety participation.
  • Proactive personality (10 items)
  • Safety climate perceptions (9 items)
  • Safety compliance (4 items)
  • Safety participation (5 items)
Table 2. Categorization and interpretation of safety climate scores [28].
ScoreCategoryInterpretation
>3.30goodshould maintain and further improve safety climate dimension
Between 3.00 and 3.30fairly goodshould slightly improve safety climate dimension
Between 2.70 and 2.99fairly lowneed to improve safety climate dimension
<2.70lowneed to greatly improve safety climate dimension
Table 3. Respondent distribution based on background information.
VariableCategoryRespondents (N)Percentage (%)
Total valid respondents 678
Age (in year)<25 years19829.33
25–29 years17525.93
30–34 years13419.85
>34 years16824.89
GenderMale52477.29
Female15422.71
Work PositionManager385.60
Supervisor16624.48
Operator32447.79
Others15022.12
Education levelPrimary school10.15
Junior high school101.47
High school61690.86
Undergraduate507.37
Graduate10.15
Length of work (in years)1 year or less13720.21
2–5 years24235.69
5–10 years18727.58
>10 years11216.52
Fuel station schemeCOCO34951.47
DODO32948.53
LocationRural20730.53
City46969.17
Have received safety trainingYes48871.98
No19028.02
Accident experienceYes13319.62
No 54580.38
Table 4. Overall result of safety climate assessment for each dimension. Safety climate score means in a scale of 1–4.
NOSACQ-50 Dimensions (n = 678)MeanStd DevVarianceCronbach’s α
Dim1: Management safety priority and ability3.250.420.170.799
Dim2: Management safety empowerment2.980.390.160.735
Dim3: Management safety justice2.970.430.190.535 *
Dim4: Worker safety commitment3.310.440.200.770
Dim5: Workers’ safety priority and risk non-acceptance2.820.490.240.627
Dim6: Safety communication, learning, and trust in co-worker safety competence3.110.380.140.795
Dim7: Workers’ trust in the efficacy of safety systems3.050.440.200.807
* Cronbach’s α reliability test value less than 0.6.
Table 5. Safety climate scores (scale 1 to 4) filtered by respondents’ background information.
VariableCategoryMeanDim1Dim2Dim3Dim4Dim5Dim6Dim7
Age<25 years3.01 3.172.882.863.262.763.093.02
25–29 years3.09 3.262.973.013.352.853.153.07
30–34 years3.10 3.293.053.003.342.863.123.05
>34 years3.12 3.313.093.083.312.863.103.09
GenderMale3.093.263.002.983.332.843.123.07
Female3.023.192.932.933.242.763.063.01
PositionManager3.183.423.163.143.392.893.163.09
Supervisor3.103.293.053.013.342.863.113.07
Operator3.033.192.912.903.282.773.103.05
Others3.093.283.043.023.302.873.123.03
Education levelPrimary school2.903.002.573.003.502.332.883.00
Junior high school3.033.142.902.883.302.833.103.02
High school3.073.242.982.973.302.813.113.05
Undergraduate3.113.303.072.983.342.903.103.06
Graduate3.083.563.003.003.003.003.003.00
Length of work1 year/less3.023.242.962.953.312.843.113.05
2–5 years3.073.263.033.013.302.783.103.05
5–10 years3.103.172.872.863.302.773.113.06
>10 years3.083.232.982.963.302.823.123.05
Fuel station schemeCOCO3.083.303.023.023.342.873.123.05
DODO3.063.293.073.023.272.813.063.05
LocationRural3.083.263.002.993.312.853.113.06
City3.073.232.972.953.302.793.113.04
Have received safety trainingYes3.103.263.033.013.302.783.103.05
No3.003.242.962.953.312.843.113.05
Incident
experience
Yes3.103.293.022.993.332.843.143.09
No3.063.142.902.913.252.783.042.97
Table 6. Comparison of safety climate scores between different categories of background variable shown as the p-value of the mean and each dimension.
VariableComparison HypothesisMeanDim1Dim2Dim3Dim4Dim5Dim6Dim7
Age25/younger < 25–290.017 *0.015 *0.035 *0.002 **0.0900.0620.1400.147
25/younger < 30–340.005 **0.002 **<0.001 ***0.002 **0.1290.027 *0.4240.144
25/younger < 35/older0.001 **<0.001 ***<0.001 ***<0.001 ***0.1570.016 *0.4870.033 *
GenderMale > Female0.006 **0.005 **0.008 **0.1050.036 *0.035 *0.1410.147
EducationUndergraduate > High school0.1670.0600.036 *0.3830.2360.0910.7280.514
High sch. > Jr. high school0.5000.1980.3010.3180.5900.6110.4980.390
Undergraduate > Jr. high school0.3100.0600.0990.2550.4920.4130.5750.428
PositionManagers > Workers0.002 **0.001 **<0.001 ***0.006 **0.0630.027 *0.2820.082
Fuel station schemeCOCO > DODO0.3150.6280.8640.5410.7710.1070.9650.325
Length of workabove 10 years > under 1 year0.031 *0.006 **<0.001 ***0.003 **0.7200.1740.7570.381
6–10 years > under 1 year0.024 *0.003 **<0.001 ***<0.001 ***0.3540.043 *0.4640.340
2–5 years > under 1 year0.0790.086<0.001 ***0.013 *0.4790.1640.3530.367
LocationRural < City0.4840.5740.968 †0.8450.3730.040 *0.4180.415
Safety TrainingNot trained < Trained<0.001 ***<0.001 ***<0.001 ***0.023 *0.041 *0.1090.003 **0.001 **
Accident
Experience
No accident experience < Accident experience0.2170.3730.034 *0.4750.1480.1770.4340.234
* p-value < 0.05; ** p-value < 0.01; *** p-value < 0.001; † p-value < 0.05 (significant) for the opposite (Rural > City).
Disclaimer/Publisher’s Note: The statements, opinions and data contained in all publications are solely those of the individual author(s) and contributor(s) and not of MDPI and/or the editor(s). MDPI and/or the editor(s) disclaim responsibility for any injury to people or property resulting from any ideas, methods, instructions or products referred to in the content.

