Article

Construction Health and Safety Agent Collaboration and Its Influence on Health and Safety Performance in the South African Construction Industry

by
Ndaleni Phinias Rantsatsi
1,*,
Innocent Musonda
1 and
Justus Agumba
2
1
Faculty of Health Sciences, University of Johannesburg, Johannesburg 2094, South Africa
2
The Faculty of Humanities, Tshwane University of Technology, Pretoria 0001, South Africa
*
Author to whom correspondence should be addressed.
Submission received: 10 October 2022 / Revised: 30 January 2023 / Accepted: 31 January 2023 / Published: 7 February 2023

Abstract

:
Fatalities, injuries, and illnesses continue to occur in the construction industry (CI), despite efforts made by clients, designers, and contractors. The lack of collaboration between these project actors and construction health and safety agents (CHSA) remains a challenge for both construction professionals and academics. Given the urgent need for CHSA to collaborate with other construction project members, this study proposes a model for improving CHSA collaboration and its influence on health and safety (H&S) performance. The exploratory sequential mixed method, which included a Delphi study and a questionnaire survey, was adopted. H&S experts were purposively sampled. A three-round Delphi study was conducted to identify the factors, and these factors were categorized into 9 main factors developed from a review of the literature and the input of 15 H&S experts, 14 of whom completed all 3 iterations. Stratified sampling was used to gather quantitative data. A total of 257 questionnaires were returned, of which 213 responses were usable for analysis. Exploratory factor analysis (EFA) using Statistical Package for the Social Sciences (SPSS) version 26 was conducted and resulted in 6 main factors. A confirmatory factor analysis (CFA) of structural equation modeling (SEM) was used to establish the validity and reliability of constructs, and finally, path analysis in EQS version 6.4 was used to analyze the results of the questionnaire survey and evaluate the goodness of model fit. The findings were that mutuality, trust, institutional support, project context, and common purpose contribute to CHSA collaboration. Additionally, the influence of project context, common purpose, and CHSA collaboration on H&S performance were found to be statistically significant. The study’s implication is that in order to improve H&S performance, clients, designers, and contractors may not limit the participation of CHSA on the project. The implication for the CI is that by promoting CHSA collaboration, the likelihood of CHSA influence could increase and H&S performance could improve on construction projects. The study revealed that collaboration should be considered for improving H&S performance. The study is limited to respondents who met the selection criteria to participate in the Delphi study and questionnaire survey. Any registered persons who did not receive regular communication and announcements would have not participated. Despite the requirements of the South Africa Construction Regulations 2014 that CHSA should be part of the construction project team, more studies should be conducted to investigate the CHSA level of involvement on the project.

1. Introduction

Fatalities, injuries, and illnesses continue to occur in the construction industry (CI), despite efforts made by clients, designers, and contractors [1,2,3]. The situation is the same in South Africa. Existing literature identifies poor collaboration between project participants as a barrier to achieving project objectives. Even though H&S legislation requires improvements in H&S [3,4], poor collaboration among the traditional project actors and CHSAs remains a concern in the CI [3]. The lack of collaboration between these project actors and CHSA remains a challenge for both construction professionals and academics [3,5,6]. The South African CI is not immune to poor collaboration between CHSA and other construction professionals. Meanwhile, Erickson [7] identified collaboration as one of the possible solutions to improving the influence of H&S professionals, and other studies have suggested that collaboration can improve H&S performance [8,9,10]. However, no study has determined the impact of collaboration on H&S performance and the statistical significance of the factors that determine CHSA collaboration on construction projects. The purpose of this study was to initially reveal the factors that determine collaboration on construction projects, then to develop a model for predicting the factors improving CHSA collaboration in the South African CI, and finally to determine the impact of CHSA collaboration on H&S performance. Since H&S professionals may work for different organizations on a project, this study focuses specifically on CHSA. In this study, CHSA is ‘’defined as competent person who acts as representative for client who has the capability to design, compile, implement and manage the health and safety (H&S) requirements for construction project from initiation and briefing to project close-out’’ (South African Council for Project and Construction Management Professions (SACPCMP), [11]. The CI is critical for infrastructure development and job creation. Despite these benefits, the CI exposes workers to H&S hazards. While the CI is known for its ability to drive the economy, it is also known for its injury and accident rates.

2. Literature Review

2.1. Construction Industry and Health and Safety Management

The CI is known for poor H&S performance worldwide [12]. In South Africa, the situation is the same in terms of accidents recorded by the CI [13]. Likewise, according to [12,14,15], many workers get involved in accidents and suffer injuries in the CI. For example, a worker dies weekly in the CI [13]. The situation is the same in South Africa, where injuries and accidents are commonplace [14,15,16]. On the other hand, in South Africa, H&S legislations have identified the role of CHSA as one of the key members of the project team tasked to eliminate hazards and improve H&S in the CI [16]. It is known that these H&S measures are addressed by different project members. However, poor collaboration affects the ability of these members to improve H&S. Clients, contractors, and designers display poor knowledge and understanding of H&S issues [3,17]. Although CHSAs are critical to H&S management [18,19,20,21,22], their participation in the project is limited [3,14,19].
Several researchers have focused on the efforts required by clients, designers, and contractors [1,2,23]. They concluded that these key actors have an influence on H&S performance. However, other studies revealed that these key actors pay more attention to production, design, and construction processes than to H&S issues [5,18,24,25]. Hence, better H&S performance on construction projects requires collaboration. References [8,9,26] are of the view that collaboration can help put an end to the fatalities and injuries experienced by the CI. Meanwhile, the literature shows that several scholars have looked into the role of H&S professionals [27,28,29,30,31]. The common understanding among researchers is that H&S professionals can improve H&S. According to [14], their influence is dependent on factors such as personal characteristics, early involvement, experience, a line of report, relevant qualifications, training, a body of H&S knowledge, roles and responsibilities, trust, and support provided by institutions, such as professional bodies and the Department of Labor (DoL).

2.2. Factors of Collaboration

Collaboration has been studied by different researchers from various disciplines, such as education, engineering, health, management, and social science. Several researchers have conducted extensive reviews to emphasize the importance of collaboration in the CI. References [19,32,33,34] conducted a systematic literature review on this subject. The findings from these studies confirmed that a myriad of collaboration factors have the potential to improve project performance. This was carried out to understand the factors that can be used to influence H&S performance. On the other hand, [14] conducted a study to identify factors determining collaboration. A Delphi study was used, and CHSA collaboration was found to be likely influenced by seven factors.
The literature review identified potential factors as key factors that can influence collaboration [14,35,36,37,38,39,40,41]. Other studies have highlighted the importance of trust and mutuality in improving collaboration [35,41]. It is important for professionals to trust and share information and knowledge at the project level.
Seven factors of collaboration were identified.
Collaboration allows for the contribution of resources that can be used to benefit everyone involved in the project [35,38,41]. In this case, mutuality is considered a key aspect of collaboration. Reciprocity, respect, and sharing of information are some of the indicators of mutuality [35,42]. In addition to sharing resources, those involved need to rely on each other to deliver on the project’s goals. Building trust requires transparent communication [43,44]. This kind of communication drives collaboration. Furthermore, ref. [41] observe that there should be an enabling environment for collaboration. This should involve joint decision-making [42] and honest communication [34,44,45]. Personal characteristics play an important role in collaboration [37,39,42]. Consideration of personal characteristics as one of the factors influencing collaboration was supported by Bronstein [38]. However, construction projects invariably involve different professionals who belong to different institutions. These institutions provide support to professionals on the project [36,37]. For example, professional bodies provide support by, for example, keeping professionals abreast of the latest legislation, policies, and practices. This may include support given by government authorities. Moreover, the project requires structure and culture to function effectively. Project culture and structure contribute to collaboration between professionals [46]. Clear roles, responsibilities, communications, objectives, and commitment are key indicators for this factor [47,48,49]. Notwithstanding the factors mentioned above, a common purpose brings all these factors together and further brings the professional members together [34,41,45]. This is reflected in a clear vision, a shared purpose, and commitment [34,46].

2.3. Collaboration and Performance

References [34,46] stress the need for collaboration in construction projects around the world. Problems facing the CI are frequent disputes, high stress levels, and excessive fragmentation [50,51]. These problems are not only limited to poor quality [52,53], but they also involve poor H&S performance [54,55]. Reference [56] used a quantitative study to evaluate the impact of collaboration on performance in Malaysian CI. The findings of the study indicated that collaboration had an impact on the overall performance of construction projects. Reference [57] in their study on factors affecting collaborative building design indicated that collaboration between the design team and construction team is important for improving building performance. Not only can collaborative procurement improve performance, but it can also promote innovation in the industry [10]. Recent results of the study by [33] revealed that collaboration factors, such as trust, commitment, and reliability, can improve project productivity. These studies provide evidence regarding the potential influence of collaboration on project performance. While collaboration has been acknowledged for improving project performance, no study has determined the impact of collaboration on H&S performance or the statistical significance of factors that determine CHSA collaboration on construction projects. The purpose of this study was to initially reveal the factors that determine collaboration on construction projects, then to develop a model for predicting the factors improving CHSA collaboration in the South African CI, and finally to determine the impact of CHSA collaboration on H&S performance.

3. Methodology

The exploratory sequential mixed method involving the Delphi study and a questionnaire survey was adopted. The exploratory sequential mixed method allows for the exploration of research problems through qualitative study before generalizing the findings through quantitative study. In this study, the Delphi study was used to explore the research phenomenon, and a questionnaire survey was used to validate the findings of the Delphi study. Thus, qualitative data preceded quantitative data. This study targeted a population of construction managers, construction project managers, and construction health and safety practitioners. These groups of professionals have the relevant information, knowledge, and experience regarding CHSA collaboration on construction projects. The literature review and Delphi study were used to develop a conceptual model. The study first starts with a qualitative study (the Delphi study) and ends with a quantitative study (a questionnaire). The Delphi method was chosen because the study sought to initially explore and reach consensus on the factors identified through the literature review. Other qualitative methods, such as interviews or group focus, were found to be inappropriate. The Delphi method has been used successfully in previous studies [14,21] investigating H&S issues. The Delphi questionnaire was distributed electronically to all panel members. The questionnaire had two parts. The first part addressed the statements frelated to factors identified from the literature, and the second part presented open questions: ‘’Please list additional factors or statements that would encourage CHSA collaboration and factors or statements of CHSA collaboration that encourage H&S performance”. A 3-round Delphi study was conducted with 15 H&S experts, 14 of whom completed all 3 iterations. These experts were drawn from different parts of the world. International experts were used for theory development. The targeted population involved professionals (construction managers, H&S professionals, and construction engineers) and academics conducting research in the CI. Purposive sampling method was adopted for the Delphi study [58,59]. A purposive sampling was chosen because the study sought the participation of professionals who have relevant knowledge and experience regarding the topic.
The questionnaire survey was conducted in South Africa. The questionnaire consisted of two sections. Section A dealt with demographic information, and section B dealt with study questions. A questionnaire was designed to include all the main constructs of the conceptual model. The questionnaire was intended to assess the influence of the identified constructs on CHSA collaboration and the impact of CHSA collaboration on H&S performance. Six respondents piloted the survey instruments in order to check whether the questions were easily understood. Changes were made to the questionnaire based on the recommendations from the pilot study. A final questionnaire was administered online and via email in South Africa to registered professionals using the SACPCMP database. Due to the poor response rate, two reminders were sent to all respondents. It took over a month to collect the data. A stratified sampling method was used to gather data. According to [58], every individual in the strata has the likelihood of forming part of a sample. This was important since the study had three groups of respondents, namely, construction managers, construction project managers, and CHSAs. A total of 257 questionnaires were returned, of which 213 responses were usable for analysis and other questionnaires were incorrectly completed. EFA using SPSS version 26 of IBM was conducted and resulted in 6 main factors.
A CFA of SEM was used to establish the validity and reliability of constructs and to evaluate the best-fit model for each construct. Finally, path analysis of EQS version 6.4 was used to analyze the results of the questionnaire survey, and the goodness of model fit was evaluated.

3.1. Results and Discussion

3.1.1. Delphi Study Demographic Characteristics of Experts

Table 1 presents the profiles of the experts. Over 60% of the experts were from South Africa, 42% of the experts had a Doctor of Philosophy (PhD) degree, 50% of experts were CHSAs, and 57% of experts had over 10 years’ experience in the CI. The experts were from different regions, such as Africa, Europe, Asia, and North America. The regions not represented on the panel are the Middle East, South America, and Australia.
Table 2 presents panel members’ publication histories. Between them, experts were published in 353 peer-reviewed journal articles, 201 conference papers, 8 books, and 10 chapters in books. These experts also served on the editorial boards for journals, served as referees or reviewers, and also served on the technical committee for government authorities.

Delphi Study Process

The Delphi study involved 14 experts who had been identified from 4 sources. The first source was from the construction H&S literature. The second source was the register of members of the Council for Research and Innovation in Building and Construction (CIB) on the CIB working commission (W099). The third source was the CIB W099 conference proceedings from 2010 to 2019. Authors or speakers that featured prominently in the proceedings were identified as potential participants. The fourth source was the registered construction professionals and academics that serve the South African built environment. A survey questionnaire for recruiting a panel of H&S experts was sent to all experts in March 2021, and this questionnaire included expert qualification criteria consisting of personal information, academic information, professional experience, and any other information that confirms participants as experts in the field.
The Delphi process involved three iterative rounds to achieve consensus among experts on the extent to which statements related to seven factors would improve CHSA collaboration and the extent to which CHSA collaboration would improve H&S performance. Round one used both open and closed questions. In round one, apart from validating the statements or issues identified from literature, experts were asked to identify additional statements or factors. The information gained in round one was used in developing the questionnaire for round two. In rounds two and three, the experts were also asked to make comments on their ratings if they differed from the group median. The results of each round were compiled and communicated by the researcher to each participant. Group medians were reported to all experts. The agreement scale used a 7-point Likert scale where 1 = strongly disagree, 2 = disagree, 3 = somewhat, 4 = neutral, 5 = somewhat, 6 = agree, and 7 = strongly agree. For the analysis data, a researcher used Microsoft Excel, and the group median was reported as well. Qualitative summaries of open questions were provided. The cutoff values of group medians 6 to 7 were required for reaching consensus, with over 60% of the respondents rating the factor between 6 and 7. These criteria were used in past Delphi studies [60,61]. Anonymity was ensured throughout the three rounds. For instance, no name or email address of the participant was included in the questionnaire.
The Delphi study identified factors that determine CHSA collaboration and agreed that CHSA collaboration improved H&S performance. The Delphi questionnaire consisted of 63 statements categorized into 8 main factors. After the 3rd round, 6 statements dropped out and experts reached consensus on 57 statements for CHSA collaboration and H&S performance. A conceptual model was proposed based on the findings of the literature review and Delphi study. The Delphi study findings were that: mutuality, trust, an enabling environment, personal characteristics, a common purpose, institutional support, and project context should be considered in the determination of CHSA collaboration. Additionally, there was a consensus that CHSA collaboration can improve H&S performance. The conceptual model based on the findings of the literature review and Delphi study is presented in Figure 1. The hypotheses below are derived from the literature review and results of Delphi study.

3.1.2. Questionnaire Survey Results and Discussion

Respondents’ Profile

Table 3 presents the profile of respondents. A majority of respondents were CHSAs and construction H&S managers (28.6%); construction H&S management profession (56.8%); CHSA (54.5%); had a National Diploma (42.3%); had between 11 and 15 years of experience (31.9%); worked for a contractor (37.1%); delivered a project through an integrated delivery method (39.0%); construction projects were in Gauteng (35.2); and the H&S department was responsible for H&S on the project (80.3).

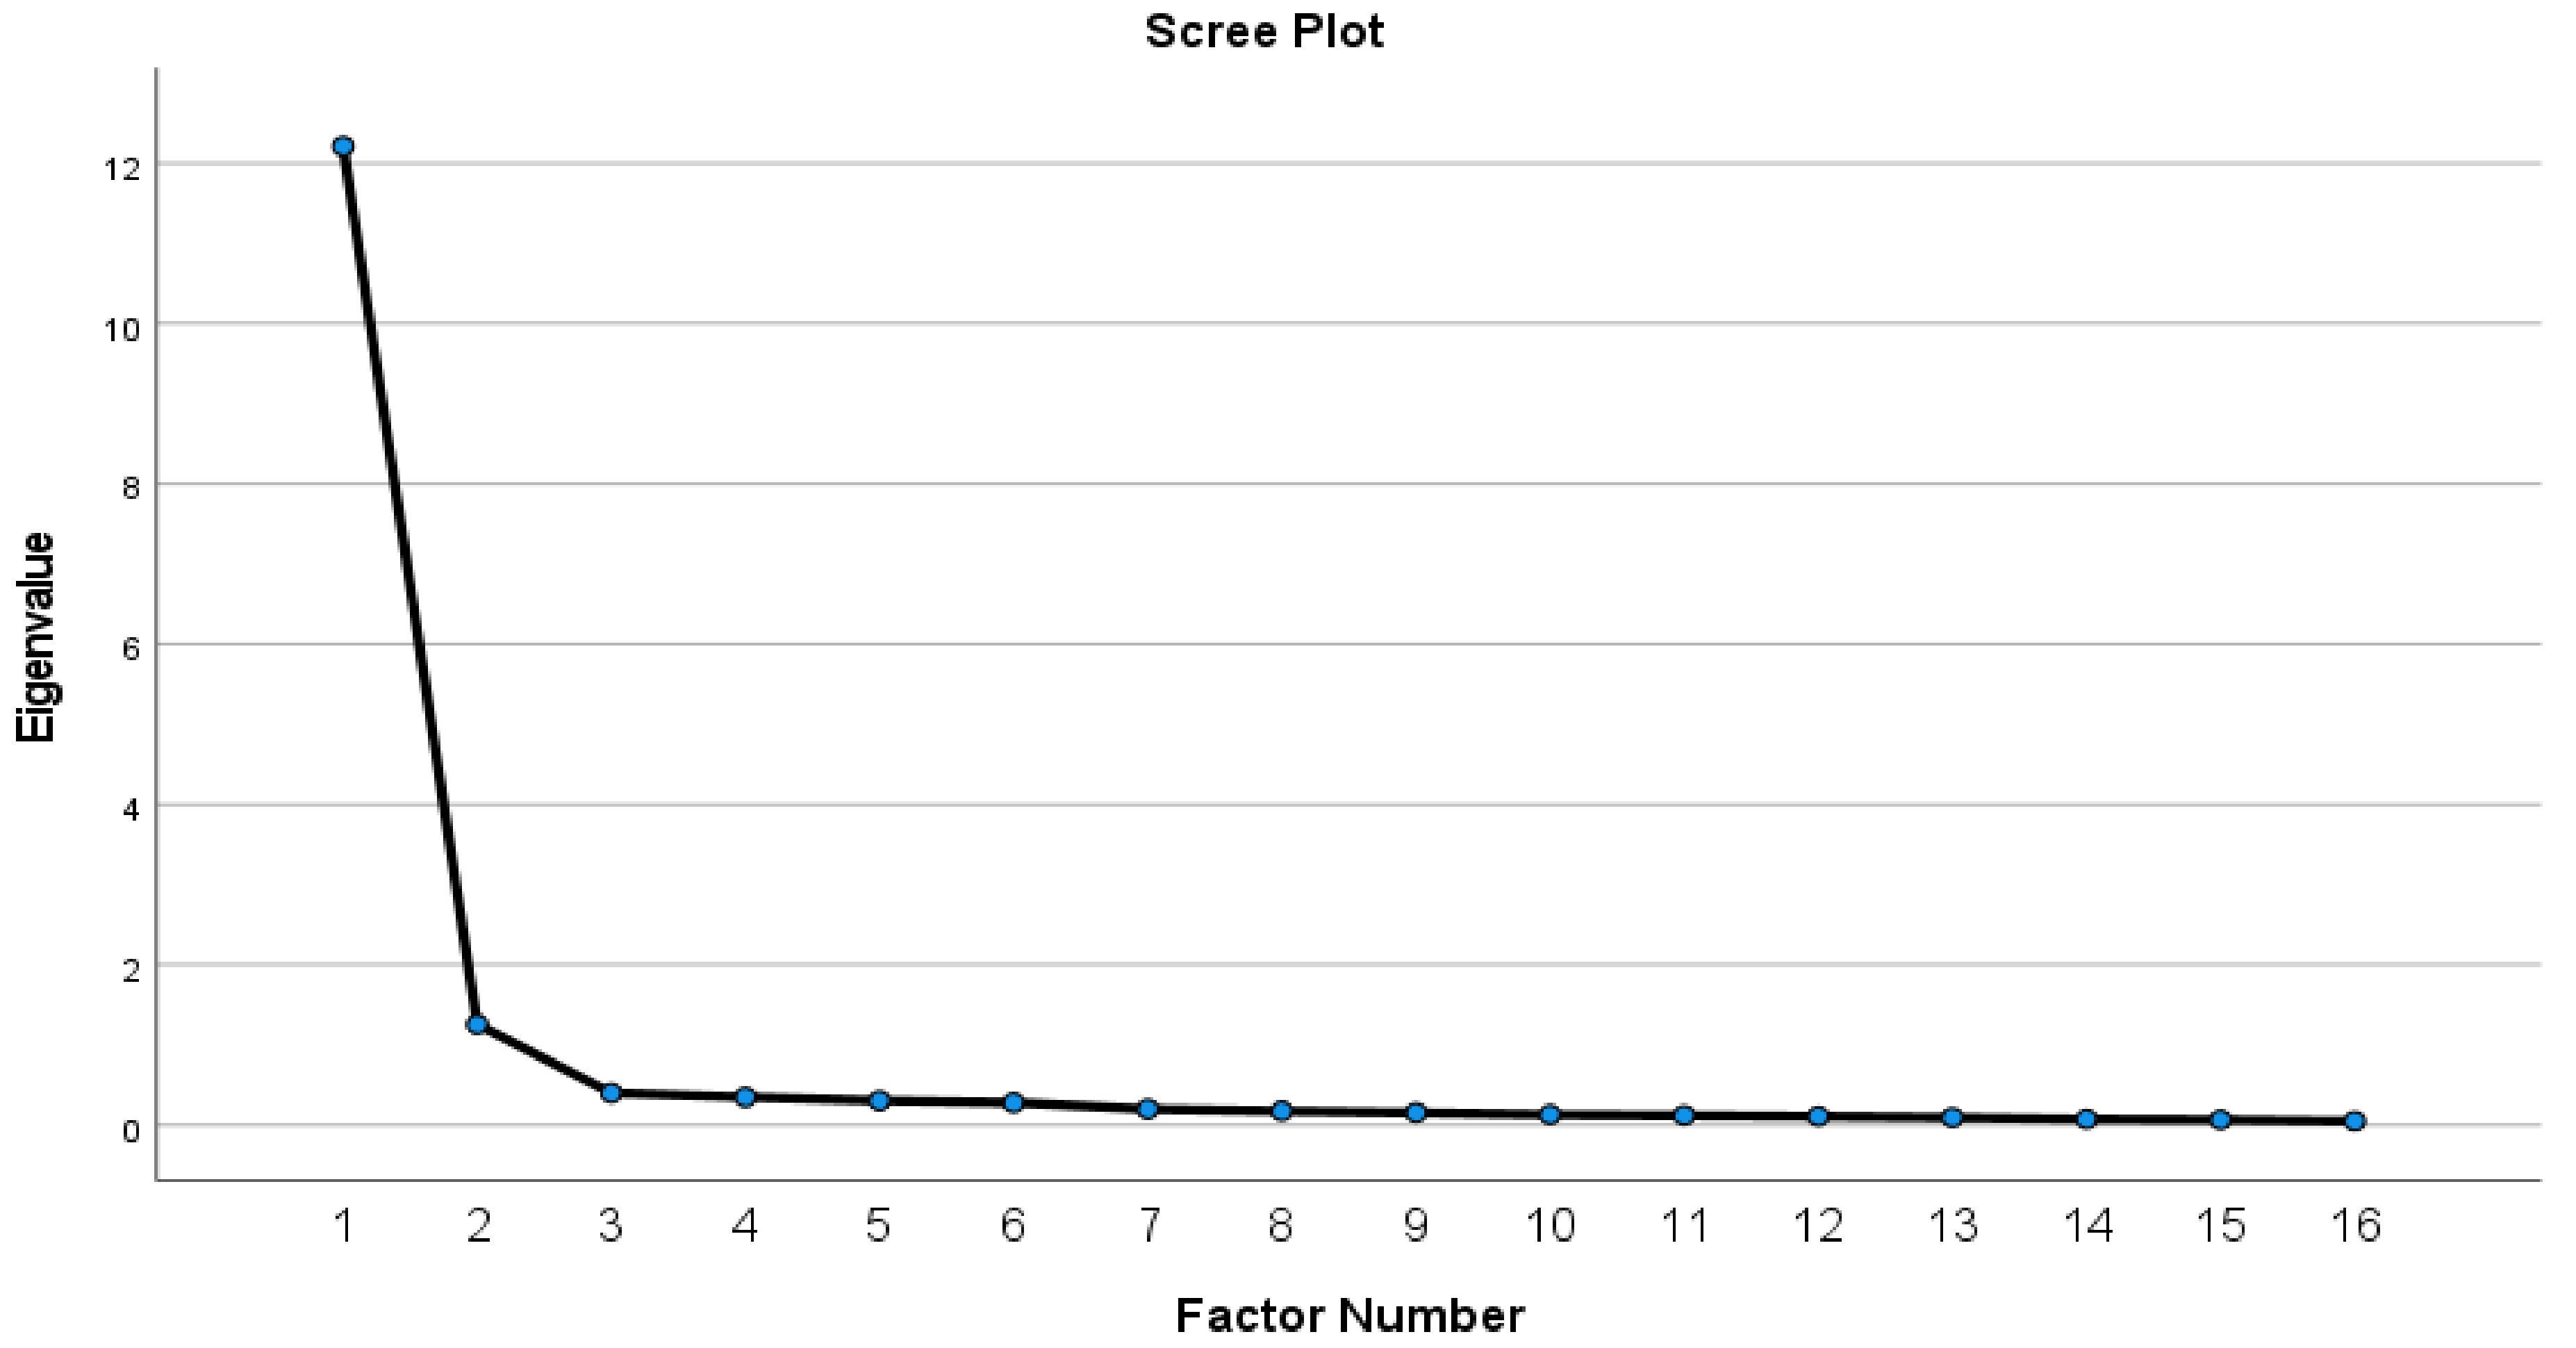
3.1.3. Factor Analysis

The results of seven independent factors were subjected to EFA to establish unidimensionality and reliability. EFA using SPSS version 26. Principal analysis factoring (PAF) with Varimax was specified as the extraction and rotation method. The results of the EFA of factors influencing CHSA collaboration. The results of EFA are presented in Table 4, Table 5 and Table 6. The EFA resulted in five factors; however, the fifth factor had only one variable loading and the other three had cross loadings. Hence, only four factors were retained for this study. Reference [62] state that a factor with fewer than three variables is weak and should be dropped.
The KMO value was 0.954, which exceeded the minimum recommended value of 0.6 [63,64]. The results indicate that the data are factor-analyzable. The Bartlett’s sphericity value was 0.000, indicating that the data is statistically significant and the value is less than 0.05, as presented in Table 4. These results support the factorability of the correlation matrix. The correlation matrix was checked and revealed coefficient values above 0.3.
PAF was conducted using the varimax rotation with Kaiser normalization for the data. Table 5 shows that five factors were extracted. Furthermore, the scree plot in Figure 2 shows the factor limit point at which eigenvalues become level. Table 6 shows the total variance: factor 1 extracted had 6.614, factor 2 extracted had 4.814, factor 3 extracted had 3.212, factor 4 extracted had 61.230, and factor 5 extracted had 2.794. The 5 factors recorded eigenvalues above 1, and they explained a total of 78.7% of the variance before rotation and 76% of the variance after rotation.
These factors had eigenvalues greater than 1.0; see Table 6 for details. The interrelationships among the factors and the variables that responded in a similar way and that had the highest loadings of variables measuring the same factor were used to rename the new four factors. Factor 1: mutuality; factor 2: trust; factor 3: institutional support; and factor 4: project context and common purpose. However, two factors, namely an enabling environment and personal characteristics, did not emerge as expected. Personal characteristics had only one variable loading out of eight variables while other variables grouped under trust factor. Enabling environment variables grouped under the mutuality factor. However, this finding was surprising since the literature provides support for the personal characteristics and enabling environment as key factors for collaboration [14,38,41]. As a result, the factors were dropped.

The Results of Two Dependent Factors, Namely CHSA Collaboration and H&S Performance

The EFA was conducted to assess the unidimensionality and reliability of the identified factors. PAF with varimax rotation was selected as the extraction and rotation methods. The results of EFA in health and safety performance (HSP) and CHSA collaboration (CC). Of the 16 variables, none dropped out. The results of EFA are presented in Table 7, Table 8 and Table 9 and in Figure 3.
The KMO value was 0.958, which exceeded the minimum recommended value of 0.6 as presented in Table 7. The Bartlett’s sphericity value was 0.0000, indicating that the data is statistically significant and the value is less than 0.05 as presented in Table 7. These results support the factorability of the correlation matrix. The correlation matrix was checked, and the coefficient values were above 0.3.
PAF was conducted using the varimax rotation with Kaiser normalization for the data. Table 7 shows the two factors that were extracted. In addition, the scree plot in Figure 3 shows the factor limits at which eigenvalues become level. Table 9 shows the total variance: factor 1 extracted had 76.319% and factor 2 extracted had 7.869%. The two factors recorded eigenvalues above 1, and they explained a total of 84% of the variance before rotation and 82% of the variance after rotation.
These factors had eigenvalues greater than 1.0; see Table 9 for details. All the variables loaded on CHSA collaboration and H&S performance as expected, and there was no need to rename these constructs.

3.1.4. Assessment of Measurement Model for Each Construct

Table 10 shows measurement model statistics and fit indices. The distribution of data indicated nonnormality. The Mardia coefficient value has to be lower than 5 in order for the data to be multivariate normally distributed. The values of Mardia’s coefficient for all constructs were found to be high. However, EQS has the ability to deal with nonnormality in data. Therefore, the robust maximum likelihood (RML) estimation method was used [65]. The lowest value was 5, and the highest value was 20. This finding revealed that degree of freedom (Df) had a positive value and was more likely to be an over-identified model. In addition, the normed-chi-square values for measurement model constructs were in the acceptable range as recommended by previous studies [66,67]. This is indicative of a good fit of the model to the data.
Table 11 presents the reliability scores for the six constructs. The lowest Cronbach Alpha was 0.951 and the highest was 0.977. The lowest Rho coefficient was 0.951 and the highest was 0.977. According to [68,69], the reliability coefficient cutoff value for confirmatory studies should be 0.70. Both values were above the minimum of 0.70 and showed a high level of internal consistency and reliability scores.
All parameter estimates for constructs stabilized in fewer than 7 iterations, indicating no convergence problems. The fit indices of Normed-chi-square (Chiq/Df), Comparative fit index (CFI), Standardized Root Mean Square Residual (SRMR), Root Mean-Squared-Error of Approximation (RMSEA), and Mcdonald’s Fit Index (MFI) demonstrated an acceptable fit of the measurement model for all constructs. Most of the fit indices were within the cutoff values, as suggested by previous studies [65,66,70,71,72]. The results indicated that there was no need to modify the measurement model before it could be included in the full path analysis model. It was concluded the measurement models had adequately fit the sample data.

3.2. Path Analysis Results

The six-factor model was fitted to the data using the RML method of the EQS Path analysis model and was analyzed using EQS 6.4 software for SEM and the model converged. The number of cases that were analyzed for the path analysis model was 213 from a sample of 257. A total of 44 cases were not used because of missing data. The model had 2 dependent variables and 6 independent variables. The number of free parameters was 17, and the number of fixed non-zero parameters was 2. Mardia‘s coefficient number for the path model was 61.4714. The sample data on the path model produce the Satorra–Bentler Scaled Chi-Square (S − Bχ2) of 17.6235 with 4 Df. This finding revealed that Df had a positive value and was more likely to be an over-identified model. The chi-square was significant, with a probability value of less than 0.00146. This finding suggested that the difference between the hypothesized model and the sample data was significant. Since the chi-square test is usually affected by the sample size, some authors advocate for a normed chi-square [67]. The sample size used in the study was 213. A normed chi-square is achieved by dividing the chi-square by the Df. Researchers recommend the normed-chi-square values be between 2.0 and 5.0 [66] or up to 3.0 or even 5.0 [67]. The result was found to be 4.405. This figure was within the recommended values of 2.0 to 5.0. This is indicative of a good fit of the model to the data.
CFI was found to be 0.953, RMSEA was found to be 0.113, and MFI was found to be 0.969. This value for RMSEA is 0.113, with a 90% confidence interval (CI) 0.070–0.189. SRMR was found to be 0.048 indicative of a good fit of the model to the data. The fit indexes presented in Table 12 illustrated that the path model had a good fit for the sample data. Fit indices of Df, Chiq/DF, CFI, SRMR, and MFI demonstrated a good fit of the path model, even though the RMSEA did not meet the cutoff values but was within the acceptable range.
Having assessed the goodness of fit of the path analysis model, the next step involves inspection of the statistical significance of the parameter estimates, standard errors, and test statistics. According to [74], path analysis is capable of providing estimates of the magnitude and significance of the relationships among sets of variables. Furthermore, parameter estimates regarding the magnitude, signs, and statistical significance are used for the rejection of the hypothesis [70,75]. According to [73,76], the test statistics have to be greater than 1.96 based on the probability level of 5% before the hypothesis can be rejected. The test statistics reported were the parameter estimate divided by its standard error, and therefore, they function as a Z-statistic to test that the estimate is statistically different from zero [70,76]. This test was used to evaluate the hypotheses.
It was hypothesized that mutuality, trust, and institutional support had a direct positive influence on CHSA collaboration. The path analysis results provided no support for mutuality, trust, or institutional support. The hypothesized relationships between exogenous variables and endogenous variables were found to be statistically insignificant. Table 13 presents the correlation values, standard errors, and test statistics. Table 13 and Table 14 indicated that the test statistics for mutuality and enabling environment, trust and personal characteristics, and institutional support were less than 1.96 (p < 0.05). This suggests that mutuality, trust, and institutional support did not largely predict CHSA collaboration, hence they were not statistically significant. Therefore, the hypotheses that mutuality, trust, and institutional support have a direct positive influence on CHSA collaboration were rejected. It is clear from the findings that mutuality, trust, and institutional support were making some contributions to predicting CHSA collaboration, but their contributions based on RML were statistically insignificant. However, using maximum likelihood (ML), the influence of these factors was found to be statistically significant. It can be suggested that the three factors’ direct influence is statistically insignificant, but they can indirectly influence CHSA collaboration. Hence, it is suggested that these factors can be the determinants of CHSA collaboration on construction projects. This finding was surprising since previous studies by [35,37,41] found that mutuality, trust, and institutional support contributed to collaboration. Although the influence of these factors was insignificant, previous studies suggested that trust, mutuality, and institutional support influence collaboration [36,44,77]. The contradictory findings can be explained by the fact that past studies tested mutuality, trust, and institutional support as key factors for collaboration but not for CHSA collaboration. There is no evidence that previous studies evaluated the influence of mutuality, trust, and institutional support on CHSA collaboration. On the other hand, it was hypothesized that project context and a common purpose had a direct positive influence on CHSA collaboration. Path analysis results provided support for the project context and common purpose. The hypothesized relationships between exogenous variables and endogenous variables were found to be statistically significant. The relationship between project context, common purpose, and CHSA collaboration was found to be significant. Table 13 and Table 14 indicated that the test statistics for project context and common purpose were greater than 1.96 (p < 0.05) and the sign was appropriate with a positive value. Therefore, the hypothesis that project context and common purpose has a direct positive influence on CHSA collaboration could not be rejected. It is clear from the findings that project context and the common purpose factor made significant contributions to predicting CHSA collaboration. Using ML and RML, the influence of this factor was found to be statistically significant. In addition, the results revealed that for every one unit that project context and common purpose increased, the CHSA collaboration increased by 0.718 units. This supports the observations made by Roberts et al. [41] (2016), who identified common purpose as one of the five factors influencing collaboration. This finding is further supported by [34,78], who found that project vision and common purpose had a positive influence on collaboration. It is further suggested that project context and the common purpose factor are significant determinants of CHSA collaboration. It is imperative for project actors to focus on this factor for better CHSA collaboration. It is clear from the findings that variables such as project team members’ commitment to the project vision, clear project roles, clearly defined objectives, two-way communication, project structure promoting relationships between the CHSA and project team members, sharing project knowledge with the CHSA, working with the CHSA to deal with the complexity of the project, and the CHSA working with other project team members to achieve a zero accidents goal significantly influence CHSA collaboration on construction projects.
On the other hand, it was hypothesized that CHSA collaboration had a direct positive influence on H&S performance. Path analysis results provided support for the CHSA collaboration. The relationship between CHSA collaboration and H&S performance was found to be statistically significant. Table 13 and Table 14 indicated that the test statistics for CHSA collaboration were greater than 1.96 (p < 0.05) and the sign was appropriate with a positive value. Therefore, the hypothesis that CHSA collaboration has a direct positive influence on H&S performance could not be rejected. It is clear from the findings that the CHSA collaboration factor was making significant contributions to predicting H&S performance. Using ML and RML, the influence of this factor was found to be statistically significant. In addition, the results revealed that for every one unit that CHSA collaboration increased, H&S performance increased by 0.738 units. The finding that CHSA collaboration is significant in improving H&S performance is highlighted by [7], who indicates that collaboration can help persons managing H&S to influence H&S performance. References [3,27,28,30] emphasized the importance of these professionals in improving H&S performance. On the other hand, this finding supported previous studies that identified collaboration as an essential requirement for H&S performance improvements [3,9,79]. It is imperative for project actors to increase CHSA collaboration for a better H&S performance. There is no evidence that previous studies evaluated the influence of CHSA collaboration on H&S performance. The current finding provided a list of minimum actions to be implemented for those aiming to improve H&S performance on construction projects. It is clear from the findings that variables such as participative decision making, fair distribution of roles, regular meetings, a collaborative spirit, alignment of contributions, integration of skills and knowledge, conflict resolution mechanisms, and top management support significantly influence H&S performance on construction projects.
The values in parentheses are for RML.

3.3. Path Analysis Model

The standardized equation for the path analysis model is:
CHSA collaboration = 0.104 mutuality + 0.107 trust + 0.088 institutional support + 0.689 project context and common purpose.
H&S performance = 0.882 CHSA collaboration
A total of 85% of the variance in CHSA collaboration is explained by mutuality, trust, institutional support, and project context and common purpose. A total of 68% of the variance in H&S performance is explained by CHSA collaboration. Figure 4 below is created by the authors.

4. Conclusions

The current study argues that CHSA influence is unlikely without collaboration and that better H&S performance is unlikely without CHSA collaboration. The findings of the literature review and Delphi study were used to develop a conceptual model. The Delphi study confirmed that all seven factors (trust, mutuality, common purpose, enabling environment, personal characteristics, institutional support, and project context) should be considered in determining CHSA collaboration and that CHSA collaboration should be considered in improving H&S performance. The model hypothesized that collaboration had an influence on CHSA and that CHSA collaboration had an influence on H&S performance. EFA was used to assess the unidimensionality and reliability of the constructs, and six main constructs were retained. A CFA of SEM using EQS 6.4 was used to assess the measurement model for each construct. The fit statistics for each construct had an acceptable fit to the sample data.
The path model was analyzed using EQS. The fit statistics for the path model had an acceptable fit to the sample data. Of the five hypotheses tested, two were significant. Project context and common purpose had a significant influence on CHSA collaboration, while other three factors, namely mutuality, trust, and institutional support, had a weaker influence. Finally, CHSA collaboration had a significant influence on H&S performance. The study revealed that the influence of CHSA on the project is unlikely without collaboration and that better H&S performance is unlikely without CHSA collaboration. The study provided a list of actions to implement in order to improve CHSA collaboration and H&S performance. All the H&S experts and respondents to the questionnaire had relevant knowledge and experience; hence, the findings have both theoretical and practical value. The study recommends validation of the current model in other countries. The study’s implication is that in order to improve H&S performance, clients, designers, and contractors may not limit the participation of CHSA on the project. The implication for the CI is that by promoting CHSA collaboration, the likelihood of CHSA influence could increase and H&S performance could improve on construction projects. The study revealed that collaboration should be considered for improving H&S performance. The study is limited to respondents who met the selection criteria to participate in the Delphi study and those who had access to SACPCMP to participate in the questionnaire survey; any registered persons who did not receive regular communications and announcements would not have participated. Despite the requirements of the South African Construction Regulations 2014 that CHSA should be part of the construction project team, more studies should be conducted to investigate the CHSA level of involvement on the project.

Author Contributions

N.P.R. developed literature review, conceptualization, methodology, collected and analyzed the data, and wrote the manuscript. I.M. and J.A. provided supervision and guidance in ensuring the manuscript contributes to the body knowledge. All authors have read and agreed to the published version of the manuscript.

Funding

This research is funded and part of collaborative research efforts at the Center of Applied Research and Innovation in the Built Environment (CARINBE).

Institutional Review Board Statement

I received a clearance certificate for conducting this study from the University of Johannesburg. This study was conducted in accordance with the Faculty of Engineering and Built Environment (FEBE) Ethics and Plagiarism Committee (FEPC) of the University of Johannesburg (protocol code UJ-FEBE-FEPC-0026 and 18 March 2021).

Informed Consent Statement

Informed consent was obtained from all subjects involved in this study.

Data Availability Statement

The data supporting the reported results can be received upon reasonable request, in accordance with the data policy of the University of Johannesburg and the prevailing legislation on data sharing.

Acknowledgments

The authors wish to acknowledge the University of Johannesburg for the resources used to conduct this study (library resources, Microsoft Excel, SPPS, and EQS).

Conflicts of Interest

The authors declare no potential conflict of interest.

References

  1. Neale, R. Ten factors to improve occupational safety and health in construction projects. Afr. Newsl. Occup. Health Saf. 2013, 23, 52–54. [Google Scholar]
  2. Goldswain, C.C. Architectural Design Interventions toward Improvement of Construction Health, Safety and Ergonomics in South Africa. Ph.D. Thesis, Nelson Mandela Metropolitan University, Gqeberha, South Africa, 2014. [Google Scholar]
  3. Deacon, C. The Effect of the Integration of Design, Procurement, and Construction Relative to Health and Safety. Unpublished. Ph.D. Thesis, Nelson Mandela University, Port Elizabeth, South Africa, 2016. [Google Scholar]
  4. Health and Safety Executive. Managing Health and Safety in Construction: Construction: (Design and Management) Regulations 2015. Guidance on Regulations; HSE Books: London, UK, 2015. [Google Scholar]
  5. Benjaoran, V.; Bhokha, S. An integrated safety management with construction management using 4D CAD model. J. Saf. Sci. 2010, 48, 395–403. [Google Scholar] [CrossRef]
  6. Larsson, T.J.; Almen, L. Health and safety coordinators in building projects. Built Environ. Proj. Asset Manag. 2014, 4, 251–263. [Google Scholar]
  7. Erickson, A.J. Interdisciplinary: Increasing safety performance. Prof. Safety. Peer-Rev. 2016, 61, 26–32. [Google Scholar]
  8. Qi, J. Integration of Construction Worker Fall Safety in Design through the Use of Building Information Modelling. Unpublished. Ph.D. Thesis, University of Florida, Gainsville, FL, USA, 2011. [Google Scholar]
  9. Atkinson, A.; Westall, R. The relationship between integrated design and construction and safety on construction projects. Constr. Manag. Econ. 2010, 28, 1007–1017. [Google Scholar] [CrossRef]
  10. Emuze, F.; Smallwood, J.J. Collaborative working in South African construction: Contractors’ perspectives. J. Eng. Des. Technol. 2014, 12, 294–306. [Google Scholar] [CrossRef]
  11. SACPCMP (South African Council for Project and Construction Management Professions). Registration Rules for Construction Health and Safety Agents in Terms of Section 18 (1) c of the Project and Construction Management Professions Act, Act No. 48 of 2000; SACPCMP: Midrand, South Africa, 2013. [Google Scholar]
  12. Manu, P.; Emuze, F.; Saurin, T.A.; Hadikusumo, B. Construction Health and Safety in Developing Countries, 1st ed.; Routledge Taylor & Francis Group: New York, NY, USA, 2020; ISBN 978-1-138-31707-9. [Google Scholar]
  13. Department of Public Works. Construction Regulations Launch: Address by the Minister of Public Works; Department of Public Works: Boksburg, South Africa, 2014.
  14. Rantsatsi, N.; Musonda, I.; Agumba, J. Factors that determine construction health and safety agent collaboration on construction projects: A Delphi study. Acta Structilia 2021, 28, 53–77. [Google Scholar] [CrossRef]
  15. Khoza, D.J. Development of a Client-Driven Health and Safety Model for Measuring Health and Safety Performance of Construction Projects in South Africa. Ph.D. Thesis, Unversity of KwaZulu-Natal, Durban, South Africa, 2020. [Google Scholar]
  16. Smallwood, J.J.; Deacon, C. The performance of construction health and safety agents. In Proceedings of the Ninth International Structural Engineering and Construction Conference (ISEC9), Valencia, Spain, 24–28 July 2017. [Google Scholar]
  17. Badri, A.; Gbodossou, A.; Nadeau, S. Occupational health and safety risks: Towards the integration into project management. J. Saf. Sci. 2012, 50, 190–198. [Google Scholar] [CrossRef]
  18. Chunxiang, W. Safety Responsibilities for Owner and Example in Public Works. In Procedia Engineering International Symposium on Safety Science and Engineering in China, 2012 (ISSSE-2012); Elsevier: Amsterdam, The Netherlands, 2012; Volume 43, pp. 523–527. [Google Scholar]
  19. Rantsatsi, N.; Musonda, I.; Agumba, J. Identifying factors of collaboration critical for improving health and safety performance in construction projects: A systematic literature review. Acta Structilia 2020, 27, 120–150. [Google Scholar]
  20. Sinelnikov, S.; Inouye, J.; Kerper, S. Using leading indicators to measure occupational health and safety performance. Saf. Sci. J. 2015, 72, 240–248. [Google Scholar] [CrossRef]
  21. Rajendran, S. Sustainable construction safety and health rating system. Civil construction and environmental engineering. Ph.D. Thesis, Oregon State University, Corvallis, OR, USA, 2006. [Google Scholar]
  22. Aulin, R.; Capone, P. The role of health and safety coordinator in Sweden and Italy construction industry. In Proceedings of the W099—Special Track 18th CIB World Building Congress, Salford, UK, 10–13 May 2010; pp. 93–106, CIB Publication 357. [Google Scholar]
  23. Lingard, H.; Cooke, T.; Blismas, N.N. Who is ‘The Designer’ in Construction Occupational Health and Safety?, Proceedings of the 27th Annual ARCOM Conference, Bristol, UK, 5–7 September 2011; Egbu, C., Lou, E.C.W., Eds.; Association of Researchers in Construction Management: Reading, UK, 2011; pp. 299–308. [Google Scholar]
  24. Skeepers, N. Safety Leadership and Management in the Construction Industry in Gauteng Province, South Africa. Ph.D. Thesis, University of Johannesburg, Johannesburg, South Africa, 2016. [Google Scholar]
  25. Kukoyi, P.O. A Framework for Improving Construction Workers’ Health and Safety Practices in Lagos, Nigeria. Ph.D. Thesis, Nelson Mandela University, Gqeberha, South Africa, 2018. [Google Scholar]
  26. Samuel, L. Labour on Injuries and Fatalities in SA Construction Sector. 2017. Available online: https://www.gov.za/speeches/sa-construction-sector-9-mar-2017-0000 (accessed on 31 October 2018).
  27. Smith, A.P.; Wadsworth, E.J. Safety Culture, Advice and Performance: The Associations Between Safety Culture and Safety Performance, Health and Wellbeing at an Individual Level, and Safety Culture, Competent Occupational Safety and Health Advice, and Safety Performance at a Corporate Level; Cardiff University: Cardiff, UK, 2009. [Google Scholar]
  28. Rebbitt, D. The Value Proposition of Safety Professional: Do Safety Professionals Actually Reduce Fatalities? Master’s Thesis, Athabasca University, Athabasca, AB, Canada, 2012. [Google Scholar]
  29. Cameron, I.; Hare, B.; Duff, R. An analysis of safety advisors roles and site safety performance. Eng. Constr. Archit. Manag. 2013, 20, 505–521. [Google Scholar] [CrossRef]
  30. Borys, D. The Value Proposition for the Occupational Health and Safety Professional: Literature Review; International Network of Safety & Health Practitioner Organisations (INSHPO): Park Ridge, IL, USA, 2014. [Google Scholar]
  31. Provan, D.J.; Dekker, S.W.A.; Rae, A.J. Bureaucracy, influence and beliefs: A literature review of the factors shaping the role of a safety professional. J. Saf. Sci. 2017, 98, 98–112. [Google Scholar] [CrossRef]
  32. Bemelmans, J.; Voordijk, H.; Vos, B. Supplier-contractor collaboration in the construction industry: A taxonomic approach to the literature of 2000–2009. Eng. Constr. Archit. Manag. 2012, 19, 342–368. [Google Scholar] [CrossRef]
  33. Deep, S.; Gajendran, T.; Jefferies, M. A systematic review of ‘enablers of collaboration’ among the participants in construction projects. Int. J. Constr. Manag. 2019, 21, 919–931. [Google Scholar] [CrossRef]
  34. Faris, H.; Gaterell, M.; Hutchinson, D. Investigating underlying factors of collaboration for construction projects in emerging economies using exploratory factor analysis. Int. J. Constr. Manag. 2019, 22, 514–526. [Google Scholar] [CrossRef]
  35. Thomson, A.M.; Perry, J.; Miller, T. Conceptualizing and measuring collaboration. J. Public Adm. Res. Theory 2009, 19, 23–56. [Google Scholar] [CrossRef]
  36. Amabile, T.M.; Patterson, C.; Mueller, J.; Wojcik, T.; Kramer, S.J.; Odomirok, P.W.; Marsh, M. Academic-practitioner collaboration in management research: A case of cross-profession collaboration. Acad. Manag. J. 2001, 44, 418–431. [Google Scholar] [CrossRef]
  37. Lu, W.; Zhang, D.; Rowlinson, S. BIM Collaboration: A Conceptual Model and Its Characteristics, Proceedings of the 29th Annual Association of Researchers in Construction Management (ARCOM) Conference, Reading, UK, 2–4 September 2013; Smith, S.D., Ahiaga-Dagbui, D.D., Eds.; Association of Researchers in Construction Management: Reading, UK, 2013; pp. 25–34. [Google Scholar]
  38. Bronstein, R.L. A Model for Interdisciplinary Collaboration Author(s): Laura, R. Bronstein Source. Soc. Work. 2003, 48, 297–306. [Google Scholar] [CrossRef]
  39. Patel, H.; Pettitt, M.; Wilson, J. Factors of collaborative working: A framework for a collaboration model. J. Appl. Ergon. 2012, 43, 1–26. [Google Scholar] [CrossRef]
  40. Torneman, C. Collaboration in Construction Project Delivery: Strategic Implications Technical Consultancy Firms. Unpublished. Master’s Thesis, Chalmers University of Technology, Gothenburg, Sweden, 2015. [Google Scholar]
  41. Roberts, D.; Van Wyk, R.; Dhanpat, N. Exploring Practices for Effective Collaboration. In Proceedings of the 28th Annual Conference of the Southern African Institute of Management Scientists, Johannesburg, South Africa, 26–28 September 2016; pp. 1–13, ISBN 978-0-620-71797-7. [Google Scholar]
  42. Ylitalo, J.; Eerikki, M.; Ziegler, K. Evolvement of trust and mutuality in early stages of interorganisational collaboration. Front. E-Bus. Res. 2004, 9, 546–560. [Google Scholar]
  43. Liu, Y.; Van Nederveen, S.; Hertogh, M. Understanding effects of BIM on collaborative design and construction. An empirical study in China. Int. J. Proj. Manag. 2017, 35, 686–698. [Google Scholar] [CrossRef]
  44. Khalfan, M.M.A.; McDermott, P.; Swan, W. Building trust in construction projects. J. Supply Chain. Manag. 2007, 12, 385–391. [Google Scholar] [CrossRef]
  45. D’Amour, D.; Ferrada-Videla, M.; Rodriquez, L.; Beaulieu, M. The conceptual basis for interprofessional collaboration: Core concepts and theoretical frameworks. J. Interprofessional Care 2005, 19, 118–206. [Google Scholar] [CrossRef] [PubMed]
  46. Dietrich, P.; Eskerod, P.; Dalcher, D.; Sandhawalia, B. The dynamics of collaboration in multi-partner projects. Proj. Manag. J. 2010, 41, 59–78. [Google Scholar] [CrossRef]
  47. Hasanzadeha, M.S.; Hosseinalipourb, M.; Hafezi, M. Collaborative procurement in construction Coordinating collaboration in contractually different complex construction projects. Procedia Soc. Behav. Sci. 2014, 20, 811–818. [Google Scholar]
  48. Hughes, D. Development of an Effective Model for Collaboration within the UK Construction Industry. Unpublished. Ph.D. Thesis, University of South Wales, Cardiff, UK, 2018. [Google Scholar]
  49. Akintan, O.; Morledge, R. Improving the collaboration between main contractors and subcontractors within traditional construction procurement. J. Constr. Eng. 2013, 2013, 281236. [Google Scholar] [CrossRef]
  50. Masemeni, N.M.; Aigbavboa, C.O.; Thwala, D.W. Evaluating Barriers of Collaboration in South Africa Construction Supply Chain; SACQSP2015-20; University of Johannesburg: Johannesburg, South Africa, 2015. [Google Scholar]
  51. Fulford, R.; Standing, C. Construction industry productivity and the potential for collaborative practice. Int. J. Proj. Manag. 2014, 32, 315–326. [Google Scholar] [CrossRef]
  52. Greenwood, D.; Wu, S. Establishing the association between collaborative working and construction project performance based on client and contractor perceptions. Constr. Manag. Econ. 2012, 30, 299–308. [Google Scholar] [CrossRef]
  53. Pal, R.; Wang, P.; Liang, X. The critical factors in managing relationships in international engineering, procurement and construction (IEPC) projects of Chinese organisations. Int. J. Proj. Manag. 2017, 35, 1225–1237. [Google Scholar] [CrossRef]
  54. Saifullah, N.M.; Ismail, F. Integration of occupational safety and health during preconstruction stage in Malaysia. Procedia Soc. Behav. Sci. 2012, 35, 603–610. [Google Scholar] [CrossRef]
  55. Mroszczyk, J.W. Improving construction safety: A Team Effort. Prof. Saf. 2015, 60, 55–68. Available online: www.asse.org (accessed on 27 August 2019).
  56. El-Sheikh, A.A.; Abonazel, M.R.; Gamil, N. A review of software packages for structural equation modeling: A comparative study. Appl. Math. Phys. 2017, 5, 85–94. [Google Scholar]
  57. Ozturk, G.; Arditi, D.; Yitmen, I.; Yalcinkaya, M. The factors affecting collaborative building design. World multidisciplinary civil engineering-architecture-urban planning symposium 2016 (WMCAUS 2016). Procedia Eng. 2016, 161, 797–803. [Google Scholar] [CrossRef]
  58. Welman, C.; Kruger, F.; Mitchell, B. Research Methodology, 3rd ed.; Oxford University Press: Cape Town, South Africa, 2005. [Google Scholar]
  59. Changi, H.K.; Karen, Y. Beyond consensus: A review of Delphi research published in Malaysian social science journals. Int. J. Bus. Soc. 2018, 19, 312–323. [Google Scholar]
  60. Von der Gracht, H. Consensus measurement in Delphi studies Re-opinion and implications for future quality assurance. Technol. Forecast. Soc. Change 2012, 79, 1525–1536. [Google Scholar] [CrossRef]
  61. Habibi, A.; Sarafrazi, A.; Izadyar, S. Delphi technique theoretical framework in qualitative research. Int. J. Eng. Sci. 2014, 3, 8–13. [Google Scholar]
  62. Costello, A.; Osborne, J. Best practices in exploratory factor analysis: Four recommendations for getting the most from your analysis. Pract. Assess. Res. Eval. 2005, 10, 7. [Google Scholar]
  63. Pallant, J. Survival Manual. A Step by Step Guide to Data Analysis Using SPSS for Windows, 3rd ed.; McGraw-Hill Companies, Inc.: New York, NY, USA, 2007; ISBN lO:0-335-22366-4. [Google Scholar]
  64. Farrington, M.F. Sibling Partnerships in South African Small and Medium-Size Family Businesses. Ph.D. Thesis, Nelson Mandela Metropolitan University, Gqeberha, South Africa, 2009. [Google Scholar]
  65. Brown, A.T. Confirmatory Factor Analysis for Applied Research; The Guilford Press: New York, NY, USA, 2006. [Google Scholar]
  66. Afthanorhan, W.A. A comparison of partial least square structural equation modeling and covariance based structural equation modeling for confirmatory factor analysis. Int. J. Eng. Sci. Innov. Eng. 2013, 2, 198–205. [Google Scholar]
  67. Kline, R.B. Principles and Practices of Structural Equation Modeling, 2nd ed.; The Guilford Press: New York, NY, USA, 2005. [Google Scholar]
  68. Lingard, H.; Pirzadeh, P.; Blismas, N.; Wakefied, R.; Kleiner, B. Exploring the link between early constructor involvement in project decision-making and the efficacy of health and safety risk control. Constr. Manag. Econ. 2014, 32, 918–931. [Google Scholar] [CrossRef]
  69. Hoque, M.; Awang, Z.; Siddiqui, A. Technopreneurial intention among university students of business courses in Malaysia: A structural equation modelling. Int. J. Entrep. Small Medium Enterp. 2017, 4, 1–16. [Google Scholar]
  70. Hu, L.; Bentler, P.M. Cutoff Criteria for Fit Indexes in Covariance Structure Analysis: Conventional Criteria Versus New Alternatives. Struct. Equ. Model. 1999, 6, 1–55. [Google Scholar] [CrossRef]
  71. Schreiber, J.B.; Nora, A.; Stage, F.K.; Barlow, E.A.; King, J. Reporting structural equation modeling and and confirmatory factor analysis results: A Review. J. Educ. Res. 2006, 99, 323–337. [Google Scholar] [CrossRef]
  72. Awang, Z. Validating the Measurement Model: CFA. SEM Made Simple; MPWS Publisher: Bangi, Selangor, Malaysia, 2015; pp. 54–74. [Google Scholar]
  73. Bentler, P.M. EQS 6 Structural Equations Program Manual; Multivariate Software, Inc.: Encino, CA, USA, 2006; ISBN 1-885898-03-7. [Google Scholar]
  74. Stage, K.F.; Carter, C.H.; Nora, A. Path Analysis: An Introduction and Analysis of a Decade of Research. J. Educ. Res. 2004, 98, 5–13. [Google Scholar] [CrossRef]
  75. Raykov, T.; Marcoulides, G. A First Course in Structural Equation Modeling; Lawrence Erlbaum Associates: London, UK, 1991. [Google Scholar]
  76. Byrne, M.B. Structural Equation Modeling with AMOS: Basic Concepts, Applications and Programming, 2nd ed.; Routledge Taylor and Francis Group: London, UK, 2006. [Google Scholar]
  77. Born-Barnard, T.; Fletcher, L.; Steyn, H. Link trust and collaboration in project teams to project management success. Int. J. Manag. Proj. Bus. 2018, 11, 432–457. [Google Scholar] [CrossRef]
  78. Iyer, R.V. Engaging a Multi-Disciplinary Literature Review in the Development of a Framework to Assess Construction Collaboration. Master’s Thesis, Texas A&M University, College Station, TX, USA, 2015. [Google Scholar]
  79. Tau, S.; Seoke, S.Y. An assessment of the implemented occupational health and safety practices in Botswana construction industry. Afr. Newsl. Occup. Health Saf. 2013, 23, 55–58. [Google Scholar]
Figure 1. A model for improving CHSA collaboration and influence on H&S performance.
Safety 09 00008 g001
Figure 2. Scree plot for factors influencing construction health and safety agent collaboration.
Safety 09 00008 g002
Figure 3. Scree plot for construction health and safety agent collaboration and health and safety performance factor analysis.
Safety 09 00008 g003
Figure 4. A model for improving construction health and safety agent collaboration and influence on health and safety performance.
Safety 09 00008 g004
Table 1. Experts’ profiles.
DemographicCharacteristicFrequency Percentage
CountrySouth Africa964.28%
United Kingdom17.14%
Nigeria214.28%
Malaysia17.14%
United States of America17.14%
Total14100.00%
QualificationPhD642.85%
Master of Science Degree214.28%
Bachelor’s Degree428.57%
National Diploma214.28%
Total14100.00%
Professional registrationConstruction project managers214.28%
CHSAs750%
Construction managers214.28%
Engineer17.14%
Construction health and safety manager17.14%
Certified safety professional17.14%
Total14100.00%
Years of experience1–5321.42%
6–10321.42%
11–1517.14%
16–2017.14%
21–25214.28
26–30214.28
31–40214.28
Total 14100.00%
Table 2. Panel members’ publication histories.
Expert Publication Number of Publications
Peer-reviewed journals 353
Peer-reviewed conference papers201
Editor or author of book 10
Author of a book chapter 8
Table 3. Respondents’ profile.
Position Frequency Percentage
Construction project manager5023.5
CHSA6128.6
Construction manager3717.4
Construction H&S manager6128.6
Other41.9
Total213100
Professions
Construction project management5123.9
Construction H&S management12156.8
Construction management4018.8
Other10.5
Total213100
Professional registration
Construction project manager5525.8
CHSA11654.5
Construction manager3918.3
Other31.4
213100
Highest qualification
Doctorate Degree 20.9
Master’s Degree 2210.3
Honors Degree 198.9
B-Tech Degree/BSc 5626.3
National Diploma 9042.3
Certificate 136.1
Matric104.7
Less than matric 10.5
Total 213100
Years of experience
0–200.0
2–583.8
6–105224.4
11–156831.9
16–203114.6
20 years and over 5425.3
Organization type
Client 6128.6
Construction health and safety consulting 5324.9
Designer 209.4
Contractor 7937.1
Total 213100
Method
Design-bid-build 3717.4
Design and build 8037.6
Integrated project delivery 8339.0
Other 136.1
Total 213100
Province
Eastern Cape 198.9
Free State 178.0
Gauteng7535.2
KwaZulu Natal 198.9
Limpopo 219.9
Mpumalanga 2712.7
North West 83.8
Northern Cape 104.7
Western Cape 178.0
Total 213100
Department responsible for health and safety
Engineering department 136.1
H&S department17180.3
Construction department 2511.7
Other 41.9
Total 213100
Table 4. KMO and Bartlett’s test.
Kaiser–Meyer–Olkin Measure of Sampling Adequacy.0.954
Bartlett’s Test of SphericityApprox. Chi-Square 13,285.276
df990
Sig.0.000
Table 5. Rotated factor matrix.
Factor
1
M5 Project knowledge that benefit other members was shared with the CHSA 0.785
M4 Responsibilities for project activities were shared with the CHSA 0.754
M2 The CHSA was involved in decision making with other project team members0.711
EE3 Leadership was shared between the CHSA and project team members0.690
M1 Project Information was shared with the CHSA0.681
EE2 Project team members communicated frequently with the CHSA0.543
Factor
2
T2 I trusted that the CHSA would fulfil their obligations 0.799
T3 I trusted the CHSA based on previous interactions and experience 0.794
T6 I trusted the role of CHSA 0.785
PCS2 The CHSA respected the inputs of other project team members 0.778
PCS1 The CHSA was willing to work with other project team members 0.753
T5 I trusted the CHSA based on their professional registration 0.692
T4 I trusted the CHSA based on their education background 0.670
PCS3 The CHSA placed project interests above individual interests 0.610
PCS8 The CHSA had knowledge of the health and safety management 0.552
Factor
3
IS4 Professional bodies ensured the implementation of health and safety by communicating good health and safety practices to the CHSA 0.819
IS3 Health and safety legislation requirements were adhered to because of the professional bodies0.808
IS2 Health and safety legislation requirements were adhered to because of the department of labor 0.728
IS5 Professional bodies communicated new construction practices to the CHSA 0.656
IS1 The involvement of the CHSA was ensured because of health and safety legislation requirements0.620
Factor
4
PC6 We used a project structure that promoted good relationships between the CHSA and project team members0.707
PC3 There was two-way communication0.684
PC2 Project objectives were defined clearly 0.675
CP6 The CHSA worked with project team members to achieve a goal of zero accidents 0.670
PC7 Project knowledge was shared with the CHSA0.665
PC5 Project team members worked with the CHSA to deal with the complexity of the project0.659
PC1 Project roles were clear0.658
CP1 Project team members were committed to the project vision0.642
Factor
5
PCS7 The CHSA had knowledge of the financials and costs0.711
Extraction method: principal axis factoring. Rotation method: varimax with Kaiser normalization.
Rotation converged in 7 iterations.
Common purpose (CP), mutuality (M), trust (T), enabling environment (EE), personal characteristics (PC), institutional support (IS), and project context (PC).
Table 6. Total variance explained for factors.
Factor Initial EigenvaluesExtraction Sums of Squared Loadings
Total % of VarianceCumulative
%
Total % of Variance Cumulative %
127.55361.23061.23027.32060.71260.712
22.9766.61467.8432.7516.11366.825
32.1664.81472.6581.9234.27471.098
41.4463.21275.8701.2332.74173.839
51.2572.79478.6641.0282.28576.124
60.9412.09180.755
70.8221.82782.582
80.7011.55784.139
90.6501.44585.584
100.5571.23886.822
110.4711.04787.869
120.4551.01088.880
130.4220.93989.819
140.3690.82190.639
150.3230.71791.356
160.2880,63991.996
170.2770.61592.610
180.2580.57393.183
190.2360.52593.708
200.2260.50394.211
210.2200.48894.699
220.2060.45895.157
230.2030.45195.608
240.1880.41996.027
250,1650.36796.394
260,1560.34696.740
270,1460.32597.066
280,1320.29497.360
290,1240.27697.636
300,1120.25097.886
310,1060.23598.121
320.0950.21198.332
330.0880.19698.528
340.0820.18198.709
350.0740.16598.874
360.0730.16399.037
370.0650.14599.182
380,0610.13599.317
390.0560.12499.441
400.0540.11999.560
410.0470.10499.664
420.0450.10099.763
430.0410.09299.855
440.0340.07599.930
450.0310.070100.000
Extraction method: principal axis factoring.
Table 7. KMO and Bartlett’s test.
Kaiser–Meyer–Olkin Measure of Sampling Adequacy.0.958
Bartlett’s Test of Sphericity Approx. Chi-Square 4886.122
df120
Sig.0.000
Table 8. Rotated factor matrix.
Factor
1
HSP8 The way CHSA collaborated with project team members reduced the number of workers affected by work related injuries0.862
HSP6 The way CHSA collaborated with project team members promoted Health and safety awareness on the project0.857
HSP5 The way CHSA collaborated with project team members promoted safe work behavior 0.827
HSP4 The way CHSA collaborated with project team members led to the Integration of H&S aspects on project 0.810
HSP1 The way CHSA collaborated with project team members reduced work related injuries and accidents 0.786
HSP7 The way CHSA collaborated with project team members led to the elimination of construction hazards 0.774
HSP2 The way CHSA collaborated with project team members reduced work related illnesses and diseases 0.768
HSP3 The way CHSA collaborated with project team members led to the reduction of total cost related to accidents and injuries0.709
Factor
2
CC6 There was integration of skills and knowledge0.876
CC2 There was a fair distribution of roles between the CHSA and project team members 0.841
CC1 Participative decision making was encouraged between the CHSA and project team members0.839
CC4 Collaborative spirit existed between the CHSA and project team members 0.804
CC5 There was alignment of contributions provided by the CHSA and project team members 0.779
CC7 Conflict resolution mechanism was established0.725
CC3 The CHSA held regular meetings with project team members0.703
CC8 Top management provided support to the CHSA and project team members 0.664
Extraction method: principal axis factoring. Rotation method: varimax with Kaiser normalization
a. Rotation converged in 3 iterations.
Health and safety performance (HSP), Construction health and safety agent collaboration (CC).
Table 9. Total variance explained for factors.
Factor Initial EigenvaluesExtraction Sums of Squared Loadings
Total % of VarianceCumulative
%
Total % of Variance Cumulative %
112.21176.31976.31912.03675.22675.226
21.2597.86984.1871.0966.85382.078
30.4002.49986.687
40.3482.17688.863
50.3051.90890.770
60.2811.75692.527
70.2011.25693.783
80.1771.10694.889
90.1570.98095.868
100.1330.82996.697
110.1230.76997.467
120.1120.69998.166
130.0970.60498.770
140.0770.47999.249
150.0680.42799.676
160.0520.324100.000
Extraction method: principal axis factoring.
Table 10. Measurement model statistics on distribution and fit.
ConstructMardia’s Coefficient(S − Bχ2)DfChiq/DfCFISRMRRMSEAMFI
Mutuality 50.546221.528992.3920.9710.0330.0810.971
Trust and89.725552.1693143.7260.8500.0480.1130.914
Institutional support (IS)38.323418.948153.7890.9590.0350.1150.968
Project context and common purpose (PCP)70.630960.5622203.0280.8900.0410.0980.909
CHSA collaboration (CC)54.342035.8348201.7910.9740.0190.0610.964
H&S performance (HSP)65.950056.8808202.8440.9060.0190.0930.917
Source: author’s own construction.
Table 11. Reliability scores for six constructs.
ConstructNumber of Indicator
Variables
Cronbach’s
Alpha
Rho
Coefficient
Mutuality 60.9510.951
Trust 70.9540.954
Institutional support 50.9270.933
Project context and common purpose 80.9570.958
CHSA collaboration 80.9770.977
H&S performance 80.9740.974
Source: author’s own construction.
Table 12. Robust fit indexes for path model.
Fit Index Cut-Off Value Estimate Comment Sources
Df0≥4Acceptable [65,72]
Chiq/DfValues between 2.0 and 5.0 indicate good fit 4.405Good fit [66,72].
CFIValues equal or greater to 0.90
(acceptable fit) or equal or greater than 0.95 (good fit)
0.953Good fit [70,71]
SRMRValues equal or less than 0.50 (good fit) and equal or less than 0.80
(acceptable fit)
0.048Good fit [70,71]
RMSEAValues equal to 0.08 (acceptable fit) and values less than 0.05 (good fit)
90% confidence interval
0.113
0.070–0.189
In acceptable range[66,70,71,72]
MFI Values greater than 0.90 (good fit) and more than 1.0 (perfect fit) 0.969Good fit [65,70,73].
Source: author’s own construction.
Table 13. Path analysis parameter estimates.
Parameter Variable Estimate Standard Error T-Statistic
P5p1 Mutuality (M) influence CHSA collaboration 0.1040.046 (0.60)2.169 (1.648)
P5p2Trust (T) influence CHSA collaboration 0.1070.047 (104)2.769 (1.265)
P5p3Institutional support (IS) influence CHSA collaboration 0.0880.036 (0.48)2.254 (1.707)
P5p4Project context and common purpose (PCP) influence CHSA collaboration0.6890.061 (0.71)12.729 (10.93)
P6p5 CHSA collaboration (CC) influences H&S performance (HSP)0.8820.35 (0.62)21.000 (11.89)
Source: author’s own construction.
Table 14. Model 1.0 Factor loading and Z-statistics.
Factor Unstandardized
Coefficient
Standardized
Coefficient
Z-Statistics Significant at 5% Level?
MEE0.0990.1042.169 (1.648)No
TPC0.1320.1072.769 (1.265)No
IS0.0820.0882.254 (1.707)No
PCP0.7810.68912.729 (10.93)Yes
CC 0.7380.88221.000 (11.89)Yes
Statistical significance at 5% level.
Disclaimer/Publisher’s Note: The statements, opinions and data contained in all publications are solely those of the individual author(s) and contributor(s) and not of MDPI and/or the editor(s). MDPI and/or the editor(s) disclaim responsibility for any injury to people or property resulting from any ideas, methods, instructions or products referred to in the content.

