1. Introduction
The human desire for mobility is a key driver for innovations. The first demonstration of a self-driving vehicle was first reported nearly 40 years after the invention of the automobile by Carl Benz in 1886. The “American Wonder” by Houdina Radio Control Co. rolled out in the summer of 1925 along Broadway in New York City and was trailed by radio waves from a following car. As enthusiastic as this sounds, it ended shortly after, when the driverless vehicle crashed into another passenger-filled vehicle [
1]. Nevertheless, this small setback did not stop intensive research on this topic for the next nearly 100 years. Today, we can observe that automated systems developed from early prototypes to the first legally approved and commercially available vehicles, i.e., vehicles equipped with the “Traffic Jam Pilot” by Honda in Japan [
2,
3]. Unless a system functions fully autonomously, humans will always play a role as a part of that system, although with different roles. Therefore, it is important to consider the human factors in all fields where automation works together with human beings or vice versa. Research regarding every aspect of coexistence, cooperation, and collaboration [
4] between humans and robots provided us with valuable knowledge on its effects. In the field of aviation, where automation currently plays a bigger role than in the automotive sector, known problems for pilots include the loss of skill, a greater workload, and the reduction or loss of situation awareness [
5,
6,
7,
8]. Increasing automation allows the driver to hand over the control and engage in a non-driving related task (NDRT). These effects can then also be observed in assisted and automated vehicles when system-initiated transitions of control are required [
7]. Resulting take-over times and performance during these transition phases were intensively researched in recent years and approaches to model both can be found in [
9,
10]. All of these studies have in common that the driver is responsible to take over the driving task whenever the system reaches its boundaries. A promising approach for the next step of automated driving would be that drivers are no longer responsible for taking over and that automated systems achieve a safe condition instead.
1.1. MRMs and MRCs
As indicated above, handing over control and decoupling from the control loop allows drivers to engage in NDRTs, e.g., eating and drinking, reading, writing/tapping on the phone, etc. [
11]. A widespread taxonomy by the Society of Automobile Engineers (SAE) provides six levels of driving automation and classifies this as an automation level 3 or higher [
12]. Whenever the system triggers a take-over request, the driver of a level 3 system is mainly responsible to resolve the situation and must achieve a minimal risk condition (MRC). SAE defines an MRC as follows, whereby the abbreviations stand for automated driving system (ADS) and dynamic driving task (DDT):
“A stable, stopped condition to which a user or an ADS may bring a vehicle after performing the DDT fallback in order to reduce the risk of a crash when a given trip cannot or should not be continued.” [
12] (p. 15)
Since the latest update of the document in April 2021, the condition was more exactly specified by adding the terms stable and stopped. If the vehicle is capable to achieve this state under all circumstances within its operational design domain (ODD), i.e operating conditions of an ADS such as geographical, (traffic) environmental, and daytime conditions, it can be classified as a level 4 system. In contrast, driver action is mandatory for level 3 systems since achieving the MRC cannot be guaranteed, although it is equally possible. Furthermore, an ADS at level 4 or above may allow driver intervention during the transition process but can also be designed to even disallow it for the purpose of crash risk reduction. Even if the term is not explicitly defined in the taxonomy, a maneuver that is required to achieve an MRC either by the driver or vehicle is called a minimal risk maneuver (MRM). Examples of MRCs are a standstill on the vehicle’s own, adjacent or, if existent, shoulder lane with the respective MRMs braking and/or steering to the slower lanes. The SAE follows the same principle for transition phases with or without an automatic MRM: an alert to the passenger of a level 4 system or a request to intervene for level 3 systems, both marking the beginning of a transition phase.
In a document from the Federal Highway Research Institute of Germany (BASt) from 2012 an MRC is stated as a vehicle in standstill [
13]. The transition to this state takes place after the driver did not respond to the request to intervene in time. Corresponding maneuvers depend on the traffic situation, state of the automation system and risk. Even if the risk assessment is not further specified, the maneuver with the lower risk should be selected. Possible MRMs include braking until standstill in the vehicle’s own lane or a neighboring hard shoulder coupled with a lane change. Drivers are able to overrule and cancel an MRM at any time via the brake/gas pedal or steering wheel input or by means of a switch. This document will not be further described, since other definitions regarding automated functions or levels have been changed. Newer publications from 2017 and 2020 introduce the
Principles of Operation that allows a more precise classification of automated functions. Here, MRCs can be found under the
Principle of Operation C, which describes functions that temporarily intervene in accident-prone situations [
14,
15]. These functions can be overruled by the driver to ensure controllability. The term MRC or risk-minimal state appears for functions at level
and
in the case of an abstract hazard, when the driver does not perform according to expectations and no immediate collision is apparent. The vehicle reaches the MRC either in the short term without a full overview of the respective traffic situation (
) or fully takes over control (
). During situations with concrete hazards, functions at level
are also able to take over control and fluently transition to
or
if driver takeover remains absent. An MRC was not further specified.
The United Nations Economic Commission for Europe (UNECE) adopted the Regulation No. 157 in early 2021 which specifies Automated Lane Keeping Systems (ALKS) at an operating speed up to 60 km/h. After activation by the driver, these systems take over longitudinal and lateral control of the vehicle and perform MRMs automatically after a transition demand in the event of severe failures or absence of driver input. The desired state to be reached by the MRM is standstill unless the driver deactivates the system during this process. The latter is favored and tried to be enforced by warning cascades no later than 4 s after the start of the transition demand and triggers an MRM at least after 10 s. In contrast to emergency maneuvers, MRMs shall not decelerate any faster than 4.0 m/s
2 [
16].
According to ISO 26262, an MRM can be seen as an emergency operation that is an operating mode for providing safety as a reaction to a failure until the transition to a safe state [
17] (p. 9). The international standard names the example of a switched-off mode for a safe state. A white paper from 11 companies in the field of automotive and automated driving adopt this definition and extend it with more MRCs in addition to standstill, i.e., a takeover by the vehicle operator and a limited operation condition [
18]. This concept allows multiple MRCs along the way to the final one with corresponding MRMs, i.e., a transition demand, a limit function state (transition to the MRC “limited operation”), various stop maneuvers (comfort, safe and emergency stop), and recovery (reaching the nominal state again).
Summing up the literature, MRMs and MRCs are described from the system perspective even though drivers are assigned an important role during this process–namely primarily to overtake control even though it is not mandatory. A common MRC is a vehicle standstill either in it’s own or adjacent free lane with the respective maneuvers: lane change (if applicable) followed by braking. In combination with a driver in the vehicle that is able or even requested to take over, driver actions during transition phases should be considered in the risk assessment. The need for including the human as a factor is shown by Karakaya et al. [
19], who investigated this topic from the driver’s point of view. In this lab study, 49 participants were invited and shown videos of the first possible maneuver in five different scenarios, resulting in 14 maneuvers in total. The applied method ensured a safe and sober view on MRMs and MRCs. Participants were asked to rate the perceived risk and choose the safest maneuver within scenarios. Results show that drivers prefer different MRMs than the literature’s guidelines or regulations, i.e., evasive maneuvers over braking until standstill and more importantly overtaking maneuvers from left over right. This discrepancy of intentions could lead to a driver counteracting the automated system and was investigated further by an experiment from Karakaya and Bengler [
20]. In the experiment, 56 participants experienced transition phases with two MRMs on a three-lane highway, i.e., standstill on far right lane and one lane change to the shoulder lane coupled with a standstill. Drivers were instructed that no action was required during transition phases because of the system’s capability to perform these MRMs. Nevertheless, drivers were either allowed to intervene in the maneuver or their input was blocked. The latter was implemented by blocking any gas or brake pedal input, although the steering wheel turned according to the system’s maneuver in order to not communicate a malfunction. Despite the need for high counterforces to change the vehicle’s direction in this group, more than 50% of the participants intervened in at least one of the two MRMs. The same number of interventions in the other group was more than 70% with the favored maneuver being to overtake the obstacle from the left, in this case through the middle lane. Interventions resulted in four accidents and five dangerous situations with the following traffic in the middle lane. Main reasons for an intervention were a disagreement with the MRM strategy (67%) and a lack of trust (13%). It can be derived from both studies that the discrepancy of intentions for a maneuver between the automated system and the driver during a transition phase is not only apparent but also leads to interventions by the driver no matter the hurdles. Furthermore, these interventions can cause (near) collisions with other traffic participants and raises the question: Was the risk of an accident reduced by introducing MRMs in transition phases? Solutions could be an intervention with a hazard-free maneuver or, under the premise of a flawless MRM, no intervention at all.
1.2. Research Questions
In order to face the challenge of transition phases with MRMs, we defined the following research question for this study:
Does environmental information and an action recommendation to the driver reduce the risk of an accident or dangerous situation during a transition phase with MRMs?
Additional information to drivers during a time critical transition phase between automation levels can have positive as well as negative effects and was addressed by the following research question:
Does environmental information and an action recommendation to the driver affect their trust in automated vehicles and workload?
2. Materials and Methods
2.1. Scenarios and Transition Design
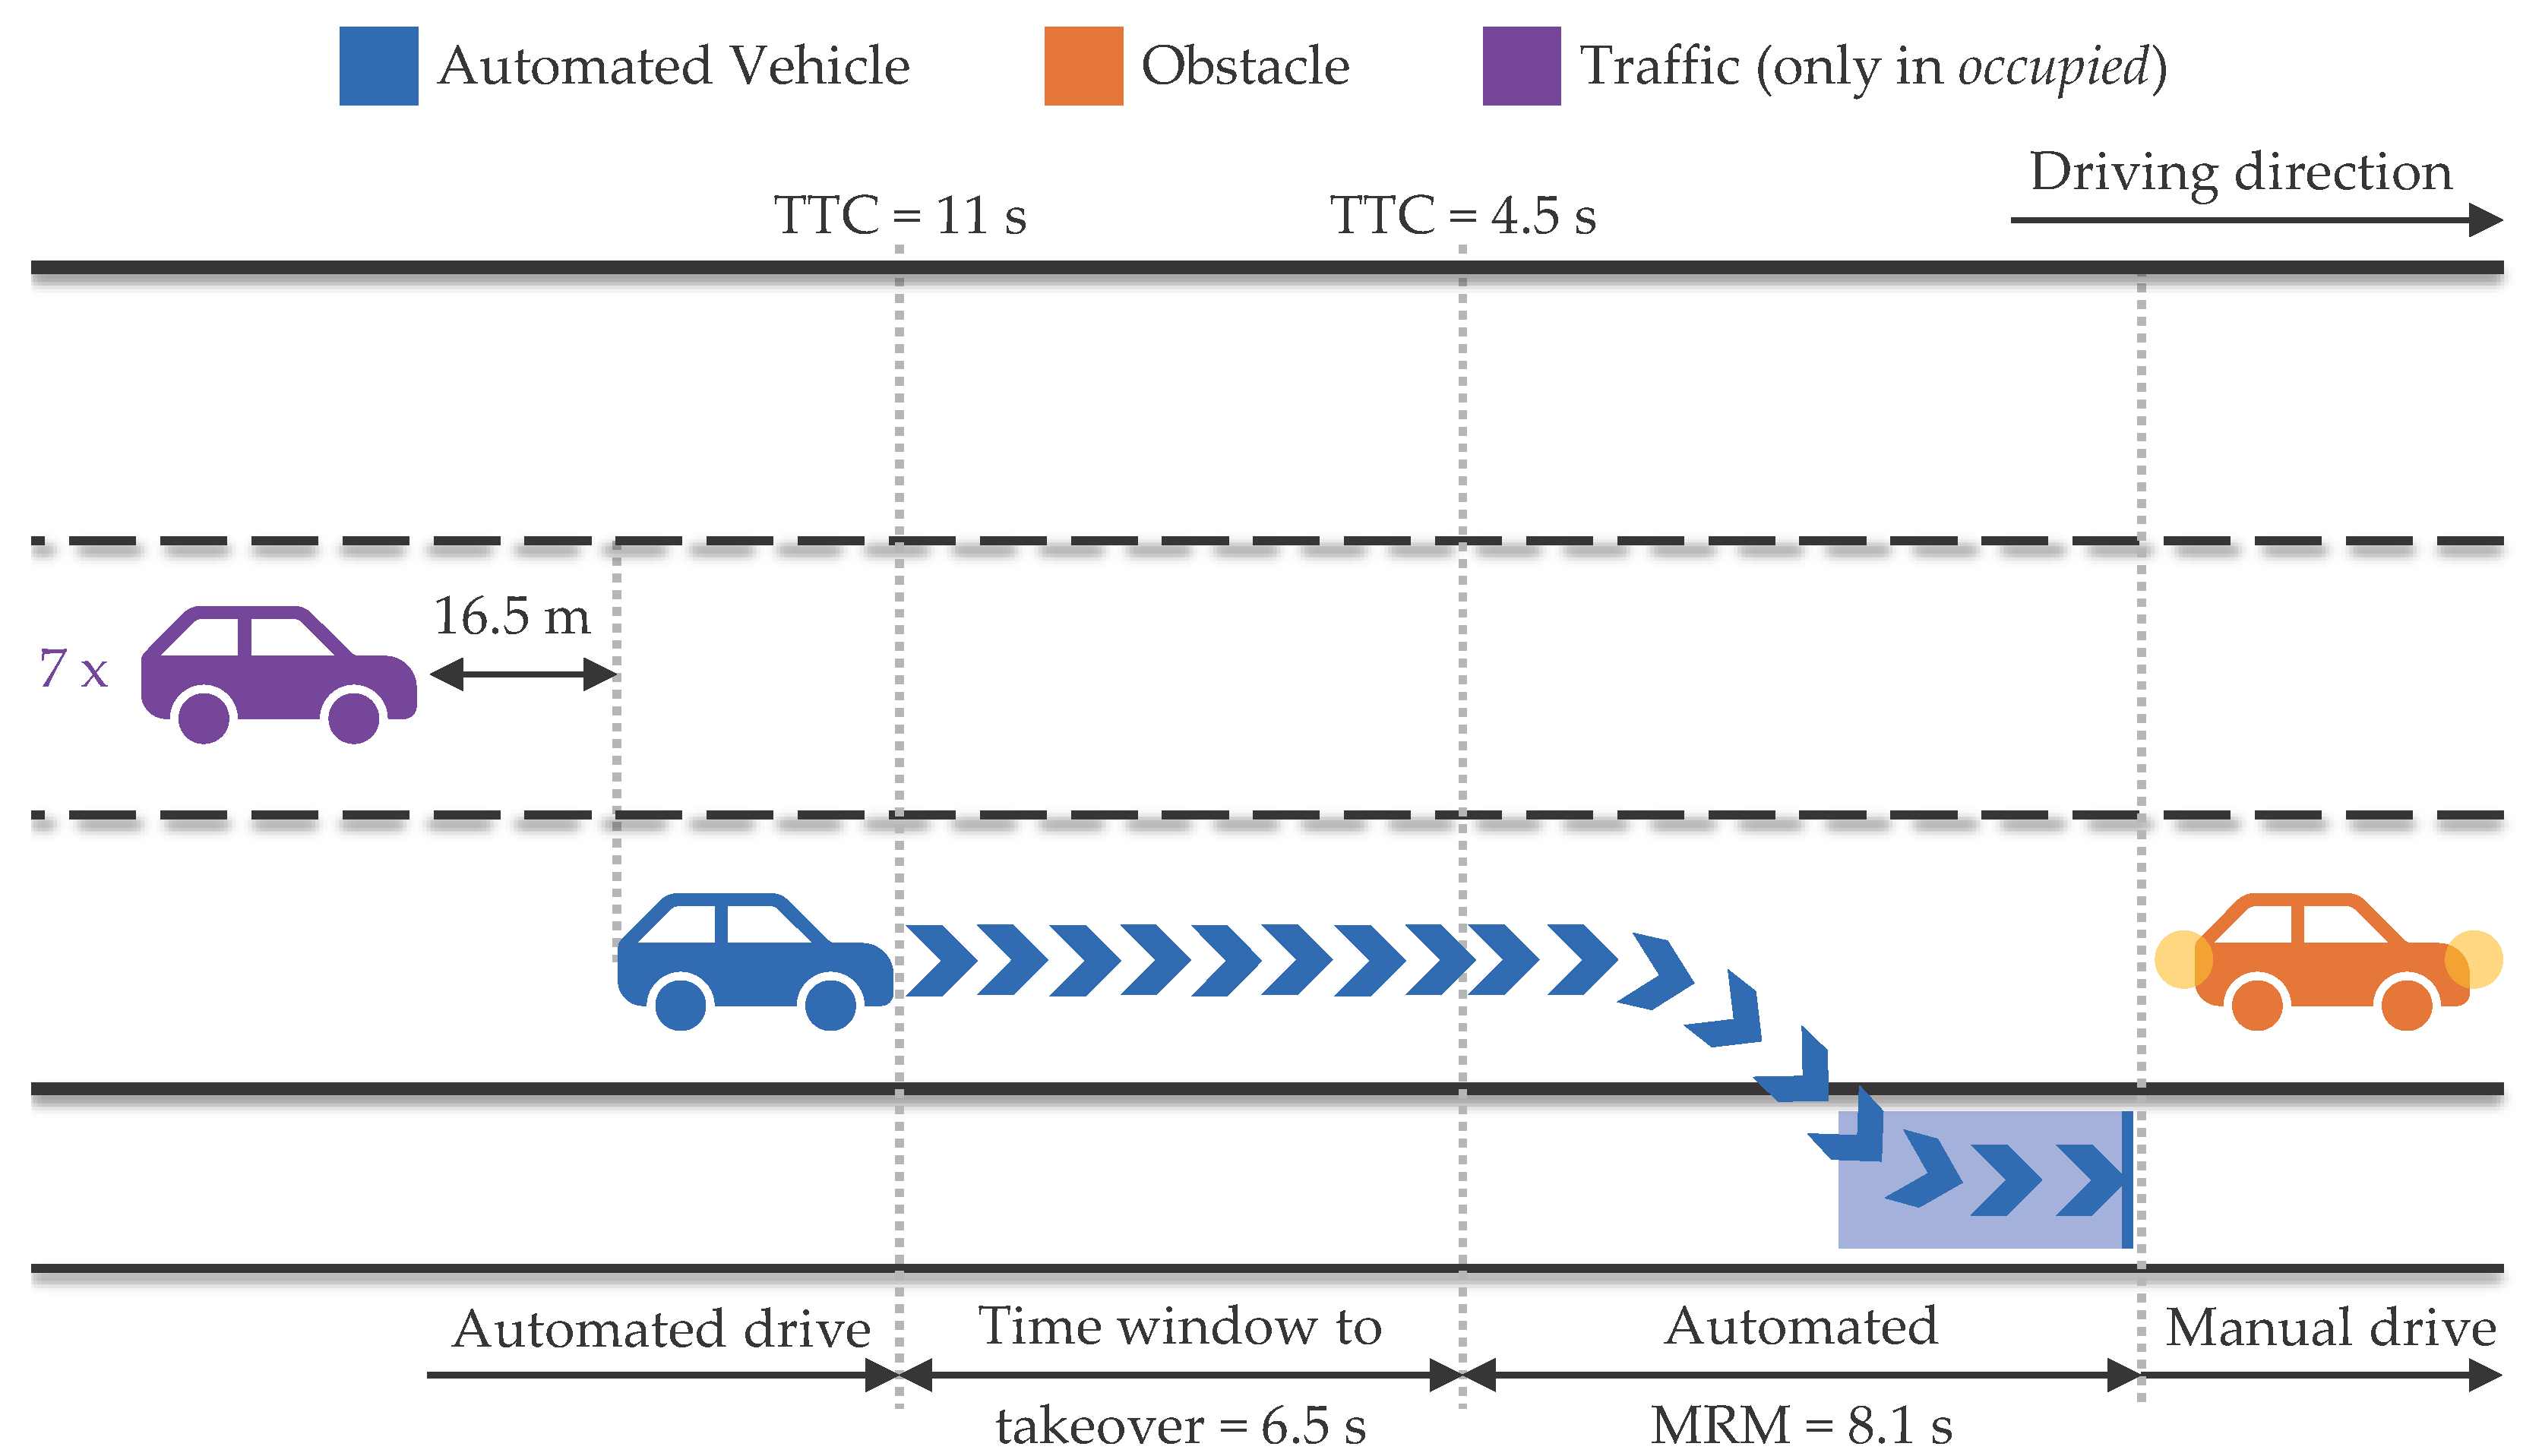
Two scenarios were implemented in the simulation that only differed in the presence of traffic in the middle lane, i.e., either with or without traffic (in the following referred to as the
occupied or
free scenarios). Both occurred on a three-lane highway with a shoulder lane while the ego vehicle was driving automated going 80 km/h in the right lane (see
Figure 1). At a TTC of 11 s, a stranded vehicle with activated hazard lights caused the transition phase and the vehicle continued driving automated for 6.5 s, giving the driver time for a voluntary take-over. Automation either continued to perform an MRM, i.e., a lane change to the shoulder lane followed by braking until standstill, or disengaged in the case of driver intervention. A brake acceleration of 6 m/s
2 was applied and resulted in a duration of 8.1 s for the MRM.
During the occupied scenario, traffic on the middle lane consisted of a convoy traveling at approximately 120 km/h and the first vehicle was located 16.5 m behind the ego vehicle. Six following vehicles had a distance of 20 m between them. The lane width was 3.75 m except for the shoulder lane, which was 2.5 m.
2.2. HMI Design and Preliminary Study
2.2.1. Theoretical Background
The underlying problem of risky transition phases and the reasons for it are described in
Section 1.1 and mainly occurs if drivers intervene in an MRM and are subsequently situated in a riskier condition than they would be if they let the ADS perform its maneuver. To prevent a risky maneuver by the driver, it is important to understand the process to this point, which can be roughly described applying the information processing model by [
21]:
sensory processing,
perception,
response selection, and
response execution. Other parts of the model, such as the system environment, which forms a closed feedback loop, the attention resources, long-term memory, working memory and cognition have their influence on this “four-stage + memory model” [
21] (p. 5). Analogous to this process, Parasuraman et al. [
22] divided automation into four classes of functions:
information acquisition,
information analysis,
decision and action selection,
action implementation. Functions of an automated system can be allocated within a category on a scale from low to high. Eriksson et al. [
23] argue that interfaces addressing these categories would score with respect to its design, e.g., providing information about the traffic situation [
24] would score high in the
information analysis category, whereas suggesting actions [
25] would score high in the
decision selection category. It is expected that the outcome of the driver’s information process, i.e.,
response execution, benefits from previously provided and well-designed information via the human machine interface (HMI) [
25,
26,
27,
28].
The focus of this study is an investigation from the driver’s perspective, i.e., within the vehicle. Furthermore, the approach is to use communication between the ADS and driver as a tool to improve transition phases with MRMs. According to the HMI framework by Bengler et al. [
29], we are operating within the
Automation HMI (aHMI). In the case of modalities, haptic and auditory signals are mainly used for warnings, whereas the visual modality was mainly applied for representing the automation state and results of the automation’s
information analysis and
decision and action selection processes [
29]. The following hardware is frequently used as a visual interface: instrument cluster, monitor in center console, (augmented reality) head-up display, and LED-strip in the windshield [
29]. A contact analog head-up display (cHUD), can be seen as an extension of augmented reality since virtual information is displayed at the correct location in the real environment [
30] (p. 20). In general, the benefits of such systems are:
Parallel interpretation of displayed information and traffic environment [
25]
Quick and controlled drawing of attention towards relevant areas [
31]
Increase in user acceptance [
32,
33]
Helps to rebuild situation awareness [
26]
Improve gaze behavior [
33,
34]
Increase in trust in automation [
32,
34]
Decrease in subjective workload [
27,
34]
Despite designing an ergonomic cHUD, negative effects can still occur, such as masking other driving related areas [
35,
36], causing the effects “cognitive capture” [
35,
37] and “attentional tunneling” [
38], etc. Consequently, driver action can be directed both ways and unexpected results are possible, e.g., cHUD causing unnecessary braking due to highlighting objects in traffic with spheres [
23]. With regard to our research objective, the relevant application areas of cHUDs are:
Maneuver recommendations in the form of carpets/corridors [
23,
27,
28]
Maneuver recommendations in the form of arrows [
23,
26]
Maneuver information or planned trajectories in the form of arrows [
32,
33,
34]
Highlighting objects in the (traffic) environment [
23,
33,
34]
Results of studies show improvements in drivers’ decision making and maneuver success [
23], reduction of accelerations and time to lane change [
26], and improvement of the quality of drivers’ actions [
27,
28].
A multi-modal approach with at least two feedback modalities is recommended [
39] (p. 269) and especially the combination of visual and auditory modality was commonly applied in studies with transition phases between different levels of automation [
40] and with MRMs [
20,
41]. Based on these findings from the literature, the instrument cluster plus cHUD for the visual and sounds along with voice message for the auditory modality were chosen for the first HMI concept.
2.2.2. Preliminary Study
The first HMI concept was assessed via an expert evaluation built on the HMI checklist by Schömig et al. [
42]. For this purpose, six experts in the field of interface design for automated driving from the Chair of Ergonomics at the Technical University of Munich were recruited. Due to hygiene restrictions caused by the COVID-19 pandemic, an online format was decided on and materials accordingly prepared. In the first round, the study investigator introduced the topic and study design. Afterwards, each phase during the experimental drive together with pictures of the simulated track was gone through and respective HMI elements, i.e., the instrument cluster, cHUD, and auditory signals, were presented. In the second round, the same procedure took place but with experts being instructed with respect to giving feedback. The checklist [
42] was accordingly filled out by the study investigator and rating categories (
major concerns,
minor concerns,
no concerns,
measurement necessary,
not applicable) regarding the 20 heuristics were documented. Except for the heuristics in
Table 1, the results of the expert review were either categorized as
not applicable or
no concern. None of the heuristics was evaluated as
measurement necessary due the proposed HMI design building on existent concepts and standards.
Remarks by the experts related to the instrument cluster resulted in changes in icon properties, i.e., background color and level of transparency, as well as permanently displaying neighboring lanes. Regarding the cHUD, the length of the green carpet was extended and marking of the obstacle was adjusted to be more salient. The last remark concerned the red/green coding, which was not changed due to established indicators for warnings but was considered during the participant recruitment.
2.2.3. HMI Concept
The final HMI concept as it was implemented for this study consisted of visual (instrument cluster and cHUD) and auditory (sound and voice message) elements, primarily designed for a transition phase with an MRM (see
Section 2.2.1).
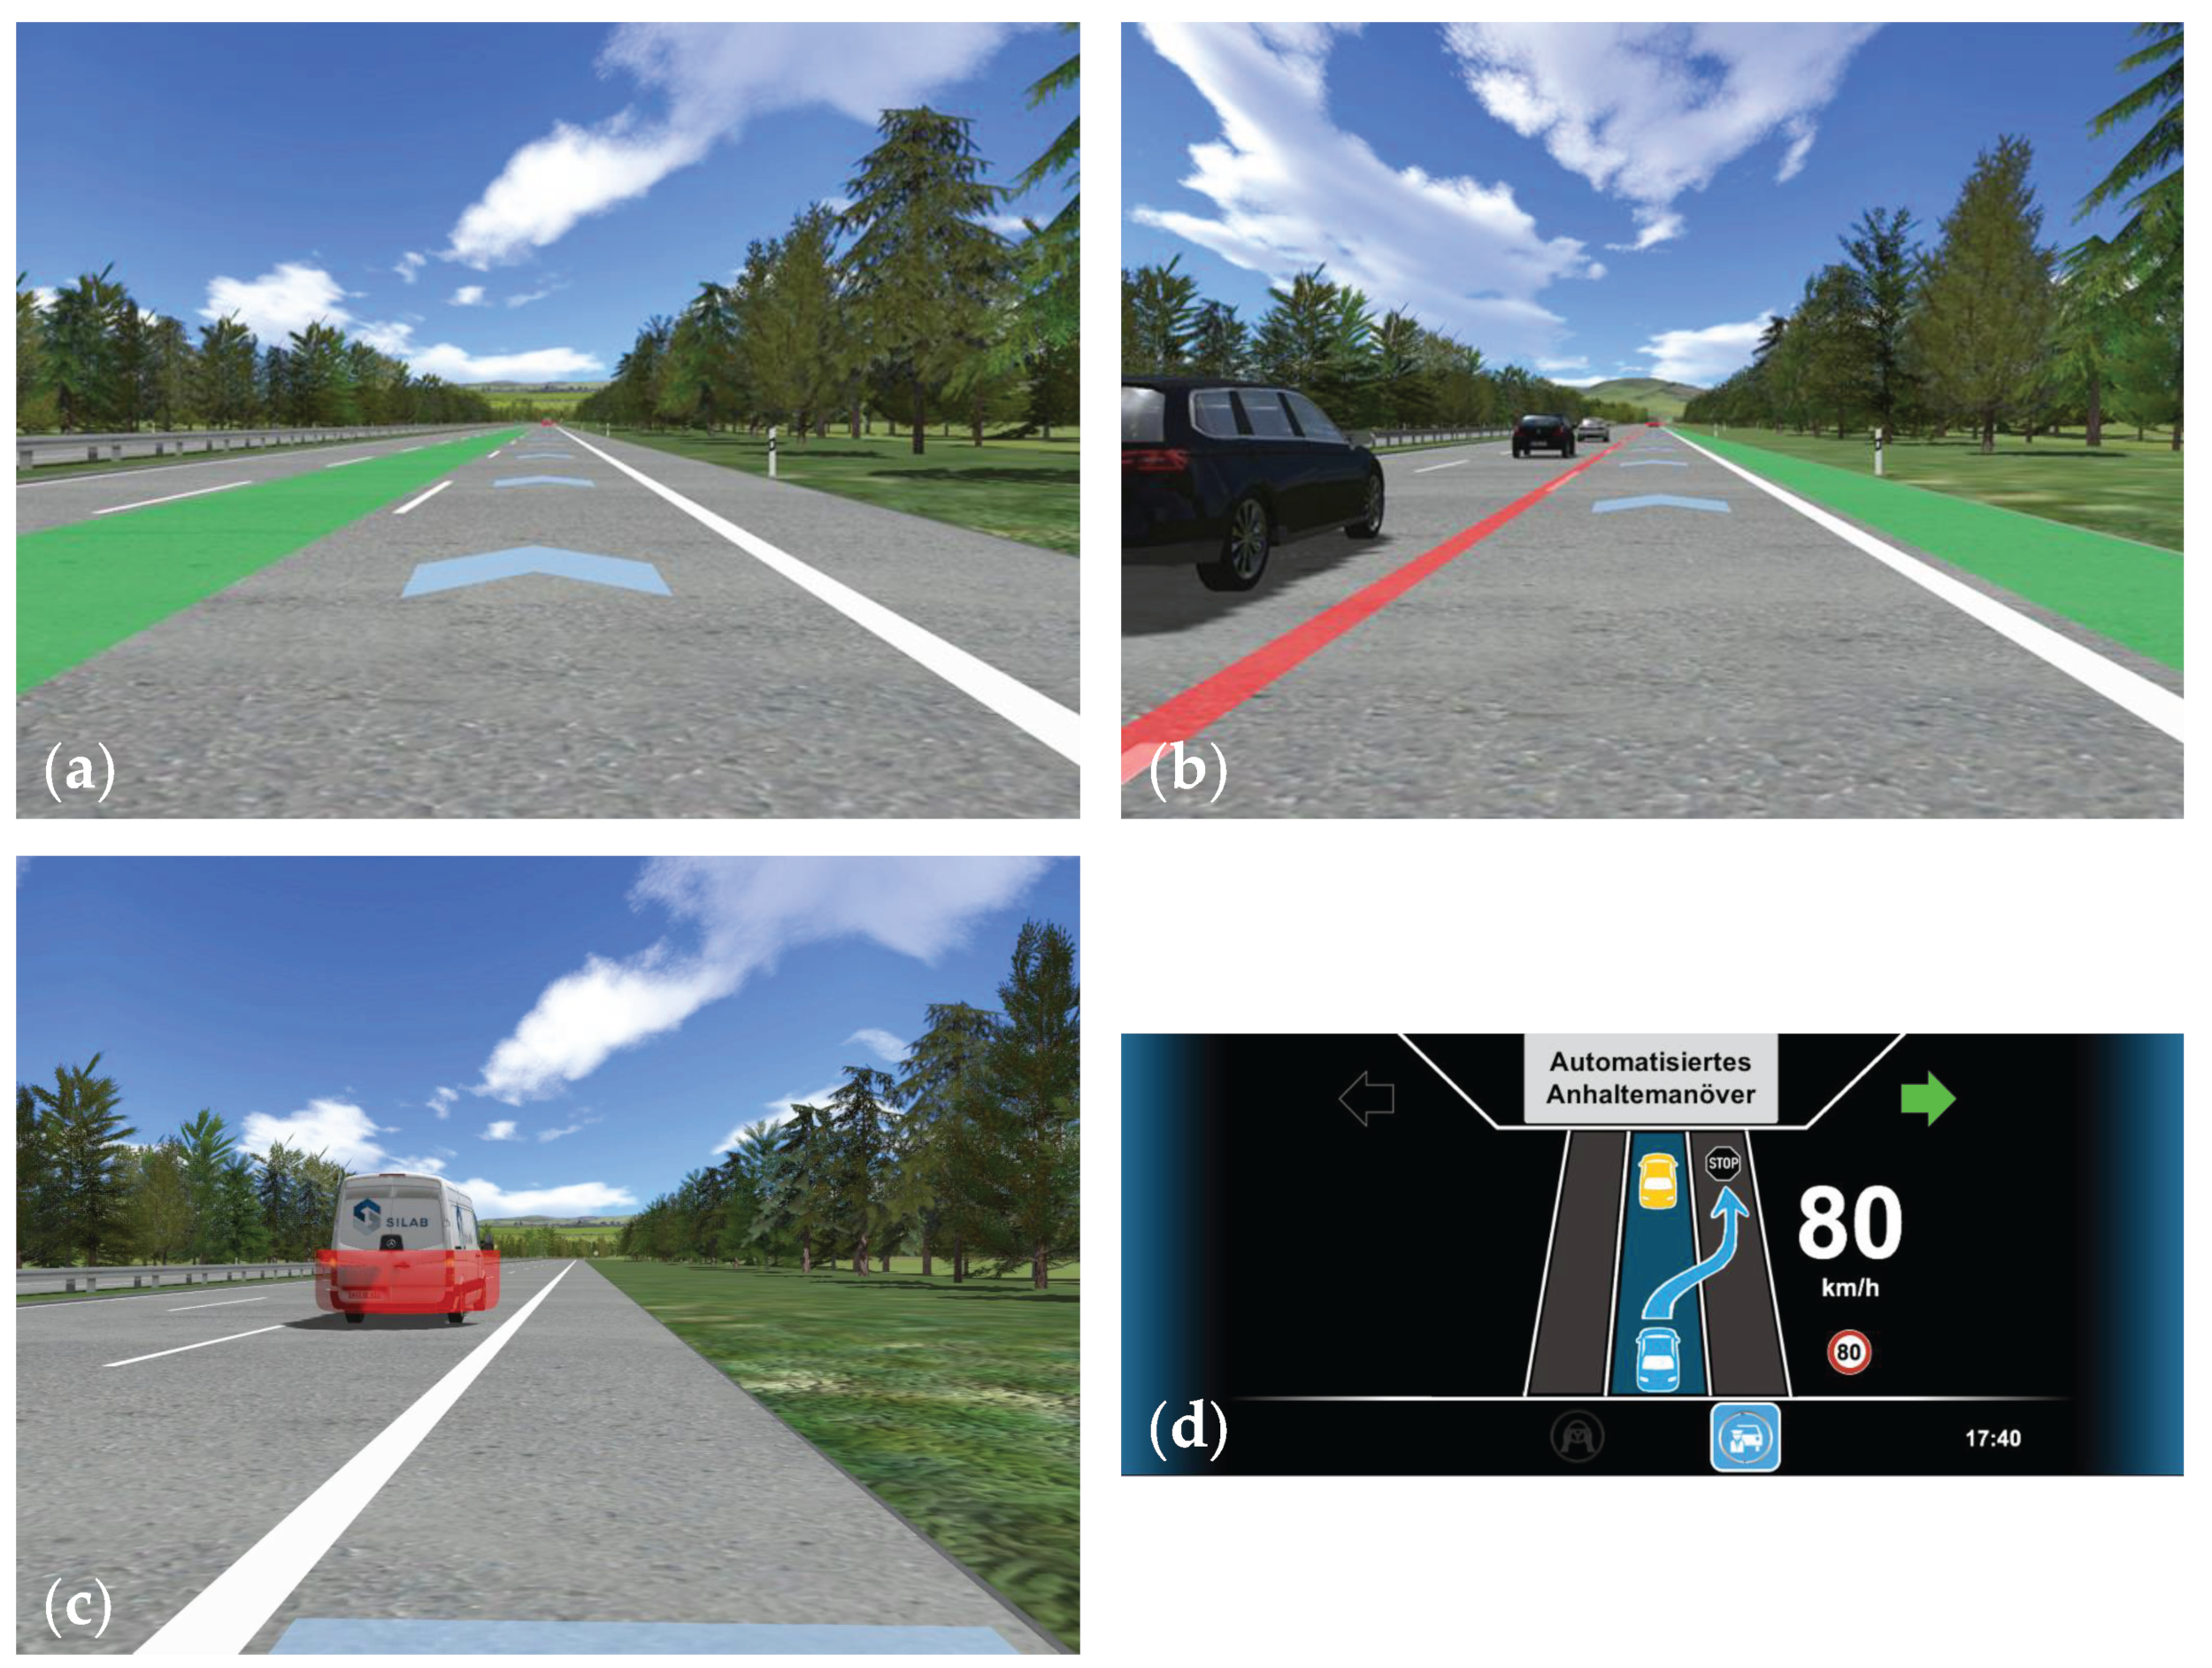
During the baseline and experimental drive, participants experienced the transition phase with the same information in the instrument cluster (see
Figure 2d) and auditory messages, i.e., two beep sounds followed by a computer-generated voice message with a female voice in German. The voice message can be translated as “automated evasive maneuver to the right”. Total duration of the auditory messages were approximately 3 s. In addition, the planned trajectory of the ADS is shown via blue arrows. The space in which the vehicle will come to a standstill is marked with a blue carpet on the lane (part of it can be seen in
Figure 2c). In the case of no intervention, the vehicle performs the MRM with right indicator plus the translated message in the instrument cluster “DO NOT INTERVENE!” in red font. Hazard lights are turned on and the message “Please continue driving manually” is displayed after coming to a standstill. The planned trajectory disappears as soon as the driver intervenes and the automation shuts off.
Only during the experimental drive, the recommendations for a voluntary take-over were shown in the
free scenario in the form of a green carpet on the left lane (see
Figure 2a). Consequently, the shoulder lane was recommended and the occupied lane indicated through a red line or narrow carpet in the
occupied scenario (see
Figure 2b). Contrary to the planned trajectory, the recommendations were still shown in the event of an intervention.
2.3. Experimental Design
A within-subject design was used to minimize the individual influence of participants and ensure a comparison of both concepts. The participants took part consecutively in the baseline as well as experimental drive with the corresponding HMI concepts that only differ in the recommendations shown for a voluntary takeover: HMI BL and HMI REC (see
Section 2.2.3). Both drives started with a manual drive and participants had to activate the ADS as soon as they entered the highway, which was signalized by the system. Drivers were engaged in the game
“1010!” by Zynga Inc. as a NDRT on a handheld device and experienced two transition phases during the
free and
occupied scenarios within 15 min of automated driving. Order of drives and scenarios within a drive were permuted and participants were randomly assigned.
2.4. Dependent Variables
Due to the transition design, the participants’ driving performance could only be measured if there was an intervention. Therefore, the first dependent variable to investigate is the decision to intervene. Intervention is defined as any driver input on the brake or gas pedal, while steering angle change has to be evaluated, respectively, to the automated MRM, i.e., a difference of steering angle over time greater than 2 °s. If drivers chose to take over, dependent variables are similiar to those for assessing the take-over quality [
10] and were the following:
Intervention time: time span between the beginning of the transition phase and driver intervention
Manner of intervention: standstill or overtaking maneuvers
Time to lane change (in the case of an overtaking maneuver)
Accelerations
Criticality of intervention: accidents or dangerous situations
The process of re-entering into traffic is investigated if there is no intervention or standstill maneuver by the driver. Furthermore, data from questionnaires regarding subjective workload (NASA RTLX [
43]) and trust in automation (TiA) [
44] were collected. A semi-structured interview was conducted at the end of the experiment.
As mentioned above, the data set has missing values for some dependent variables, i.e., accelerations and the times for the first intervention and to lane change, since they are determined by the driver behaviour. A missing data point represents a missing intervention during the transition phases of drives. Statistical tests, such as repeated measures ANOVA, would treat missing values by listwise deletion and consequently distort the results. It is also possible that drivers may be inconsistent with their decision across transition phases, e.g., intervention only during the baseline drive, during different scenarios in each drive, etc., which would intensify this effect. Enhanced methods, e.g., linear mixed models, are not feasible due to the small number of data points. If applicable for the other dependent variables, statistical tests were conducted in IBM SPSS Statistics and JASP (version 0.16.3) with a significance level of = 0.05. Data preparation and descriptive statistics were carried out in MATLAB (The MathWorks Inc.) and Excel (Microsoft Inc.). Outliers in boxplots were values greater than the third quartile plus 1.5 times the interquartile range. The following hypotheses were formulated based on the presented literature:
Hypothesis 1a. Providing recommendations for a voluntary take over does not influence the decision to intervene during the free scenario.
Hypothesis 1b. Providing recommendations for a voluntary take over reduces the number of interventions during the occupied scenario.
Hypothesis 2. Drives with the HMI REC result in a lower subjective workload than drives with the HMI Baseline.
Hypothesis 3. Drives with the HMI REC result in a higher trust in automation than drives with the HMI Baseline.
2.5. Apparatus
The experiment was conducted on a static driving simulator equipped with five 55-inch ultra HD screens that allowed a 180° field of view (see
Figure 3). Side mirrors are integrated in the form of two additional displays and rear view is placed on top of the middle screen. A freely programmable instrument cluster is located behind the steering wheel and audio speakers are attached around the mockup. Information through the cHUD was simulated by inserting the visual elements directly in the SILAB 6.0 simulation software from the Würzburg Institute of Traffic Sciences (WIVW). The experiment was video recorded via a GoPro HERO 6 on a tripod behind the driver seat. NDRT during the automated drive was performed on a 10-inch tablet from Huawei (Mediapad T3 10) that could be placed on a shelf to the right of the driver seat if manual control was resumed.
2.6. Participants
Requirements to participate at this study were a minimum age of 18 years old, a valid driver’s license, and proficient German language skills to understand the HMI messages. In total, thirty-six participants with an average age of 25.86 years (SD = 9.53, Min = 19, Max = 65) took part at the experiment. The sample consisted of 13 female and 23 male participants. Due to technical issues, the automation did not turn off for two participants (scenario for both: free; drives: 1 × baseline and 1 × experimental) despite driver intervention and those data sets were partly excluded from the analysis, i.e., from driving performance and subjective data. One front screen of the driving simulator turned off close to the transition phase during the baseline drive for another participant and consequently this data set was excluded from the whole analysis for baseline drives. None of the participants reported uncorrected vision, color blindness, or hearing impairments.
2.7. Procedure
At the beginning, participants were welcomed, briefed on safety regulations, and instructed to read the information sheets regarding the experimental procedure. After signing the consent form and generating a pseudonymization code, a demographic questionnaire was filled out and participants were introduced to the driving simulator and automated system. Information on system boundaries and subsequent transition phases with MRMs were repeated, and it was emphasized that a take over by the driver is voluntary. Additionally, the planned trajectory of the automated system during this phase in the form of blue arrows as part of the cHUD was explained on a printed document. A training drive without other traffic participants and two transition phases followed, in which the participant was asked once to let the system perform the MRM and to intervene in the other. Depending on the permutation, the baseline or experimental drive followed. Prior to the experimental drive, the other parts of the cHUD, i.e., recommendations during the transition phase, were introduced the same way as before. Questionnaires about perceived workload and trust in automation were handed out after each drive and the experiment ended with a semi-structured interview. Total duration of the experiment was about 75 min and participants were compensated with an allowance of 30€.
4. Discussion
In this experiment, we aimed to reduce the risk of an accident by providing environmental information and action recommendations to the driver during a transition phase with MRMs. To this end, we developed an HMI concept and investigated its effects during two scenarios: one in which participants should easily be able to follow the recommendation (free) and one in which participants would find it more difficult (occupied). Another objective of the study was to ensure that this concept does not negatively effect driver’s workload and trust in automation.
Since an intervention during the transition phase was not mandatory and the MRM would safely bring the vehicle to a standstill on the shoulder lane, the number of interventions was analyzed first. Results show that there is a high proportion of drivers who intervene during both scenarios, with higher numbers in the
free scenario as compared to the
occupied scenario. Nevertheless, the goal of an MRM is to ensure a safe transition phase regardless of the scenario and the number of interventions during at least one scenario emphasizes the importance of this investigation: 68.6% with HMI BL and 77.8% with HMI REC. These results can be compared to the “MRM evasive” scenario in the experiment by Karakaya et al. [
20]. In that study, the number of interventions for participants who were allowed to intervene was less (46.4%) than during the
free scenario with both HMI concepts (HMI REC: 69.4%, HMI BL: 62.9%). Even if two different MRM strategies were investigated, the decision to intervene during at least one transition phase was similar (71.4%). According to our analysis, providing environmental information and action recommendations did not influence the decision to intervene. Consequently, the higher intervention rates in this study must be due to other factors, such as transition design, i.e., prolonged time for voluntary takeover from 3 s to 6.5 s, an additional HMI element, i.e., cHUD, absence of a motion platform, etc. The main reason for an intervention as stated during the interview was that participants disagreed with the MRM strategy (70%), similar to the results of [
20]. Other reasons for and against an intervention also matched.
Results from [
19,
20] could be confirmed here again since a maneuver to the left is clearly favored by the participants over one to the right. A standstill maneuver in their own lane was not performed by any participant, but is a proposed MRM found in the literature (see
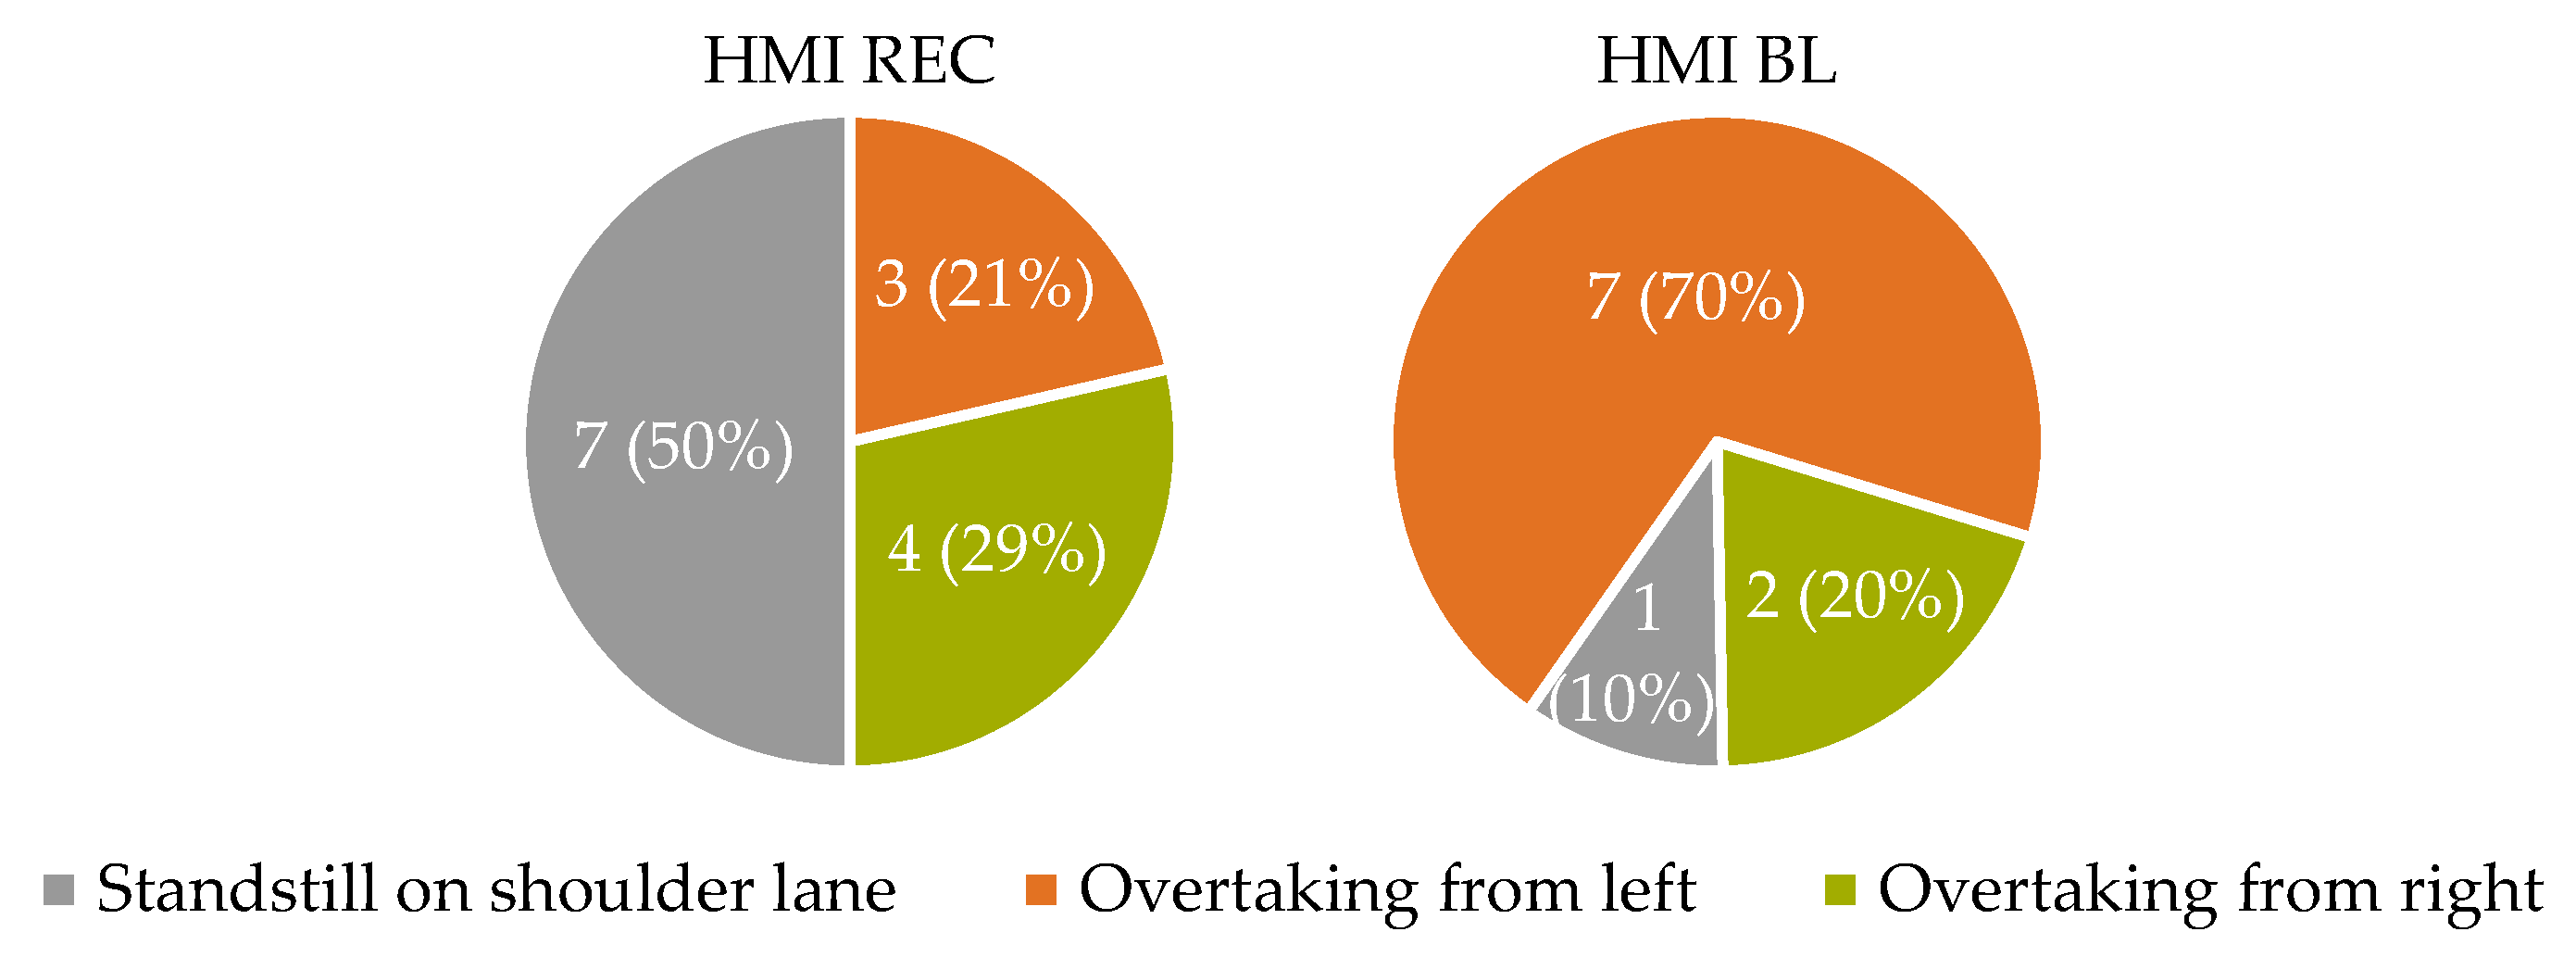
Section 1.1). Even if the middle lane is blocked and a lane change to the left is dangerous, participants had the desire to overtake through that lane by slowing down, sometimes close to a standstill, to let the traffic pass before starting to change the lane. Two participants during the baseline and experimental drive did not wait while slowing down and maneuvered in between the convoy, causing an accident in each case. The positive effect of the HMI REC is a shift in the manner of intervention: more standstill maneuvers in the shoulder lane, less overtaking from the left, and an increase in overtaking from the right. The latter is not necessarily a positive effect since it is against the traffic law in Germany and passengers in the stranded vehicle could be located on the shoulder lane, which in turn was not the case in the simulated scenario.
Recommendations via the HMI were followed by all participants during the free scenario. This is not surprising since the maneuver recommended by the system conforms with the one desired by drivers. In the occupied scenario, 50% of all intervening participants followed the recommendation. This proportion could increase if there were more experienced transition phases with MRMs, more trust in the automation, or more uncertainty regarding the participant’s own takeover. It could also decrease due to the previously stated reasons such as lacking time to assess the situation or significant distraction because of the NDRT. In order to change the willingness to follow the recommendations by the systems, these factors need to be considered. However, none of the participants stated unclear recommendations as a reason for or against an intervention. Thus, the cHUD is a suitable mean to communicate the recommendations of the ADS and changes in the HMI type are not assumed to be a factor for improvement. On the contrary, insufficient communication of the recommendations and intentions of the ADS could lead to higher intervention rates of drivers and consequently induce higher risks.
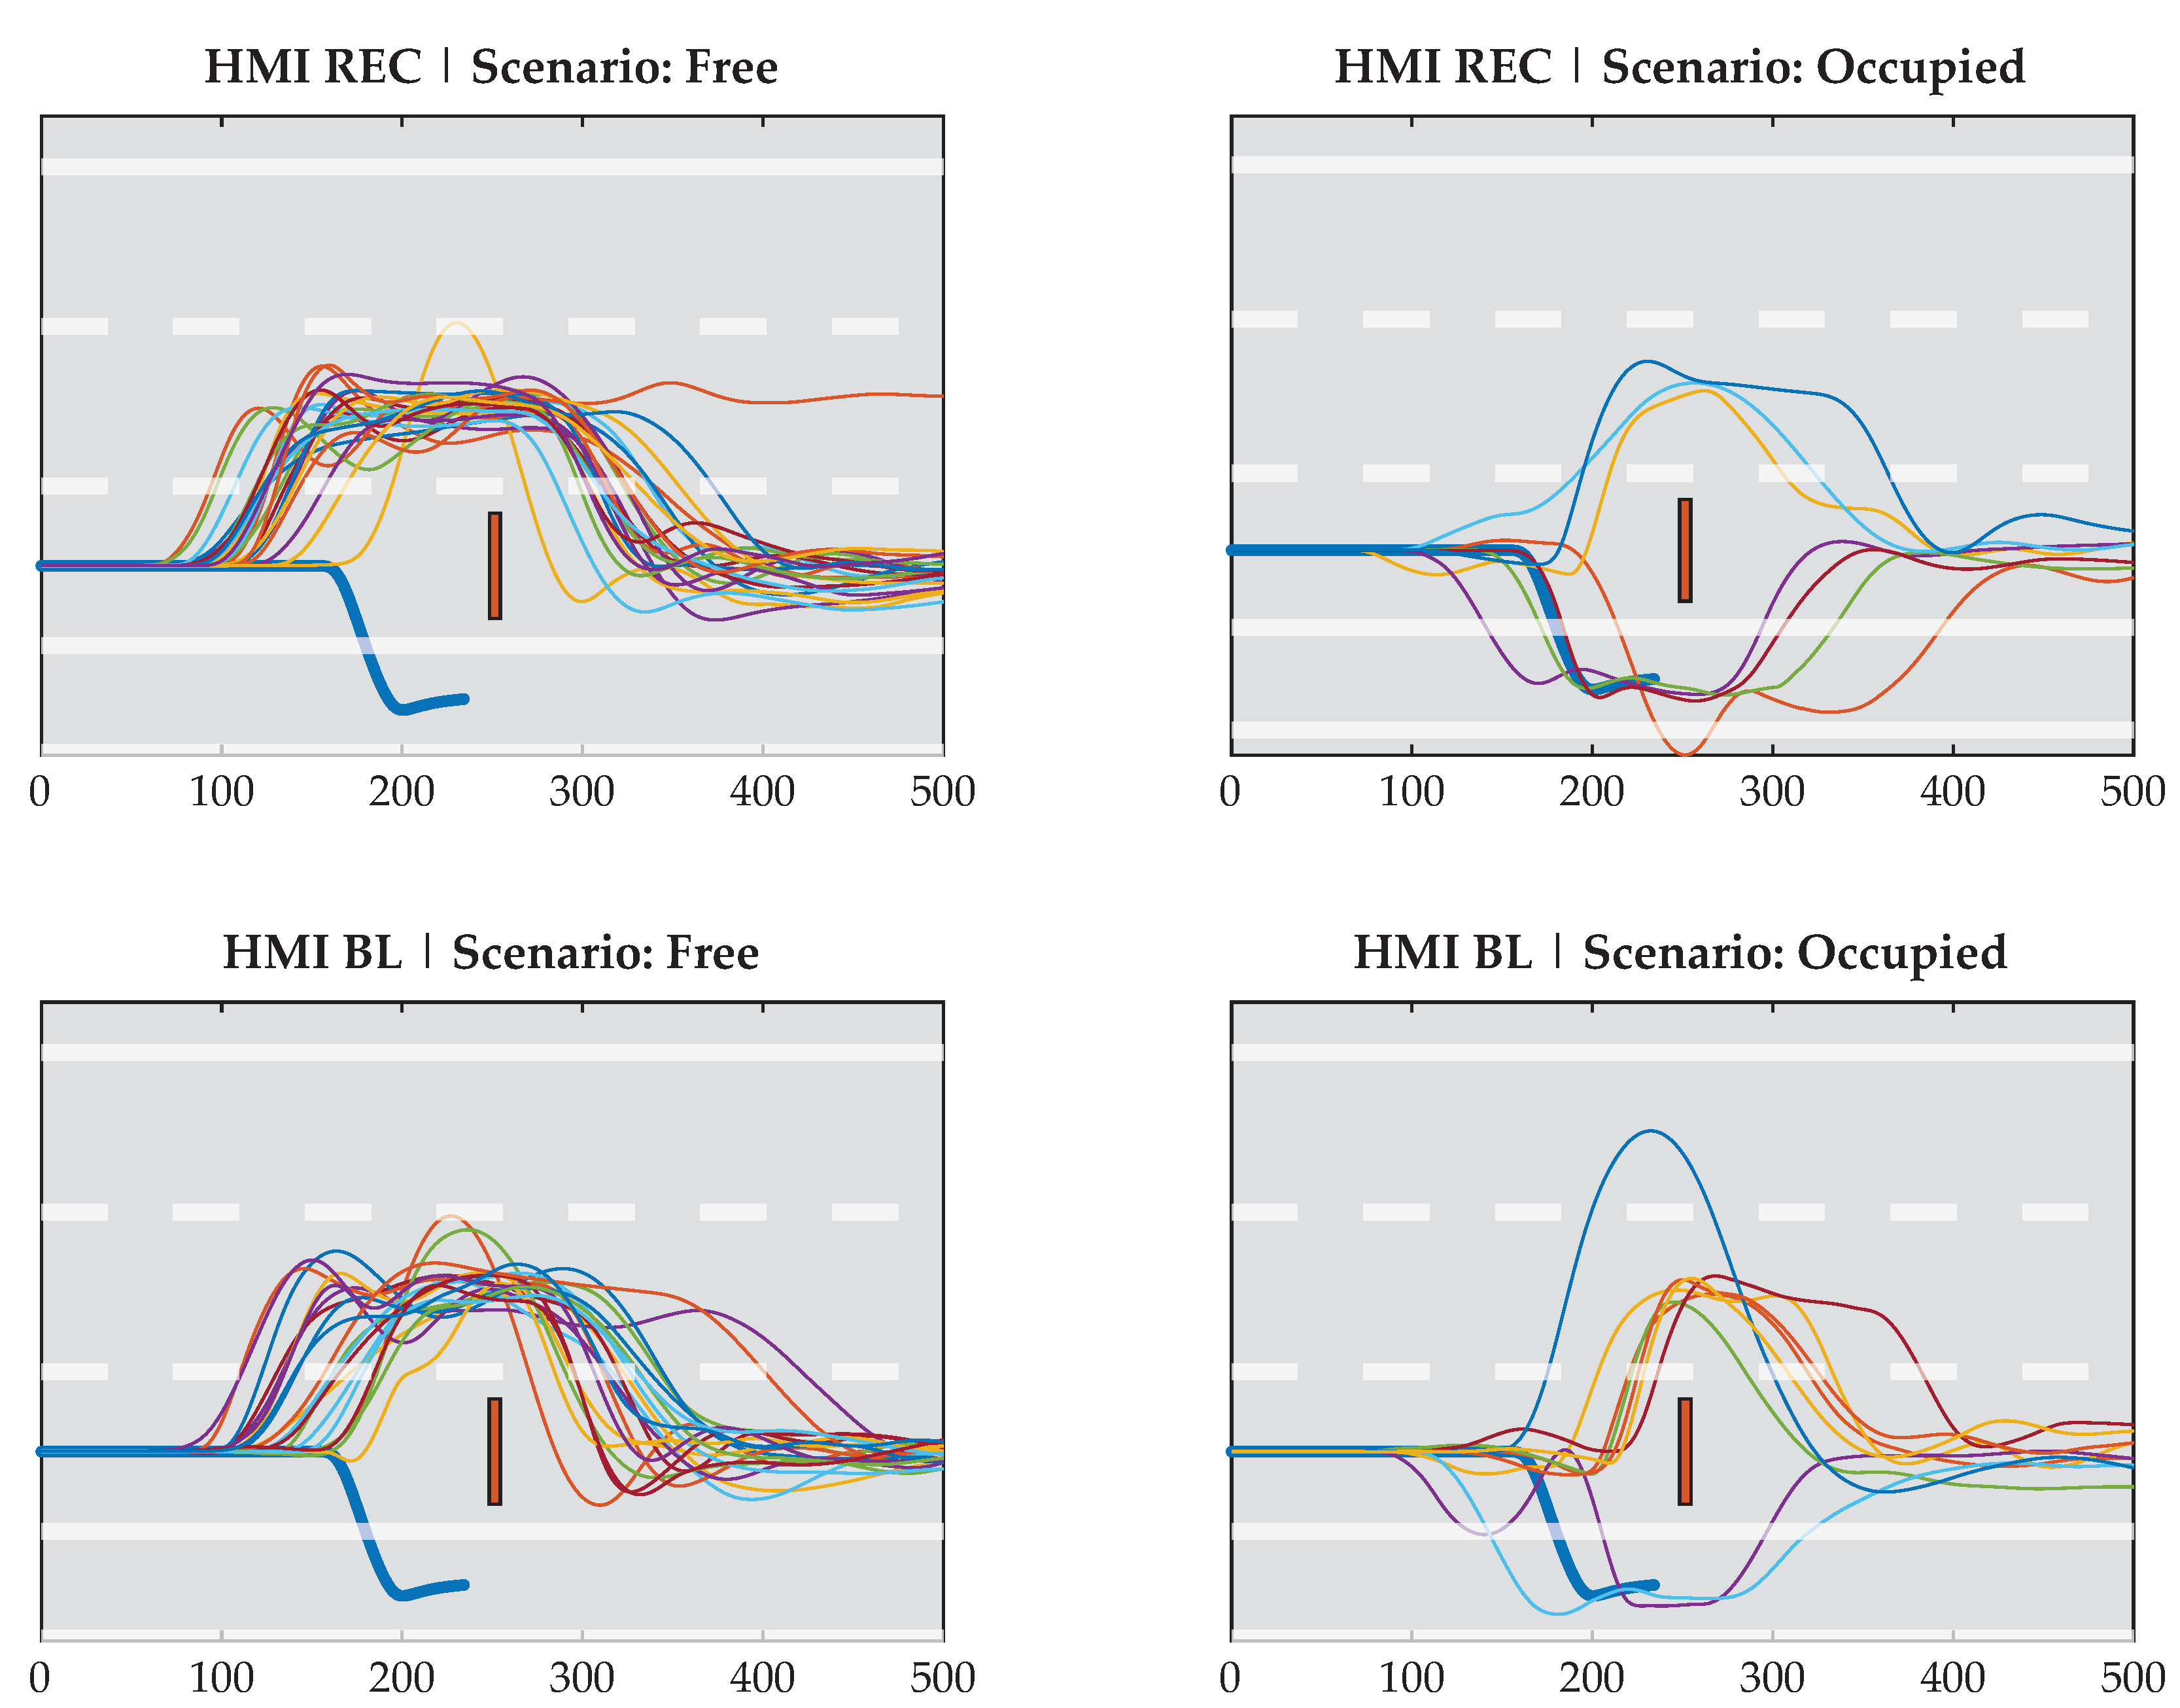
Analysis of the driving performance of drivers who intervened showed that the time of first intervention was the nearly the same regardless of the scenario or HMI and was on average 4 s after the transition was initiated. Therefore, the first intervention seems to be a reactive action to the MRM announcement. This assumption is supported by the fact that nine participants intervened before the audio message, including the verbal announcement of the MRM, had finished. The analysis of the time to lane change shows the influence of supporting the previous stages of the information processing model via information out of the traffic environment shown in the HMI on the
response selection stage (see
Section 2.2.1): a tendency of a 1 s earlier lane change in the
free scenario was found due to the HMI REC. Longer times and higher standard deviations in the
occupied scenario can be explained by the shift of intervention manners through the HMI, i.e., more participants overtaking from the left during the baseline drive. This is analogous to the resulting acceleration that showed no difference between the HMIs in the
free scenario. Higher acceleration rates are also caused by braking either to gain time for a lane change or to come to a standstill in the shoulder lane. The higher standard deviation with the HMI REC results from a more heterogeneous distribution of intervention manners.
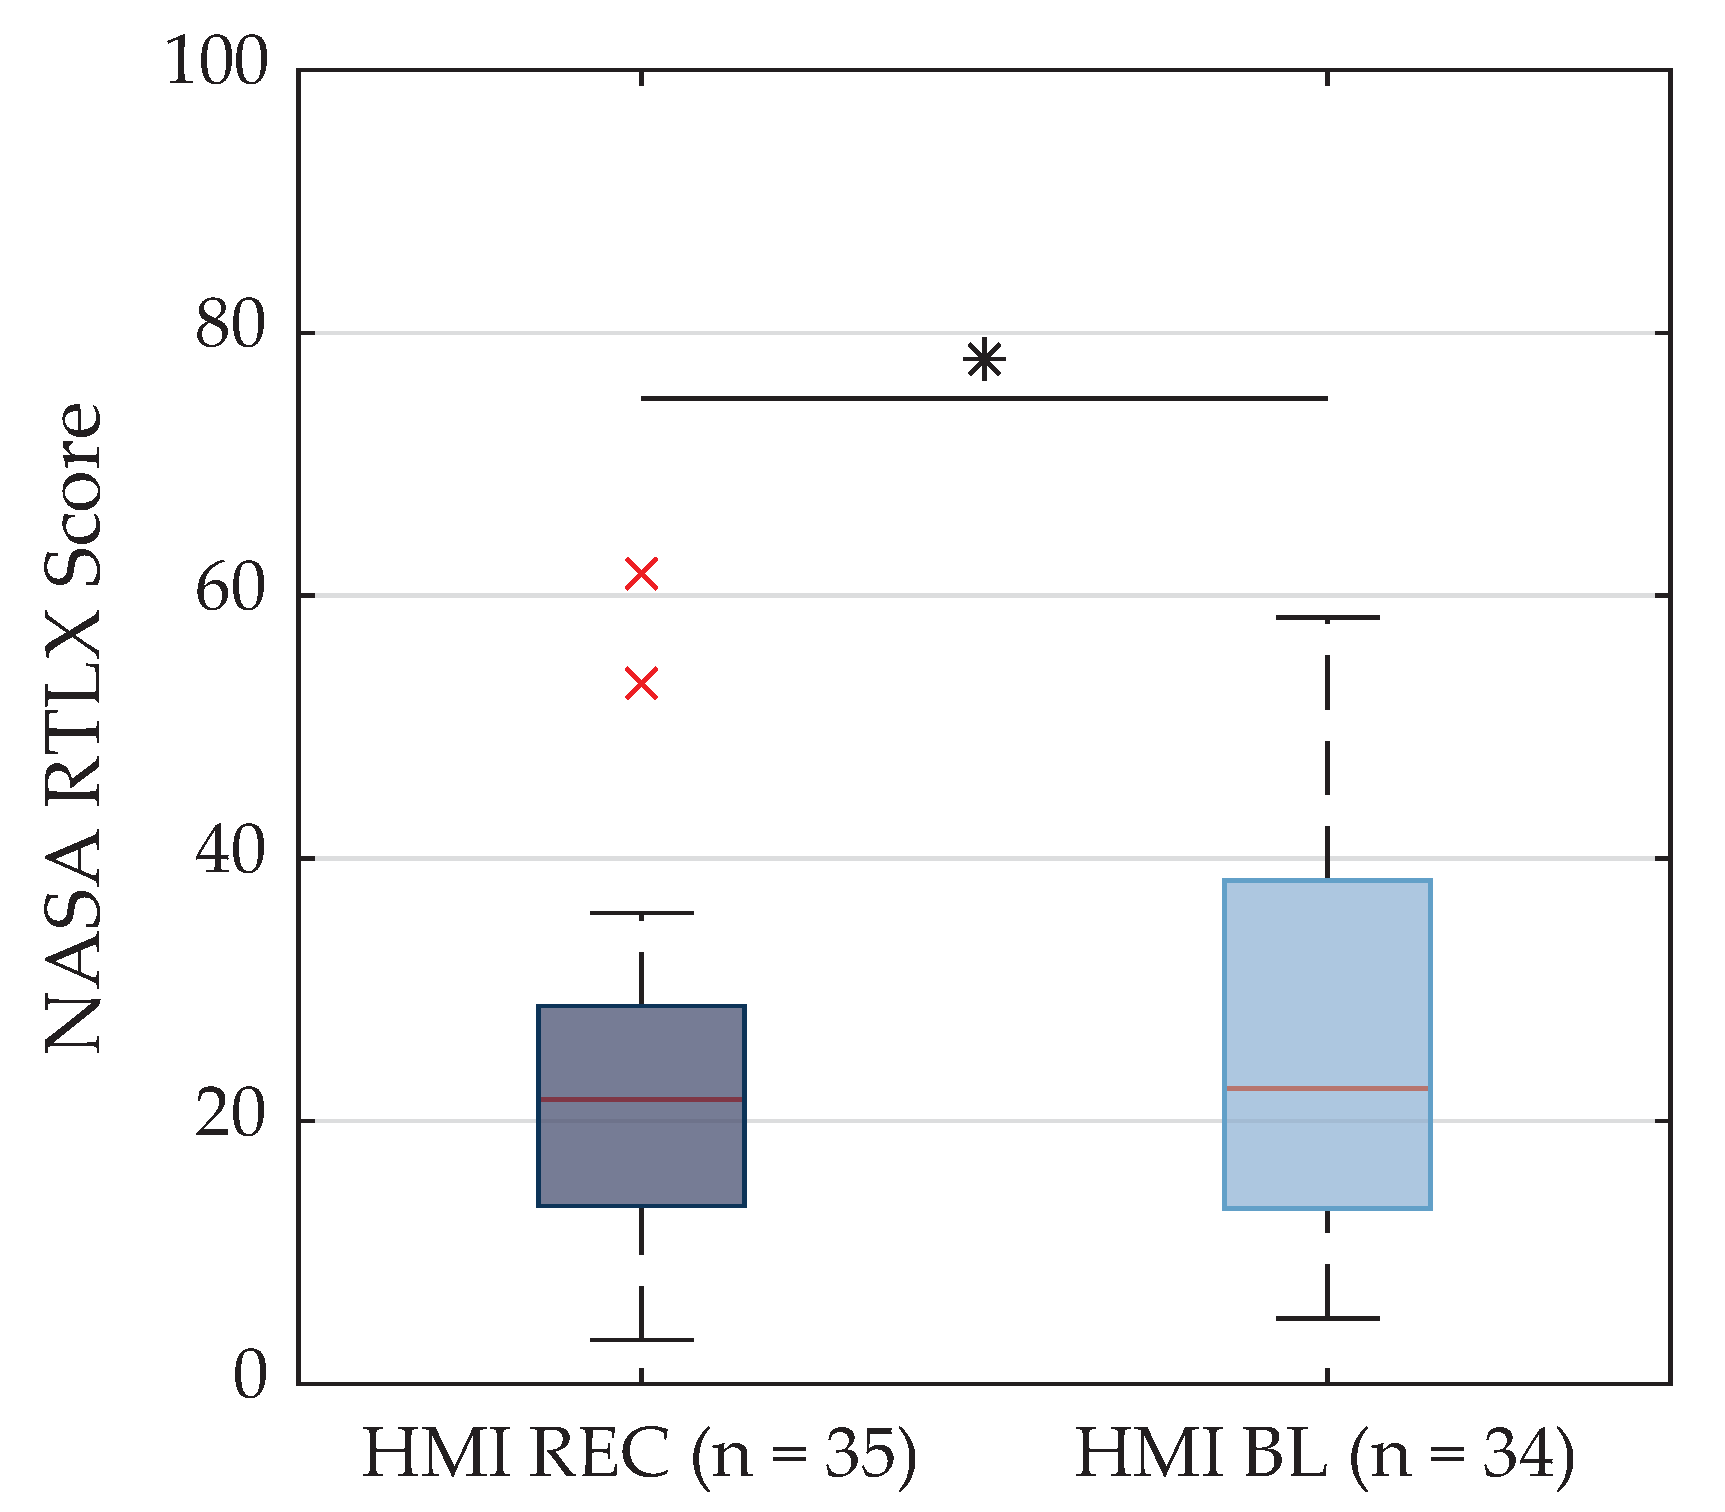
The developed HMI concept yielded a lower subjective workload by the drivers. Moreover, its influence on trust in automation was analyzed with the TiA questionnaire [
44]. As stated in hypothesis 3, higher values in each subscale were assumed prior to the experiment. Results showed a significant difference only in the scale concerning understanding and predictability of the system. No difference or a decrease of the scores in the other subscales are feasible due to non-significant results. Therefore, we could only observe a positive influence on one factor of perceived trustworthiness according to the model by Körber [
44]. This contributes to increasing trust in automation, and in terms of a holistic enhancement, the other factors have to be considered in future studies.
Risk is formulated as the product of the severity of an harmful event and its probability of occurrence [
17]. To answer the research question posed by this study, one of these two factors or both need to be reduced. First of all, the harmful event during the transition phase, especially combined with an MRM, has to be defined. Applied to this context, no harmful event occurs if participants let the system perform its MRM, since we simulated a flawless automation. Here, the only risk occurs after automatically coming to a standstill, i.e., during the process of re-entering into traffic, when drivers decide to overtake the stationary obstacle with an overtaking maneuver through the middle lane. Drivers should be guided after an MRM since a slow overtaking through the shoulder lane is less prone to cause an accident than through the middle lane.
Risk assessment in the case of a driver intervention depends greatly on the definition of the harmful event, i.e., a (1) collision with other traffic participants and/or a (2) dangerous situation. The severity of a collision was assumed to be the same across all possible collisions in the occupied scenario. A lower frequency of accidents with the HMI REC (7.1%) as compared to HMI BL (10.0%) correlates with lower probabilities of the occurrence of an accident and thus a reduction of the collision risk. Dangerous situations were overshoots during lane changes and interventions timed after the MRM. Given a similar severity within a situation, again the frequency and therefore the probability of occurrence solely determines the risk level. Lower frequencies of dangerous situations were found with the HMI REC than with the HMI BL within the free scenario (4.0% vs. 13.6%) as well as the occupied scenario (14.3% vs. 20.0%). Overtaking maneuvers through the middle lane with low velocities, i.e., an average speed of 42 km/h, or through the shoulder lane were also performed by participants in the occupied scenario. The former is potentially dangerous for upcoming vehicles with driving at faster velocities and the latter due to potential passengers who left the stranded vehicle. Although this was not the case in our study, it could be added to the dangerous situations and corresponding difference in the frequencies between HMI REC and BL would be higher (42.9% vs. 80.0%). In either case, the risk of a dangerous situation is lower with the developed HMI concept. Consequently, the risk of an accident and a dangerous situation can be reduced by providing environmental information and action recommendations. In addition, trust is positively influenced by increasing the driver’s understanding and predictability of the system and subjective workload being reduced.


