Article

Exploring the Use of Geographic Information Systems to Identify Spatial Patterns of Remote UAS Pilots and Possible National Airspace Risk

School of Aviation and Transportation Technology, Purdue University, West Lafayette, IN 47907, USA
*
Author to whom correspondence should be addressed.
Safety 2023, 9(1), 18; https://doi.org/10.3390/safety9010018
Submission received: 31 October 2022 / Revised: 3 March 2023 / Accepted: 9 March 2023 / Published: 22 March 2023
(This article belongs to the Special Issue Aviation Safety—Accident Investigation, Analysis and Prevention)

Abstract

:
The proliferation of Unmanned Aircraft Systems (UAS) in the United States National Airspace System (NAS) has resulted in an increasing number of close encounters between manned aircraft and UAS, which correlates with the increasing number of remote pilots in the Federal Aviation Administration (FAA) airmen database. This research explores spatial patterns of registered airmen using Geographic Information Systems (GIS) analyses that provide notable spatial distribution patterns of pilots and how they relate to UAS sightings and airspace categories. The application of GIS to these aviation data may assist safety practitioners with identifying geographic patterns, areas of higher risk, and ultimately improve safety management. The authors analyzed publicly available airmen data to examine spatial distribution patterns, data correlations, and inferences. Airmen addresses were first geocoded into ArcPro 10.4 GIS software as a vector data layer containing attribute values of the database. The spatial analysis tool set was then utilized to establish clustering, density patterns, and spatial relationships between various categories of registered airmen. These density analyses revealed implicitly that commercial registered pilots tend to have the highest clustering near major commercial use controlled airspace, yet registered remote (UAS) pilots are also clustered in these and other densely populated areas. UAS sighting data were also geocoded using zip code values of the reported city to potentially correlate UAS sighting with registered remote pilots, yet the lack of spatial precision in the database made establishing any type of spatial relationship ineffective. The implicit spatial relationships between commercial and remote registered pilots revealed further research is needed to integrate UAS safely and effectively into the national airspace. The poor quality of UAS sighting data also demonstrates the need to better utilize GIS to monitor and track UAS flights within the context of an Unmanned Traffic Management System.

1. Introduction

Over the past decade, Unmanned Aircraft Systems (UAS) have rapidly evolved from a disruptive technology, associated with RC hobbyists, to what is now an established and growing commercial segment of the aviation industry. UAS are becoming an increasingly integrated and essential component of the National Airspace System (NAS). In 2021, the UAS market size was estimated at USD 22.1 billion and is forecast to reach USD 43.4 billion by 2027 [1]. Advanced Air Mobility (AAM) is the next progression of UAS and is expected to further increase the volume of air traffic. Morgan Stanley Research predicts the AAM market value nearing USD 1.5 trillion by 2040 [2].
Consequently, there has been an exponential increase in UAS operations across a diverse population of users and applications. As of December 2022, there were about 871,000 registered UAS in the United States (U.S.) [3]. Almost 334,000 of these UAS are registered for commercial use, which far exceeds the approximate 250,000 registered manned aircraft [3,4]. In 2017, the FAA [5] established the Low Altitude Authorization and Notification Capability (LAANC), which provides UAS operators with automated airspace authorizations to operate in the controlled airspace surrounding the airport. To date, LAANC services are available at 732 U.S. airports and have issued over 1 million authorizations allowing UAS pilots to safely operate in this busy airspace [5,6]. Increasingly, airports themselves are using UAS to support their operations across a number of use cases, such as runway/taxiway inspections, wildlife management, and perimeter security [7,8,9,10]. These UAS operations near or on an airport may be conducted safely, but are not without risk, so long as they are conducted by properly trained operators, in accordance with regulatory policy, and operators exercise proper safety management practices [7,8,9,10]. Additionally, the projected increases in commercial air traffic, UAS operations, and the maturation of AAM technologies will further exacerbate the demand for the FAA’s air traffic control (ATC) resources [7,11,12].
The FAA’s Airmen Certification Branch manages the Civil Aviation Registry (AVS Registry), which serves as the national repository for airmen certification records and provides the central services necessary for the control of these records [13]. The basic pilot certificates issued by the FAA are (a) student; (b) sport; (c) recreational; (d) private; (e) commercial; (f) airline transport; (g) and remote (FAA, 2022e). Table 1 provides a breakdown of the AVS Registry pilot population by certificate along with a brief description of each certificate [14,15,16,17].
A student pilot certificate is intended for initial training and does not expire unless the certificate is surrendered or superseded by a higher pilot certification [18]. However, about 60% of student pilots never earn a higher pilot certificate (e.g., private, recreational, or sport), and approximately 80% of student pilots drop out of flight training; therefore, a large number of the student pilot population is likely inactive [19,20].
The rapid growth of UAS would be significant in any industry and remains unprecedented within aviation. The U.S. issued its first manned pilot certificate in 1927 [21]. In contrast, since the FAA enacted Title 14 Part 107 of the Code of Federal Regulation (CFR) for small UAS in August of 2016, it has issued over 307,000 remote pilot certificates, which already comprises over 20% of the total pilot population [16,22]. A remote pilot certificate allows a person to operate a small UAS (below 55 lbs) for work or business in accordance with Part 107 regulations [23,24]. This remote pilot data, coupled with the number of UAS registered for commercial use, suggests a significant number of remote pilots are engaged in commercial operations.

Problem Statement

The advancement in unmanned technologies, coupled with the FAA’s ever-increasing burden of safely integrating the exponential growth of registered UAS platforms and remote pilots into the NAS, presents significant challenges in making sure that both remote and manned aircraft can effectively share the same airspace. Compounding this challenge is the relative dearth of quality data regarding UAS flight patterns and sightings. To address this challenge, and to use the FAA AVS Registry database, one of the first questions to be asked is if there is an overlap between the location of registered manned and remote pilots and if there are notable patterns associated with the explosive growth of UAS [25]. Although where remote and manned pilots reside may not answer all questions regarding how the explosive growth of UAS presents conflicts within the airspace, gaining an understanding of what may appear to be obvious patterns when mapped provides a precise geolocation dataset as a foundation to build upon in future research. Information gleaned through the study of spatial patterns of pilots may help the FAA better allocate its limited resources to these high-risk locations. This research utilizes a GIS to convert the address locations from the FAA AVS Registry database into a coordinate location-based point file to better understand spatial patterns of registered pilots within the continental United States. It should be noted that this research is not intended to address risks associated with deliberate bad actors or terrorism.

2. Background

The increasing number of UAS in the NAS and the lack of a mature regulatory framework have led to several concerning events around airport operating areas (AOAs). For example, in 2019 two UAS operating near Newark Liberty International Airport delayed 43 flights and caused nine others to divert to another airport [26]. Similar events at London Gatwick [27] and Dubai airports [28] halted airport operations for a significant time and exemplify the potential hazards small UAS (below 55 lbs) pose to airports.
Airport boundary intrusions, airport threats, airspace disruption, air traffic controllers’ increased workloads, and runway incursions are just some of the hazards presented by small UAS. Risks due to UAS at an airport can be significant in terms of aircraft delays and inconvenience [7]. Overall, the number of close encounters between UAS and manned aircraft is on the rise. Pyrgies [29] conducted a quantitative analysis of 139 UAS incidents and categorized 24 of these incidents to be a near mid-air collision with manned aircraft, two UAS resulted in a mid-air collision, ten UAS resulted in airport closure, and one UAS was sighted inside the airport premises. Since the FAA first started collecting UAS sightings reports in 2016, there has been a steady rise in the number of sightings. For example, a review of this data found that during the period from April through June 2021 there were 958 sightings, an increase of 79% over the same 3-month period in 2016 [30]. Such issues highlight the need for innovative safety risk management strategies to better manage commercial UAS operations.
Spurred by these safety concerns, recent research has investigated the frequency and location of these events. One study used FAA Reported Sightings Data from November 2014 until January 2016 to create an interactive map [31]. This study found the following:
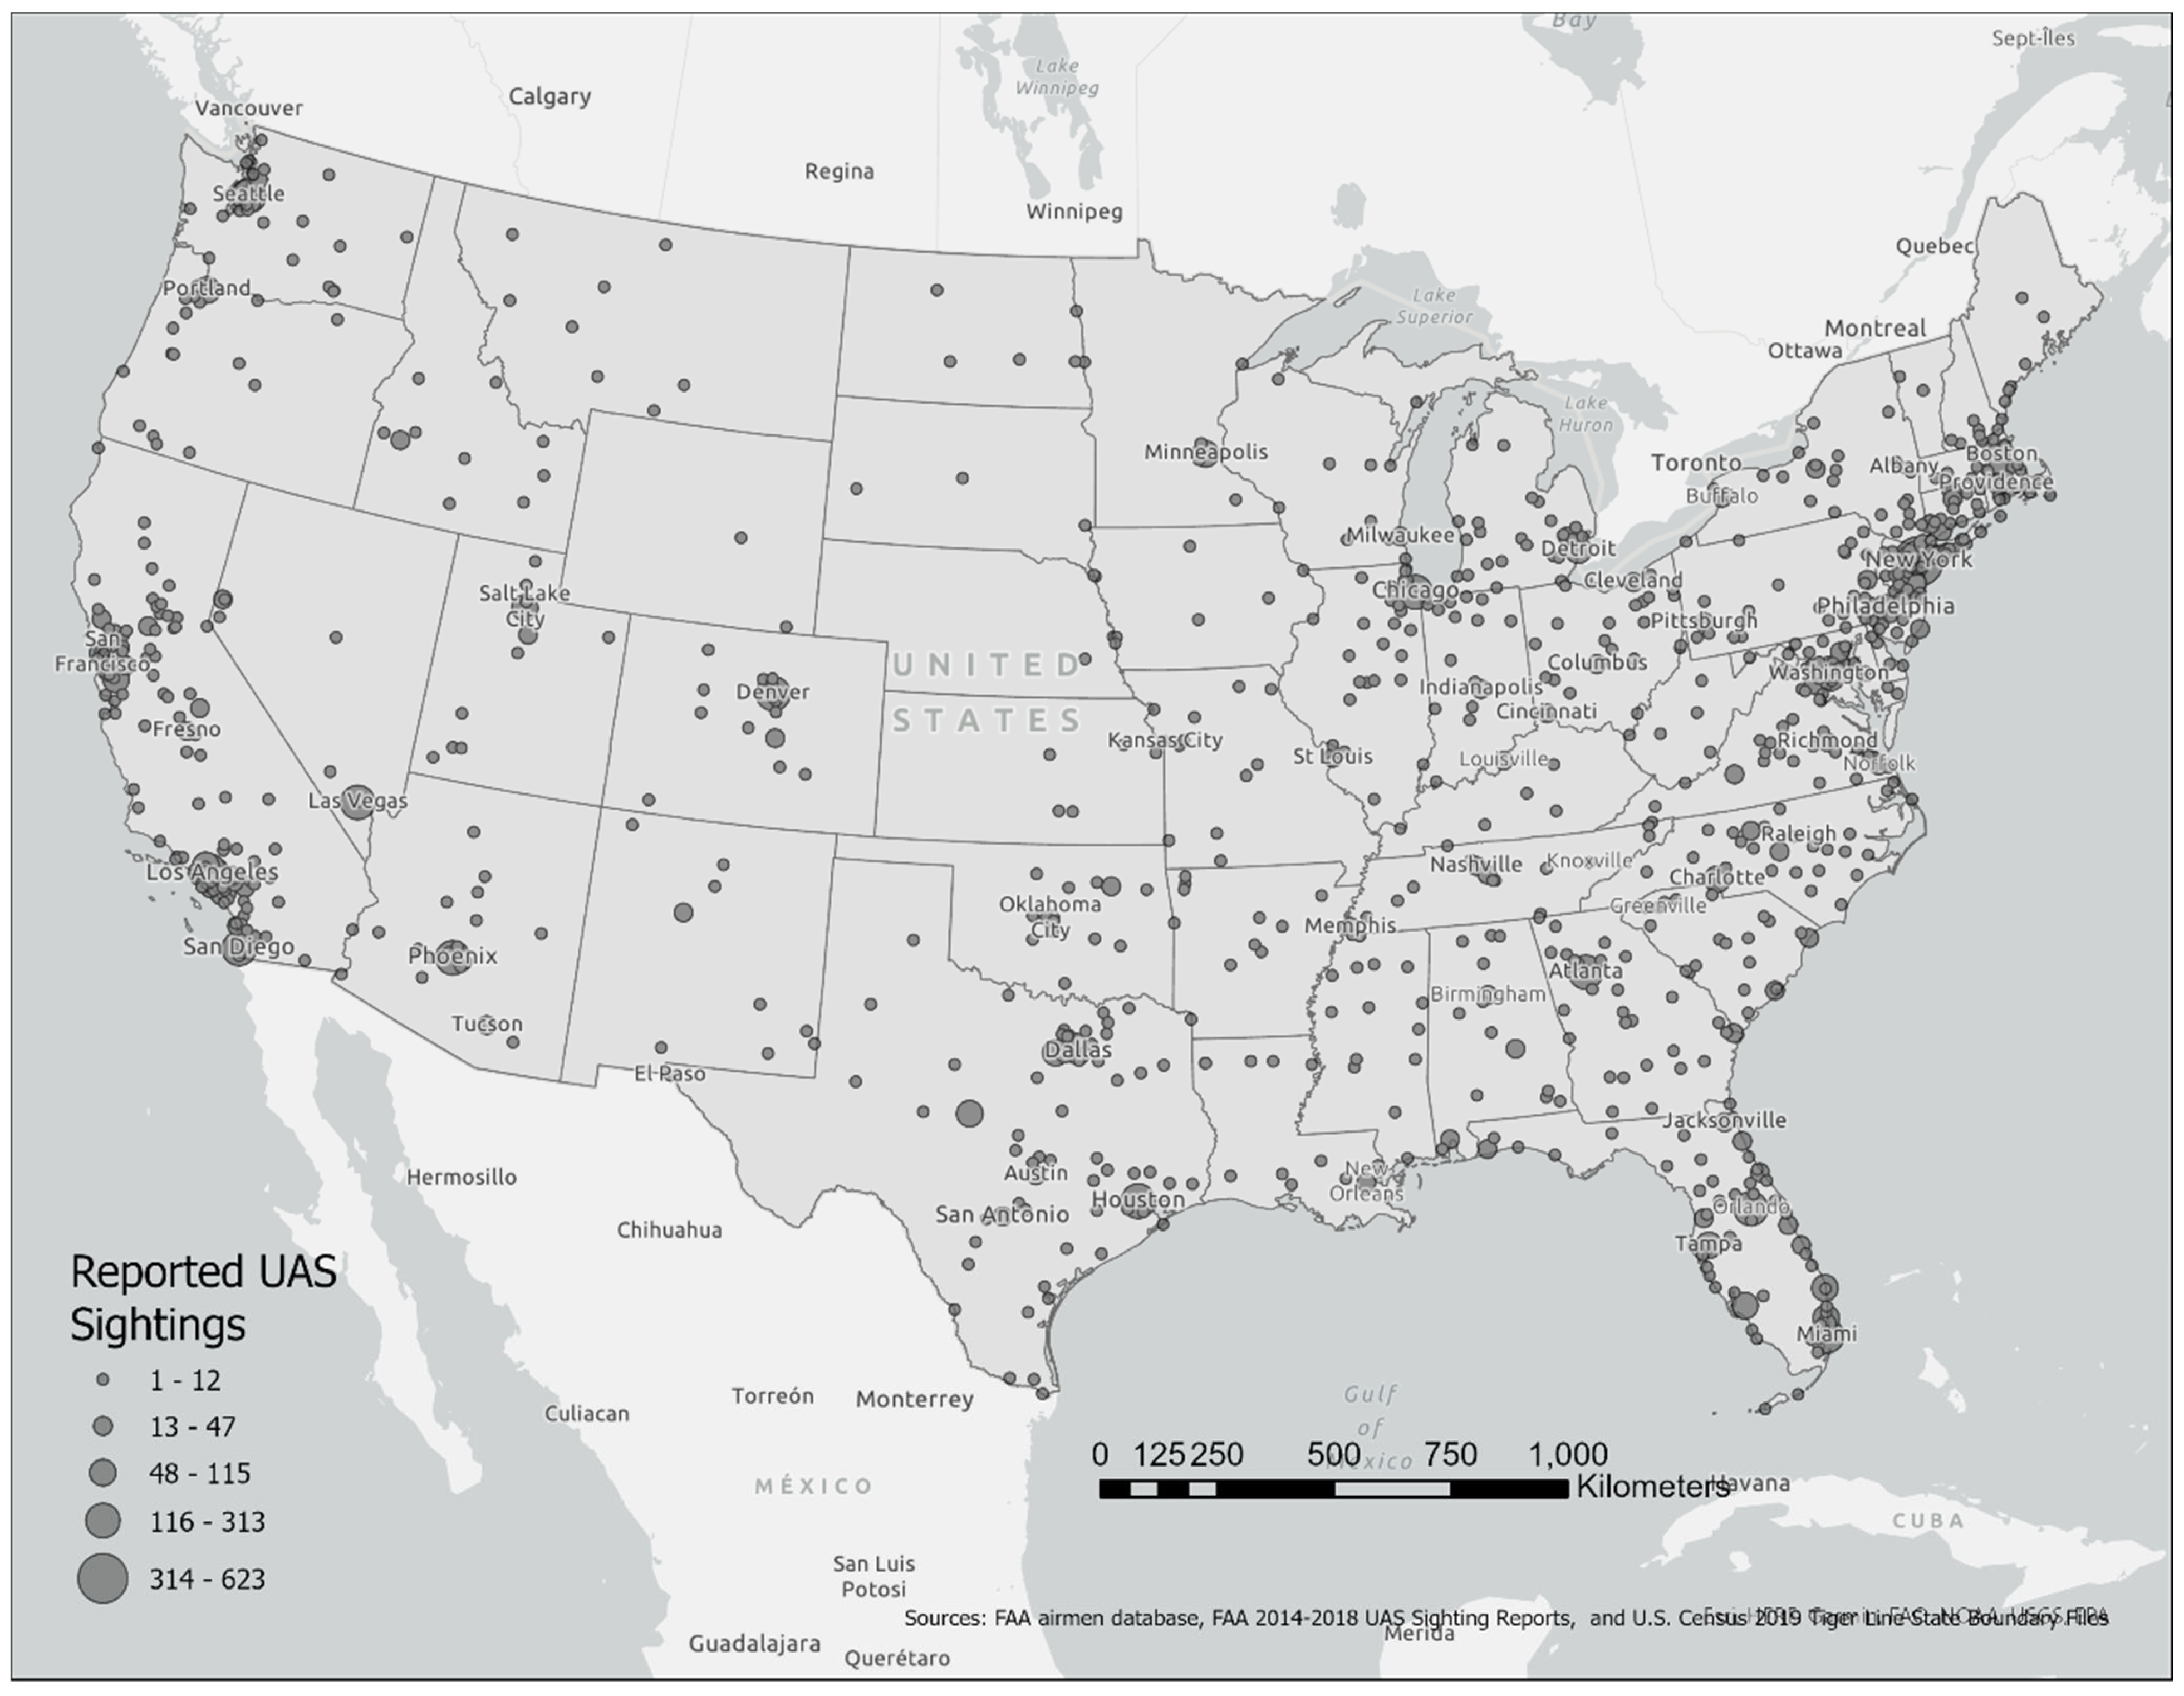
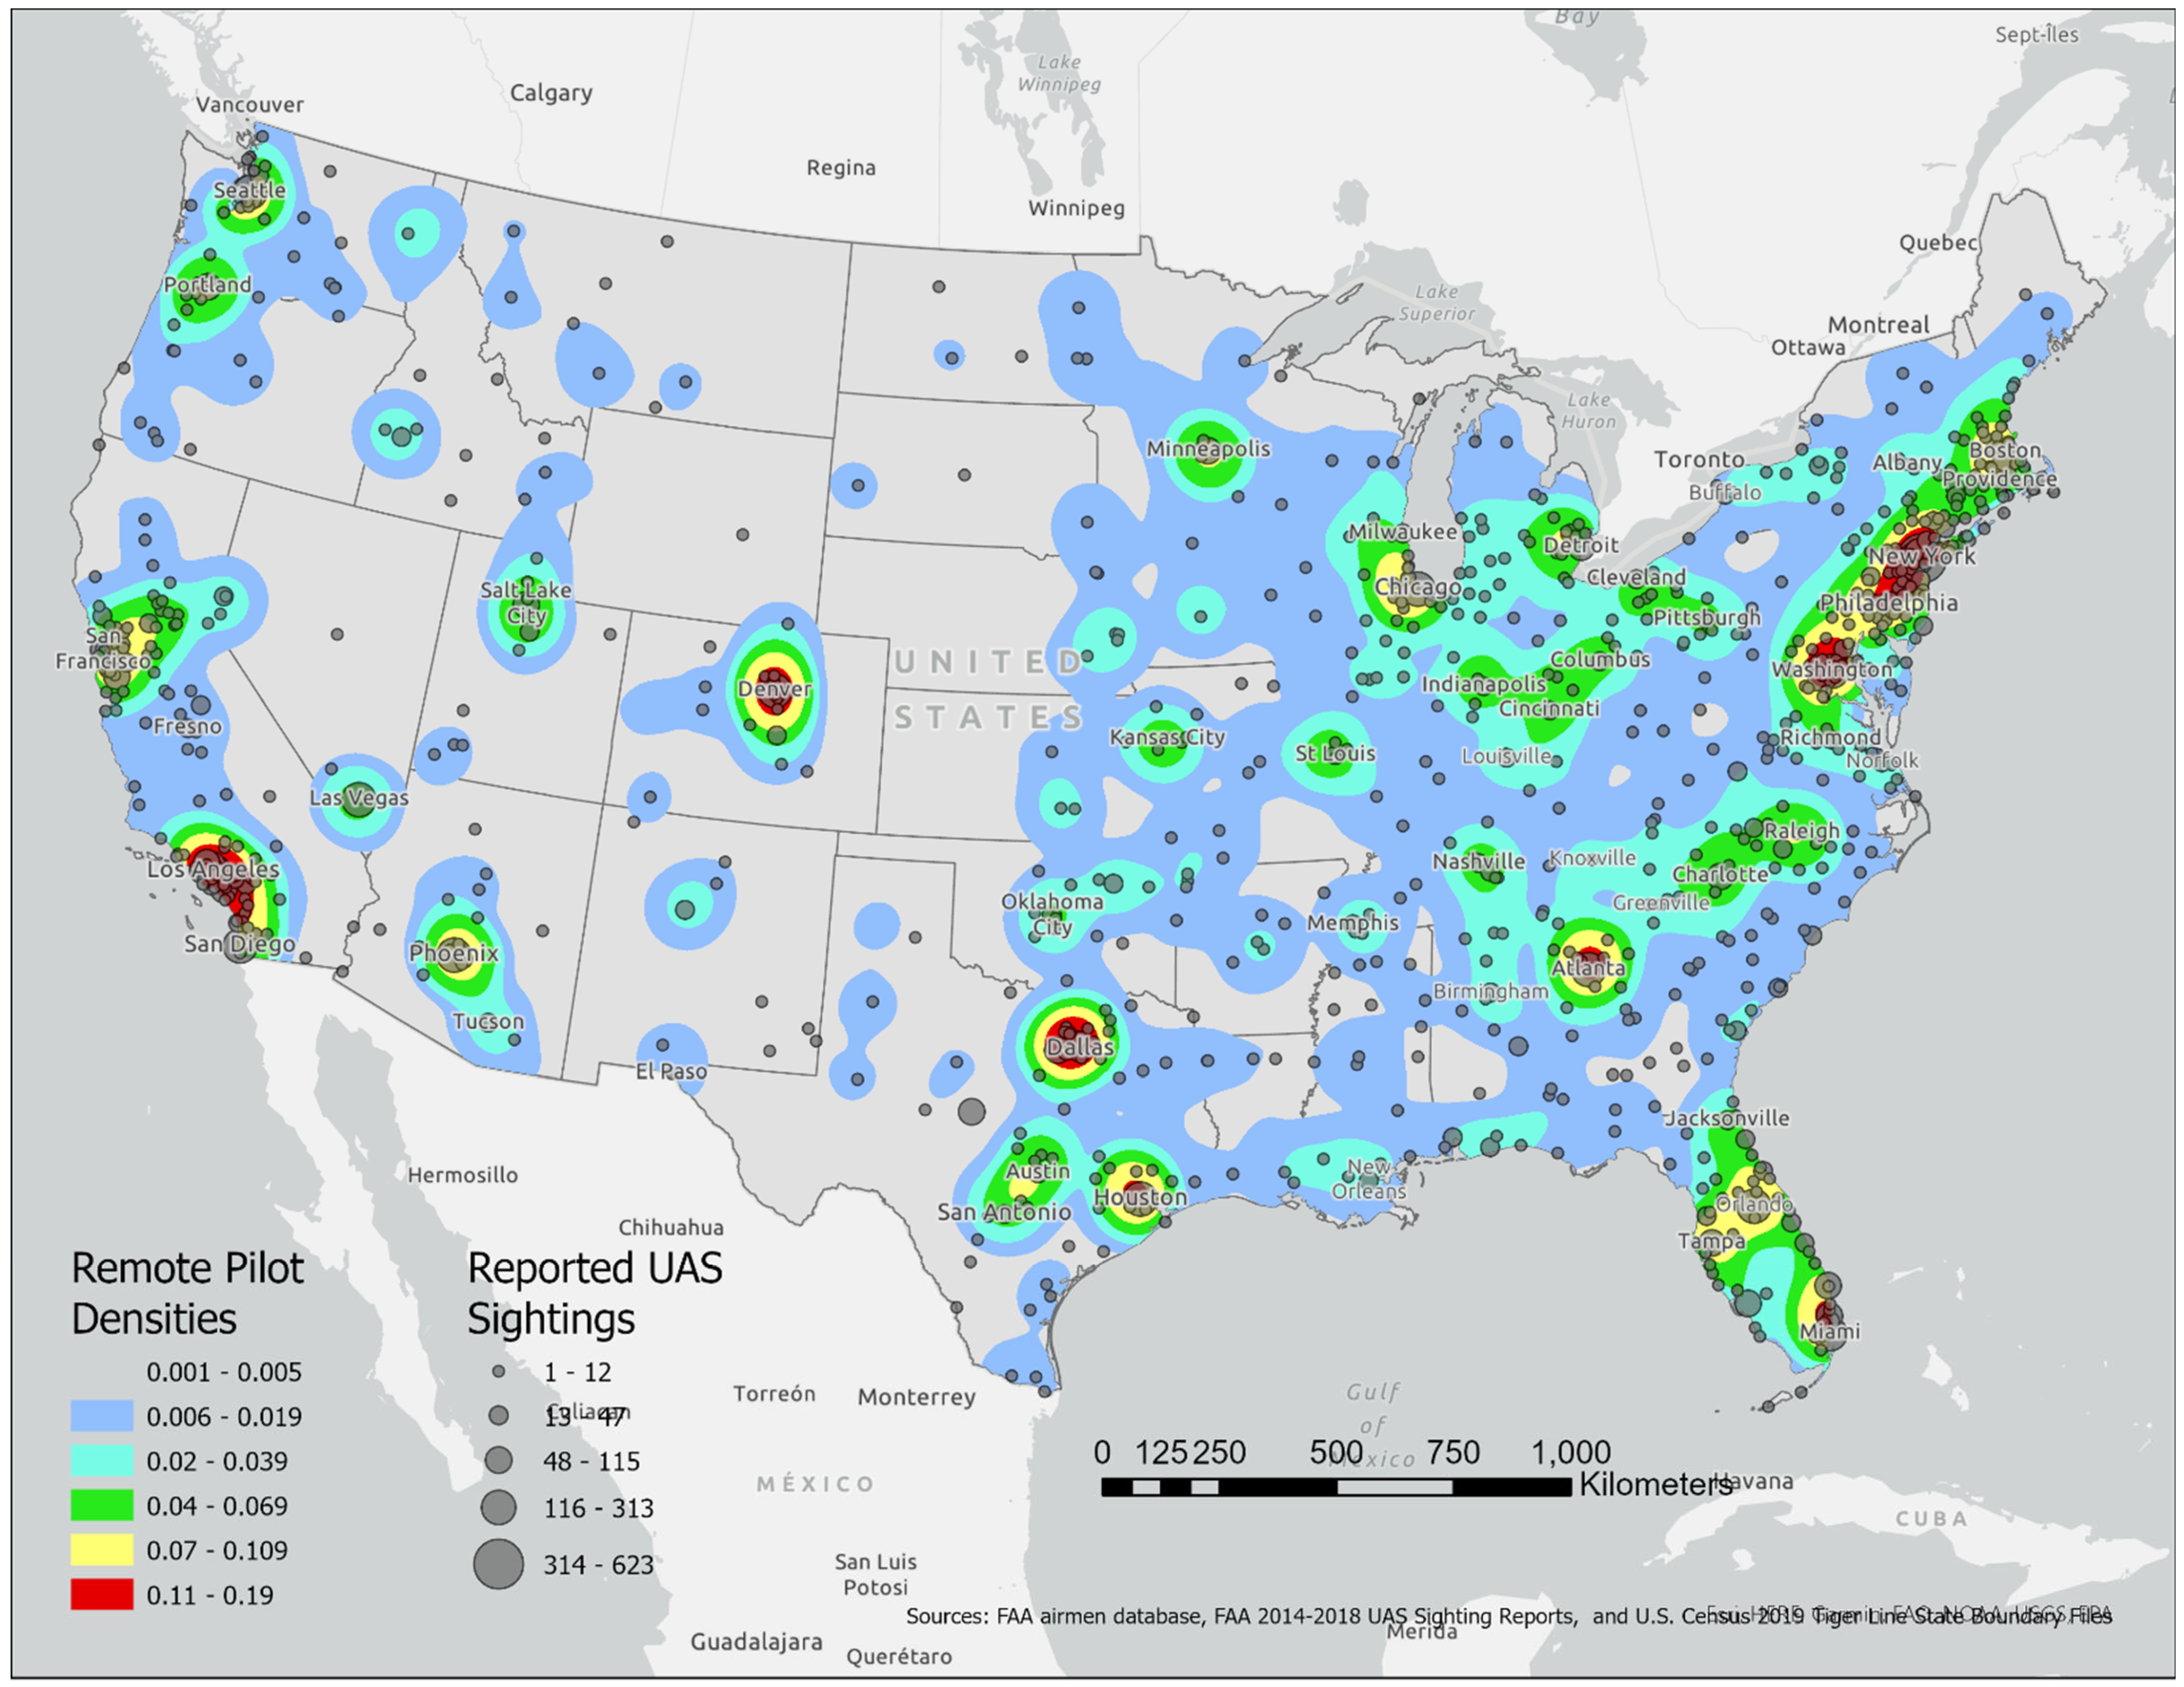
  • In the U.S., the State of California had the most sightings,
  • Out of 1346 reported sightings,
    o
    1009 were above the legal limit of 400 feet,
    o
    491 were within five miles of an airport,
    o
    73 were within 250 feet of manned aircraft,
    o
    27 were at the same altitude as the manned aircraft,
    o
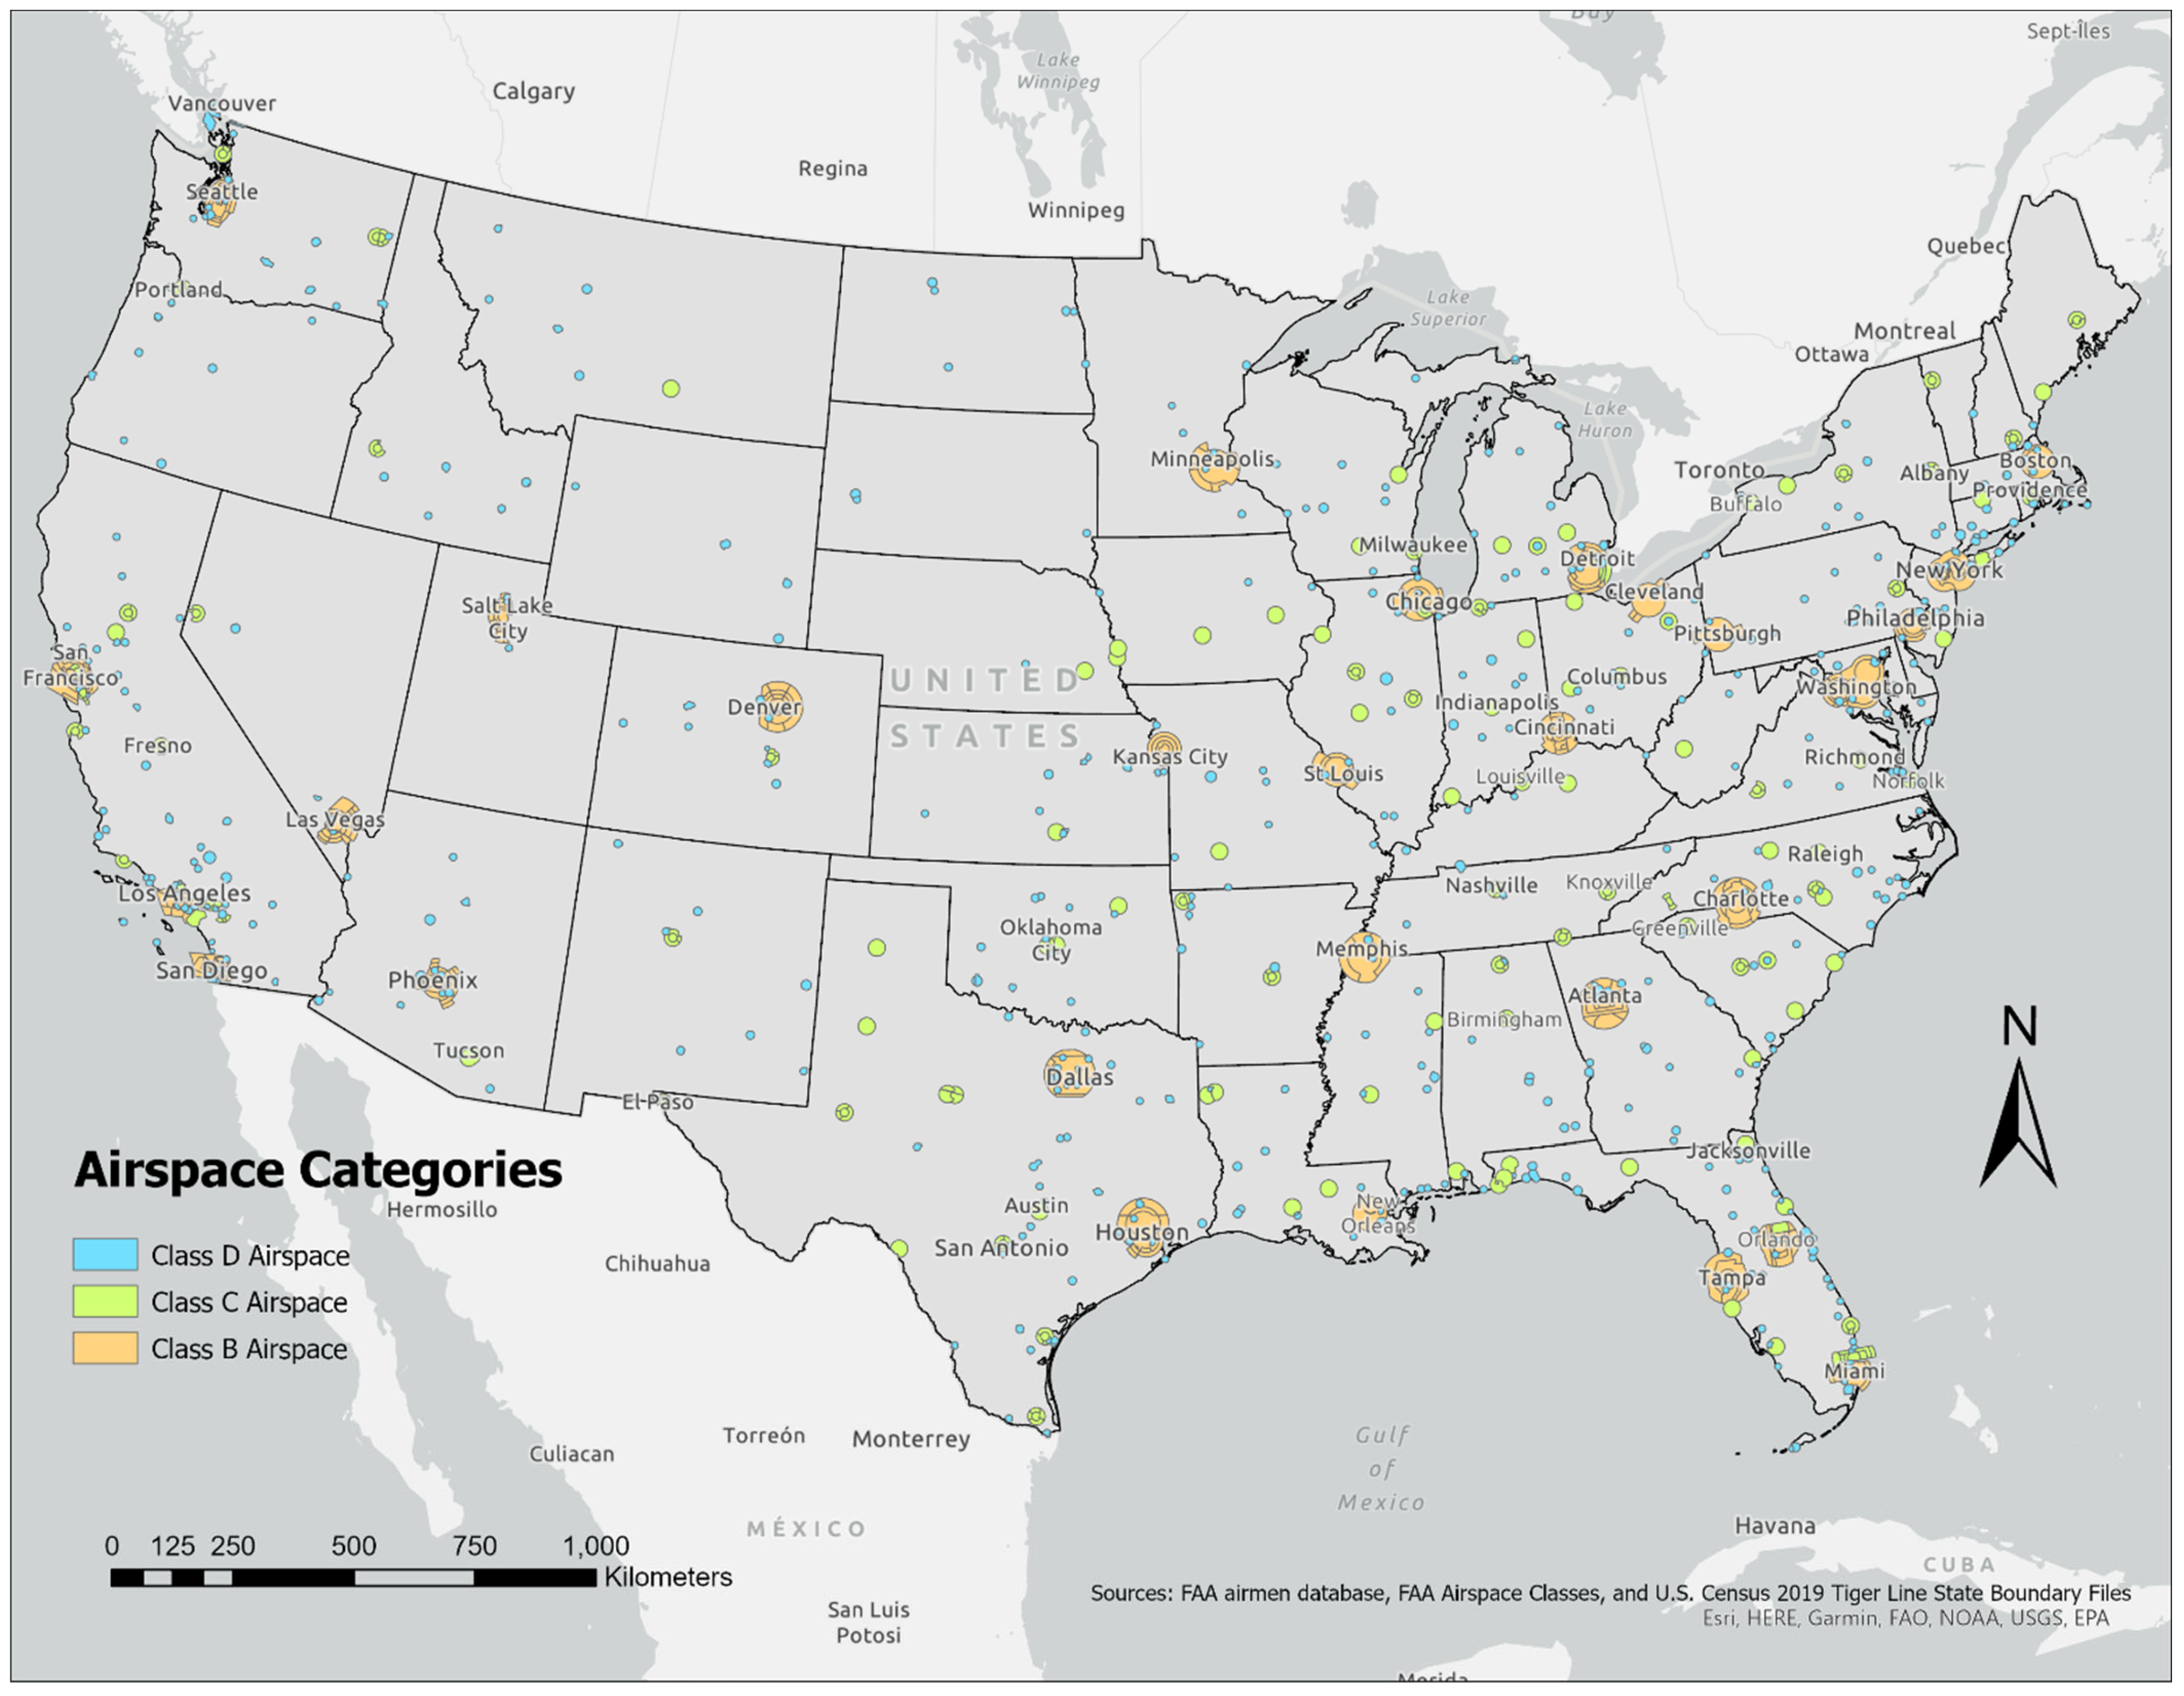
    260 were within Class B and C airspace,
    o
    25 required manned aircraft to take evasive action to avoid a collision.
These UAS sighting reports however are limited in that the location information is not a specific geographical location but is reported as general compass heading, area, and/or distance from the aircraft, navigational aid, airport, or city. This does not allow for easy interpretation or comparison to other GIS data, such as airport location, or pilot address.
Huang et al. [32] investigated the sociodemographic factors of UAS users and their relationship with regulatory compliance. As part of this study, researchers attempted to determine the respondents’ locations by their IP address and asked them to select their location across four undefined categories (large city, rural, small city, or suburb). Their research found that over 50% of participants indicated they lived near a large city. However, the survey did not utilize any formal techniques to spatially locate respondents within a GIS. Results from the survey mainly determined how respondents utilized UAS, with 85% of respondents indicating they were recreational users, and the research did not report on whether the respondents held any FAA airmen certificates. The researchers go on to suggest that location data may assist the FAA in developing more effective safety strategies.
Furthermore, the UAS sighting research did not explore related data, such as pilot demographics, population data, or UAS registration data. Another limitation of these sighting data is that the FAA does not investigate nor confirm most of these reported sightings, which may not involve a UAS but instead may be a case of mistaken identity, such as a balloon or bird [33]. Subsequent research attempted to address this limitation by using the DJI Aeroscope, which is a UAS detection technology that identifies the location of UAS manufactured by DJI and provides flight information such as the direction of travel, speed, and altitude [34]. Using the Aeroscope, researchers observed UAS activity within 10.78 miles of Tampa, Florida, over a 19-day period. Analyses of this data found multiple instances of UAS operations that posed a potential safety hazard to manned aircraft.
While this research aided in validating some sighting reports, it was limited to a small time frame and a limited geographical area, it was limited to only DJI-manufactured UAS, and it did not investigate other types of pilot or UAS data. Similarly, a review of the LAANC services data found no publicly available data where the location of airspace authorizations may be correlated with a specific geographical location, therefore limiting any comparison with sightings data and validating whether the UAS was in fact an unknown hazard. For example, a UAS reported as a sighting may have been authorized to operate in the area and was operated in coordination with local ATC.
Additionally, the federal government is faced with a record budget deficit nearing USD 3 trillion [35,36], which naturally impacts the FAA operating budget [37]. Likewise, the current and projected shortage of qualified aviation professionals further strains the human resources of both the FAA and the industry [38,39,40]. Coupled with the FAA’s increasing work scope, which includes the proliferation of AAM technology and commercial space operations, the FAA’s workload focus and oversight processes need to evolve given these resource limitations [41,42].
To help address these resource challenges, in 2017 the FAA developed the Integrated Oversight Philosophy (IOP) [43]. The IOP identifies principles for evolving safety oversight systems to better enable the FAA in meeting the challenges of a rapidly changing U.S. aerospace system. The IOP is part of the FAA’s culture shift to be proactive and collaborative in using safety management principles to address risk [44,45]. Integral to this policy is the FAA’s Risk-Based Decision Making (RBDM) Strategic Initiative, which leverages the use of consistent, data-informed approaches that may enable the FAA to make smarter, system-level, risk-based decisions [43,45,46]. RBDM emphasizes the review of safety data to integrate risk into decision making processes, developing risk-based models to more efficiently allocate the FAA’s limited oversight resources. The application of geospatial analysis within a GIS may provide data that contribute towards the FAA’s move towards RBDM by improving safety-related decision making and more efficient resource allocation.

3. Methods

3.1. Data Sources

The authors downloaded publicly available data and imported them into Environmental Systems Research Institute (ESRI) ArcGIS Pro (version 2.5.2) software. These data sources were: (1) the FAA AVS Registry; (2) U.S. Census TIGER lines files of states, counties, and zip codes; (3) the FAA shapefile of airports and their associated airspace classifications; and (4) FAA UAS sightings reports from 2014 to 2018.
The AVS Registry Database is comprised of two .csv files and includes pilot basic information and pilot certification information. These data include fields for a pilot’s unique ID, name, registration street address, certificate type, certification level, and ratings. Within these files are the addresses of 14 CFR Part 107 remote pilots (UAS pilots). Each pilot address can be geocoded as a point location within a GIS and contains valuable attribute information such as pilot rating and certification level. The U.S. Census TIGER line files comprise a collection of GIS boundary data layers that contain demographic attribute data that range from the state down to the census tract level. State, county, and zip code tract boundary files were downloaded for spatial pattern analysis to be conducted at these respective levels of scale.

3.2. Geocoding Methods

The FAA is not only responsible for issuing pilot certificates, but all airmen certificates, which also include mechanics, repairmen, air traffic controllers, ground instructors, parachute riggers, and navigators [13] (FAA, 2022d). To provide a geospatial perspective of the entire airmen population, a spatial query was performed to illustrate the size and distribution of the FAA Registered Airmen population across the continental U.S. (Figure 1). Referring to Figure 1, airmen records were plotted as point locations using the ArcGIS Pro geocoding tool. Each point represents the XY coordinate of an individual FAA Registered Airmen’s address. Although the airmen address does not equate to the exact location of their airspace operations, one may conclude that a large percentage of these airmen is conducting operations near their home address and associated airspace.
The FAA UAS sighting reports and a frequency count of the incidents reported per city over the 2014–2018 period were also geocoded (Figure 2), but the way these sightings are reported is only as precise as the named city location. Because of the imprecise means of the way UAS sightings are reported, these geocoded locations were used in later analyses only for a generalized and imprecise comparison between airmen registration densities and reported sightings. The FAA airspace category layer was also downloaded and queried to show only airspace classes B, C, and D within the continental United States (Figure 3). This data layer allowed for later implicit geographic comparisons with airmen density patterns and UAS sightings.

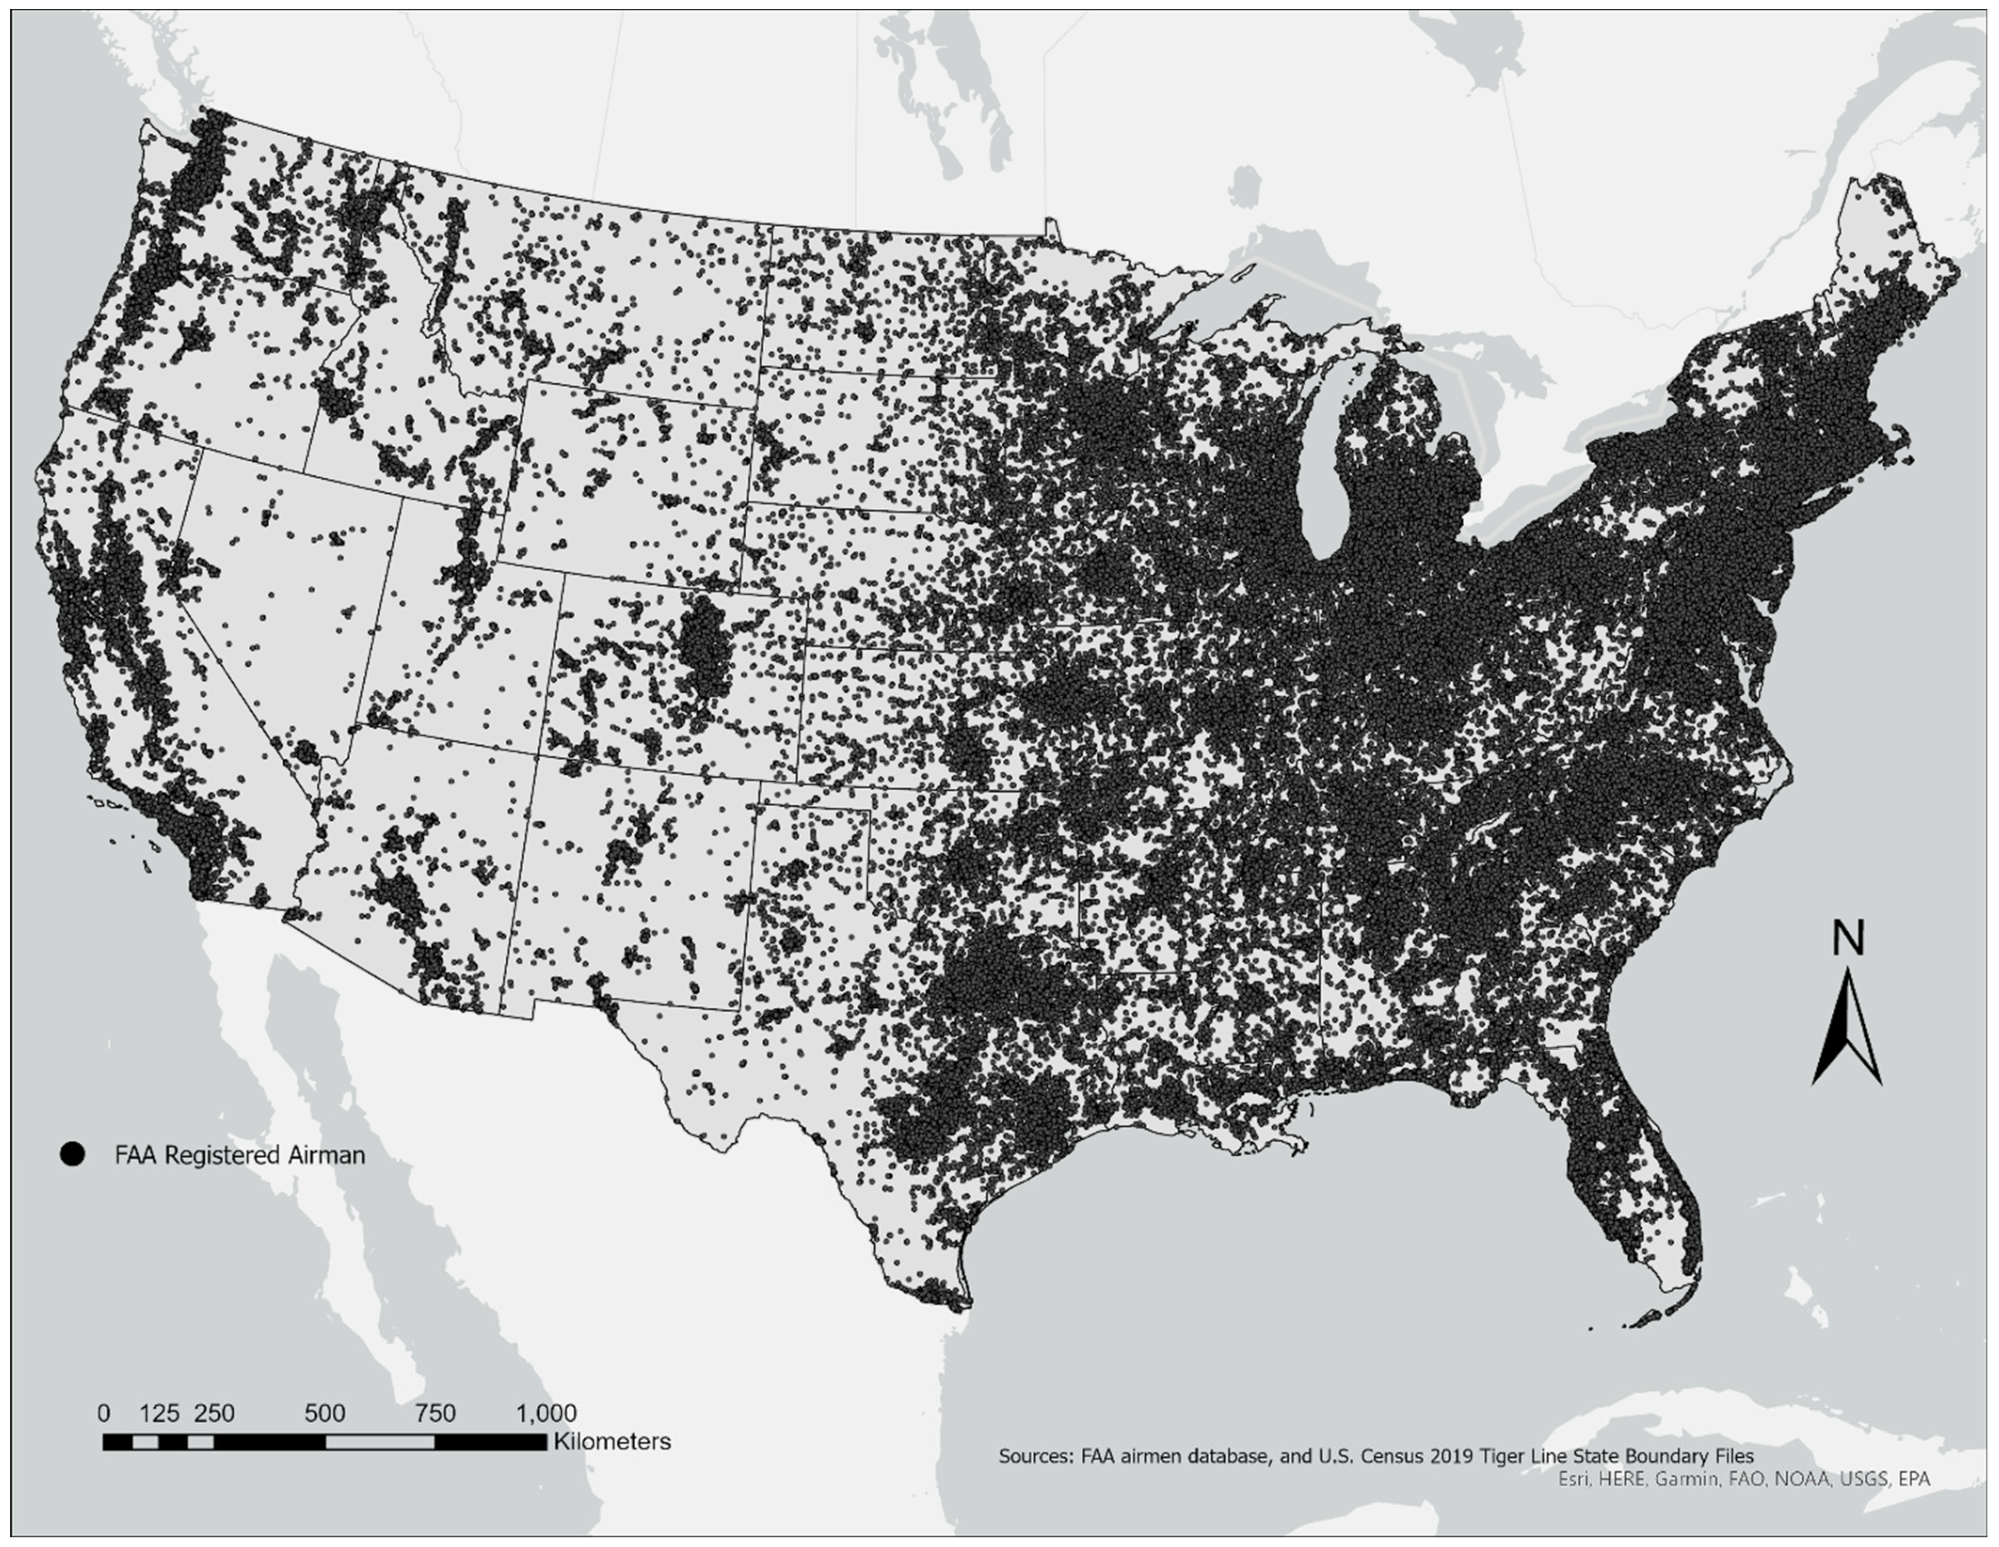
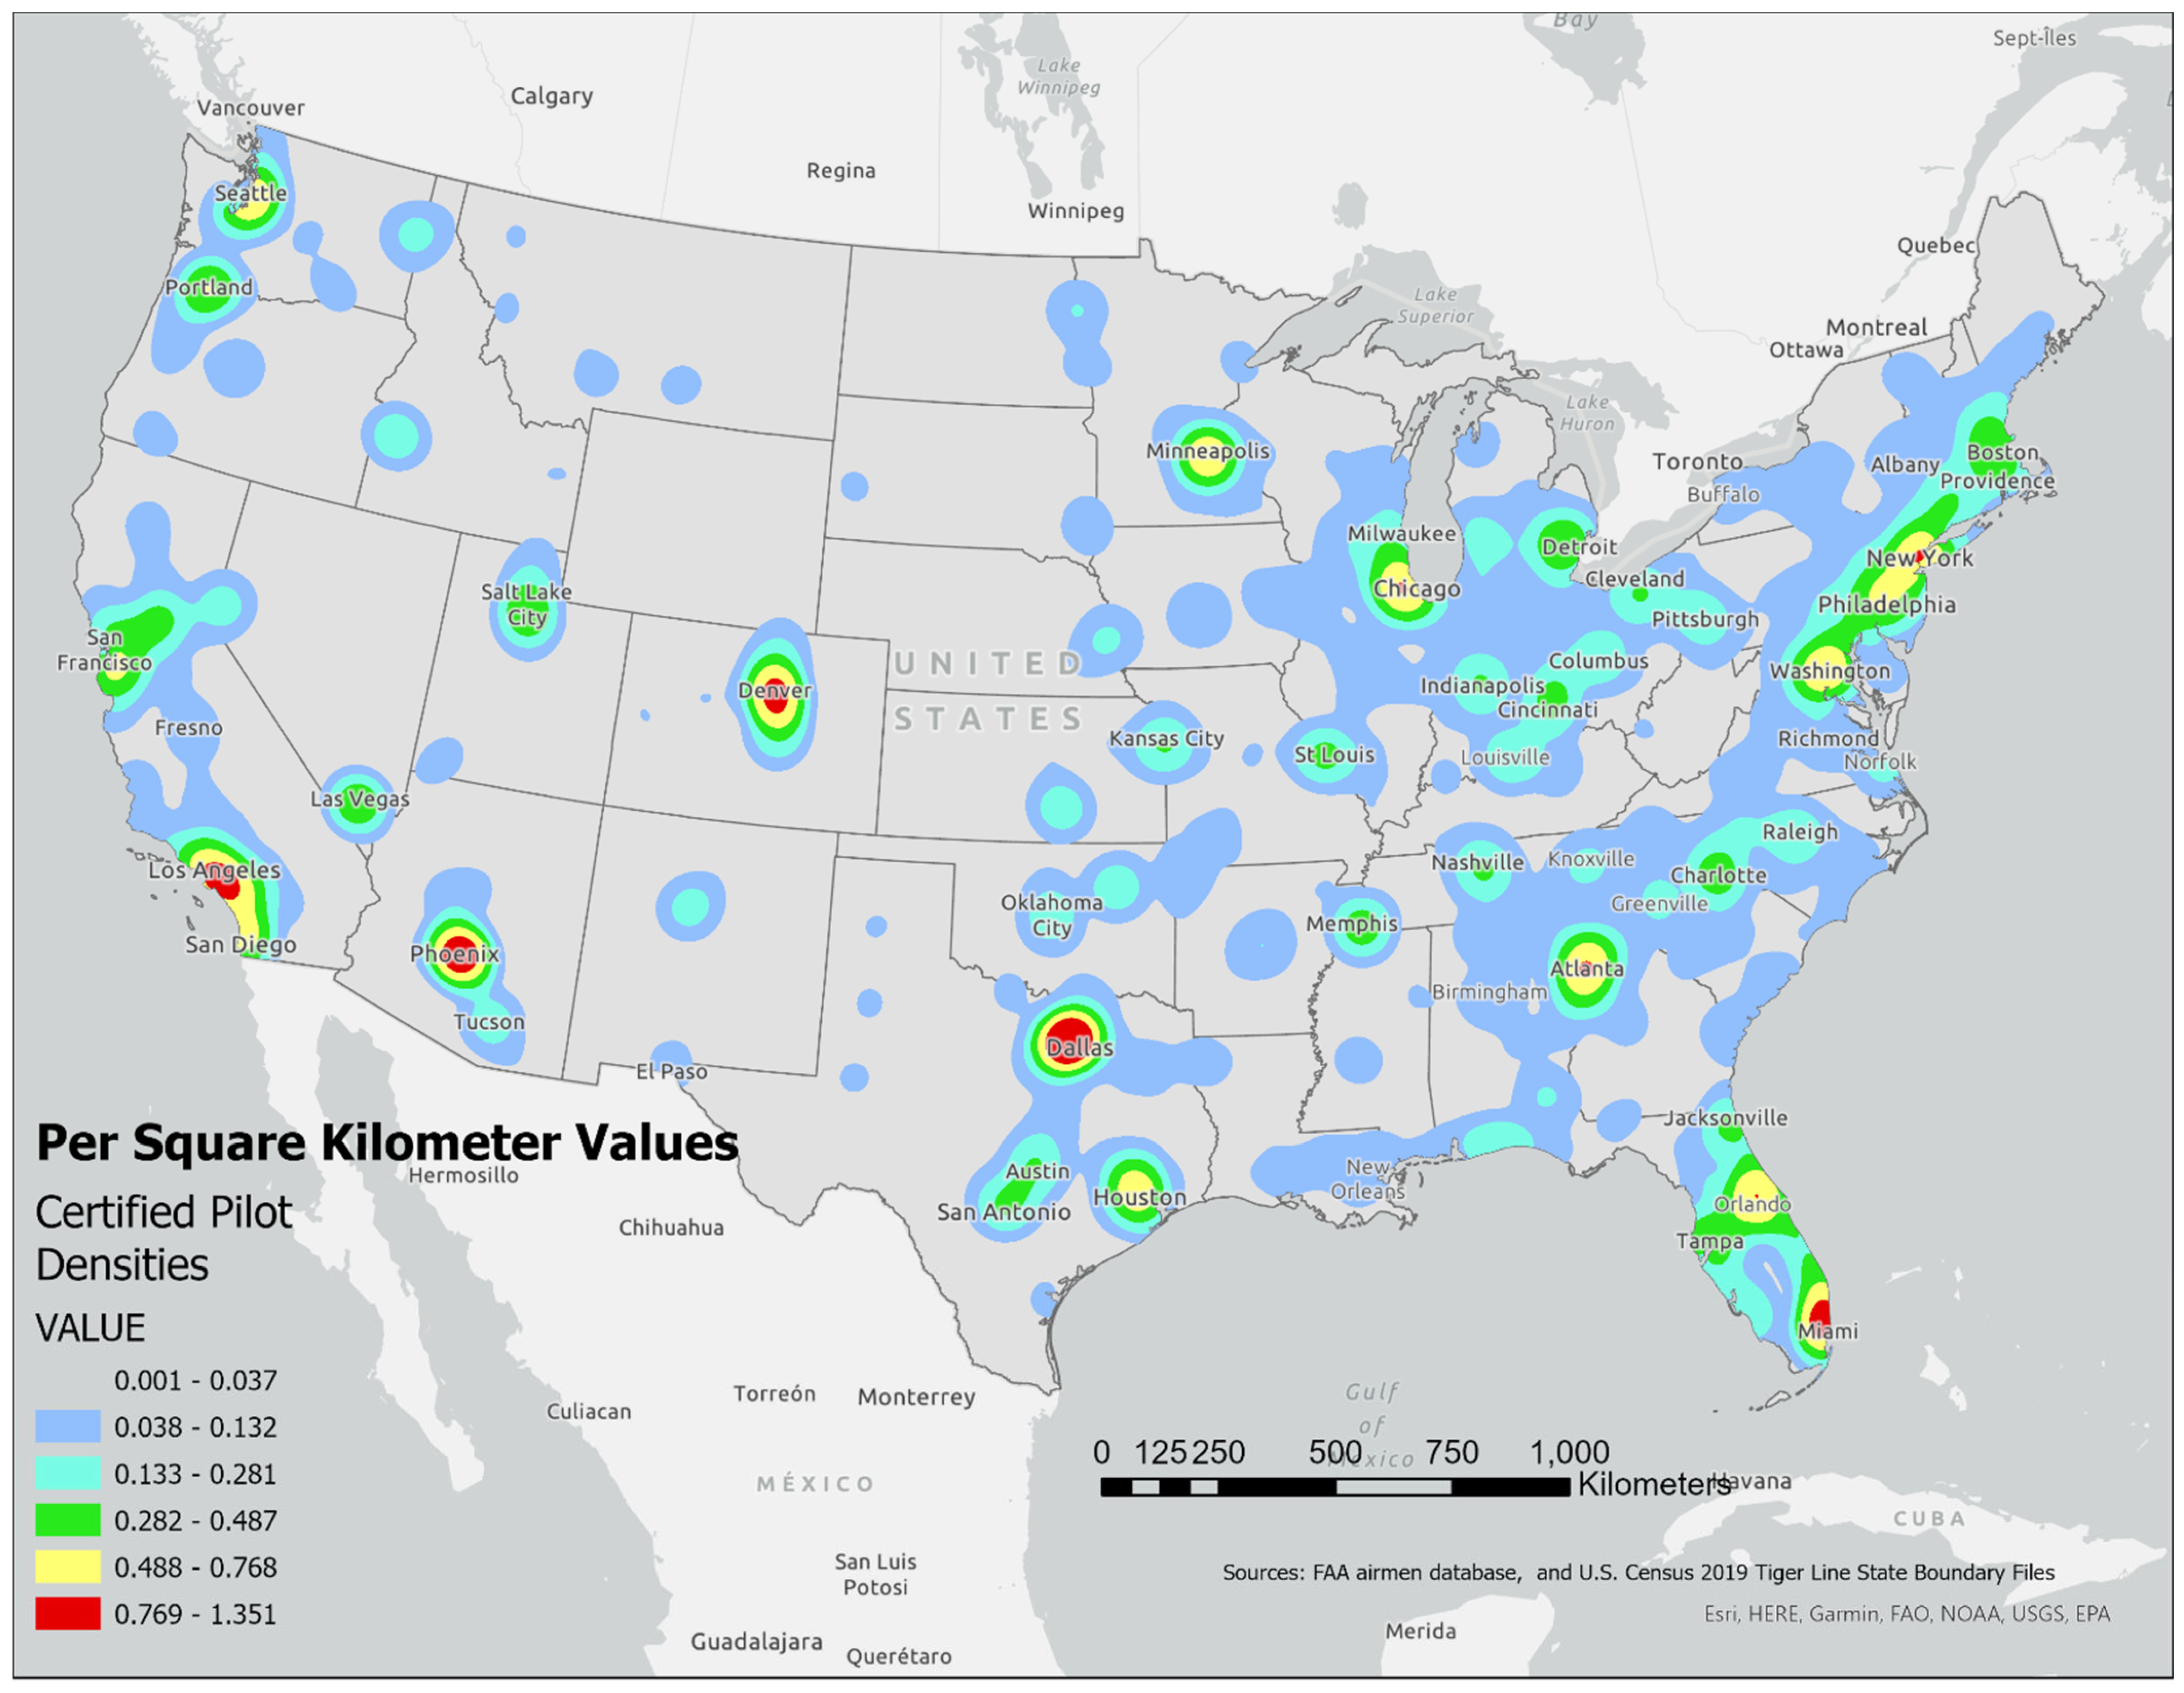
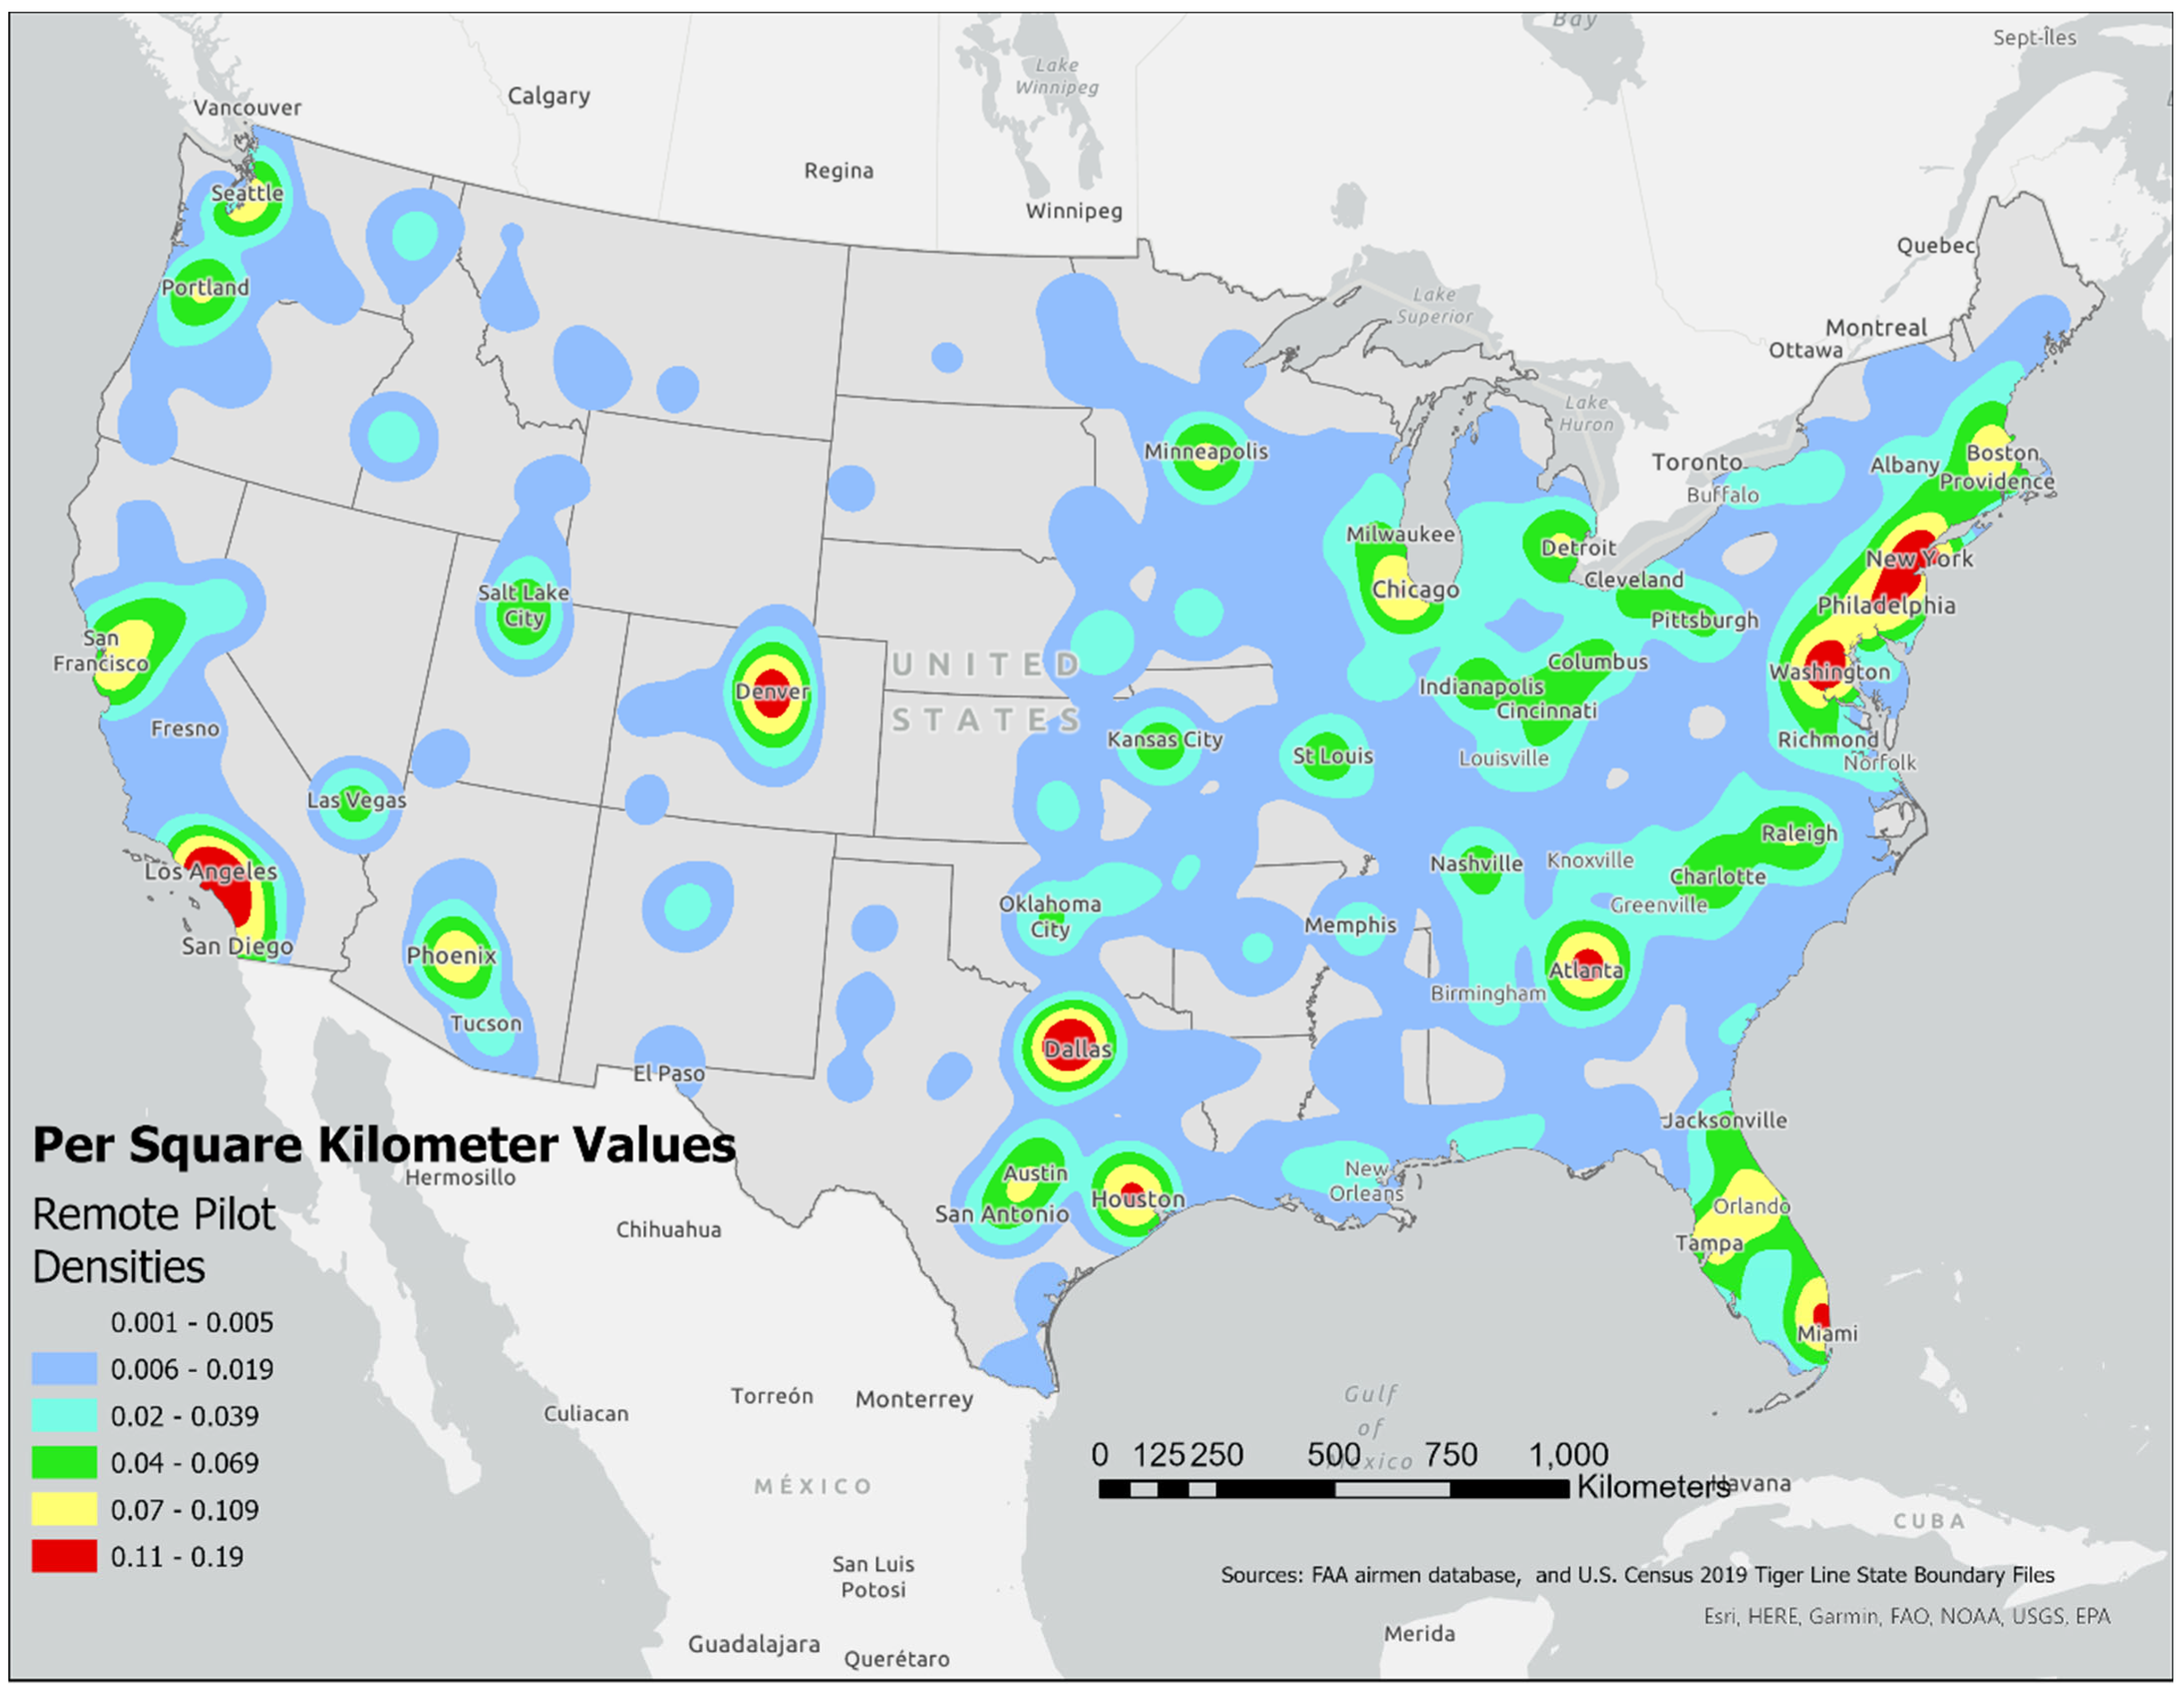
3.3. Airmen Geospatial Analysis

A cursory examination of Figure 1 not only illustrates the large number of FAA Registered Airmen within the continental United States, but also that discerning any spatial distribution patterns is not possible without some form of geostatistical cluster analysis. To better understand registered airmen patterns, attribute queries were performed to select and extract points for the creation of new data layers for the pilot registrations pertinent to the study (Table 2). For example, Registered Manned Pilots were queried and then extracted to generate a layer containing only these pilots. (Figure 4). For the Registered Manned Pilots layer, recreational pilots were removed due to their low population (n = 79), and student pilots were removed due to their high level of inactivity. By generating a new data layer for these different airmen categories, a spatial analysis could be performed on each layer to determine if clustering and density patterns varied between the airmen categories. By noting these patterns, a foundational understanding can be established of remote pilot clustering in urban versus remote areas, and if they tend to significantly reside in the same areas as manned and commercial pilots. This is a more precise means of establishing where registered remote pilots reside than using IP addresses from a survey, as reported by Huang et al. [32], and follows up on the suggestion for more precise location-based data of UAS pilots.
Airmen distribution patterns related to point clustering and density were examined for each queried data layer by experimenting with several different spatial analyst tools using ArcPro 2.8 software spatial analyst extension. Density patterns were examined using the hotspot analyst tool by examining the number of pilots within a given unit area at the county, zip code, and within a 10 square kilometer unit area. Ultimately, the hotspot analysis per unit area yielded coarse results that did not reveal clustered density patterns. The Kernel Density tool in ArcGIS Pro proved to be much more effective in identifying clustered density patterns. While the hotspot analysis tool is much better suited for analysis that contains attribute values of a given count of incidents at a given point such as with crime reporting, the Kernel Density tool is calculated by adding the values of all the kernel surfaces where they overlay the raster cell center. Thus, it is a spatial analysis tool that calculates a magnitude-per-unit area from a point or polyline features using a kernel function to fit a smoothly tapered surface to each point or polyline. Although a search radius can be set for the tool, the tool yields better results by utilizing a built-in algorithm to find the ideal search radius or bandwidth for clusters that exclude points considered outliers in the density analysis. The tool begins by calculating the mean center of the input points and then calculates the distance from the weighted mean of all points. Next, the weighted median of that distance is calculated, and a standard distance is calculated and used to identify a key search radius [47]. The density values in the output maps provide density ranges based on the calculated variance in the search radius. The output data layer is a continuous surface raster model that provides unit area density values per pixel. The unit area in this study was square kilometers, and the output pixel size was set to 50 km. A Kernel Density analysis with these parameters was performed on the Registered Commercial Pilot, Registered Manned Pilot, and Registered Remote Pilot data layers.

4. Results

Overall results from the Kernel Density analysis revealed clustering within urban areas and corridors such as the Mid-Atlantic, Northeast, Florida, and Southern California. The results illustrate that Registered Commercial Pilots are most often found in highly populated areas (Figure 5), which is not unexpected. Examples are Southern California, Northern California, Houston Texas, Chicago Illinois, and around New York City. Clustering of commercial pilots is especially apparent around major airport hubs outside of the urban corridors, as seen with clustering in urban areas such as Denver, Dallas, and Minneapolis (Figure 5).
Kernel Density patterns for Registered Manned Pilots, which includes all forms of registered manned pilots excluding student and recreational, showed a similar clustering pattern (Figure 6). The number of registered pilots is much higher than commercial pilots, yet the same clustering can be seen in urban areas, particularly in the Northeastern United States and Florida. The clustering has its highest density in the Dallas Fort Worth metro area, but Florida has the largest cluster of registered pilots.
An implicit geospatial comparison of Registered Manned Pilots to Registered Remote Pilots illustrated a significant overlap between where manned and remote pilots reside (Figure 7). This overlap is notable as it suggests a significant amount of commercial UAS activities may be occurring within urban areas, which are often near airports and within controlled airspace. This finding is further supported by the fact that since 2017, the FAA has issued over 1 million authorizations for UAS operations in controlled airspace. Early on, commercial drone operations in the U.S. were largely limited to uncontrolled airspace, which is typically located away from airports and in less densely populated areas [21,48]. As such, initial commercial UAS applications were primarily in agriculture, mining (quarries), and forestry—areas most often in remote locations. However, reviewing these kernel density maps, along with the growing number of LAANC issued airspace authorizations, the data suggest a pattern of manned and unmanned pilots increasingly sharing the same airspace in urban areas. A review of market statistics further supports the growing use of drones in urban environments where the construction and real estate industries are leaders in adopting drone technologies. According to Drone Base [49], in 2019 the use of drones on construction projects increased by 239%. The worldwide growth in urban populations and the demand for virtual home tours are fueling the growth of the real estate drone market, which is forecast to grow to USD 1.2 billion by 2030 [50,51]. The number of cities adopting drones to improve emergency response is also on the increase [52,53].
To gain insight into the number of manned pilots who may also possess a remote pilot certificate, the authors queried the AVS Registry and found that about 25% of certificated remote pilots also possess a Part 61 pilot certificate. To further examine this finding, the authors analyzed the FAA Annual Airmen Knowledge Test Statistics regarding the UAG and found that 237,350 people have passed this test since 2016 [54,55]. The cost to take the test is between USD 150 and 160 [56]. If we assume those taking the test were all nonpilots and they all successfully completed the application process, then this suggests approximately 85% of the certificated remote pilots obtained their certificate via the nonpilot process, and only 15% of these remote pilots also have a Part 61 pilot certificate. Collectively, these two findings suggest a large contingent of the manned pilot population does not possess a remote pilot certificate; therefore, the certification overlap between the Part 107 remote pilot population and the Part 61 pilot population is low. The authors attempted to delineate between remote pilots holding a Part 61 certificate and those not holding a Part 61 certificate but found the airmen database did not provide a means to filter this data down to individual airmen and their corresponding address.
To implicitly compare UAS sightings data with remote pilot location density, the authors created a map (Figure 8) that overlays UAS sighting location data from 2014 to 2018 over the 2019 remote pilot kernel density from Figure 7. Reviewing this map, we see a high correlation between reported sighting locations and areas where remote pilot density is high. Comparisons with the Figure 3 airspace map also show a high correlation with areas of higher remote pilot density and locations of UAS sightings. This further suggests an increase in the proximity of manned and unmanned operations near airports and urban areas. However, as mentioned earlier, these comparisons are limited due to the imprecision of sighting location reported to a named city. This also limits comparisons of the sighting data with controlled airspace. Similarly, a lack of LAANC airspace authorization location data also limits further data comparisons.

5. Discussion and Conclusions

This study explored how various forms of geospatial analysis could be utilized to assist aviation safety practitioners in better identifying potential areas of higher risks, and by extension build a foundational geospatial dataset for the overall process of safety risk management using GIS technology. By providing a unique geospatial overview of airmen distribution patterns, the authors discovered correlations between UAS pilots, controlled airspace, and densely populated areas. The results suggest drones and manned aircraft are increasingly operating in shared airspace and support the projections of growing UAS operations in urban areas. These results were intended to serve as a foundational dataset to draw implicit relationships for future research that draws upon other forms of data such as manned aircraft flight patterns and better UAS sighting and flight pattern data. While the patterns on the maps may come across as unsurprising and non-revealing, they help to confirm, in a cartographic manner, patterns that a non-spatial record-based database cannot.
UAS sighting analyses in this research were limited due to a lack of publicly available precise geographic coordinate locational data regarding UAS sightings and LAANC-issued airspace authorizations. Precise location data of UAS sightings and flight patterns would enable explicit rather than implicit comparisons between locations of manned and remote pilots, providing a more robust picture of UAS operations and identification of higher risk locations. This research suggests that by identifying potential areas of higher risks, safety practitioners may focus their efforts on examining any potential hazards associated with these locations and developing appropriate risk mitigations.
For example, each UAS sighting may be compared using location-based queries against an airspace map, the location of airspace authorizations, and position information from the Automatic Dependent Surveillance-Broadcast (ADSB) from manned aircraft [32,57]. By comparing these data, one may determine the location and number of potential UAS airspace violations or areas where UAS and manned aircraft operations often coexist. In identifying these high traffic areas, airspace authorities may examine existing traffic patterns and implement revised procedures to minimize risk. A possible solution to improving UAS sighting data is the use of remote identification (ID) technology. The FAA recently established part 89 regulations that will require most UAS to be equipped with remote ID technology by 16 September 2023 [58]. Remote ID technology enables a UAS in flight to provide identification and geolocation data that can be received by other parties. This new technology has the potential to provide researchers with highly accurate UAS position data and enables richer forms of GIS analyses for better risk management. Taking these concepts one step further, in the future if the FAA provides more precise location data of FAA UAS airspace authorizations, more robust forms of airspace geospatial analyses could be conducted using GIS technology. NASA is developing an Unmanned Traffic Management (UTM) system for UAS to maintain safe and efficient airspace operations. This technology is seen as a key to enabling the full potential that unmanned aviation may provide but will require a diverse array of risk management processes to ensure safety and, by extension, public acceptance. Geospatial analyses incorporating GIS technology may help stakeholders manage risks in future UTM operations.
Safety promotion is one of the four components of a robust SMS and includes training, communication, and dissemination of lessons learned [59]. The GIS datasets developed in this study may enable safety practitioners to provide more focused safety promotion by better targeting geographic locations and populations. For example, the FAA Safety Team (FAAST) [55] may partner with local community-based organizations (such as the Academy of Model Aeronautics or Association of Uncrewed Vehicle Systems International (AUVSI)) and conduct safety promotion activities to disseminate regional safety concerns and education. Similarly, in October 2019, the United States Government Accountability Office issued a report to Congress highlighting that the FAA’s approach to UAS regulatory compliance and enforcement could benefit from improved data and communication with local law enforcement [60,61]. The type of analyses discussed in this paper may provide a powerful tool that facilitates improved collaboration between the FAA and law enforcement, such as targeted enforcement of specific geographic locations or identification of risky UAS operators.
Other potential actions might include examining current UAS airspace authorization processes at the local level that may inadvertently contribute to manned and unmanned aircraft operating within close proximity, or targeted deployment of drone detection technology, similar to the DJI Aeroscope, to assist local ATC with tracking UAS traffic or identifying unauthorized operations. Overall, the maps produced from this study build a foundational application of GIS that creates a spatial perspective to an FAA airmen aviation database that may provide safety practitioners with a powerful tool for identifying areas of higher risk and ensuring an acceptable level of safety as future UAS operations expand.

Author Contributions

Conceptualization, D.J.L. and J.P.H.; methodology, J.P.H.; software, J.P.H.; validation, D.J.L.; formal analysis, J.P.H.; investigation, D.J.L. and J.P.H.; writing—original draft preparation, D.J.L. and J.P.H.; writing—review and editing, J.P.H. and D.J.L.; visualization, J.P.H. All authors have read and agreed to the published version of the manuscript.

Funding

This research received no external funding.

Institutional Review Board Statement

Not applicable.

Informed Consent Statement

Not applicable.

Data Availability Statement

Data available from authors upon request.

Conflicts of Interest

The authors declare no conflict of interest.

References

  1. IMARC. Drones Market: Global Industry Trends, Share, Size, Growth, Opportunity and Forecast 2022–2027. 2022. Available online: https://www.imarcgroup.com/drones-market (accessed on 28 July 2022).
  2. Jonas, A. Are Flying Cars Preparing for Takeoff? Morgan Stanley Research, 23 January 2019. Available online: https://www.morganstanley.com/ideas/autonomous-aircraft(accessed on 16 August 2022).
  3. Federal Aviation Administration (FAA). Drones by the Numbers. 2022. Available online: https://www.faa.gov/uas/resources/by_the_numbers/ (accessed on 28 July 2022).
  4. Federal Aviation Administration (FAA). FAA Releasable 2021 Aircraft Registration Database. 2022. Available online: https://www.faa.gov/licenses_certificates/aircraft_certification/aircraft_registry/releasable_aircraft_download (accessed on 28 July 2022).
  5. Federal Aviation Administration (FAA). FAA Reaches One Million Airspace Authorizations for Drone Pilots; Federal Aviation Administration: Washington, DC, USA, 2022. Available online: https://www.faa.gov/newsroom/faa-reaches-one-million-airspace-authorization-drone-pilots (accessed on 6 March 2022).
  6. Federal Aviation Administration (FAA). Airports Participating in LAANC. 2022. Available online: https://www.faa.gov/uas/programs_partnerships/data_exchange/laanc_facilities (accessed on 12 August 2022).
  7. Hubbard, S.; Pak, A.; Gu, Y.; Jin, Y. UAS to Support Airport Safety and Operations: Opportunities and Challenges. J. Unmanned Veh. Syst. 2017, 6, 1–17. [Google Scholar] [CrossRef] [Green Version]
  8. Mackie, T.; Lawrence, A. Integrating unmanned aircraft systems into airport operations: From buy-in to public safety. J. Airpt. Manag. 2019, 13, 380–390. [Google Scholar]
  9. Sichko, P. Integrating unmanned aerial system operations into the Dallas/Fort Worth airport environment. J. Airpt. Manag. 2019, 13, 206–214. [Google Scholar]
  10. Tomic, L.; Cokorilo, O.; Macura, D. Runway Pavement Inspections Using Drone—Safety Issues and Associated Risks. Int. J. Traffic Transp. Eng. 2020, 10, 278–285. [Google Scholar] [CrossRef]
  11. Chauhan, B.B.; Carroll, M. Human Factors Considerations for Urban Air Mobility. In Proceedings of the 21st International Symposium on Aviation Psychology, Online, 18–21 May 2021; pp. 7–12. Available online: https://corescholar.libraries.wright.edu/isap_2021/2 (accessed on 12 May 2022).
  12. Kamienski, J.; Semanek, J. ATC Perspectives of UAS Integration in Controlled Airspace. Procedia Manuf. 2015, 3, 1046–1051. [Google Scholar] [CrossRef]
  13. Federal Aviation Administration (FAA). Civil Aviation Registry-Airmen Certification Branch—Responsibilities. 2022. Available online: https://www.faa.gov/about/office_org/headquarters_offices/avs/offices/afx/afb/afb700/cert_responsibilities (accessed on 28 July 2022).
  14. Collins, M. Medical Certification Options: Fit to Fly? Aircraft Owners and Pilots Association: Frederick, MD, USA, 2020; Available online: https://www.aopa.org/news-and-media/all-news/2020/april/you-can-fly/medical-certification-options-fit-to-fly (accessed on 28 July 2022).
  15. Federal Aviation Administration (FAA). What Are the Differences in the Types of Pilot Licenses (Certificates)? 2022. Available online: https://www.faa.gov/faq/what-are-differences-types-pilot-licenses-certificates (accessed on 28 July 2022).
  16. Federal Aviation Administration (FAA). Airmen Certification System Active Pilots Summary. 2022. Available online: https://registry.faa.gov/activeairmen/M70_Active_Pilots_Summary.pdf (accessed on 12 May 2022).
  17. Federal Aviation Administration (FAA). Become a Pilot—Medical Certificate Requirements. 2022. Available online: https://www.faa.gov/pilots/become/medical/ (accessed on 28 July 2022).
  18. Federal Aviation Administration (FAA). Become a Pilot—Student Pilot Certificate Requirements. 2022. Available online: https://www.faa.gov/pilots/become/student_cert/ (accessed on 28 July 2022).
  19. Aircraft Owners and Pilots Association (AOPA). The Flight Training Experience: A Survey of Students, Pilots, and Instructors. 2010. Available online: https://download.aopa.org/epilot/2011/AOPA_Research-The_Flight_Training_Experience.pdf (accessed on 28 July 2022).
  20. Beckett, J. I Quit. General Aviation News, 22 November 2016. Available online: https://generalaviationnews.com/2016/11/22/i-quit/(accessed on 28 July 2022).
  21. Federal Aviation Administration (FAA). The FAA’s New Drone Rules are Effective Today; Press Release. 2016. Available online: https://www.faa.gov/news/updates/?newsId=86305 (accessed on 12 May 2022).
  22. Federal Aviation Administration (FAA). NextGen Implementation Plan. March 2016. Available online: https://www.faa.gov/nextgen/media/nextgen_implementation_plan-2016.pdf (accessed on 1 March 2018).
  23. Federal Aviation Administration (FAA). Become a Drone Pilot. 2022. Available online: https://www.faa.gov/uas/commercial_operators/become_a_drone_pilot (accessed on 12 August 2022).
  24. Federal Aviation Administration (FAA). How to Register Your Drone. 2023. Available online: https://www.faa.gov/uas/getting_started/register_drone (accessed on 12 January 2023).
  25. Avram, A.; Andries, P. The use of GIS in aviation. J. Young Sci. 2014, 2, 141–144. [Google Scholar]
  26. Shepardson, D. FAA Details Impact of Drone Sightings on Newark Airport. Reuters. 2019. Available online: https://www.reuters.com/article/us-usa-drones/faa-details-impact-of-drone-sightings-on-newark-airport-idUSKCN1PH243 (accessed on 21 July 2022).
  27. Wendt, P.; Voltes-Dorta, A.; Suau-Sanchez, P. Estimating the costs for the airport operator and airlines of a drone-related shutdown: An application to Frankfurt international airport. J. Transp. Secur. 2020, 13, 93–116. [Google Scholar] [CrossRef]
  28. Dobush, G. Dubai Airport Disrupted by ‘Unauthorized Drone Activity’. Fortune. 2019. Available online: https://fortune.com/2019/02/15/dubai-airport-disrupted-drone/ (accessed on 21 July 2022).
  29. Pyrgies, J. The UAVs threat to airport security: Risk analysis and mitigation. J. Airl. Airpt. Manag. 2019, 9, 63–96. [Google Scholar] [CrossRef] [Green Version]
  30. Federal Aviation Administration (FAA). UAS Sightings Report (2016–2021). 2022. Available online: https://www.faa.gov/uas/resources/public_records/uas_sightings_report/ (accessed on 13 February 2022).
  31. Fort Hill Group. UAS Sightings in the USA. Available online: http://www.forthillgroup.com/uas-sightings (accessed on 19 July 2022).
  32. Huang, C.; Chen, Y.-C.; Harris, J. Regulatory compliance and socio-demographic analyses of civil Unmanned Aircraft Systems users. Technol. Soc. 2021, 65, 101578. [Google Scholar] [CrossRef]
  33. Wang, C.; Hubbard, S.M. Characteristics of Unmanned Aircraft System (UAS) Sightings and Airport Safety. J. Aviat. Technol. Eng. 2021, 10, 2. [Google Scholar] [CrossRef]
  34. Wallace, R.J.; Kiernan, K.M.; Robbins, J.; Haritos, T.; Loffi, J.M. Evaluating Small UAS Operations and National Airspace System Interference Using AeroScope. J. Aviat. Technol. Eng. 2019, 8, 24–39. [Google Scholar] [CrossRef]
  35. DataLab. Federal Budget Deficit Trends over Time. 2022. Available online: https://datalab.usaspending.gov/americas-finance-guide/deficit/trends/ (accessed on 11 August 2022).
  36. Tankersley, J. U.S. Deficit Expected to Hit $3 Trillion in 2021. The New York Times, 2 July 2021. Available online: https://www.nytimes.com/2021/07/01/business/economy/united-states-deficit.html(accessed on 17 August 2022).
  37. Department of Transportation (DOT). FAA Top Policy Issues: FAA Reauthorization and Governance. 2018. Available online: https://www.transportation.gov/transition/FAA/Top-Policy-Issues (accessed on 18 October 2018).
  38. Aviation International News (AIN). Aviation Orgs Unite in Call for Help on Worker Shortage. 2019. Available online: https://www.ainonline.com/aviation-news/business-aviation/2019-02-07/aviation-orgsunite-call-help-worker-shortage (accessed on 16 June 2019).
  39. Federal Aviation Administration (FAA). FAA Aerospace Forecast Fiscal Years 2019–2039. 2018. Available online: https://www.faa.gov/data_research/aviation/aerospace_forecasts/media/FY2019-39_FAA_Aerospace_Forecast.pdf (accessed on 19 July 2022).
  40. Federal Aviation Administration (FAA). Aviation Safety Workforce Plan: 2018–2027. 2019. Available online: https://www.faa.gov/about/plans_reports/media/fy18_avs_wfp.pdf (accessed on 16 June 2019).
  41. Aviation International News (AIN). Air Charter Safety Foundation Safety Symposium Focuses on SMS, FAA Enforcement Actions. 9 May 2012. Available online: http://www.ainonline.com/aviation-news/2012-05-09/acsf-safety-symposium-focuses-sms-faaenforcement-actions (accessed on 12 May 2022).
  42. Boeing Commercial Airplanes. Current Market Outlook, 2019–2038. 2019. Available online: https://www.boeing.com/commercial/market/commercial-market-outlook/ (accessed on 27 April 2019).
  43. Federal Aviation Administration (FAA). FAA Integrated Oversight Philosophy. FAA Order 8000.72. 2017. Available online: https://www.faa.gov/documentLibrary/media/Order/FAA_Order_8000.72_s.pdf (accessed on 21 July 2022).
  44. U.S. Department of Transportation, Office of Inspector General (OIG). FAA Has Made Progress Implementing NextGen Priorities, but Additional Actions Are Needed to Improve Risk Management. Report No. AV2018001. 18 October 2017. Available online: https://www.oig.dot.gov/sites/default/files/FAA%20Progress%20Implementing%20NextGen%20Priorities%20Final%20Audit%20Report%5E10-18-17.pdf (accessed on 12 January 2023).
  45. U.S. Government Accountability Office (GAO). Unmanned Aircraft Systems, FAA’s Compliance and Enforcement Approach for Drones Could Benefit from Improved Communication and Data. GAO Report to Congress: GAO-20-29. 2023. Available online: https://www.gao.gov/assets/gao-20-29.pdf (accessed on 3 March 2023).
  46. Flight Safety Foundation (FSF). Risk Based Decision Making. AeroSafety World, 7 November 2015. Available online: https://flightsafety.org/asw-article/risk-based-decision-making/(accessed on 12 January 2023).
  47. Silverman, B.W. Density Estimation for Statistics and Data Analysis; Routledge: Abingdon, UK, 2018. [Google Scholar]
  48. Association of Unmanned Vehicle Systems International (AUVSI). Global Trends of Unmanned Aerial Systems; Danish Technological Institute: Taastrup, Denmark, 2018; Available online: https://02f09e7.netsolhost.com/AUVSIDocs/Global%20Trends%20for%20UAS.pdf (accessed on 26 August 2022).
  49. Drone Base. Drone Impact on the Construction Industry: A Statistical Round-Up. 2019. Available online: https://blog.dronebase.com/drone-impact-on-the-construction-industry-a-statistical-round-up (accessed on 27 August 2022).
  50. Siniak, N.; Kauko, T.; Shavrov, S.; Marina, N. The impact of proptech on real estate industry growth. IOP Conf. Ser. Mater. Sci. Eng. 2020, 869, 062041. [Google Scholar] [CrossRef]
  51. Statista. Real Estate Drone Market Size Worldwide from 2020 to 2030. 2022. Available online: https://www.statista.com/statistics/1234627/worldwide-real-estate-drone-market/ (accessed on 27 August 2022).
  52. Commercial UAV NEWS. Measuring the Value of Safety: How Drones Are Making Work Safer for Public Safety Agencies. 2022. Available online: https://www.commercialuavnews.com/public-safety/measuring-the-value-of-safety-how-drones-are-making-work-safer-for-public-safety-agencies (accessed on 27 August 2022).
  53. Zwęgliński, T. The Use of Drones in Disaster Aerial Needs Reconnaissance and Damage Assessment—Three-Dimensional Modeling and Orthophoto Map Study. Sustainability 2020, 12, 6080. [Google Scholar] [CrossRef]
  54. Federal Aviation Administration (FAA). The First U.S. Federal Pilot License. 2022. Available online: https://www.faa.gov/about/history/milestones/media/first_pilots_license.pdf (accessed on 17 August 2022).
  55. Federal Aviation Administration (FAA). FAA Safety Team (FAASTeam)—Safer Skies Through Education. 2022. Available online: https://www.faasafety.gov/ (accessed on 10 October 2022).
  56. PSI True Talent (PSI). FAA Airmen Knowledge Testing. 2023. Available online: https://faa.psiexams.com/faa/login (accessed on 12 January 2023).
  57. Zhang, S.; Zhang, Y.; Tay, T.; Shankar, J. Learning-based Aircraft Trajectory Analysis Tool for Holding and Vectoring Identification with ADS-B Data. In Proceedings of the 2022 IEEE 25th International Conference on Intelligent Transportation Systems (ITSC), Macau, China, 8–12 October 2022; pp. 1100–1105. [Google Scholar] [CrossRef]
  58. Federal Aviation Administration (FAA). UAS Remote Identification. 2023. Available online: https://www.faa.gov/uas/getting_started/remote_id (accessed on 23 January 2023).
  59. Federal Aviation Administration (FAA). Safety Management Systems. 2023. Available online: https://www.faa.gov/about/initiatives/sms/explained/components (accessed on 3 March 2023).
  60. U.S. Government Accountability Office (GAO). Small Unmanned Aircraft Systems: FAA should Improve Its Management of Safety Risks (Report No. GAO-18-110). 2018. Available online: https://www.gao.gov/assets/700/692010.pdf (accessed on 8 February 2022).
  61. U.S. Government Accountability Office (GAO). AVIATION SAFETY Actions Needed to Evaluate Changes to FAA’s Enforcement Policy on Safety Standards. GAO Report to Congress: GAO-20-642. 2020. Available online: https://www.gao.gov/assets/gao-20-642.pdf (accessed on 12 January 2023).
Figure 1. Geocoded point locations for FAA Registered Airmen within the continental U.S.
Safety 09 00018 g001
Figure 2. UAS sighting reports from 2014 to 2018 geocoded at the city level with frequency counts per city.
Safety 09 00018 g002
Figure 3. Airspace classes D, C, and B within the continental United States.
Safety 09 00018 g003
Figure 4. Geocoded point locations for FAA Registered Manned Pilots by certification level.
Safety 09 00018 g004
Figure 5. Kernel Density of FAA Registered Commercial Pilots.
Safety 09 00018 g005
Figure 6. Kernel Density of FAA Registered Manned Pilots.
Safety 09 00018 g006
Figure 7. Kernel Density of FAA Registered Remote Pilots.
Safety 09 00018 g007
Figure 8. UAS sighting report frequencies from 2014 to 2018 geocoded at the city level compared to 2019 remote pilot registration densities.
Safety 09 00018 g008
Table 1. Pilot Certification Population and Description.
Pilot
Certificate
DescriptionTotal
Population
StudentDesigned for the initial training period of flying. Must have a flight instructor present. May fly solo after instructor endorsement.252,452
RecreationalLimited to certain aircraft, number of passengers, distance, and types of airports.79
SportLimited to light-sport aircraft. 6837
PrivateMay carry passengers and provides for limited business use of an airplane. 168,971
CommercialMay conduct some operations for compensation and hire. 108,083
Airline TransportRequired to fly as captain by some air transport operations. 164,112
Remote PilotMay operate a UAS under the FAA’s Small UAS Rule (Part 107). 307,049
Table 2. List of pilot point location data layers generated by attribute query and extraction.
Layer NameLayer Description
FAA Registered AirmenGeocoded point location at the address level of all records within the airmen database
Registered Remote PilotsGeocoded point location for all records with a certification type of ‘U’
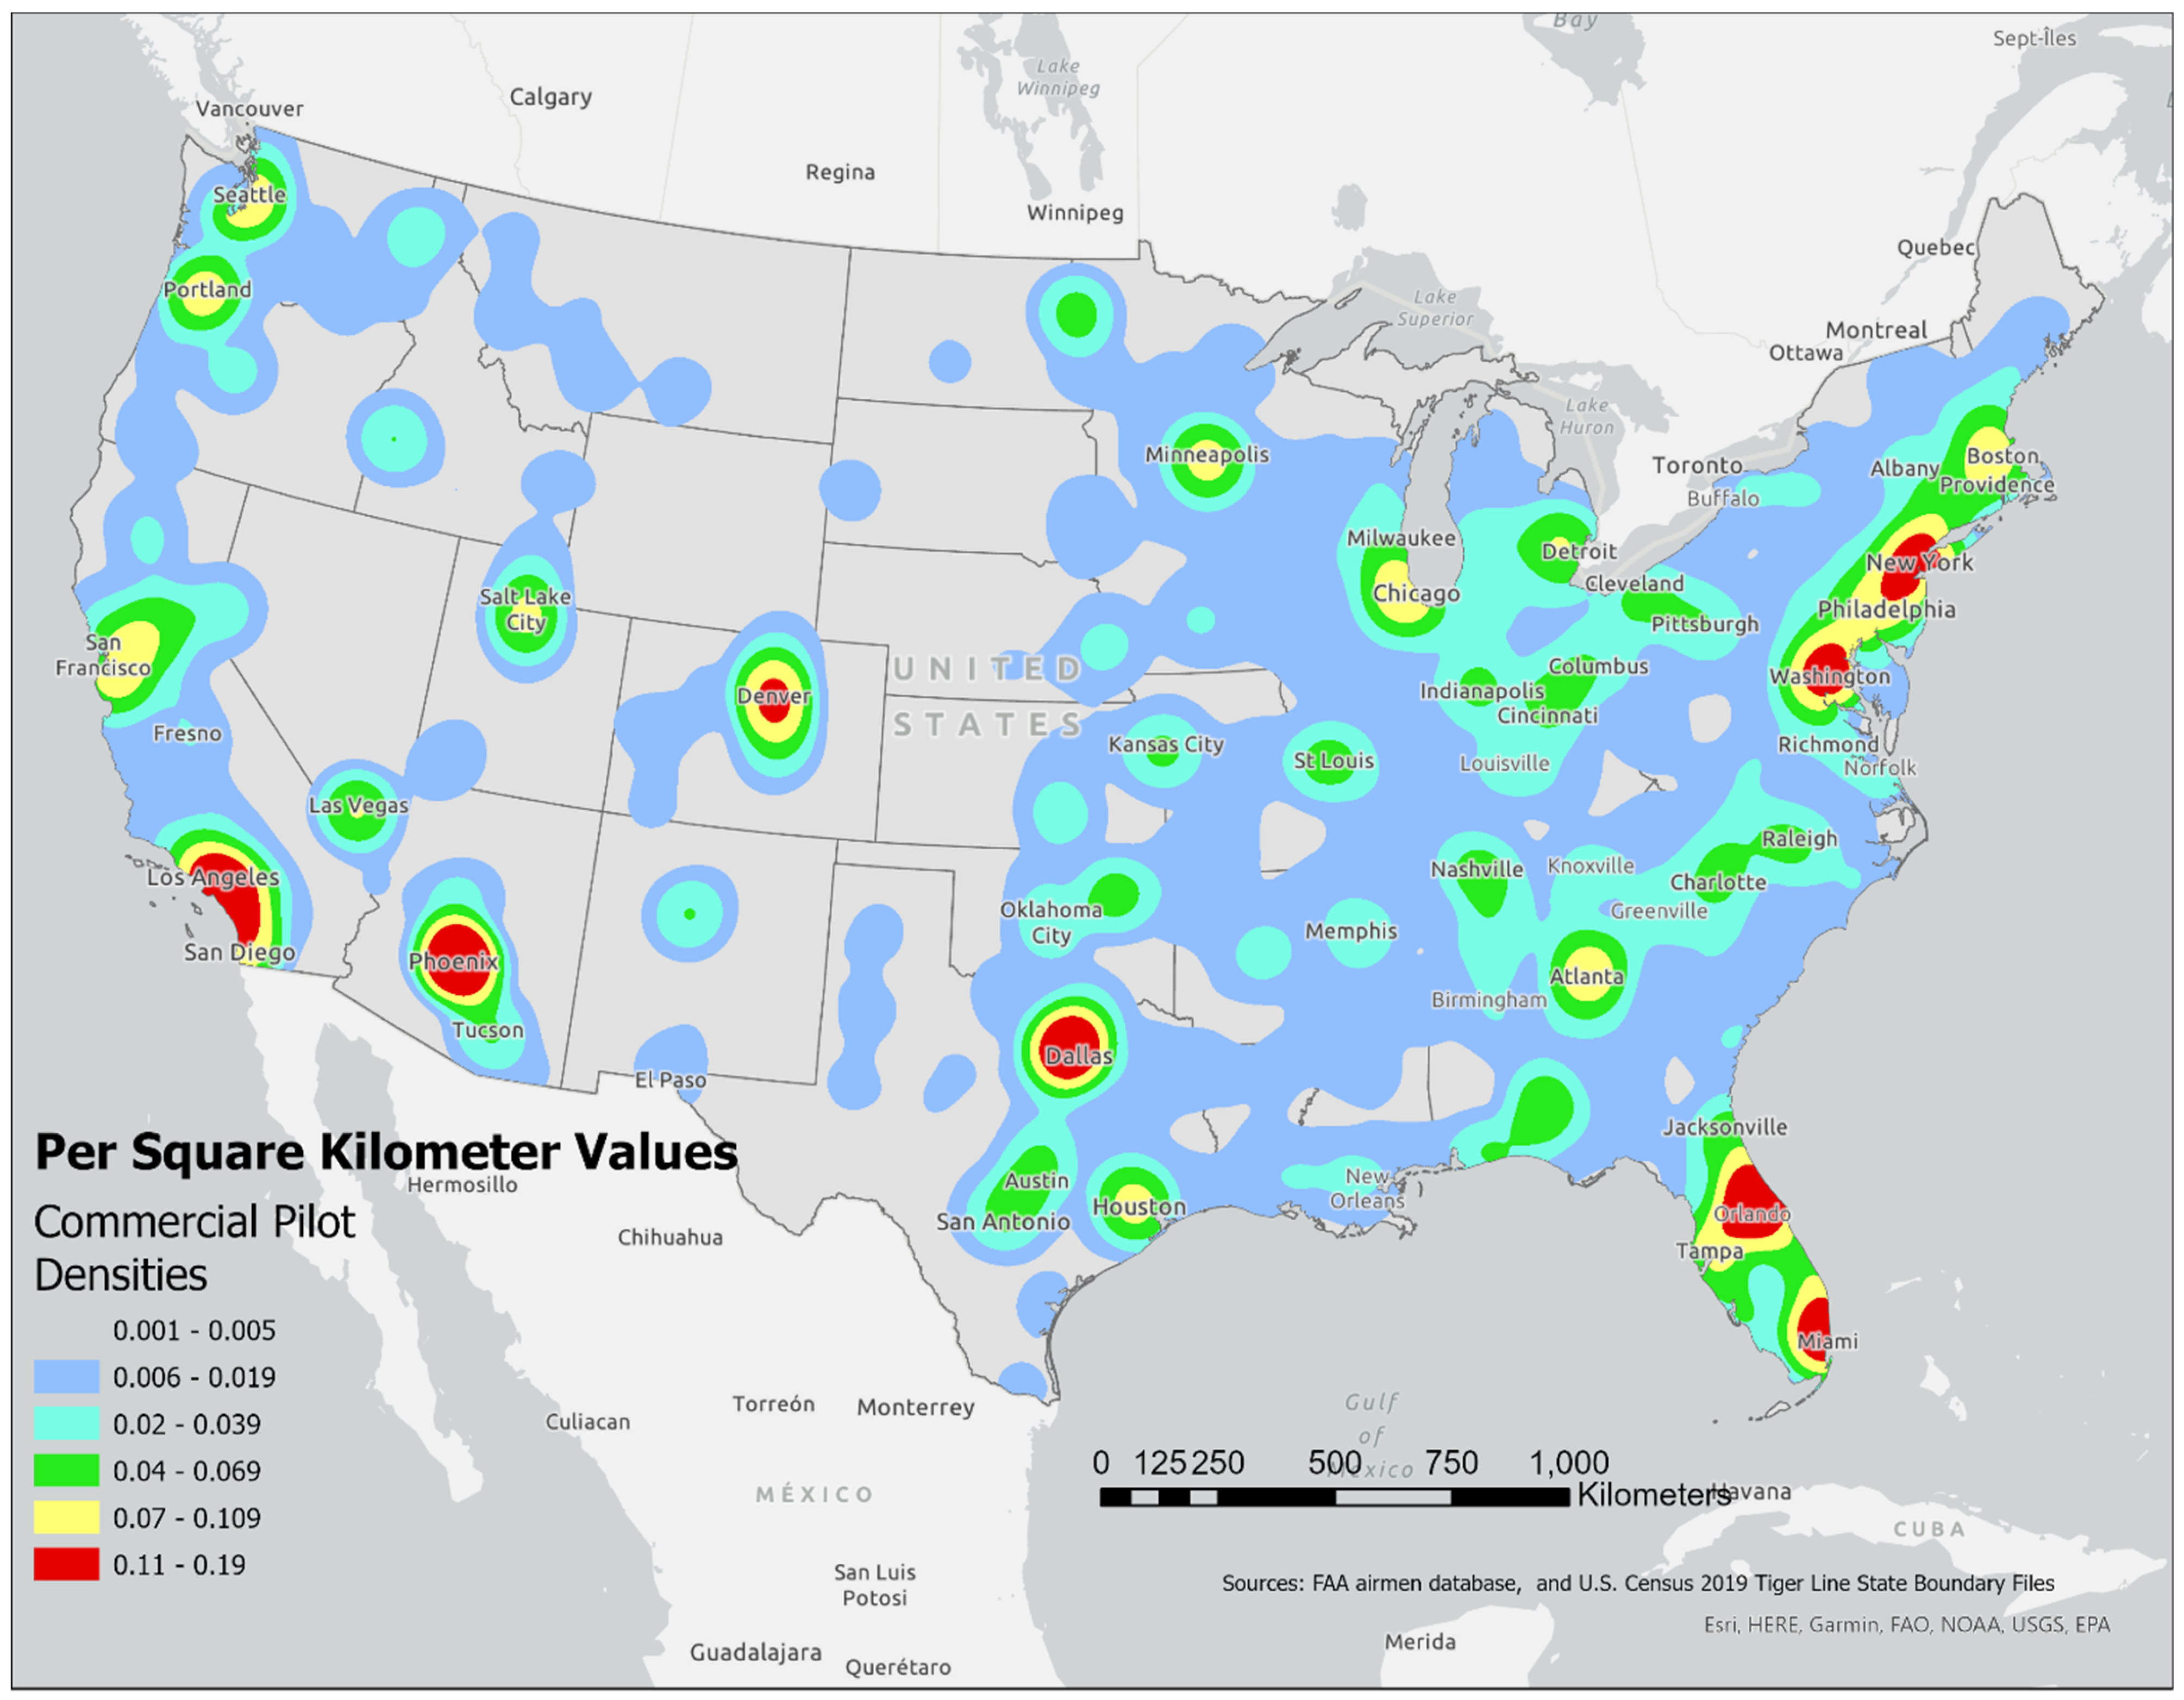
Registered Commercial PilotsGeocoded point location for all records with a certification type of ‘P’ and certification level of ‘C’
Registered Manned PilotsGeocoded point location for all records with a certification type of ‘P’ and excluding those with a certification level of ‘S’
Disclaimer/Publisher’s Note: The statements, opinions and data contained in all publications are solely those of the individual author(s) and contributor(s) and not of MDPI and/or the editor(s). MDPI and/or the editor(s) disclaim responsibility for any injury to people or property resulting from any ideas, methods, instructions or products referred to in the content.

