


Exploration of the X-ray Dark-Field Signal in Mineral Building Materials
 , , ,
, , ,  , and
, and
Abstract
:1. Introduction
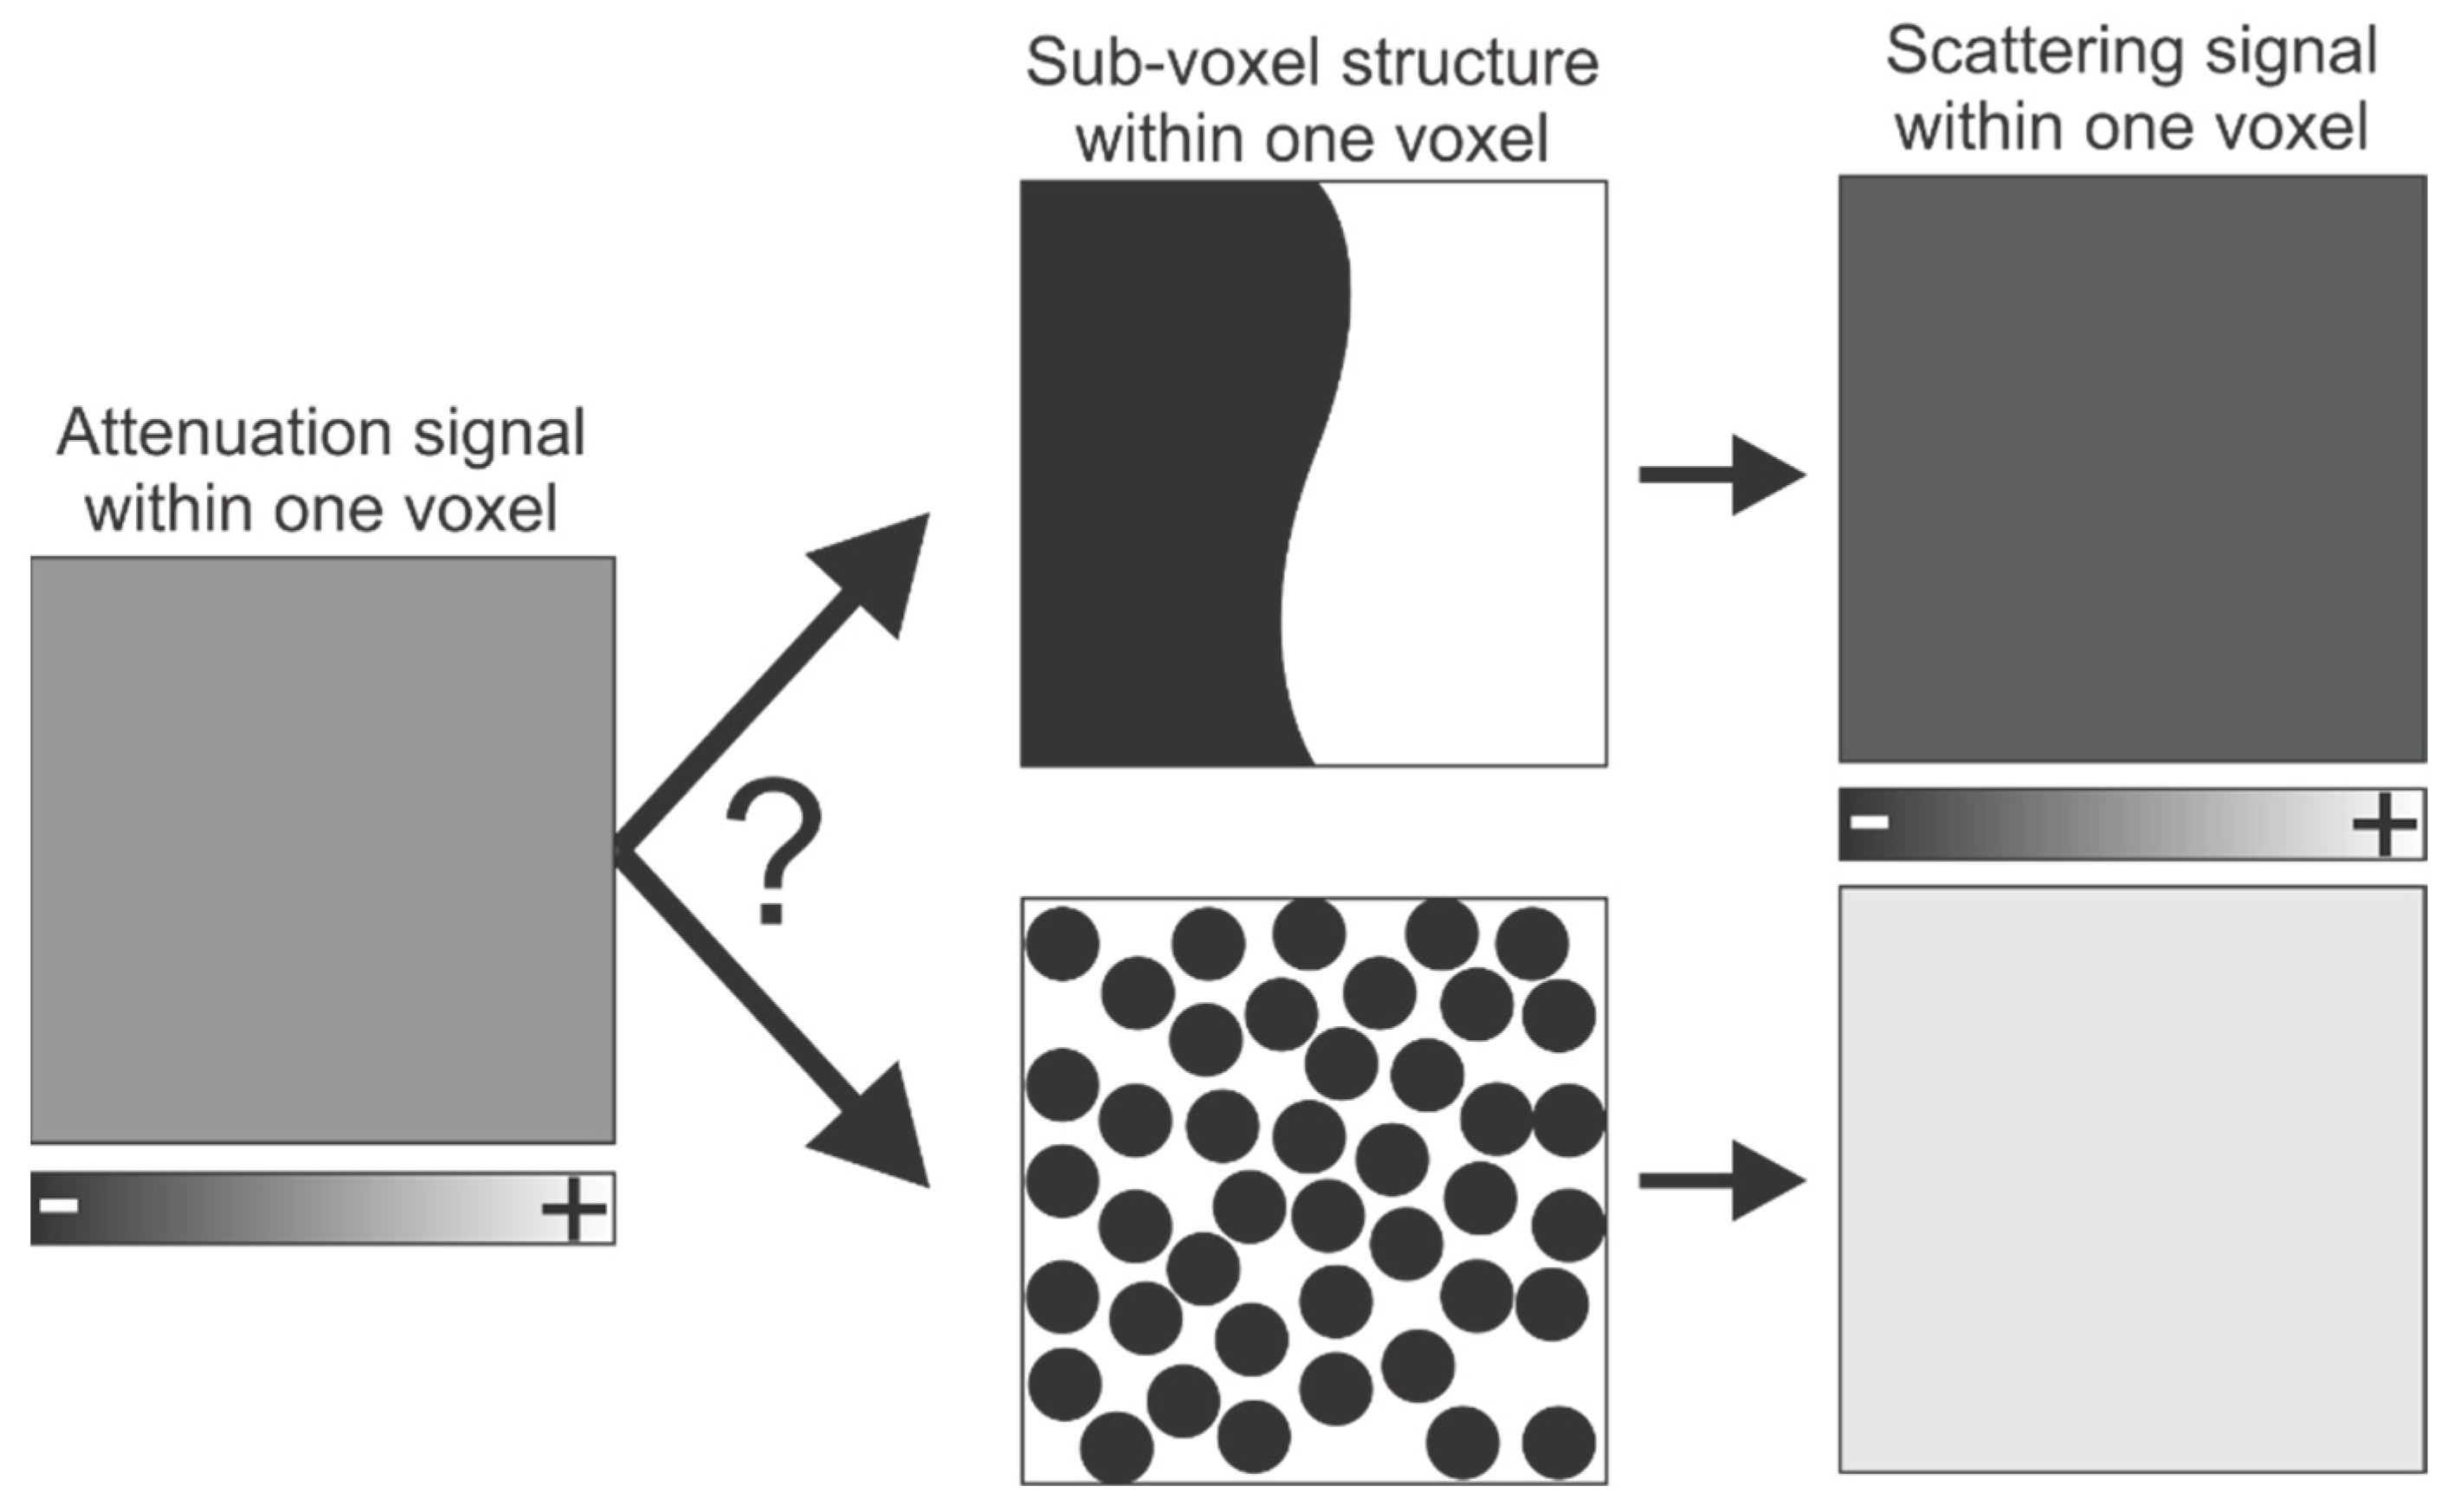
Applications of X-ray Dark-Field Imaging (DFI)
2. Methods and Materials
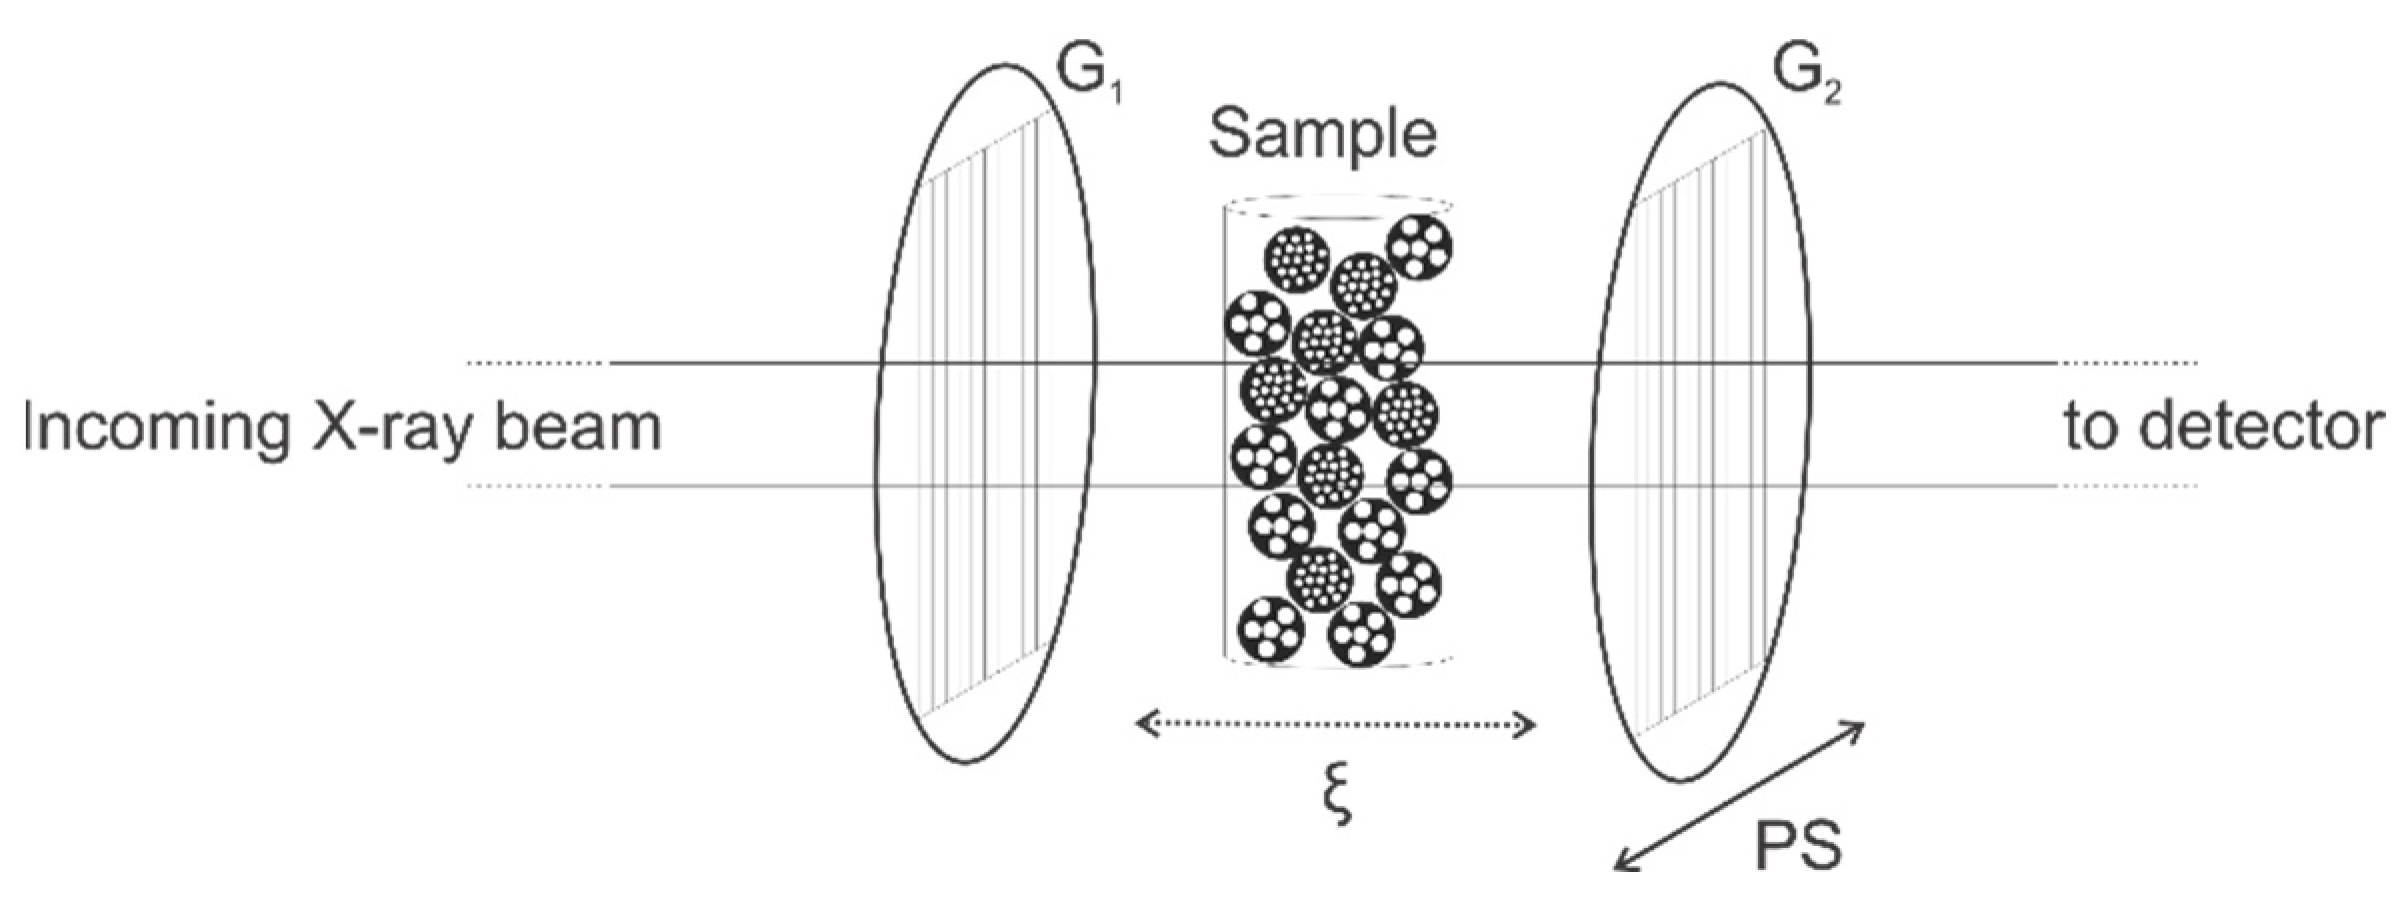
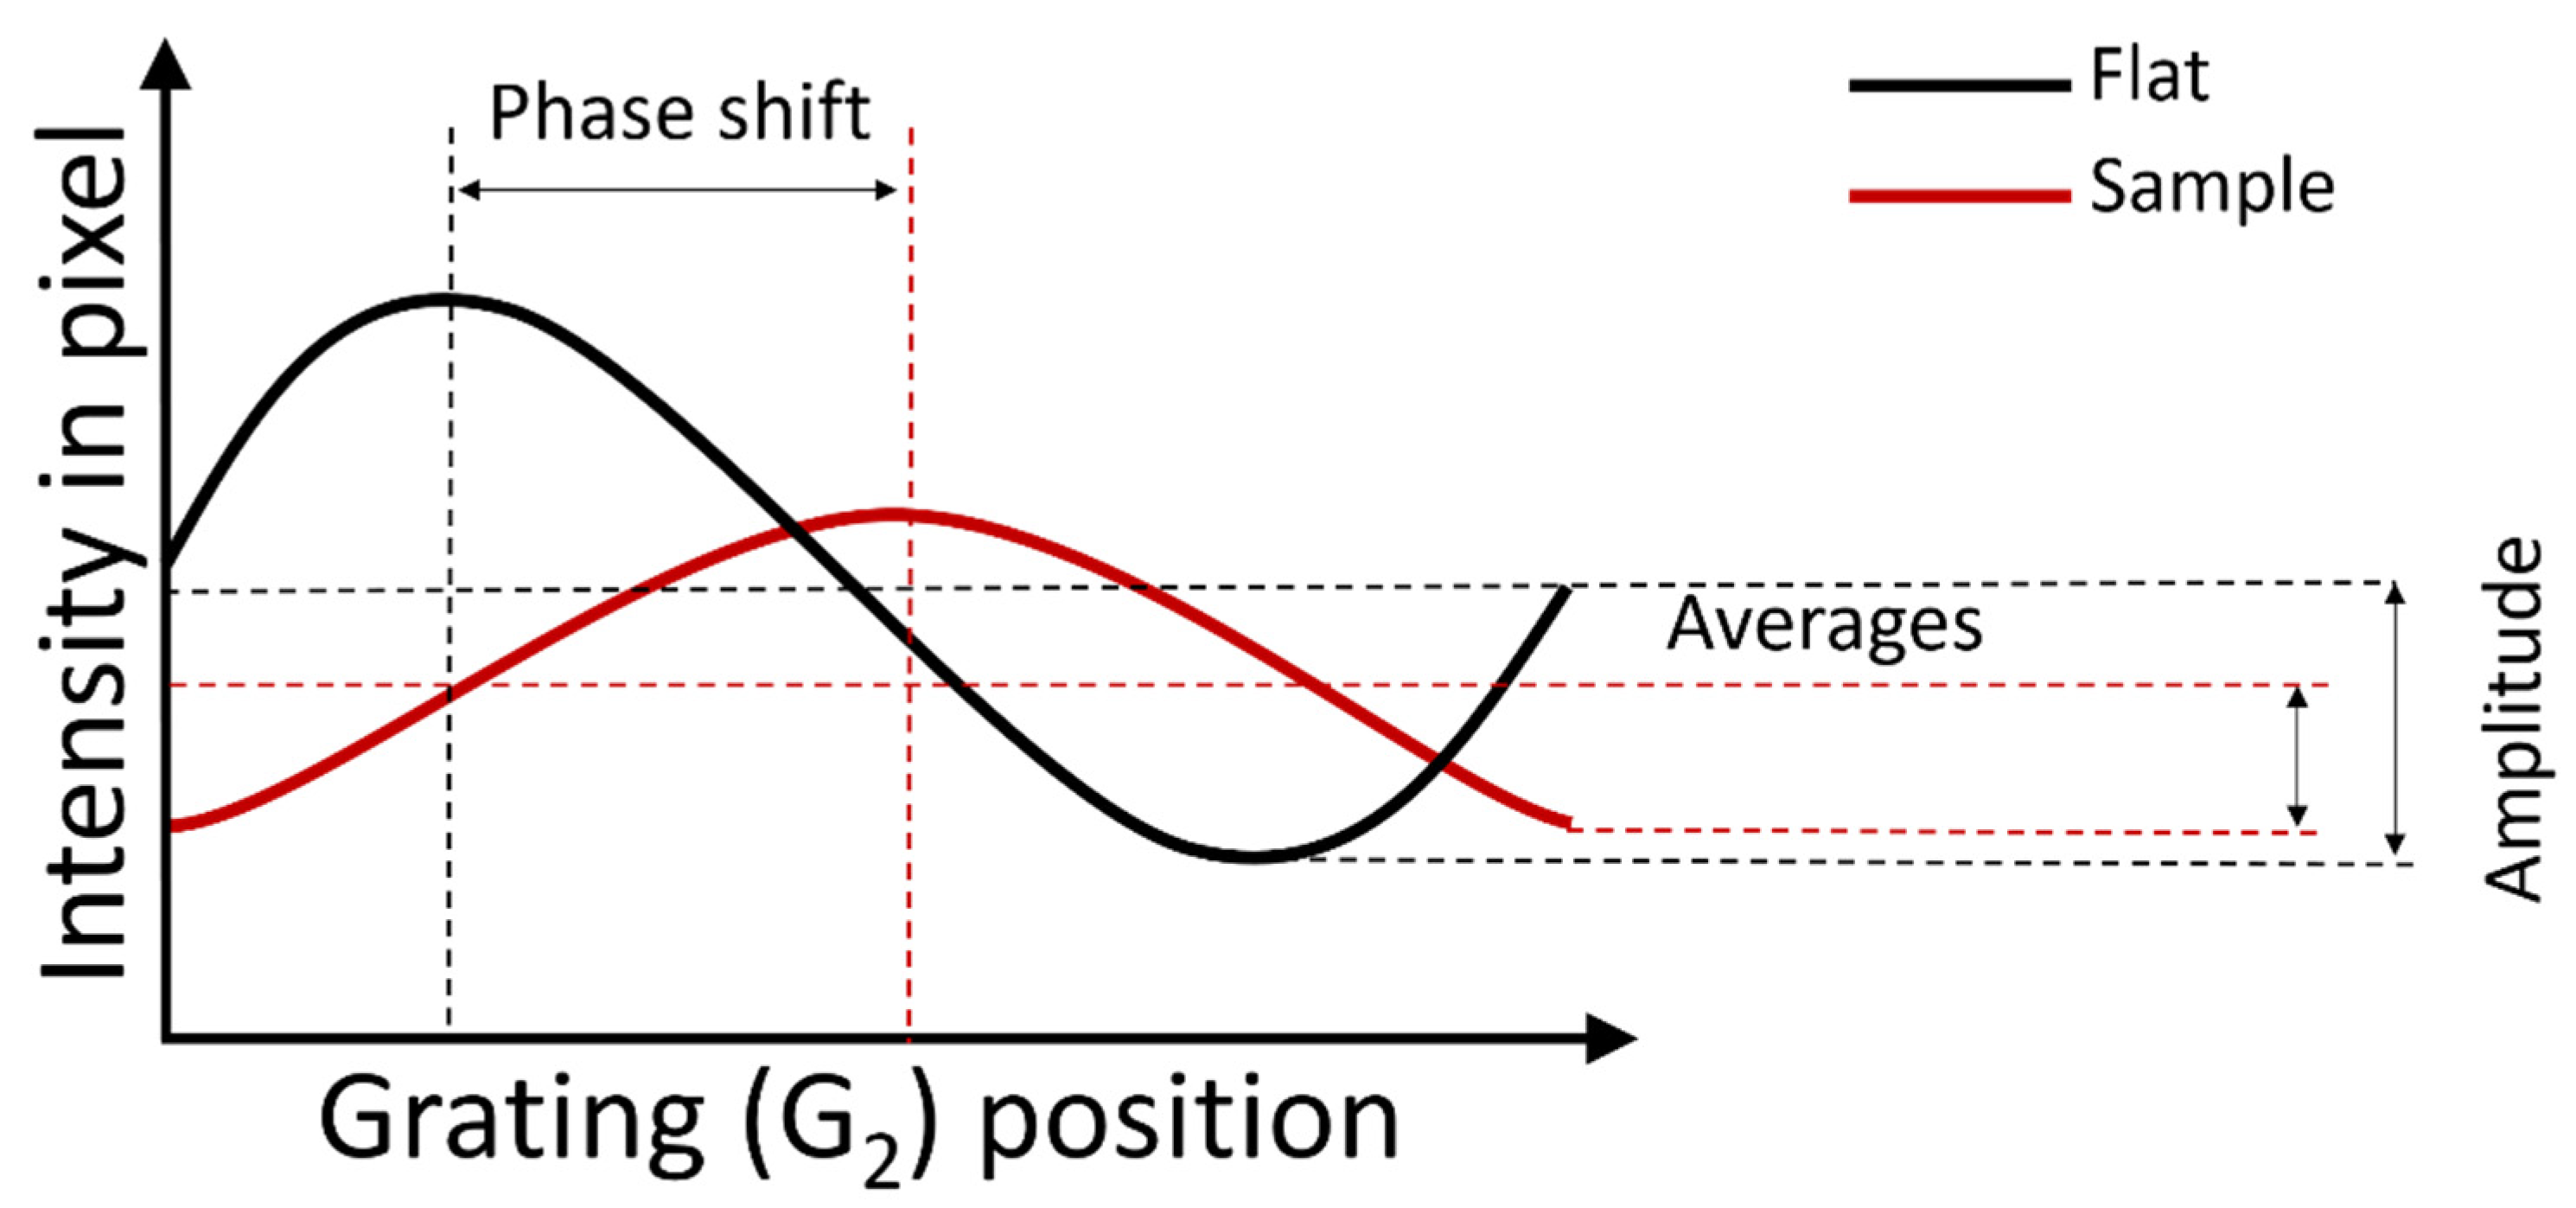
2.1. Grating Interferometry-Based X-ray Dark-Field Tomography and High-Resolution µCT
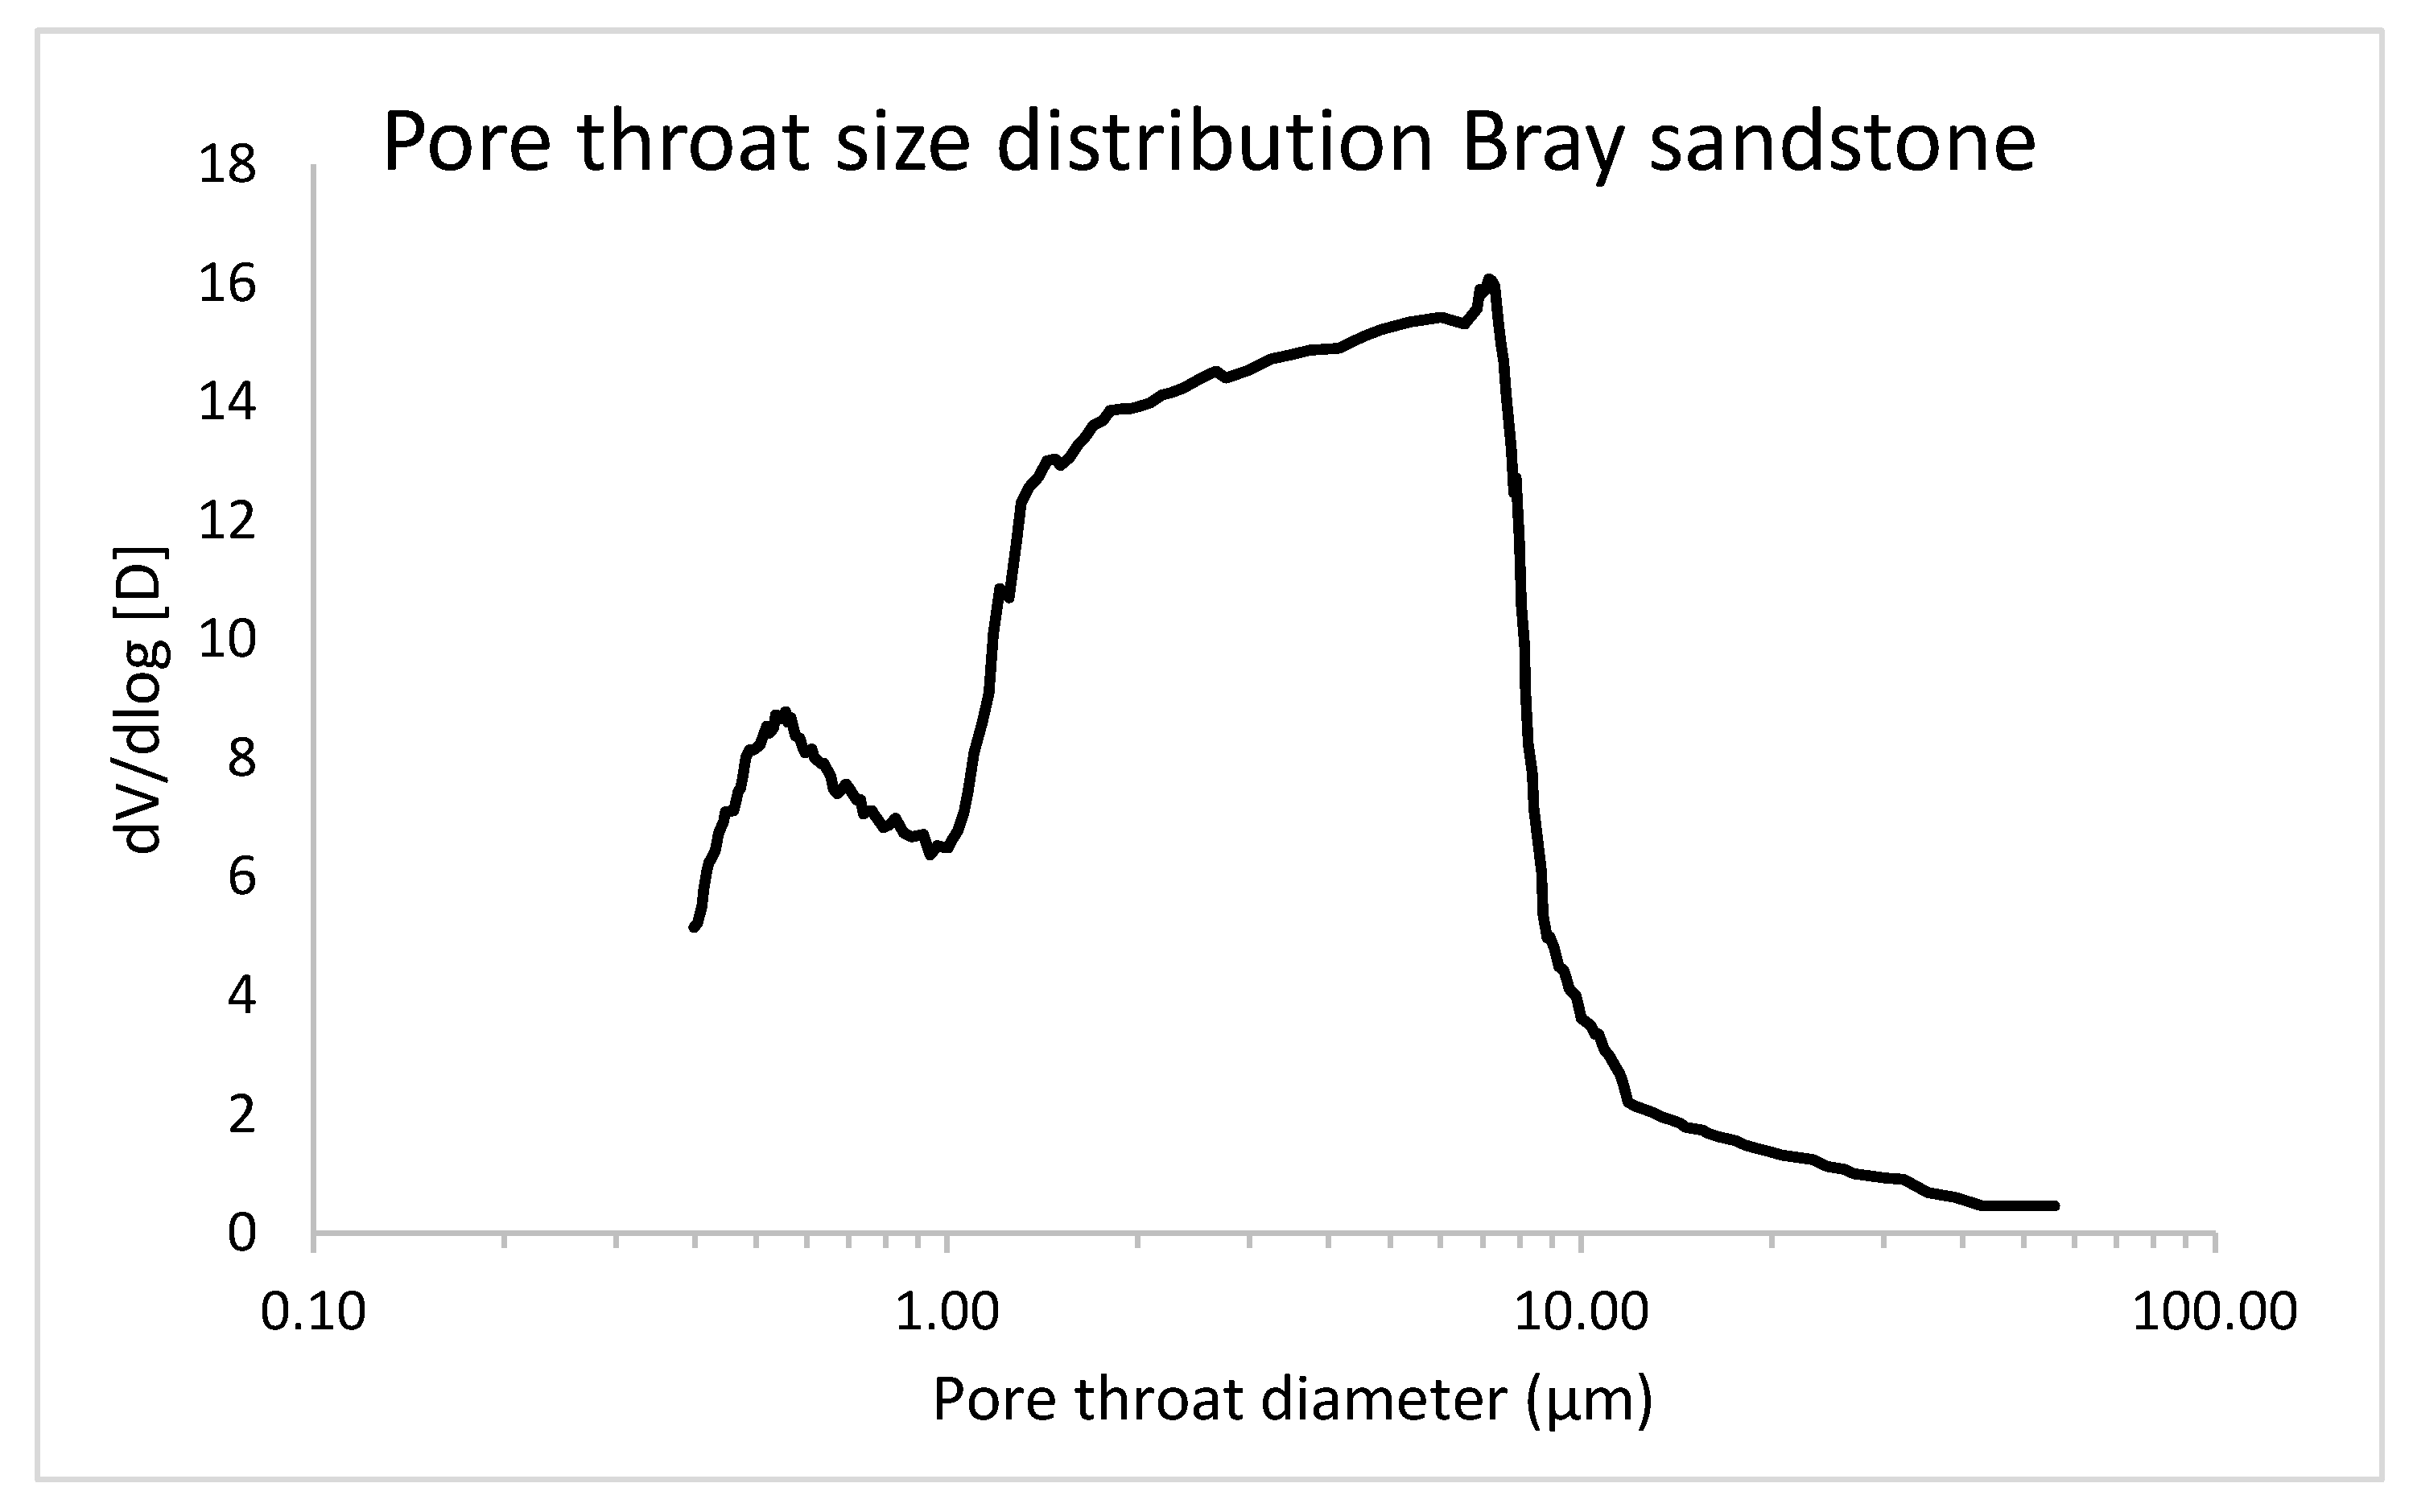
2.2. Bray Sandstone
2.3. Ceramic Samples
2.4. Carbonated Mineral Building Material
3. Results
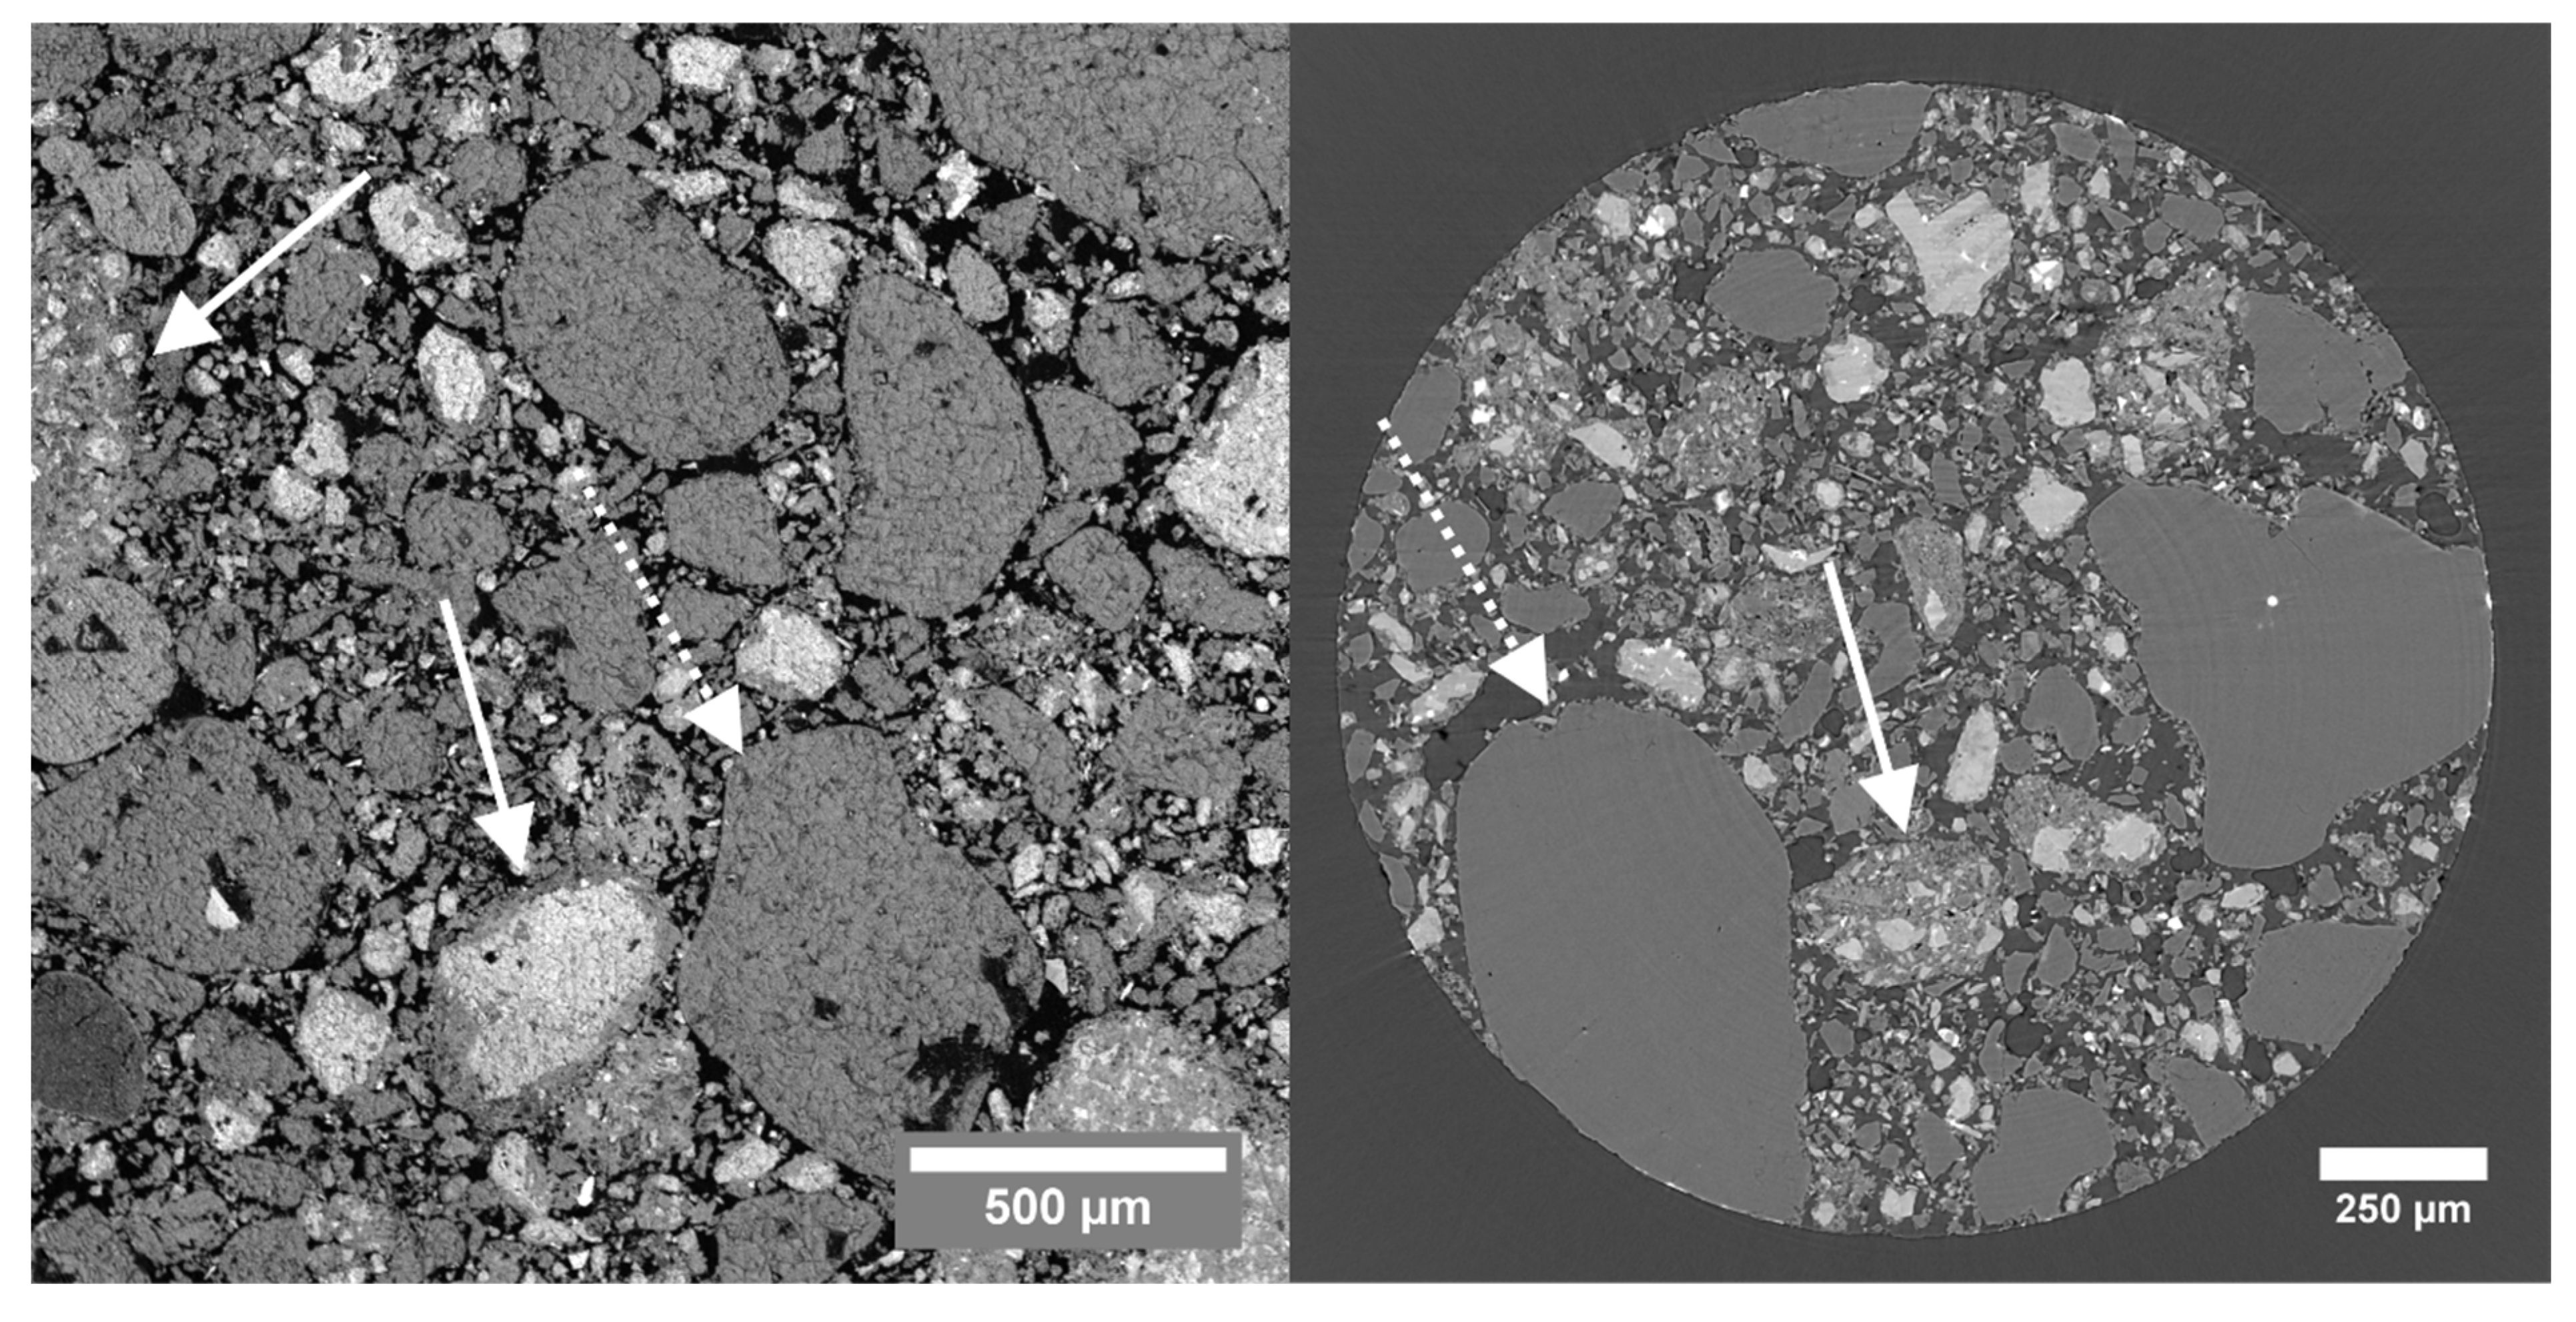
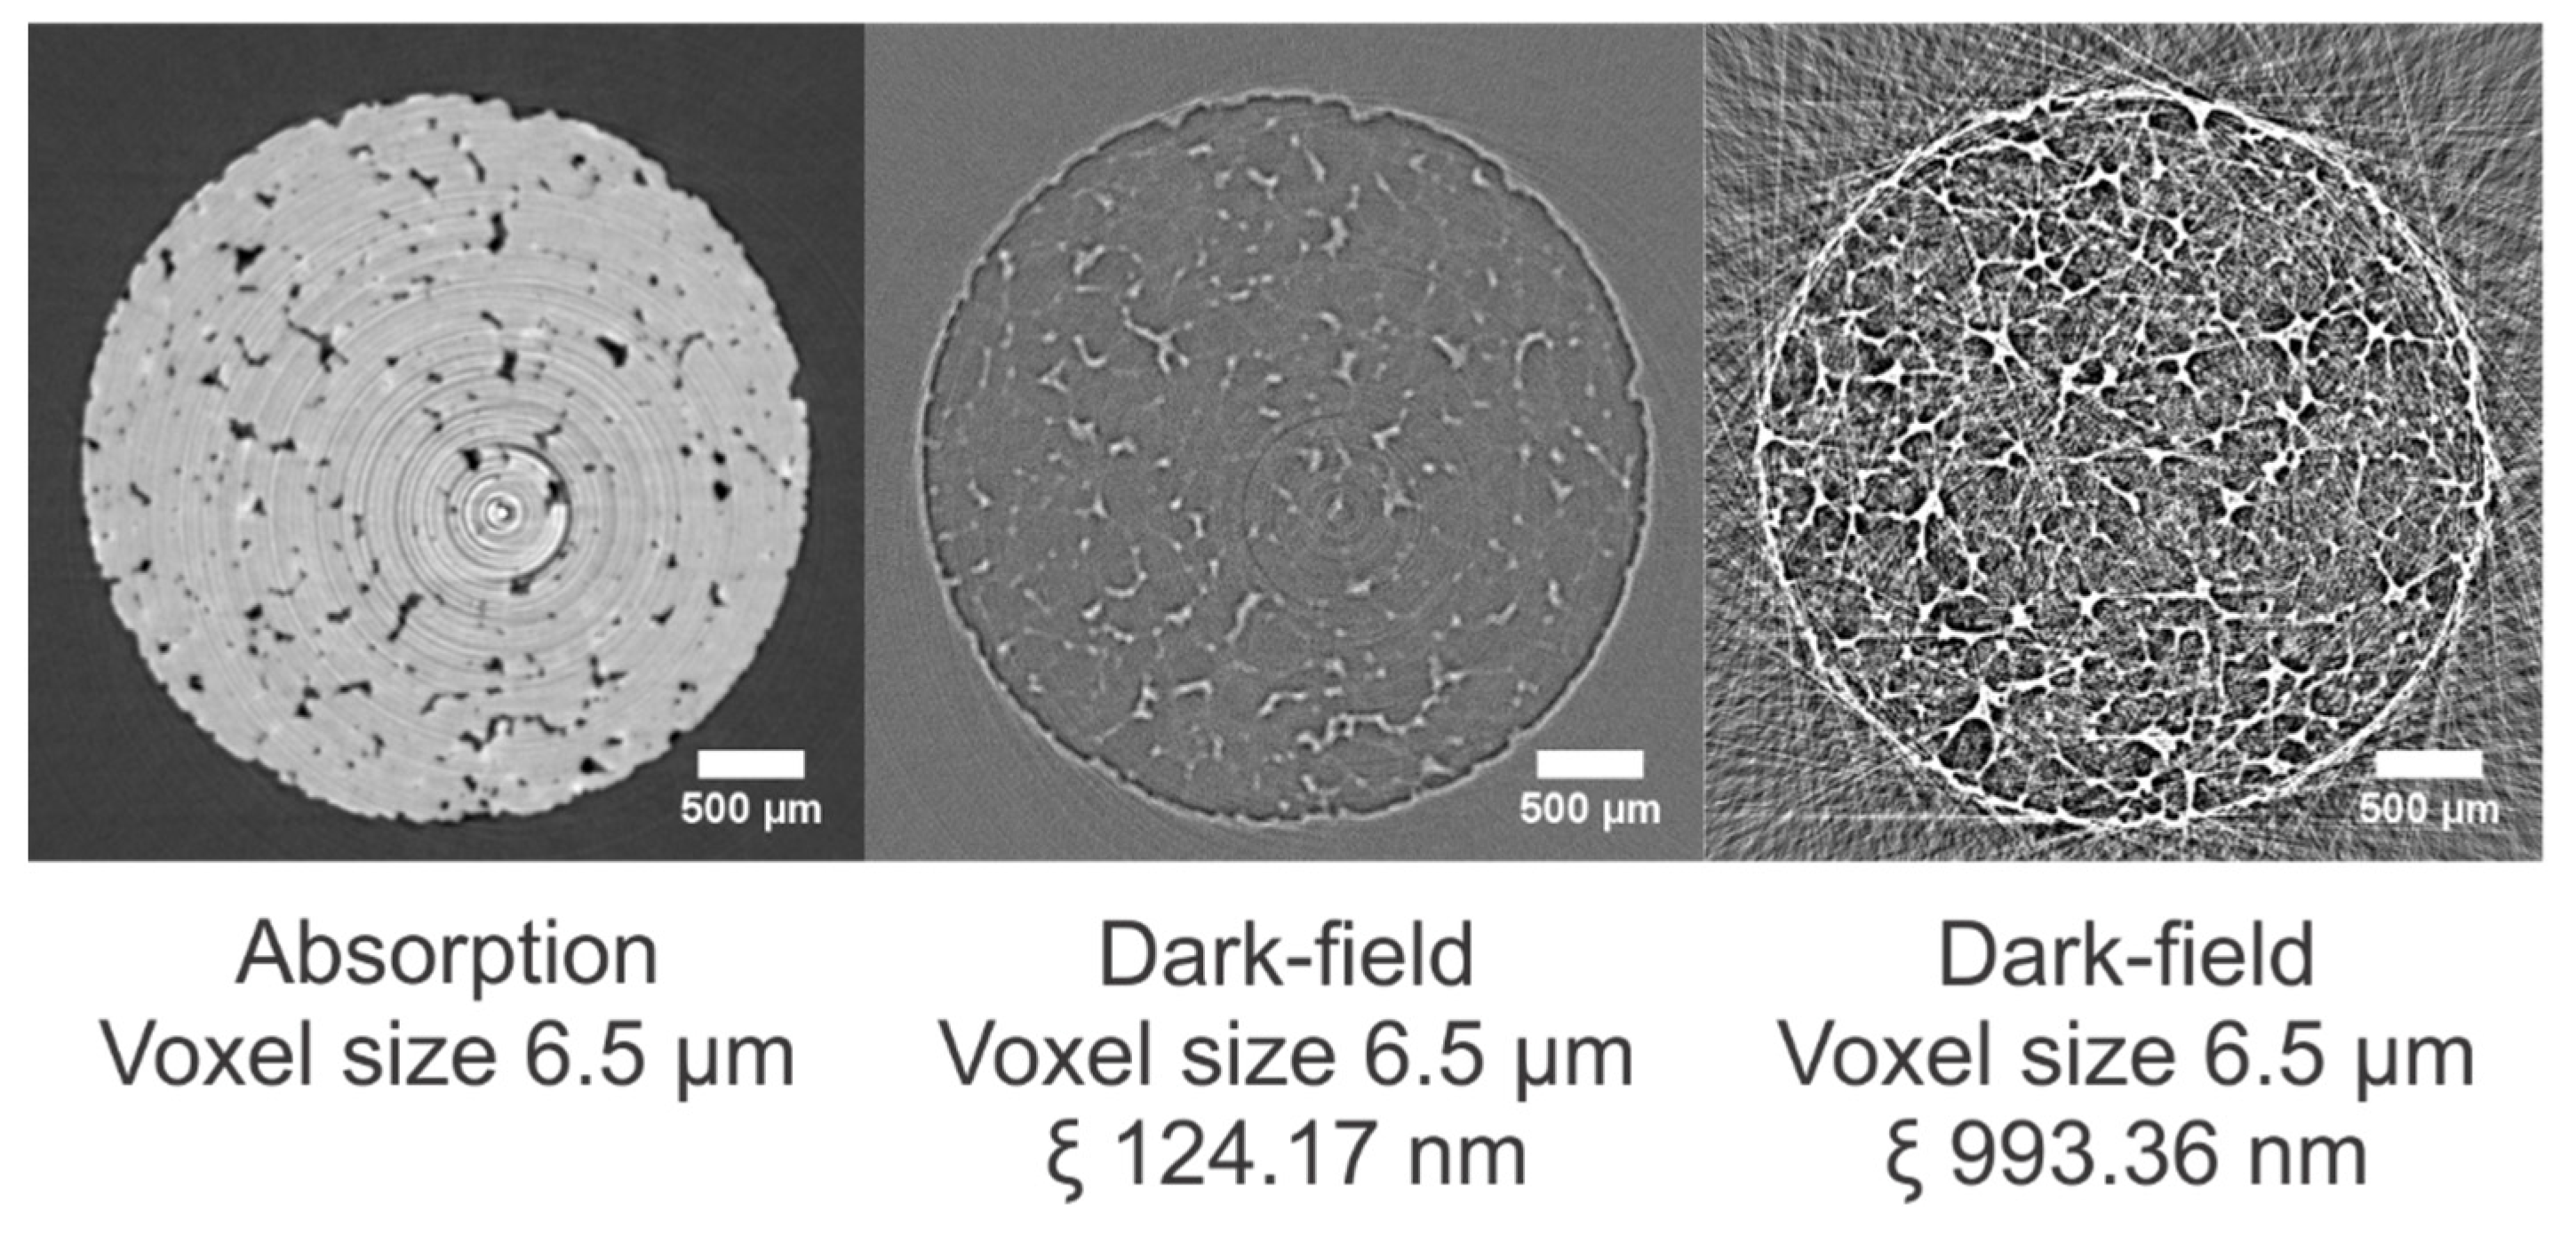
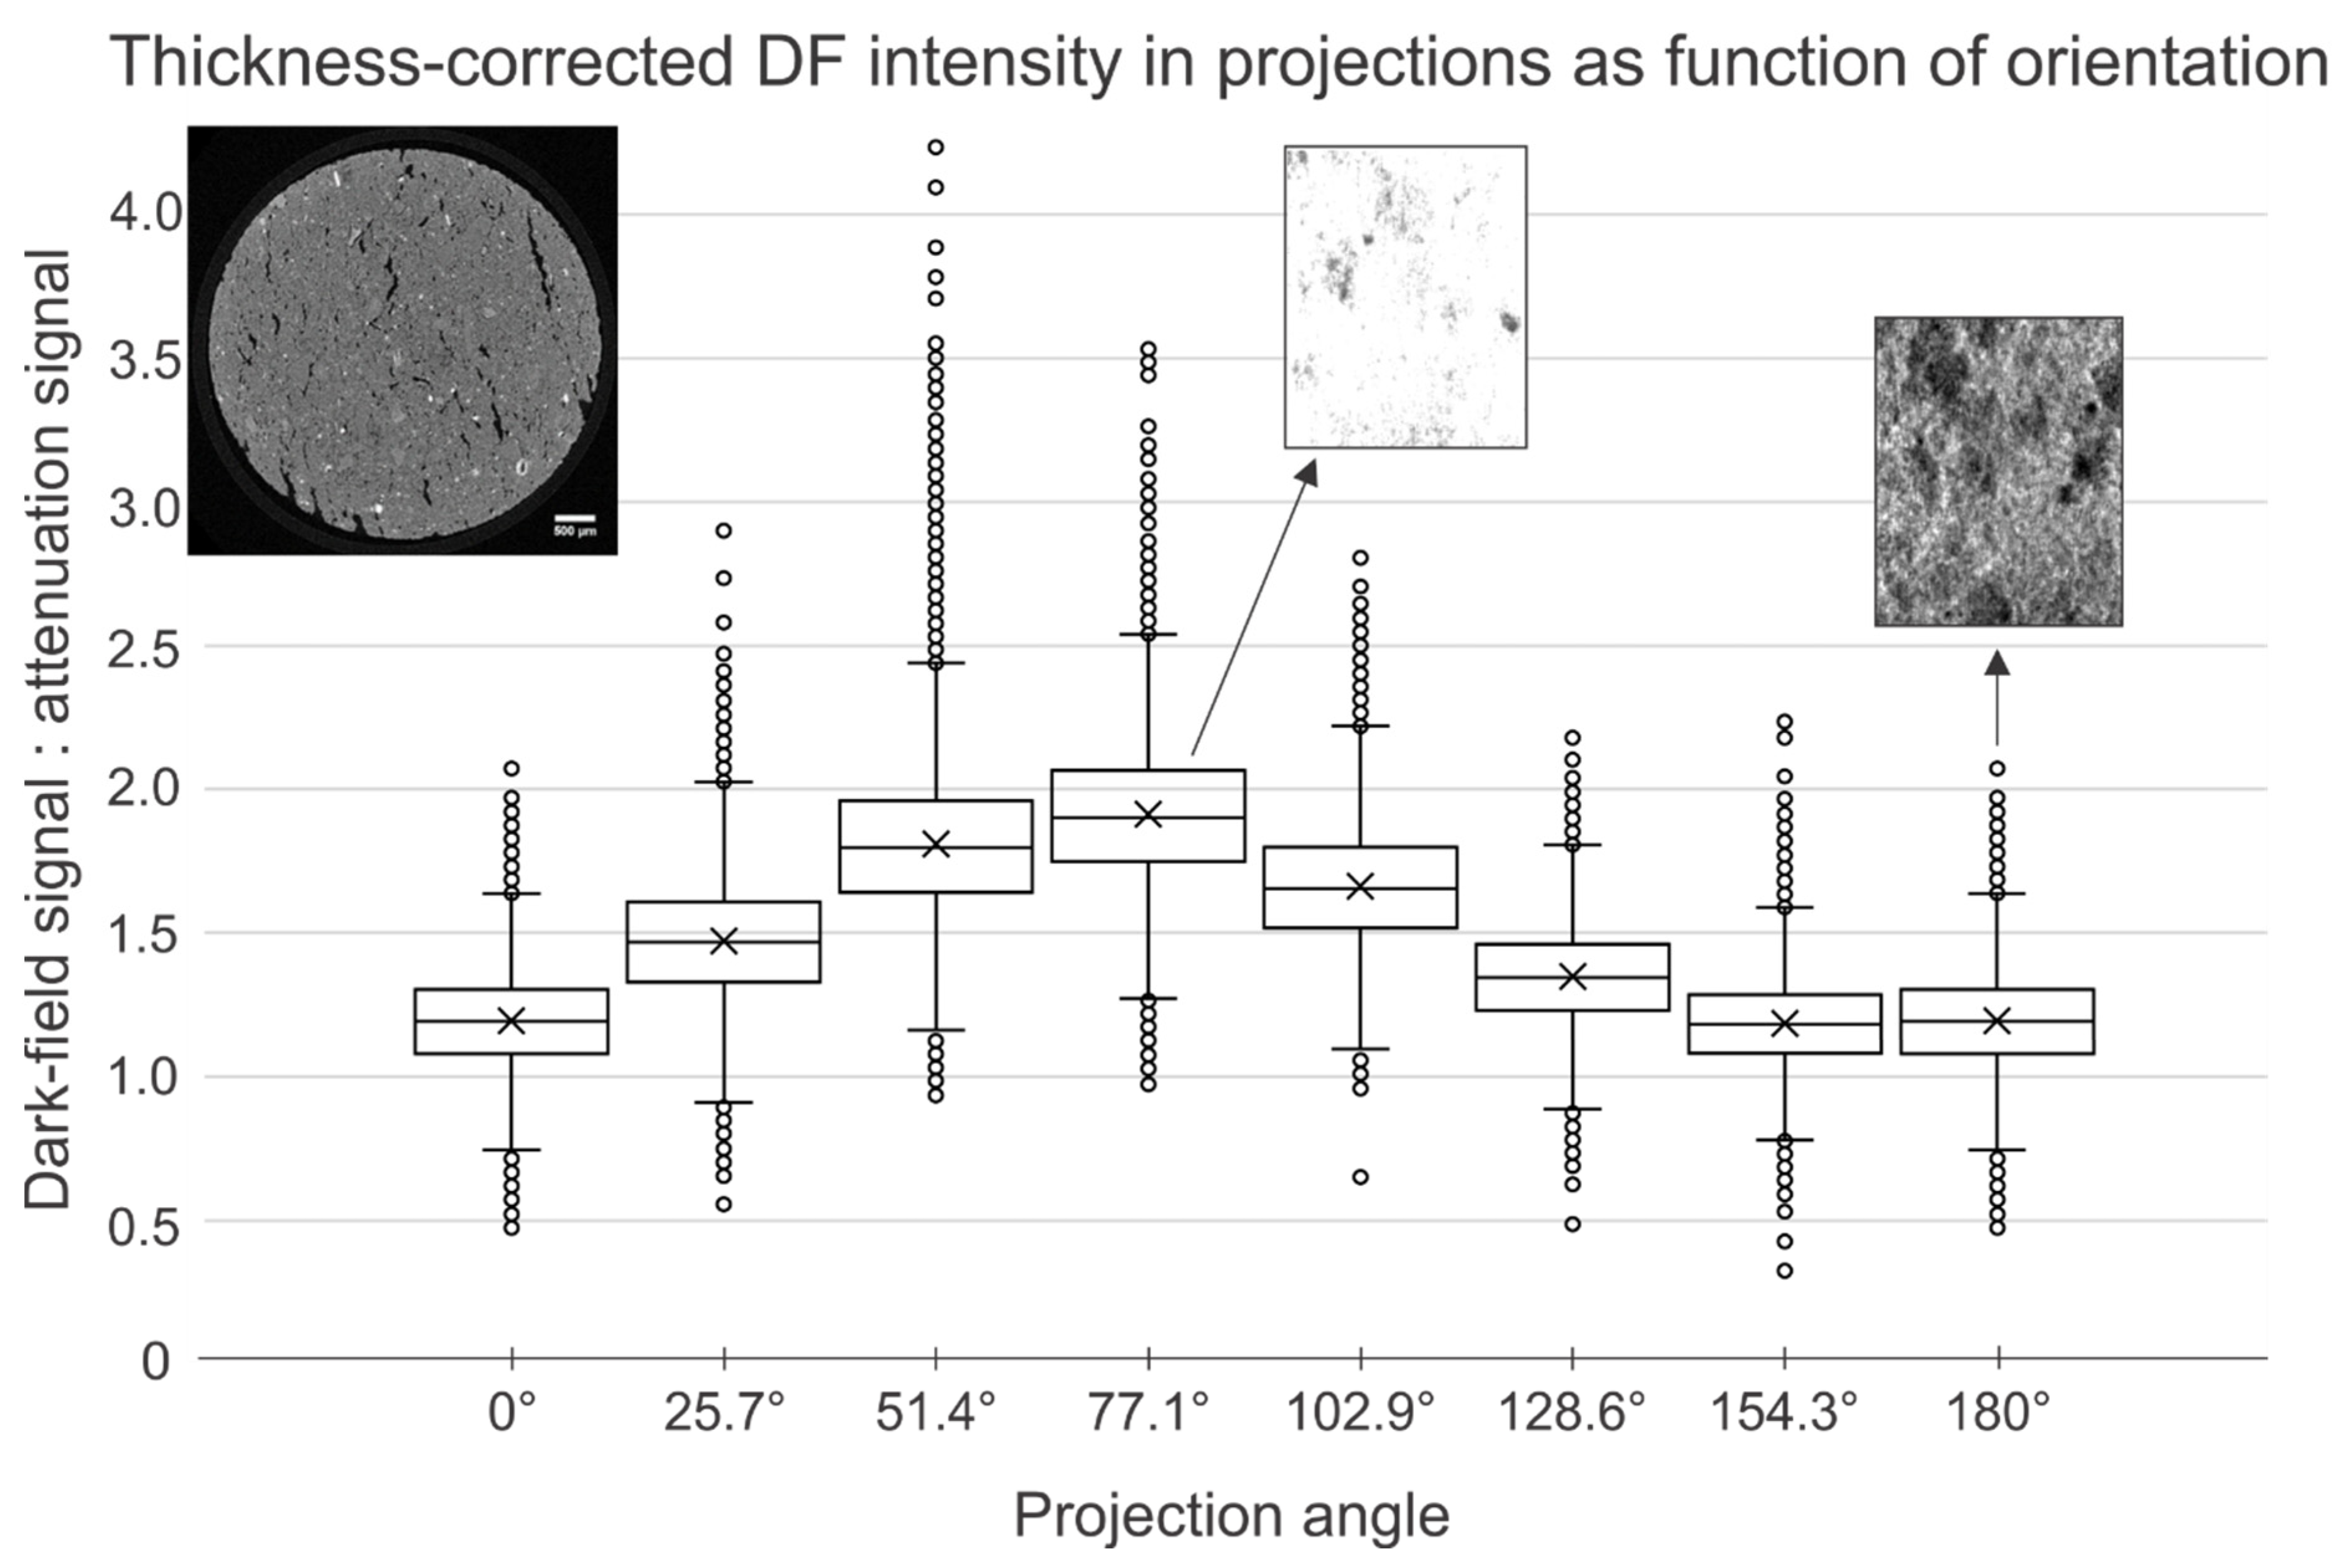
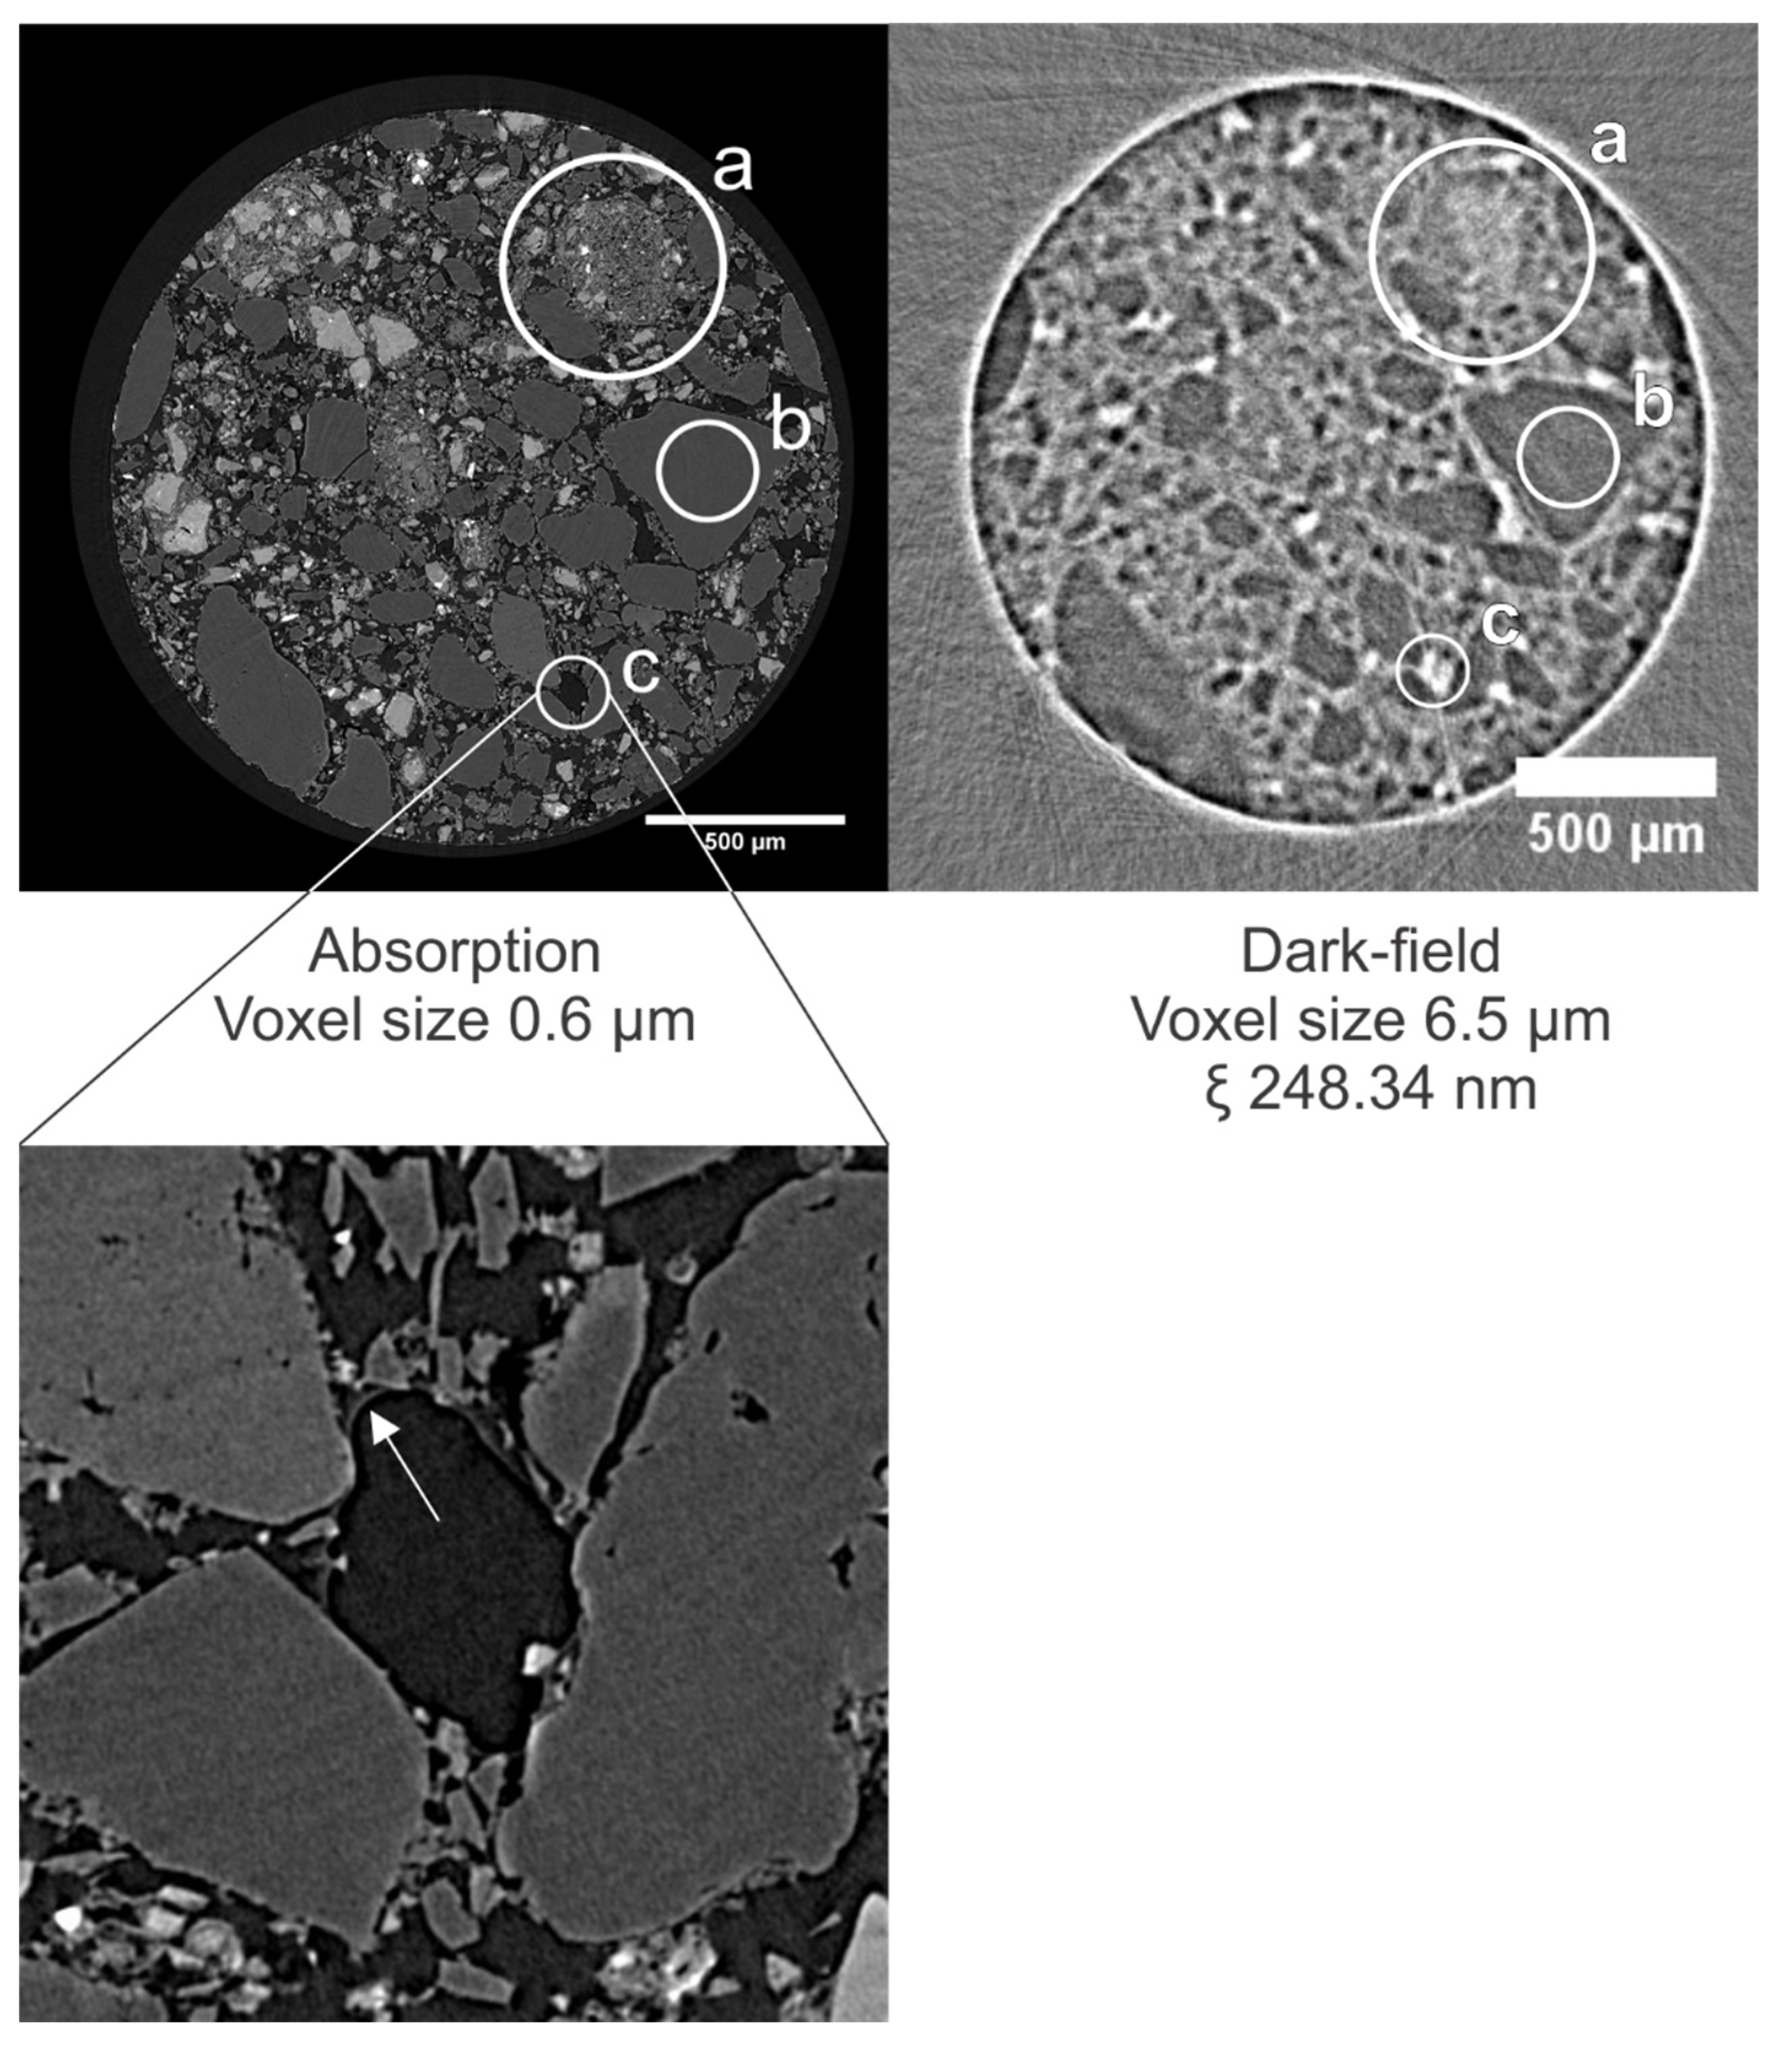
3.1. Bray Sandstone
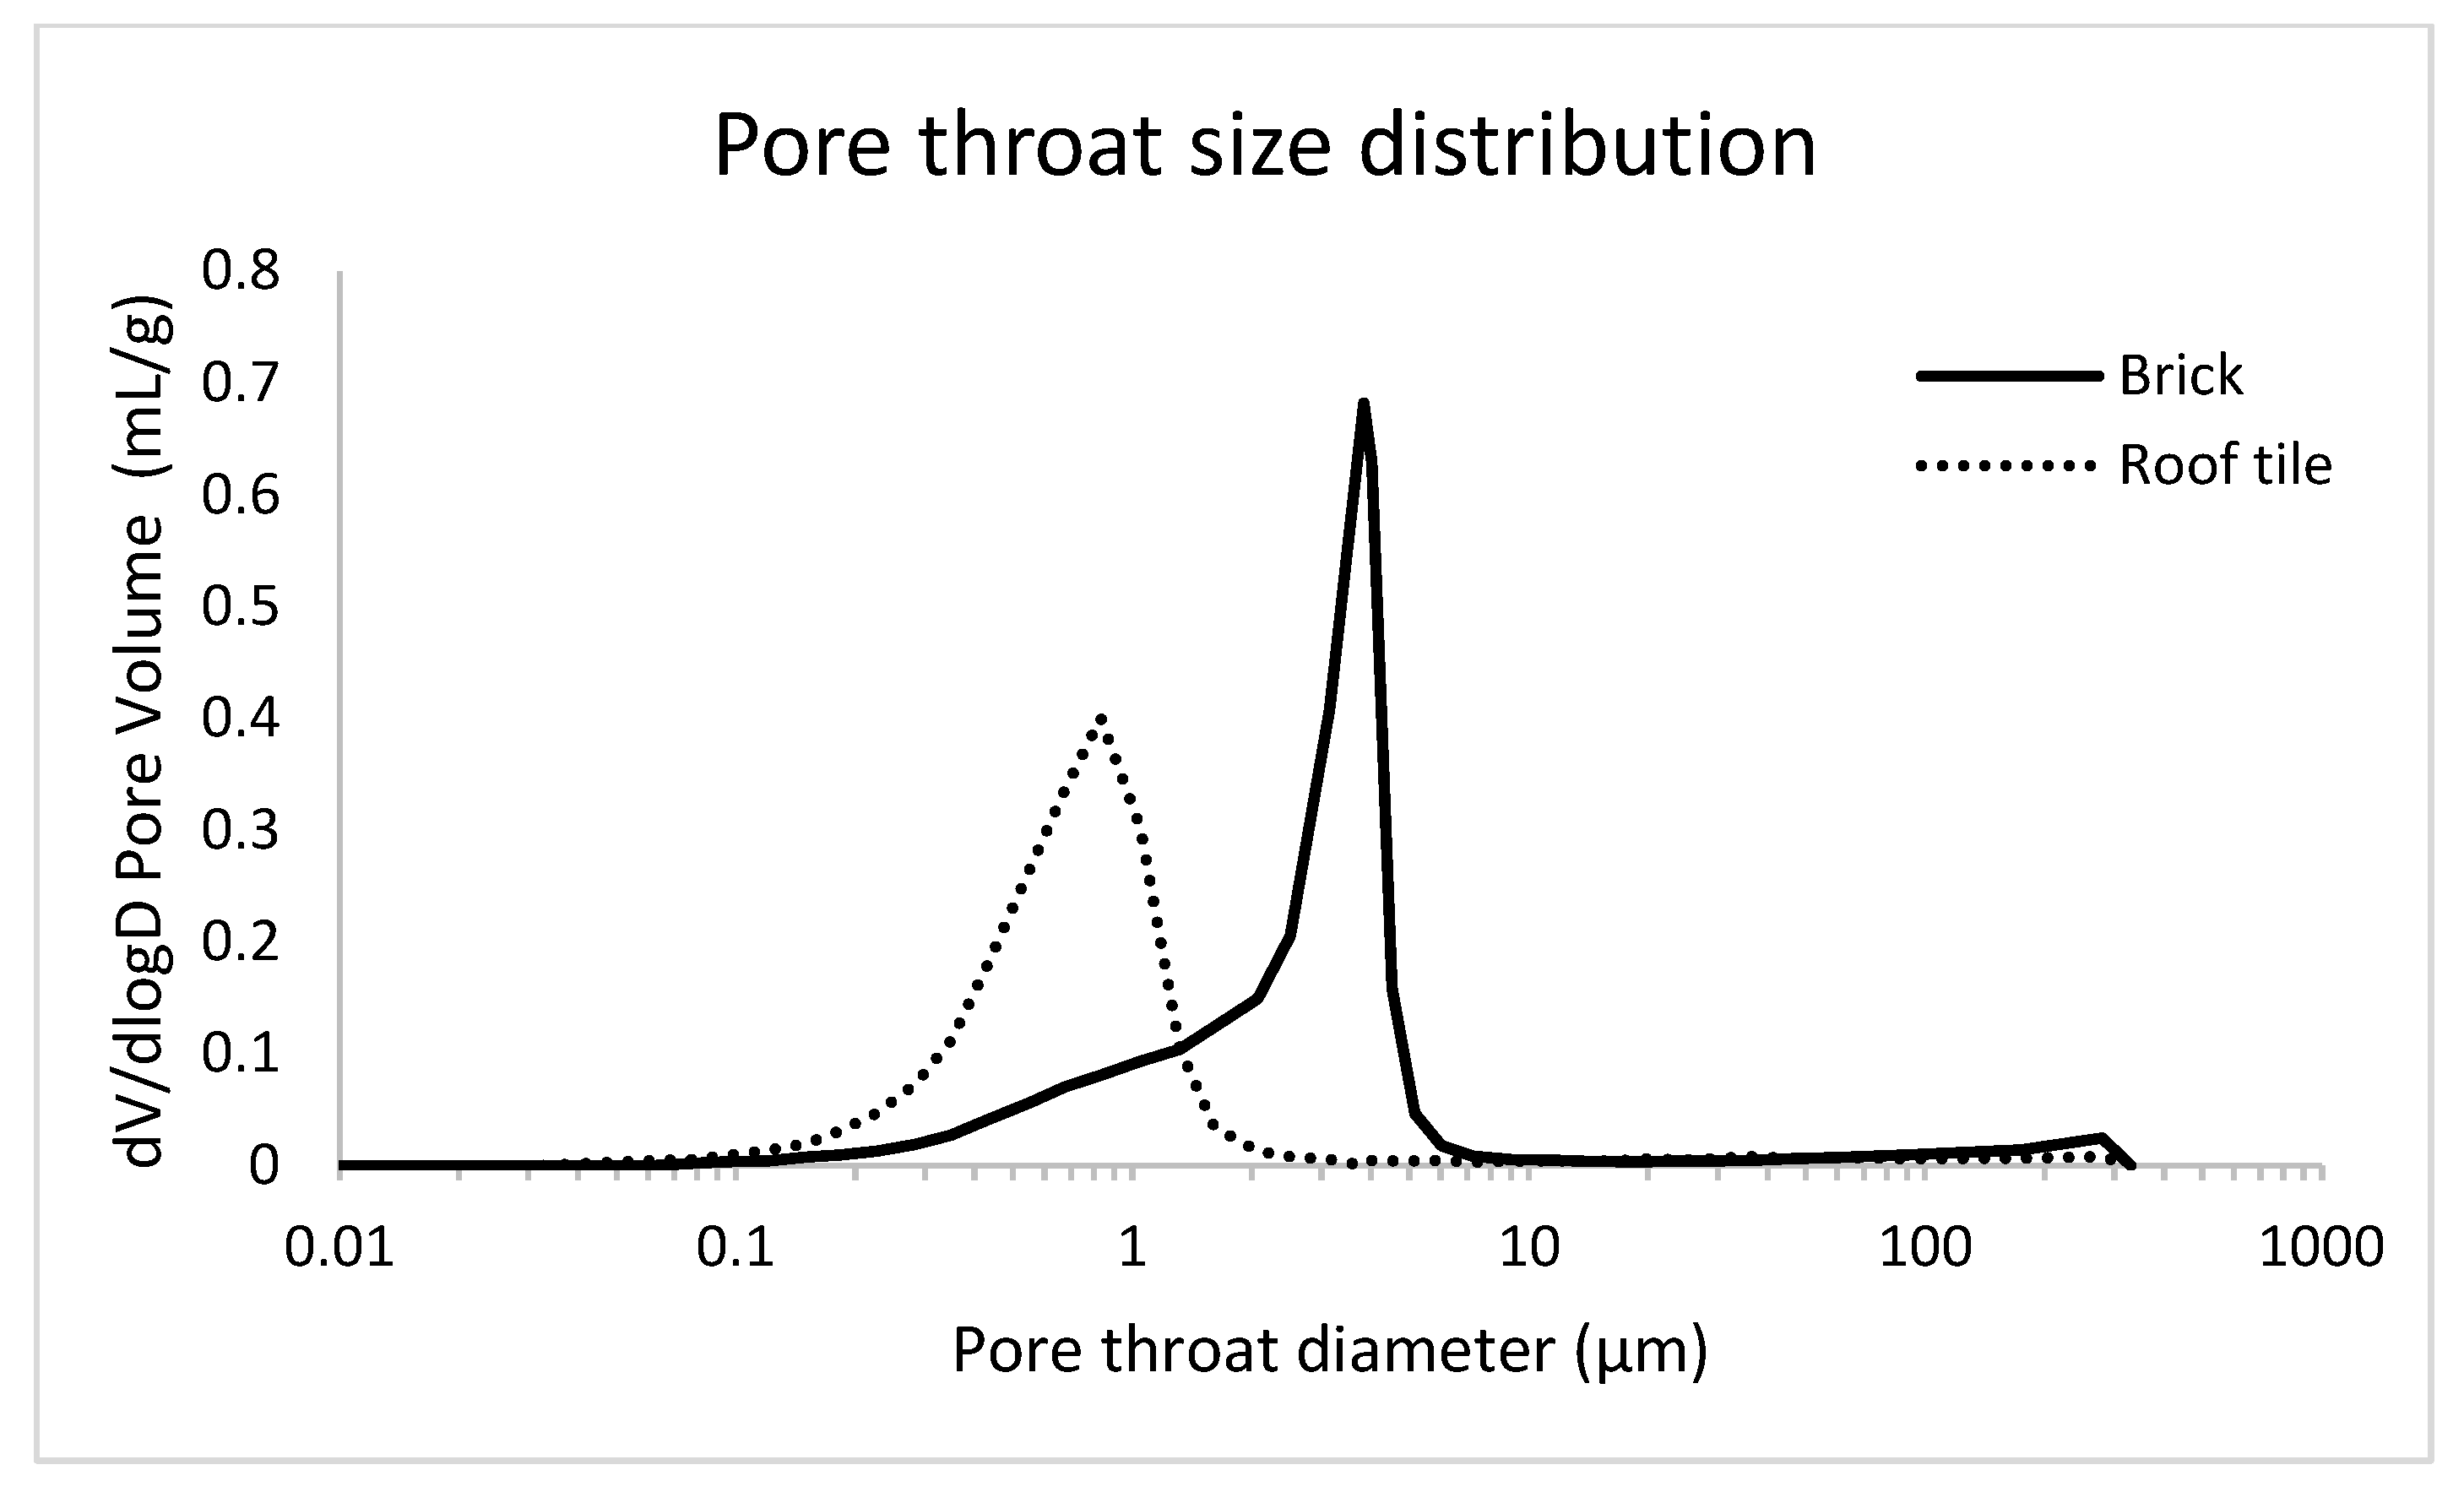
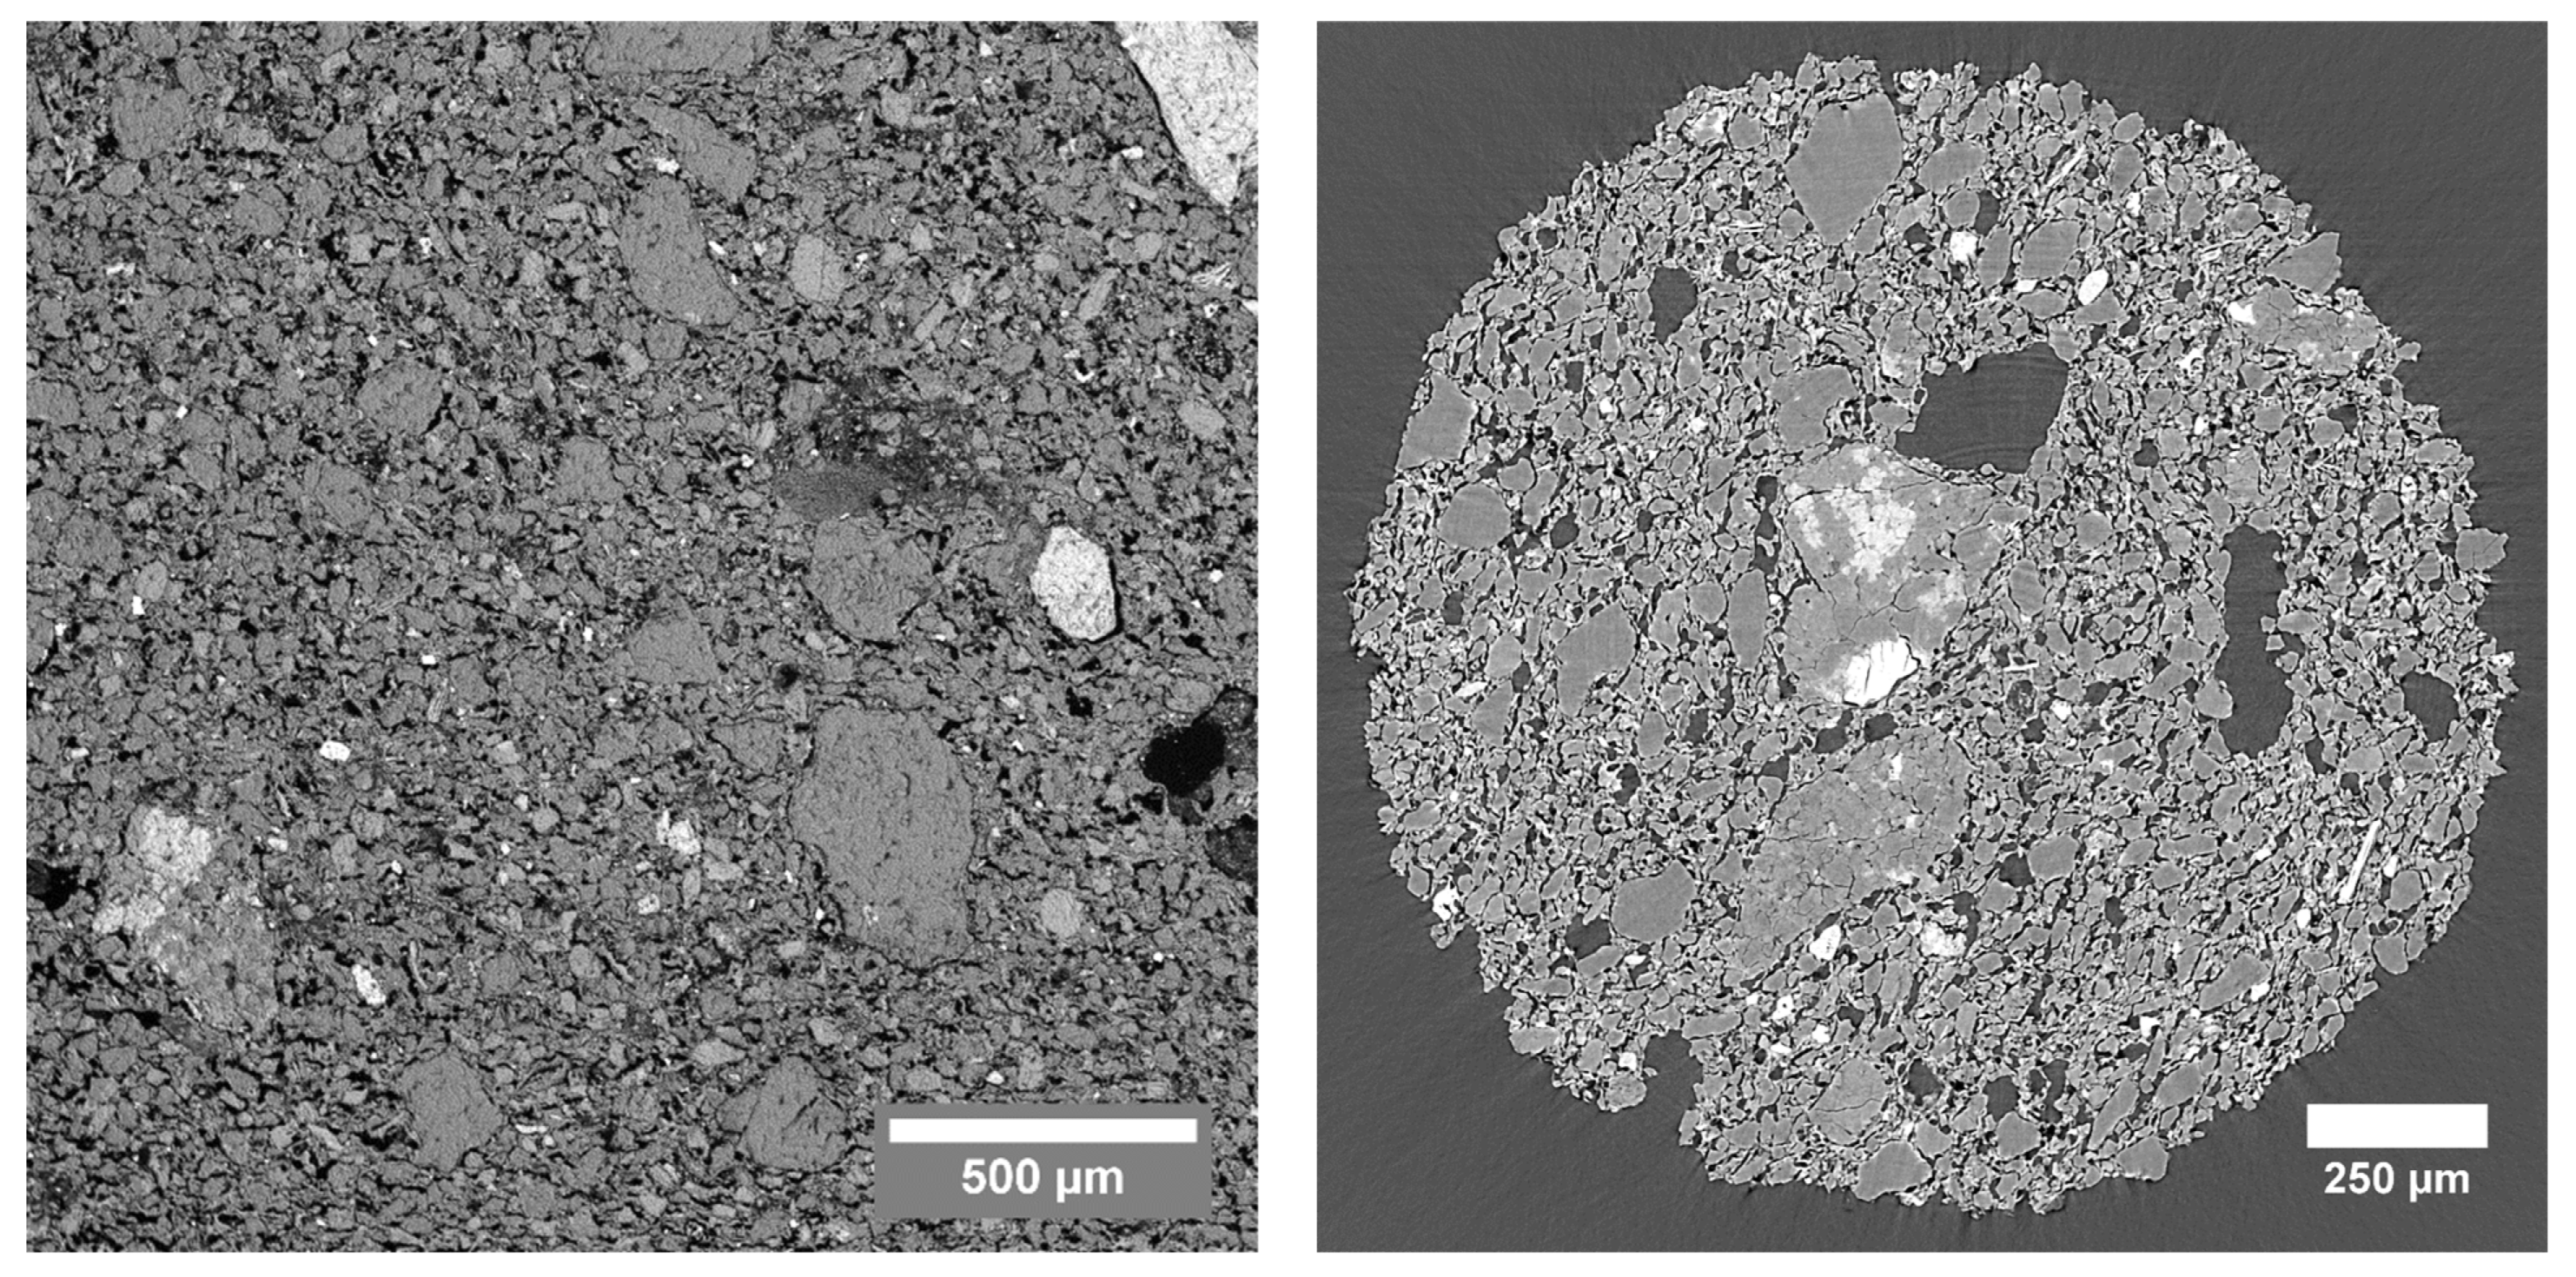
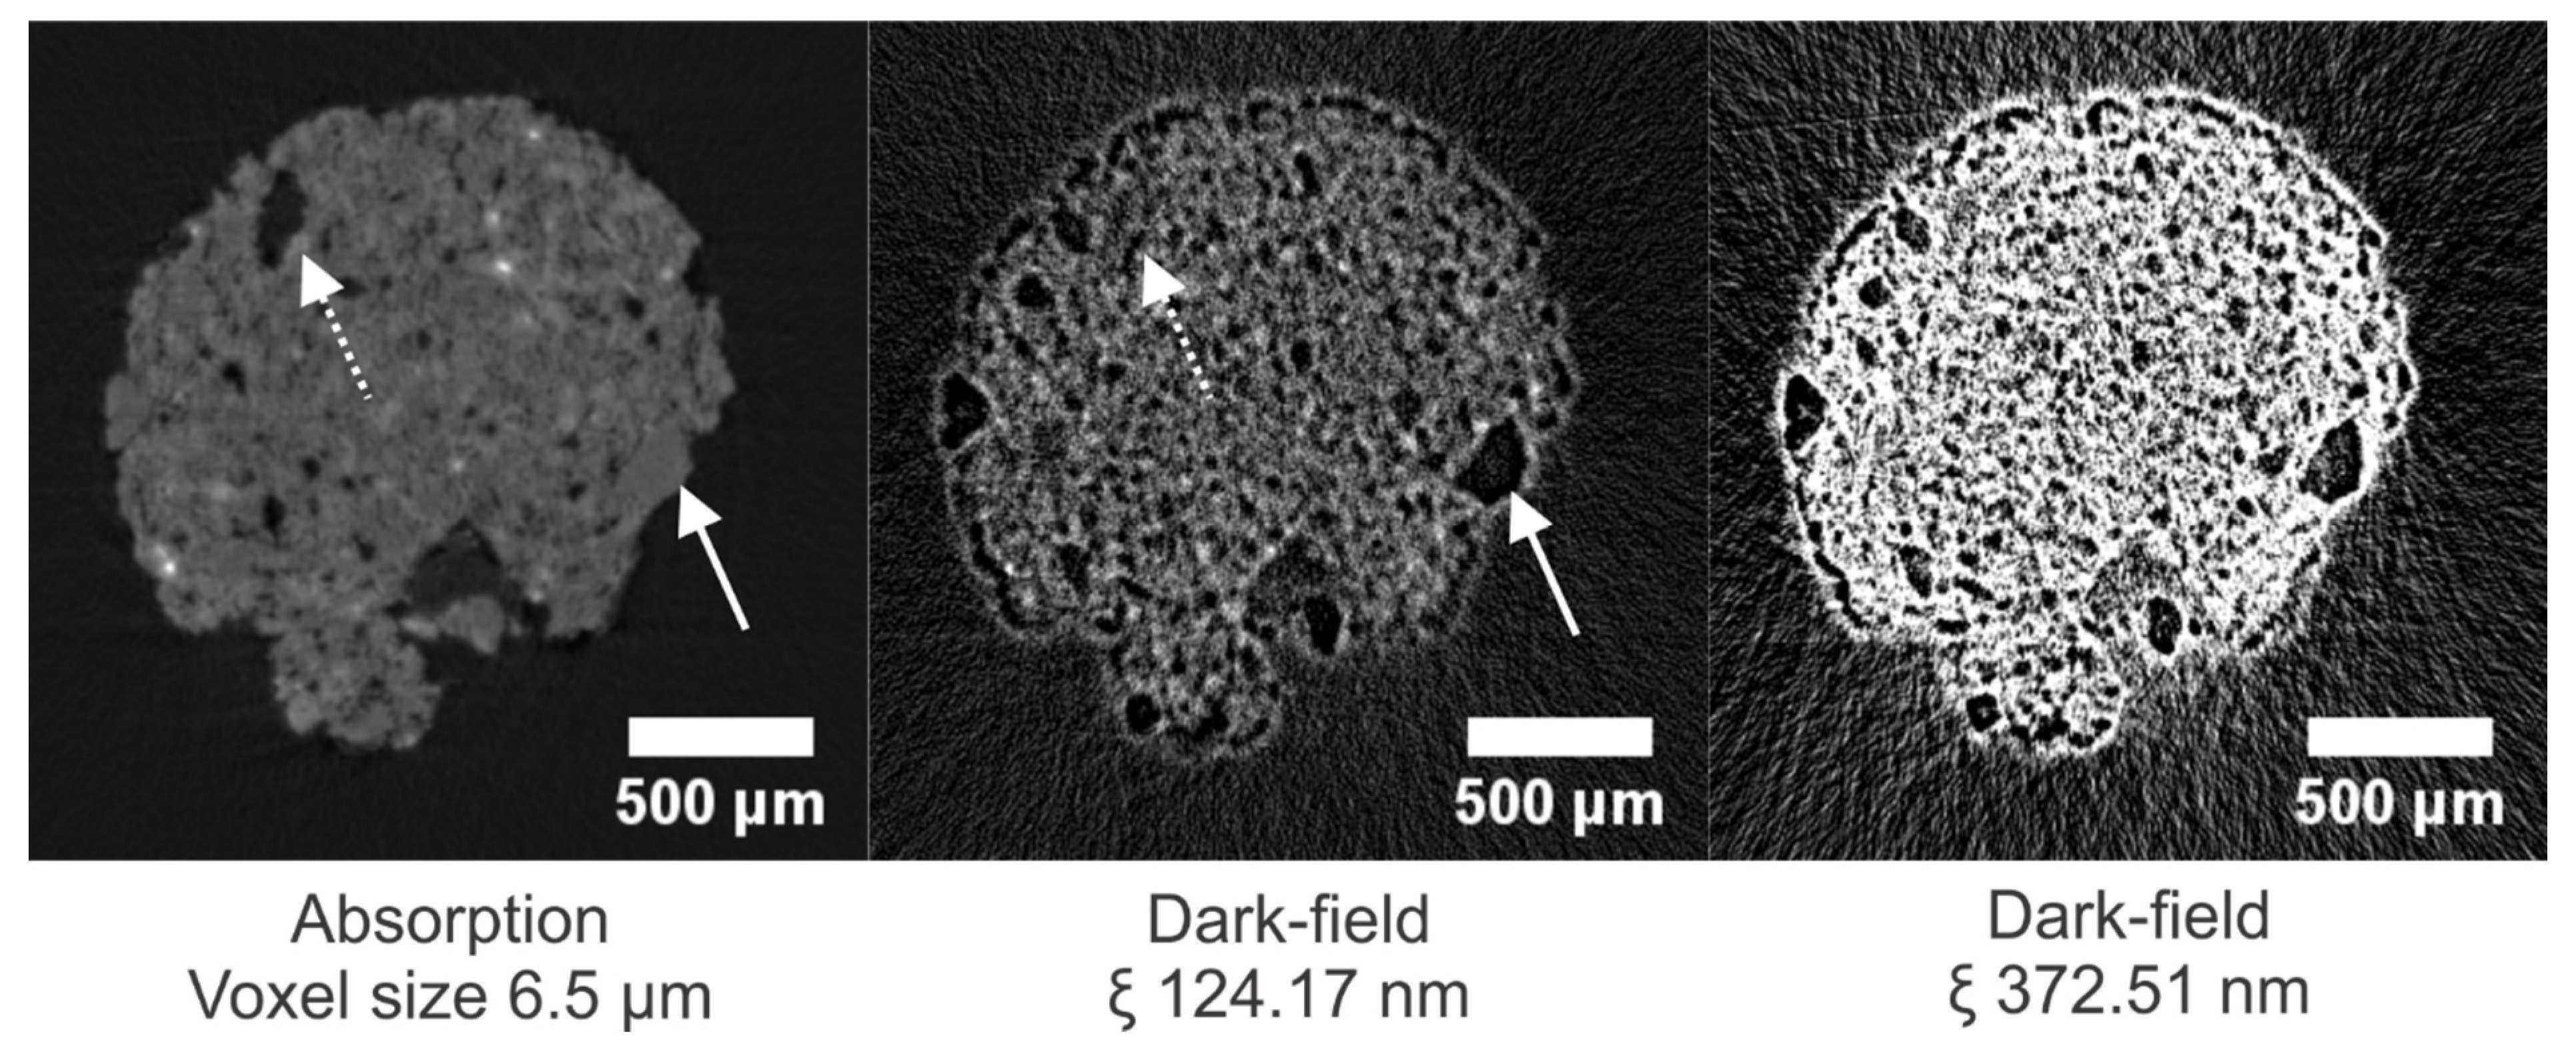
3.2. Brick (TB)
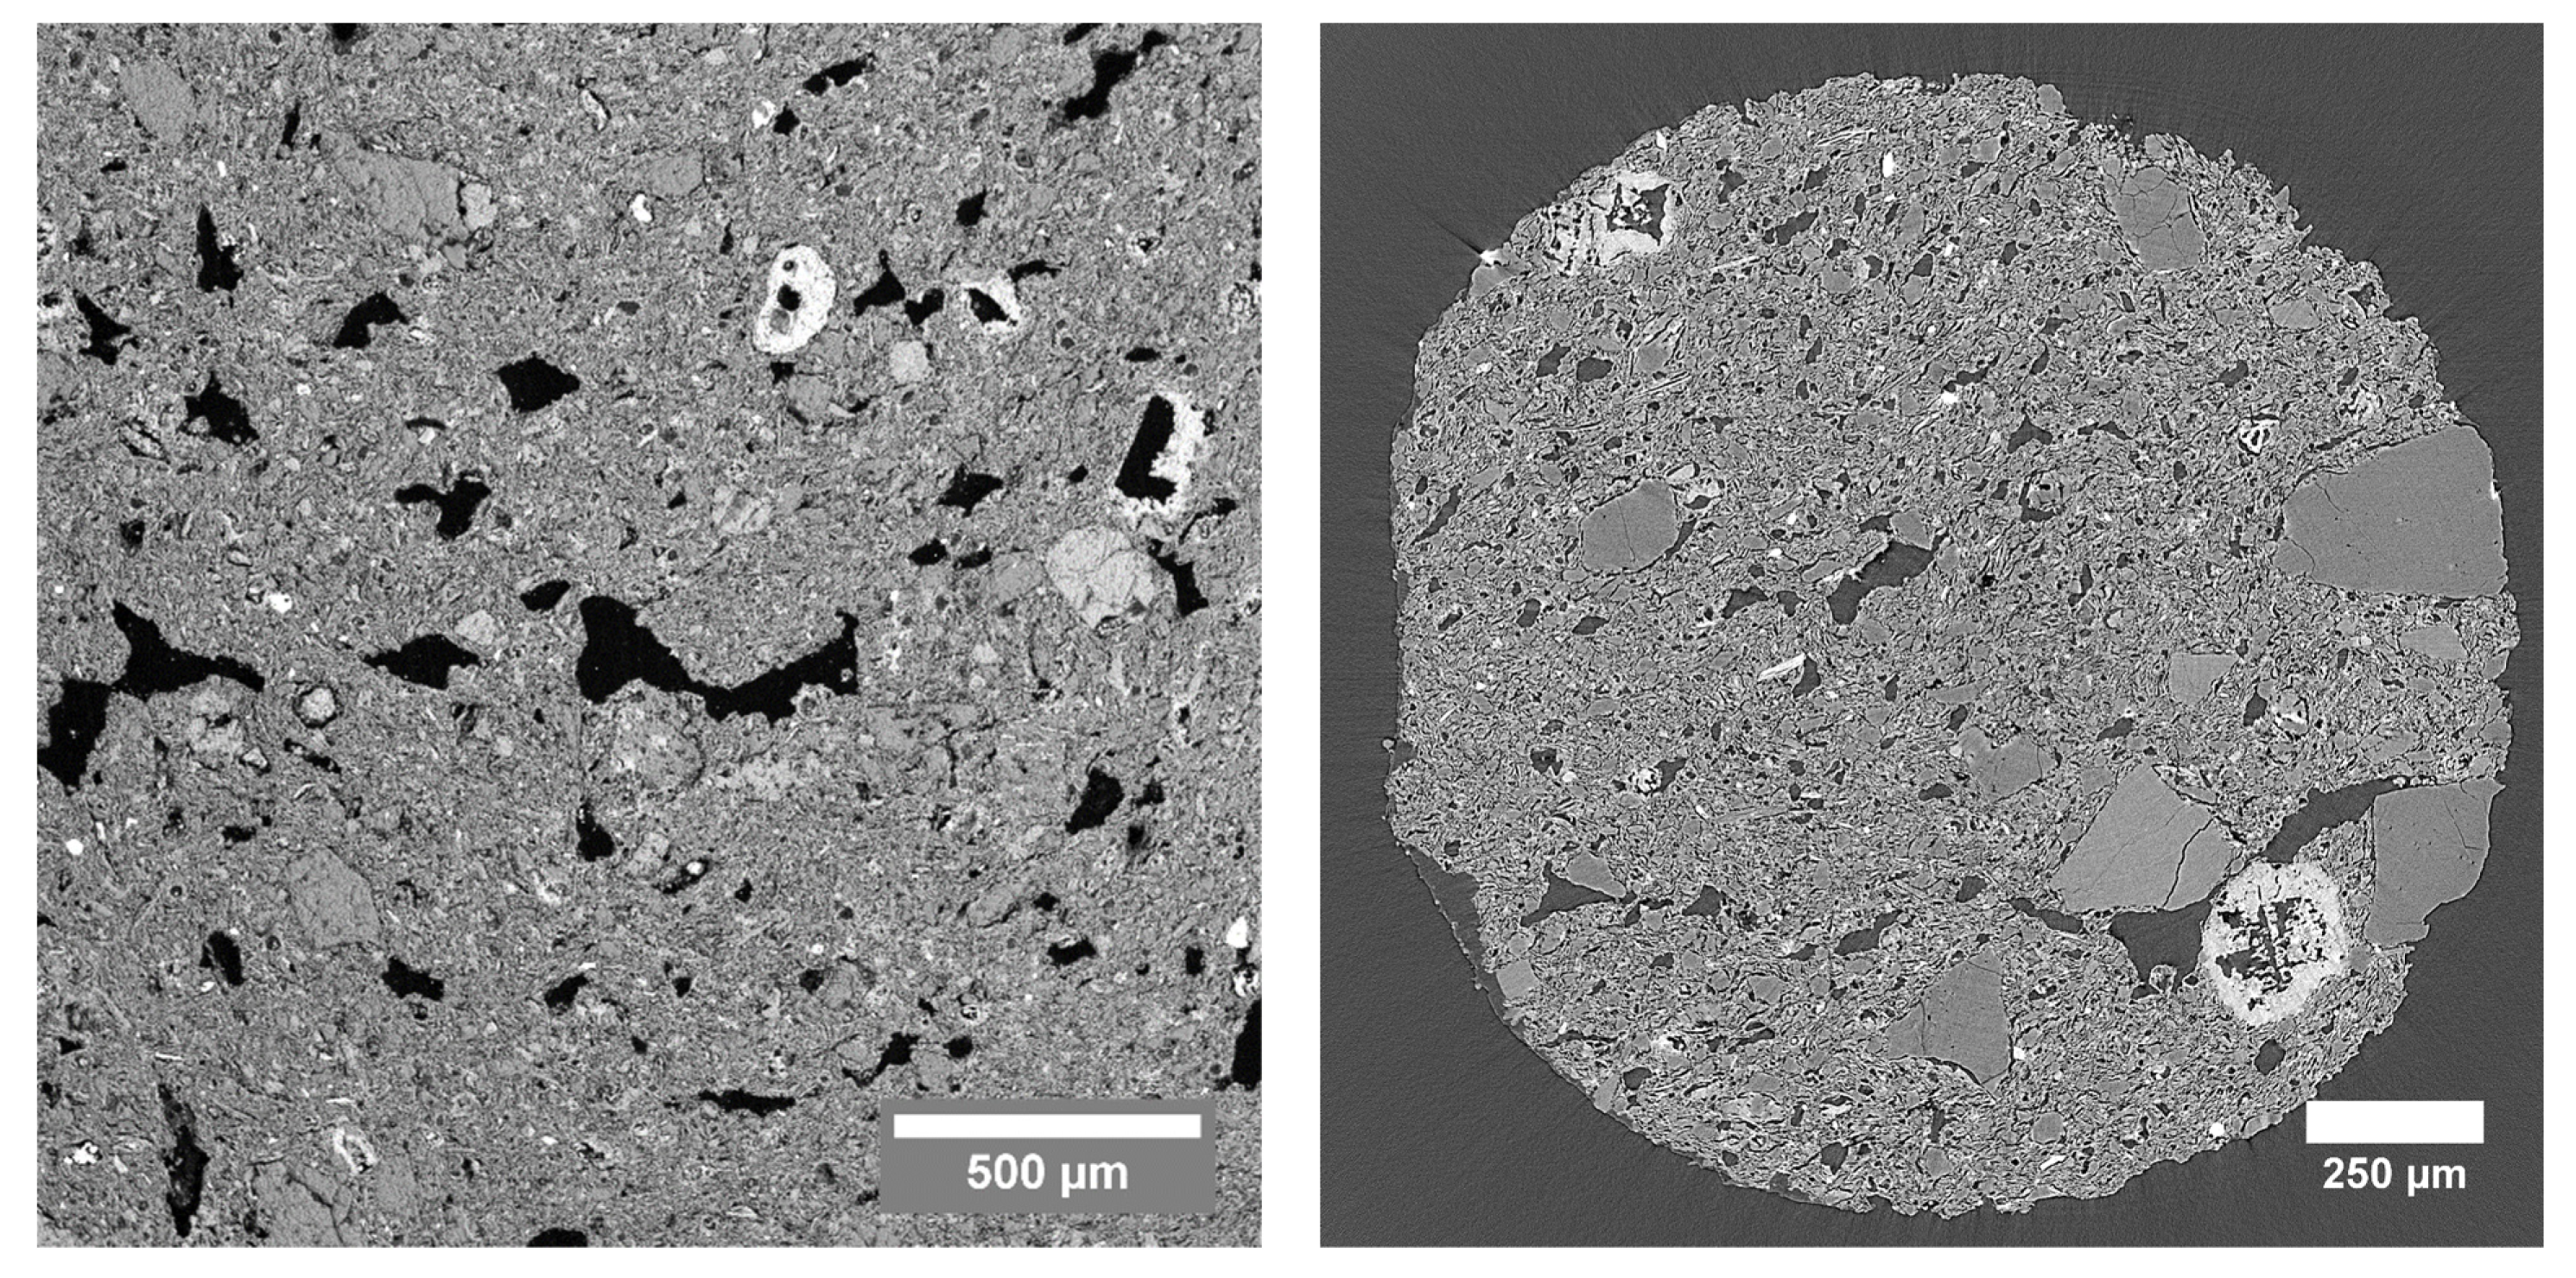
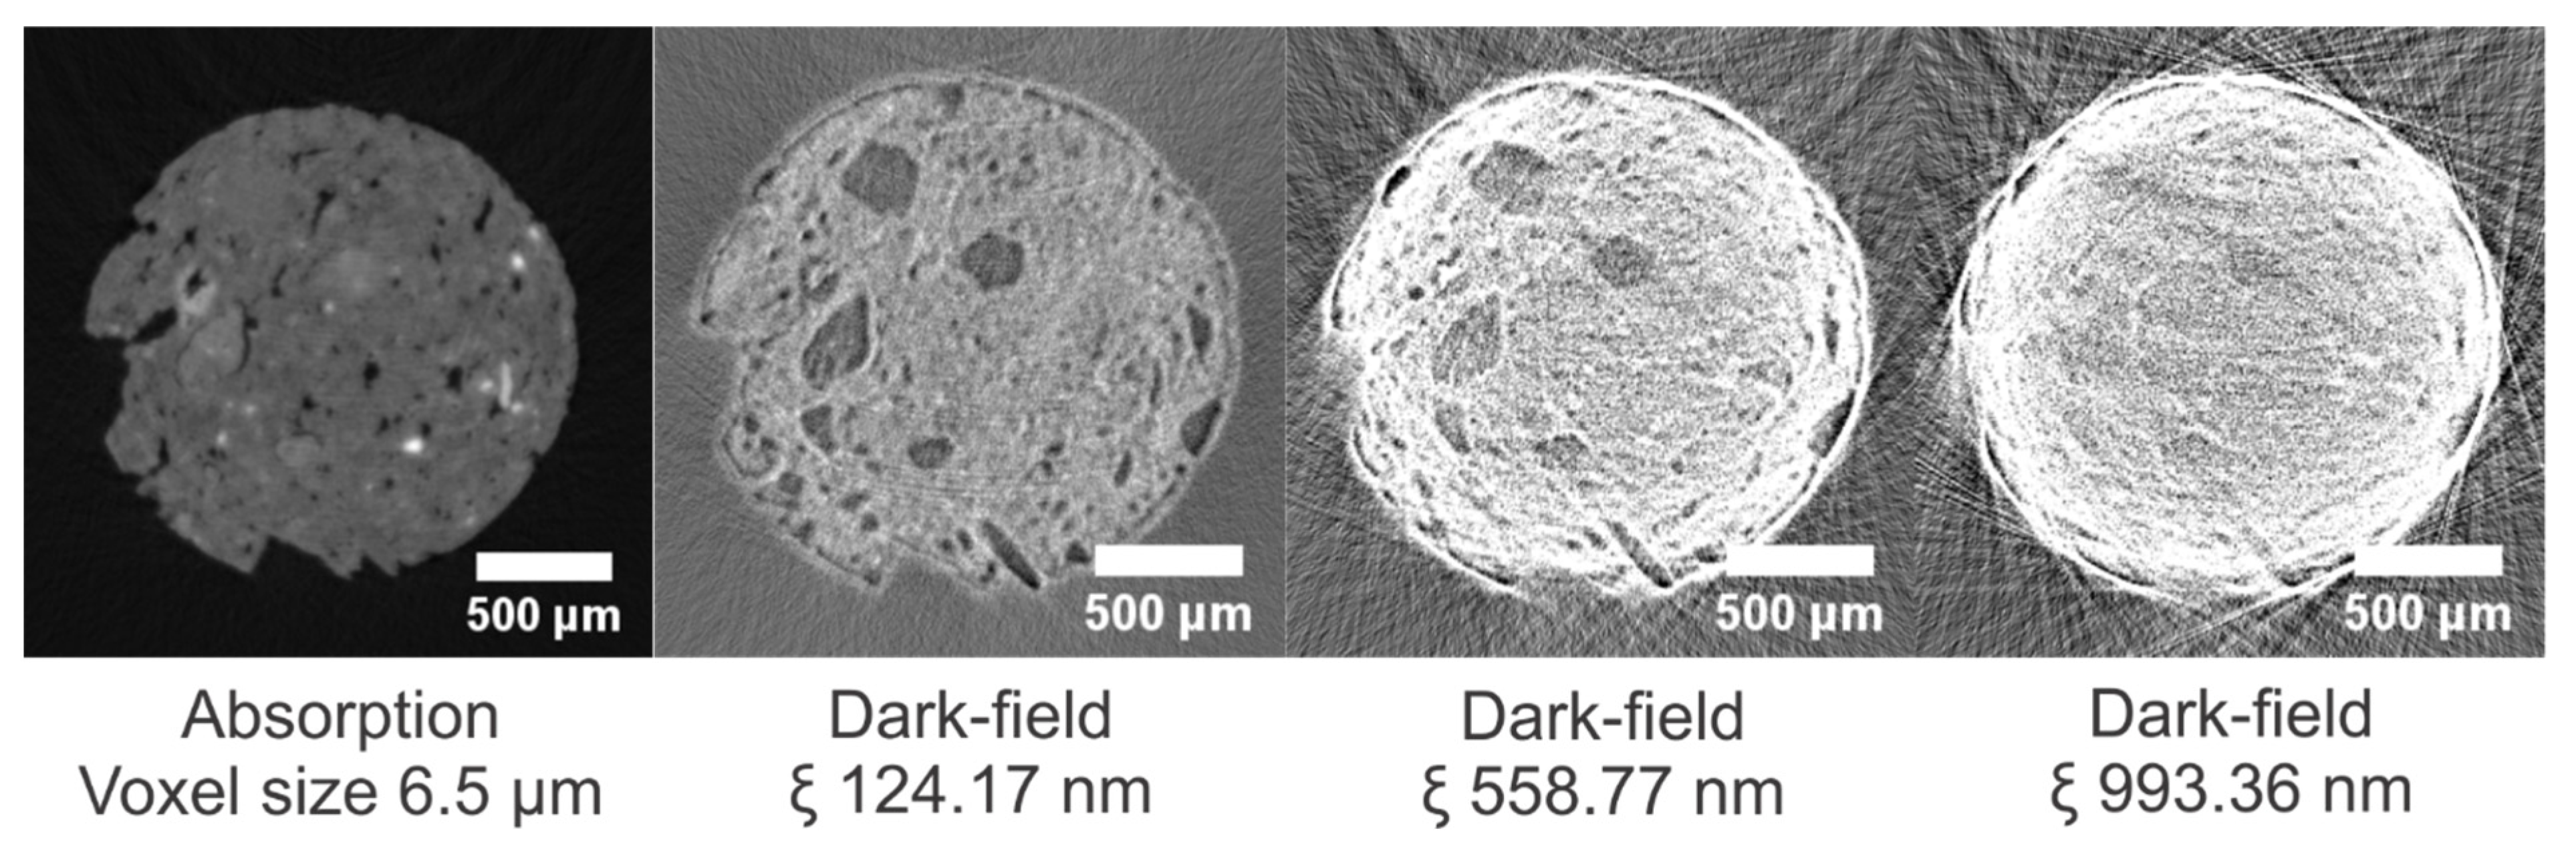
3.3. Roof Tile (TL)
3.4. Carbonated Sample
4. Discussion and Conclusions
4.1. Anisotropic Sample Structures
4.2. Scanning Durations
4.3. Outlook
Supplementary Materials
Author Contributions
Funding
Institutional Review Board Statement
Informed Consent Statement
Data Availability Statement
Acknowledgments
Conflicts of Interest
References
- Gentilini, C.; Franzoni, E.; Bandini, S.; Nobile, L. Effect of Salt Crystallisation on the Shear Behaviour of Masonry Walls: An Experimental Study. Constr. Build. Mater. 2012, 37, 181–189. [Google Scholar] [CrossRef]
- Gibeaux, S.; Vázquez, P.; De Kock, T.; Cnudde, V.; Thomachot-Schneider, C. Weathering Assessment under X-ray Tomography of Building Stones Exposed to Acid Atmospheres at Current Pollution Rate. Constr. Build. Mater. 2018, 168, 187–198. [Google Scholar] [CrossRef]
- Schröer, L.; Boon, N.; De Kock, T.; Cnudde, V. The Capabilities of Bacteria and Archaea to Alter Natural Building Stones—A Review. Int. Biodeterior. Biodegrad. 2021, 165, 105329. [Google Scholar] [CrossRef]
- Deprez, M.; De Kock, T.; De Schutter, G.; Cnudde, V. A Review on Freeze-Thaw Action and Weathering of Rocks. Earth-Sci. Rev. 2020, 203, 103143. [Google Scholar] [CrossRef]
- Withers, P.J.; Bouman, C.; Carmignato, S.; Cnudde, V.; Grimaldi, D.; Hagen, C.K.; Maire, E.; Manley, M.; Du Plessis, A.; Stock, S.R. X-ray Computed Tomography. Nat. Rev. Methods Prim. 2021, 1, 18. [Google Scholar] [CrossRef]
- Pfeiffer, F.; Bech, M.; Bunk, O.; Kraft, P.; Eikenberry, E.F.; Brönnimann, C.; Grünzweig, C.; David, C. Hard-X-ray Dark-Field Imaging Using a Grating Interferometer. Nat. Mater. 2008, 7, 134–137. [Google Scholar] [CrossRef]
- Bech, M.; Jensen, T.H.; Bunk, O.; Donath, T.; David, C.; Weitkamp, T.; Le Duc, G.; Bravin, A.; Cloetens, P.; Pfeiffer, F. Advanced Contrast Modalities for X-ray Radiology: Phase-Contrast and Dark-Field Imaging Using a Grating Interferometer. Z. Med. Phys. 2010, 20, 7–16. [Google Scholar] [CrossRef]
- Bultreys, T.; Boone, M.A.; Boone, M.N.; De Schryver, T.; Masschaele, B.; Van Hoorebeke, L.; Cnudde, V. Fast Laboratory-Based Micro-Computed Tomography for Pore-Scale Research: Illustrative Experiments and Perspectives on the Future. Adv. Water Resour. 2016, 95, 341–351. [Google Scholar] [CrossRef]
- Blykers, B.K.; Organista, C.; Boone, M.N.; Kagias, M.; Marone, F.; Stampanoni, M.; Bultreys, T.; Cnudde, V.; Aelterman, J. Tunable X-ray Dark-Field Imaging for Sub-Resolution Feature Size Quantification in Porous Media. Sci. Rep. 2021, 11, 18446. [Google Scholar] [CrossRef]
- Lynch, S.K.; Pai, V.; Auxier, J.; Stein, A.F.; Bennett, E.E.; Kemble, C.K.; Xiao, X.; Lee, W.K.; Morgan, N.Y.; Wen, H.H. Interpretation of Dark-Field Contrast and Particle-Size Selectivity in Grating Interferometers. Appl. Opt. 2011, 50, 4310–4319. [Google Scholar] [CrossRef] [PubMed]
- Kagias, M.; Wang, Z.; Jefimovs, K.; Stampanoni, M. Dual Phase Grating Interferometer for Tunable Dark-Field Sensitivity. Appl. Phys. Lett. 2017, 110, 014105. [Google Scholar] [CrossRef]
- Wang, Z.T.; Kang, K.J.; Huang, Z.F.; Chen, Z.Q. Quantitative Grating-Based X-ray Dark-Field Computed Tomography. Appl. Phys. Lett. 2009, 95, 3–6. [Google Scholar] [CrossRef]
- Modregger, P.; Wang, Z.; Thuering, T.; Pinzer, B.; Stampanoni, M. Artifacts in X-ray Dark-Field Tomography. AIP Conf. Proc. 2010, 1365, 269–272. [Google Scholar] [CrossRef] [Green Version]
- Kagias, M.E. Direct Self-Imaging Methods for X-ray Differential Phase and Scattering Imaging; ETH Zurich: Zürich, Switzerland, 2017; ISBN 9783906916019. [Google Scholar]
- Horn, F.; Bayer, F.; Gödel, K.; Haas, W.; Pelzer, G.; Rieger, J.; Ritter, A.; Weber, T.; Zang, A.; Durst, J.; et al. Artifacts in X-ray Dark-Field Measurements. Med. Imaging 2013 Phys. Med. Imaging 2013, 8668, 866855. [Google Scholar] [CrossRef]
- Bech, M.; Bunk, O.; Donath, T.; Feidenhans’l, R.; David, C.; Pfeiffer, F. Quantitative X-ray Dark-Field Computed Tomography. Phys. Med. Biol. 2010, 55, 5529–5539. [Google Scholar] [CrossRef]
- Koehler, T.; Martens, G.; Van Stevendaal, U.; Roessl, E. Non-Scatter Contributions to the Dark-Field Signal in Differential Phase Contrast Imaging. AIP Conf. Proc. 2012, 1466, 205–210. [Google Scholar] [CrossRef]
- Ritter, A.; Bayer, F.; Durst, J.; Gödel, K.; Haas, W.; Michel, T.; Weber, T.; Anton, G. Investigations on the Origin of the Darkfield Signal in X-ray Talbot Interferometry. In Proceedings of the IEEE Symposium on Nuclear Science (NSS/MIC), Valencia, Spain, 28–29 October 2011; pp. 2314–2315. [Google Scholar] [CrossRef]
- Pandeshwar, A.; Kagias, M.; Wang, Z.; Stampanoni, M. Modeling of Beam Hardening Effects in a Dual-Phase X-ray Grating Interferometer for Quantitative Dark-Field Imaging. Opt. Express 2020, 28, 19187–19204. [Google Scholar] [CrossRef]
- Yashiro, W.; Vagovič, P.; Momose, A. Effect of Beam Hardening on a Visibility-Contrast Image Obtained by X-ray Grating Interferometry. Opt. Express 2015, 23, 23462–23471. [Google Scholar] [CrossRef]
- Yashiro, W.; Terui, Y.; Kawabata, K.; Momose, A. On the Origin of Visibility Contrast in X-ray Talbot Interferometry. Opt. Express 2010, 18, 16890–16901. [Google Scholar] [CrossRef]
- Yashiro, W.; Harasse, S.; Kawabata, K.; Kuwabara, H.; Yamazaki, T.; Momose, A. Distribution of Unresolvable Anisotropic Microstructures Revealed in Visibility-Contrast Images Using X-ray Talbot Interferometry. Phys. Rev. B-Condens. Matter Mater. Phys. 2011, 84, 094106. [Google Scholar] [CrossRef]
- Ando, M.; Sugiyama, H.; Maksimenko, A.; Pattanasiriwisawa, W.; Hyodo, K.; Xiaowei, Z. A New Optics for Dark-Field Imaging in X-ray Region “Owl”. Jpn. J. Appl. Phys. Part 2 Lett. 2001, 40, L844. [Google Scholar] [CrossRef]
- Rieger, J.; Bayer, F.; Durst, J.; Gödel, K.; Haas, W.; Horn, F.; Michel, T.; Pelzer, G.; Ritter, A.; Weber, T.; et al. Grating-Based Dark-Field Breast Imaging. Med. Imaging 2013 Phys. Med. Imaging 2013, 8668, 866810. [Google Scholar] [CrossRef]
- Emons, J.; Fasching, P.A.; Wunderle, M.; Heindl, F.; Rieger, J.; Horn, F.; Pelzer, G.; Ritter, A.; Weber, T.; Radicke, M.; et al. Assessment of the Additional Clinical Potential of X-ray Dark-Field Imaging for Breast Cancer in a Preclinical Setup. Ther. Adv. Med. Oncol. 2020, 12, 1–10. [Google Scholar] [CrossRef]
- Lång, K.; Arboleda, C.; Forte, S.; Wang, Z.; Prevrhal, S.; Koehler, T.; Kuhn, N.; David, B.; Jefimovs, K.; Kubik-Huch, R.A.; et al. Microbubbles as a Contrast Agent in Grating Interferometry Mammography: An Ex Vivo Proof-of-Mechanism Study. Eur. Radiol. Exp. 2019, 3, 19. [Google Scholar] [CrossRef]
- Fingerle, A.A.; De Marco, F.; Andrejewski, J.; Willer, K.; Gromann, L.B.; Noichl, W.; Kriner, F.; Fischer, F.; Braun, C.; Maack, H.I.; et al. Imaging Features in Post-Mortem X-ray Dark-Field Chest Radiographs and Correlation with Conventional X-ray and CT. Eur. Radiol. Exp. 2019, 3, 25. [Google Scholar] [CrossRef]
- Gromann, L.B.; De Marco, F.; Willer, K.; Noël, P.B.; Scherer, K.; Renger, B.; Gleich, B.; Achterhold, K.; Fingerle, A.A.; Muenzel, D.; et al. In-Vivo X-ray Dark-Field Chest Radiography of a Pig. Sci. Rep. 2017, 7, 4807. [Google Scholar] [CrossRef] [PubMed] [Green Version]
- Nielsen, M.S.; Christensen, L.B.; Feidenhans’l, R. Frozen and Defrosted Fruit Revealed with X-ray Dark-Field Radiography. Food Control 2014, 39, 222–226. [Google Scholar] [CrossRef]
- Nielsen, M.S.; Damkjær, K.B.; Feidenhans’l, R. Quantitative In-Situ Monitoring of Germinating Barley Seeds Using X-ray Dark-Field Radiography. J. Food Eng. 2017, 198, 98–104. [Google Scholar] [CrossRef] [Green Version]
- Gusenbauer, C.; Reiter, M.; Plank, B.; Salaberger, D.; Senck, S.; Kastner, J. Porosity Determination of Carbon and Glass Fibre Reinforced Polymers Using Phase-Contrast Imaging. J. Nondestruct. Eval. 2019, 38, 1. [Google Scholar] [CrossRef]
- Kagias, M.; Wang, Z.; Birkbak, M.E.; Lauridsen, E.; Abis, M.; Lovric, G.; Jefimovs, K.; Stampanoni, M. Diffractive Small Angle X-ray Scattering Imaging for Anisotropic Structures. Nat. Commun. 2019, 10, 5130. [Google Scholar] [CrossRef] [PubMed] [Green Version]
- Lauridsen, T.; Lauridsen, E.M.; Feidenhans’L, R. Mapping Misoriented Fibers Using X-ray Dark Field Tomography. Appl. Phys. A Mater. Sci. Process. 2014, 115, 741–745. [Google Scholar] [CrossRef]
- Senck, S.; Scheerer, M.; Revol, V.; Plank, B.; Hannesschläger, C.; Gusenbauer, C.; Kastner, J. Microcrack Characterization in Loaded CFRP Laminates Using Quantitative Two- and Three-Dimensional X-ray Dark-Field Imaging. Compos. Part A Appl. Sci. Manuf. 2018, 115, 206–214. [Google Scholar] [CrossRef]
- Kim, J.; Slyamov, A.; Lauridsen, E.; Birkbak, M.; Ramos, T.; Marone, F.; Andreasen, J.W.; Stampanoni, M.; Kagias, M. Macroscopic Mapping of Microscale Fibers in Freeform Injection Molded Fiber-Reinforced Composites Using X-ray Scattering Tensor Tomography. Compos. Part B Eng. 2022, 233, 109634. [Google Scholar] [CrossRef]
- Endrizzi, M.; Murat, B.I.S.; Fromme, P.; Olivo, A. Edge-Illumination X-ray Dark-Field Imaging for Visualising Defects in Composite Structures. Compos. Struct. 2015, 134, 895–899. [Google Scholar] [CrossRef]
- Fromme, P.; Endrizzi, M.; Olivo, A. Defect Imaging in Composite Structures. In AIP Conference Proceedings; AIP Publishing LLC: Melville, NY, USA, 2018; Volume 1949. [Google Scholar]
- Lauridsen, T.; Willner, M.; Bech, M.; Pfeiffer, F.; Feidenhans’l, R. Detection of Sub-Pixel Fractures in X-ray Dark-Field Tomography. Appl. Phys. A Mater. Sci. Process. 2015, 121, 1243–1250. [Google Scholar] [CrossRef]
- Jerjen, I.; Revol, V.; Brunner, A.J.; Schuetz, P.; Kottler, C.; Kaufmann, R.; Luethi, T.; Nicoletti, G.; Urban, C.; Sennhauser, U. Detection of Stress Whitening in Plastics with the Help of X-ray Dark Field Imaging. Polym. Test. 2013, 32, 1094–1098. [Google Scholar] [CrossRef]
- Schaff, F.; Bachmann, A.; Zens, A.; Zaeh, M.F.; Pfeiffer, F.; Herzen, J. Grating-Based X-ray Dark-Field Computed Tomography for the Characterization of Friction Stir Welds: A Feasibility Study. Mater. Charact. 2017, 129, 143–148. [Google Scholar] [CrossRef]
- Revol, V.; Jerjen, I.; Kottler, C.; Schtz, P.; Kaufmann, R.; Lthi, T.; Sennhauser, U.; Straumann, U.; Urban, C. Sub-Pixel Porosity Revealed by X-ray Scatter Dark Field Imaging. J. Appl. Phys. 2011, 110, 044912. [Google Scholar] [CrossRef] [Green Version]
- Prade, F.; Chabior, M.; Malm, F.; Grosse, C.U.; Pfeiffer, F. Observing the Setting and Hardening of Cementitious Materials by X-ray Dark-Field Radiography. Cem. Concr. Res. 2015, 74, 19–25. [Google Scholar] [CrossRef]
- Prade, F.; Fischer, K.; Heinz, D.; Meyer, P.; Mohr, J.; Pfeiffer, F. Time Resolved X-ray Dark-Field Tomography Revealing Water Transport in a Fresh Cement Sample. Sci. Rep. 2016, 6, 29108. [Google Scholar] [CrossRef] [Green Version]
- Sarapata, A.; Ruiz-Yaniz, M.; Zanette, I.; Rack, A.; Pfeiffer, F.; Herzen, J. Multi-Contrast 3D X-ray Imaging of Porous and Composite Materials. Appl. Phys. Lett. 2015, 106, 154102. [Google Scholar] [CrossRef]
- Stampanoni, M.; Groso, A.; Isenegger, A.; Mikuljan, G.; Chen, Q.; Meister, D.; Lange, M.; Betemps, R.; Henein, S.; Abela, R. TOMCAT: A Beamline for TOmographic Microscopy and Coherent RAdiology ExperimenTs. In AIP Conference Proceedings; AIP Publishing LLC: Melville, NY, USA, 2007; Volume 879, pp. 848–851. [Google Scholar]
- Kagias, M.; Wang, Z.; Guzenko, V.A.; David, C.; Stampanoni, M.; Jefimovs, K. Fabrication of Au Gratings by Seedless Electroplating for X-ray Grating Interferometry. Mater. Sci. Semicond. Process. 2019, 92, 73–79. [Google Scholar] [CrossRef]
- Marone, F.; Stampanoni, M. Regridding Reconstruction Algorithm for Real-Time Tomographic Imaging. J. Synchrotron Radiat. 2012, 19, 1029–1037. [Google Scholar] [CrossRef] [Green Version]
- Münch, B.; Trtik, P.; Marone, F.; Stampanoni, M. Stripe and Ring Artifact Removal with Combined Wavelet-Fourier Filtering. EMPA Act. 2009, 17, 34–35. [Google Scholar] [CrossRef] [Green Version]
- Cnudde, V.; Jacobs, P.J.S. Monitoring of Weathering and Conservation of Building Materials through Non-Destructive X-ray Computed Microtomography. Environ. Geol. 2004, 46, 477–485. [Google Scholar] [CrossRef]
- Al-Raoush, R.; Papadopoulos, A. Representative Elementary Volume Analysis of Porous Media Using X-ray Computed Tomography. Powder Technol. 2010, 200, 69–77. [Google Scholar] [CrossRef]
- Daval, D.; Martinez, I.; Corvisier, J.; Findling, N.; Goffé, B.; Guyot, F. Carbonation of Ca-Bearing Silicates, the Case of Wollastonite: Experimental Investigations and Kinetic Modeling. Chem. Geol. 2009, 265, 63–78. [Google Scholar] [CrossRef]
- Boone, M.A. 3D Visualization of Mineral Carbonation: ΜCT as a Tool to Understand Pore Scale Processes. Ph.D. Thesis, Ghent University, Ghent, Belgium, 2015. [Google Scholar]
- Jensen, T.H.; Bech, M.; Bunk, O.; Donath, T.; David, C.; Feidenhans’L, R.; Pfeiffer, F. Directional X-ray Dark-Field Imaging. Phys. Med. Biol. 2010, 55, 3317–3323. [Google Scholar] [CrossRef] [PubMed]
- Modregger, P.; Pinzer, B.R.; Thüring, T.; Rutishauser, S.; David, C.; Stampanoni, M. Sensitivity of X-ray Grating Interferometry. Opt. Express 2011, 19, 18324–18338. [Google Scholar] [CrossRef] [PubMed]
- Kagias, M.; Wang, Z.; Lovric, G.; Jefimovs, K.; Stampanoni, M. Simultaneous Reciprocal and Real Space X-ray Imaging of Time-Evolving Systems. Phys. Rev. Appl. 2021, 15, 044038. [Google Scholar] [CrossRef]
- Von Teuffenbach, M.; Koehler, T.; Fehringer, A.; Viermetz, M.; Brendel, B.; Herzen, J.; Proksa, R.; Rummeny, E.J.; Pfeiffer, F.; Noël, P.B. Grating-Based Phase-Contrast and Dark-Field Computed Tomography: A Single-Shot Method. Sci. Rep. 2017, 7, 7476. [Google Scholar] [CrossRef] [Green Version]
- Zhou, T.; Wang, H.; Sawhney, K. Single-Shot X-ray Dark-Field Imaging with Omnidirectional Sensitivity Using Random-Pattern Wavefront Modulator. Appl. Phys. Lett. 2018, 113, 091102. [Google Scholar] [CrossRef]


| Correlation Length (nm) | Sample-G2 Distance (mm) | Sample | |||
|---|---|---|---|---|---|
| TB | TL | Carb. | Bray | ||
| 124.17 | 10 | X | X | X | X |
| 186.26 | 15 | X | X | X | |
| 248.34 | 20 | X | X | ||
| 310.43 | 25 | X | X | ||
| 372.51 | 30 | X | X | ||
| 434.60 | 35 | X | X | ||
| 496.68 | 40 | X | |||
| 558.77 | 45 | X | X | ||
| 682.94 | 55 | X | |||
| 807.11 | 65 | X | |||
| 931.28 | 75 | X | |||
| 993.36 | 80 | X | X | ||
| Projections per phase step | 501 | 1001 | 501 | 1001 | |
| Sample diameter (mm) | 1.5 | 1.5 | 1.5 | 3 | |
Publisher’s Note: MDPI stays neutral with regard to jurisdictional claims in published maps and institutional affiliations. |
© 2022 by the authors. Licensee MDPI, Basel, Switzerland. This article is an open access article distributed under the terms and conditions of the Creative Commons Attribution (CC BY) license (https://creativecommons.org/licenses/by/4.0/).
Share and Cite
Blykers, B.K.; Organista, C.; Kagias, M.; Marone, F.; Stampanoni, M.; Boone, M.N.; Cnudde, V.; Aelterman, J. Exploration of the X-ray Dark-Field Signal in Mineral Building Materials. J. Imaging 2022, 8, 282. https://doi.org/10.3390/jimaging8100282
Blykers BK, Organista C, Kagias M, Marone F, Stampanoni M, Boone MN, Cnudde V, Aelterman J. Exploration of the X-ray Dark-Field Signal in Mineral Building Materials. Journal of Imaging. 2022; 8(10):282. https://doi.org/10.3390/jimaging8100282
Chicago/Turabian StyleBlykers, Benjamin K., Caori Organista, Matias Kagias, Federica Marone, Marco Stampanoni, Matthieu N. Boone, Veerle Cnudde, and Jan Aelterman. 2022. "Exploration of the X-ray Dark-Field Signal in Mineral Building Materials" Journal of Imaging 8, no. 10: 282. https://doi.org/10.3390/jimaging8100282