Article

The Relationship between Knowledge, Attitudes, Values, and Technology in Promoting Zero-Waste Pro-Environmental Behaviour in a Zero-Waste Campus Framework

by
Mayawi Baba-Nalikant
1,*,
Nor Athiyah Abdullah
1,
Mohd Heikal Husin
1,
Sharifah Mashita Syed-Mohamad
2,
Mohamad Saifudin Mohamad Saleh
3 and
Asyirah Abdul Rahim
4
1
School of Computer Sciences, Universiti Sains Malaysia, Gelugor 11800, Malaysia
2
Faculty of Ocean Engineering Technology and Informatics, Universiti Malaysia Terengganu, Kuala Terengganu 21030, Malaysia
3
School of Communication, Universiti Sains Malaysia, Gelugor 11800, Malaysia
4
School of Humanities, Universiti Sains Malaysia, Gelugor 11800, Malaysia
*
Author to whom correspondence should be addressed.
Recycling 2023, 8(2), 40; https://doi.org/10.3390/recycling8020040
Submission received: 11 February 2023 / Revised: 11 March 2023 / Accepted: 3 April 2023 / Published: 5 April 2023
(This article belongs to the Topic Solid Waste Management)

Abstract

:
This study aimed to investigate the relationships between knowledge, attitudes, and values in promoting zero-waste, pro-environmental behaviour among the university campus community and how technology plays its role. A survey instrument was developed from the findings of earlier focus group discussions and in-depth interviews, which were based on the adaptation and adoption of previous studies, especially Kollmuss and Agyeman’s 2002 Model of Pro-Environmental Behaviour and a modified Knowledge-Attitude-Practises Model. Three hundred ninety-three respondent samples from Universiti Kebangsaan Malaysia, Universiti Putra Malaysia, and Universiti Sains Malaysia were analysed for their insights regarding their vision of a Zero-Waste Campus using the Structural Equation Modelling approach. The results show positive relationships between the five studied variables and the proposed hypotheses. Knowledge and attitudes serve as moderating variables, enhancing the strength of the causal effects of the related relationships. As the results show good significance, proper planning for integrating the studied variables and the proposed zero-waste campus framework can be used by university management, other institutions, or national-level agencies to develop an environment-specific plan to promote zero-waste, pro-environmental behaviour.

1. Introduction

Solid waste management (SWM) remains a major societal and governance challenge, particularly in urban areas overwhelmed by rapid population growth and waste generation [1]. Urban lifestyle changes have resulted in a severe Municipal Solid Waste (MSW) problem. The rate of waste generation caused by urbanisation is surging along with the rate of urbanisation itself [2]. Human activities continuously generate waste from industry, construction, commerce, the services and domestic sectors, and individual households [3]. Annual waste generation is expected to increase by 73% from 2020 levels to 3.88 billion tonnes in 2050 due to rapid population growth and urbanisation. Residents in developing countries, particularly the urban poor, are more severely impacted by unsustainable waste management than those in developed countries [4]. As the global alarm is raised, there is a growing interest in addressing global waste problems through the implementation of innovative ideas and philosophies such as zero-waste and the circular economy [5]. Zero-waste as a new sustainability concept challenges the widely held belief that waste is a worthless and unavoidable byproduct produced at the end of a product’s life cycle. Instead, the zero-waste concept recognises waste as a “misallocated resource” or “resource in transition “generated throughout the intermediate phases [6]. The zero-waste campus initiatives have been introduced in several public universities in Malaysia. These initiatives are the continuation of sustainability programmes [7]. Through education and research, Universiti Kebangsaan Malaysia (UKM), Universiti Putra Malaysia (UPM), Universiti Malaya (UM), and especially Universiti Sains Malaysia (USM) strive to promote sustainability in their communities [8]. Learning is highly valued and actively encouraged across diverse organisational cultures in educational institutions. Thus, universities provide an excellent platform for educating future generations of citizens and leaders [9]. Furthermore, university campuses can be seen as small cities because of their extensive coverage, large population numbers, and myriad complicated activities that may or may not impact the environment [10]. On the low end, Malaysian universities are said to contribute significantly to the country’s solid waste generation [11]. Therefore, resolving MSW issues on campus might be relevant and adopted by the government at the national level to develop appropriate measures to increase public awareness and participation in promoting pro-environmental behaviour (PEB) towards a zero-waste goal. Furthermore, sustainable SWM can contribute to the achievement of several United Nations Sustainable Development Goals (SDGs), including good health and wellbeing (SDG3), clean water and sanitation (SDG6), sustainable cities and inclusive communities (SDG11), responsible consumption and production (SDG12), climate change (SDG13), life below water (SDG14), and life on land (SDG15) [12].
The MSW problem is among the many environmental concerns influenced by human behaviour [13] that must be addressed appropriately. Behavioural scientists have generally focused on theoretical frameworks and related approaches to investigate the determinants of environmental behaviour, which is considered an integrated and inter-disciplinary component of environmental psychology [14]. Thus, there are apparent benefits to applying psychological theories to nurture pro-environmental behaviour [15]. Behavioural interventions are effective when they are systematically planned, implemented, and evaluated [16]. Therefore, education—the process of receiving or imparting structured instruction—is a critical discipline for disseminating ideas about sustainable development [17,18]. Thus, Malaysian universities as higher education institutions are believed to be the right setting for promoting pro-environmental behaviour, especially to overcome the MSW problems.
Ten relevant factors influencing a community’s sustainable pro-environmental behaviour towards a zero-waste campus have been identified and incorporated into the Zero-Waste Campus Framework, which was proposed in a previous paper for this research [19]. The proposed framework will be tested and verified further in this paper using the survey results. The relationships between knowledge, attitudes, values, and technology with zero-waste PEB practises are validated.
This paper is divided into four major sections: introduction, results and discussion, materials and methods, and conclusion. The results and discussion sections discuss zero-waste campus framework verification using confirmatory factor analysis and hypothesis testing. The flow of the study, survey instrument development and validation processes, and research hypotheses are explained in the material and methods section. Kollmuss and Agyeman’s Model of Pro-Environmental Behaviour and the modified Knowledge-Attitude-Practises (KAP) Model used as the primary tool for the survey are explained in the same section. Limitations and future recommendations are proposed in the conclusion.

2. Results and Discussion

The development and general description of the framework have been briefly described in the previously published paper [19]. The proposed Zero-Waste Campus Framework builds on several theoretical models, including Kollmuss and Agyeman model of Pro-Environmental Behavior, Theories of Planned Behavior, Value-Belief Norm Model, and Knowledge-Attitude-Practice model. The study’s qualitative and quantitative findings are then incorporated into the development of a new theory based on these models and theories.

2.1. Modified Knowledge, Attitudes, and Practises (KAP) Model

The KAP Model refers to the interaction of knowledge, attitudes, and practise [20]. This model was created as a tool to study what participants in a particular topic know, think, and do. This model is economical and one of the earliest models to facilitate questionnaire development that focuses on specific audiences, identifying barriers and constraints commonly used to study human behaviour [21]. As one of the first models, the guidance for the development of instruments based on this model has been established in various disciplines, including study guidelines [22,23,24] and survey research recommendations [25,26].
KAP surveys are often custom-designed for each situation and project, and the content represents specific knowledge, attitudes, and practises for each project. Knowledge, attitude, and practise are the three essential domains or constructs of identification in KAP surveys. In this study, knowledge refers to the acquisition, retention, and application of information combined with experience and skills that result from education and experience about zero-waste, particularly waste minimisation, and recycling. Attitude is a degree of favour, disfavour, or feelings in determining the general factors contributing to the campus’s MSW problem. Practises relate to the participant’s actions to improve the MSW problem and establish a campus free of waste. It is a facet of the model that helps comprehend how knowledge links to attitudes and practises towards pro-environmental behaviour.
In this study, the KAP Model was slightly modified to recognise the importance of value, as described in [27]. According to previous studies, values are essential in determining pro-environmental behaviour [28,29]. Redcliff [30] notes that values are frequently negotiated, impermanent, and conflicting. Value is a human affective dimension [31] that involves the internalisation of emotion and feeling. The acceptance of a phenomenon or behaviour about worth, excellence, practicality, or significance is referred to as value. In this study, value refers to one’s preference for zero-waste behaviours. This construct entails identifying specific emotions that influence behaviour. The preceding discussion demonstrated the importance of social and human behaviour in ensuring environmental sustainability [32].
In addition, technological advancement also plays a vital role in sustainable environmental development [33]. According to [34], science and technology are essential components of environmental protection and conservation. Fogg [35] stated that the advancement of information technology has changed how people work, network, and communicate. His book discusses how websites, software applications, and mobile devices might be utilised to affect people’s attitudes and behaviours. He defined this as persuasive technology designed to influence users’ attitudes or behaviours by persuasion and social influence rather than through pressure. The Fogg functional triad is a conceptual framework that summarises technology’s three roles as a tool, media, and social actor. These three functions define how humans interact with or react to almost any computing product. According to Zheng, Chen, and Kong [36], technology increases motivation and self-efficacy among adult learners. While Yükseltürk, Altiok, and Baser [37] acknowledged that technology-assisted learning has a significant positive influence on improving students’ metacognitive levels. According to the World Bank [38], Malaysia has 139.6% mobile penetration, with more than 40 million mobile cellular subscriptions. This statistic shows that Malaysians have an advantage. This statistic supports Sung, Chang, and Liu’s [39] finding that learners performed significantly better while using mobile devices. As a result, it is vital to explore the roles of technology, particularly information technology, in fostering zero-waste behaviour among the university campus community. According to Malik et al. [40], education needs to promote technology-related sustainability awareness among students. It is believed that combining good human behaviour with adequate technological utilisation will result in a better solution to the solid waste problem.

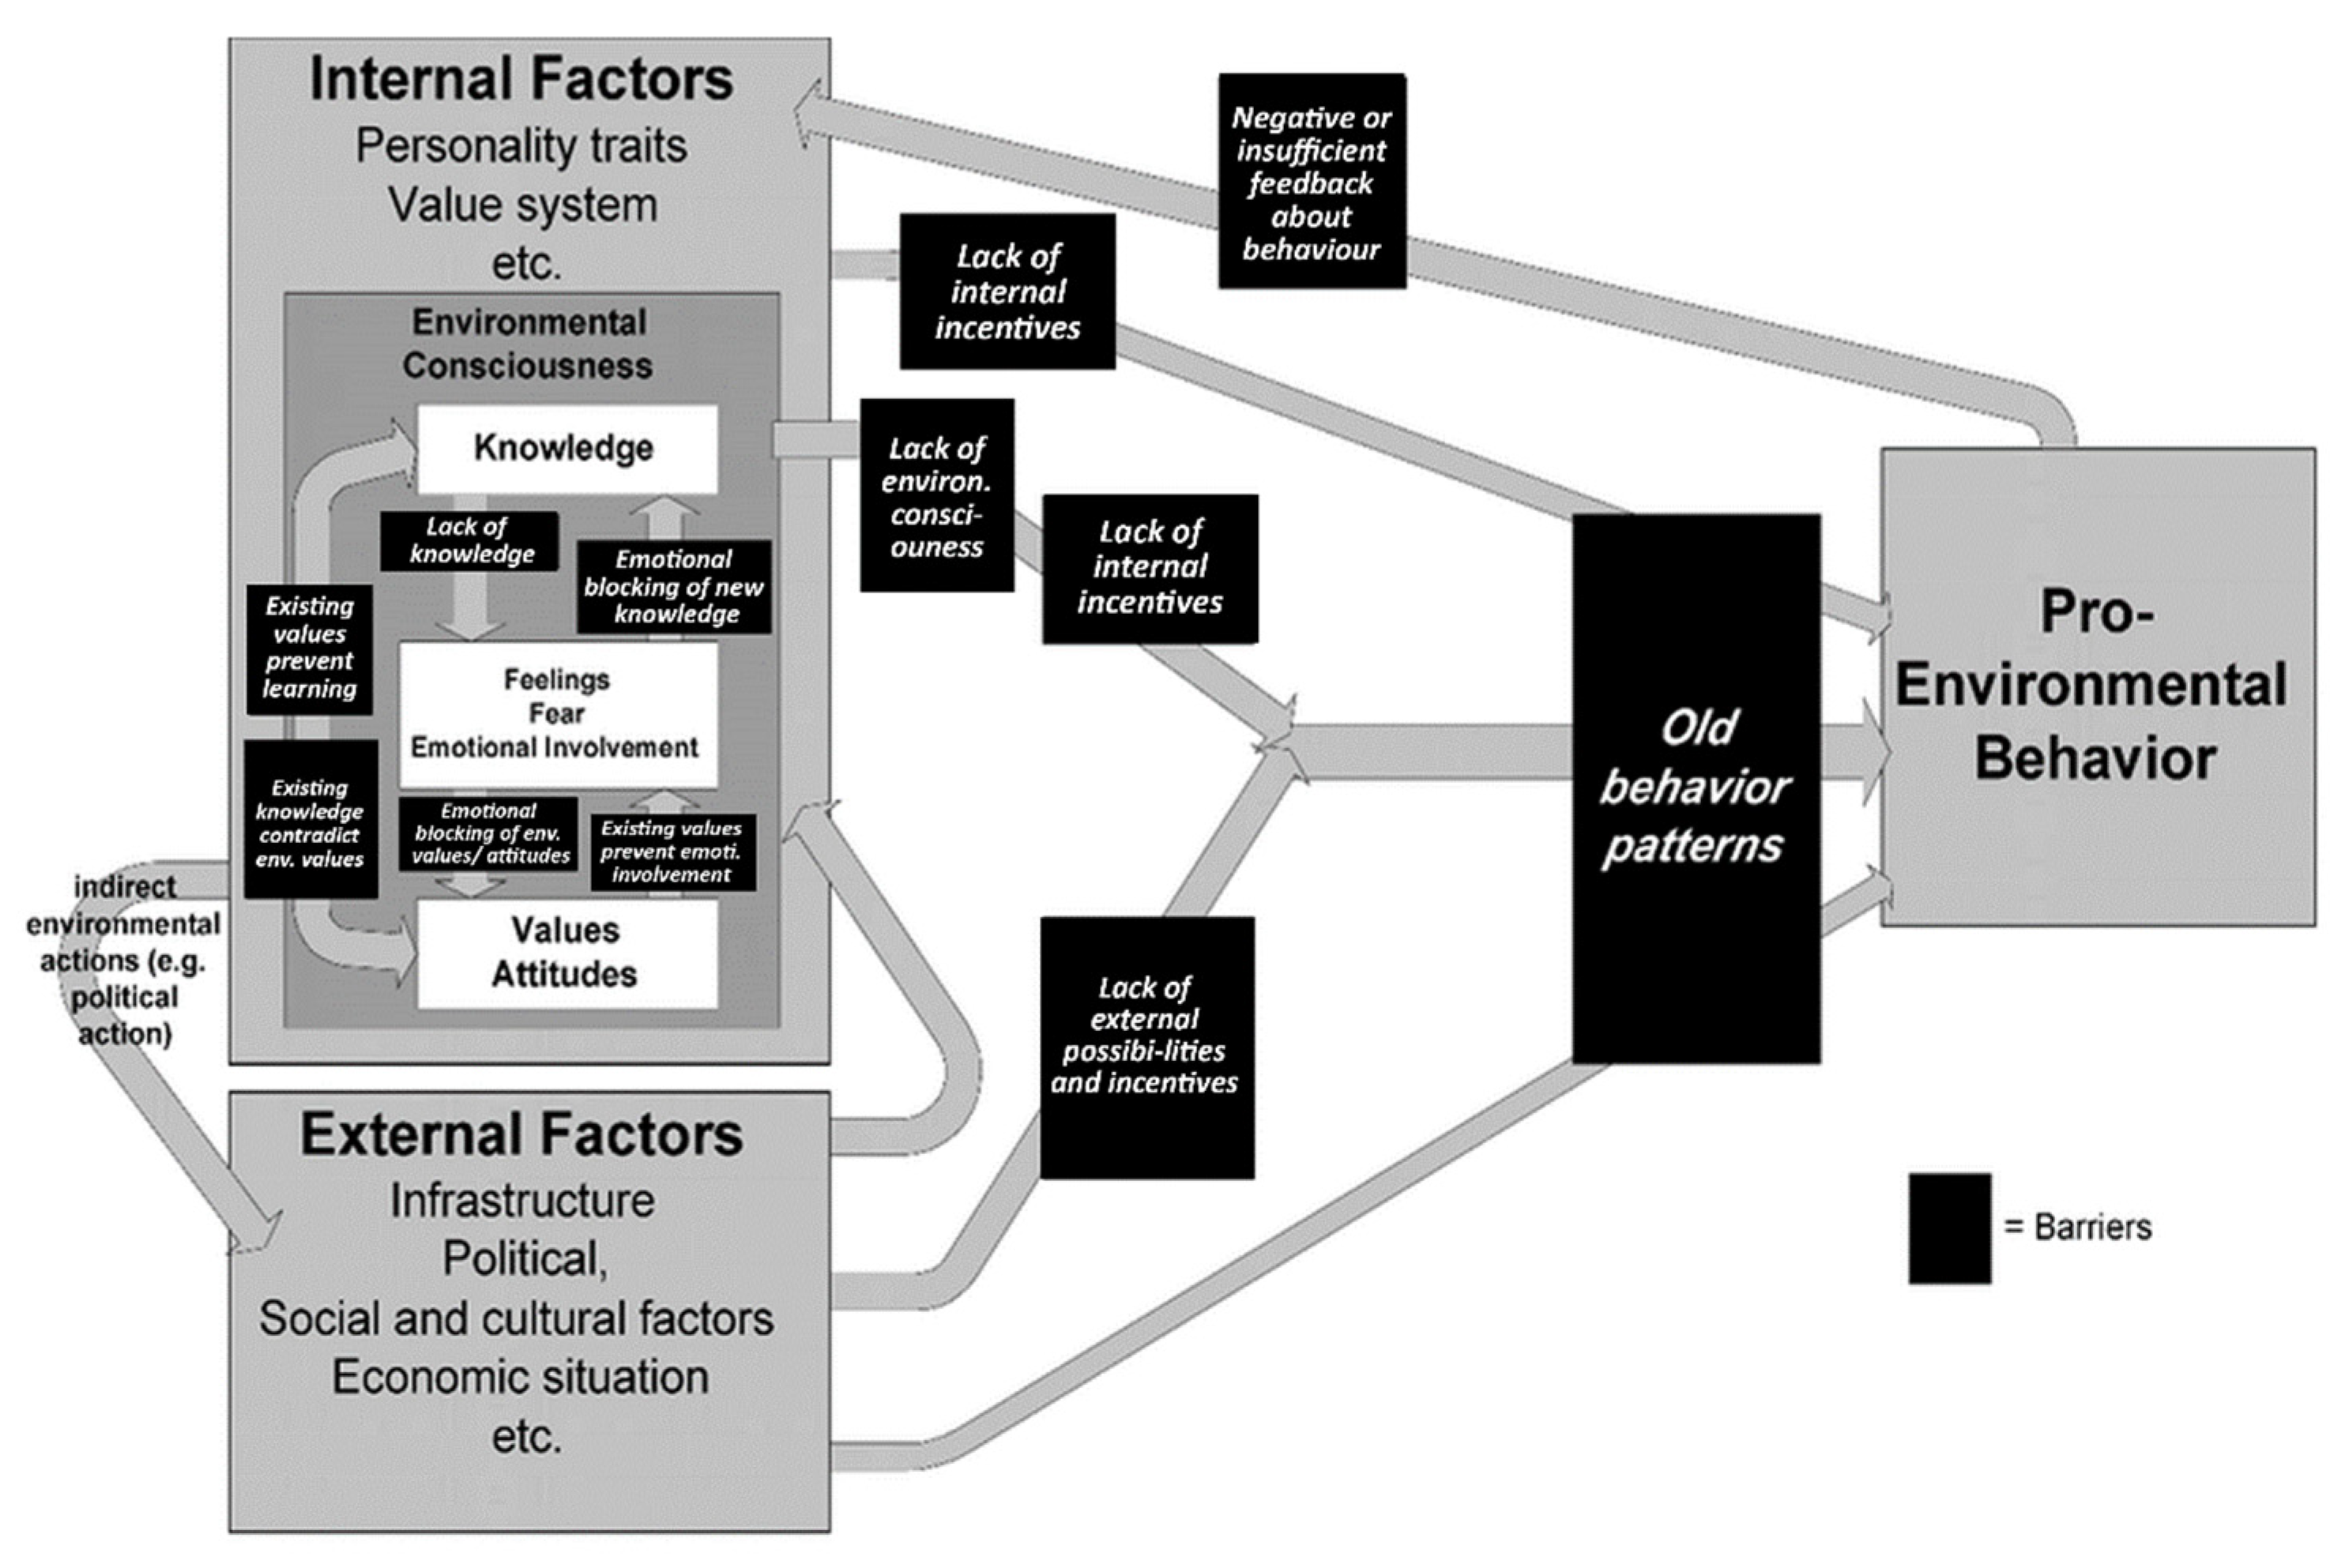
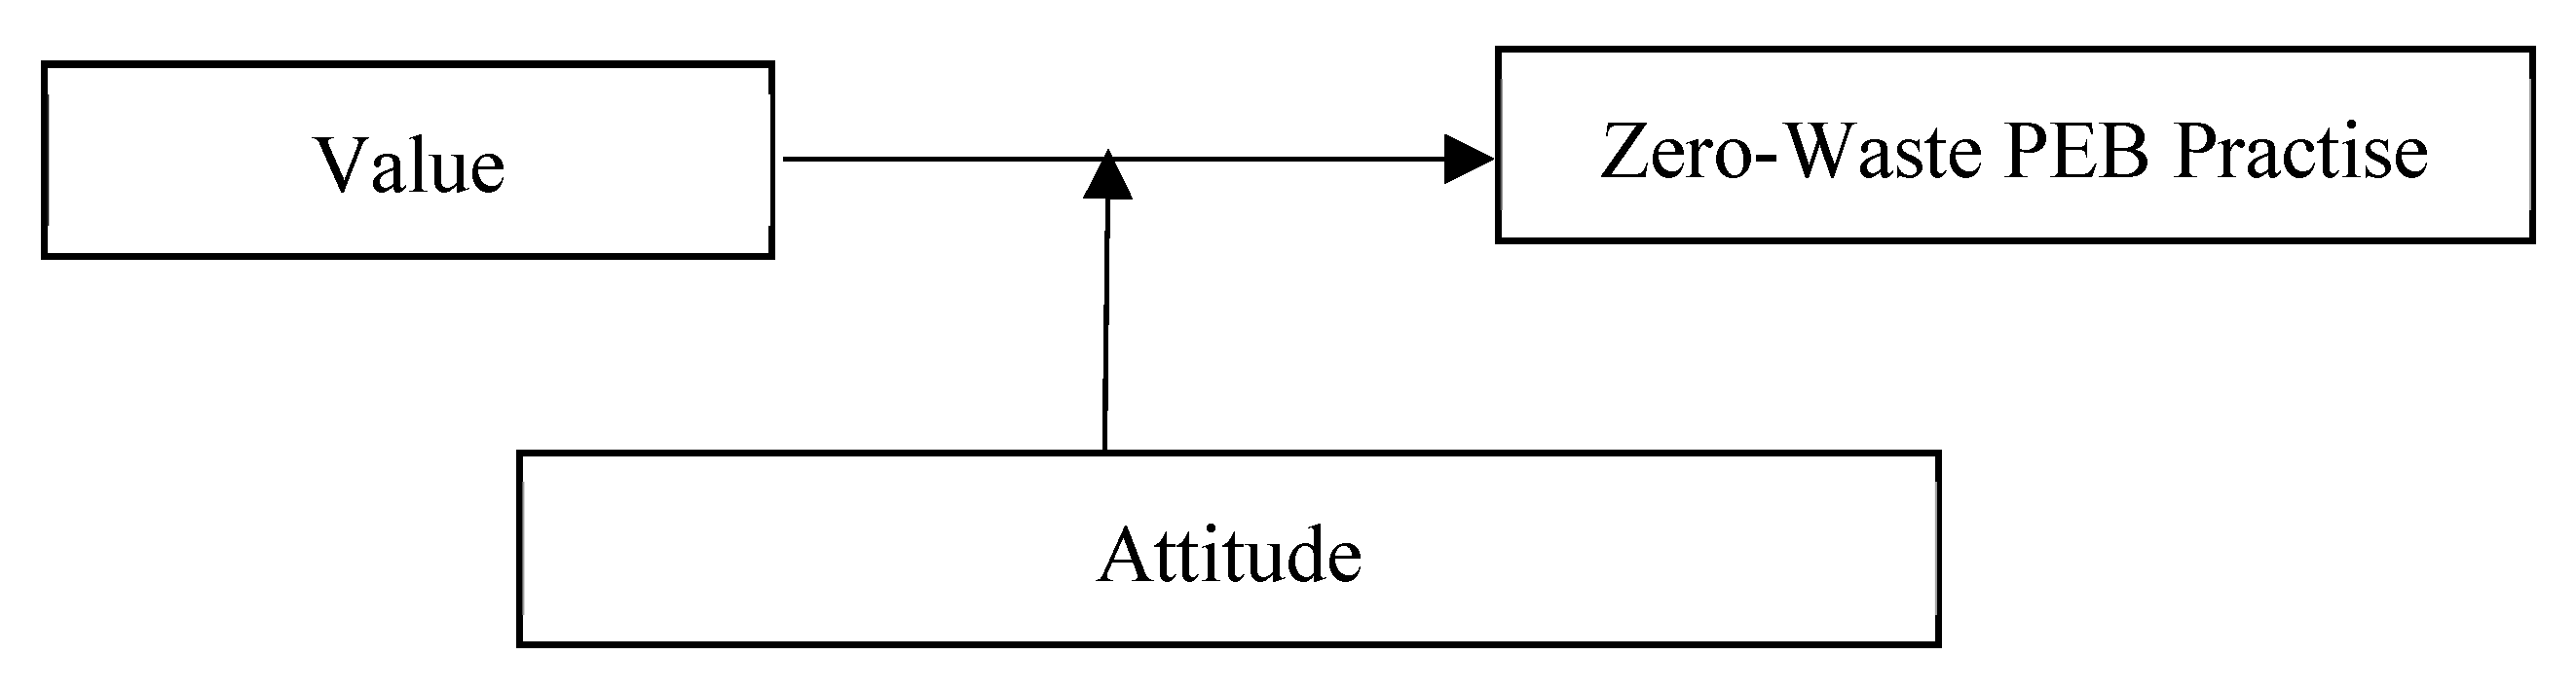
2.2. Kollmuss and Agyeman Model of Pro-Environmental Behaviour

Kollmuss and Agyeman [27] proposed a comprehensive PEB model in one of the most cited works among pro-environmental studies. This model integrates knowledge, values, and attitudes with emotional involvement to form the ‘pro-environmental consciousness complex. This complex is embedded in broader personal values and shaped by personality traits and other internal and external factors. Social and cultural factors are classified as external factors, even though they could be considered a separate category that overlaps with internal and external factors. The various factors inherent in it and the synergies between them would play greater or lesser roles during the development process or at different stages in people’s lives. According to them, the greater the length of education, the more extensive the knowledge of environmental issues. However, increased education does not always imply increased pro-environmental behaviour. The model is characterised by arrows representing the numerous components interacting with one another. The wider arrow shows that the most substantial positive influence on PEB is produced when internal and external factors act synergistically. The black boxes highlight potential barriers to positive influence on PEB. Only a few of the most significant barriers are listed in the model. The largest one in the diagram represents old behavioural patterns. This is due in part to the fact that the barrier must block all three arrows. It is also because they want to draw attention to this aspect, believing that old habits form a formidable barrier frequently overlooked in the literature on pro-environmental behaviour. This model highlights the importance of knowledge, values, and attitudes in fostering pro-environmental behaviours. Figure 1 shows Kollmuss and Agyeman’s PEB model [27].
Figure 2 depicts the proposed Zero-Waste Campus Framework. The green boxes represent the ten relevant factors identified during the qualitative phase in shaping a community’s sustainable pro-environmental behavior towards a zero-waste campus. The barriers in the Kollmuss and Agyeman Model of Pro-Environmental Behavior is replaced with specific positive influencing factors such as personal experiences on waste management, environmental education, social technology, social responsibility, environmental self-awareness, reinforcement contingencies, environmental policy, exemplary leadership, community engagement, and environmental goals. It expands the framework of the Kollmuss and Agyeman model to include additional factors that have been identified in this research as being important drivers of pro-environmental behavior. These factors highlight the importance of a multifaceted approach to promoting sustainable behavior. By focusing on these positive influencing factors instead of barriers, the proposed framework could take a more strengths-based approach to promoting sustainable zero-waste pro-environmental behavior. This approach would emphasize opportunities for action and positive change, rather than limitations and obstacles. In the previous paper, the development and flow of the framework were described in depth [19]. The framework is labelled as a proposed preliminary framework. This paper tests and verifies the relationship between factors and the five studied variables.

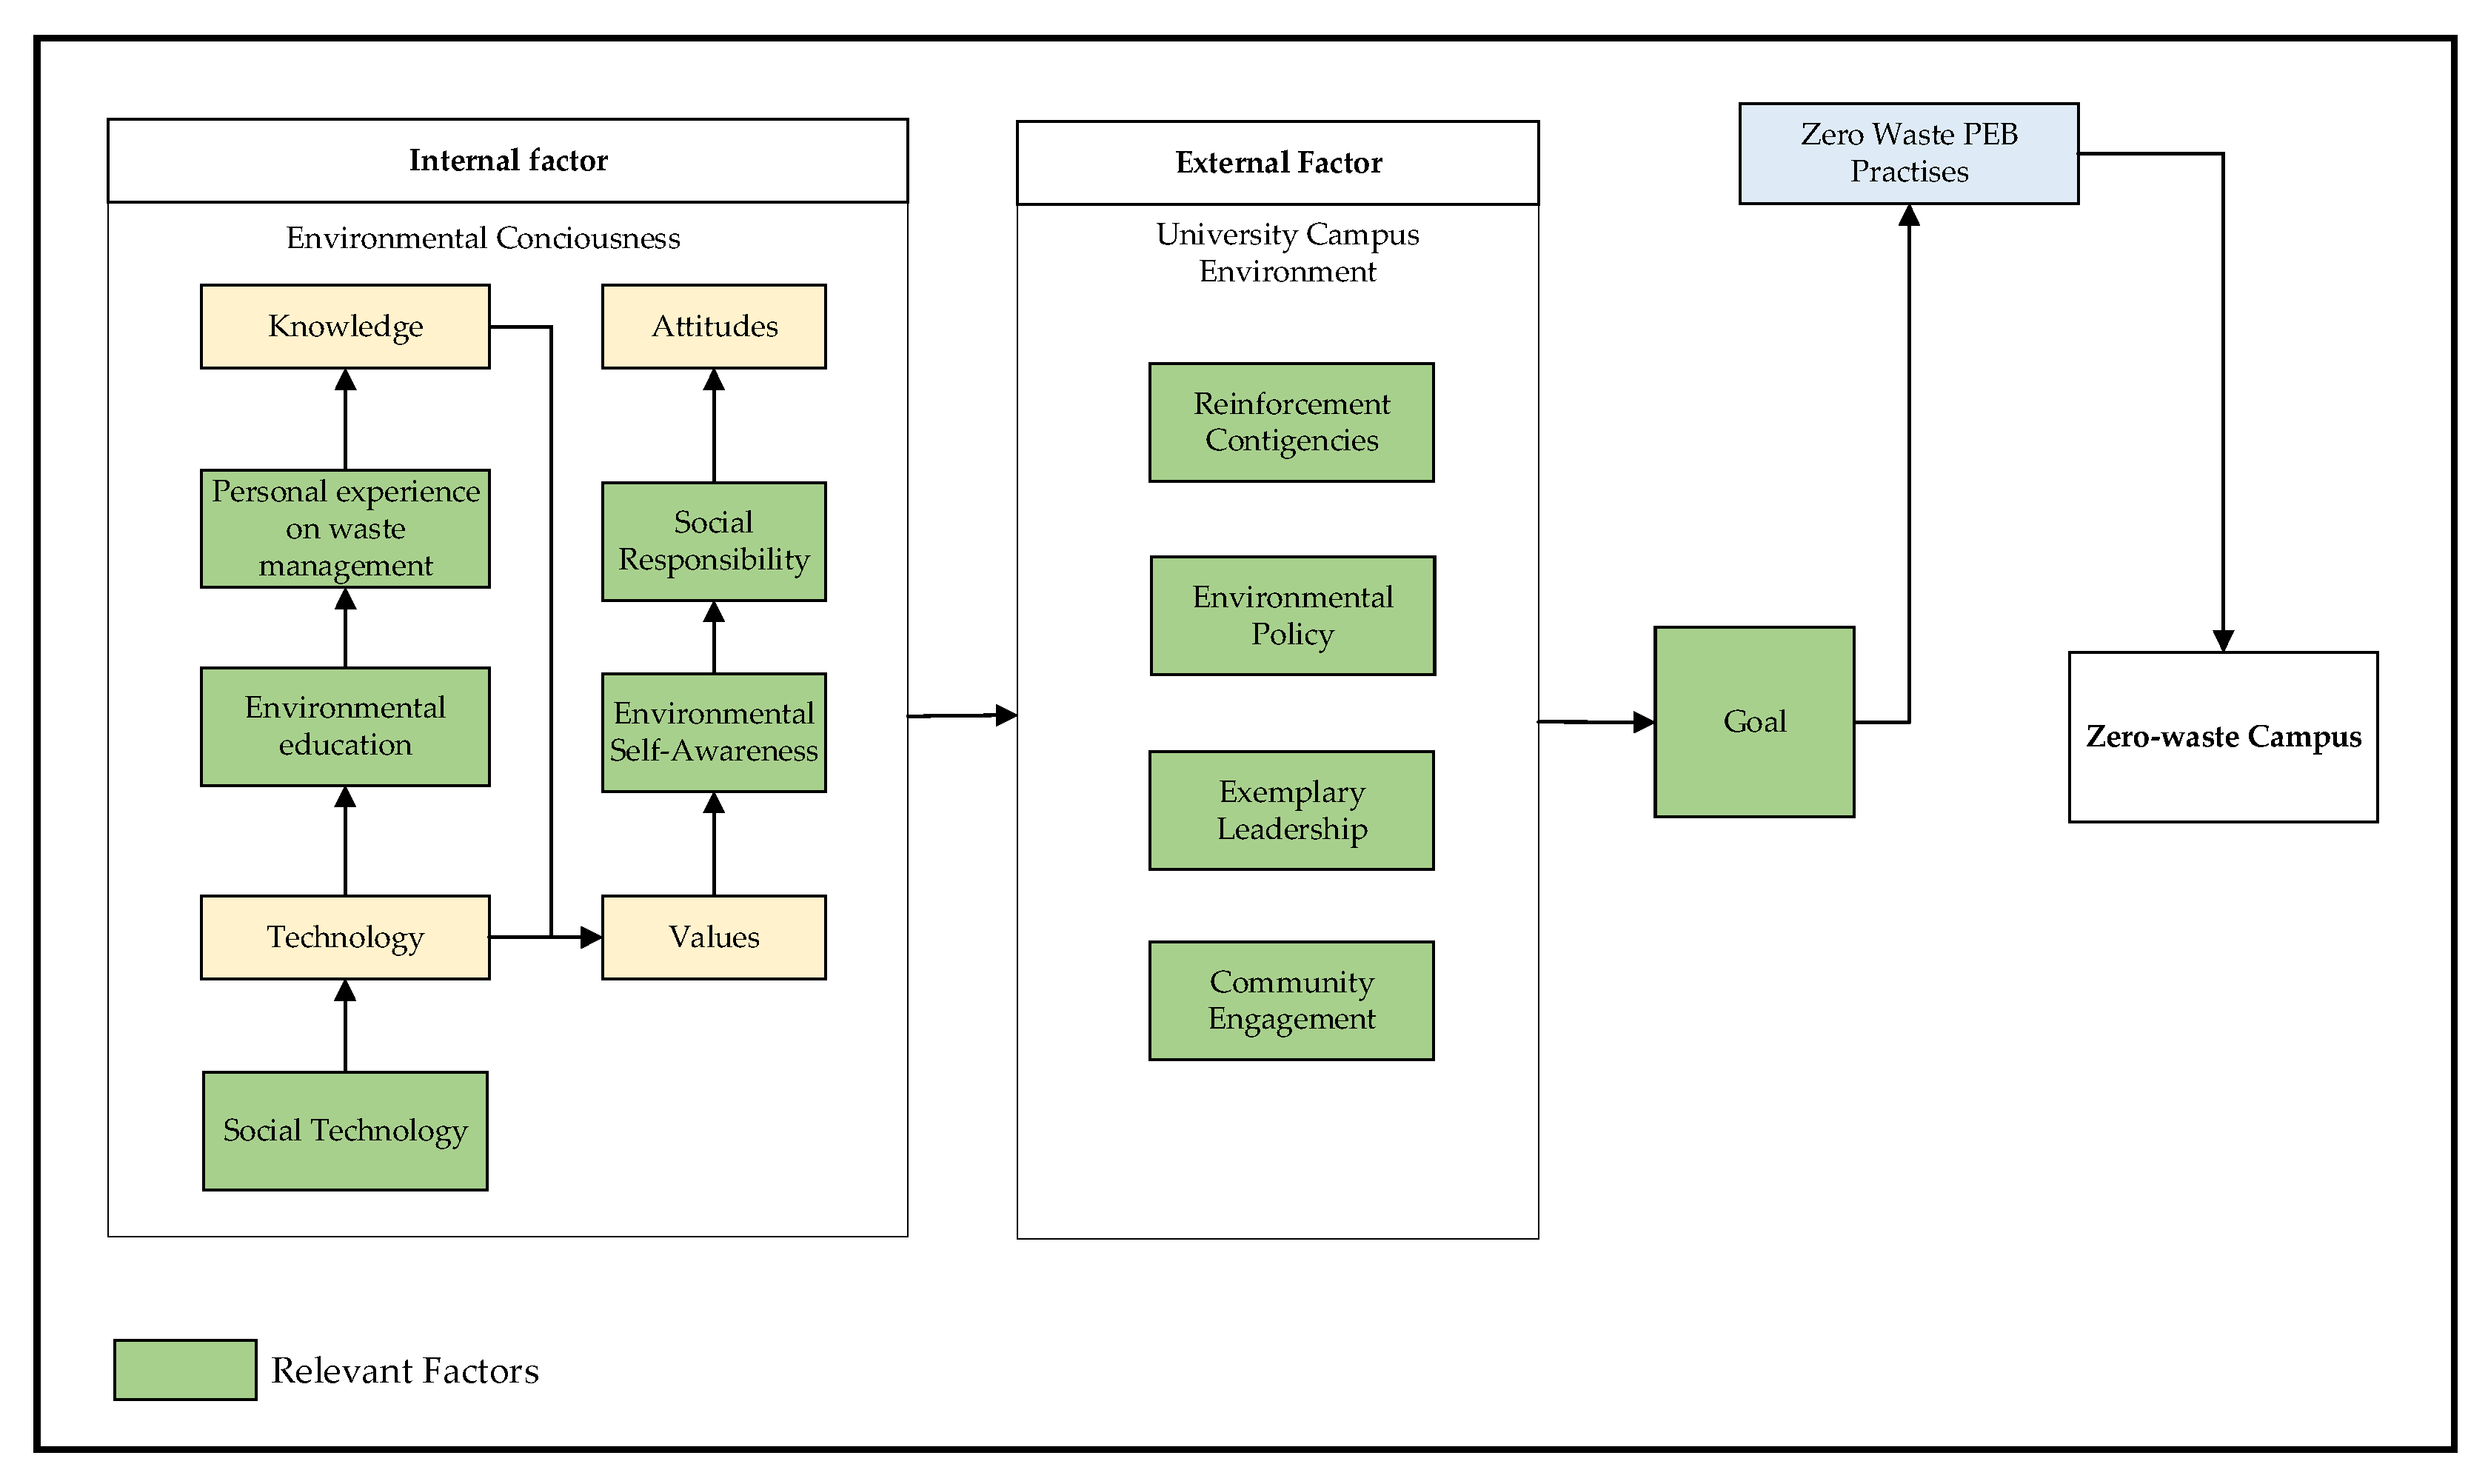
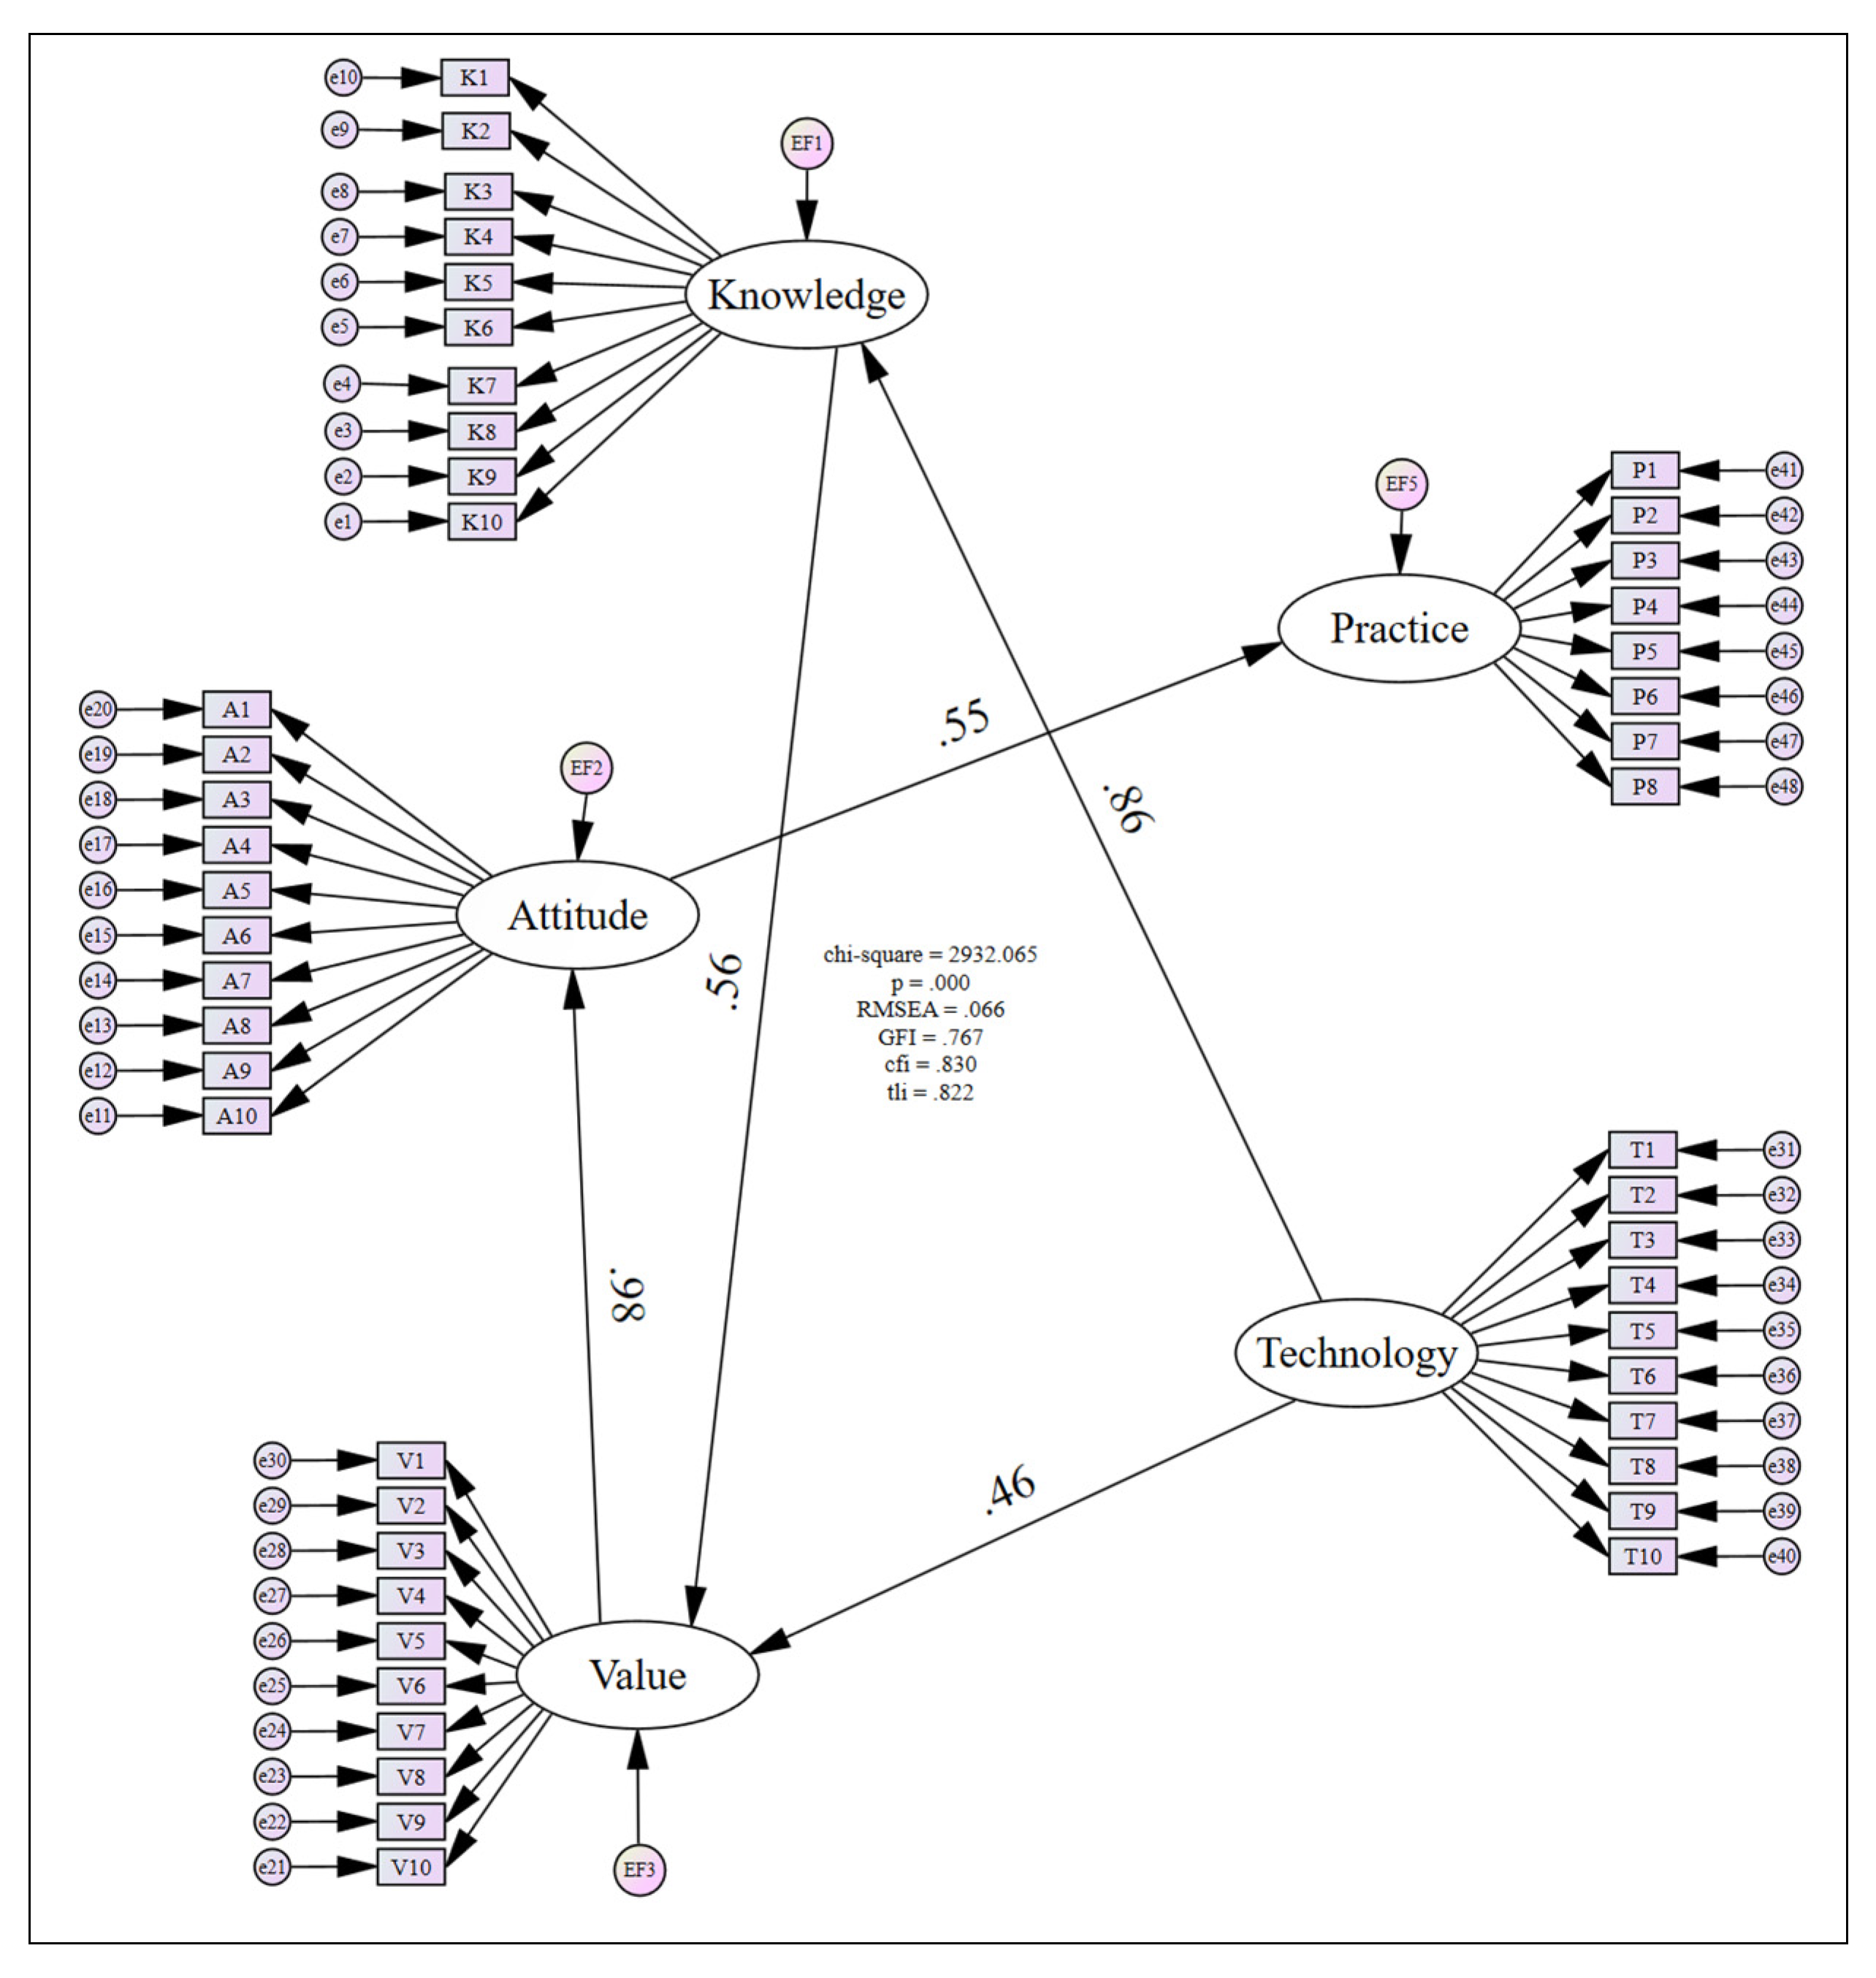
2.3. Zero-Waste Framework Development Utilising Confirmatory Factor Analysis

In the Zero-Waste Campus framework, relationships between studied variables are verified using Confirmatory Factor Analysis (CFA). The goodness of fit of the proposed framework was tested using CFA. CFA is the measuring component of SEM, which demonstrates the correlations between latent variables and their indicators. SEM is an effective method to analyse the correlation and causal relationship among latent constructs and observed variables, estimate the variance and covariance, test hypotheses, model conventional regression, and run the CFA [41]. CFA is a theory-driven alternative to traditional Exploratory Factor Analysis (EFA). The CFA allows items to be assigned to their respective factors and uses ‘fit statistics’ to evaluate whether the collected data are consistent with the hypothesised factor model. In this study, the variables knowledge, attitude, value, technology, and practise are considered latent constructs, which humans understand as concepts but cannot directly measure. Knowledge is commonly described as a true and justified belief. This definition has resulted in methods of measurement that rely solely on the correctness of answers. A correct or incorrect answer simply indicates that a person knows or does not know something [42]. However, it always comes down to measuring a score and converting that score into an estimate of knowledge, which may not be accurate if the answers to choose from, such as in multiple-choice questions, are provided. The university campus community’s knowledge, attitude, value, and practise, including the role of technology in SWM, cannot be measured directly, but their significance can be inferred by measuring observable variables. To determine the value of a latent variable, the observed variables are quantified, and a relationship between them and the latent variables is established. In CFA, model fit refers to how closely observed data match the relationships specified in a hypothesised model. The Kaiser–Meyer–Olkin (KMO) value for this study is 0.951, therefore the data is suitable for factor analysis. In SEM, several goodness-of-fit indexes reflect the model’s fit to the data. Currently, researchers cannot agree on which fitness indices should be reported. Cunningham et al. [43] and Hair [44] suggest using at least three fit indices, one from each model fit category. The three fitness classifications are absolute, incremental, and parsimonious, as shown in Table 1. The structural model of the study that met the three categories of model fit was adequate to represent the entire set of causal relationships.
In this study, the goodness of fit index will refer to RMSEA, GFI, CFI, and Chisq/df values as they are highly reported in the literature and recommended by Awang [41]. Table 2 shows the model fit value for the proposed framework. The values for the model fit index of cmin/df, p-value, CFI, GFI, AFI, SRMR, RMSEA, and RMR are significant. Both the RMSEA value and the Chisq/df have reached the level of acceptance mentioned by Awang [41] in his book. These accepted values are also cited in Browne and Cudeck [45]. Even though the values for GFI and AGFI do not exceed 0.9 (the threshold value), they still meet the requirement suggested by Doll et al. [46], where the value is acceptable if above 0.8.

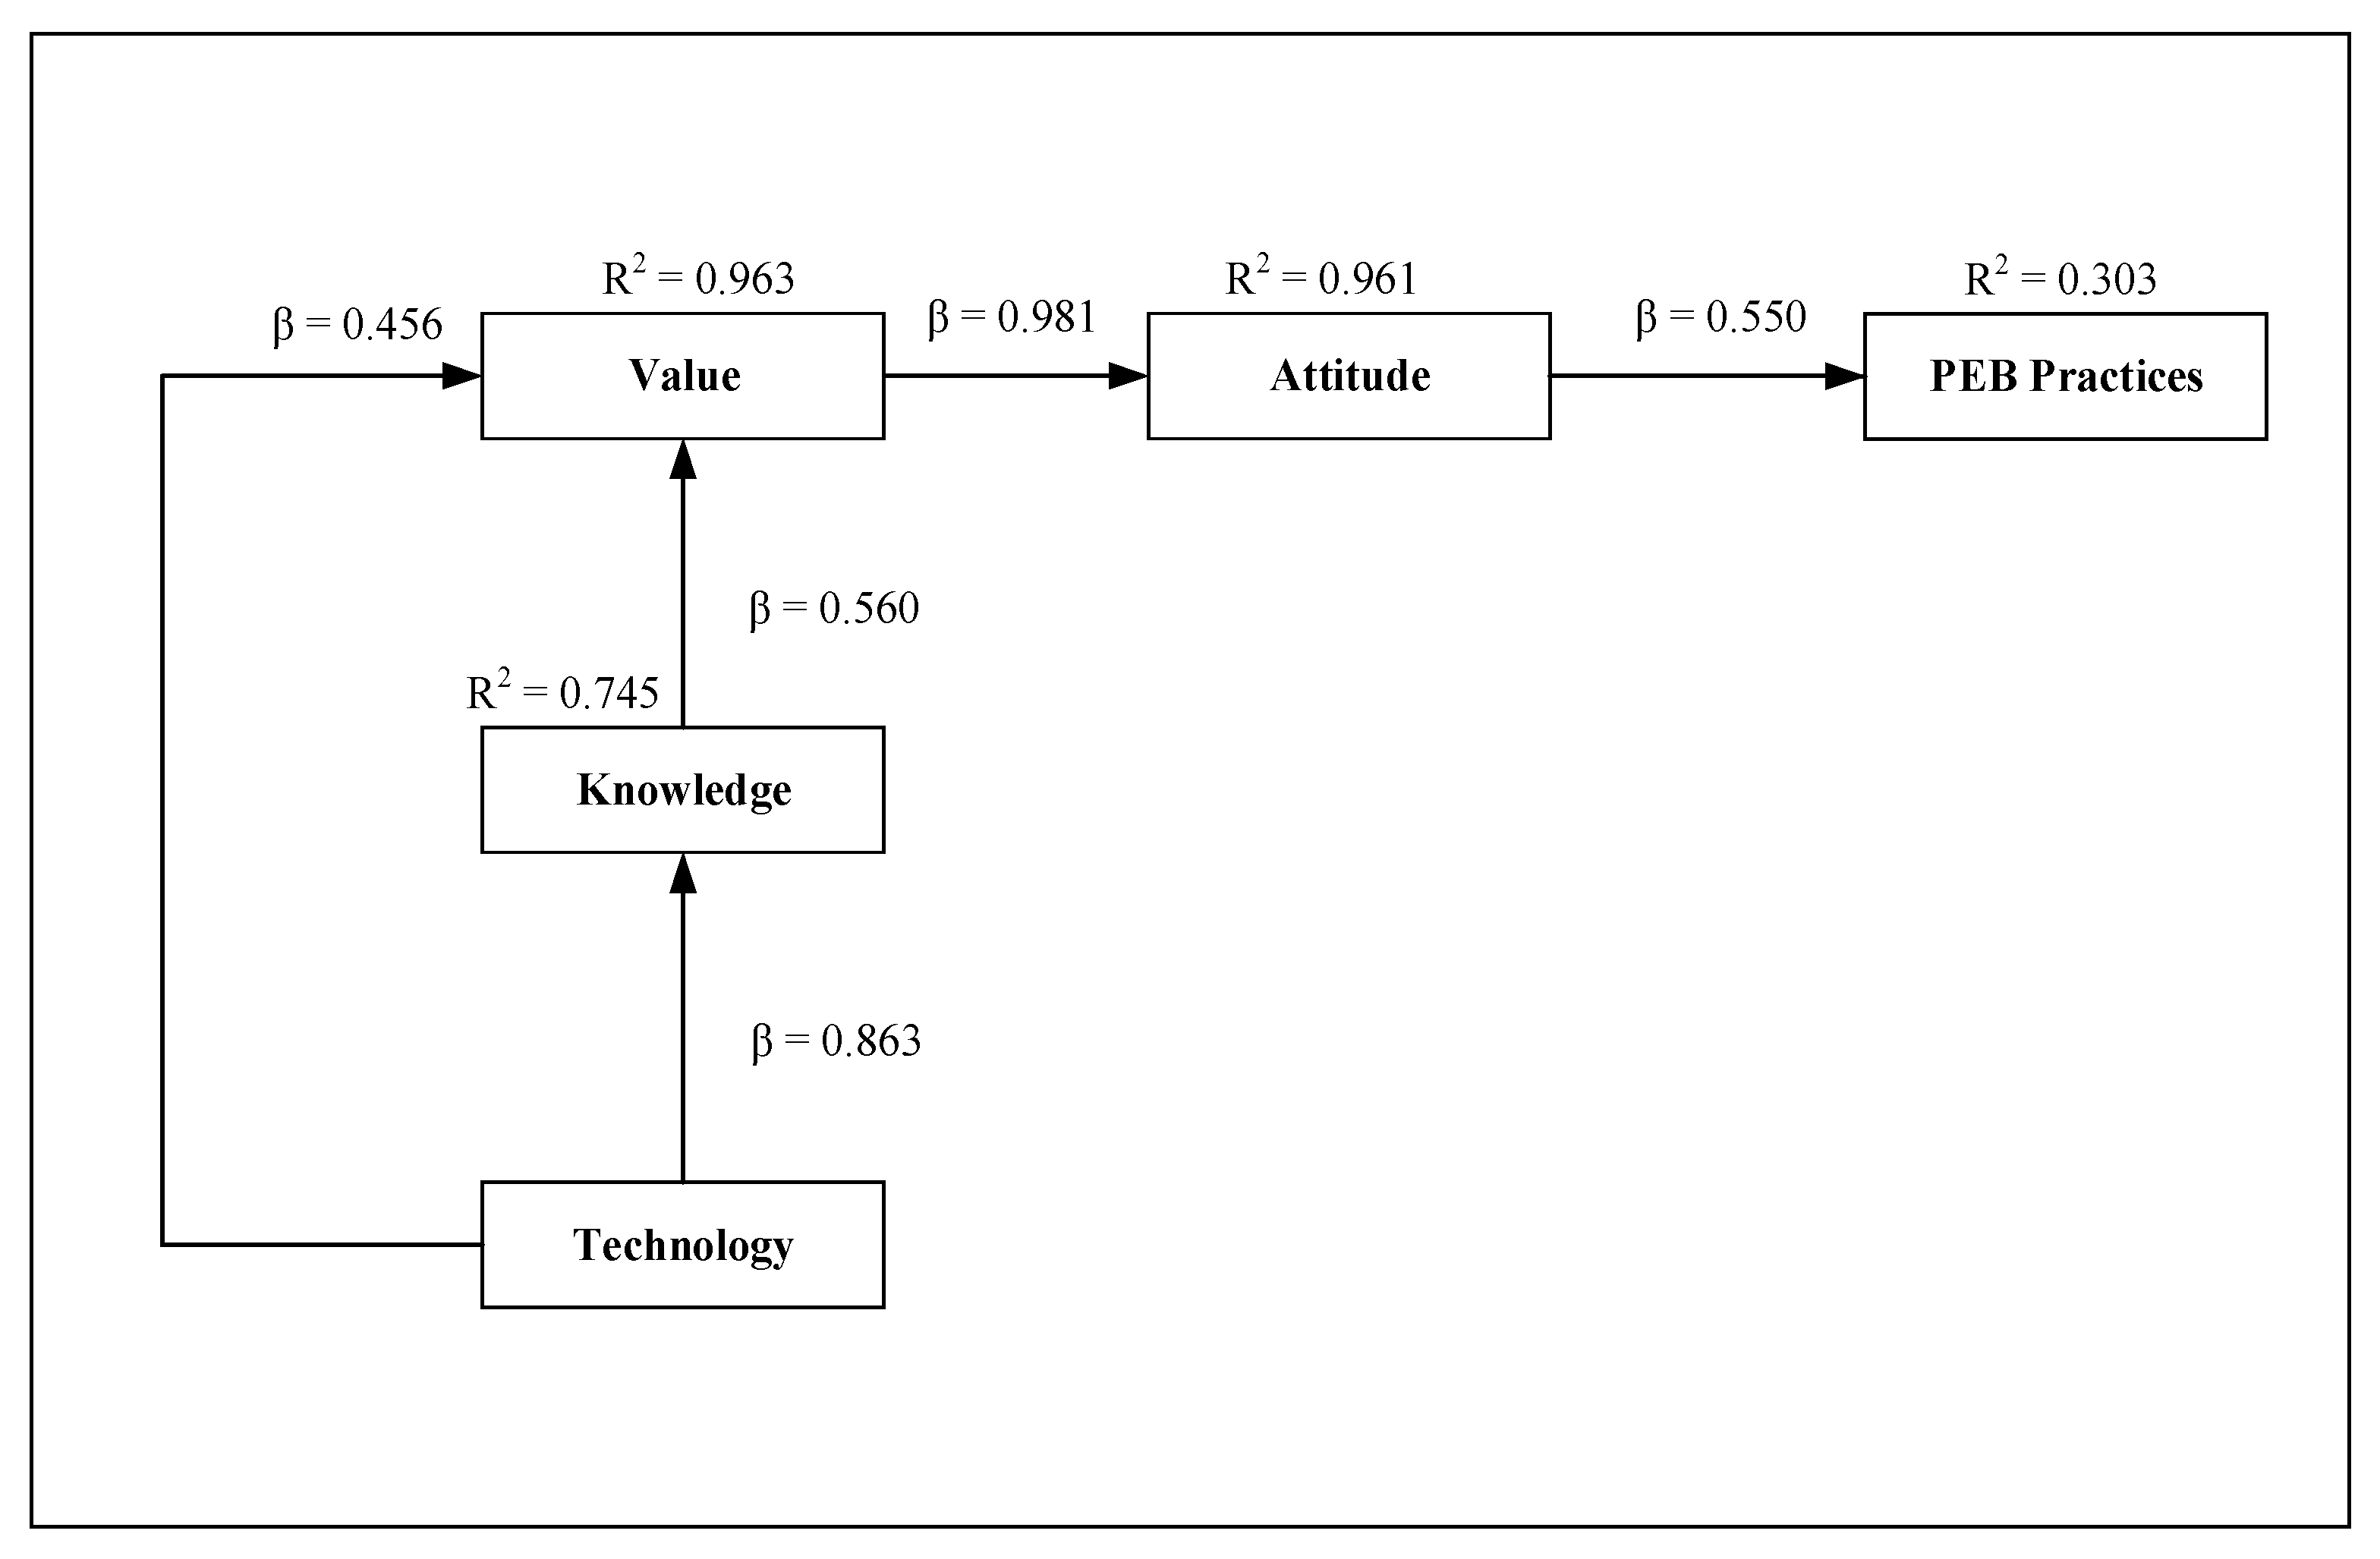
2.4. Hypothesis Testing

This part will test whether the proposed relationship is significant or not based on the data gathered, and the hypotheses will be tested using SEM. The standardised estimates and the regression weight results of the structural model were considered for testing the research hypotheses of this study for direct effects. A direct effect is the effect of one variable on another variable without any mediation. Figure 3 depicts the path diagram of the model of the proposed framework along with the direct effect strengths, Standardised Beta (β), when the model is executed with SPSS AMOS. Figure 4 depicts another representation of the relationships between variables by displaying the β and Squared Multiple Correlation (R2) values. Table 3 presents the detailed results of the execution.
The results shown in Table 3 supported all the hypotheses of the direct effect model. Technology as the independent variable is a positive and significant predictor for knowledge (β = 0.863, p < 0.01) and value (β = 0.456, p < 0.01). Technology, particularly social technology such as social media, has the ability to convey messages and appeal to people’s emotions, persuading them to adhere to codified principles. According to research, 52% of the world’s turtles have consumed debris such as plastic waste [47]. This information is most likely being disseminated among academics and researchers. Only a tiny percentage of the community is aware of the problem. However, when the videos of sea turtles affected by plastic pollution circulated and were frequently shared on social media, they captured the attention of many people who later felt affected and wanted to do something to help improve the situation. In the context of SWM on campus, technology will enable the community to access environmental information, particularly on zero-waste, at the tip of their fingers. They will gain an understanding of the subject matter as a result of the easy and quick access to information. They can also distinguish between valid and invalid information shared on social media platforms, where social interaction helps balance the information technology provides. Dynamic discussion among community members will enable them to form opinions about the correct facts. Heartwarming videos, interactive information, and other media depicting environmental issues and information will attract the community members’ eyes and emotions more than words or texts alone can and will later instill values in the campus community members. Knowledge is a positive and significant predictor of value (β = 0.560, p < 0.01). Knowledge gained through education will bring out latent human values from within, transforming the individual into a good person with character [48]. A well-informed community will have reliable information, which will later become knowledge, influencing how they feel about the environment and building their inner belief in the matter. The result also shows that = value is a positive and significant predictor of attitude (β = 0.981, p < 0.01). Values and attitudes are two terms that are frequently used interchangeably but are distinct in their own right. University campus communities with strong values will influence their actions and behaviours towards the environment. For example, in the cafeterias around university campuses, single-use plastic is used for food packaging. Knowledge of the environmental effects of single-use plastic will raise awareness and instill a sense of value among the campus community. This was demonstrated by the hugely successful ‘White Coffin’ (Styrofoam food containers) and ‘Say No to Plastic’ campaigns at USM in 2008, which spread to other universities and spawned a follow-up activity known as ‘Tapau-mania’. This programme encourages students to bring reusable containers to campus to pack food from cafeterias. Since January 2011, it has also influenced the Penang state government to implement a ‘No Plastic Bag’ policy [49]. The values instilled in the community influenced their attitudes and encouraged them to participate and act. This is supported by the study’s findings, which discovered that attitude is a positive and significant predictor of zero-waste PEB practises (β = 0.550, p < 0.01), which will encourage sustainable zero-waste practises among the community members. Knowledge, values, attitudes, practises, and the role of technology in promoting zero-waste are all significantly associated.
Next, the effect of moderating effects is analysed. A moderating variable moderates the strength of causal effects from an independent variable on its dependent variable [41]. With moderating variables, the effects of independent variables and dependent variables could no longer be significant, or they could be more significant after interaction. Figure 5 and Figure 6 show the position of the moderating variable in the relationship between variables in the proposed frameworks.
In this study, Multi-group Confirmatory Factor Analysis (Multi-Group CFA) is used to assess the effect of the moderator variable on latent constructs using the steps suggested by Awang [41] for both knowledge and attitudes. According to him, if the Chi-Square value between the constrained and unconstrained models differs by more than 3.84, then the moderator variable has a significant moderating effect on the relationship between the constructs in the selected path. The data is first divided into two groups, high and low, for each moderator variable to be assessed. The procedure for testing moderation for the same variable using two different data sets is to demonstrate whether the different levels of the tested variables moderate the causal effects. To avoid confusion, the following steps will refer to the first moderating variable, knowledge. As the knowledge contains multiple items, they must be merged into one as a new variable, namely, combined-knowledge. Then, the median is identified to determine the frequency at which to divide the data into two separate data sets. The median for the new variable is cut off by two percentiles of 50. The same steps are repeated for moderating variable attitudes. Table 4 showed the output of the new frequencies and medians for the combined-knowledge and combined-attitude variables.
Table 5 displays the frequencies of the items in the dataset that represent low and high levels of the moderating variables, namely, low knowledge, high knowledge, low attitude, and high attitude.
Two separate AMOS models are developed, i.e., constrained and unconstrained models. In the first model, a constraint is put on the relationship parameter between constructs of interest to be equal to 1. In the second model, the relationship parameter is allowed to be freely estimated.
Table 6 shows the measures of a model fit carried out for the constrained and unconstrained models for low and high moderating variables of knowledge and attitude data.
The moderation effect is significant since the difference in Chi-Square values between the constrained and unconstrained models for low and high knowledge and attitude data is more than 3.84 with 1 degree of freedom. The test for the hypotheses for moderation, found that the moderator variables (i.e., knowledge and attitude) do moderate the causal effects of value and practise, respectively. The result of hypothesis testing is consistent for both datasets.

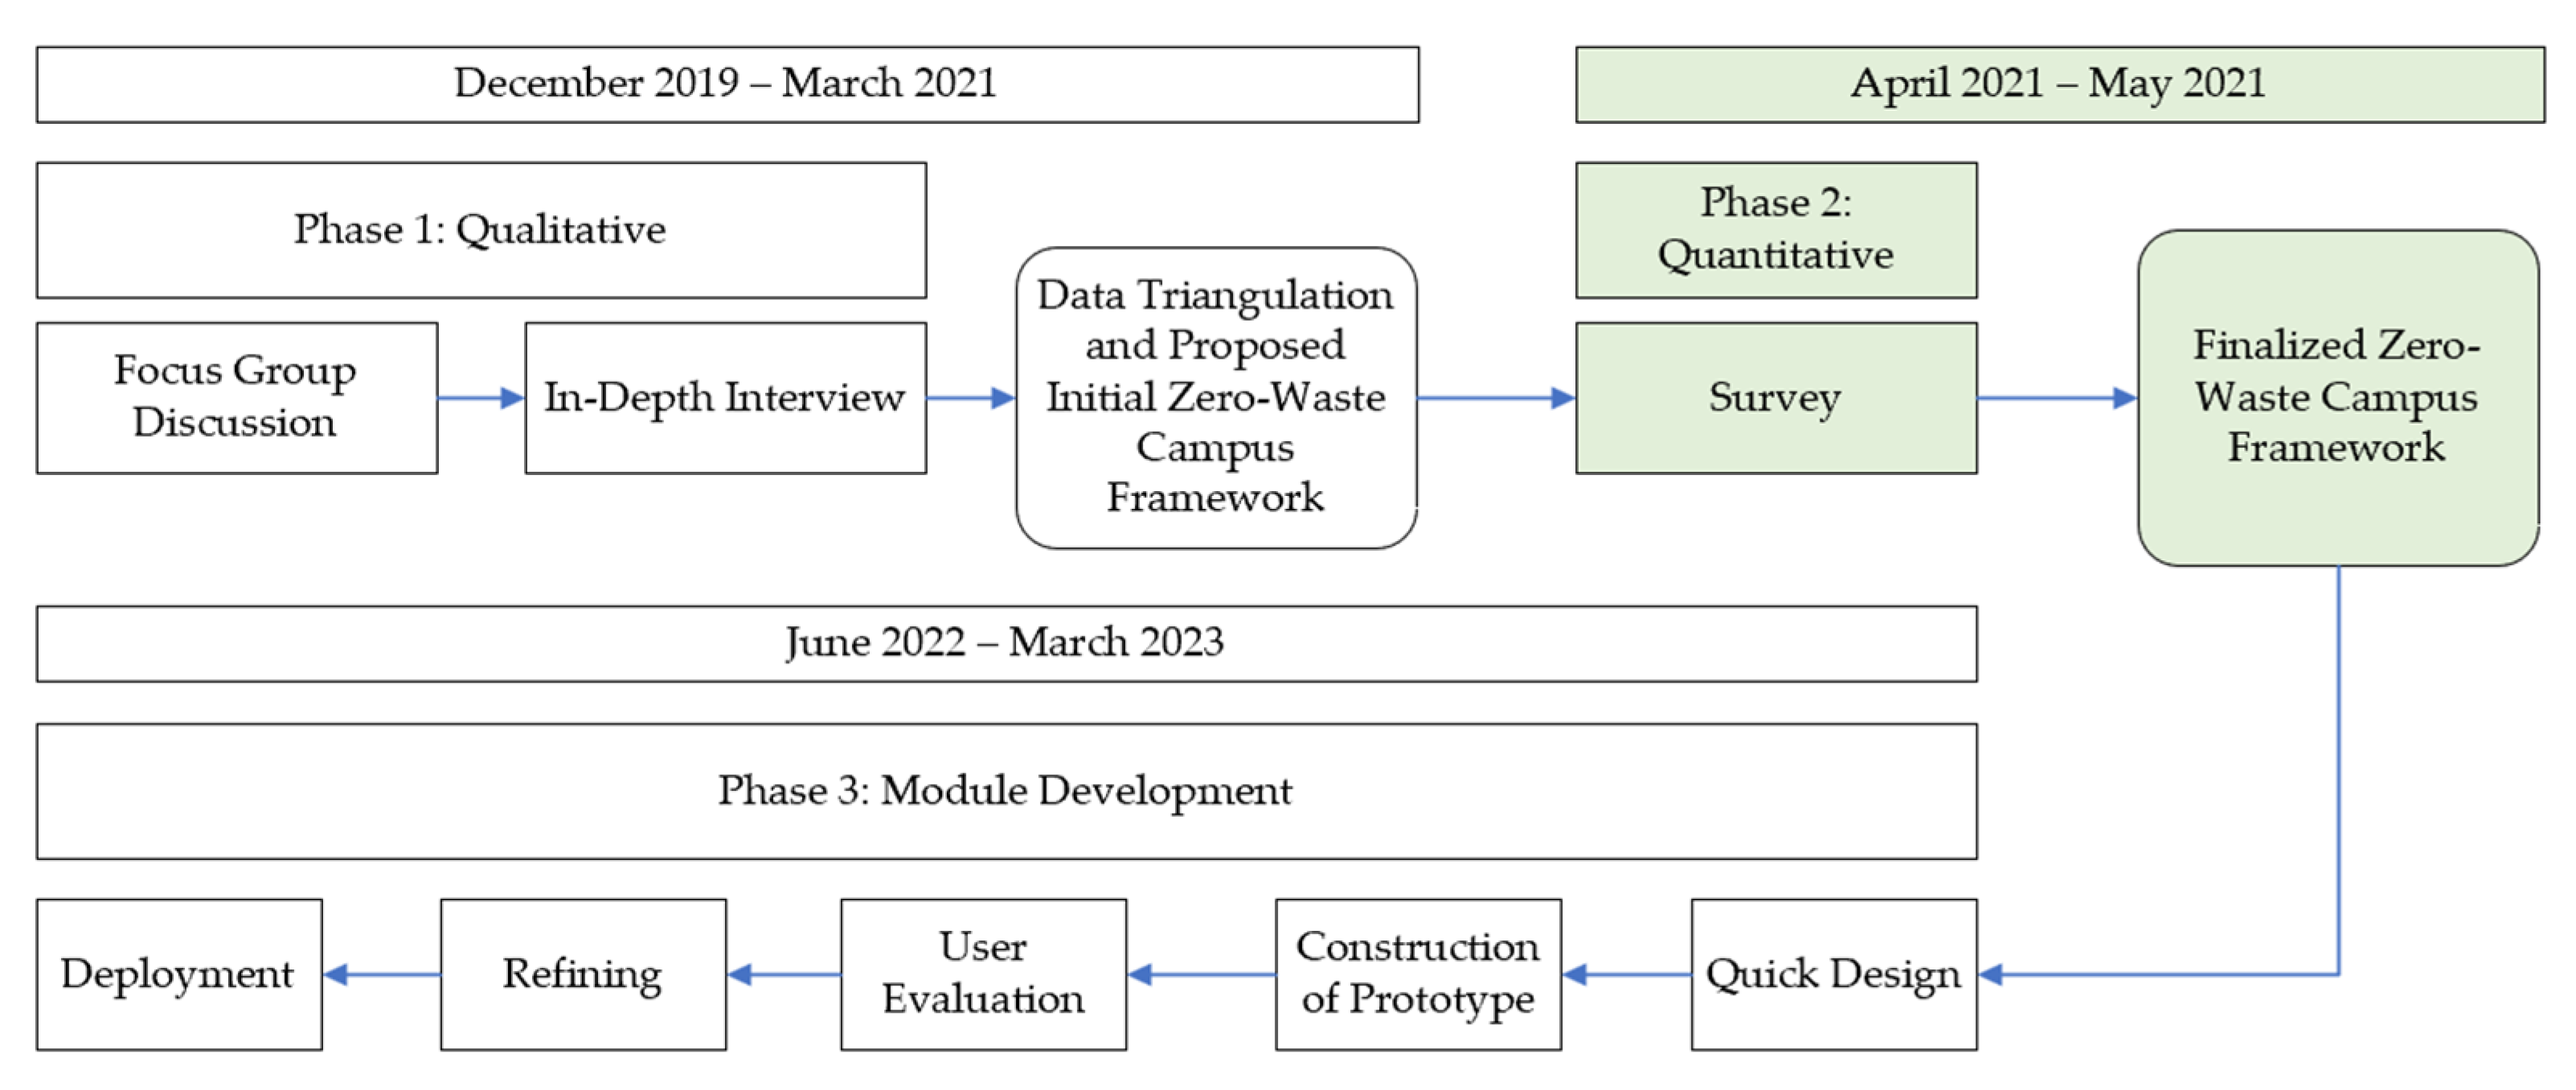
3. Materials and Methods

This study used an exploratory mixed-method design [50]. An initial qualitative phase included focus group discussions and in-depth interviews to investigate the main and relevant factors that influence the pro-environmental behaviour of the university campus community. The findings from the qualitative phases are then triangulated to develop the survey instrument. The finding is also being used to propose an initial zero-waste campus framework. This was followed by a quantitative phase, which will be discussed in this paper, which explored the university campus perspective from a broader perspective using a larger sample. The survey results are used to finalise the proposed framework to help promote environmental sustainability through pro-environmental behaviour on a zero-waste campus. The findings from both phases are then used to develop a prototype for a Zero-Waste Campus digital module. The flow of the study is illustrated in Figure 7.
The survey data is analysed using IBM-SPSS version 26 and IBM-SPSS-AMOS version 26. Statistical techniques are used to analyse the data, especially descriptive statistics. Descriptive statistics summarise and organise data set characteristics such as sample size, centeredness, and dispersion. IBMP-SPSS is also used in developing the Zero-Waste Campus Framework to determine the frequency and median for the moderating variables assessment. The inferential statistical method using Structural Equation Modeling (SEM) is then used to determine if the collected data represents broader population conclusions. SEM is a versatile multivariate statistical technique [21]. The reliability and validity of the collected data are analysed based on SEM and CFA. The CFA was conducted to verify the proposed framework’s measurement model for the Zero-Waste Campus Framework. Data was collected using a web platform called SurveyMonkey by Momentive Inc. The survey questionnaire was distributed using various web-based communication channels, including emails, social media, and mobile messaging services. The online questionnaires were open from 1st October 2021 to 7th November 2021. This study investigated the relationship between the campus community’s knowledge, attitudes, and values in describing zero-waste PEB practises. The role of technology is also tested to determine where it belongs in the relationship. The survey questions, as presented in Table A1 (see Appendix A), were developed based on the researcher’s earlier focus group discussions and in-depth interviews, as well as the adoption and adaptation of previous studies with reference to Kollmuss and Agyeman’s 2002 Model of Pro-Environmental Behaviour and a modified Knowledge-Attitude-Practises Model. The following section will go over the questionnaire development and validation process in greater detail to demonstrate that expert panels have validated the instruments and that they are fit for purpose. Then followed the descriptive analysis of the survey data and the proposed hypotheses.

3.1. Zero-Waste Campus Questionnaire Development

The questionnaire items were validated based on the content validation procedure proposed by Yusoff [51]. According to him, content validity is the degree to which a measurement instrument accurately represents the measured construct. It is regarded as critical evidence when determining the validity of a measurement tool, such as a questionnaire, for research purposes. The Zero-Waste Campus questionnaire went through all six proposed content validation steps. Steps three and four were completed concurrently and sequentially. While steps five and six are discussed together.

3.1.1. Preparing the Content Validation Form

The validation form is prepared to ensure that the expert review panels have clear expectations and comprehension of the assignment. The rating scale of 1 (the item is not relevant to the measured domain), 2 (the item is somewhat relevant to the measured domain), 3 (the item is quite relevant to the measured domain), and 4 (the item is highly relevant to the measured domain) has been used for scoring individual items. The definitions of knowledge, attitudes, practises, values, and technology domains related to the study are provided to aid the expert panels’ scoring process.

3.1.2. Selecting a Review Panel of Experts

The expert review panel is made up of both internal and external specialists. The internal expert group consists of three senior lecturers working on the same project. In terms of the external group of experts, three individuals were chosen based on their unique expertise to review and critique the evaluation instrument. Table 7 displays the descriptive criteria of the selected external group of expert panels.

3.1.3. Conducting Content Validation and Reviewing Domain/Items

The content validation for zero-waste campus questionnaires was performed through a combination of face-to-face and non-face-to-face methods with internal and external experts. Many consistent online meetings have been carried out between the researcher and the internal group of experts to review the questionnaire’s domain and items. Once the internal panels review the instruments, an online meeting is held with an external expert one using the Webex platform to review the instruments in depth. The internal expert panels and the researcher then studied and reviewed the external expert one’s written and verbal comments. Improvements were made to the related domain and item. The modified instrument, validation form, and detailed instructions were then emailed to another two external experts. External experts two and three provided written feedback to increase the relevance of the targeted domain before providing a score on each item. All comments are considered to improve the domain and its items. Both methods were conducted online from 1st June to 17th September 2021. All the external experts received tokens of appreciation for their essential feedback and time spent reviewing the instruments.

3.1.4. Providing a Score on Each Item and Calculating the Content Validation Index (CVI)

After reviewing the domain and items, the experts independently score each item and resend the form to the researcher via email once they have scored them. Item Content Validity Index (I-CVI), Scale Validation Index (S-CVI), and Universal Agreement (UA) values are calculated based on the scores given by experts two and three. The average of I-CI scores across all items based on the I-CVI value is equal to 0.92. While the average proportional relevance score across all experts based on proportional relevance is equal to 0.92. The average UA score across all items is equal to 0.83. Based on the preceding calculation, it is concluded that I-CVI, S-CVI/Ave, and S-CVI/UA satisfy satisfactory levels based on acceptable CVI values proposed by Davis [52] for two experts. Thus, the scale of the questionnaire has achieved a satisfactory level of content validity.

3.2. Descriptive Analysis

The study was conducted among the target respondents, who are members of the university campus community affiliated with UKM, UPM, or USM and older than 18. Respondent sampling based on convenience and purposeful sampling were used to gather 393 valid respondents based on the population of the three universities in 2020. The number of responses exceeded the target of 383 to represent the size of the population with a 5% margin of error and a 95% confidence level. The respondents were divided into two main groups: the staff and the students. The staff groupings included lecturers, administrative personnel, and service/technical personnel. While undergraduate and postgraduate students contribute to the student group. The respondents’ demographic profiles are shown in Table 8.
The collected data are then assessed to check for outliers and measure the central tendency. Verifying the normality of the data is critical to meeting the requirements for using parametric statistical tests. The standard deviation, skewness, and kurtosis of every item in the survey instrument are identified. The minimum and maximum statistics for each item range from 1 to 5. The mean for negatively stated item P7 is 3.08, whereas the others ranged from 3.45 to 4.50. The standard deviation index (SDI) for all items in this study ranges from 0.691 to 1.388. The SDI value for all items except P7 is below 1.25. Therefore, the items are acceptable. The SDI value for P7 items falls between 1.25 and 1.49. It is still acceptable for marginal performance. The skewness ranges from −2.234 to 0.009, and the kurtosis ranges from −1.320 to 6.532. Hair et al. [44] stated that the data are normal if the kurtosis ranges from 7 to +7. Brown [53] also said that when using SEM, acceptable skewness values are between 3 and +3, while acceptable kurtosis values are between 10 and +10. Therefore, the data in this study are normally distributed and meet the requirements for employing parametric statistical tests, including SEM.

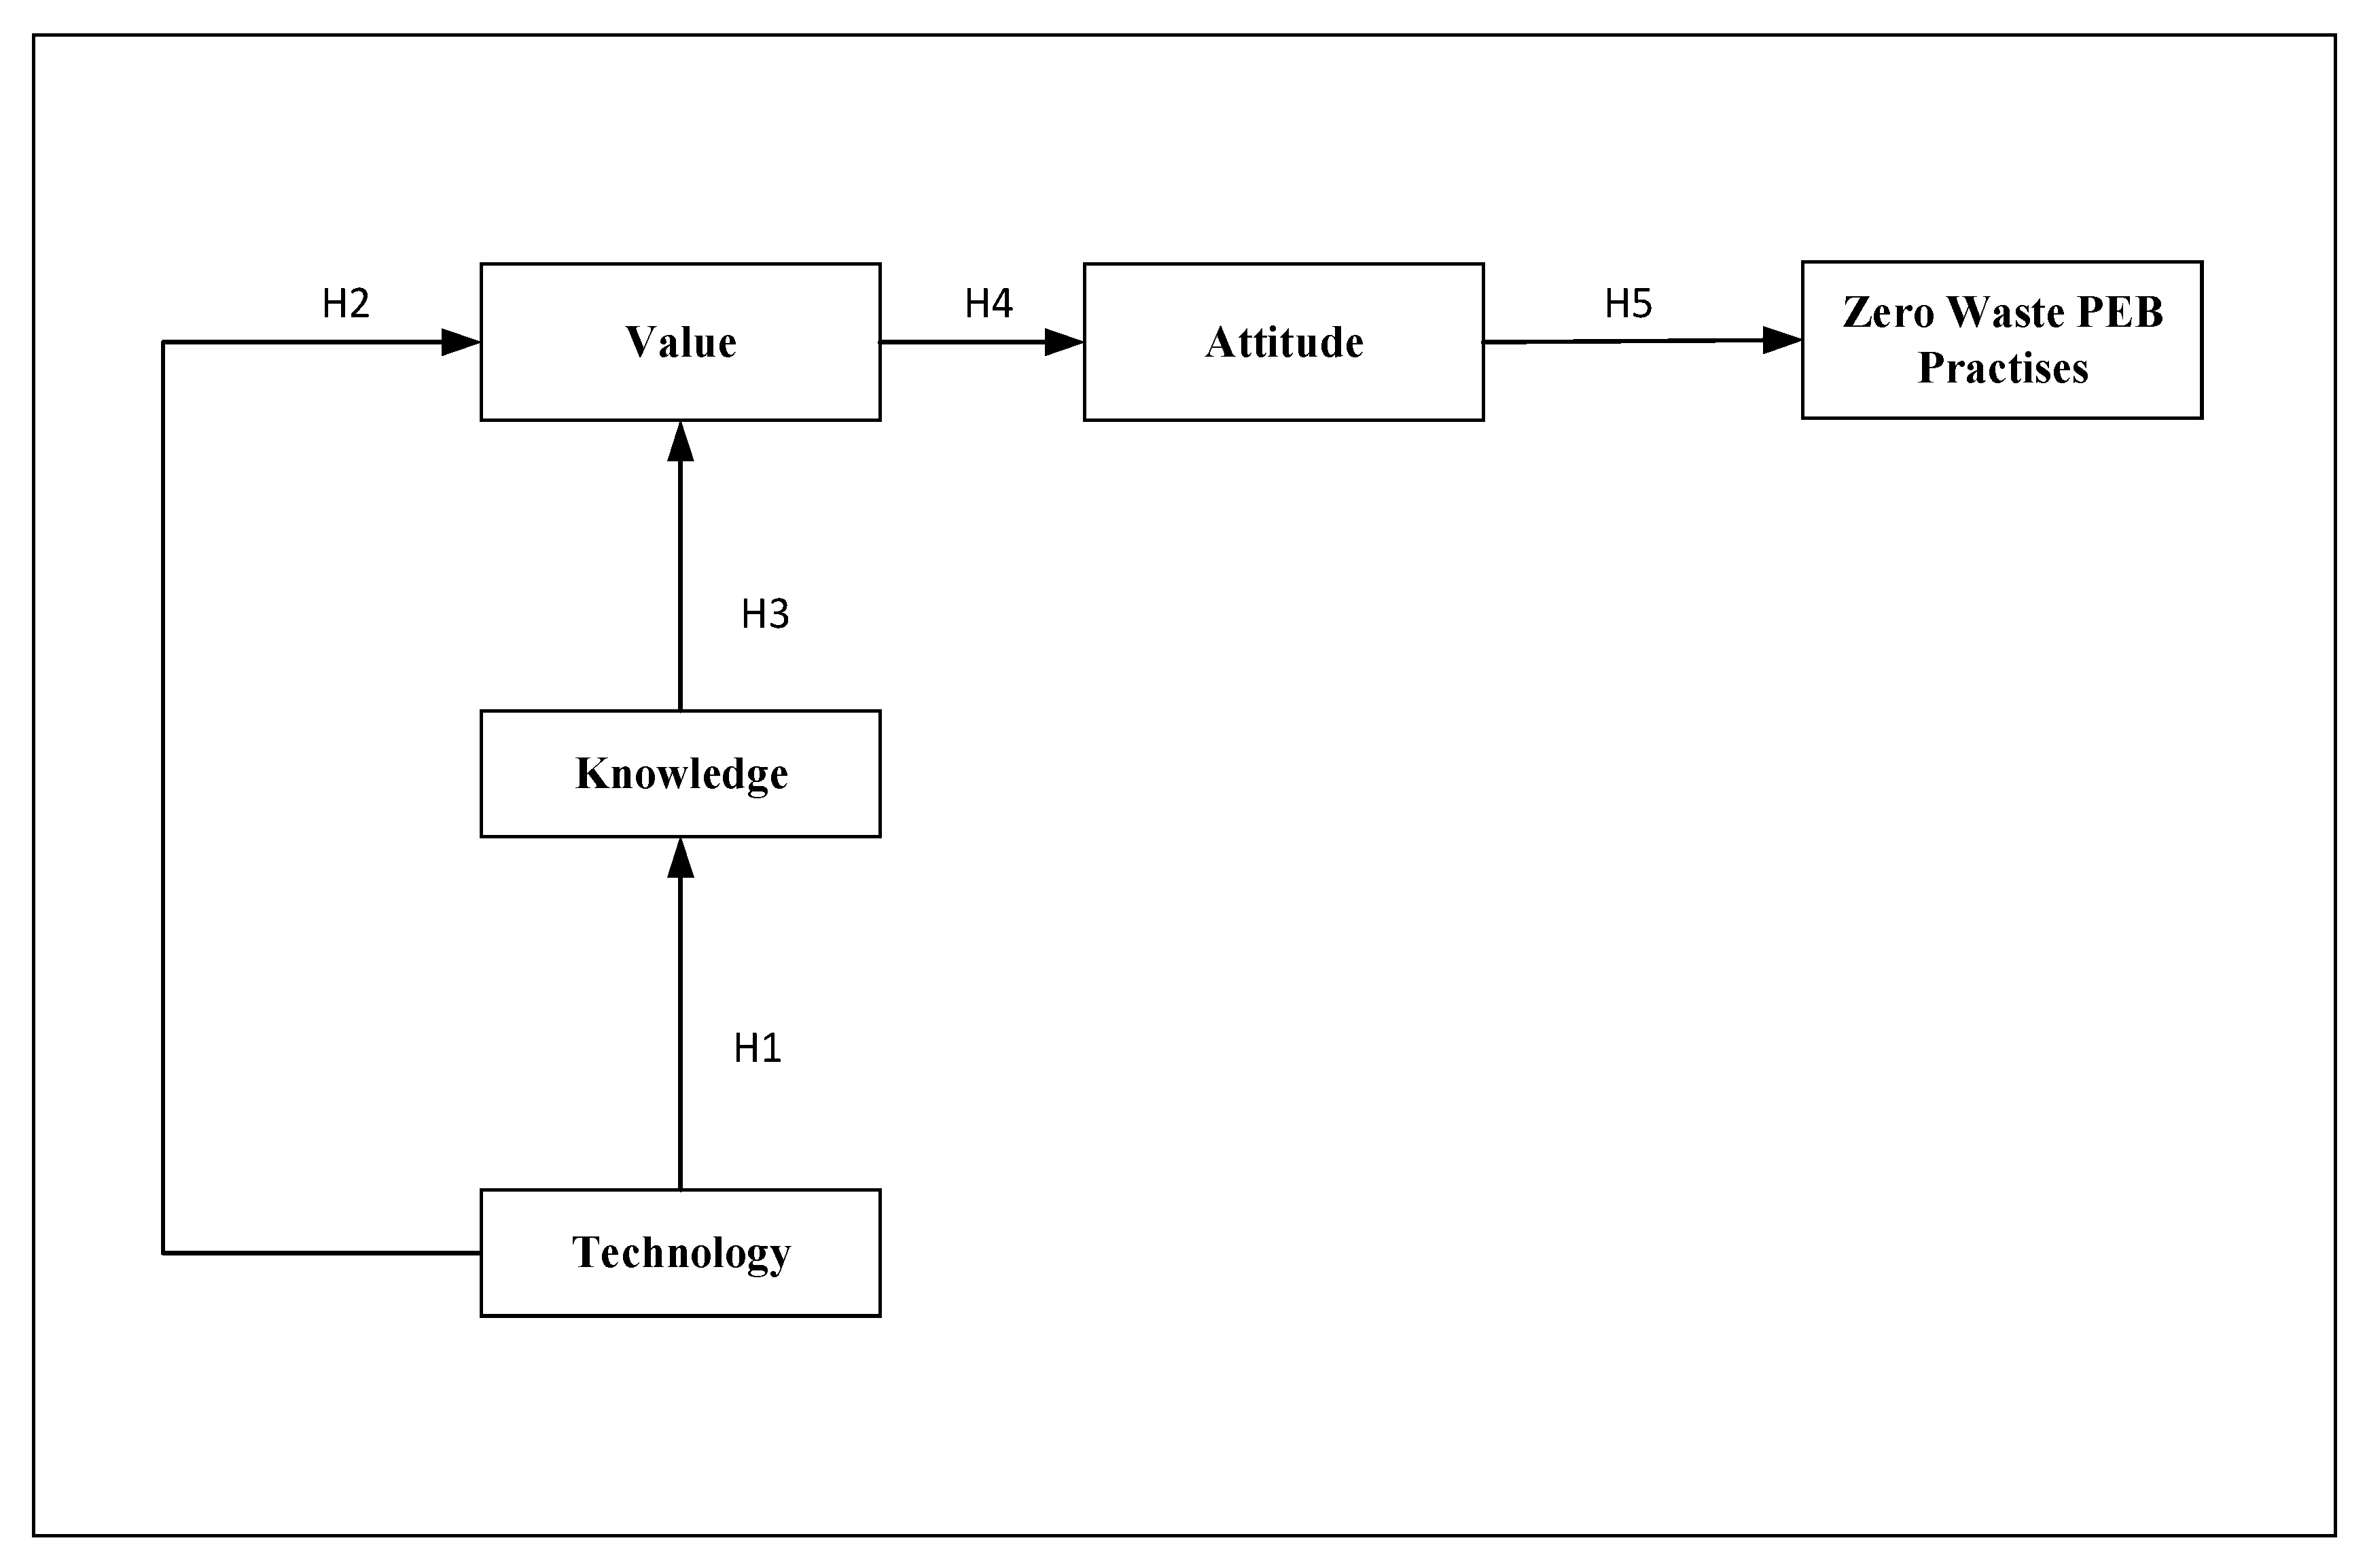
3.3. Research Hypotheses

Current generations are overwhelmed with many kinds of information. However, despite the known knowledge, the waste issue is getting more critical by the day. What does it take for one to practise sustainable, zero-waste, pro-environmental behaviour? Does technology, particularly information technology, aid in the management of waste in a sustainable manner? With the advancement of technology in the modern century, it is critical to find the relationship between knowledge, attitude, value, and technology in fostering sustainable zero-waste PEB practises. Figure 8 shows the research framework for this study.
Hypothesis 1 (H1): Technology has a positive effect on disseminating knowledge.
Today’s technological advancements have resulted in many changes in human life. Technology, particularly computer-mediated communication technologies, are information technologies that enable, intensify, or broaden the interactions between individuals in activities such as planning, designing, decision-making, or implementing a task [54,55]. Modern information technology aids in disseminating environmental information and is a significant source of information for the community [56]. They did, however, underline that the authority subject to the spread of inaccurate information should be considered. In this study, technology is believed to have a positive impact on shaping knowledge.
Hypothesis 2 (H2): Technology has a positive effect on nurturing value.
There is limited literature on the effect of technology on value. The influence of technology on values can be positive or negative, depending on living conditions and the internalisation of values under these conditions. It is vital to strengthen and improve the relationship between technology and values because, as technological society evolves, people tend to gravitate towards a system devoid of their values [57]. According to a new global survey performed by Lenovo, a large proportion of those polled believe that technology has the potential to make people more understanding, tolerant, charitable, and open-minded [58]. Building a society based on the relationship between values and technology appears to be a viable approach. Therefore, it is believed that technology has a positive influence on nurturing values in the university campus community.
Hypothesis 3 (H3): Knowledge has a positive effect on value.
According to Chan and Lau [59], a person’s environmental moral principles are heavily influenced by their knowledge, and such values are instilled in individuals who engage in PEB practises. Though, according to Sharot and Sunstein [60], knowledge has the potential to influence people’s actions, emotions, and cognition in both positive and negative ways. However, in this study, it is believed that knowledge will positively affect the university campus community’s environmental values.
Hypothesis 4 (H4): Value has a positive effect on attitude.
Attitudes are the proneness to act in particular ways with reference to the attitude object [61]. While value is an affective domain of a human [31], which involves the internalisation of emotion and feeling. Value refers to the acceptance of a phenomenon or behaviour with respect to its worth, excellence, usefulness, or importance. According to Guagnano et al. [62], the relationship between values, beliefs, and intentions is relatively free of the various constraints that interact with attitudes to influence behaviour. The research findings by Jayawardhena [63] have shown that personal values were significantly associated with a favourable environmentally friendly attitude. Therefore, the hypothesis that value has a positive effect on attitude is proposed.
Hypothesis 5 (H5): Attitude has a positive effect on Zero-Waste PEB Practise.
Some earlier research has proven the positive relationship between attitudes and behaviours. According to Kollmuss and Agyeman [27], individuals could only develop positive environmental behaviours by altering their value, intrinsic motivation, and relevant attitude. Pe’er, Goldman, and Yavetz [64] showed in their study that attitudes can positively influence environmental behaviour. In a recent study by Liu, Teng, and Han [65], attitudes have been discovered to have a considerable impact on PEB. Many research models have shown that individuals must first improve their attitudes towards the environment before they can change their behaviours towards the environment. Attitudes are believed to shape zero-waste PEB practises on university campuses.

4. Conclusions

This study enriches the existing literature by uncovering how knowledge, attitudes, and values interact and relate to the promotion of zero-waste PEB practises and how technology plays a role in closing the gap between the variables. The study shows significant results, which support the initially proposed zero-waste campus. The framework had been verified and validated by process in the quantitative phase. The positive relationships between technology and knowledge as well as their shared values demonstrate the role of technology as a significant predictor in fostering zero-waste PEB among the university campus community. Technology through social technology, specifically social media, can disseminate information fast and to a broad audience. The advancement of technology provides exciting interactive content that can attract the audience’s interest. Furthermore, social media is an excellent platform for sharing, and every member of the campus community can learn from each other’s personal experiences on waste management. However, technology did not stand alone. It necessitates the incorporation of other aspects. The information must be accurate and beneficial. This information will turn into knowledge that will instill values within oneself. Eventually, those moral principles will positively influence attitudes. This attitude will shape the community’s zero-waste PEB practises. By taking these variables into account, better planning on the university campus level can be implemented, which will benefit environmental sustainability and help to make the vision of a zero-waste campus a reality. This study is limited to university campus environments, and the sample respondents are restricted to only three universities. Therefore, it is suggested that it be carried out with more participating universities or tested on real cities in Malaysia. As a result, resolving MSW issues on campus may be relevant and adopted at the national level by the government to develop appropriate measures to increase public awareness and participation in promoting PEB practises towards a zero-waste goal.

Author Contributions

Conceptualisation, M.B.-N., N.A.A., M.H.H. and S.M.S.-M.; methodology, M.B.-N., N.A.A., M.H.H. and S.M.S.-M.; formal analysis, M.B.-N.; data curation, M.B.-N.; writing—original draft preparation, M.B.-N.; writing—review and editing, M.B.-N., N.A.A., M.H.H. and S.M.S.-M., M.S.M.S. and A.A.R.; supervision, N.A.A., M.H.H. and S.M.S.-M.; project administration, M.H.H.; funding acquisition, M.H.H. All authors have read and agreed to the published version of the manuscript.

Funding

This work was supported by the Ministry of Higher Education Malaysia for a long-term research project (Project Code: LRGS MRUN/F2/01/2019/2/2).

Data Availability Statement

The data that support the findings of this study are available from the corresponding author, Baba-Nalikant, M., upon reasonable request.

Conflicts of Interest

The authors declare no conflict of interest.

Ethics Approval

The Human Research Ethics Committee of Universiti Sains Malaysia (Reference Number: USM/JEPeM/20020092).

Appendix A

Table A1. Zero-Waste Campus Questionnaire Item.
ConstructItemQuestions Score
12345
Part A: KnowledgeK1Municipal Solid Waste (MSW) is a collection of various household waste that is discarded after use.
K2Zero-waste is a goal that encourages people to change their lifestyle to emulate sustainable natural cycles.
K3Zero-waste aims for no waste to be sent to landfills, incinerators, or the ocean.
K4Zero-waste is a continuous process that encourages long-term sustainability.
K5Zero-waste means focusing on waste minimisation at the source.
K6Reduce, Reuse, and Recycle (3R) play an important role towards the zero-waste goal.
K7Zero-waste approach conserves natural resources.
K8Zero-waste approach can help reduce pollution.
K9Avoiding single-use plastics can help reduce landfill waste.
K10Food waste is a major environmental issue.
Part B: AttitudeA1Environmental awareness is important to initiate the university campus community’s solid waste management towards a zero-waste campus.
A2Having a zero-waste environmental policy would guide the university towards its zero-waste goal.
A3Rewards can encourage the university campus community to practise zero-waste behaviour.
A4Punishment can deter the university campus community from creating waste.
A5The university’s solid waste management facilities can assist me in discarding my waste in a more manageable manner.
A6University top management inspires the campus community to practise organizational culture in pursuit of a zero-waste campus.
A7My participation in the university’s zero-waste community programmes encourages me to practise zero-waste behaviour.
A8My personal waste-related experiences have helped me gain a better understanding of waste issues.
A9Environmental education is important in encouraging the university campus community to practise zero-waste behaviour.
A10Zero-waste awareness campaigns are still effective in encouraging the university campus community to practise zero-waste behaviour.
Part C: PractiseP1I practise a zero-waste lifestyle in order to minimise waste.
P2I voluntarily joined the university’s zero-waste group to participate in their programme.
P3I actively share zero-waste knowledge with others.
P4I often seek zero-waste information on my own.
P5I use the university’s solid waste management facilities to manage my waste better.
P6I follow every waste management guideline issued by the university administration.
P7I prefer single-use plastics when buying food and groceries.
P8I would participate in zero-waste activities if I were offered incentives.
Part D: ValueV1A zero-waste goal is important to guide the way to a successful zero-waste campus.
V2Environmental education is important to achieve a zero-waste campus.
V3Personal waste-related experience is important in establishing an individual’s zero-waste, pro-environmental behaviour.
V4A zero-waste environmental policy is required to guide the university’s effort to achieve a zero-waste campus.
V5Solid waste management facilities are important to achieve a zero-waste campus.
V6Individual environmental awareness is important to achieve a zero-waste campus.
V7Rewards are important to encourage the university community’s participation in achieving a zero-waste campus.
V8Punishments are necessary to deter negative behaviour on campus that could jeopardise the university’s efforts to achieve a zero-waste campus.
V9Promoting campus community participation in zero-waste activities is important to achieve a zero-waste campus.
V10The campus community needs to take on social responsibility to achieve a zero-waste campus.
Part E: TechnologyT1Information technology plays an important role in promoting zero-waste, pro-environmental behaviour among the university campus community to achieve a zero-waste campus.
T2Information technology is important in disseminating information on zero-waste.
T3Information technology has the potential to influence the university campus community to adopt zero-waste’s pro-environmental behaviours.
T4Information technology helps the university’s campus community practise zero-waste and pother pro-environmental behaviour.
T5A zero-waste mobile application will help the university campus community understand zero-waste.
T6Social media is a powerful medium of communication to promote zero-waste behaviour.
T7Social media has widespread influence to promote zero-waste behaviour.
T8Social media influencers are important in promoting zero-waste, pro-environmental behaviours.
T9Social media creates social support for zero-waste, pro-environmental awareness.
T10The viral nature of social media will enable positive zero-waste and pro-environmental awareness sharing.
Each item or statement is followed by five response options to indicate the extent to which respondents agree with the given statement, with a score representing 5-strongly agree, 4-agree, 3-slightly disagree, 2-disagree, and 1-strongly disagree.

References

  1. Abubakar, I.R.; Maniruzzaman, K.M.; Dano, U.L.; AlShihri, F.S.; AlShammari, M.S.; Ahmed, S.M.S.; Al-Gehlani, W.A.G.; Alrawaf, T.I. Environmental Sustainability Impacts of Solid Waste Management Practices in the Global South. Int. J. Environ. Res. Public Health 2022, 19, 12717. [Google Scholar] [CrossRef] [PubMed]
  2. Hoornweg, D.; Bhada-Tata, P. What a Waste: A Global Review of Solid Waste Management; World Bank: Washington, DC, USA, 2012. [Google Scholar]
  3. Yang, H.; Ma, M.; Thompson, J.R.; Flower, R.J. Waste management, informal recycling, environmental pollution and public health. J. Epidemiol. Community Health 2018, 72, 237–243. [Google Scholar] [CrossRef] [PubMed]
  4. World Bank Group. Solid Waste Management. 2022. Available online: https://www.worldbank.org/en/topic/urbandevelopment/brief/solid-waste-management (accessed on 8 January 2023).
  5. Zaman, A. Zero-Waste: A New Sustainability Paradigm for Addressing the Global Waste Problem. In The Vision Zero Handbook: Theory, Technology and Management for a Zero Casualty Policy; Springer International Publishing: Cham, Switzerland, 2022; pp. 1–24. [Google Scholar]
  6. Zaman, A.; Newman, P. Plastics: Are they part of the zero-waste agenda or the toxic-waste agenda? Sustain. Earth 2021, 4, 4. [Google Scholar] [CrossRef]
  7. Saadatian, O.; Salleh, E.I.; Tahir, O.M.; Dola, K. Observations of sustainability practices in Malaysian research universities: Highlighting particular strengths. Pertanika J. Soc. Sci. Humanit. 2009, 17, 225–244. [Google Scholar]
  8. Koshy, K.C.; Ibrahim, K. Universiti Sains Malaysia’s Sustainability Journey: Reflections on a Road Less Travelled; Universiti Sains Malaysia: Penang, Malaysian, 2012. [Google Scholar]
  9. Bursztyn, M.; Drummond, J. Sustainability science and the university: Pitfalls and bridges to interdisciplinarity. Environ. Educ. Res. 2014, 20, 313–332. [Google Scholar] [CrossRef]
  10. Srivanit, M.; Hokao, K. Evaluating the cooling effects of greening for improving the outdoor thermal environment at an institutional campus in the summer. Build. Environ. 2013, 66, 158–172. [Google Scholar] [CrossRef]
  11. Abas, M.A.; Nor, A.N.M.; Malek, N.H.A.; Hassin, N.H. A Review of Sustainable Campus Concept in the Context of Solid Waste Management. J. Educ. Soc. Policy 2018, 5, 71–76. [Google Scholar] [CrossRef]
  12. United Nations (UN). United Nations Sustainable Development Goals. 2015. Available online: https://sdgs.un.org/goals (accessed on 8 January 2023).
  13. Gardner, G.T.; Stern, P.C. Environmental Problems and Human Behavior; Allyn & Bacon: Des Moines, IA, USA, 1996. [Google Scholar]
  14. Vining, J.; Ebreo, A. Emerging Theoretical and Methodological Perspectives on Conservation Behavior; John Wiley & Sons: Hoboken, NJ, USA, 2002. [Google Scholar]
  15. Raghu, S.J.; Rodrigues, L.L.R. Behavioral aspects of solid waste management: A systematic review. J. Air Waste Manag. Assoc. 2020, 70, 1268–1302. [Google Scholar] [CrossRef]
  16. Steg, L.; Vlek, C. Encouraging pro-environmental behaviour: An integrative review and research agenda. J. Environ. Psychol. 2009, 29, 309–317. [Google Scholar] [CrossRef]
  17. Ibáñez, M.E.; Ferrer, D.M.; Muñoz, L.V.A.; Claros, F.M.; Ruiz, F.J.O. University as Change Manager of Attitudes towards Environment (The Importance of Environmental Education). Sustainability 2020, 12, 4568. [Google Scholar] [CrossRef]
  18. Michelsen, G.; Fischer, D. Sustainability and education 1. In Sustainable Development Policy; Routledge: Abingdon, UK, 2018; pp. 135–158. [Google Scholar] [CrossRef]
  19. Baba-Nalikant, M.; Syed-Mohamad, S.M.; Husin, M.H.; Abdullah, N.A.; Saleh, M.S.M.; Rahim, A.A. A Zero-Waste Campus Framework: Perceptions and Practices of University Campus Community in Malaysia. Recycling 2023, 8, 21. [Google Scholar] [CrossRef]
  20. Schwartz, N.E. Nutrition knowledge, attitudes and practices of canadian public health nurses. J. Nutr. Educ. 1976, 8, 28–31. [Google Scholar] [CrossRef]
  21. Eckman, K.; Fortin, C.; Nuckles, K.; Were, V.L.A. Dakota County Winter Maintenance Training: KAP Study Report; University of Minnesota: Minneapolis, MN, USA, 2011. [Google Scholar]
  22. Kaliyaperuma, K. Guideline for Conducting a Knowledge, Attitude and Practice (KAP) Study. Community Ophthalmol. 2004, 4, 7–9. [Google Scholar]
  23. Vandamme, E. Concepts and challenges in the use of Knowledge-Attitude-Practice surveys: Literature review. Strateg. Netw. Negl. Dis. Zoonoses 2009, 1, 1–7. [Google Scholar]
  24. FAO. Guidelines for Assessing Nutrition-Related Knowledge, Attitudes and Practices; Food and Agriculture Organization of the United Nations: Rome, Italy, 2014. [Google Scholar]
  25. Boynton, P.M.; Greenhalgh, T. Selecting, designing, and developing your questionnaire. BMJ 2004, 328, 1312–1315. [Google Scholar] [CrossRef] [Green Version]
  26. Draugalis, J.R.; Coons, S.J.; Plaza, C.M. Best Practices for Survey Research Reports: A Synopsis for Authors and Reviewers. Am. J. Pharm. Educ. 2008, 72, 11. [Google Scholar] [CrossRef]
  27. Kollmuss, A.; Agyeman, J. Mind the Gap: Why do people act environmentally and what are the barriers to pro-environmental behavior? Environ. Educ. Res. 2002, 8, 239–260. [Google Scholar] [CrossRef] [Green Version]
  28. Howell, R.A.; Allen, S. Significant life experiences, motivations and values of climate change educators. Environ. Educ. Res. 2019, 25, 813–831. [Google Scholar] [CrossRef] [Green Version]
  29. Maiteny, P.T. Mind in the Gap: Summary of research exploring ’inner’ influences on pro-sustainability learning and behaviour. Environ. Educ. Res. 2002, 8, 299–306. [Google Scholar] [CrossRef]
  30. Seager, J.; Redclift, M.; Benton, T. Social Theory and the Global Environment. Econ. Geogr. 1994, 72, 473. [Google Scholar] [CrossRef]
  31. Krathwohl, D.; Bloom, B.; Masia, B. Taxonomy of Educational Objectives: The Classification of Educational Goals—Handbook II: Affective Domain; David McKay Company: Philadelphia, PA, USA, 1964. [Google Scholar]
  32. Vlek, C.; Steg, L. Human Behavior and Environmental Sustainability: Problems, Driving Forces, and Research Topics. J. Soc. Issues 2007, 63, 1–19. [Google Scholar] [CrossRef]
  33. Beder, S. The role of technology in sustainable development. IEEE Technol. Soc. Mag. 1994, 13, 14–19. [Google Scholar] [CrossRef] [Green Version]
  34. Kongoli, F. Role of Science and Technology in Sustainable Development. In Proceedings of the Sustainable Industrial Processing Summit and Ex-Hibition Plenaries, Paphos, Cyprus, 22–27 October 2016. [Google Scholar]
  35. Fogg, B.J. Persuasive Technology: Using Computers to Change What We Think and Do; Kaufmann Publishers: San Francisco, CA, USA, 2003. [Google Scholar]
  36. Zheng, Q.; Chen, T.; Kong, D. An Empirical Study on Context Awareness Integrated Mobile Assisted Instruction and the Factors. Eurasia J. Math. Sci. Technol. Educ. 2017, 13, 1737–1747. [Google Scholar] [CrossRef]
  37. Yükseltürk, E.; Altiok, S.; Baser, Z. Using game-based learning with kinect technology in Foreign Language education course. Educ. Technol. Soc. 2018, 21, 159–173. [Google Scholar]
  38. The World Bank. Mobile Cellular Subscriptions—Malaysia|Data, the World Bank. 2022. Available online: https://data.worldbank.org/indicator/IT.CEL.SETS?locations=MY&start=2019 (accessed on 27 December 2022).
  39. Sung, Y.-T.; Chang, K.-E.; Liu, T.-C. The effects of integrating mobile devices with teaching and learning on students’ learning performance: A meta-analysis and research synthesis. Comput. Educ. 2016, 94, 252–275. [Google Scholar] [CrossRef] [Green Version]
  40. Malik, M.N.; Khan, H.H.; Chofreh, A.G.; Goni, F.A.; Klemeš, J.J.; Alotaibi, Y. Investigating Students’ Sustainability Awareness and the Curriculum of Technology Education in Pakistan. Sustainability 2019, 11, 2651. [Google Scholar] [CrossRef] [Green Version]
  41. Awang, Z. Research Methodology and Data Analysis, 2nd ed.; UiTM Press: Shah Alam, Malaysia, 2012. [Google Scholar]
  42. Hunt, D.P. The concept of knowledge and how to measure it. J. Intellect. Cap. 2003, 4, 100–113. [Google Scholar] [CrossRef] [Green Version]
  43. Cunningham, E.; Holmes-Smith, P.; Coote, L. Structural Equation Modelling: From the Fundamentals to Advanced Topics; Streams Statsline: Melbourne, Australia, 2006. [Google Scholar]
  44. Hair, J.F. Multivariate Data Analysis: A Global Perspective, 7th ed.; Pearson Prentice Hall: Hoboken, NJ, USA, 2010. [Google Scholar]
  45. Browne, M.W.; Cudeck, R. Alternative ways of assessing model fit. Sociol. Methods Res. 1992, 21, 230–258. [Google Scholar] [CrossRef]
  46. Doll, W.J.; Xia, W.; Torkzadeh, G. A Confirmatory Factor Analysis of the End-User Computing Satisfaction Instrument. MIS Q. 1994, 18, 453. [Google Scholar] [CrossRef]
  47. Schuyler, Q.A.; Wilcox, C.; Townsend, K.A.; Wedemeyer-Strombel, K.R.; Balazs, G.; van Sebille, E.; Hardesty, B.D. Risk analysis reveals global hotspots for marine debris ingestion by sea turtles. Glob. Chang. Biol. 2016, 22, 567–576. [Google Scholar] [CrossRef] [Green Version]
  48. Kaliannan, M.; Chandran, S. Education in human values (EHV): Alternative approach for a holistic teaching. Educ. Res. Rev. 2010, 5, 802. [Google Scholar]
  49. Osman, O.; Ibrahim, K.; Koshy, K.; Akib, N.A.M.; Shabudin, A.F.A. The Sustainability Journey of USM: Solution Oriented Campus Ecosphere for Vitalising Higher Education Action on GAP. Handb. Theory Pract. Sustain. Dev. High. Educ. 2017, 3, 377–390. [Google Scholar] [CrossRef]
  50. Creswell, J.; Clark, V. Designing and Conducting Mix Method Research, 3rd ed.; SAGE Publications Inc.: New York, NY, USA, 2018. [Google Scholar]
  51. Yusoff, M.S.B. ABC of Content Validation and Content Validity Index Calculation. Educ. Med. J. 2019, 11, 49–54. [Google Scholar] [CrossRef]
  52. Davis, L.L. Instrument review: Getting the most from a panel of experts. Appl. Nurs. Res. 1992, 5, 194–197. [Google Scholar] [CrossRef]
  53. Brown, T.A. Confirmatory Factor Analysis for Applied Research; Guilford publications: New York, NY, USA, 2015. [Google Scholar]
  54. Townsend, A.M.; DeMarie, S.; Hendrickson, A.R. Virtual teams: Technology and the workplace of the future. Acad. Manag. Perspect. 1998, 12, 17–29. [Google Scholar] [CrossRef]
  55. Carr, C.T. Computer-Mediated Communication: A Theoretical and Practical Introduction to Online Human Communication; Rowman & Littlefield: Lanham, Maryland, 2021. [Google Scholar]
  56. Ladychenko, V.; Chomakhashvili, O.; Uliutina, O.; Kanaryk, J. Dissemination of Environmental Information in the E-Governance system: World Trends and Experience for Ukraine. Eur. J. Sustain. Dev. 2020, 9, 51. [Google Scholar] [CrossRef]
  57. Gizemagyuz. The Impact of Technology on Values (An Interaction Project); GRIAL Research Group of the University of Salamanca: Salamanca, Spain, 2019. [Google Scholar]
  58. New Global Study by LenovoTM Reveals how Tech is Impacting our Human Values—Lenovo StoryHub, Lenovo Group Limited. 2019. Available online: https://news.lenovo.com/pressroom/press-releases/new-global-study-by-lenovo-reveals-how-tech-is-impacting-our-human-values/ (accessed on 18 December 2022).
  59. Chan, R.Y.K.; Lau, L.B.Y. Antecedents of green purchases: A survey in China. J. Consum. Mark. 2000, 17, 338–357. [Google Scholar] [CrossRef]
  60. Sharot, T.; Sunstein, C.R. How people decide what they want to know. Nat. Hum. Behav. 2020, 4, 14–19. [Google Scholar] [CrossRef]
  61. Wan, T.T.H.; Rav-Marathe, K.; Marathe, S. A Systematic Review of Kap-O Framework for Diabetes. Med. Res. Arch. 2016, 3, 9. [Google Scholar]
  62. Guagnano, G.A.; Stern, P.C.; Dietz, T. Influences on attitude-behavior relationships: A natural experiment with curbside recycling. Env. Behav. 1995, 27, 699–718. [Google Scholar] [CrossRef]
  63. Jayawardhena, C. Personal values’ influence on e-shopping attitude and behaviour. Internet Res. 2004, 14, 127–138. [Google Scholar] [CrossRef]
  64. Pe’er, S.; Goldman, D.; Yavetz, B. Environmental literacy in teacher training: Attitudes, knowledge, and environmental behavior of beginning students. J. Env. Educ. 2007, 39, 45–59. [Google Scholar] [CrossRef]
  65. Liu, P.; Teng, M.; Han, C. How does environmental knowledge translate into pro-environmental behaviors?: The medi-ating role of environmental attitudes and behavioral intentions. Sci. Total Environ. 2020, 728, 138126. [Google Scholar] [CrossRef] [PubMed]
Figure 1. Kollmuss and Agyeman’s Model of Pro-Environmental Behaviour.
Recycling 08 00040 g001
Figure 2. Zero-Waste Campus Framework.
Recycling 08 00040 g002
Figure 3. Screenshot of the Path Diagram from SPSS AMOS.
Recycling 08 00040 g003
Figure 4. Direct effect strengths (β) and Squared Multiple Correlation (R2) values.
Recycling 08 00040 g004
Figure 5. The schematic diagrams showing the positions of the independent (Technology), dependent (Value), and moderating (Knowledge) variables.
Recycling 08 00040 g005
Figure 6. The schematic diagrams showing the positions of the independent (Value), dependent (Attitude), and moderating (Practise) variables.
Recycling 08 00040 g006
Figure 7. Flow of the study.
Recycling 08 00040 g007
Figure 8. Research Framework.
Recycling 08 00040 g008
Table 1. Model Fit Categories and Indexes.
Name of CategoryName of IndexLevel of AcceptanceComments
Absolute fitChisqp > 0.05Sensitive to sample size > 200.
RMSEARMSEA < 0.08Range of 0.05 to 0.1 is acceptable.
GFIGFI > 0.90GFI = 0.95 is a good fit.
Incremental fitAGFIAGFI > 0.90AGFI = 0.95 is a good fit.
CFICFI > 0.90CFI = 0.95 is a good fit.
Parsimonious fitChisq/dfChisq/df < 5.0The value should be less than 5.0.
Table 2. Model Fit Value for the Proposed Framework.
Name of CategoryName of IndexObserved Value
Absolute fitRMSEA0.068
GFI0.762
Incremental fitCFI0.822
Parsimonious fitChisq/df2.809
Table 3. Hypothesis Testing (Direct Effects).
Hypothesis/RelationshipStandardized BetaStandard ErrorCritical RatioPLabelDecision
H1Technology -> Knowledge0.8630.1168.878***Supported
H2Technology -> Value0.4560.0947.461***Supported
H3Knowledge -> Value0.5600.0947.674***Supported
H4Value -> Attitude0.9810.06814.985***Supported
H5Attitude -> Zero-Waste PEB Practise0.5500.0488.156***Supported
*** p-value is less than 0.01.
Table 4. The median of combined-knowledge and combined-attitude variables.
VariableCombined-KnowledgeCombined-Attitude
Median45.000040.0000
Percentiles5040.000040.0000
10045.000045.0000
Table 5. The frequency of low and high levels.
VariableFrequencyPercent
Low Knowledge20852.9
High Knowledge18547.1
Low Attitude22056.0
High Attitude17344.0
Table 6. Measure on Constrained and Unconstrained Models for Moderating Variables.
Data GroupIndexConstrained ModelUnconstrained ModelChi-Square DifferenceModeration
Result
Hypothesis
Result
Low KnowledgeChi-Square517.519501.93215.587SignificantAccepted
DF1701691
High KnowledgeChi-Square483.506469.32914.177SignificantAccepted
DF1701691
Low AttitudeChi-Square428.435385.81842.617SignificantAccepted
DF1351341
High AttitudeChi-Square245.897241.7694.128SignificantAccepted
DF1351341
Table 7. External group expert panels.
Expert PanelArea of ExpertiseYears of ExperienceResignation
1Environmental Geography
Environmental Issues and Assessment
Environmental Management
Urban Studies
13Senior
Lecturer
2Curriculum Studies
Environmental Education
Geographical Instructional Methodology
Pedagogy
20Associate Professor
3Social Sciences
Geography
Tertiary Education
Economics
22Senior
Lecturer
Table 8. Profiles of respondents.
Demographic VariableCategoryFrequencyPercentage
GenderMale13033.1
Female26366.9
EthnicityMalay24562.3
Chinese9323.7
Indian348.7
Other215.3
Age18−2421554.7
25−349423.9
35−446215.8
45−44174.3
55−6451.3
UniversityUKM11028.0
UPM11529.3
USM16842.7
DesignationLecturer4210.7
Administration Staff348.7
Service/Technical Staff184.6
Undergraduate18647.3
Postgraduate11328.8
Disclaimer/Publisher’s Note: The statements, opinions and data contained in all publications are solely those of the individual author(s) and contributor(s) and not of MDPI and/or the editor(s). MDPI and/or the editor(s) disclaim responsibility for any injury to people or property resulting from any ideas, methods, instructions or products referred to in the content.

