
Release of PAH from Secondary Products Made from End-of-Life Tire Recyclates into 20% Aqueous Ethanol as Assessment of Human Dermal Absorption


Abstract
:1. Introduction
- Migration increases under dynamic conditions (linear shaking) by a factor of up to 20. Therefore, dynamic conditions were selected for subsequent tests.
- Under the same migration conditions, the relative migration of PAH depends on the molecular weight and shape of each substance, its content, the matrix, and the specific surface area of the test specimens.
- The results indicate that extender oil has the greatest influence on the release, and the PAH it contains appear to migrate more easily than those in the carbon black.
- Carbon black may have the ability to reabsorb released PAH, with this effect potentially increasing with increasing specific surface area of the carbon black.
- After an initial increase for PAH released over time, the trend for some materials indicates that migration tends to reach a plateau. However, in other cases, a decrease in released PAH has been observed after the passing of a maximum, which is associated with reuptake.
- For end-of-life tire granulates, a potential barrier effect of a polyurethane coating was found, whereas migration from coated granulates was up to three times lower.
2. Results
2.1. PAH Content
2.2. PAH Migration
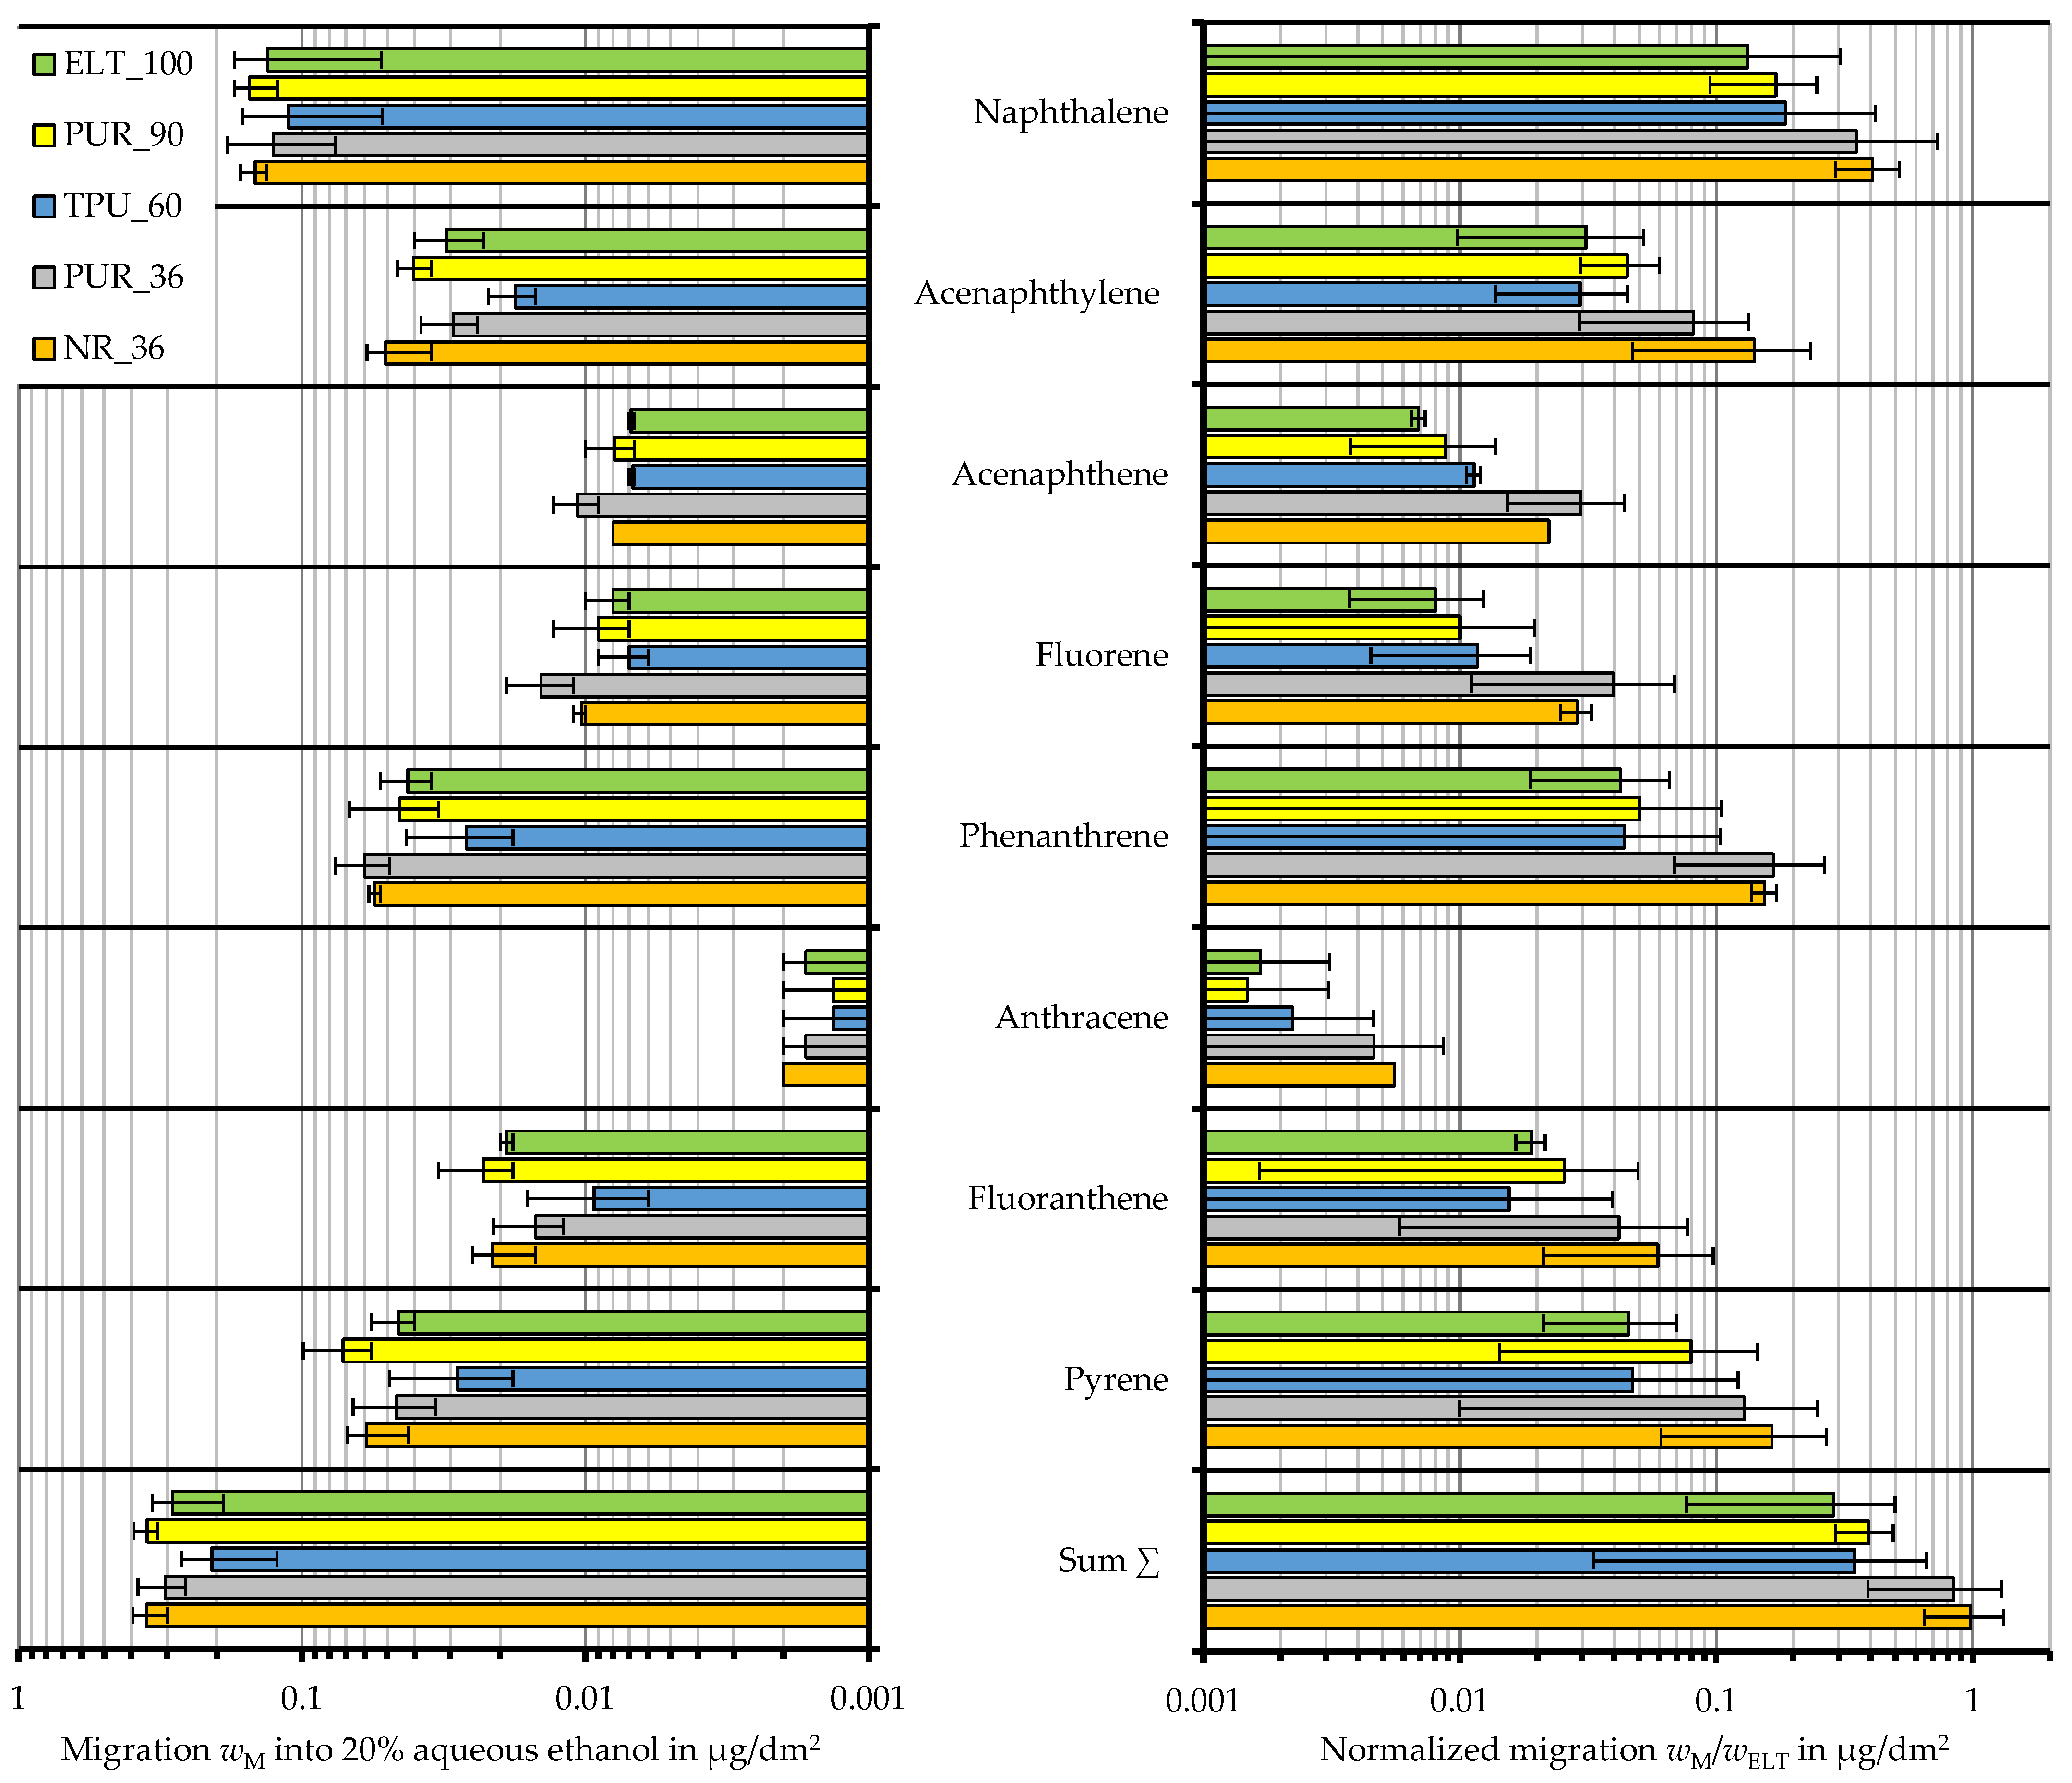
2.2.1. Specific Migration of PAH into 20% Aqueous Ethanol
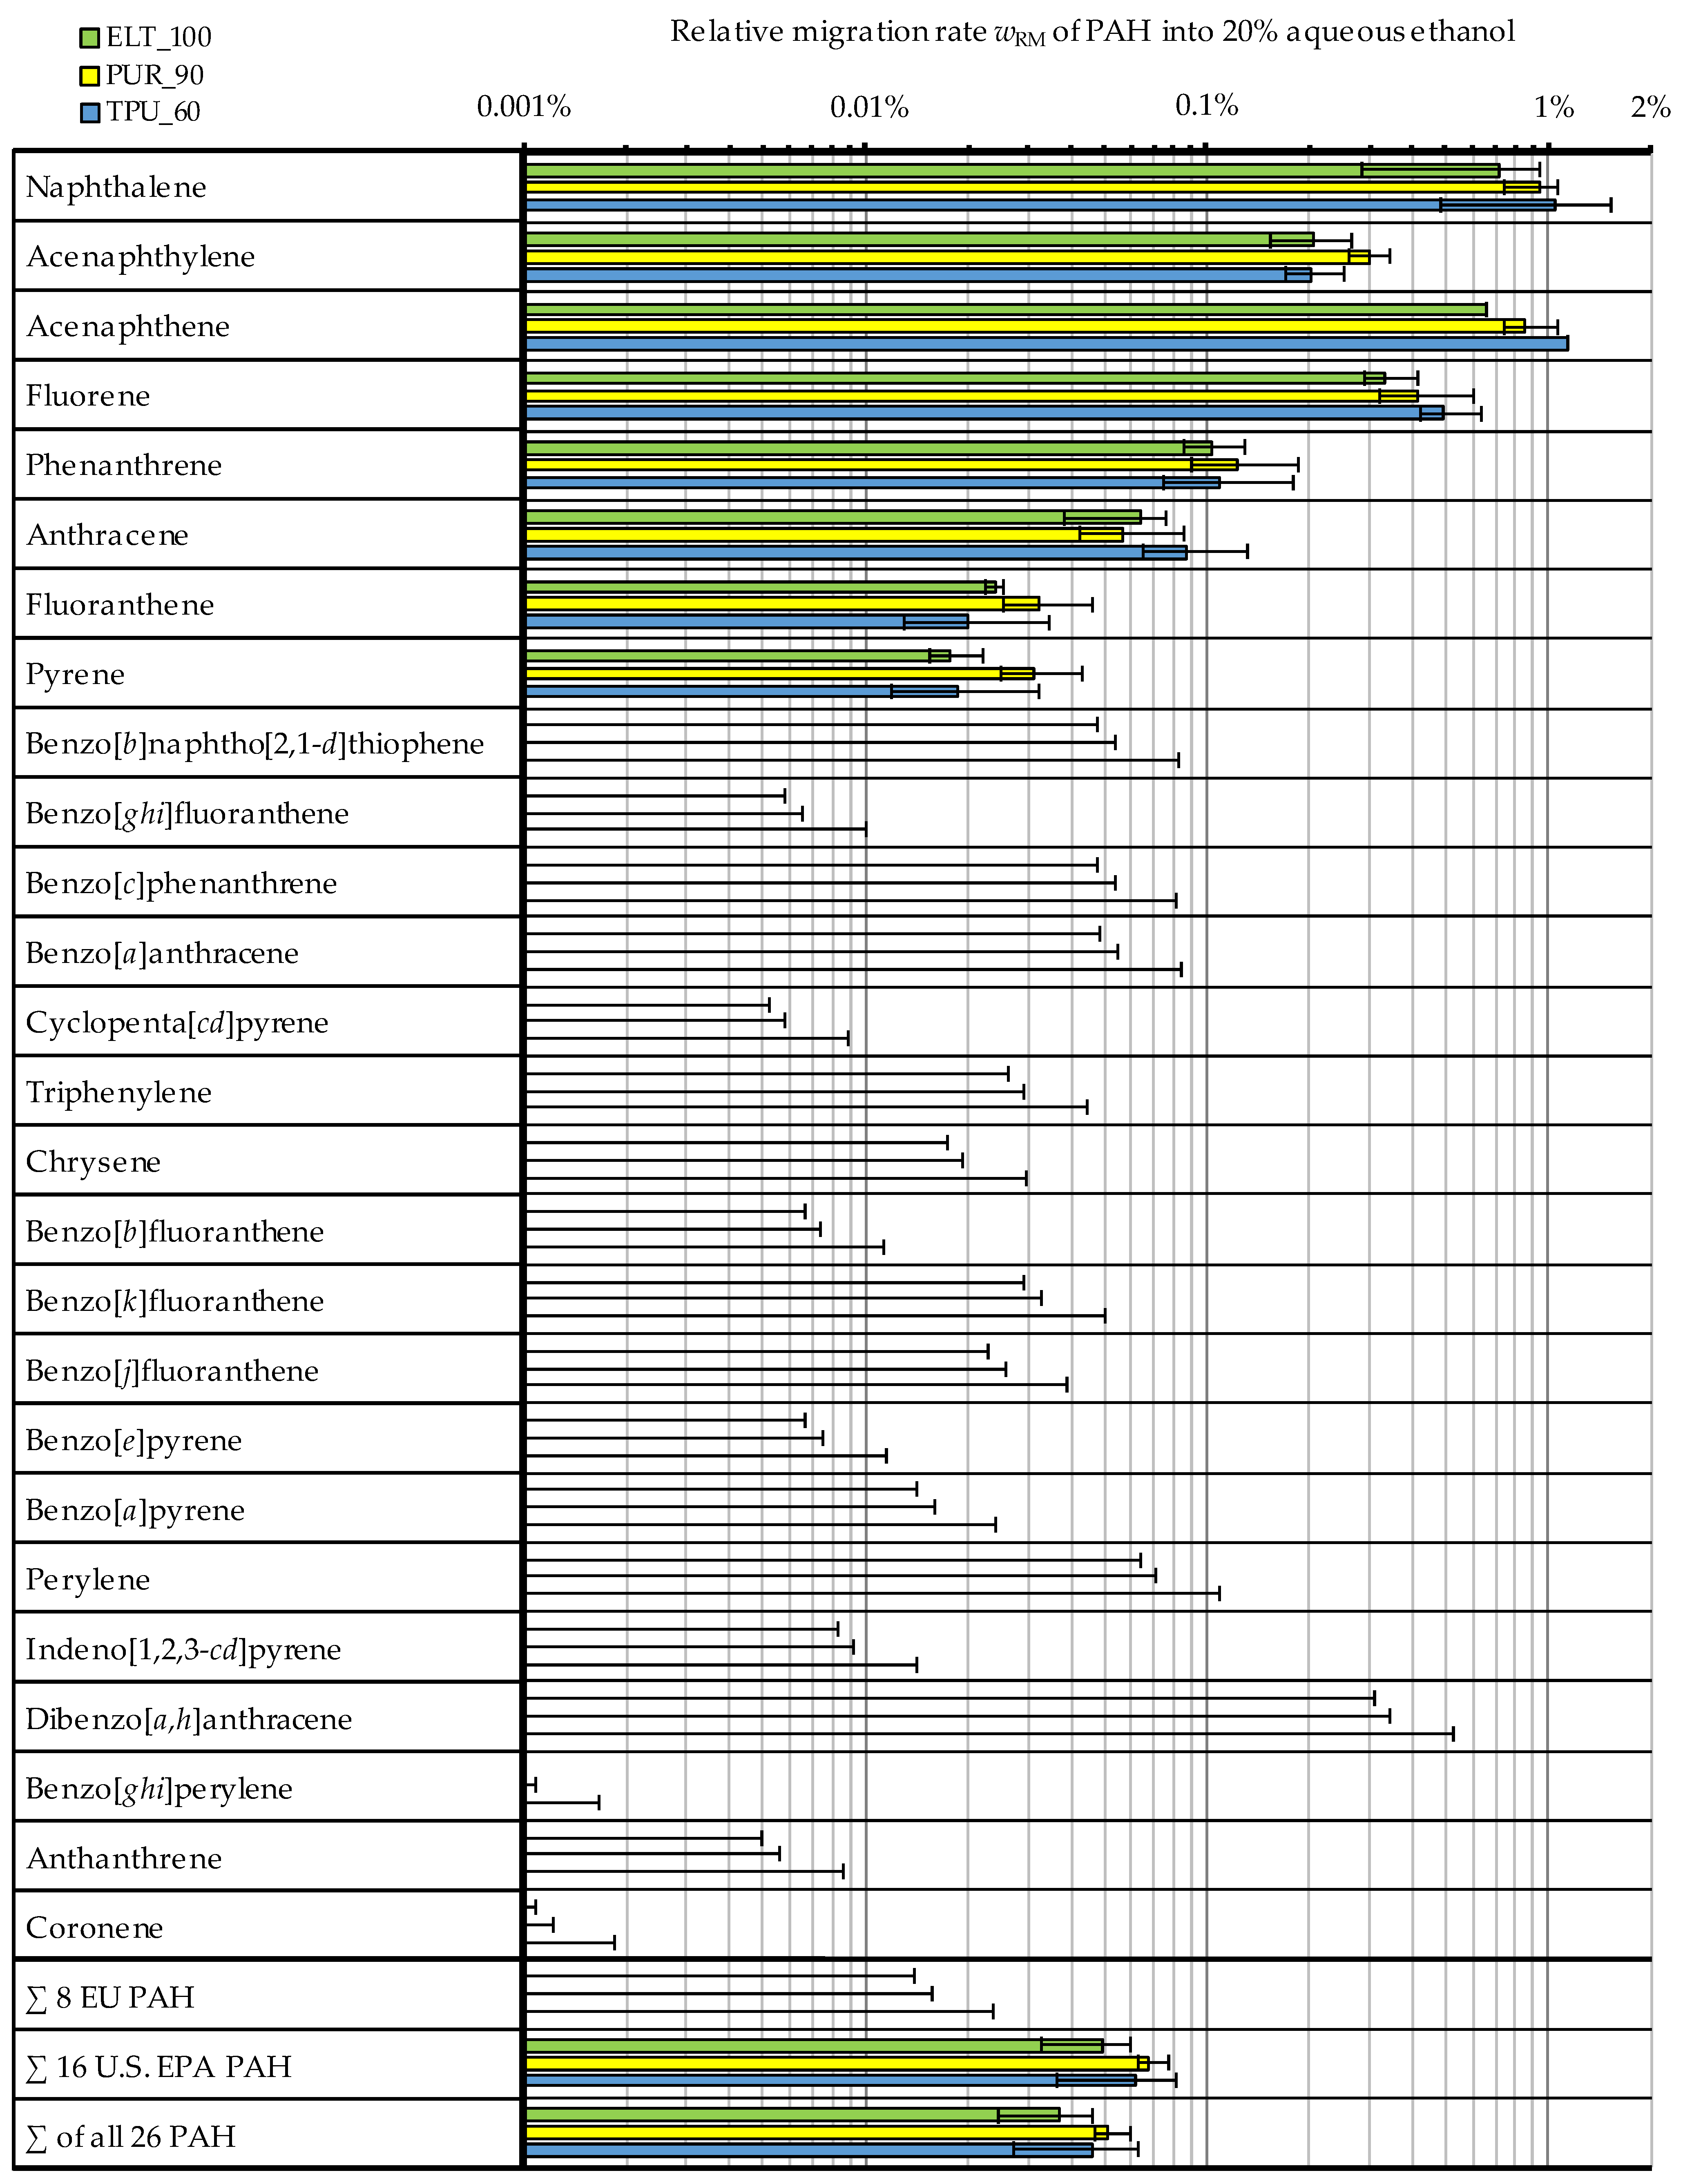
2.2.2. Migration of PAH Relative to Their Content
3. Discussion
4. Materials and Methods
4.1. Methods
4.2. Materials
4.3. Preparation of Materials and Test Specimens
4.4. PAH Content Measurement
4.5. PAH Release from Rubber into the Ethanolic Test Liquid
4.5.1. General
4.5.2. Preparation of the Migration Extract
4.5.3. PAH Analysis of the Migration Extract
4.5.4. Calculation of the Relative Migration Rate wRM
5. Conclusions
Author Contributions
Funding
Institutional Review Board Statement
Informed Consent Statement
Data Availability Statement
Acknowledgments
Conflicts of Interest
Appendix A

| NR_36 (n = 3) | PUR_36 (n = 3) | ELT_100 | PUR_90 | TPU_60 | |||||||
|---|---|---|---|---|---|---|---|---|---|---|---|
| Arithmetic Mean | Margin of Error e | Standard Deviation s | Maximum Value | Arithmetic Mean | Margin of Error e | Standard Deviation s | Maximum Value | Mathematically Estimated Content | Mathematically Estimated Content | Mathematically Estimated Content | |
| Naphthalene | 0.994 | 0.280 | 0.113 | 1.124 | 0.839 | 0.101 | 0.041 | 0.867 | 1.805 | 1.625 | 1.083 |
| Acenaphthylene | 0.718 | 0.105 | 0.042 | 0.753 | 0.685 | 0.033 | 0.013 | 0.700 | 1.480 | 1.332 | 0.888 |
| Acenaphthene | 0.065 | 0.032 | 0.013 | 0.073 | 0.067 | 0.012 | 0.005 | 0.072 | 0.104 | 0.094 | 0.062 |
| Fluorene | 0.103 | 0.012 | 0.005 | 0.106 | 0.105 | 0.035 | 0.014 | 0.116 | 0.239 | 0.215 | 0.143 |
| Phenanthrene | 1.823 | 0.122 | 0.049 | 1.868 | 1.762 | 0.051 | 0.020 | 1.777 | 4.042 | 3.638 | 2.425 |
| Anthracene | 0.123 | 0.013 | 0.005 | 0.128 | 0.139 | 0.025 | 0.010 | 0.145 | 0.258 | 0.232 | 0.155 |
| Fluoranthene | 2.962 | 0.121 | 0.049 | 3.000 | 2.887 | 0.047 | 0.019 | 2.909 | 7.821 | 7.039 | 4.693 |
| Pyrene | 10.027 | 0.568 | 0.229 | 10.244 | 9.792 | 0.428 | 0.172 | 9.921 | 25.443 | 22.899 | 15.266 |
| Benzo[b]naphtho [2,1-d]thiophene | 0.066 | 0.001 | 0.001 | 0.067 | 0.068 | 0.006 | 0.003 | 0.070 | 0.164 | 0.148 | 0.098 |
| Benzo[ghi]fluoranthene | 1.052 | 0.029 | 0.012 | 1.065 | 1.041 | 0.053 | 0.021 | 1.056 | 2.694 | 2.425 | 1.616 |
| Benzo[c]phenanthrene | 0.053 | 0.015 | 0.006 | 0.058 | 0.055 | 0.004 | 0.002 | 0.056 | 0.144 | 0.130 | 0.086 |
| Benzo[a]anthracene | 0.104 | 0.006 | 0.003 | 0.107 | 0.098 | 0.005 | 0.002 | 0.100 | 0.281 | 0.253 | 0.169 |
| Cyclopenta[cd]pyrene | 0.769 | 0.162 | 0.065 | 0.837 | 0.941 | 0.051 | 0.020 | 0.959 | 3.025 | 2.723 | 1.815 |
| Triphenylene | 0.124 | 0.016 | 0.006 | 0.131 | 0.103 | 0.006 | 0.002 | 0.104 | 0.301 | 0.271 | 0.181 |
| Chrysene | 0.176 | 0.022 | 0.009 | 0.183 | 0.154 | 0.005 | 0.002 | 0.156 | 0.455 | 0.410 | 0.273 |
| Benzo[b]fluoranthene | 0.175 | 0.005 | 0.002 | 0.177 | 0.168 | 0.017 | 0.007 | 0.176 | 0.446 | 0.401 | 0.268 |
| Benzo[k]fluoranthene | 0.054 | 0.005 | 0.002 | 0.056 | 0.052 | 0.010 | 0.004 | 0.057 | 0.101 | 0.091 | 0.061 |
| Benzo[j]fluoranthene | 0.053 | 0.020 | 0.008 | 0.061 | 0.052 | 0.015 | 0.006 | 0.058 | 0.129 | 0.116 | 0.077 |
| Benzo[e]pyrene | 0.651 | 0.021 | 0.009 | 0.660 | 0.620 | 0.039 | 0.016 | 0.637 | 1.763 | 1.587 | 1.058 |
| Benzo[a]pyrene | 0.528 | 0.024 | 0.010 | 0.535 | 0.498 | 0.014 | 0.006 | 0.504 | 1.457 | 1.311 | 0.874 |
| Perylene | 0.080 | 0.011 | 0.005 | 0.085 | 0.072 | 0.011 | 0.004 | 0.077 | 0.186 | 0.167 | 0.112 |
| Indeno [1,2,3-cd]pyrene | 0.603 | 0.048 | 0.019 | 0.618 | 0.557 | 0.026 | 0.010 | 0.569 | 1.546 | 1.391 | 0.928 |
| Dibenzo[a,h]anthracene | 0.019 | 0.001 | 0.001 | 0.019 | 0.014 | 0.015 | 0.006 | 0.021 | 0.016 | 0.014 | 0.010 |
| Benzo[ghi]perylene | 3.399 | 0.205 | 0.083 | 3.461 | 3.327 | 0.162 | 0.065 | 3.402 | 9.176 | 8.258 | 5.506 |
| Anthanthrene | 0.572 | 0.121 | 0.049 | 0.611 | 0.561 | 0.050 | 0.020 | 0.578 | 1.772 | 1.595 | 1.063 |
| Coronene | 3.419 | 0.330 | 0.133 | 3.513 | 3.248 | 0.312 | 0.126 | 3.383 | 8.181 | 7.363 | 4.909 |
| ∑ 8 EU PAH | 1.760 | 0.090 | 0.036 | 1.794 | 1.656 | 0.091 | 0.037 | 1.698 | 4.889 | 4.400 | 2.933 |
| ∑ 16 U.S. EPA PAH | 21.873 | 0.901 | 0.363 | 22.189 | 21.143 | 0.353 | 0.142 | 21.295 | 57.225 | 51.503 | 34.335 |
| ∑ of all 26 PAH | 28.711 | 1.504 | 0.605 | 29.242 | 27.903 | 0.513 | 0.206 | 28.135 | 76.129 | 68.516 | 45.677 |
Appendix B
| PAH | Limit of Quanti-Fication in ng/dm2 |
|---|---|
| Naphthalene | 52.4 |
| Acenaphthylene | 13.7 |
| Acenaphthene | 6.7 |
| Fluorene | 1.4 |
| Phenanthrene | 0.8 |
| Anthracene | 0.2 |
| Fluoranthene | 0.4 |
| Pyrene | 1.3 |
| Benzo[b]naphtho [2,1-d]thiophene | 0.8 |
| Benzo[ghi]fluoranthene | 1.6 |
| Benzo[c]phenanthrene | 0.7 |
| Benzo[a]anthracene | 1.4 |
| Cyclopenta[cd]pyrene | 1.6 |
| Triphenylene | 0.8 |
| Chrysene | 0.8 |
| Benzo[b]fluoranthene | 0.3 |
| Benzo[k]fluoranthene | 0.3 |
| Benzo[j]fluoranthene | 0.3 |
| Benzo[e]pyrene | 1.2 |
| Benzo[a]pyrene | 2.1 |
| Perylene | 1.2 |
| Indeno [1,2,3-cd]pyrene | 1.3 |
| Dibenzo[a,h]anthracene | 0.5 |
| Benzo[ghi]perylene | 0.9 |
| Anthanthrene | 0.9 |
| Coronene | 0.9 |
Appendix C
| ELT_100 | PUR_90 | TPU_60 | NR_36 | PUR_36 | All | |||||||||||
|---|---|---|---|---|---|---|---|---|---|---|---|---|---|---|---|---|
| Compound | min | max 1 | min | max 1 | min | max 1 | min | max 1 | min | max 1 | ||||||
| Naphthalene | 0.723 | 0.284 | 0.945 | 0.940 | 0.747 | 1.059 | 1.043 | 0.486 | 1.523 | 1.217 | 1.115 | 1.373 | 1.237 | 0.744 | 1.802 | 1.340 |
| Acenaphthylene | 0.206 | 0.153 | 0.266 | 0.301 | 0.261 | 0.343 | 0.201 | 0.171 | 0.251 | 0.584 | 0.403 | 0.680 | 0.352 | 0.288 | 0.456 | 0.399 |
| Acenaphthene | 0.663 | 0.663 | 0.663 | 0.850 | 0.743 | 1.062 | 1.135 | 1.135 | 1.135 | 1.018 | 1.018 | 1.018 | 1.307 | 1.103 | 1.593 | 1.094 |
| Fluorene | 0.330 | 0.289 | 0.412 | 0.416 | 0.324 | 0.601 | 0.494 | 0.423 | 0.635 | 0.833 | 0.806 | 0.886 | 1.121 | 0.860 | 1.486 | 0.804 |
| Phenanthrene | 0.103 | 0.085 | 0.129 | 0.124 | 0.090 | 0.186 | 0.110 | 0.075 | 0.179 | 0.253 | 0.240 | 0.263 | 0.280 | 0.228 | 0.354 | 0.222 |
| Anthracene | 0.064 | 0.038 | 0.076 | 0.057 | 0.043 | 0.086 | 0.087 | 0.065 | 0.131 | 0.135 | 0.135 | 0.135 | 0.099 | 0.059 | 0.118 | 0.109 |
| Fluoranthene | 0.024 | 0.023 | 0.025 | 0.032 | 0.025 | 0.047 | 0.020 | 0.013 | 0.035 | 0.060 | 0.042 | 0.070 | 0.043 | 0.034 | 0.060 | 0.047 |
| Pyrene | 0.018 | 0.015 | 0.022 | 0.031 | 0.025 | 0.043 | 0.019 | 0.012 | 0.032 | 0.049 | 0.035 | 0.057 | 0.039 | 0.029 | 0.055 | 0.042 |
| Benzo[b]naphtho [2,1-d]thiophene | n.d. | n.d. | 0.048 | n.d. | n.d. | 0.054 | n.d. | n.d. | 0.082 | n.d. | n.d. | 0.100 | n.d. | n.d. | 0.097 | 0.076 |
| Benzo[ghi]fluoranthene | n.d. | n.d. | 0.006 | n.d. | n.d. | 0.007 | n.d. | n.d. | 0.010 | n.d. | n.d. | 0.013 | n.d. | n.d. | 0.013 | 0.010 |
| Benzo[c]phenanthrene | n.d. | n.d. | 0.048 | n.d. | n.d. | 0.054 | n.d. | n.d. | 0.082 | n.d. | n.d. | 0.110 | n.d. | n.d. | 0.105 | 0.080 |
| Benzo[a]anthracene | n.d. | n.d. | 0.049 | n.d. | n.d. | 0.055 | n.d. | n.d. | 0.084 | n.d. | n.d. | 0.111 | n.d. | n.d. | 0.118 | 0.083 |
| Cyclopenta[cd]pyrene | n.d. | n.d. | 0.005 | n.d. | n.d. | 0.006 | n.d. | n.d. | 0.009 | n.d. | n.d. | 0.017 | n.d. | n.d. | 0.014 | 0.010 |
| Triphenylene | n.d. | n.d. | 0.026 | n.d. | n.d. | 0.029 | n.d. | n.d. | 0.045 | n.d. | n.d. | 0.053 | n.d. | n.d. | 0.064 | 0.044 |
| Chrysene | n.d. | n.d. | 0.017 | n.d. | n.d. | 0.019 | n.d. | n.d. | 0.030 | n.d. | n.d. | 0.038 | n.d. | n.d. | 0.043 | 0.029 |
| Benzo[b]fluoranthene | n.d. | n.d. | 0.007 | n.d. | n.d. | 0.007 | n.d. | n.d. | 0.011 | n.d. | n.d. | 0.014 | n.d. | n.d. | 0.015 | 0.011 |
| Benzo[k]fluoranthene | n.d. | n.d. | 0.029 | n.d. | n.d. | 0.033 | n.d. | n.d. | 0.050 | n.d. | n.d. | 0.046 | n.d. | n.d. | 0.047 | 0.041 |
| Benzo[j]fluoranthene | n.d. | n.d. | 0.023 | n.d. | n.d. | 0.026 | n.d. | n.d. | 0.039 | n.d. | n.d. | 0.047 | n.d. | n.d. | 0.047 | 0.036 |
| Benzo[e]pyrene | n.d. | n.d. | 0.007 | n.d. | n.d. | 0.008 | n.d. | n.d. | 0.011 | n.d. | n.d. | 0.015 | n.d. | n.d. | 0.016 | 0.011 |
| Benzo[a]pyrene | n.d. | n.d. | 0.014 | n.d. | n.d. | 0.016 | n.d. | n.d. | 0.024 | n.d. | n.d. | 0.033 | n.d. | n.d. | 0.035 | 0.024 |
| Perylene | n.d. | n.d. | 0.064 | n.d. | n.d. | 0.071 | n.d. | n.d. | 0.109 | n.d. | n.d. | 0.124 | n.d. | n.d. | 0.137 | 0.101 |
| Indeno [1,2,3-cd]pyrene | n.d. | n.d. | 0.008 | n.d. | n.d. | 0.009 | n.d. | n.d. | 0.014 | n.d. | n.d. | 0.018 | n.d. | n.d. | 0.019 | 0.014 |
| Dibenzo[a,h]anthracene | n.d. | n.d. | 0.308 | n.d. | n.d. | 0.345 | n.d. | n.d. | 0.527 | n.d. | n.d. | 0.222 | n.d. | n.d. | 0.286 | 0.338 |
| Benzo[ghi]perylene | n.d. | n.d. | 0.001 | n.d. | n.d. | 0.001 | n.d. | n.d. | 0.002 | n.d. | n.d. | 0.002 | n.d. | n.d. | 0.002 | 0.002 |
| Anthanthrene | n.d. | n.d. | 0.005 | n.d. | n.d. | 0.006 | n.d. | n.d. | 0.009 | n.d. | n.d. | 0.013 | n.d. | n.d. | 0.013 | 0.009 |
| Coronene | n.d. | n.d. | 0.001 | n.d. | n.d. | 0.001 | n.d. | n.d. | 0.002 | n.d. | n.d. | 0.002 | n.d. | n.d. | 0.002 | 0.002 |
| ∑ 8 EU PAH | n.d. | n.d. | 0.014 | n.d. | n.d. | 0.016 | n.d. | n.d. | 0.024 | n.d. | n.d. | 0.032 | n.d. | n.d. | 0.034 | 0.024 |
| ∑ 16 U.S. EPA PAH | 0.049 | 0.033 | 0.059 | 0.068 | 0.063 | 0.077 | 0.061 | 0.036 | 0.081 | 0.134 | 0.113 | 0.152 | 0.118 | 0.100 | 0.150 | 0.104 |
| ∑ of all 26 PAH | 0.037 | 0.024 | 0.046 | 0.051 | 0.047 | 0.060 | 0.046 | 0.027 | 0.063 | 0.102 | 0.086 | 0.119 | 0.089 | 0.076 | 0.117 | 0.081 |
References
- Xue, W.; Warshawsky, D. Metabolic activation of polycyclic and heterocyclic aromatic hydrocarbons and DNA damage: A review. Toxicol. Appl. Pharmacol. 2005, 206, 73–93. [Google Scholar] [CrossRef] [PubMed]
- International Agency for Research on Cancer (IARC). Some non-heterocyclic polycyclic aromatic hydrocarbons and some related exposures. In IARC Monographs on the Evaluation of Carcinogenic Risks to Humans; International Agency for Research on Cancer (IARC): Lyon, France, 2010; Volume 92, pp. 1–853. ISBN -13 978-92-832-1592-9. Available online: https://publications.iarc.fr/Book-And-Report-Series/Iarc-Monographs-On-The-Identification-Of-Carcinogenic-Hazards-To-Humans/Some-Non-heterocyclic-Polycyclic-Aromatic-Hydrocarbons-And-Some-Related-Exposures-2010 (accessed on 20 December 2022).
- Abdel-Shafy, H.I.; Mansour, M.S.M. A review on polycyclic aromatic hydrocarbons: Source, environmental impact, effect on human health and remediation. Egypt J. Pet. 2016, 25, 107–123. [Google Scholar] [CrossRef] [Green Version]
- Fu, P.P.; Xia, Q.; Sun, X.; Yu, H. Phototoxicity and environmental transformation of polycyclic aromatic hydrocarbons (PAHs)—Light-induced reactive oxygen species, lipid peroxidation, and DNA damage. J. Environ. Sci. Health Part C 2012, 30, 1–41. [Google Scholar] [CrossRef] [PubMed]
- REGULATION (EC) No 1907/2006 of The European Parliament and of the Council of 18 December 2006. ANNEX XVII, Column 1, Number 50. Available online: https://eur-lex.europa.eu/legal-content/EN/TXT/?uri=CELEX%3A02006R1907-20221014 (accessed on 20 November 2022).
- Hoyer, S.; Kroll, L.; Lippert, K.; Seidel, A. A Long-Term Study on the Content of Polycyclic Aromatic Hydrocarbons in Rubber from End-of-Life Tires of Passenger Cars and Trucks. Materials 2022, 15, 7017. [Google Scholar] [CrossRef] [PubMed]
- Geiss, O.; Senaldi, C.; Bianchi, I.; Lucena, A.; Tirendi, S.; Barrero-Moreno, J. A fast and selective method for the determination of 8 carcinogenic polycyclic aromatic hydrocarbons in rubber and plastic materials. J. Chromatogr. A 2018, 1566, 13–22. [Google Scholar] [CrossRef] [PubMed]
- German Federal Institute for Risk Assessment, BfR. PAK in Verbrauchernahen Produkten Müssen so Weit wie Möglich Minimiert Werden. Aktualisierte Stellungnahme 2009, Nr. 025/2009. p. 3. Available online: https://mobil.bfr.bund.de/cm/343/pak_in_verbrauchernahen_produkten_muessen_so_weit_wie_moeglich_minimiert_werden.pdf (accessed on 20 December 2022).
- Bartsch, N.; Heidler, J.; Vieth, B.; Hutzler, C.; Luch, A. Skin permeation of polycyclic aromatic hydrocarbons: A solvent-based in vitro approach to assess dermal exposures against benzo[a]pyrene and dibenzopyrenes. J. Occup. Environ. Hyg. 2016, 13, 969–979. [Google Scholar] [CrossRef] [PubMed]
- Geiss, O.; Bianchi, I.; Senaldi, C.; Lucena, A.; Tirendi, S.; Barrero-Moreno, J. Skin surface film liquid as new migration medium for the determination of PAHs released from rubber containing consumer goods. Polycycl. Aromat. Compd. 2020, 40, 553–562. [Google Scholar] [CrossRef] [Green Version]
- Barrero-Moreno, J.; Senaldi, C.; Bianchi, I.; Geiss, O.; Tirendi, S.; Folgado de Lucena, A.; Barahona, F.; Mainardi, G.; Leva, P.; Aguar-Fernandez, P. Migration of Polycyclic Aromatic Hydrocarbons (PAHs) from Plastic and Rubber Articles; JRC111476; EUR 29282 EN, Publications Office of the European Union: Luxembourg, 2018; ISBN 978-92-79-89749-8. [Google Scholar] [CrossRef]
- Keith, L. The Source of U.S. EPA’s sixteen PAH priority pollutants. Polycycl. Aromat. Compd. 2015, 35, 147–160. [Google Scholar] [CrossRef]
- Grimmer, G.; Jacob, J.; Naujack, K.-W. Atmospheric emission of polycylic aromatic hydrocarbons in sampling areas of the German enviromental specimen bank. Method for the precise measurement of gaseous and particle-associated polycyclic aromatic hydrocarbons in the sub-nanogram range using deuterated internal standards. Chemosphere 1997, 34, 2213–2226. [Google Scholar] [CrossRef]
- European Tyre & Rubber Manufacturers’ Association (ETRMA). Replacement of Highly Aromatic Oils in Tyres. ETRMA Notification 2010. Available online: https://www.etrma.org/wp-content/uploads/2019/09/20100712-etrma-qanda-replacement-of-ha-oils-in-tyres.pdf (accessed on 20 December 2022).
- Ptak, S.; Krasodomski, W.; Jakóbiec, J.; Antosz, A. Modified TDAE petroleum plasticiser. Open Chem. 2021, 19, 916–928. [Google Scholar] [CrossRef]
- German Federal Institute for Risk Assessment (BfR). Krebserzeugende Polyzyklische Aromatische Kohlenwasserstoffe (PAK) in Verbraucherprodukten Sollen EU-Weit Reguliert Werden. Stellungnahme Nr. 032/2010. 2010. Available online: https://mobil.bfr.bund.de/cm/343/krebserzeugende_polyzyklische_aromatische_kohlenwasserstoffe_pak_in_verbraucherprodukten_sollen_eu_weit_reguliert_werden.pdf (accessed on 20 December 2022).
- Federal Institute for Occupational Safety and Health (BAuA). Proposal for a Restriction. Annex XV Restriction Report 2010. Available online: https://www.bfr.bund.de/cm/343/pak_annex_XV_restriction_report_proposal_for_a_restriction.pdf (accessed on 20 December 2022).
- Weyssenhoff, A.; Opala, M.; Koziak, S.; Melnik, R. Characteristics and investigation of selected manufacturing defects of passenger car tires. Transp. Res. Procedia 2019, 40, 119–126. [Google Scholar] [CrossRef]
- Hoyer, S. Novel Milling Technology for the Recycling of Elastomers and Analysis of Process-Related Properties. Ph.D. Thesis, Chemnitz University of Technology, Chemnitz, Germany, 2014. Available online: https://nbn-resolving.org/urn:nbn:de:bsz:ch1-qucosa-231846 (accessed on 20 December 2022).
- Holland, G.W.; Hu, B.; Holland, S. Surface area measurement of ground rubber using the B.E.T. Surface Area Analyzer. The Free Library 1994. Available online: https://www.thefreelibrary.com/Surface%20area%20measurement%20of%20ground%20rubber%20using%20the%20B.E.T.%20surface...-a015410478 (accessed on 20 December 2022).
- German Institute for Standardization (DIN). Technical Specification CEN/TS 17510:2020: Materials Obtained from End-of-Life tyres—Determination of the Specific Surface Area of Powders—Method Based on Krypton Adsorption. Beuth Verlag: Berlin, Germany. Available online: https://www.beuth.de/de/vornorm/din-cen-ts-17510/321618768 (accessed on 20 December 2022).
- Sing, K.S.W. Adsorption methods for the characterization of porous materials. Adv. Colloid Interface Sci. 1998, 76–77, 3–11. [Google Scholar] [CrossRef]
- Pehlken, A.; Müller, D.H. Using information of the separation process of recycling scrap tires for process modelling. Resour. Conserv. Recycl. 2009, 54, 140–149. [Google Scholar] [CrossRef]
- Kroll, L.; Hoyer, S.; Klaerner, M. Production technology of cores for hybrid laminates containing rubber powder from scrap tyres. Procedia Manuf. 2018, 21, 591–598. [Google Scholar] [CrossRef]


| Material | Parameter | Naph-thalene | Acenaphthylene | Acenaph-thene | Fluo-rene | Phe-nan-threne | An-thra-cene | Fluo-ranthe-ne | Py-rene | Sum ∑ |
|---|---|---|---|---|---|---|---|---|---|---|
| ELT_100 | Arithmetic mean | 0.132 1 | 0.031 | 0.007 2 | 0.008 | 0.042 | 0.002 | 0.019 | 0.046 | 0.267 |
| Margin of error e | 0.172 1 | 0.021 | 0.000 2 | 0.004 | 0.023 | 0.001 | 0.002 | 0.024 | 0.295 | |
| Standard deviation s | 0.069 1 | 0.009 | 0.000 2 | 0.002 | 0.009 | 0.001 | 0.001 | 0.010 | 0.119 | |
| Maximum value | 0.173 | 0.040 | 0.007 | 0.010 | 0.053 | 0.002 | 0.020 | 0.057 | 0.337 | |
| PUR_90 | Arithmetic mean | 0.154 | 0.040 | 0.008 2 | 0.009 | 0.045 | 0.001 | 0.023 | 0.072 | 0.350 |
| Margin of error e | 0.069 | 0.014 | 0.005 2 | 0.009 | 0.049 | 0.001 | 0.022 | 0.059 | 0.097 | |
| Standard deviation s | 0.028 | 0.006 | 0.002 2 | 0.003 | 0.020 | 0.001 | 0.009 | 0.024 | 0.039 | |
| Maximum value | 0.173 | 0.046 | 0.010 | 0.013 | 0.068 | 0.002 | 0.033 | 0.099 | 0.393 | |
| TPU_60 | Arithmetic mean | 0.112 | 0.018 | 0.007 3 | 0.007 | 0.026 | 0.001 | 0.009 | 0.028 | 0.204 |
| Margin of error e | 0.139 | 0.009 | 0.000 3 | 0.004 | 0.036 | 0.001 | 0.014 | 0.044 | 0.195 | |
| Standard deviation s | 0.056 | 0.004 | 0.000 3 | 0.002 | 0.014 | 0.001 | 0.006 | 0.018 | 0.079 | |
| Maximum value | 0.163 | 0.022 | 0.007 | 0.009 | 0.043 | 0.002 | 0.016 | 0.049 | 0.267 | |
| PUR_36 | Arithmetic mean | 0.126 | 0.029 | 0.011 | 0.014 | 0.060 | 0.002 | 0.015 | 0.046 | 0.304 |
| Margin of error e | 0.135 | 0.019 | 0.005 | 0.010 | 0.035 | 0.001 | 0.013 | 0.043 | 0.163 | |
| Standard deviation s | 0.054 | 0.008 | 0.002 | 0.004 | 0.014 | 0.001 | 0.005 | 0.017 | 0.066 | |
| Maximum value | 0.184 | 0.038 | 0.013 | 0.019 | 0.076 | 0.002 | 0.021 | 0.066 | 0.379 | |
| NR_36 | Arithmetic mean | 0.146 | 0.051 | 0.008 | 0.010 | 0.056 | 0.002 | 0.021 | 0.059 | 0.354 |
| Margin of error e | 0.041 | 0.034 | 0.000 | 0.001 | 0.006 | 0.000 | 0.014 | 0.037 | 0.121 | |
| Standard deviation s | 0.016 | 0.014 | 0.000 | 0.001 | 0.003 | 0.000 | 0.006 | 0.015 | 0.049 | |
| Maximum value | 0.165 | 0.059 | 0.008 | 0.011 | 0.058 | 0.002 | 0.025 | 0.069 | 0.395 |
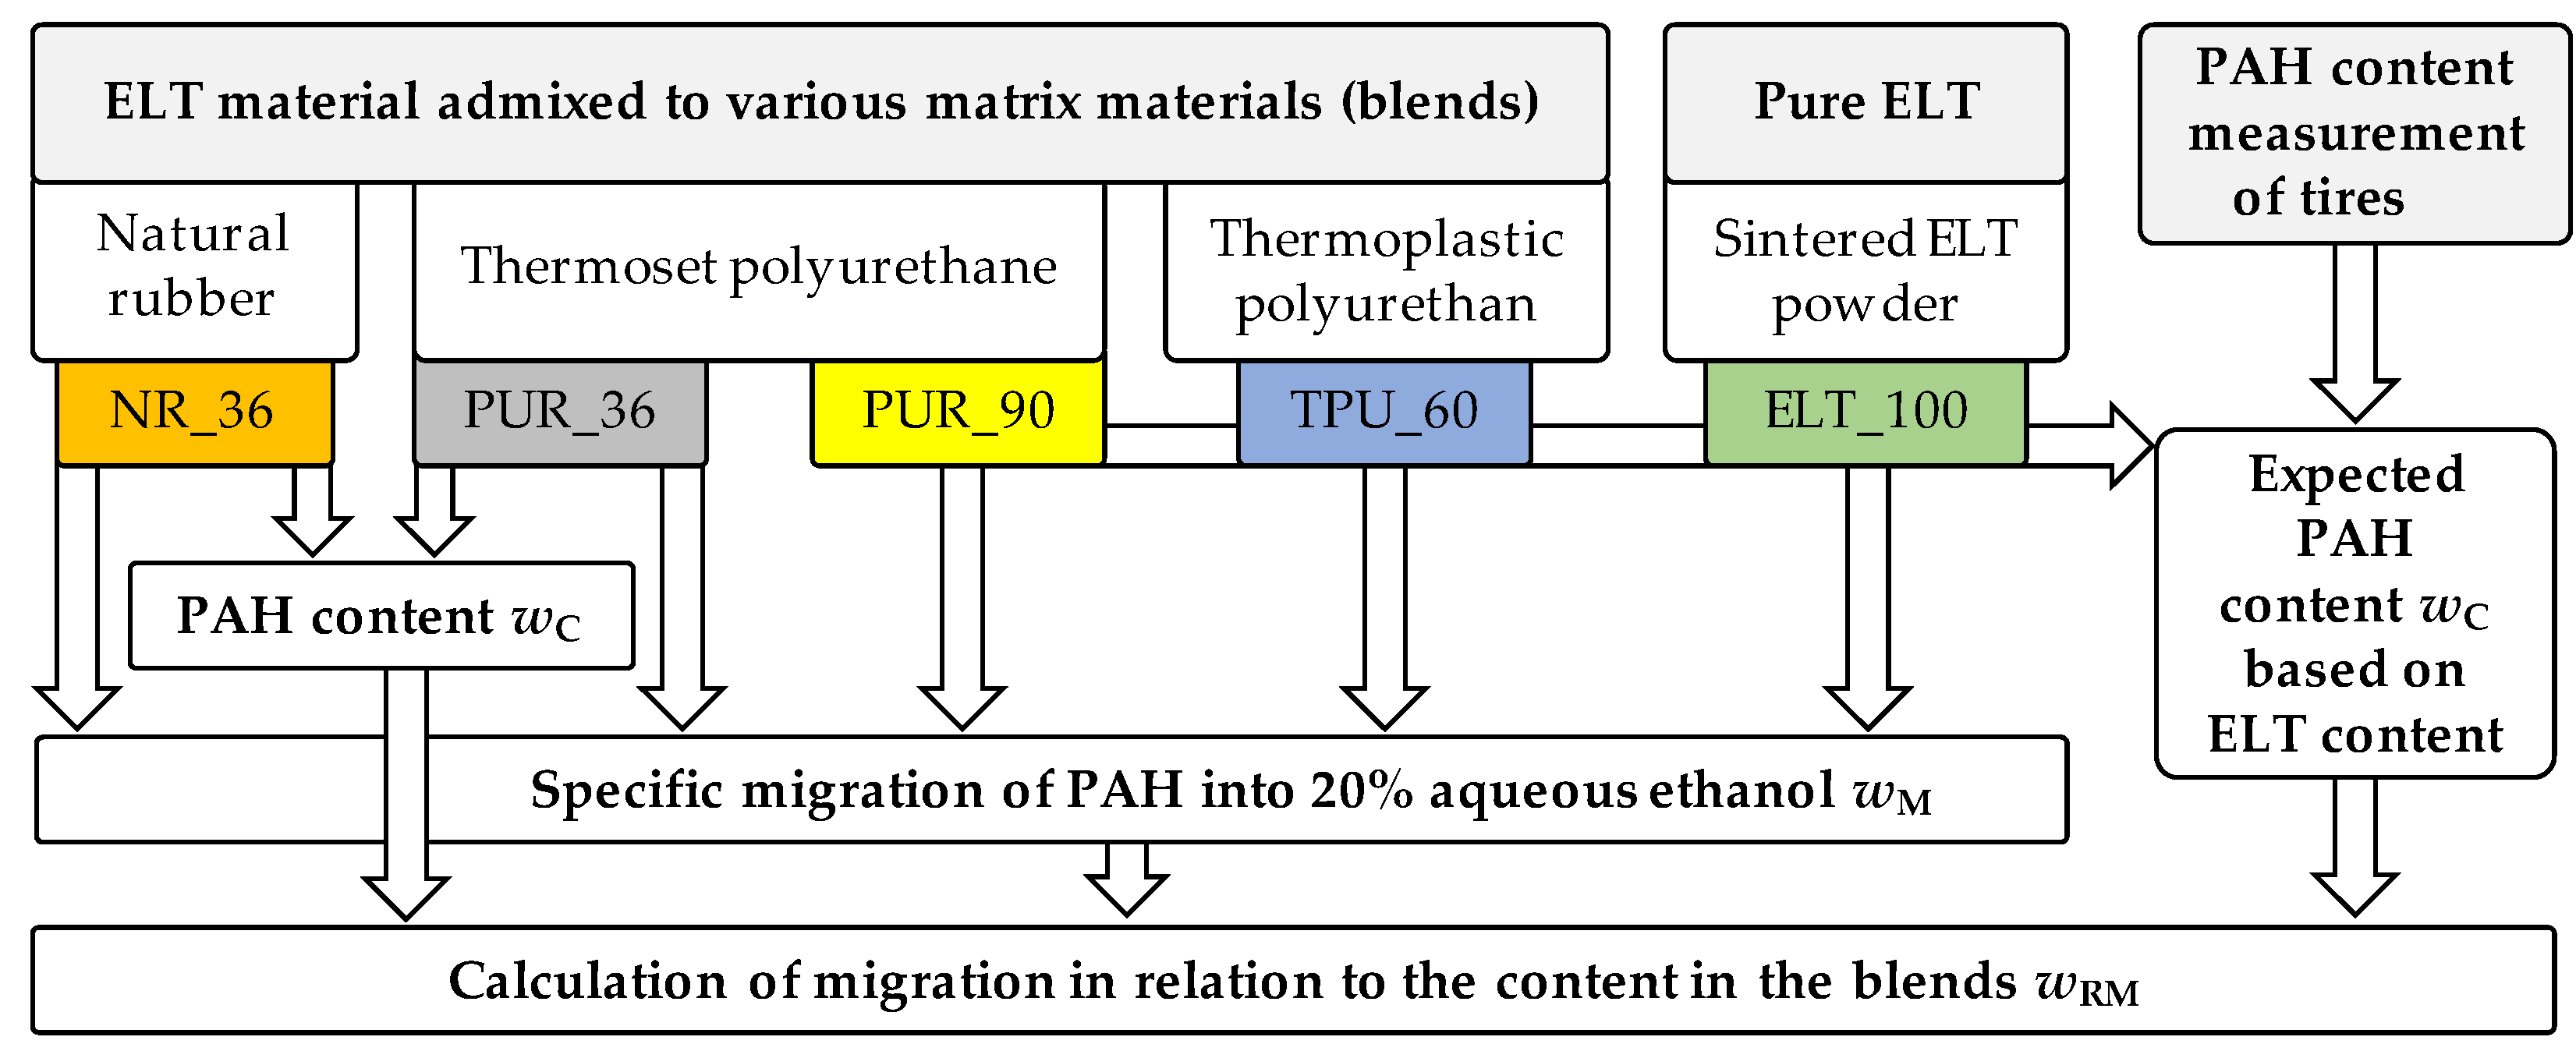
| Material | Composition and Properties |
|---|---|
| ELT_100 | ELT content wELT: 100% (powder, K0204), produced by HPHT sintering Density: 1.15 g/cm3 |
| PUR_90 | Thermoset matrix (polyurethane, aromatic polyether, 2C system) ELT content wELT: 90% (granulates, W1035); 10% polyurethane Density: 1.14 g/cm3 |
| PUR_36 | Thermoset matrix (polyurethane, aromatic polyether, 2C system) ELT content wELT: 36% (powder, K0204); 32% kaolin, 30% polyurethane, 2% Zeolite Density: 1.38 g/cm3 |
| TPU_60 | Thermoplastic matrix, thermoplastic polyurethane (TPU, polyether) ELT content wELT: 60% (powder, K0204); 40% TPU (Elastollan 1170 A) Density: 1.12 g/cm3 |
| NR_36 | Elastomer matrix (natural rubber) 37% aluminum hydroxide (Apyral 40), 36% ELT (powder, K0204), 16% natural rubber (SVR CV 60), 5.5% carbon black (SPHERON® SO-LP) Density: 1.37 g/cm3 |
Disclaimer/Publisher’s Note: The statements, opinions and data contained in all publications are solely those of the individual author(s) and contributor(s) and not of MDPI and/or the editor(s). MDPI and/or the editor(s) disclaim responsibility for any injury to people or property resulting from any ideas, methods, instructions or products referred to in the content. |
© 2022 by the authors. Licensee MDPI, Basel, Switzerland. This article is an open access article distributed under the terms and conditions of the Creative Commons Attribution (CC BY) license (https://creativecommons.org/licenses/by/4.0/).
Share and Cite
Hoyer, S.; Kroll, L.; Fischer, B.; Pisulla, K.; Seidel, A. Release of PAH from Secondary Products Made from End-of-Life Tire Recyclates into 20% Aqueous Ethanol as Assessment of Human Dermal Absorption. Recycling 2023, 8, 6. https://doi.org/10.3390/recycling8010006
Hoyer S, Kroll L, Fischer B, Pisulla K, Seidel A. Release of PAH from Secondary Products Made from End-of-Life Tire Recyclates into 20% Aqueous Ethanol as Assessment of Human Dermal Absorption. Recycling. 2023; 8(1):6. https://doi.org/10.3390/recycling8010006
Chicago/Turabian StyleHoyer, Stefan, Lothar Kroll, Benny Fischer, Kai Pisulla, and Albrecht Seidel. 2023. "Release of PAH from Secondary Products Made from End-of-Life Tire Recyclates into 20% Aqueous Ethanol as Assessment of Human Dermal Absorption" Recycling 8, no. 1: 6. https://doi.org/10.3390/recycling8010006