Article

Use of Biomass Ash in Reinforced Clayey Soil: A Multiscale Analysis of Solid-State Reactions

1
Dipartimento di Fisica e Geologia, Università degli Studi di Perugia, 06121 Perugia, Italy
2
Dipartimento di Chimica, Biologia e Biotecnologie, Università di Perugia, 06121 Perugia, Italy
3
Dipartimento di Ingegneria, Università degli Studi di Perugia, 06121 Perugia, Italy
4
Centro di Ricerca sulle Biomasse CRB-CIRIAF, 06129 Perugia, Italy
5
Dipartimento di Giurisprudenza, Università Telematica Pegaso, 80132 Napoli, Italy
*
Author to whom correspondence should be addressed.
Recycling 2023, 8(1), 5; https://doi.org/10.3390/recycling8010005
Submission received: 28 October 2022 / Revised: 23 December 2022 / Accepted: 24 December 2022 / Published: 29 December 2022
(This article belongs to the Special Issue Sustainable Materials from Waste and Renewable Sources)

Abstract

:
Clayey soils are treated with binding agents to improve their mechanical properties, as these soils are widely used in construction. The production of binding agents is an energy-intensive process and emits significant amounts of CO2. In addition, the interest in recycling industry waste materials has increased, and the management of significant waste from biomass power plants remains an issue. We used three biomass ashes derived from pellet, olive, and grapevine combustion as stabilizing agents of a clayey soil. The mechanical effects of the treatment on clay-ash mixtures were evaluated using confined compressive tests. The mixtures’ chemo-mineralogical evolution was evaluated through X-ray powder diffraction and quantitative Rietveld analysis, Fourier transform infrared spectroscopy (FT-IR), and energy-dispersive X-ray spectroscopy coupled with scanning electron microscopy (EDS-SEM). The FT-IR spectra showed an evolution of the Si-O-Si/Al features, with shifting band positions due to polymerization of the tetrahedral units. The EDS-SEM analysis showed an evolution of the Ca/Si distribution and the growth of pozzolanic reaction products, such as C-S-H nanocrystals and gels. This evidence confirms that the pozzolanic reaction occurs by dissolution of clay minerals and/or the amorphous phase of the ash, which affects the macroscopic behavior of clayey soils in terms of stiffening and strengthening, as confirmed by mechanical tests, albeit these effects are non-homogenous and continuous.

1. Introduction

The poor physical and mechanical characteristics of clayey soils are critical issues in geotechnical engineering. Besides the problems this creates for foundation structures, high plasticity, swelling behavior and high compressibility make these soils unsuitable, in their natural state, as construction materials. Nonetheless, quarry materials are becoming scarce, and they are not considered environmentally friendly as the expansion of quarries implies diverse environmental problems and quarry sites are often located far from construction sites, consequently increasing costs and environmental concerns [1]. For these reasons, clay-rich soils are often treated with chemical agents able to improve their physical and mechanical characteristics while reacting with soil particles. Portland cement and lime are among the most frequently used binders, and their stabilization mechanisms have been widely investigated [2,3,4,5,6,7,8,9,10]. A major concern with these stabilizers is their very significant environmental penalty, as the production process for these materials is energy-intensive and emits significant amounts of greenhouse gases [1,11]. These concerns emphasize the urgent need for alternative stabilizers, preferably individuated among by-products, within the framework of the auspicated circular economy. Biomass fly ashes are the residue produced by the combustion of plant materials and have a wide range of compositions. Biomasses generated as waste material by industries can be classified into two types: biomass bottom ashes and biomass fly ashes [12]. The use of biomass for energy production to reduce dependence on traditional fuels has increased in recent years [13] and will continue to do so in the near future. Therefore, the amount of combustion waste has increased, producing a new discard that has been re-used with encouraging results in agriculture and concrete manufacture [14,15]. Recently, different kinds of biomass ashes have also been investigated, with varying results, as possible clayey soil binders [16,17,18].
Calcium silicate hydrates (C-S-Hs) are the main constituents of hydrated cement systems, which have been widely explored in industry and academia due to their low cost and high strength, generated from the hydration of clinker phases [19]. In recent years, several waste materials, primarily those formed by amorphous silica, have been added to the traditional clinker Portland to produce reinforced concrete, which has a higher strength compared to traditional concrete [20]. In fact, by combining residual lime with amorphous silica, an increase in the development of C-S-H phases through the pozzolanic reaction can be observed. Similarly, with the aim of creating “re-enforced clayey soils”, some recent studies have been devoted to improving the technical properties of clayey soils by using fly ashes in a highly alkaline environment, where the dissolution of the aluminosilicate source from clayey soils and/or fly ashes can lead to the formation of calcium silicate hydrate (C-S-H) and calcium aluminum silicate hydrate (C-A-S-H) compounds [21,22,23]. The effect this has on the soil’s mechanical characteristics is an increase in stiffness, a reduction in compressibility and a reduction in plasticity and swelling characteristics [24].
How this mechanism occurs is not well understood, and thus this work focused on the investigation of the solid-state reaction occurring in a plastic clayey soil when different kinds of biomass ashes are added. The ashes used were wastes from the combustion of both wood pellets and different plants, which are widely utilized in Italy as an important part of production in the agri-food sector (oil and wine). Among the different analyzed ashes previously characterized by Comodi et al. [25] are those that, based on their chemo-mineralogical composition, seem to be more suitable as binders, including calcium, silica and alumina sources. When the presence of the ash itself determined a highly alkaline environment, an attempt was made to use the ash as a stabilization agent without the addition of any alkali activator. In the other cases, the ashes were activated by a sodium-based alkaline solution. The mechanical effects of the treatment were evaluated by means of confined compressive tests at different curing times, namely 1, 7, 14 and 28 days. The evolution of the clay–ash mixtures from a chemo-mineralogical point of view was evaluated by means of X-ray powder diffraction (XRPD) data and Rietveld spectra analysis to determine their mineralogical quantitative composition, as well as amorphous content. Fourier transform infrared spectroscopy (FT-IR) was used to collect high-resolution spectral data over a wide spectral range (from 300 to 4000 cm-1), and to determine the structural and/or chemical changes in functional groups, namely to identify any structural or chemical changes that occurred in the samples during curing. In addition, field emission scanning electron microscopy with an energy dispersion scanning system (Fe-SEM-EDS) allowed us to observe the micro-nano textural characteristics of the mixtures and their chemical composition evolution at different times.
In the present work, a multidisciplinary investigation on the effects of the use of biomasses ashes as alternative binders on a clayey soil is reported and discussed. The results obtained provide further evidence for the suitability of biomass ash as a possible sustainable alternative binder for clay soils, highlighting the link between chemical and physical trends, microstructural changes and the mechanical response of the mixture.

2. Results

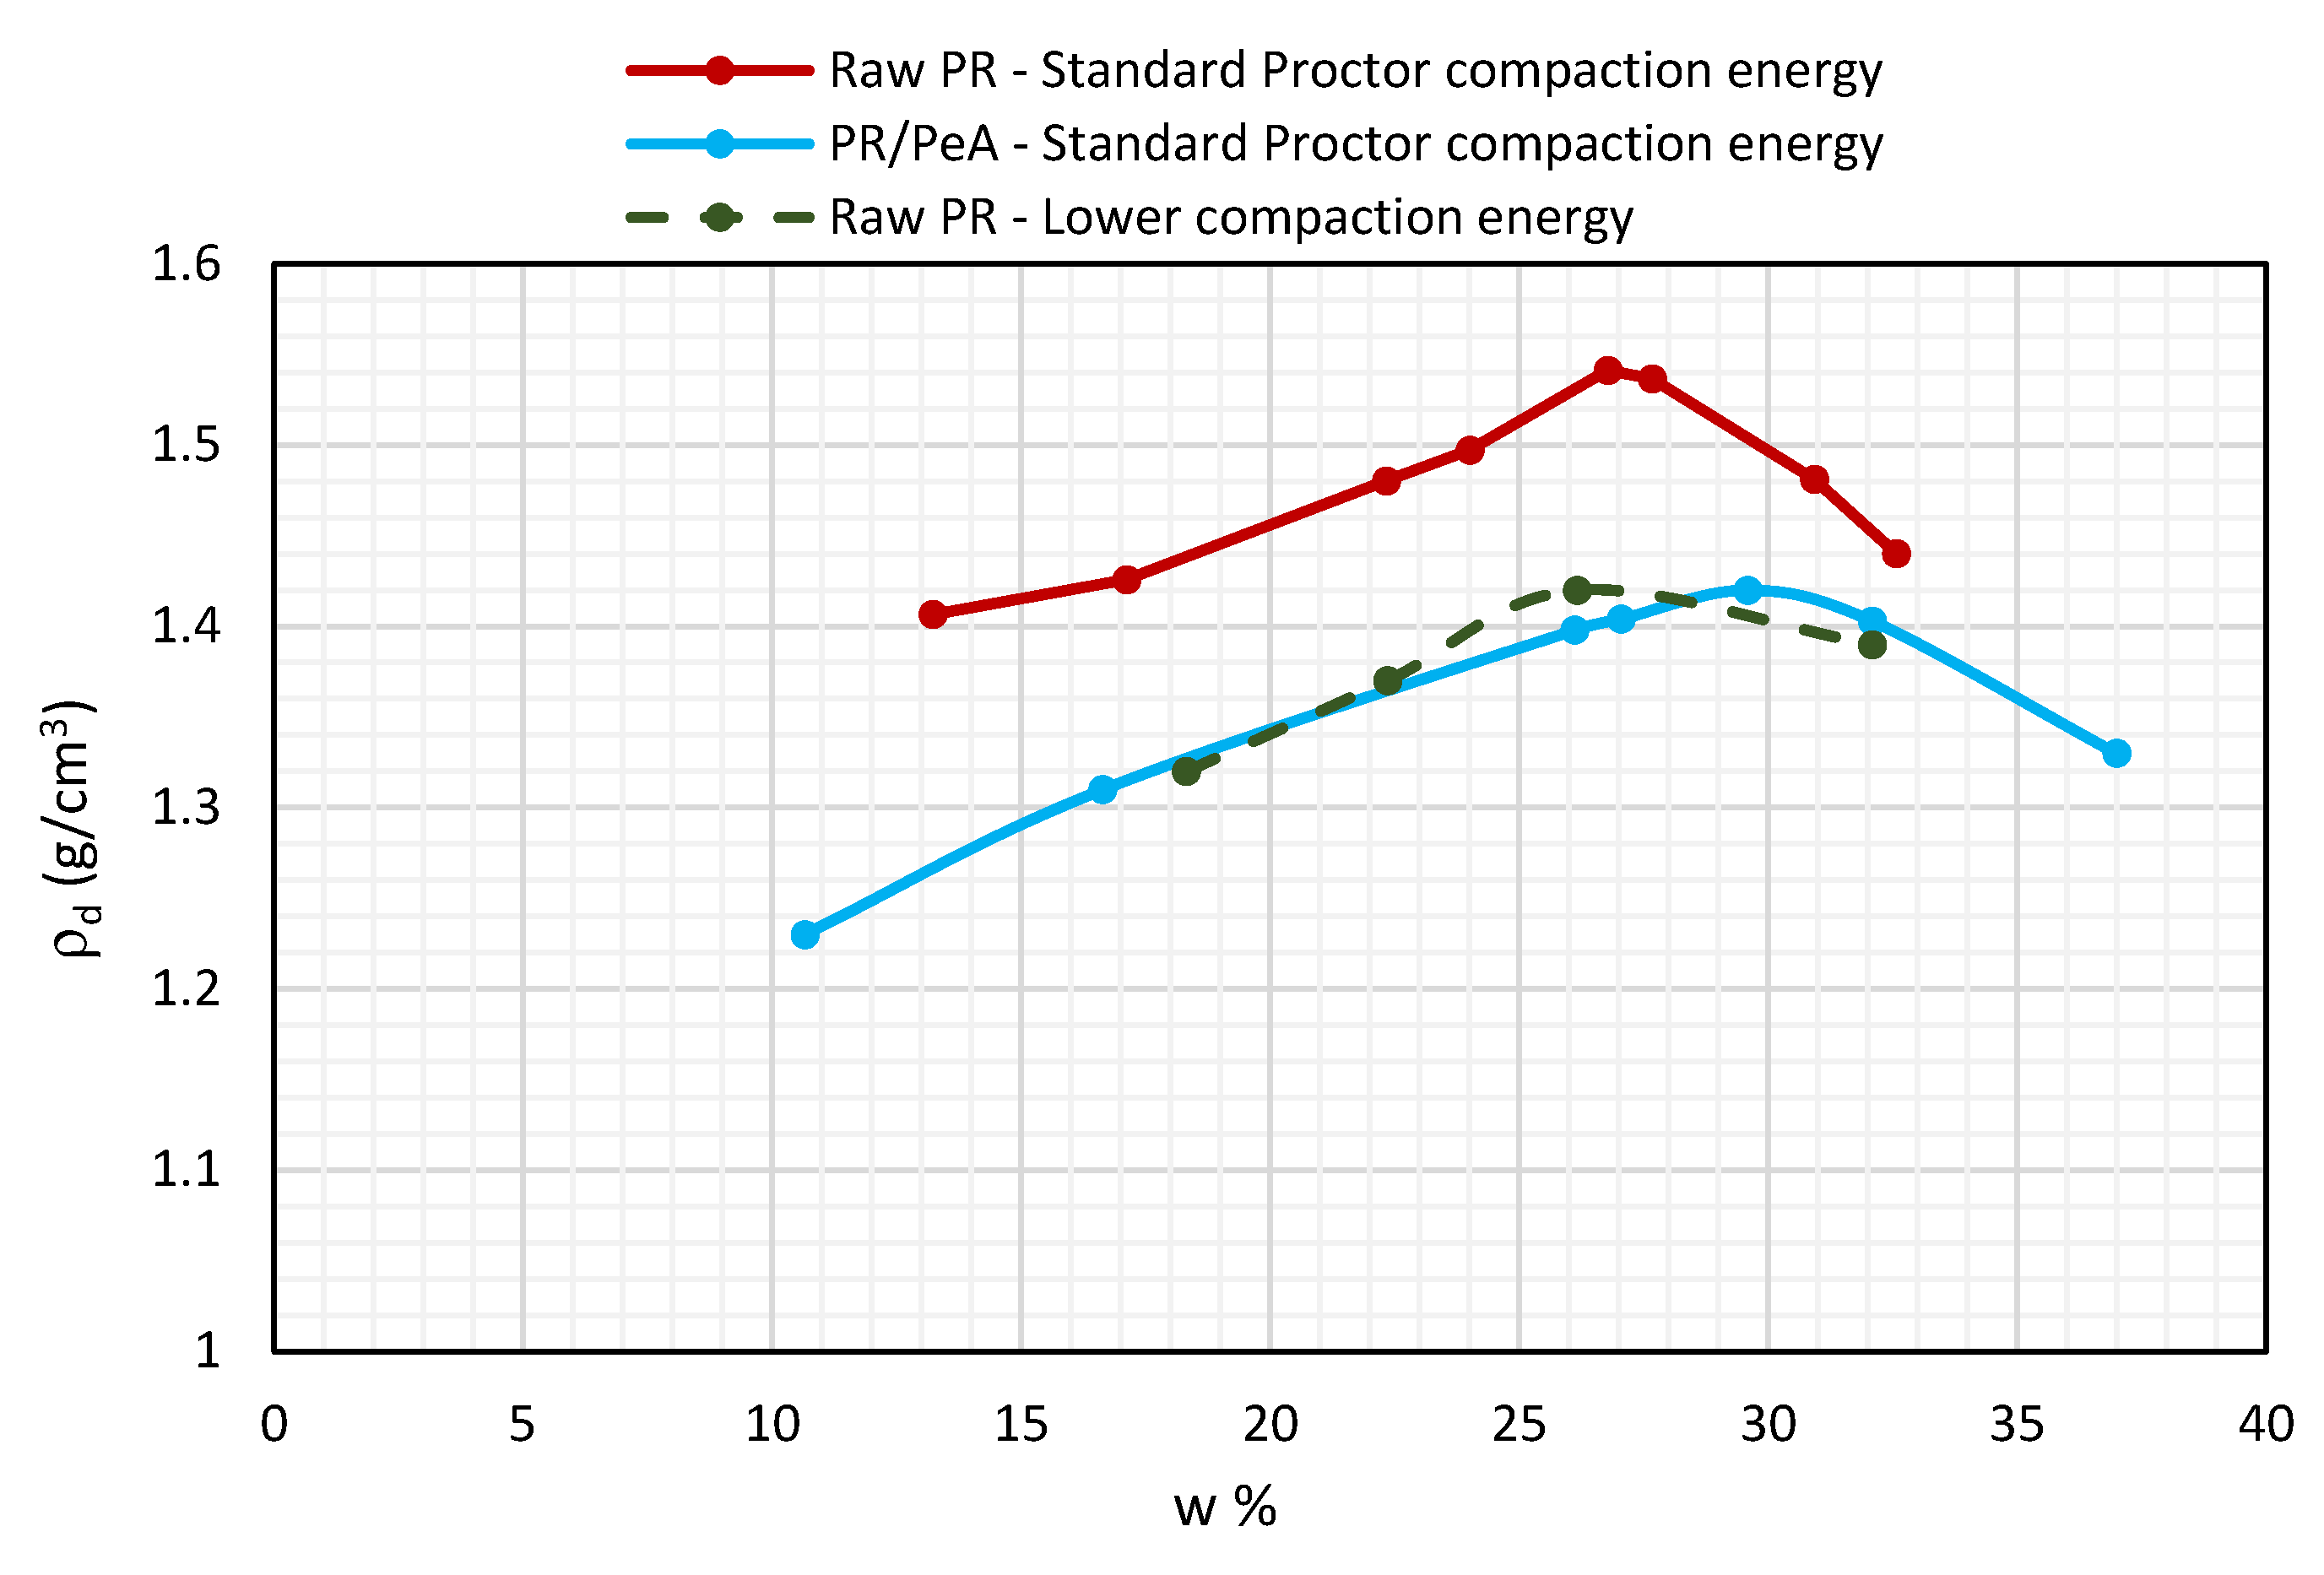
2.1. Geotechnical Analyses

The results of the Eades and Grim test performed on PR/lime and PR/ash mixtures are shown in Table 1.
The results show that the minimum lime amount required to enter the stabilization field is 6% of dry weight of soil. As for the ashes, all of them created an alkaline environment, but only PeA, when added in an amount equal to 20% wt, brought the pH above 12.4.
Based on the Eades and Grim results, four ash–clay mixtures were created. Each ash was added to the PR soil in an amount equal to 20 wt% soil. When necessary, an alkaline activator was used to increase the ash–soil mixture alkalinity. Following Vitale et al. [24] and Coudert et al. [11], a sodium silicate solution with a SiO2/Na2O mass ratio equal to 1.7 (GEOSIL 34417 supplied by the Woelnner group, hereafter indicated as GEOS) was used. Following the indications of Vitale et al., [24], a GEOS activator was added to PR/GrA and Pr/OlA in an amount equal to 50 wt% of the previously added ash to increase alkalinity. A mixture containing the same amounts of PeA and GEOS was also created for ease of comparison of the effects of the three added ashes. The mixtures created are listed and named below:
  • PR/PeA (PR soil with added wood pellet ash);
  • PR/PeA/GEOS (PR soil with added wood pellet ash and activator);
  • PR/OlA/GEOS (PR soil with added olive pruning ash and activator);
  • PR/GrA/GEOS (PR soil with added grapevine pruning ash and activator).
The curves derived from the formerly described compaction procedure performed on raw PR soil and the PR/PeA mixture are shown in Figure 1.
The purple and blue curves (Figure 1) were obtained for raw PR soil and the PR/PeA mixture, respectively, using the compaction energy of a standard proctor test (595 kJ/m3; 14 blows from a height of 0.20 m). These curves (Figure 1) showed that the compaction procedure was less efficient for the PR/PeA mixture (blue curve in Figure 1) than for raw PR soil (purple curve in Figure 1). In fact, the maximum dry density was higher and the optimum water content was lower in raw PR soil than in the PR/PeA mixture, and the curves did not intersect. We then repeated the test on raw PR soil with a lower compaction energy. Raw PR soil samples were compacted with the same equipment, but the mass was allowed to drop from a height of 0.15 m for 9 consecutive blows; this scheme corresponded to an energy of approximately 287 kJ/m3 according to the compacting energy equation. A new raw PR compaction curve was generated (green curve in Figure 1), which crossed the PR/PeA curve (blue curve). This allowed us to determine the water content (28%) at which it was possible to achieve two samples with the same dry density (ρd = 1.41 g/cm3), corresponding to e = 0.92. The raw PR soil sample with these compaction characteristics is hereafter indicated as PR-0.92.
The same compaction procedure was used for PR/ash/GEOS mixtures maintaining the same water content (28%) and the compaction energy of a standard Proctor test (595 kJ/m3). The test results showed that compaction was less efficient for these mixtures, so the highest dry density after compaction was ρd = 1.320 g/cm3, corresponding to a lower e of 1.1. To make the comparison of PR/ash/GEOS mixtures with raw PR soil possible, it was necessary to compact another raw PR soil sample with the same void ratio as the PR/ash/GEOS samples. Another sample of untreated material, still with a water content w = 28%, was therefore prepared by reducing the compaction energy. It was found that by reducing the compaction energy to 126 kJ/m3 (4 blows from a height of 0.15m), the same e as that obtained for PR/ash/GEOS mixtures could be achieved (e = 1.1). The raw PR soil sample with these compaction characteristics is hereafter indicated as PR-1.1.
Compression tests were performed on the PR-0.92 and PR/PeA mixtures, both of which had the same water content (28%) and void ratio (0.92). The variables affecting compressibility were therefore reduced, and the results could be compared. The results of the compression tests performed on PR/ash/GEOS mixtures (w = 28% and e = 1.1) were compared with those obtained for PR-1.1, which had the same physical characteristics. Table 2 lists the characteristics of all samples tested for compressibility and the results of compression tests are shown in Figure 2.
As expected, the initial response of raw PR soil on first loading (σ < 100 kPa) was stiffer for PR-0.92 (Figure 2a) than for PR-1.1 (Figure 2b–d). For vertical stresses higher than approximately 100 kPa, large volumetric strains occurred in all raw samples, with the better-compacted one (Figure 2a) approaching a single normal compression line at a vertical stress of approximately 200 kPa and the less-compacted one (Figure 2b–d) reaching a normal compression line at a vertical stress of approximately 100 kPa. The initial response on first loading was characterized by gradual yield as the vertical stress increased, with significant volume changes even before major yield.
A significant reduction in compressibility was recorded in all the treated samples after the shortest curing time (1 day). This is likely due to mere mechanical effects, induced by the addition of a relevant amount (20 wt%) of a material (ashes) that is less compressible than the raw clay to PR soil. Nonetheless, for longer curing times, the mechanical evolution differed among the mixtures.
For the sample treated with PeA only (Figure 2a), a progressive increase in stiffness and a decrease in compressibility occurred with increasing curing time, up to 14 days. No further improvements were observed for longer curing times (28 days). The maximum reduction in axial deformation was approximately 12% at the highest load (1600 kPa).
Significant differences in the overall effects of treatment and the evolution of compressibility characteristics while increasing curing time were observed for mixtures containing GEOS. The three analyzed blends differed from each other only with regard to ash nature, as all of them had an initial water content w = 28%, an initial e = 1.1, and an ash amount of 20 wt% PR soil. These common initial characteristics allowed us to compare the results.
The compressibility of PR/PeA/GEOS increased from 1 day of curing up to 14 days of curing and decreased again after 28 days of curing, so the reaction to loading was the same for samples cured for 1 and 28 days (Figure 2b). In this case, a more pronounced reduction in axial deformation was recorded at a load of 1600 kPa, being slightly higher than 11%.
The PR/OlA/GEOS samples maintained virtually the same characteristics with increasing curing time (Figure 2c). The reduction in axial yield obtained for this mixture was higher than that of all other blends, with a reduction in compressibility close to 20% at the highest load (1600 kPa).
For the PR/GrA/GEOS mixture, compressibility was highest at the shortest curing time (1 day) and lowest after 7 days of curing (Figure 2c), with an overall reduction of approximately 15% in comparison to the raw sample. It is worth noting that this was the only mixture for which the axial deformation tended to increase when the curing time exceeded 7 days, up to 28 days of curing. Nonetheless, although the compressibility of this blend varied throughout the curing process, the compressibility of this blend after more than 1 day of curing was always lower than that recorded after 1 day.
It is worth mentioning that in other studies in which compression tests were used to investigate mechanical improvements of clays treated with alkali-activated ashes [23], a reduction in the compressibility of treated materials comparable to that observed in this work was detected. Vitale et al. [23] also showed that the evolution of mechanical behavior of the treated material is different depending on the mineralogy of the added fly ashes.

2.2. XRPD and Electron Microscopy Analyses on PR/ash Mixtures

Figure 3, Figure 4 and Figure 5 show Rietveld refinement of the XRPD spectra of PR/PeA/GEOS, PR/OlA/GEOS, and PR/GrA/GEOS samples, respectively, with the addition of the external standard (crystalline silicon). In each graph, the blue patterns represent the collected data and the red lines represent the calculated profile. The theoretical peak position of each refined phase is below the horizontal lines. The green profile represents the difference between the measured and the refined profile and is indicative of the quality of the fit. Agreement indexes, Rwp, Rp, and Rexp, were reported for each pattern. The phases detected in all samples were calcite, dolomite, quartz, and phyllosilicates (mainly illite, muscovite, and chamosite). Oligoclase was detected in PR/GrA/GEOS and PR/PeA/GEOS, while minor phases (albite, reichenbachite, hydroxylapatite, and phosphoferrite) were detected in PR/OlA/GEOS. The X-ray diffraction profiles and quantitative mineralogical compositions of the selected biomass ashes revealed an amorphous content equal to 47.6 wt% for the OlA sample and an amount of amorphous content equal to 79.5 and 72.1 wt% for the GrA and PeA samples, respectively [25].
The characteristics of the XRPD spectra showed that all the compacted treated and untreated mixtures contained well-organized clayey layers due to the presence of sharp and regular well-organized reflection peaks. After the saturation procedure, no peak shifts of clay minerals were identified, so we can exclude the presence of swelling clays.
After 28 days of curing, no crystalline secondary phases were detected. The amorphous content, the presence of which is attributed to both amorphous raw soil and ashes, increased after 7 days of curing for the PR/PeA/GEOS and PR/OlA/GEOS samples at the expense of the phyllosilicate content, which was mainly composed of illite (Figure 6a,b). However, in the PR/GrA/GEOS sample (Figure 6c), the phyllosilicate content remained stable, suggesting that illite is not involved in the pozzolanic reactions, which are likely to occur at the expense of a high amorphous content of GrA ash (~79 wt%). The nonlinear behavior of both phyllosilicate and amorphous content can be explained by the complexity of the system in terms of (i) the diverse amorphous content of the selected ashes and thus a different availability of Si for pozzolanic reactions, which can also result from the more tenacious clays to be dissolved, and (ii) the availability of water for the formation of cementitious materials, as an identical water content was ensured in all cases.
The results of QPA are reported in Figure 6. The abundance of the crystalline and amorphous phase wt% was calculated using the Rietveld method for the PR/PeA/GEOS, PR/OlA/GEOS, and PR/GrA/GEOS samples cured for 0 to 28 days.
Fe-SEM photos of raw clayey soil mixed with biomass ash samples at different magnifications are shown in Figure 7. Images of raw soil show clay minerals with typical lamellar structures stacked on top of each other and semi-spherical agglomerates of added biomass fly ashes. Figure 8 shows the mixtures after 28 days of treatment.
The surfaces of samples were clearly modified with a sort of gel that coated the lamellar morphology of pristine clay. Although the gel coating was not as evident in the PR/GrA/GEOS sample (Figure 8c) as in the other samples, EDS analysis showed an increase in the amount of calcium on the surface of the clay lamellae. It was noted that the lack of an evident coating on the surface corresponded to higher compressibility after 28 days of curing. In fact, PR/Gra/GEOS was the only mixture in which the compressibility after 28 days was not the lowest recorded after 7 days of curing (Figure 2d).
EDS semi-quantitative analyses showed that the newly formed surface coating had a CaO content of approximately 15% at 28 days of curing in all mixtures (Figure 8), a higher amount with respect to the primitive CaO content of PR soil, which was around 8 wt% (Table 5). This finding is consistent with the evidence for time-dependent reactions resulting in the growth and development of C-S-H and C-A-S-H [18], which have a CaO content of approximately 20%.
Figure 9 evidences the formation of C-S-H and C-A-S-H nanocrystals and gels after 60 days of curing as a result of hydration reactions. From the images collected, two different types of pozzolanic reaction products could be identified: (i) needle-like nanocrystals formed between clay and C-S-H fabric gels in the PR/PeA/GEOS and PR/GrA/GEOS samples, such as jennite/thaumasite crystals (Figure 9a,c), and (ii) honeycomb textures typical of C-S-H/C-A-S-H tobermorite-like phases in the PR/OlA/GEOS sample (Figure 9b).

2.3. FT-IR

FT-IR was used to better characterize the hydration products derived from pozzolanic reactions. Figure 10 shows the sample spectra of the raw materials used in this study (a), the spectra after 28 days of curing for the PR/PeA/GEOS (b) and PR/OlA/GEOS (c) samples, and the spectra after 60 days of curing for the PR/GrA/GEOS sample (d). This prolonged time, 60 days, was used to determine whether the new C-S-H phases needed more time to grow and whether more evident shifts in the band positions would eventually develop.
Table 3 and Table S1 report the band assignments for all major and minor absorption bands identified in the spectra of raw and treated materials, respectively, at different curing times. The absorption bands located at 3000–3750 cm−1 and 1570–1700 cm−1 are due to the O-H stretching (ν1 and ν3) and H-O-H bending of H2O (ν2), respectively [26]. In detail, in biomass ash samples, the presence of water absorption bands is attributed both to the possible absorption of H2O before the measurements and to the presence of minerals with a high water content (e.g., heulandite or calcioferrite, as reported in Comodi et al. [25]). In addition, the band at ~3600 cm−1 is due to O-H stretching from clay minerals [27,28].
The carbonate asymmetric stretching (ν3) and the in-plane (ν4) and out-of-plane (ν2) bending signals observed at ~1400, ~710, and ~850 cm−1, respectively, are associated with the presence of calcite mineral in raw biomass ash and clayey soil [29]; the band at ~1800 cm−1 is assigned to the ν1 + ν4 combination band. The absorption bands in the 1100–900 cm−1 range are ascribed to the asymmetric stretching vibration of Si-O-T, and those between 420 and 620 cm−1 are attributed to the bending vibration of Si-O-Si or Si-O-Al units, related to the presence of clay minerals [28]. Furthermore, the doublet at 800 and 780 cm−1 indicates the presence of quartz in the mixtures [28].
After 60 days of curing, a shift in the spectral features related to Si-O-T (1100–900 cm−1) asymmetric stretching and Si-O-Si or Si-O-Al (420 to 500 cm−1) was observed and is reported in Figure 11. This shift, which varied in magnitude, depending on the type of sample, is attributed to the possible growth of cement phases [30,31].

3. Discussion

A comparison of the results of the different analyses performed on PR/ash mixtures allowed the following conclusions to be made:
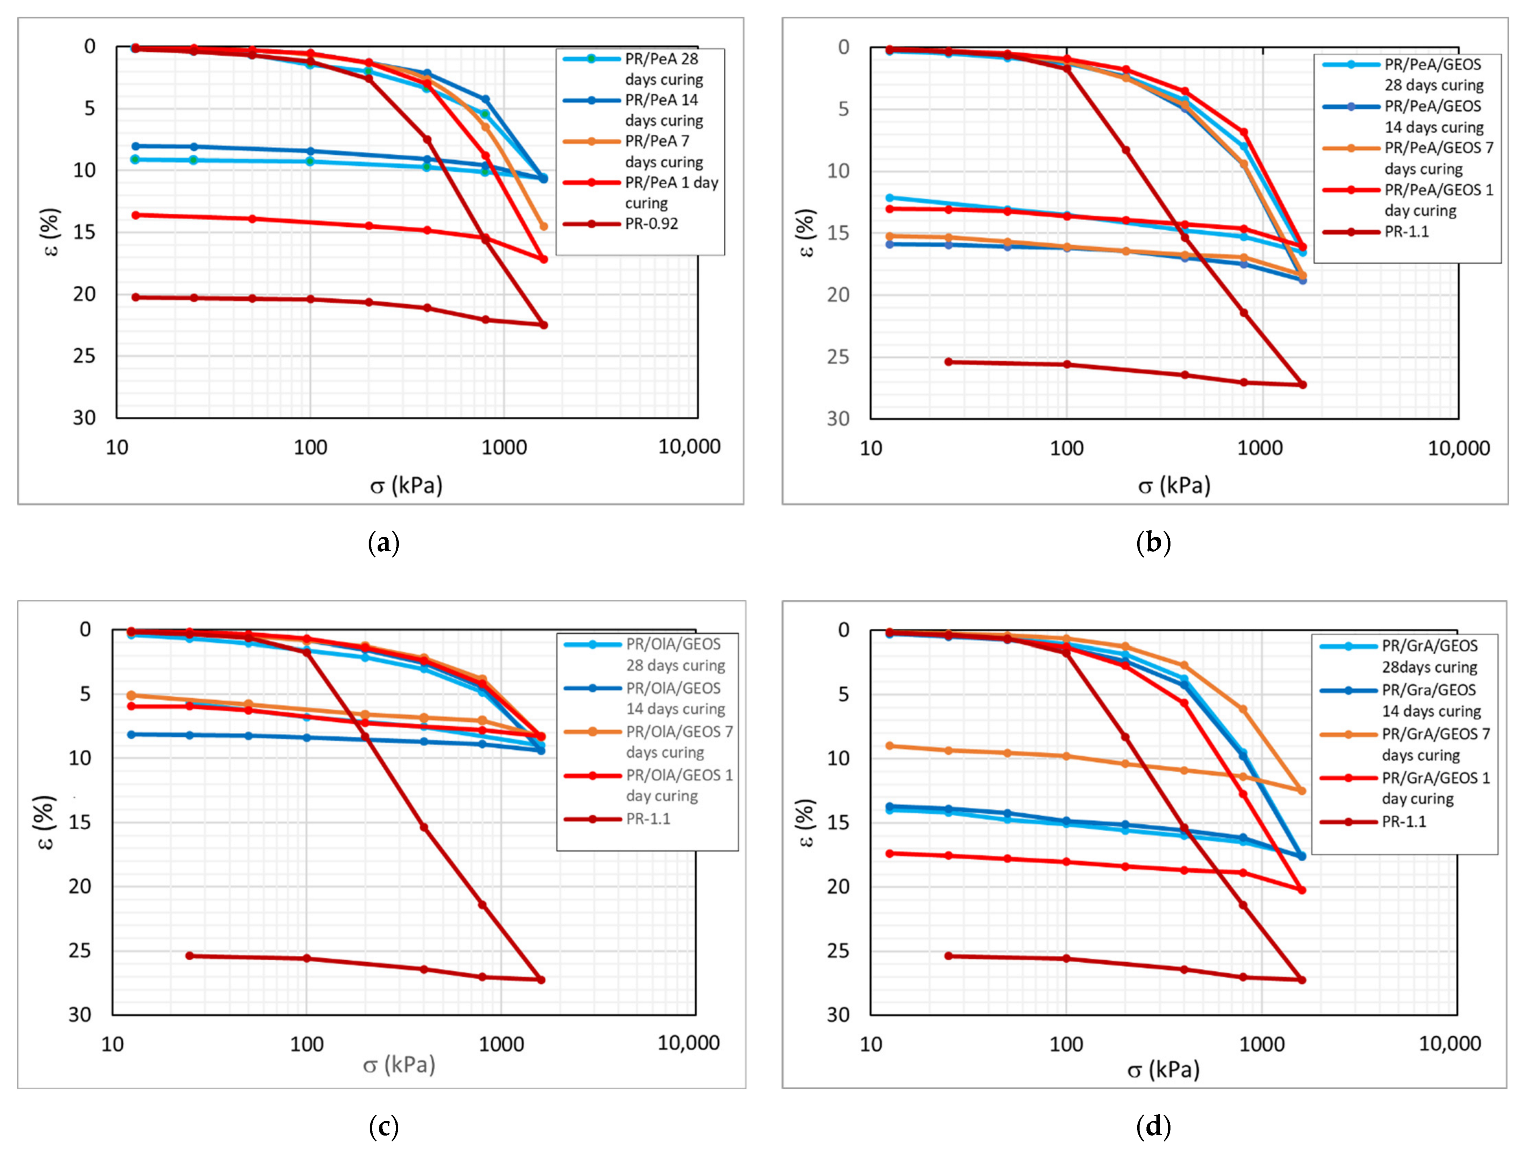
  • The initial reduction in compressibility observed in all samples after 1 day of curing was likely due to a mere mechanical effect. In fact, it is known that pozzolanic reactions involving biomass ashes in the systems do not develop products in the early stage of curing [32]. In PR/PeA/GEOS, worse compressibility characteristics were observed at intermediate curing times (7 and 14 days). This could be because at this stage of the system evolution, pozzolanic reactions have already determined a consumption of the added ash but the newly formed compounds are still not able to give beneficial effects compensating for the gradual loss of mere mechanical benefits due to the addition of unreacted PeA. After 28 days of curing, the binding effects are stronger and they compensate for the loss of initial mechanical benefits. The compression curves after 1 and 28 days of curing were in fact superimposed on each other. On the contrary, the results obtained for PR/OlA/GEOS seem to indicate that pozzolanic reactions induce the formation of new compounds, the presence of which determines, at any time up to 28 days, beneficial effects compensating for the gradual loss of mechanical benefits observed in the short term (1 day) and due to the addition of unreacted OlA. Finally, the behavior of PR/GrA/GEOS suggested that after 7 days of curing, new compounds had developed with improved mechanical effects (compressibility reduction) compared to those seen after 1 day with the addition of the unreacted GrA. Nonetheless, these effects were transient, and compressibility increased again after longer curing times (14 and 28 days), although it remained inferior after 1 day of curing. This behavior suggests that after 7 days, new transitional compounds had formed, conferring transient mechanical benefits. Later, such compounds could have been substituted by others, leading to less benefits, at least until 28 days of curing. In such complex systems, pozzolanic reactions are influenced by several variables, such as the chemo-mineralogical characteristics of the ashes [24], the Si/Ca ratio of the mixture, pH, and water content. For these reasons, the rate of pozzolanic reactions is nonlinear and varies in terms of the compressibility characteristics of different mixtures. Nonetheless, it was observed that after 28 days of curing, all mixtures had a compressibility, at different degrees, lower than that observed after 1 day of curing. The effects induced by pozzolanic reactions are expected to be permanent or even to improve over longer curing times, which could allow the formation of better-developed cementitious compounds, as evidenced by the Fe-SEM images taken after 60 days of curing (see point 3).
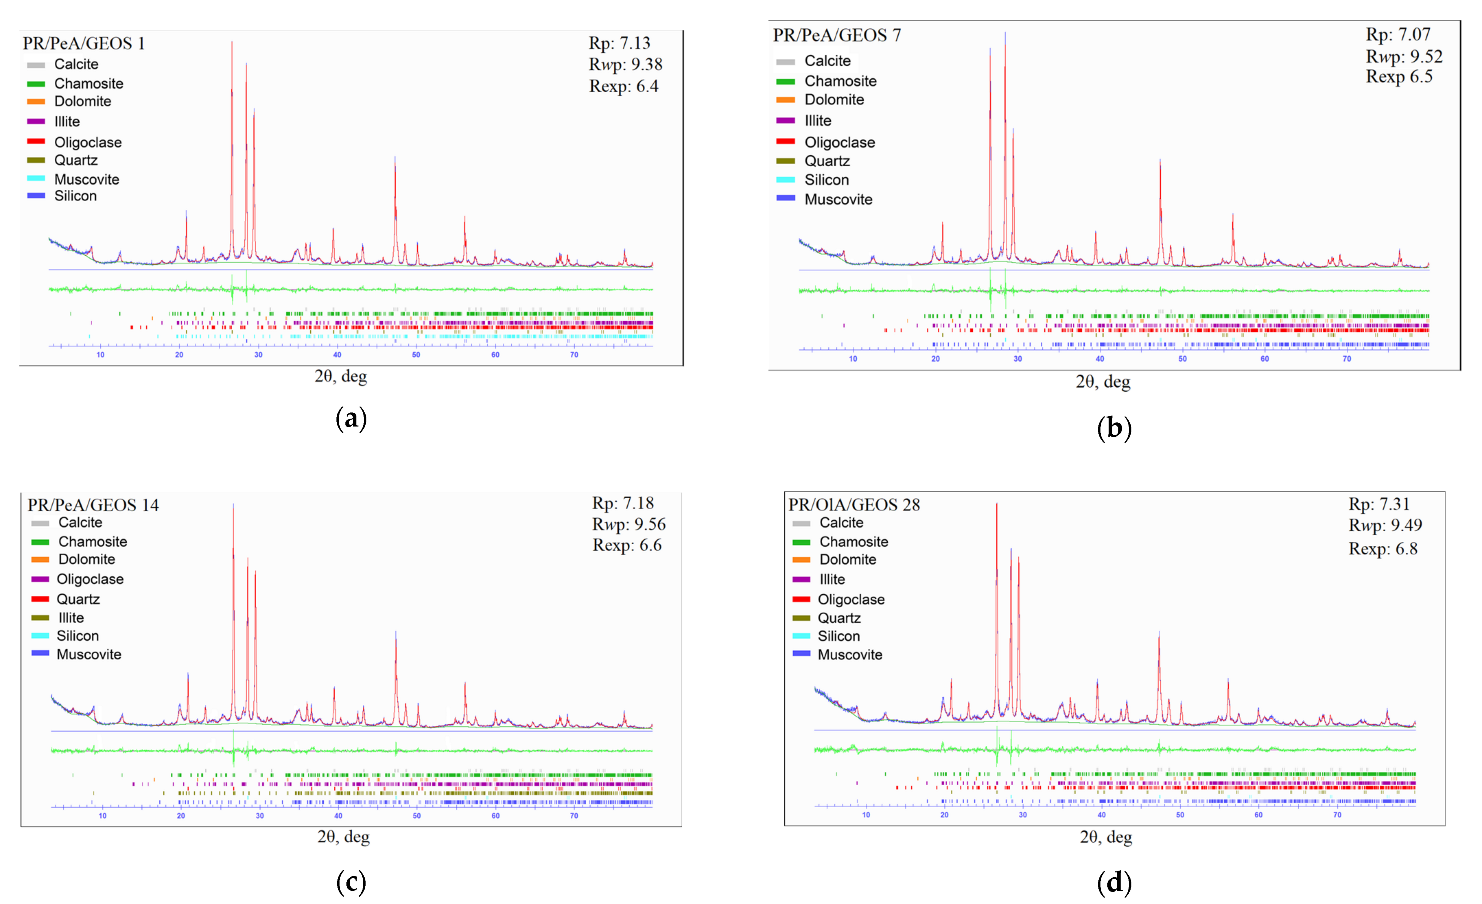
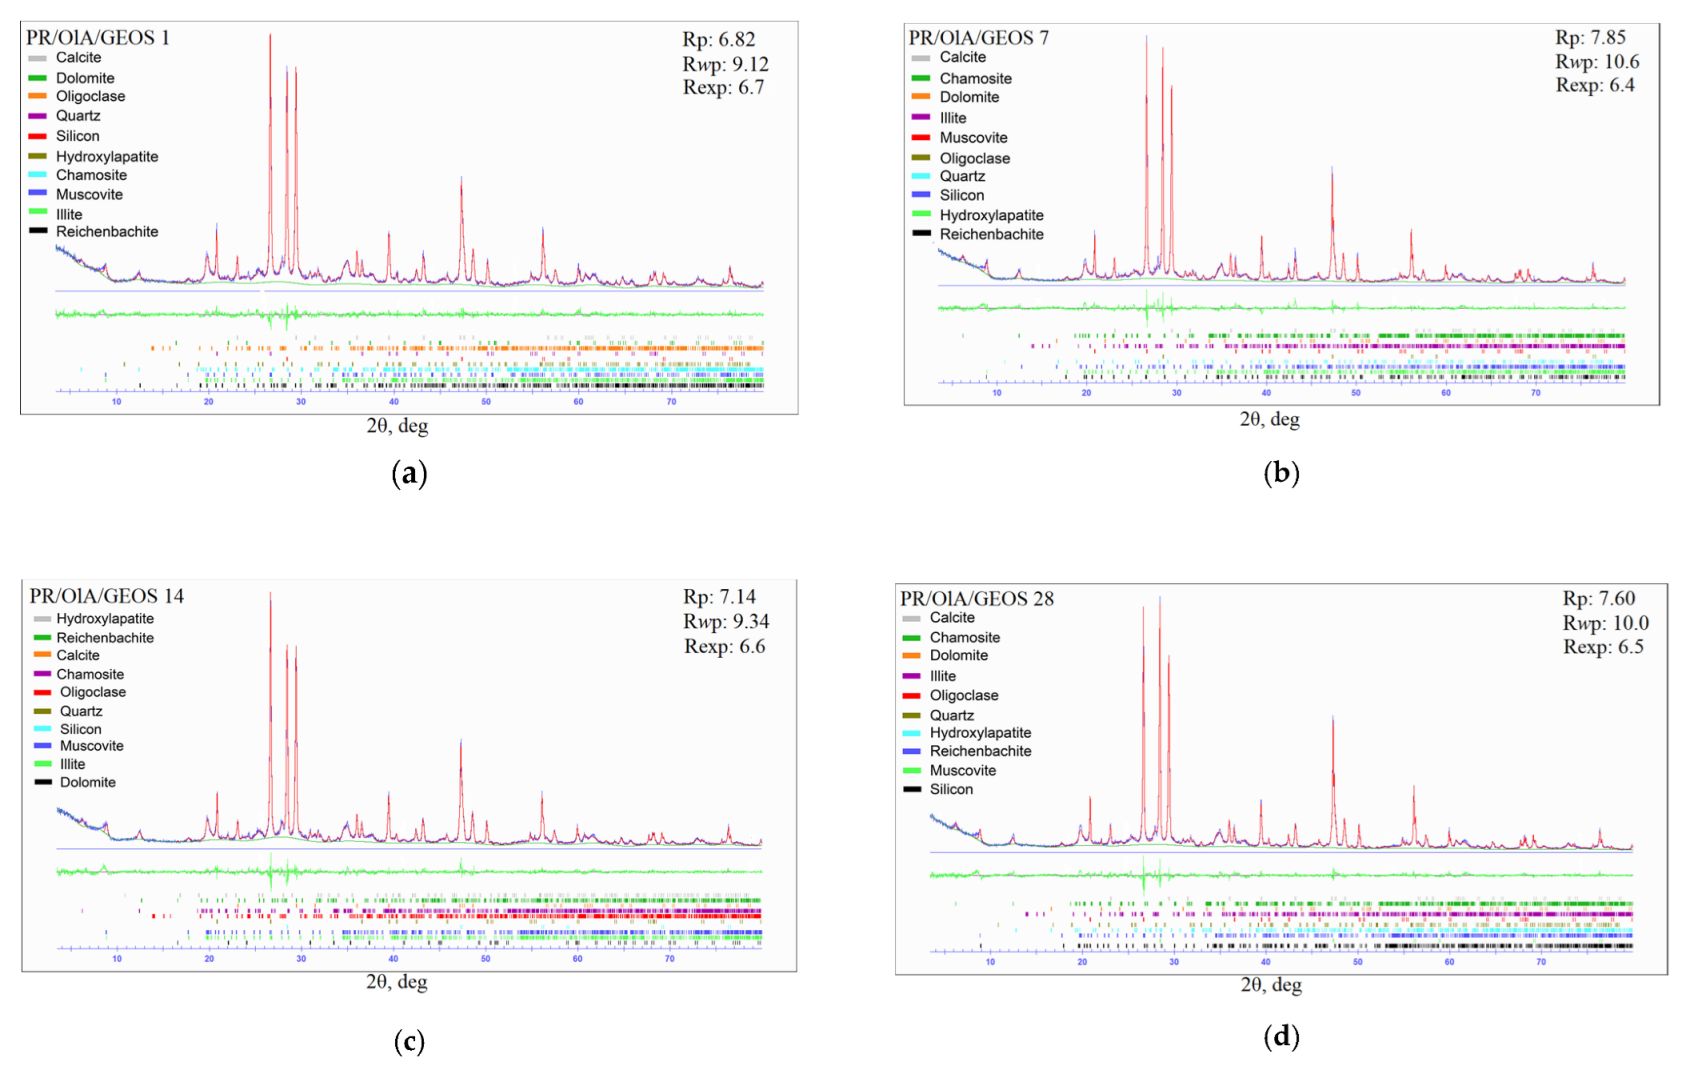
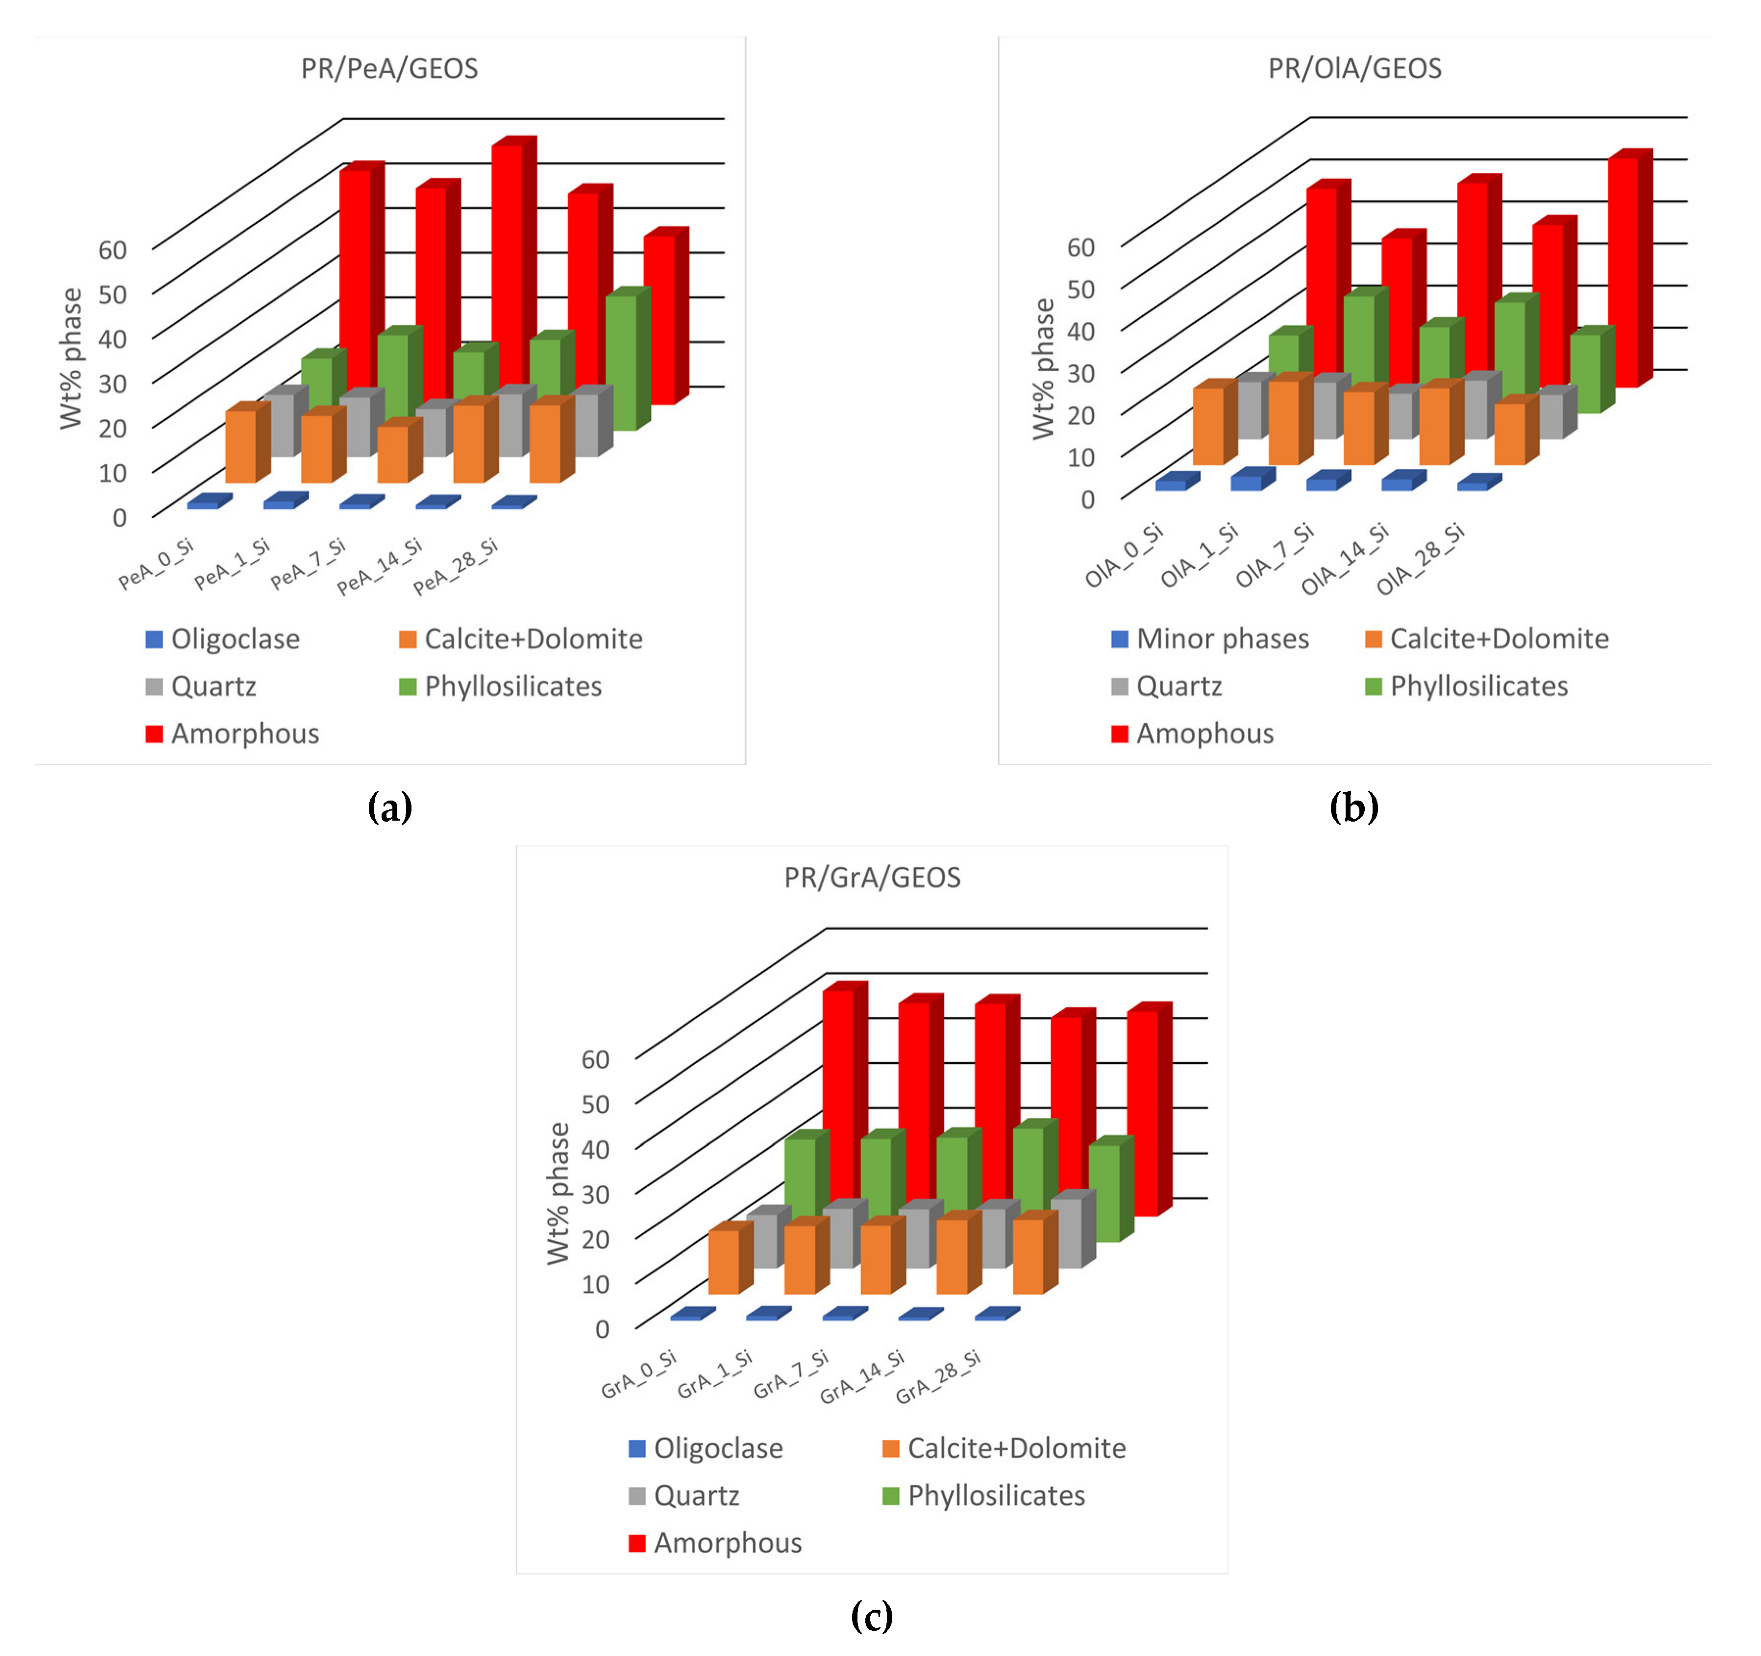
  • None of the XRPD spectra of the three mixtures, at any curing time, showed C-S-H or/and C-A-S-H peaks (Figure 3, Figure 4, and Figure 5), which are the main phases that improve the strength of the samples. At room temperature, only poorly crystalline C-S-H may be formed, which is difficult to detect using XRPD [9,33]. In addition, the illite content decreased in PR/OlA/GEOS and PR/PeA/GEOS (Figure 6 b,c) as the amorphous content increased, as also reported by Chrysochoou [34], while for the PR/GrA/GEOS mixture, the content remained largely stable. Clay granules are attacked in these alkaline environments and form available silica and alumina groups that combine with fly-ash-derived calcium to form amorphous C-S-H phases [33]. This behavior confirms that secondary products, such as C-S-H and C-A-S-H, form principally in amorphous phases, as evidenced by the increase in the amorphous content corresponding to the improvement in the geotechnical properties of the samples.
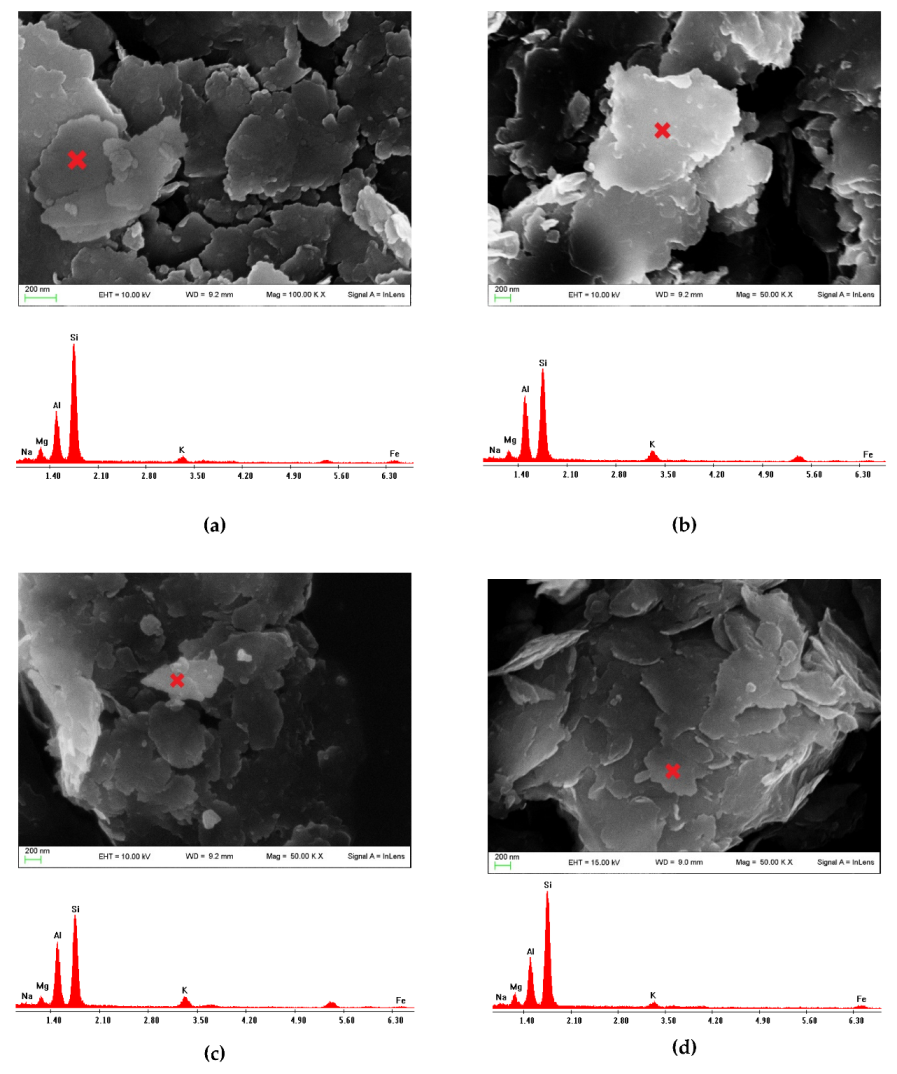
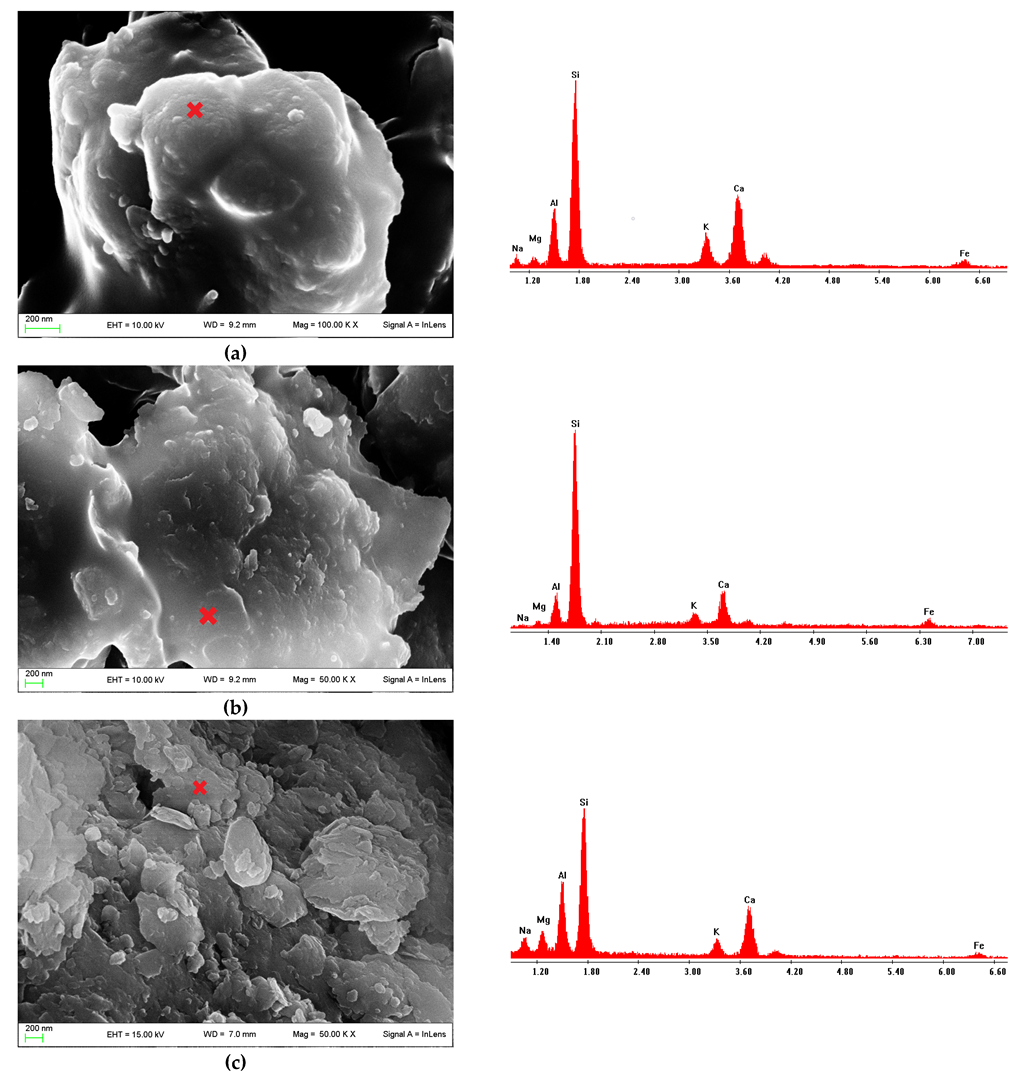
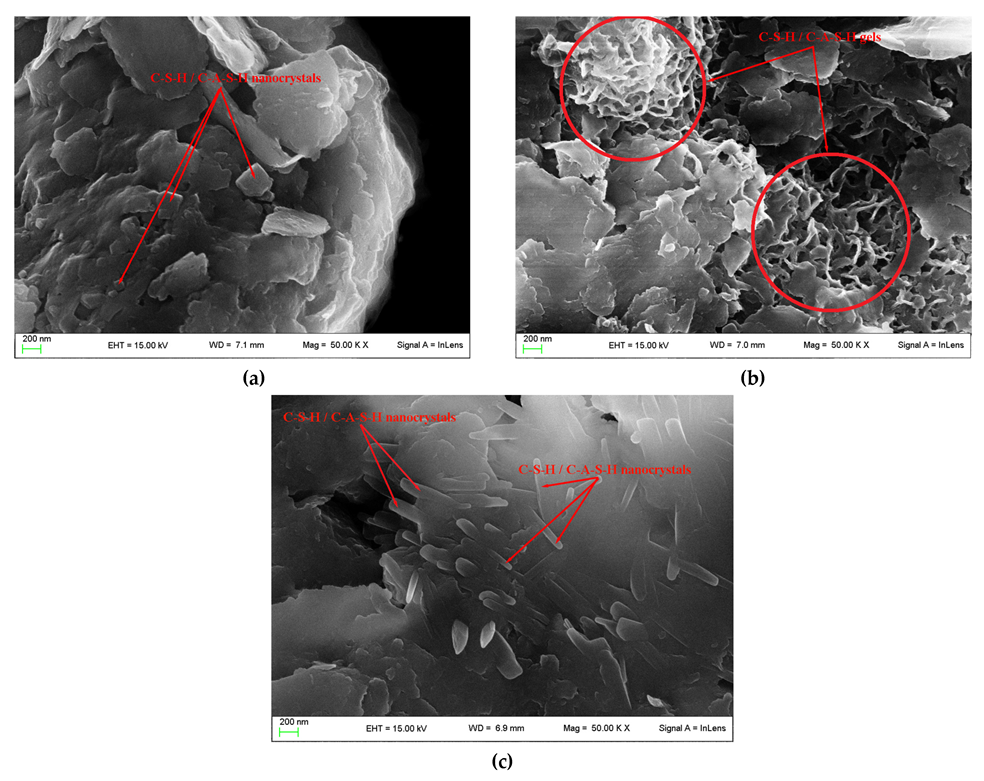
  • Further evidence of the growth of an amorphous product of pozzolanic reactions in gel form is provided by the Fe-SEM images, where the serrated edges of clay lamellae appear rounded, and EDS semi-quantitative analyses showed a drastic increase in the Ca content, from approximately 8% in raw PR soil to approximately 15% on the surface of clay grains after 28 days of curing for the PR/PeA/GEOS, PR/OlA/GEOS, and PR/GrA/GEOS mixtures (Figure 8). After 60 days of curing, two different C-S-H/C-A-S-H reaction products were detected from electron images: intertwined acicular crystals in the PR/PeA/GEOS and PR/GrA/GEOS mixtures (Figure 9a–c) and honeycomb textures characteristic of C-S-H/C-A-S-H tobermorite-like phases in the PR/OlA/GEOS sample (Figure 9b). These structures were found in all mixtures and are comparable to those found in clayey soils traditionally treated with lime [35,36] and recently synthesized for novel functional carrier materials applied in photocatalysis [37]. Figure 6c in Solanki et al. [35] and Figure 6 in Di Sante et al. [36] confirm the similarities of the structure.
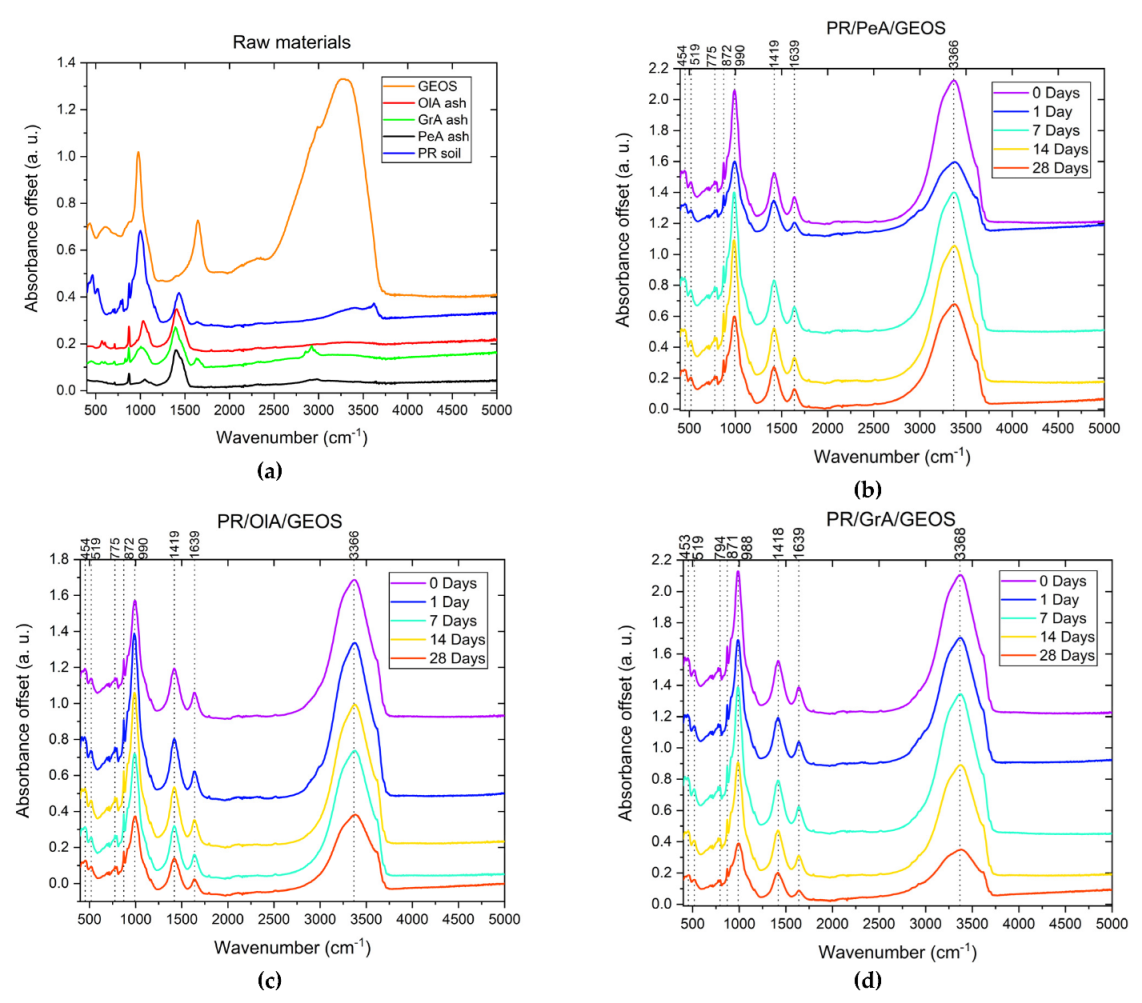
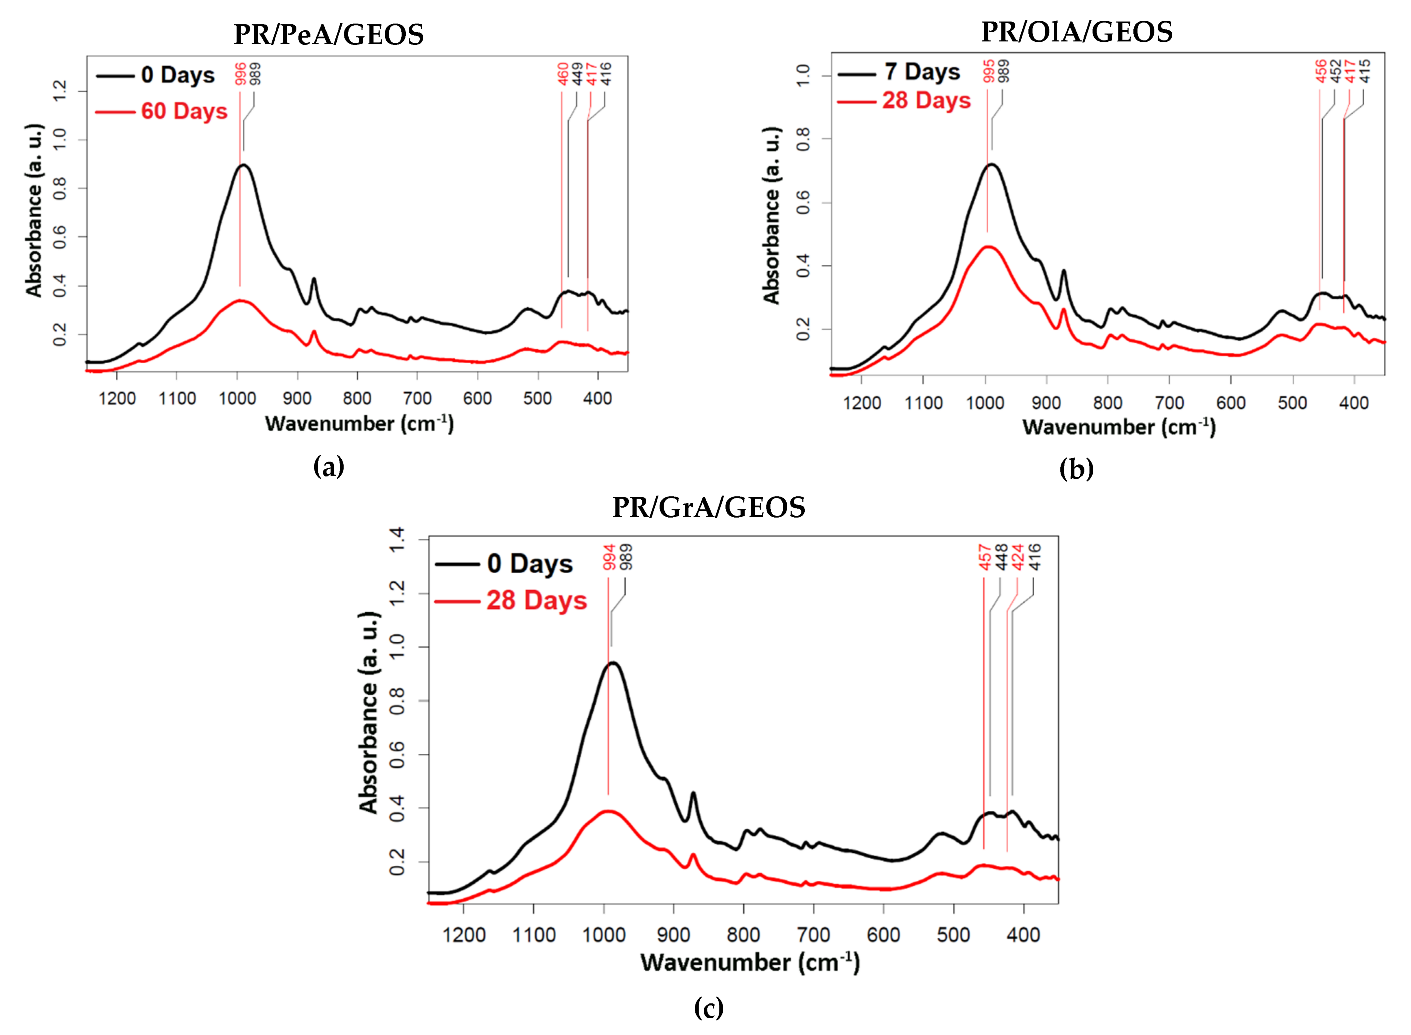
  • The extent of the pozzolanic reaction can be delineated and studied by determining the change in the position and intensity of diagnostic FT-IR peaks [17,31]. The bands located at 900–1100 cm−1 (Si-O-T stretching modes) and 420–620 cm−1 (Si-O-T bending modes) are sensitive to the chemical reaction, resulting in a shift in the positions indicative of the formation of C-S-H and/or C-A-S-H gels [30]. The shift in the position of the Si-O-T bands is due to an increase in the degree of polymerization of the silicon tetrahedra (SiO4). It can be clearly seen that a shift in the peak position in the functional groups took place for all four samples at different curing times (Figure 11). In detail, for the PR/OlA/GEOS and PR/GrA/GEOS samples (Figure 11b,c), the shift in the position of the Si-O-T bands was already visible at 28 days of treatment, while for the PR/PeA/GEOS sample, a longer curing time (60 days) was required before a shift in the Si-O-T bands (Figure 11a) could be seen. Another effect of the formation of cementitious phases was the progressive decrease in the intensity of the bands at ~3375 cm−1 (O–H stretching) and their widening, a behavior described by Murmu et al. [38] to be due to the involvement of water in the pozzolanic reaction. The reduction in the O–H band intensity at ~3375 was clearly visible for the PR/OlA/GEOS and PR/GrA/GEOS samples (Figure 10c,d).

4. Materials and Methods

4.1. Clayey Soil

The clay used in this work, hereafter called PR soil, was obtained from a quarry situated in Parma Province (Italy). The results of the XRPD analyses performed in this study are shown in Table 4, while Table 5 shows the results of the semi-quantitative chemical analyses of PR soil. The quantification of the mineralogical phases was carried out using the Rietveld method [39] and Quanto software (software version number 1.0, creator A. Altomare et al., CNR Bari, Italy) [40]. For more details on the procedure of refining XRPD spectra, see Section 4.4.
The grain size distribution of PR soil, determined by aerometric analysis according to the ASTM D422-63 standard, is shown in Figure 12.
The specific gravity (Gs) and consistency limits (liquid limit—LL; plastic limit—PL; plasticity index—PI) were 2.72, 58%, 31%, and 27%, respectively. Gs was defined according to the ASTM D 854-14 standard and consistency limits according to the ASTM D 4318 standard, in which LL is determined by means of the Casagrande test.

4.2. Biomass Ashes

Three types of biomass ashes, derived from the combustion of grapevine (GrA), pellet (PeA), and olive tree pruning (OlA), were used. In a previous study, accurate chemo-mineralogical analyses of these samples were carried out by Comodi et al. [25]. A summary of the chemical properties and mineralogical compositions of the selected fly ashes is reported in Table 6 and Table 7 with the codes used in this paper.
The chemistry of the studied fly ashes indicated that their main component was CaO, followed by SiO2 and then Al2O3 or, in one case, MgO. The abundance of SiO2, Al2O3, and CaO suggests that these ashes can be considered potential aluminosilicate sources and may be suitable as stabilizing agents for clayey soils, provided that the environment of a possible soil–ash mixture is alkaline enough to determine the dissolution of silicates and promote pozzolanic reactions.
The quantitative mineralogical composition and the amount of amorphous components of GrA, PeA, and OlA ashes are reported in Table 7.
Furthermore, we confirmed the safety of the materials in terms of fine dust and potentially toxic elements, as determined in Comodi et al. [25], where it was found that the average particle size for the three samples ranges between 17 and 21 μm, with less than 1 vol% of inhalable particles, smaller than 2.5 μm. The concentrations of potentially toxic elements were below the Italian legislation limits (legislative decree 152/2006) [41], and the polycyclic aromatic hydrocarbon content was non-detectable in all samples.

4.3. Geotechnical Analyses

Before attempting to use the aforementioned ashes for the stabilization of PR soil, preliminary analyses, some of which are typically run to set the best parameters for lime treatment, were performed.
The Eades and Grim test, which is widely used in lime treatment to determine the minimum amount of lime necessary to enter the stabilization field, was performed on PR soil. This test identifies the amount of lime necessary to enter the stabilization field in a clay-lime mixture as the quantity at which the pH exceeds 12.4. Following the procedure described by ASTM D6276-99a (standard 2006) [42], the test was performed using as additives both hydrated lime with a Ca(OH)2 content higher than 95% and the three described biomass ashes as an alternative to lime. All ashes were ground in a mortar until they could pass through the sieve at 450 μm. The goal of this procedure was to determine whether, in any of the investigated clay-ash mixtures, the environment formed was alkaline enough to lead to the dissolution of silicates and to promote possible pozzolanic reactions, without the addition of alkaline activators.
Compaction tests based on the same principles as the Proctor test were also performed, at the scale of the oedometer ring, on both raw PR soil and on PR/ash mixtures. Samples were compacted within the oedometer ring with different water contents by using a constant compaction energy. Unlike in standard compaction tests, the goal of this compaction procedure was not to determine the optimum moisture content and the maximum dry density (ρd) of each mixture but to build compaction curves of raw and treated soils crossing with each other. In fact, the crossing point among compaction curves of PR and PR/ash mixtures could define at what water content it is possible to prepare samples of raw PR and PR/ash mixtures with the same dry density (ρd) and void ratio (e). This is of great importance to evaluate the mechanical effects of a possible treatment, as it reduces the number of variables affecting soils’ compressibility, including the void ratio (a higher void ratio implies higher compressibility) and moisture content (which influences the evolution of pozzolanic reactions).
Raw PR and PR/ash mixtures with different water contents were compacted in a 5-cm-diameter (Ø) oedometer ring, with an internal volume equal to 39.27 cm3 (height 2 cm). Samples were compacted into a single layer using a hollow cylindrical mallet with a mass of 850 g sliding along a vertical bar. For the compaction of each sample, the mass was dropped from a height of 0.20 m (n = 14 consecutive blows). Considering the final sample volume and the mallet mass, this scheme corresponds to the compaction energy of a standard Proctor test (approximately 595 kJ/m3), according to the relation:
E   k J / m 3 = n · h   · M m · g V
where E is the compaction energy, n in the number of blows, h is the height of the drop, Mm is the mallet mass, g is the gravity acceleration, and V is the sample volume.
The testing equipment and procedure were such that after compaction, the sample height slightly exceeded the height of the ring, so the excess material could be carefully removed, guaranteeing a perfect filling of the oedometer ring. The samples prepared this way could be directly inserted into the oedometer to perform compression tests.
The compressibility properties of both raw PR soil and PR/ash mixtures were measured using oedometer tests performed on the previously compacted samples, which were selected on the basis of the compaction test results. All tested samples had the same water content (w), dry density (ρd), and void ratio (e) and were tested at different curing times, namely 1, 7, 14, and 28 days. During curing, all samples, which were cured within the oedometer ring in which they were prepared, were stored in a cellar at a stable temperature of approximately 20 °C and with constant humidity, carefully wrapped in plastic film to avoid drying.
During the compression tests, vertical stress was conventionally applied in successive steps (Δσvv = 1). Tests were run in unsaturated conditions with the lateral confinement of the oedometer ring; no suction measurements were performed before or during the tests. Eight steps of increasing stresses and four steps of decreasing stresses were applied in the range of σv = 12.5 kPa ÷ 1600 kPa. Micrometer dial gauges with an accuracy of 0.001 mm were used to measure the vertical displacements.

4.4. Chemo-Mineralogical Analyses

The quantitative mineralogical compositions of the mixtures at every curing time (1, 7, 14, 28 days), as well as their amorphous content, were obtained with X-ray powder diffraction data (XRPD), collected using a Bragg Brentano θ–2θ diffractometer (Philips PW 1830, (Koninklijke Philips N.V., Amsterdam, The Netherlands), CuKα radiation λ = 1.54184 Å, 40 kV, and 30 mA) in the 3°–80° [2θ] range with an angle step scan of 0.02° and a step time of 20 s. Spectra were qualitatively interpreted with X’pert HighScore Plus 3.0 (PANanalytical) (University of Perugia, Perugia, Italy) using the Crystallography Open Database (COD) library for mineral profile comparison [43,44,45,46,47]. Quantitative phase analyses (QPAs) were performed using the Rietveld method [39] and Quanto software [40]. The background was fitted using a Chebyshev polynomial function. The scale factor, lattice constant, and profile coefficient were refined for each phase. The amorphous content was calculated by adding 10 wt% crystalline silicon to the samples as an external standard. The quantification of the amorphous content was performed following the strategy described in [48,49]. The starting atomic coordinates and cell parameters were taken from the American Mineralogist Crystal Structure Database (AMCSD) [50].
The micro-nano-textural evolution of the samples at different curing times was observed using an Fe-SEM-EDS analyzer (ZEISS, Perugia, Italy) to measure the semi-quantitative chemical composition of the samples. An Fe-SEM LEO 1525 analyzer (ZEISS, Perugia, Italy) with a ZEISS angle-selective backscatter detector (ZEISS, Perugia, Italy) was used for imaging materials at 1, 7, 14, 28, and 60 days of curing. The analysis scale ranged from granular to sub-granular to nanoscale, and the GEMINI column (ZEISS, Perugia, Italy) was used for chemical analysis.
FT-IR spectra in an attenuated total reflectance (ATR) configuration were made using an Alpha spectrometer (Bruker Optics) (Bruker, Perugia, Italy) equipped with a GLOBAR source, a ROCKSOLID interferometer, a KBr beam splitter, an RT-DLATGS detector, and a diamond crystal. Opus 7.5 Bruker Optics software was used for spectral measurements and analysis. Data were recorded in the spectral range of 300 to 5000 cm−1, with a spectra resolution of 2 cm−1 and averaging 64 acquisition scans. The collected spectra were corrected using the Opus 7.5 routine for water vapor.
Before describing the results of each individual analysis in detail, the tests performed for each untreated sample and as a function of curing time are shown systematically in Table 8 and Table 9.

5. Conclusions

We analyzed the interactions between clayey soil and three biomass fly ashes through a multi-method approach (compression test, XRPD, FT-IR, and Fe-SEM) to assess their efficiency in providing green soil stabilization.
These preliminary results support the possible use of non-hazardous biomass ash from power plants as an environmentally and economically effective alternative binder for clayey subsoils.
Honeycomb-like structures, such as those observed using traditional lime treatments, were observed in the samples studied after 60 days of curing, which were preceded by an amorphous gel that covered the clay flakes during the first 28 days. C-S-H gel polymerization was followed by FT-IR techniques, showing the increase in Q3 species with curing time. The mechanical behaviors were not homogeneous and continuous in the different samples studied, nor were the improvements in the geotechnical characteristics, probably because several parameters should be considered, such as the evolution of C-S-H in relation to the Ca/Si ratio of the starting mixture, the amount of free water available, the environmental alkalinity during the hardening time, the temperature during curing, and possibly other contrasting reactions that occur in the solid state. PR/OlA/GEOS provided the best and most promising results.
The use of biomass ash from local combustion plants for construction activities contributes to the reduction in landfill waste and can bring important economic benefits to industry and society.
Even though the results obtained are relevant for biomass ash applications in soil stabilization and present an opportunity to use waste and low-value by-products in civil construction, it is imperative that the uniformity of the properties and characteristics of the products obtained be studied. Further geotechnical investigations are required to obtain a product and procedure that can be implemented for large-scale industrial applications.
Finally, it is necessary to carry out life cycle assessment (LCA) studies in order to assess the actual sustainability and advantages or disadvantages, in regard to most impact categories, of the product used.

Supplementary Materials

The following supporting information can be downloaded at https://www.mdpi.com/article/10.3390/recycling8010005/s1: Table S1: Band assignments of treated soil up to 60 days of curing for PR/PeA/GEOS and up to 28 days of curing for PR/OlA/GEOS and PR/GrA/GEOS obtained from FT-IR analysis. Band positions are indicated in wavenumbers (cm−1). Bands were assigned according to [36,37,38,39].

Author Contributions

Conceptualization, P.C., C.C. and M.F.; methodology, C.C., M.F., P.C., E.P.B., P.S. and L.P; validation P.C., A.Z., and P.S.; investigation, M.F., C.C., E.P.B. and L.P.; resources, P.C.; data curation, M.F., C.C. and P.C.; writing—original draft preparation, M.F., C.C. and P.C.; writing—review and editing, F.C., G.C.; M.F., C.C., P.C., A.Z. and P.S; funding acquisition, P.C. All authors have read and agreed to the published version of the manuscript.

Funding

This research was funded by Fondazione Cassa di Risparmio di Perugia (Italy) under the title “Ceneri da biomassa e da carbone: possibili reimpieghi e strategie di bonifica” (project no. #2018.0508 (P.C.)).

Institutional Review Board Statement

Not applicable.

Informed Consent Statement

Not applicable.

Data Availability Statement

Not applicable.

Conflicts of Interest

The authors declare no conflict of interest.

References

  1. Phummiphan, I.; Horpibulsuk, S.; Phoo-ngernkham, T.; Arulrajah, A.; Shen, S.-L. Marginal Lateritic Soil Stabilized with Calcium Carbide Residue and Fly Ash Geopolymers as a Sustainable Pavement Base Material. J. Mater. Civ. Eng. 2017, 29, 04016195. [Google Scholar] [CrossRef]
  2. Uddin, K.; Balasubramaniam, A.S.; Bergado, D.T. Engineering Behavior of Cement-Treated Bangkok Soft Clay. Geotech. Eng. 1997, 28, 89–119. [Google Scholar]
  3. Miura, N.; Horpibulsuk, S.; Nagaraj, T.S. Engineering Behavior of Cement Stabilized Clay at High Water Content. Soils Found. 2001, 41, 33–45. [Google Scholar] [CrossRef] [PubMed] [Green Version]
  4. Boardman, D.I.; Glendinning, S.; Rogers, C.D.F. Development of Stabilisation and Solidification in Lime–Clay Mixes. Géotechnique 2001, 51, 533–543. [Google Scholar] [CrossRef]
  5. Lemaire, K.; Deneele, D.; Bonnet, S.; Legret, M. Effects of Lime and Cement Treatment on the Physicochemical, Microstructural and Mechanical Characteristics of a Plastic Silt. Eng. Geol. 2013, 166, 255–261. [Google Scholar] [CrossRef]
  6. Gentili, S.; Comodi, P.; Nazzareni, S.; Zucchini, A. The Orvieto-Bagnoregio Ignimbrite: Pyroxene Crystal-Chemistry and Bulk Phase Composition of Pyroclastic Deposits, a Tool to Identify Syn-and Post-Depositional Processes. Eur. J. Mineral. 2014, 26, 743–756. [Google Scholar] [CrossRef]
  7. Chemeda, Y.C.; Deneele, D.; Christidis, G.E.; Ouvrard, G. Influence of Hydrated Lime on the Surface Properties and Interaction of Kaolinite Particles. Appl. Clay Sci. 2015, 107, 1–13. [Google Scholar] [CrossRef]
  8. Vitale, E.; Deneele, D.; Russo, G.; Ouvrard, G. Short-term effects on physical properties of lime treated kaolin. Appl. Clay Sci. 2016, 132-133, 223–231. [Google Scholar] [CrossRef]
  9. Guidobaldi, G.; Cambi, C.; Cecconi, M.; Comodi, P.; Deneele, D.; Paris, M.; Russo, G.; Vitale, E.; Zucchini, A. Chemo-Mineralogical Evolution and Microstructural Modifications of a Lime Treated Pyroclastic Soil. Eng. Geol. 2018, 245, 333–343. [Google Scholar] [CrossRef]
  10. Vitale, E.; Deneele, D.; Russo, G. Multiscale Analysis on the Behaviour of a Lime Treated Bentonite. Procedia Eng. 2016, 158, 87–91. [Google Scholar] [CrossRef] [Green Version]
  11. Coudert, E.; Paris, M.; Deneele, D.; Russo, G.; Tarantino, A. Use of Alkali Activated High-Calcium Fly Ash Binder for Kaolin Clay Soil Stabilisation: Physicochemical Evolution. Constr. Build. Mater. 2019, 201, 539–552. [Google Scholar] [CrossRef]
  12. Cabrera, M.; Galvin, A.P.; Agrela, F.; Carvajal, M.D.; Ayuso, J. Characterisation and Technical Feasibility of Using Biomass Bottom Ash for Civil Infrastructures. Constr. Build. Mater. 2014, 58, 234–244. [Google Scholar] [CrossRef]
  13. Agrela, F.; Cabrera, M.; Morales, M.M.; Zamorano, M.; Alshaaer, M. Biomass Fly Ash and Biomass Bottom Ash. In New Trends in Eco-Efficient and Recycled Concrete; Elsevier: Amsterdam, The Netherlands, 2019; pp. 23–58. [Google Scholar]
  14. Thomas, M.D.A. Optimizing the Use of Fly Ash in Concrete; Portland Cement Association: Skokie, IL, USA, 2007; Volume 5420. [Google Scholar]
  15. Obernberger, I.; Supancic, K. Possibilities of Ash Utilisation from Biomass Combustion Plants. In Proceedings of the 17th European Biomass Conference & Exhibition, Hamburg, Germany, 29 June–3 July 2009; Volume 29. [Google Scholar]
  16. Cabrera, M.; Rosales, J.; Ayuso, J.; Estaire, J.; Agrela, F. Feasibility of Using Olive Biomass Bottom Ash in the Sub-Bases of Roads and Rural Paths. Constr. Build. Mater. 2018, 181, 266–275. [Google Scholar] [CrossRef]
  17. Gupt, C.B.; Bordoloi, S.; Sahoo, R.K.; Sekharan, S. Mechanical Performance and Micro-Structure of Bentonite-Fly Ash and Bentonite-Sand Mixes for Landfill Liner Application. J. Clean. Prod. 2021, 292, 126033. [Google Scholar] [CrossRef]
  18. Cherian, C.; Siddiqua, S. Engineering and Environmental Evaluation for Utilization of Recycled Pulp Mill Fly Ash as Binder in Sustainable Road Construction. J. Clean. Prod. 2021, 298, 126758. [Google Scholar] [CrossRef]
  19. Cristelo, N.; Glendinning, S.; Teixeira Pinto, A. Deep Soft Soil Improvement by Alkaline Activation. Proc. Inst. Civ. Eng.-Ground Improv. 2011, 164, 73–82. [Google Scholar] [CrossRef] [Green Version]
  20. Snellings, R.; Kazemi-Kamyab, H.; Nielsen, P.; Van den Abeele, L. Classification and Milling Increase Fly Ash Pozzolanic Reactivity. Front. Built Environ. 2021, 7, 670996. [Google Scholar] [CrossRef]
  21. Rios, S.; Cristelo, N.; Viana da Fonseca, A.; Ferreira, C. Structural Performance of Alkali-Activated Soil Ash versus Soil Cement. J. Mater. Civ. Eng. 2016, 28, 04015125. [Google Scholar] [CrossRef] [Green Version]
  22. Sargent, P.; Hughes, P.N.; Rouainia, M.; White, M.L. The Use of Alkali Activated Waste Binders in Enhancing the Mechanical Properties and Durability of Soft Alluvial Soils. Eng. Geol. 2013, 152, 96–108. [Google Scholar] [CrossRef]
  23. Gatta, G.D.; Comodi, P.; Zanazzi, P.F.; Ballaran, T.B. Anomalous Elastic Behavior and High-Pressure Structural Evolution of Zeolite Levyne. Am. Mineral. 2005, 90, 645–652. [Google Scholar] [CrossRef]
  24. Vitale, E.; Deneele, D.; Paris, M.; Russo, G. Multi-Scale Analysis and Time Evolution of Pozzolanic Activity of Lime Treated Clays. Appl. Clay Sci. 2017, 141, 36–45. [Google Scholar] [CrossRef]
  25. Comodi, P.; Zucchini, A.; Susta, U.; Cambi, C.; Vivani, R.; Cavalaglio, G.; Cotana, F. Multi-Scale Minero-Chemical Analysis of Biomass Ashes: A Key to Evaluating Their Dangers vs. Benefits. Sustainability 2021, 13, 6052. [Google Scholar] [CrossRef]
  26. Zhu, W.; Chen, X.; Struble, L.J.; Yang, E.-H. Characterization of Calcium-Containing Phases in Alkali-Activated Municipal Solid Waste Incineration Bottom Ash Binder through Chemical Extraction and Deconvoluted Fourier Transform Infrared Spectra. J. Clean. Prod. 2018, 192, 782–789. [Google Scholar] [CrossRef]
  27. Madejová, J. FTIR Techniques in Clay Mineral Studies. Vib. Spectrosc. 2003, 31, 1–10. [Google Scholar] [CrossRef]
  28. Madejová, J.; Gates, W.P.; Petit, S. IR Spectra of Clay Minerals. In Developments in clay science; Elsevier: Amsterdam, The Netherlands, 2017; Volume 8, pp. 107–149. ISBN 1572-4352. [Google Scholar]
  29. Kalembkiewicz, J.; Galas, D.; Sitarz-Palczak, E. The Physicochemical Properties and Composition of Biomass Ash and Evaluating Directions of Its Applications. Pol. J. Environ. Stud. 2018, 27, 1–11. [Google Scholar] [CrossRef]
  30. Jose, A.; Nivitha, M.R.; Krishnan, J.M.; Robinson, R.G. Characterization of Cement Stabilized Pond Ash Using FTIR Spectroscopy. Constr. Build. Mater. 2020, 263, 120136. [Google Scholar] [CrossRef]
  31. Geng, G.; Myers, R.J.; Li, J.; Maboudian, R.; Carraro, C.; Shapiro, D.A.; Monteiro, P.J. Aluminum-Induced Dreierketten Chain Cross-Links Increase the Mechanical Properties of Nanocrystalline Calcium Aluminosilicate Hydrate. Sci. Rep. 2017, 7, 44032. [Google Scholar] [CrossRef] [Green Version]
  32. Lav, A.H.; Lav, M.A. Microstructural Development of Stabilized Fly Ash as Pavement Base Material. J. Mater. Civ. Eng. 2000, 12, 157–163. [Google Scholar] [CrossRef]
  33. Tabet, W.E.; Cerato, A.B.; Elwood Madden, A.S.; Jentoft, R.E. Characterization of Hydration Products’ Formation and Strength Development in Cement-Stabilized Kaolinite Using TG and XRD. J. Mater. Civ. Eng. 2018, 30, 04018261. [Google Scholar] [CrossRef]
  34. Chrysochoou, M. Investigation of the Mineral Dissolution Rate and Strength Development in Stabilized Soils Using Quantitative X-Ray Diffraction. J. Mater. Civ. Eng. 2014, 26, 288–295. [Google Scholar] [CrossRef]
  35. Solanki, P.; Zaman, M. Microstructural and Mineralogical Characterization of Clay Stabilized Using Calcium-Based Stabilizers. In Scanning Electron Microscopy; IntechOpen: London, UK, 2012. [Google Scholar]
  36. Di Sante, M.; Fratalocchi, E.; Mazzieri, F.; Pasqualini, E. Time of Reactions in a Lime Treated Clayey Soil and Influence of Curing Conditions on Its Microstructure and Behaviour. Appl. Clay Sci. 2014, 99, 100–109. [Google Scholar] [CrossRef]
  37. Zhao, D.; Gao, Y.; Nie, S.; Liu, Z.; Wang, F.; Liu, P.; Hu, S. Self-Assembly of Honeycomb-like Calcium-Aluminum-Silicate-Hydrate (CASH) on Ceramsite Sand and Its Application in Photocatalysis. Chem. Eng. J. 2018, 344, 583–593. [Google Scholar] [CrossRef]
  38. Murmu, A.L.; Jain, A.; Patel, A. Mechanical Properties of Alkali Activated Fly Ash Geopolymer Stabilized Expansive Clay. KSCE J. Civ. Eng. 2019, 23, 3875–3888. [Google Scholar] [CrossRef]
  39. Rietveld, H.M. A Profile Refinement Method for Nuclear and Magnetic Structures. J. Appl. Crystallogr. 1969, 2, 65–71. [Google Scholar] [CrossRef]
  40. Altomare, A.; Burla, M.C.; Giacovazzo, C.; Guagliardi, A.; Moliterni, A.G.; Polidori, G.; Rizzi, R. Quanto: A Rietveld Program for Quantitative Phase Analysis of Polycrystalline Mixtures. J. Appl. Crystallogr. 2001, 34, 392–397. [Google Scholar] [CrossRef] [Green Version]
  41. Agovino, M.; Garofalo, A.; Mariani, A. Separate Waste Collection in Italy: The Role of Socio-Cultural Factors and Targets Set by Law. Env. Dev. Sustain. 2017, 19, 589–605. [Google Scholar] [CrossRef]
  42. ASTM D6276-19; Test Method Using Ph Estim. Soil-Lime Proportion Requir. Soil Stabilization. ASTM Int.: West Conshohocken, PA, USA, 2006.
  43. Gražulis, S.; Merkys, A.; Vaitkus, A.; Okulič-Kazarinas, M. Computing Stoichiometric Molecular Composition from Crystal Structures. J. Appl. Crystallogr. 2015, 48, 85–91. [Google Scholar] [CrossRef] [Green Version]
  44. Gražulis, S.; Daškevič, A.; Merkys, A.; Chateigner, D.; Lutterotti, L.; Quiros, M.; Serebryanaya, N.R.; Moeck, P.; Downs, R.T.; Le Bail, A. Crystallography Open Database (COD): An Open-Access Collection of Crystal Structures and Platform for World-Wide Collaboration. Nucleic Acids Res. 2012, 40, D420–D427. [Google Scholar] [CrossRef] [Green Version]
  45. Merkys, A.; Vaitkus, A.; Butkus, J.; Okulič-Kazarinas, M.; Kairys, V.; Gražulis, S. COD::CIF::Parser: An Error-Correcting CIF Parser for the Perl Language. J. Appl. Cryst. 2016, 49, 292–301. [Google Scholar] [CrossRef] [Green Version]
  46. Quirós, M.; Gražulis, S.; Girdzijauskaitė, S.; Merkys, A.; Vaitkus, A. Using SMILES Strings for the Description of Chemical Connectivity in the Crystallography Open Database. J. Cheminform. 2018, 10, 1–17. [Google Scholar] [CrossRef]
  47. Vaitkus, A.; Merkys, A.; Gražulis, S. Validation of the Crystallography Open Database Using the Crystallographic Information Framework. J Appl Cryst 2021, 54, 661–672. [Google Scholar] [CrossRef] [PubMed]
  48. Balić-Žunić, T. Quantitative Powder Diffraction Phase Analysis with a Combination of the Rietveld Method and the Addition Method. Powder Diffr. 2002, 17, 287–289. [Google Scholar] [CrossRef]
  49. Comodi, P.; Nazzareni, S.; Balić-Žunić, T.; Zucchini, A.; Hanfland, M. The High-Pressure Behavior of Bloedite: A Synchrotron Single-Crystal X-Ray Diffraction Study. Am. Mineral. 2014, 99, 511–518. [Google Scholar] [CrossRef]
  50. Downs, R.T.; Hall-Wallace, M. The American Mineralogist Crystal Structure Database. Am. Mineral. 2003, 88, 247–250. [Google Scholar]
Figure 1. Compaction curves of PR soil and PR/Pea mixture.
Recycling 08 00005 g001
Figure 2. Compression curves of PR-0.92 and PR/PeA (a), PR-1. 1 and PR/PeA/GEOS (b), PR-1.1 and PR/OlA/GEOS (c), and PR-1.1 and PR/GrA/GEOS (d).
Recycling 08 00005 g002
Figure 3. XRPD patterns refined by means of the Rietveld method for PR/PeA/GEOS samples after 1 (a), 7 (b), 14 (c), and 28 (d) days of curing with the addition of the external standard (crystalline silicon—Si). Observed and calculated profiles are given in blue and red, respectively. The differences between the observed and calculated powder diffraction profiles are in green. The colored vertical lines below the profile indicate the expected peaks of the phases shown in the legend at the top left and used for refinement.
Recycling 08 00005 g003
Figure 4. XRPD patterns refined by means of the Rietveld method for PR/OlA/GEOS samples after 1 (a), 7 (b), 14 (c), and 28 (d) days of curing with the addition of the external standard (crystalline silicon—Si). See Figure 3 for details.
Recycling 08 00005 g004
Figure 5. XRPD patterns refined by means of the Rietveld method for PR/GrA/OLA samples after 1 (a), 7 (b), 14 (c), and 28 (d) days of curing with the addition of the external standard (crystalline silicon—Si). See Figure 3 for details.
Recycling 08 00005 g005
Figure 6. Histograms reporting quantitative analyses by Rietveld refinement of XRPD for PR/PeA/GEOS (a), PR/OlA/GEOS (b), and PR/GrA/GEOS (c) samples. Quantitative results are given in wt %. The amorphous content was recalculated based on Si as an external standard.
Recycling 08 00005 g006
Figure 7. Fe-SEM photos of PR (a), PR/PeA at 0 days of curing (b), PR/OlA at 0 days of curing (c), and PR/GRA at 0 days of curing (d). For each photo, the chemical analysis (EDS) is reported below. Red crosses indicate the points at which analyses were carried out. The images show the typical lamellar structures of clay minerals.
Recycling 08 00005 g007
Figure 8. Fe-SEM photos of treated PR/PeA/GEOS (a), PR/OlA/GEOS (b), and PR/GrA/GEOS (c) after 28 days of curing. For each sample, the chemical analyses (EDS) are reported on the right. Red crosses indicate the points at which the analyses were carried out. The images show the lamellar structures coated by amorphous gels.
Recycling 08 00005 g008
Figure 9. Fe-SEM photos of treated PR/PeA/GEOS (a), PR/OlA/GEOS (b), and PR/GrA/GEOS (c) after 60 days. The images show C-S-H/C-A-S-H nanocrystals (ac) and honeycomb textures C-S-H/C-A-S-H gels (b).
Recycling 08 00005 g009
Figure 10. FR-IR spectra of raw materials used in this work and clayey soil mixtures after 60 days of curing. (a) FT-IR spectra of raw biomass ash, clayey soil, and liquid activator. FT-IR spectra of PR/PeA/GEOS (b), PR/OlA/GEOS (c), and PR/GrA/GEOS (d) soils at different curing times. The positions of the bands shown in the figures and marked with dotted lines refer to a curing time of 0 days. In each graph, absorbance is reported in arbitrary units (a.u.). Spectra are offset for clarity.
Recycling 08 00005 g010
Figure 11. Details of the FT-IR spectra of PR/PeA/GEOS (a), PR/OlA/GEOS (b), and PR/GrA/GEOS (c) samples in the 370–1250 cm−1 spectral range. Lines show the positions of Si-O-T banding and stretching vibrational mode bands. After 60 days of treatment for PR/PeA/GEOS and after 28 days for PR/OlA/GEOS and PR/GrA/GEOS, a shift in the Si-O-T bands to higher wavenumbers (cm−1) was seen. In each graph, absorbance is reported in arbitrary units (a.u.).
Recycling 08 00005 g011
Figure 12. Grain size distribution of PR soil.
Recycling 08 00005 g012
Table 1. Results of Eades and Grim tests performed on PR/lime and PR/ash mixtures. The amount of additive is indicated as a percentage of the dry weight of PR soil.
Lime Amount
(wt%)
pHGrA
Amount
(wt%)
pHPeA
Amount
(wt%)
pHOlA
Amount
(wt%)
pH
212.1028.9729.9628.98
312.2639.25310.5938.97
412.3649.39411.0449.19
512.3959.57511.3159.34
612.4069.44611.5969.57
----109.701012.05109.7
----209.932012.5209.72
Table 2. Samples tested for compressibility.
Sample CodeWater Content
(wt%)
Void Ratio (e)
wt%PR-0.92280.92
PR/PeA280.92
PR-1.1281.1
PR/PeA/GEOS281.1
PR/OlA/GEOS281.1
PR/GrA/GEOS281.1
Table 3. Band assignments of raw biomass ash, clayey soil, and liquid activator from FT-IR analysis. Bands were assigned according to [26,27,28,29].
Vibrational ModesWavenumber Position (cm−1)
GEOSPROlAGrAPeA
O-H stretching 2978
3277
3402
3620
/2961
2922
2852
2901
2980
H-O-H bending16461635/1696/
CO3−2 stretching/143314011393
1453
1402
1452
Si-O-T (T: tetrahedral Si or Al) stretching978
(Si-O)
912
1001
1015
1167
962
1032
1087
1006
1027
1035
1048
1111
CO3−2 bending/715
778
874
710
872
710
871
713
873
Si-O-T (T: tetrahedral Si or Al) bending437
607
(Si-O)
422
464
523
567
604
567
600
516
613
Table 4. Mineralogical composition of raw clayey soil (PR). Data are given as the weight percent (wt%), together with their relative errors (err) in the wt% quantification.
Mineral Phasewt%Err.
Quartz14.510.1
Calcite16.60.2
Dolomite1.140.1
Muscovite0.880.1
Chamosite2.00.1
Oligoclase1.250.1
Illite25.850.6
Amorphous37.80.1
Table 5. Semi-quantitative chemical analyses performed on PR soil.
Oxideswt%
Na2O1.49
MgO3.53
Al2O316.04
SiO265.7
K2O3.15
CaO8.0
FeO2.09
Table 6. Summary of the chemical composition and origin of selected biomass ashes used in this work. Data were taken from Comodi et al. [24].
CodeTypeOriginMajor Elements (in Oxide wt%)
GrABiomass ashesGrapevine pruning NaOClMnK2OMgOSiO2Cr2O3FeOCaOAl2O3P2O5TiO2Total
0.940.00.131.789.1426.190.02.3444.265.528.860.3299.5
PeABiomass ashesWood pellets0.110.01.110.032.416.510.02.7637.215.543.500.299.4
OlABiomass ashesOlive tree
pruning
0.580.00.124.943.8527.950.02.8943.317.907.830.3599.8
Table 7. Mineralogical composition of selected biomass ashes. Data were taken from Comodi et al. [24]. Data are given as the weight percent (wt%), together with their relative errors (err) in the wt% quantification.
SampleMineral Phasewt%Err.
GrAPericlase
Calcite
Heulandite
Calcioferrite
Fairchildite
Quartz
Hydroxylapatite
Amorphous
1.81
8.34
1.15
1.60
2.23
0.33
5.08
79.5
0.01
0.04
0.03
0.02
0.01
0.11
0.21
0.2
PeAPericlase
Calcite
Portlandite
Lime
Fairchildite
Quartz
Apatite
Amorphous
5.77
6.36
0.63
2.06
11.20
0.52
1.39
72.1
0.02
0.05
0.04
0.02
0.03
0.14
0.26
0.3
OlAReichenbachite
Calcite
Quartz
Phosphoferrite
Hydrossilapatite
Amorphous
0.95
42.24
4.18
0.42
4.57
47.6
0.02
0.15
0.07
0.03
0.03
0.5
Table 8. Geotechnical and chemo-mineralogical analyses performed on raw materials before treatment.
Sample IDTest
ILCAtt. Lim.Granul.ProctorOedometricXRPDQPASEMFT-IR
PRxxxxxxxx
OlA xxxx
PeA xxxx
GrA xxxx
GEOS x
ILC: initial lime consumption; Att. Lim.: Atterberg limits; Granul.: granulometry; XRPD: X-ray powder diffraction; QPA: quantitative phase analysis; SEM: scanning electron microscopy; FT-IR: Fourier transform infrared spectroscopy.
Table 9. Geotechnical and chemo-mineralogical analyses performed on mixtures at different curing times. See Table 8 for abbreviations.
Mixture IDCuring Time (days)Test
OedometricXRPDQPASEMFT-IR
PR/Pea1x
7x
14x
28x
60
PR/PeA/GEOS1xxxxx
7xxxxx
14xxxxx
28xxxxx
60 xx
PR/OlA/GEOS1xxxxx
7xxxxx
14xxxxx
28xxxxx
60 xx
PR/GrA/GEOS1xxxxx
7xxxxx
14xxxxx
28xxxxx
60 xx
Disclaimer/Publisher’s Note: The statements, opinions and data contained in all publications are solely those of the individual author(s) and contributor(s) and not of MDPI and/or the editor(s). MDPI and/or the editor(s) disclaim responsibility for any injury to people or property resulting from any ideas, methods, instructions or products referred to in the content.

