
An Analysis of the Circular Economy Practices of Pesticide Container Waste in Pakistan
by
 , , and
Ali Raza
1, 
Syed Asif Ali Naqvi
1,*,
Muhammad Abuzar Mehdi
1,
Muhammad Usman
1,2,
Sadia Ali
1,
Ashfaq Ahmad Shah
3 and
Bilal Hussain
1,* 1
Department of Economics, Government College University, Faisalabad 38000, Pakistan
2
Department of Management Sciences, Riphah International University Faisalabad Campus, Faisalabad 44000, Pakistan
3
Research Center for Environment and Society, School of Public Administration, Hohai University, Nanjing 210098, China
*
Authors to whom correspondence should be addressed.
Recycling 2023, 8(1), 4; https://doi.org/10.3390/recycling8010004
Submission received: 16 October 2022
/
Revised: 17 December 2022
/
Accepted: 22 December 2022
/
Published: 27 December 2022
Abstract
:Empty pesticide container recycling helps control nonpoint source pollution and provides alternative sources for basic materials. This article investigates end users’ adoption of recycling their pesticide container waste and investigates the determinants influencing their adoption. The study uses an extensive farm survey of 210 farmers from the District Faisalabad of the Province of Punjab (Pakistan). It applies the partial least squares structural equation modeling technique to assess the impact of different elements, such as subjective norms, attitude, perceived behavioral control, intention, and environmental concerns, on end users’ adoption regarding recycling of pesticide empty container waste. The results explain that perceived behavioral control and intention to reuse pesticide container waste positively predict end users’ adoption. Furthermore, adoption is positively impacted by attitude, subjective norms, and environmental concerns via the intention to recycle pesticide container waste. The study urges the need to encourage end users to share responsibility for pesticide container waste management for a sustainable society.
1. Introduction
About 1.8 billion people worldwide work in agriculture, and they all rely on chemical pesticides, fertilizers, and other forms of crop protection to ensure that their families have access to enough food year-round. From 1950 onward, pesticides have been widely used in agriculture worldwide to protect crops from harmful insects and other pests [1]. Pesticides have helped gain higher average output of rice and wheat since 1960 [2]. However, this boost in agricultural production is not without cost. Harmful compounds present in containers after they have been used and emptied are dangerous to human and animal health and the environment [3]. Proper pesticide container waste (p-waste) disposal is essential for these chemicals. It is important to pay attention to the material that remains after application and the locations where sprayers are applied [4]. Many farmers do not know that they should not dump p-waste into a water source or compost it on their farms [5].
Empty containers that have not been thoroughly cleaned may still contain remnants of contents, which could lead to complications in various contexts. Pesticide containers should not be thrown away since their contents harm the environment. The Food and Agriculture Organization of the United Nations (FAO) and the WHO issued a recommendation in 2008 listing several pesticide packaging collection, recycling, and disposal methods. Developed nations, such as Germany, Canada, Australia, and France, are among those whose strategies are effective [6] and follow these recommended methods. Groups of experts and firms or groups set up in collaboration with pesticide manufacturers are responsible for collecting packets in these nations. To the authors’ knowledge, there have been limited studies in which individual farmers primarily collect and perform something to reuse p-waste.
The worldwide consumption of pesticides rose from 2,299,979 tons in 1990 to 4,122,334 tons in 2018. From 1990 to 2018, Asia used 1,777,740 tons (53%) of pesticides, followed by the Americas with 1,010,693 (30%), Europe with 465,556 (14%), Africa with 69,985 (2%), and Oceania with 42,522 (1.3%) tons. A total of 1,404,167 tons of pesticides were used in China between 1990 and 2018 [7]. Regarding agricultural use of pesticides, Pakistan ranks second in South Asia [8]. However, only a small percentage of Pakistani farmers (19%) are adequately trained in the safe application of pesticides and their waste [9].
The existing linear economy (create, use, and dispose of) poses significant dangers to human health due to greenhouse gas emissions and environmental pollution, despite the widespread usage of plastic as a material in our daily lives. The circular plastic economy aims to reuse, reduce, and recycle all plastics to mitigate these problems [10]. The transition to a circular economy (CE) has risen to the top of the strategic agenda for businesses worldwide. Chemical pesticides are unavoidable in today’s conventional farming [6]. Farmers often use pesticides without knowing what kinds of these are or if there are any dangers to their families from these chemicals [11]. The CE seeks to reduce the amount of trash produced and its adverse effects on the environment, society, and the economy. It also supports keeping the product and its material in use to regenerate the natural system [12]. According to the Food and Agricultural organization, p-waste is increasing daily, so recycling p-waste benefits the environment and resources.
Several previous studies, such as Huyen et al. [13] for Vietnam, Sharafi et al. [14] for Iran [14], and Shammi et al. [15] for Bangladesh, highlight that there is a lack of pesticide-related awareness among farming communities. A lack of information related to the handling of pesticides has resulted in severe problems for human health and the environment [16]. The recent fight against locusts, combined with Pakistan’s long history of pesticide use, has made these problems much worse. The farming community in Pakistan suffers from a lack of awareness, inefficient legislation, and technological know-how, all of which contribute to improper regulation of the use of pesticides [17]. Most of the farmers throw their p-waste in canals and other water sources, disturbing the aquatic life and contaminating the water resource. Besides, many frames throw p-waste in their fields, polluting the environment. This contamination in sanitation and pure water is responsible for climate change.
To the best of our knowledge, no study has ever analyzed the impact of different socioeconomic and psychological elements on end users’ adoption of recycling p-waste. Most of the research is descriptive, and there has been little work encouraging end users to recycle their p-waste.
Previous research mainly focuses on managing waste rather than reusing waste, which connects the last node of the CE, such as dispose of, with the first one, such as create. Recycling is a procedure that involves breaking down or reprocessing waste materials to generate something new and valuable while also reducing pollution. It involves the process of refining waste materials to convert them into usable or new materials. The current research aims to solve this literature gap. More specifically, the theory of planned behavior (TPB) is applied in this context to evaluate the end users’ adoption of recycling p-waste. TPB offers a holistic framework for assessing multiple sociopsychological aspects of user behavior. It assumes that the users’ attitude and desire ultimately determine the outcome of any given situation. At the same time, experts agree that TPB is useful for describing individual intention-behavior [18].
Extending the original TPB architecture is crucial for increasing its predictive power [19]. This research also includes environmental concerns (ECs) to consider the previous lack of recycling and reuse of p-waste products. The study takes the aid of cross-sectional data collected from pesticide users. There are three main objectives of this study: First, it determines the socioeconomic characteristics of p-waste circularity of farming households in the district of Faisalabad. Second, it examines the adoption behavior of respondents toward p-waste recycling in the study area using the PLS model. Third, it suggests suitable policy recommendations based on the study results for concerned stakeholders. From the above-stated background, we put forward the following hypotheses:
H1.
ATT positively affects the p-waste intention of recycling.
H2.
SN positively affects the p-waste intention of recycling.
H3a.
PBC positively affects the p-waste intention of recycling.
H3b.
PBC positively affects end users’ adoption of recycling p-waste.
H4a.
EC positively affects the p-waste intention of recycling.
H4b.
EC positively affects end users’ adoption of recycling p-waste.
H5.
p-Waste intention of recycling positively affects end users’ adoption to recycle p-waste.
In developing Asian countries, where occupational health laws are severely lacking, pesticide use has led to several indirect health and environmental problems, including the poisoning of beneficial animals and the contamination of air and water supplies [19]. An increasing body of evidence suggests that pesticide waste, if disposed of incorrectly, poses significant risks to human health and the environment [20]. Pesticide containers should not be thrown away since their contents harm the environment. Pesticide residues damage water and soil, and may adversely affect human and animal health [21]. The existing linear economy (create, use, and dispose of) poses significant dangers to human health due to greenhouse gas emissions and environmental pollution, despite the widespread usage of plastic as a material in our daily lives.
This section gives a brief background of the article. The rest of the paper is divided into four sections. Section 2 presents a brief literature review; Section 3 presents the empirical methodology, including the data and empirical model, as well as the estimation techniques being applied. Section 4 describes the empirical findings and discussion regarding the study results. The last section concludes the study and presents policy suggestions based on the results.
2. Research Context
This section presents previous relevant studies. It is not surprising that apart from a few studies, almost all provide similar findings based on secondary source data or descriptive results. In this regard, Damalas et al. [4] conducted a study in Greece, and the results found that farmers’ training programs reduce the risks associated with pesticide usage. Plianbangchang et al. [22] explored a study regarding pesticide use methods in Thailand, and the results showed that farmers frequently looked to commercials for advice on which pesticide to apply. Patarasiriwong et al. [23] identified a workable methodology for managing trash from pesticide packaging for the local environment. The study suggested essential elements, including the multiple rinse method, a central collection site operated by the community, a waste recovery program provided by pesticide production companies, and government registration and regulations for sanitary glass-bottle-washing facilities. Veiga [24] performed an exploratory study for Brazil, and the findings showed that the reverse logistics program is ineffective for small rural areas, despite its overall success.
Yang et al. [25] perused a study in two rural areas of the Wei River catchment in China, where farming practices and erosion levels were substantially different. They used canonical correspondence analysis, and results revealed that education levels and ages significantly increased the hazards associated with pesticide use. Agrawal et al. [26] highlighted the future ways for research gap analysis by reviewing the literature. Chau et al. [27] analyzed a survey that different sources of drinkable water and impurities with pesticides provide information on probable factors contributing to exposure to pesticides in Vietnam.
Abadi [28] investigated that the increased usage of pesticides in central Iran is a significant issue; however, the study did not find any relevant witnesses regarding the elements contributing to the problem. Aldosari et al. [29] examined farmers’ pesticide knowledge and dependence on sustainable pesticide use. The results showed that most farmers did not obtain any training on pesticide use sustainably; on the other hand, research told that pieces of training might be helpful for sustainable pesticide use. Bagheri et al. [30] explored a study for apple farmers and examined standard safety procedures for pesticides. For rural China, Jin et al. [31] found a short-term decrease in land pollution due to high use of certain pesticides. Sharafi et al. [13] insisted on comprehensive training education and implementing the waste management system for environmental sustainability.
Bagheri et al. [32] observed that the handling of pesticides in agriculture had been the subject of research, but the factors that motivate farmers to utilize pesticides are not better understood. Bagheri et al. [33] found that farmers’ understanding of pesticide usage, attitudes toward risks, and perceptions of safety all play crucial roles in ensuring spraying operations. They concluded that farm-level improper p-waste disposal harms the environment and the general public’s health.
Ali et al. [34] advised policy to minimize the gap between crop growers, locals, and other stakeholders, including governmental organizations and retailers. Van den Berg et al. [35] studied that human and environmental health are likely compromised at different points in the pesticide lifetime. Li et al. [36] found that the perceived benefits positively impact perceived risks and willingness harms green dumping behaviors and willingness. Acerbi et al. [37] proposed a reference model by developing a conceptual data model to standardize and structure the necessary data in circular manufacturing to support manufacturers’ decision-making process. Sassanelli et al. [38] detected existing CE performance assessment methods and developed a positioning framework for measuring and assessing the circularity degree of a company. Vinante et al. [39] found that most of CE metrics are sufficiently general and applicable in assessment procedures, irrespective of the firm size and geographic location.
Bagheri et al. [40] for Iran used PLS and found that attitudes favor intention, whereas perceived behavioral control has a negative effect. Furthermore, SN has no significant effect on intention. They concluded that extension education should focus on changing farmers’ intentions and actions toward sustainable pesticide usage by altering their attitudes and perceptions of behavioral control. Garbounis and Komilis [41] anticipated the pace at which unused pesticide containers are being produced on a local, state, and federal scale. Salmenpera et al. [42] found that waste management businesses play a role by offering waste processing treatment to meet the needs of the production sector. Cishahayo et al. [43] found that farmers who participated in self-learning and social learning have a greater environmental protection awareness. We noticed that the impact of circularity practices and waste management technologies on environmental pollution related to farm waste in the form of pesticides has not received considerable attention in the current developing economies’ circularity literature.
The use of pesticides and their waste contaminate the soil, water, and environment. Governments and industries should manage technical education, regulations, and integrated pest control management to upgrade the living standard. The literature on waste management shows that it lacks specificity regarding managing waste products parallel to ecological sustainability [44,45]. Pesticide packaging is composed of plastic, which does not break down easily and thus negatively affects soil quality [14]. These pesticide management techniques can save the environment, soil, and groundwater from deterioration. On the other hand, these can have disadvantages for farm production. These can reduce farm production and disturb the food supply chain [46].
3. Materials and Methods
In this research, both quantitative and qualitative data were collected. A well-structured and accurate questionnaire was used to collect information from the target population. Before collecting, the required information questionnaire was pretested to validate it. After pretesting, data were gathered from farmers regarding the recycling of p-waste in the context of the CE. Due to time and resource limitations, the Faisalabad District of the Province of Punjab (Pakistan) was selected. The farm survey was conducted from 2 to 17 April 2022 with the help of a team of trained enumerators who were graduate-level students. As data are homogenous in nature, we applied simple random sampling, which is a probability sampling method, and here, each unit has an equal probability of being included in the research sample. In probability sampling, randomly chosen sampling units that are appropriately picked may indicate the entire sampling population. For this study, information was gathered from 230 respondents, but after obtaining the data, the proper accurate respondents were 210, and the response rate of our survey data was 91.3%. In the questionnaire, only a few questions were open-ended, while others were closed-ended. Questionnaires were formed on a 5-point Likert scale, and the 5-point Likert scales ranged from strongly disagree to strongly agree for measuring the variables.
Faisalabad is located in Punjab Province, the third-most-populated city in Pakistan and once known as Lyallpur. Here, a total of 3,625,000 people are living in Faisalabad as of year 2022 with an increase of 2.34% since 2021. The entire size of the district is 5856 square kilometers. It is located between latitudes 30.35 and 31.50 north and longitudes 72.66 and 73.40 east. It contributes more than 20% of the Province of Punjab’s GDP. In District of Faisalabad, there are six tehsils (Chak Jhumra, Faisalabad City, Faisalabad Sadar, Jaranwala, Samundri, and Tandlianwala). These tehsils are administrative units of the district, and all of these were taken in the study sample. The lower Chenab canal irrigates the crops farmed in Faisalabad, including cotton, wheat, sugarcane, fruits, and vegetables. The district is also known as the Manchester of Pakistan, and it is the third largest city in Pakistan after Karachi and Lahore and the second largest city in Punjab after Lahore. This study is taken only at the Faisalabad level because of time and resource constraints.
3.1. Data Analysis
Structural equation modeling (SEM) is a well-known analysis tool for many research fields. The partial least square (PLS) of the SEM is based on coherence and especially when data are not correctly partitioned. PLS uses partial least squares path modelling and provides a graphical interface based on SEM [47]. The PLS path modelling (also called the soft modelling technique) has the lowest measurement scale requirements, sample size, and residual distribution. Besides, it includes modular methods for calculating bootstrap signal spacing, model parameters, and multiple quality indicators. These algorithms are becoming increasingly popular in other areas, such as PLS algorithm information system research and marketing [48]. The PLS analysis is based on the part of the model that has a large number of predictors. PLS also provides expected results for structural models, structural and reflective models, and good fit quality [49]. PLS was chosen for the study because it facilitates the investigation of formative constructs. Software for SEM that uses covariance is better than PLS-SEM because it was initially created for prediction [50].
This study takes attitude, EC, perceived behavioral control, and subjective norms (SN) as independent variables and checks their impact on dependent variables, such as intention and adoption of recycling p-waste. The association between constructed and related items has been determined using the measurement model (outer model). However, as a way to find out the association between endogenous and exogenous constructs, the structural (inner) model was applied. This study used several reliability tests for measuring. Path coefficient, t-value, and p-value are used in structural models to determine the significance of each variable.
Additionally, the R square was discussed, which helps evaluate the validity of the whole model. We now have the fundamental framework for compiling reliable data and conducting research. Sreejesh et al. [51] looked at three significant categories of research: exploratory, descriptive, and explanatory. Using factual or statistical techniques, explanatory research has been used to evaluate the hypothesis and measure the links between variables [52].
In this study, the data are collected via face-to-face interviews of farmers. To ensure the validity of the questionnaire, face-to-face distribution was chosen. Validity and reliability are essential for the model to work. Loading and composite reliability are employed to ensure the measurement model’s accuracy, while discriminant and convergent validity serve as the cornerstones of model validity [53].
3.2. Internal Consistency Reliability
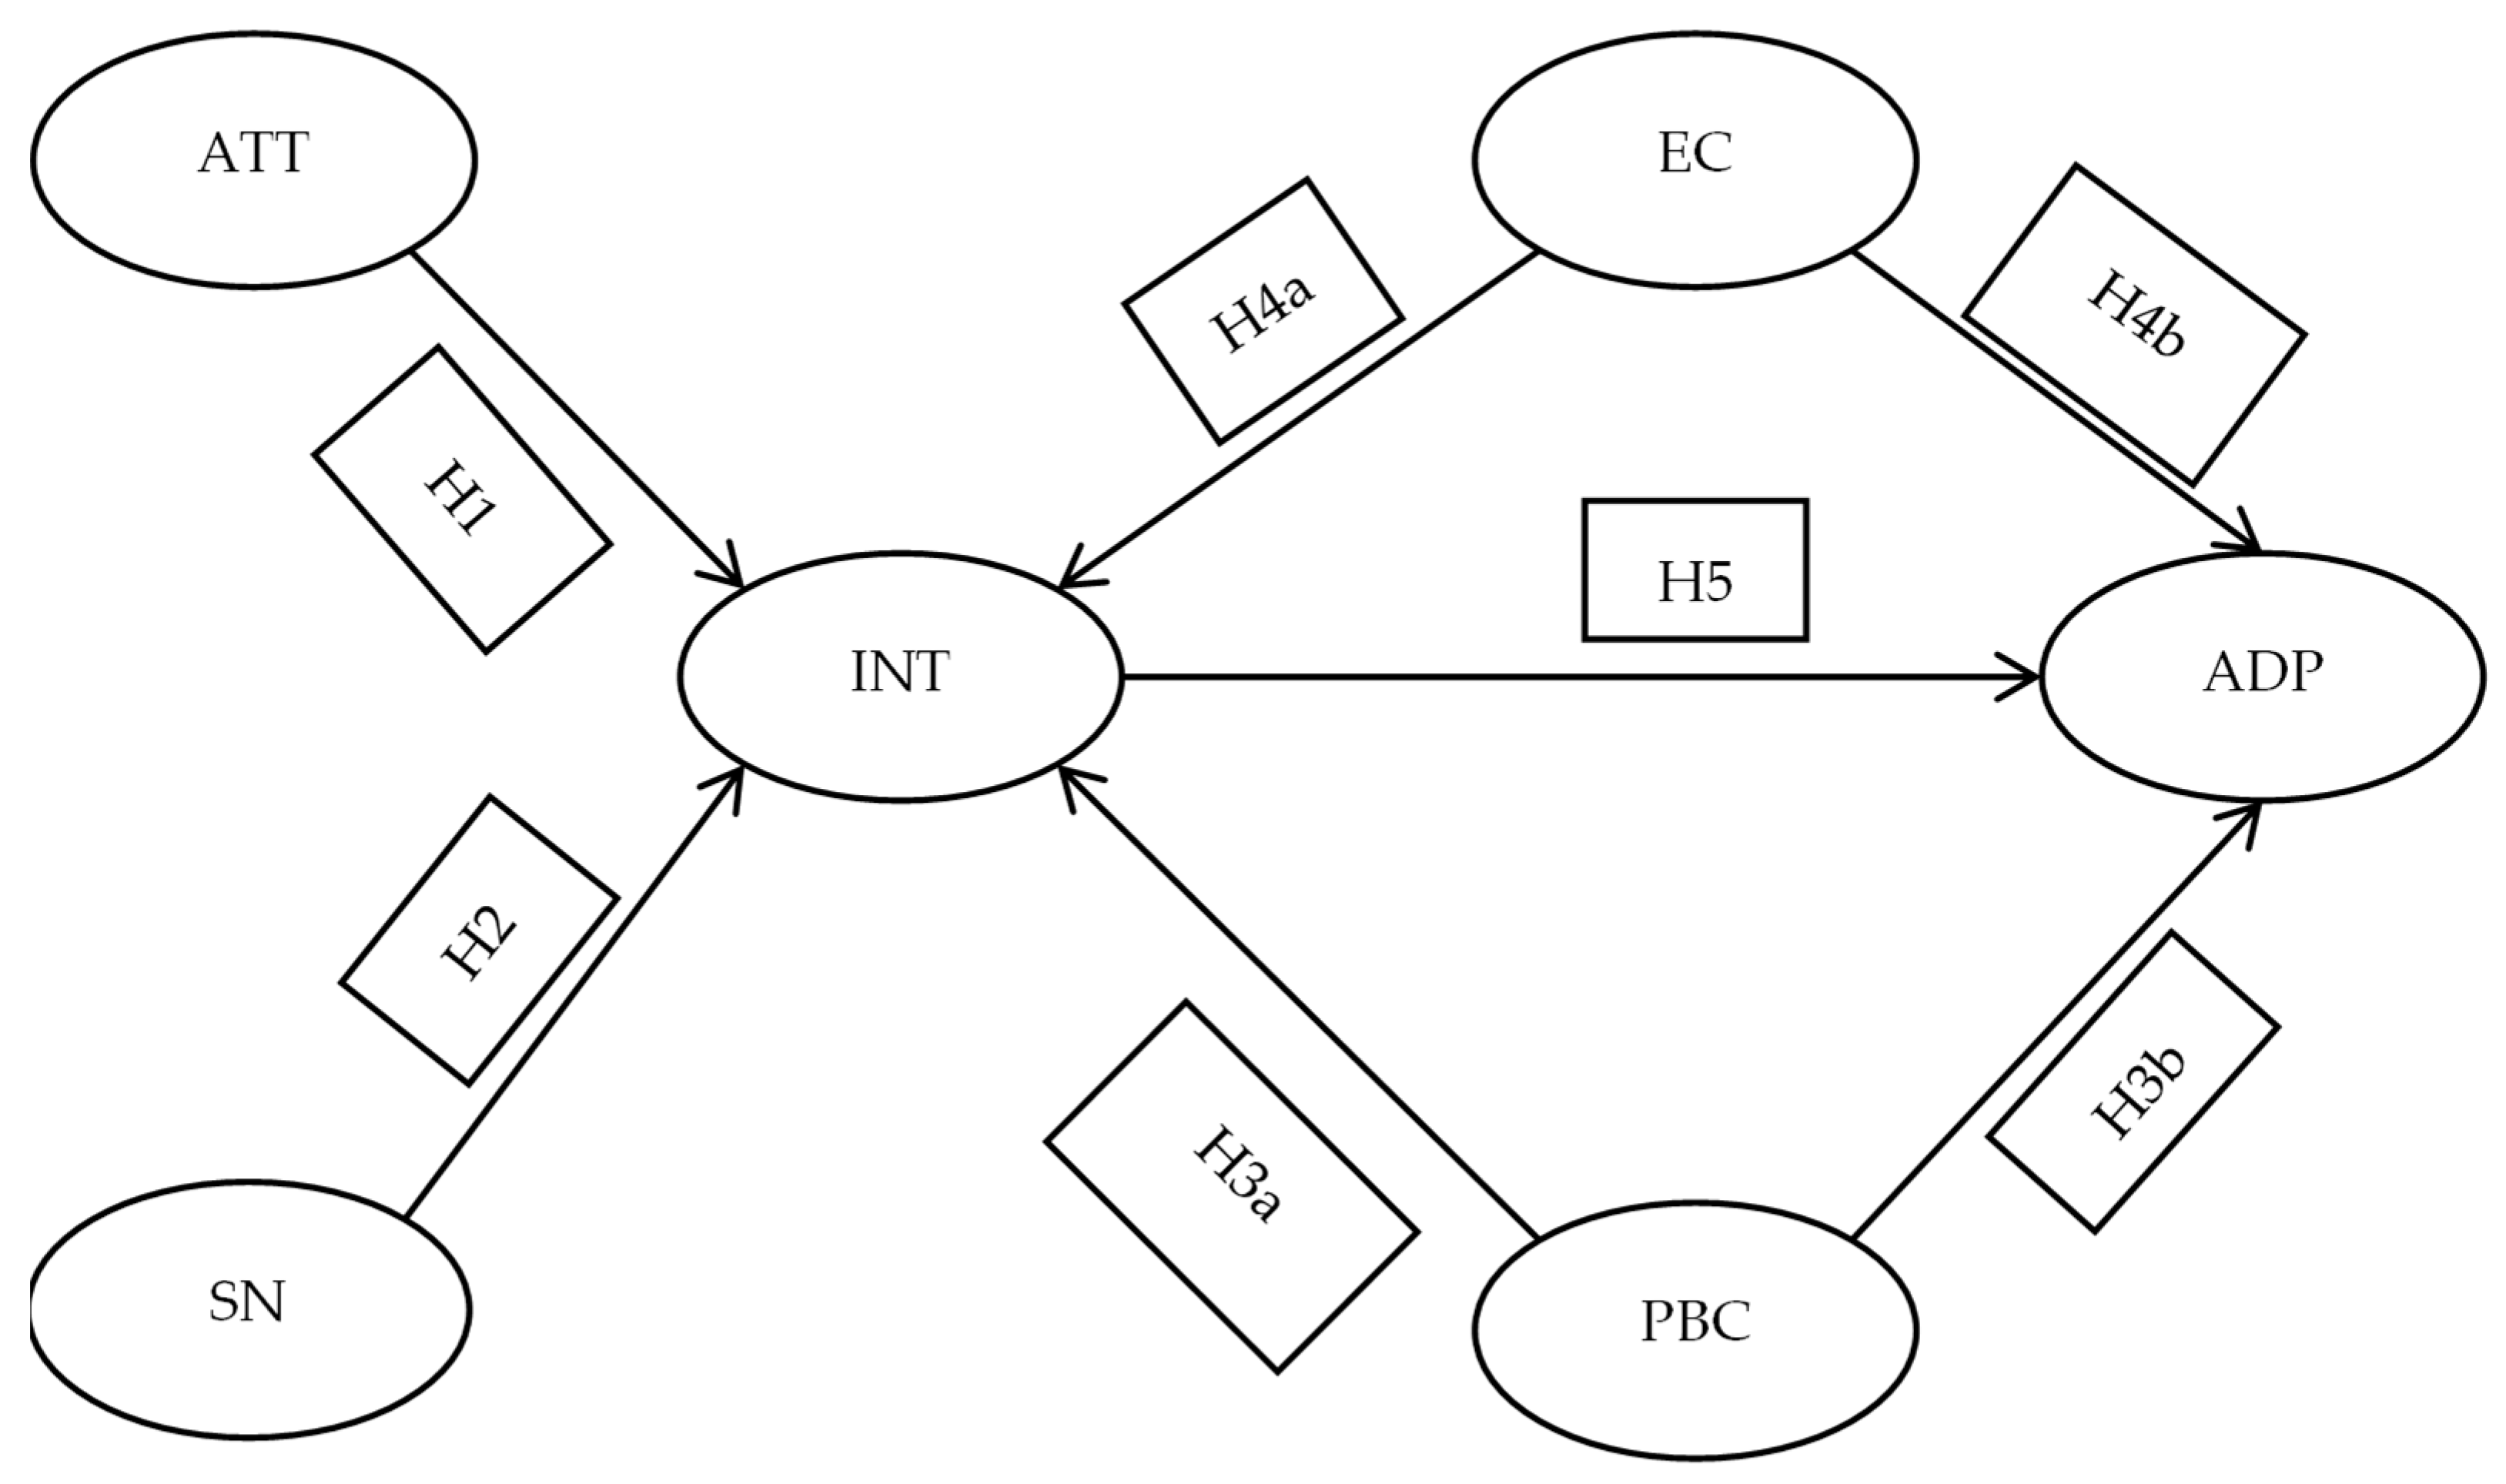
An internal consistency reliability approach was employed to assess the data’s dependability. The data items were organized into groups based on the types of factors, and each factor’s factor loading and internal consistency reliability were checked. For the sake of this study, factor loading is taken to indicate how well a collection of items assesses a single latent notion. Many researchers who have studied the subject of factor loading requirements have suggested a value greater than 0.7 as a significant value [54]. The conceptual framework of the study is given below in Figure 1.
ATT, EC, PBC, and SN show the independent variables in this framework. Meanwhile, the variables INT and adoption of recycling p-waste (ADP) are independent variables. The study checked the impact of selected explanatory variables on both explained variables. However, null hypotheses of the study explained previously in the introduction are shown here as H1, H2, H3a, H3b, H4a, H4b, and H5 in the figure.
4. Results
PLS-SEM graphically shows the hypotheses and the variable linkages in a path model. The outer model (measurement model) and the inner model (structural model) are the two components of PLS-SEM. The measurement model demonstrates the relationship between the constructions and their indicators, while the structural model depicts the link between the constructs. Ordinary least squares (OLS) regression and principal component analysis (PCA) are used in the PLS-SEM technique to estimate the path models [55]. As a consequence, the method for presenting the findings is described by Hair et al. [56], who contend that the measurement model should first be evaluated for validity and reliability before assessing the structural model.
4.1. Demographic Characteristics of Respondents
The demographic characteristics of the study’s respondents are given in Table 1. According to the results, the average age of the farmers was 48.4 years. Less than half of the farmers (49.0%) were in the age group of 46–60 years, 6.7% were with the age of ≤30 years, 32.9% were between 31 to 45 years, and 11.4% were with ≥61 years of age. The average education level was 6.9 years. Less than half of the farmers (47.1%) were with an education of ≤5 years, 38.1% of the farmers were with an education level of 6–10 years, 9.5% had 11–14 years of education, and only 5.2% were with ≥16 year education. The average farming experience was 24 years. Out of the total, 18.1% had ≤10 years of experience, 37.6% of the farmers had experience of 11 to 25 years, 37.1% of the farmers ranged in the category of 26–40 years of experience, and only 7.1% respondents were with more than or equal to 41 years of experience.
The average monthly income of the sampled farmers was PKR 70,549. More than half of the farmers (58.1%) had a total monthly income of PKR 50,001 to PKR 100,000. Out of the total, 30.5% were with a monthly income ≤PKR 50,000, and only 11.4% of the farmers enjoyed a high monthly income (≤PKR 100,001). Less than half of the households (42.4%) had only one employed person in a house. The remaining 41.4% of the households had two members with monthly income, 13.8% of the sampled households had three employed members, and only 2.4% had four employed members in the household. Most of the farmers were married (93.8%), and out of the total sample, 77.6% of the household heads were married. Out of the total sample, 60% of the farmers had cattle, and 55.7% had smartphones. Most of the farmers (88.6%) had no technical education. It was noticed that only a few women (19%) were actively participating in farm-level activities related to pesticides. Most farmers had health (87.1%) and sanitation (91.4%) facilities at the domestic level.
Further, the farmers were asked about the current status of recycling p-waste. They were asked about any system in place to safely collect empty pesticide containers from them, the location of the nearest collection center if there was any, and a collection center at a convenient distance. However, all of them replied that none of these were currently practiced in the study area. However, they showed willingness to adopt if there would be any.
4.2. Measurement Model
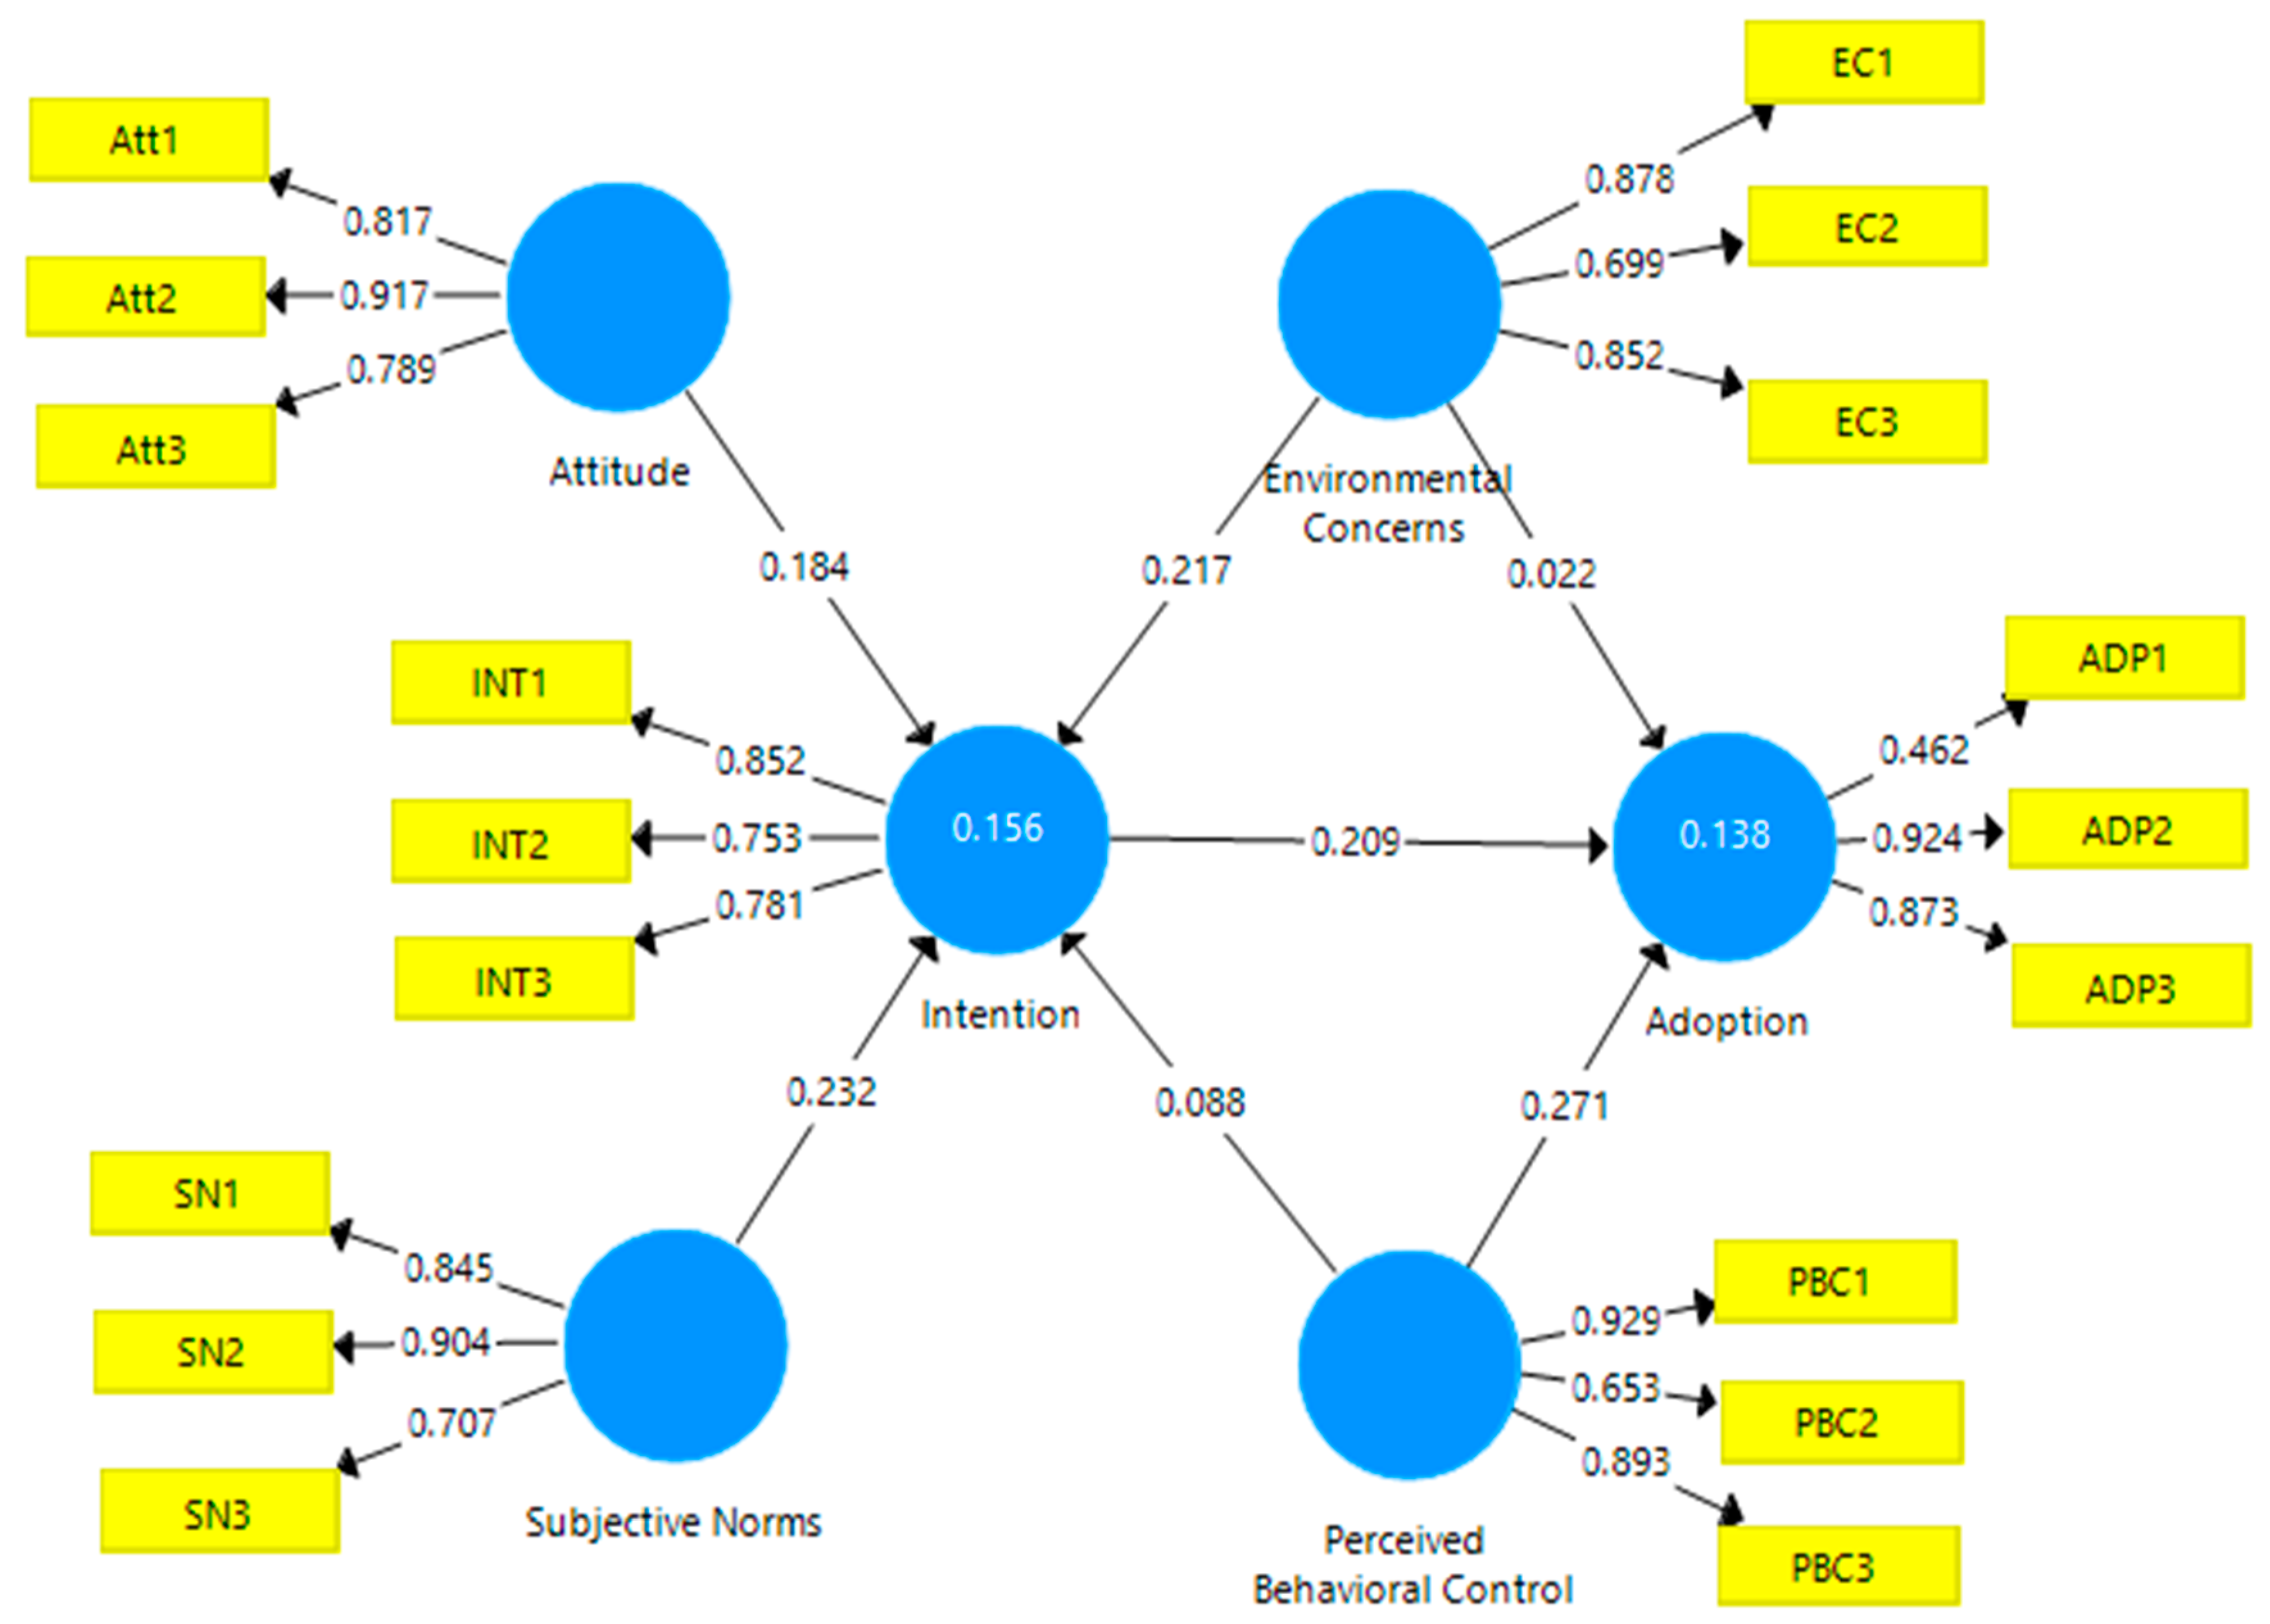
To assess the measurement model, we calculated the indicator reliability, convergent validity, internal consistency, and discriminant validity [57]. Indicator loadings should preferably be greater than 0.70, claim Hair et al. [58]. However, if the average variance extracted (AVE) of the construct is more than 0.50, indicator loadings between 0.40 and 0.70 are likewise appropriate [59]. In the current study, we discovered that all of the indicator loadings range between 0.462 and 0.929 (see Table 2). The AVE of each construct must be greater than 0.50 for convergent validity. However, according to our research, the AVE of each construct is more than 0.50 and ranges from 0.610 to 0.710. As a result, our research meets the requirements for indicator reliability and convergent validity (see Table 2). Figure 2 also displays the measurement model’s path diagram.
Likewise, Cronbach’s alpha (CA), rho_A, and composite reliability (CR) values for internal consistency should preferably be more than 0.70. [60]. According to Hair et al. [56], both CA and CR are measures of internal consistency, although CA is a less accurate metric. We discovered that the CA and CR values were above the suggested cut-off levels, with the CR values ranging from 0.814 to 0.880 and the CA values from 0.642 to 0.804 (see Table 2). Additionally, rho-A values fall between CA and CR values, leading us to believe that our research met the internal consistency criterion.
Figure 2 (path diagram of the measurement model) explains three measurements; the inner model shows the values of path coefficients, the outer model shows the model’s outer loadings, and the R-square values are presented in the circles. In addition, we tested the discriminant validity using the Fornell-Larcker and Heterotrait-Monotrait ratio of correlations (HTMT) criteria [59]. According to the Fornell-Larcker criteria, all constructs included in the study model’s square root of AVE must have greater values than their correlations [61]. We observed that the measurement model satisfied the Fornell-Larcker criteria (see Table 3).
Fornell-Larcker criteria may not always be adequate to determine discriminant validity [59], and therefore, Ali et al. [61] used HTMT criteria in addition to the Fornell-Larcker criterion. According to Hair et al. [56], the HTMT value should not be higher than 0.85, and the HTMT values are less than 0.85 in our study (see Table 3). An analysis of the cross-loading of the items evaluated also offered further support for discriminating validity. According to Table 4, there was no cross-loading issue, and each measurement item had the maximum loading in its appropriate structure. In other words, the current research complies with the requirements of discriminant validity.
4.3. Structural Model
As was already indicated, the structured model evaluation comes after the measurement model’s reliability and when validity has been established. The importance of the path coefficients and the R square value, representing the variance explained in the dependent latent variables are considered in the evaluation of the structural model. The SEM assessment started with a collinearity check, and the findings show no collinearity among the constructs in this research since the VIF values for all seven constructs are less than 5, with a maximum value of 3.253 (see Table 2). Then, we look at the endogenous constructs’ R square values, which show their ability to predict outcomes within samples by following [62]. The estimates accurately matched the data, as shown by the R square values for INT and ADP in a path diagram, which are 0.156 and 0.138, respectively (see Figure 2). The R square values of 0.15 and 0.13 are regarded as medium levels, as indicated by Cohen [32]. As a result, the INT and ADP R square values show that the in-sample predictive power is adequate.
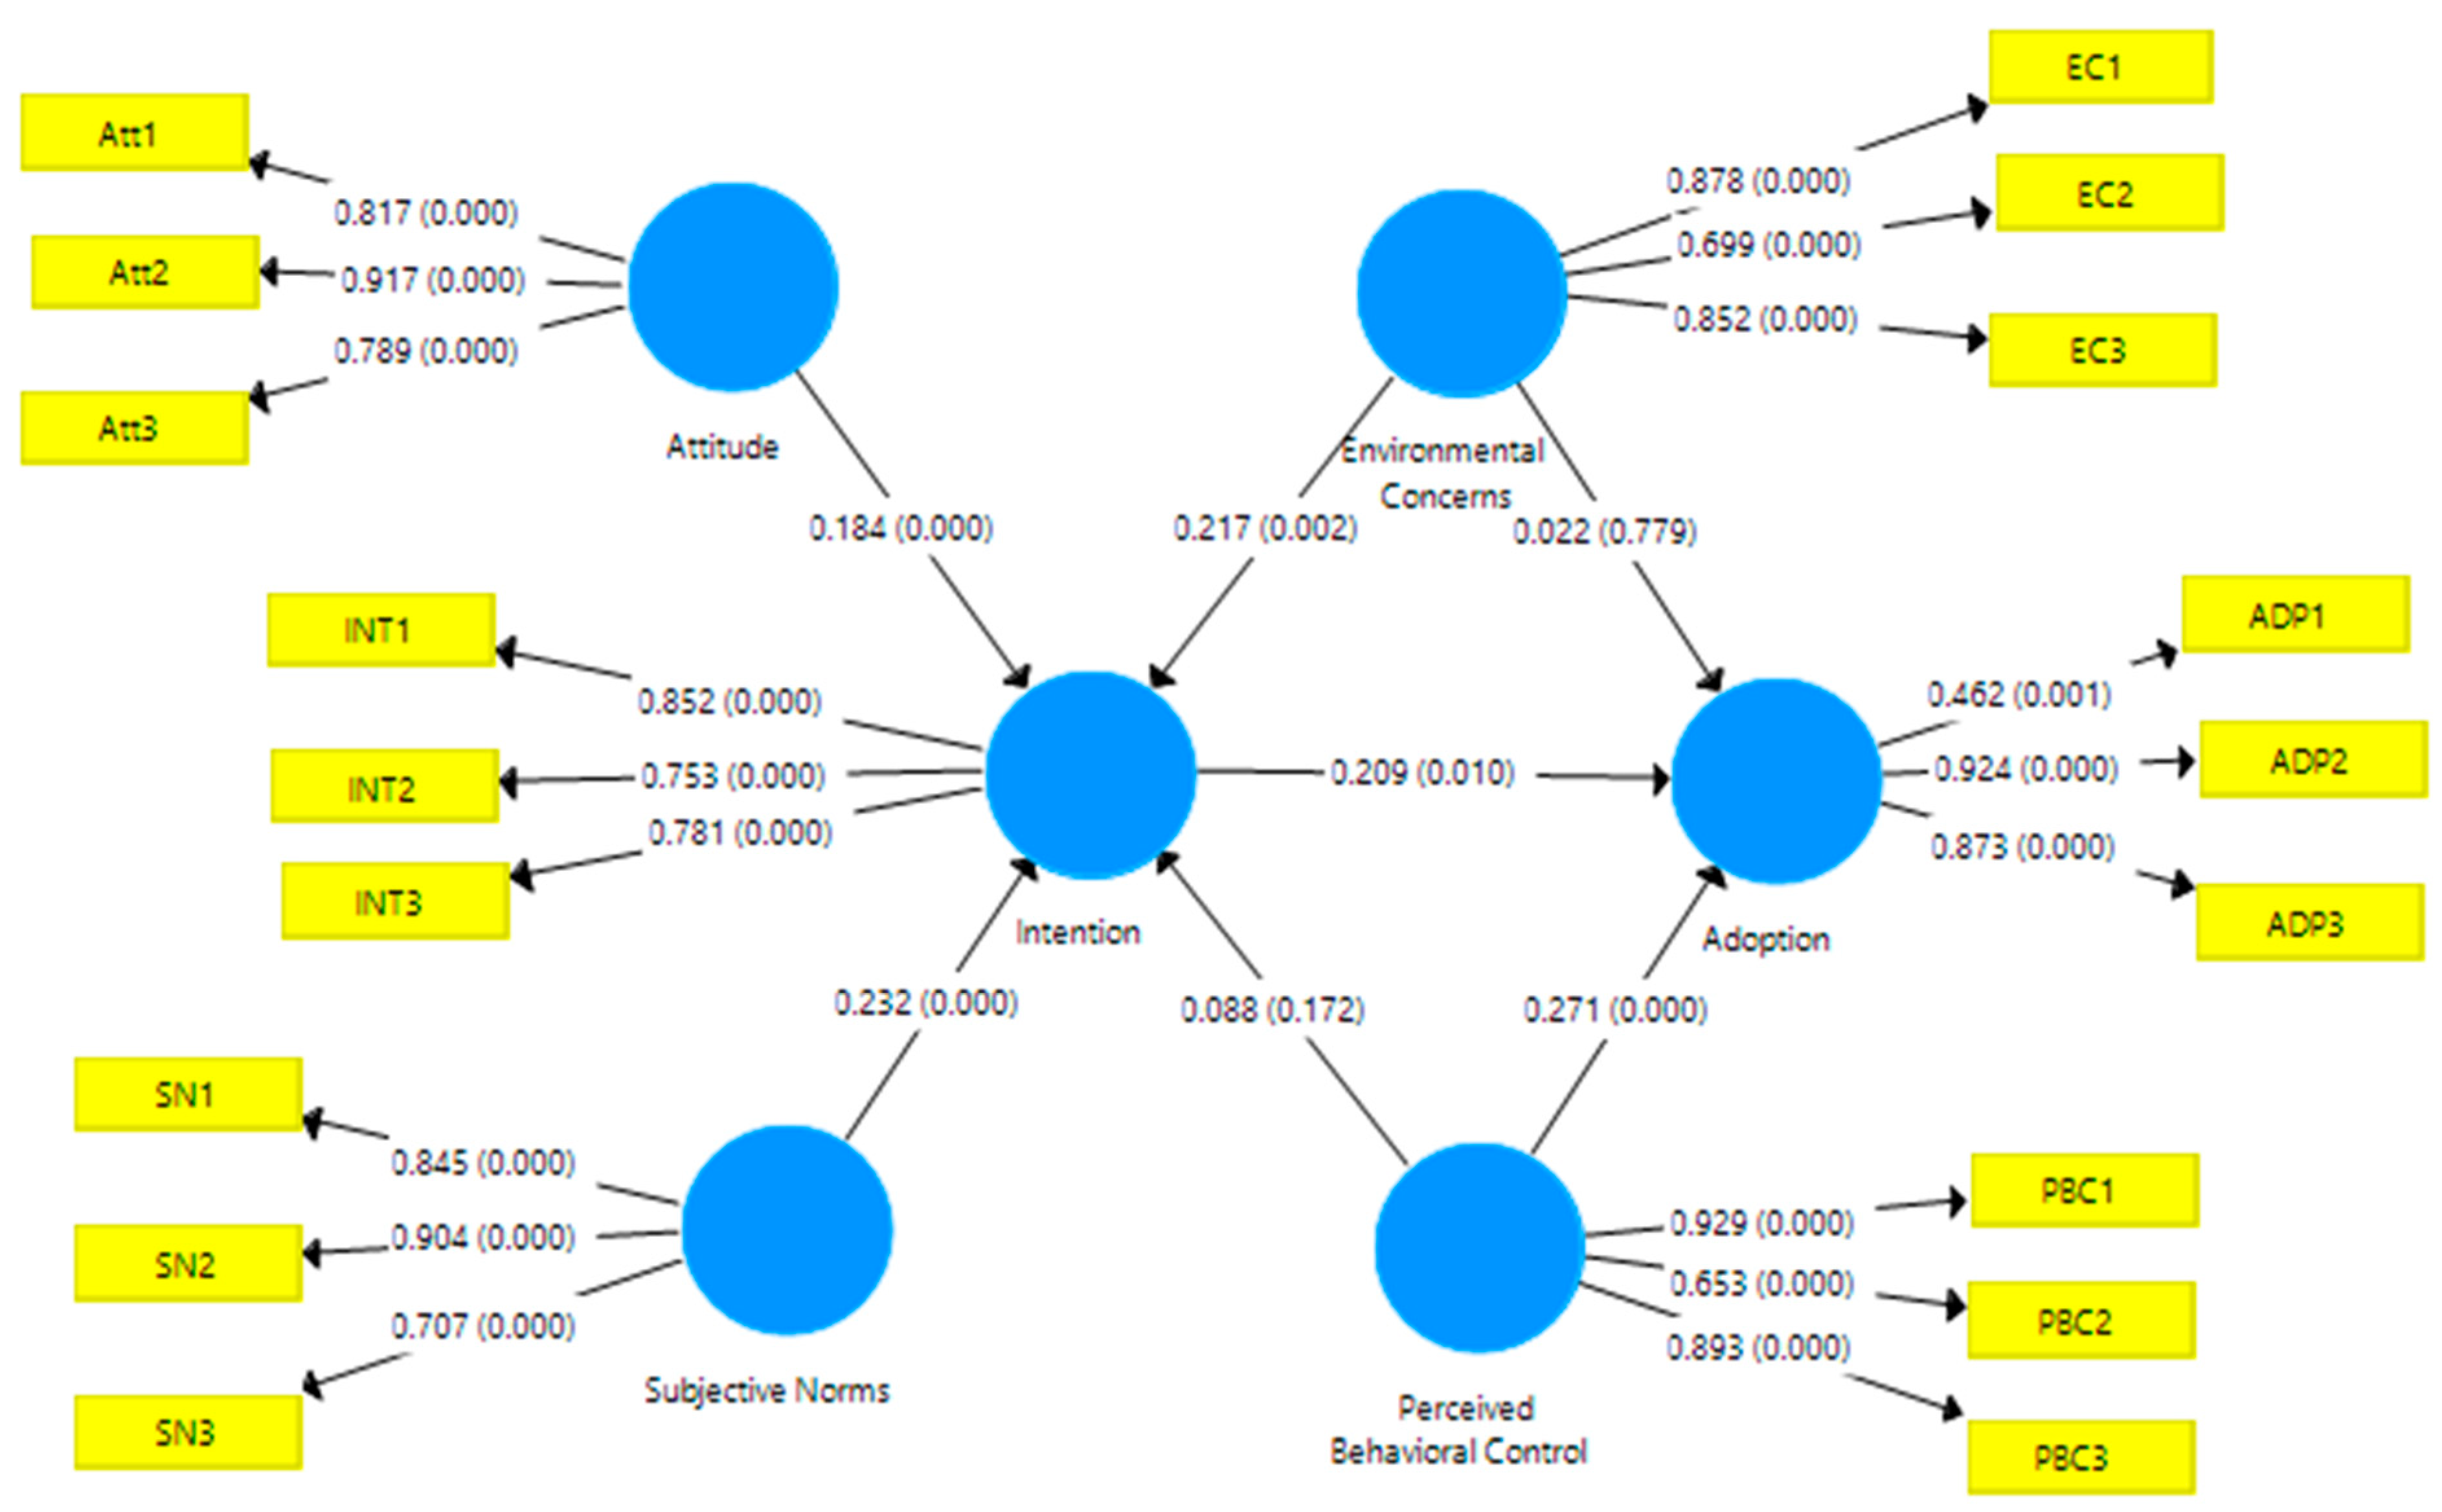
The path coefficients’ significance is evaluated using the bootstrapping approach and 5000 resamples [63]. Smart PLS generates the bootstrap confidence intervals for the measurement. Bootstrapping is an option to generate subsamples from the original samples and strengthens the value of the coefficient. This study used the bootstrapping approach to evaluate the significance of the path coefficients. The results of the bootstrap technique are shown in Table 5, and the structural model in Figure 3 illustrates the link between the hypothesized components. The standardized regression coefficients, known as the path coefficients, explain how each exogenous construct affects the endogenous construct.
The results of path coefficients in Table 5 show that five out of the seven hypotheses were not rejected at a 5% significance level. The results in Table 5 show that attitudes about intentions to recycle p-waste has a direct effect of 0.184, which was significant at p < 0.01. Therefore, H1 was accepted, showing a linear relationship between attitudes toward recycling and intentions to recycle p-waste. In testing H2, the influence of subjective norms on intention was significant at p < 0.01 with a direct impact of 0.232, and the hypothesis was accepted, showing that farmers are more likely to recycle p-waste if they follow influential individuals in their community. In contrast, H3a was rejected because perceived behavioral control has no significant impact on farmers’ intentions to recycle p-waste. Further, H3b was also accepted, showing that the adoption of recycling p-waste is impacted by PBC and has a direct influence of 0.289, which was significant at p < 0.01.
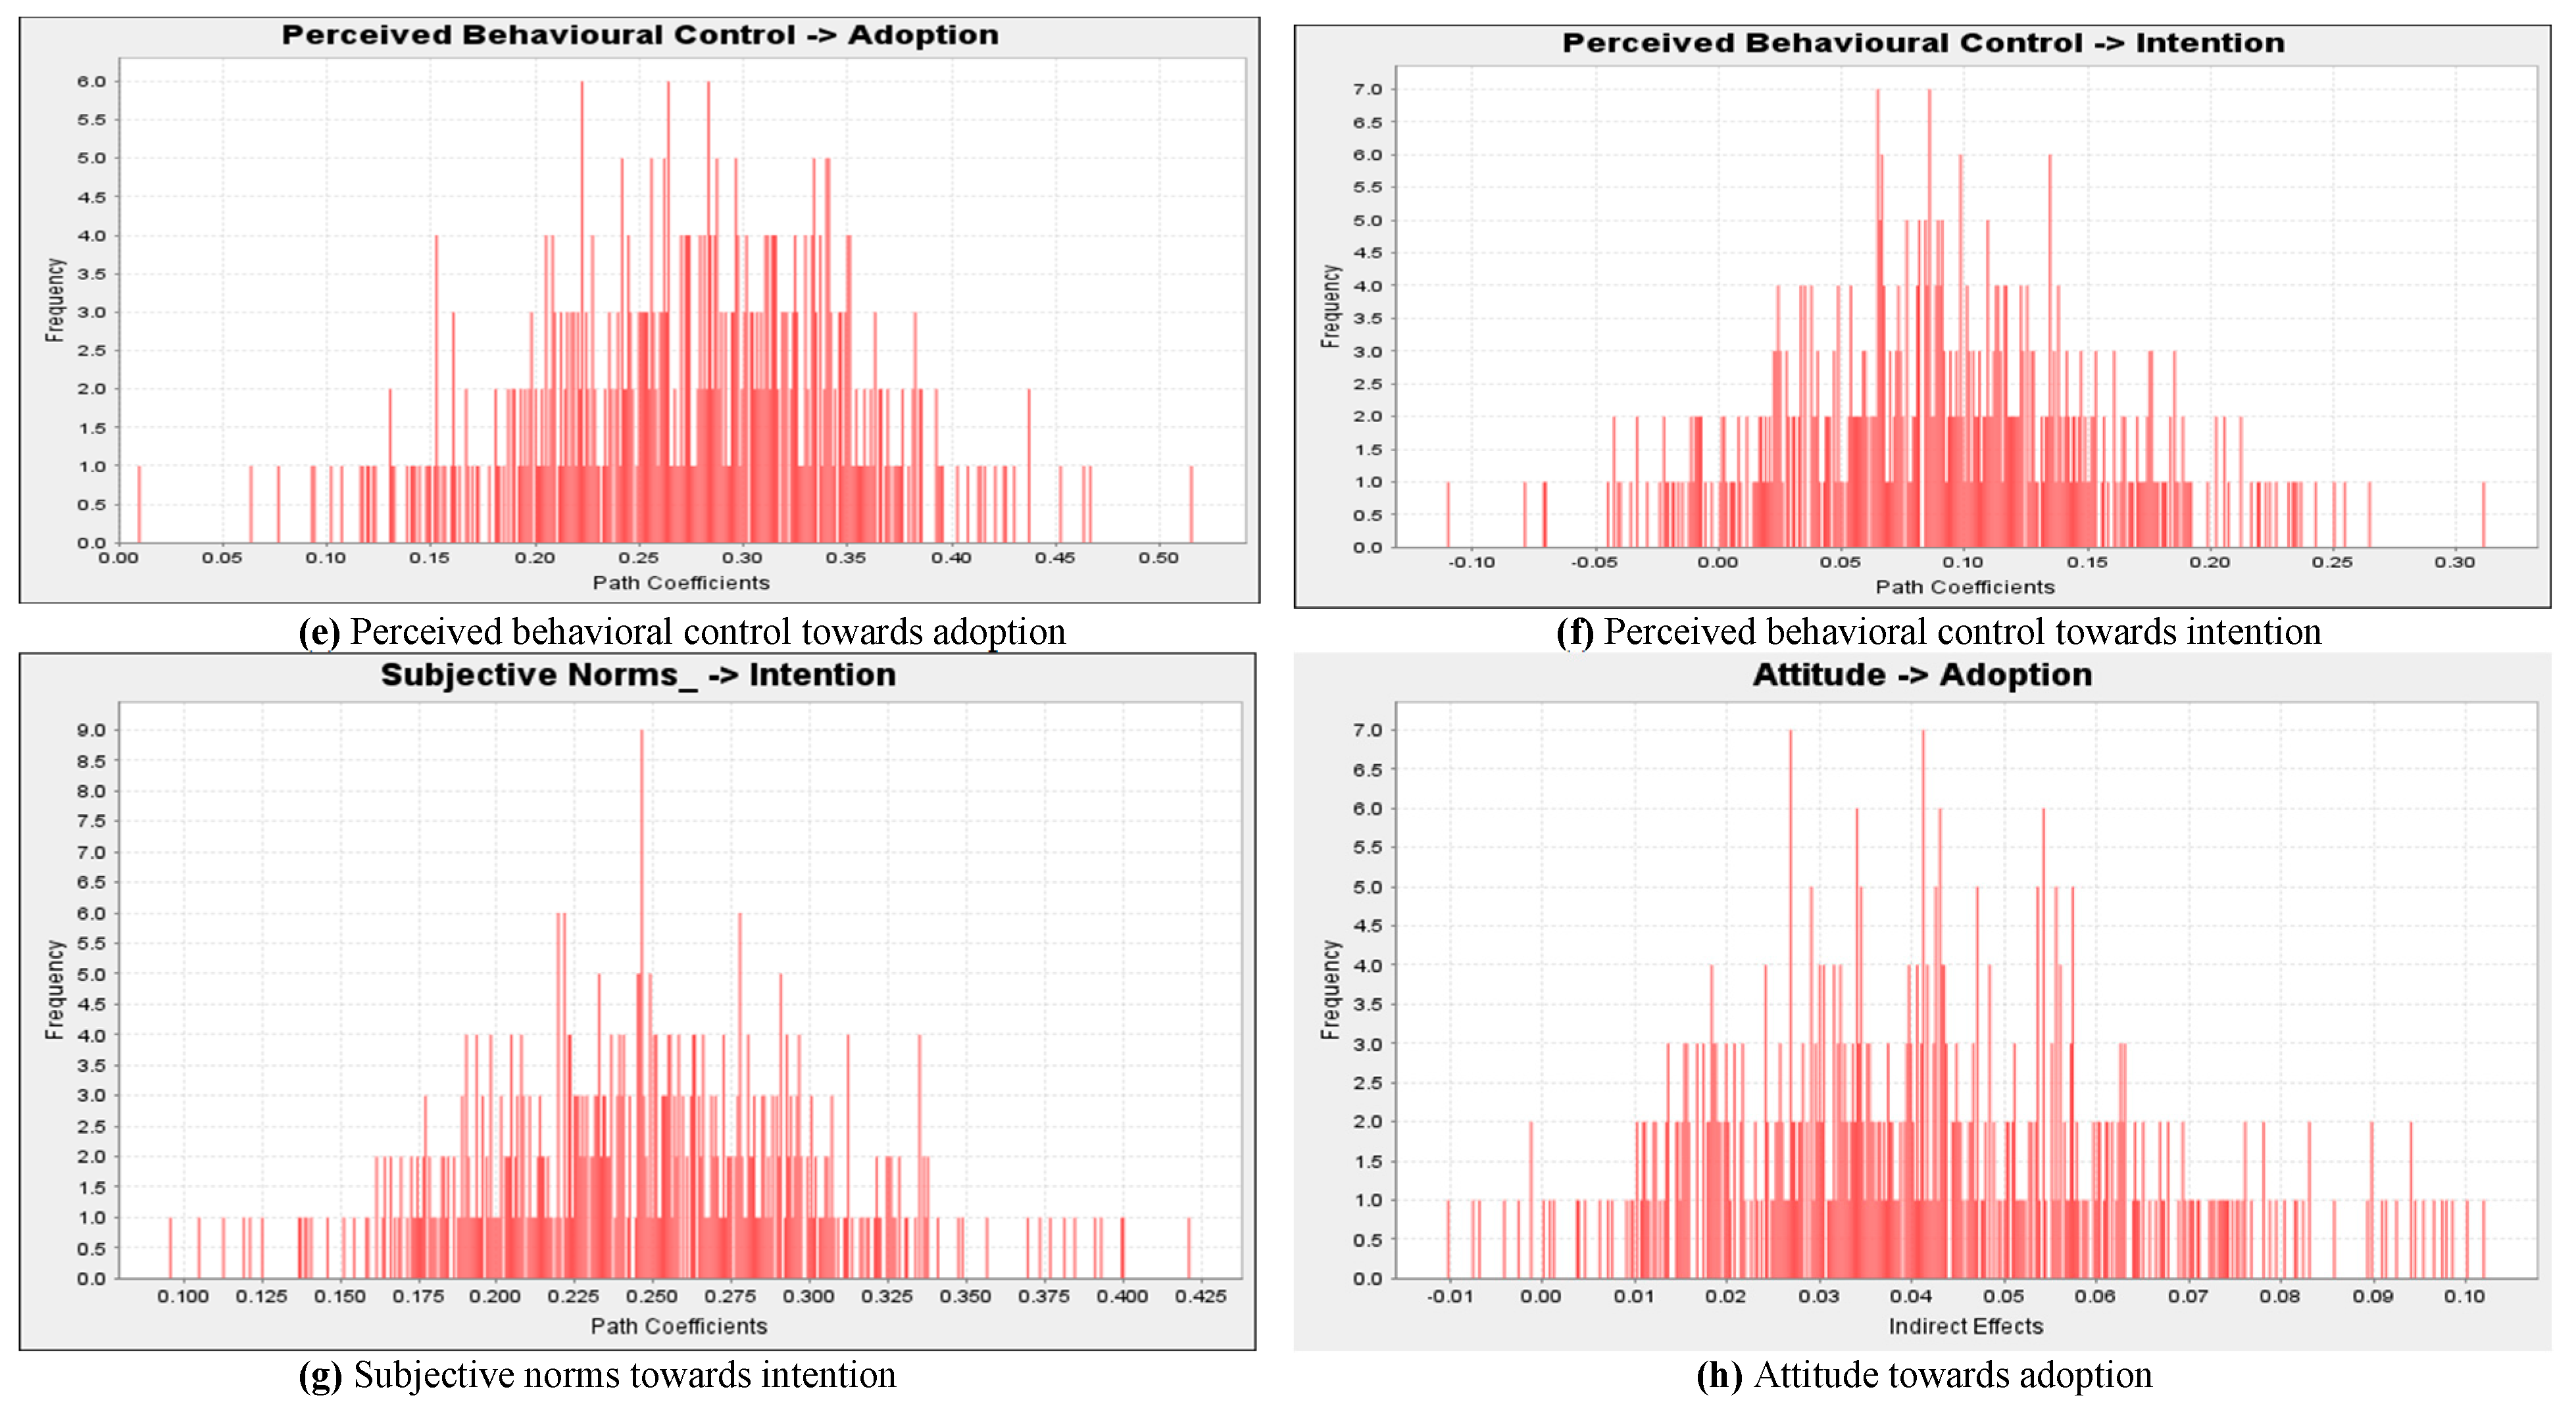
H4a was verified, demonstrating that the more environmental concerns, the better the intentions to recycle p-waste. Similarly, H4a environmental concerns significantly influence intentions toward recycling p-waste at p < 0.01. On the other hand, the H4b hypothesis was not accepted, showing that EC has no direct influence on the adoption of recycling p-waste. The null hypothesis of H5 was confirmed, indicating that the more intentions there are to recycle p-waste, the better the adoption of recycling pesticide container waste would be. Farmers’ intentions were used to test H5 and their direct impact with a value of 0.209 and showed a significant impact on the adoption to recycle p-waste at p < 0.05. PBC has no impact on actual behavior; hence, H5 was disregarded. As a result, 15.6% of the variation in intentions to recycle p-waste could be explained by three independent components: Att, SN, and EC. However, EC has no discernible effect on ADP; only PBC and intentions might account for the 13.8% variation in the adoption of recycling p-waste. Further, histograms of the path coefficient are given in Appendix A Figure A1.
5. Discussion
To guarantee CE practices, the research aims to investigate how end users adopt p-waste recycling practices. The study’s specific goal is to employ an expanded TPB framework to understand better how end users’ adoption behaviors relate to recycling p-waste. As a result, the current research represents an innovative effort to close this gap. A structural model is suggested by utilizing the TPB theoretical framework. Environmental concerns are also included to increase the TPB framework’s explanatory power. This extension suggests that attitude, subjective norms, PBC, and environmental concerns influence an end users’ intentions and adoption of recycling p-waste. We also contend that intentions influence the adoption to recycle p-waste. According to the analysis’s findings, five of the seven hypotheses are supported, while the others are not.
The impact of pesticides on the crop is very significant; they enhance the crop’s production but also pollute the soil and water quality [64]. FAO concluded that insect attacks reduced agricultural productivity in developed countries by 35% before and 20% after harvesting. Hellweg and Geisler [65] explain that pesticides are active biotic materials that escape the environment, and this life cycle of pesticides reduces environmental quality. Most of the farmers throw their p-waste in the field, regular garbage waste, and water canal streams; only some burn them.
The PLS-SEM findings confirmed that attitudes, subjective norms, and environmental concerns significantly positively impacted intentions to recycle p-waste. Perceived behavioral control, however, did not suggest an influence on intentions. The adoption of recycling p-waste, however, seemed to be positively and significantly impacted by perceived behavioral control and intentions to recycle p-waste. Environmental concern does not influence the adoption of recycling p-waste in the sample area but has a significant favorable influence on intentions. The findings seem to support hypothesis H1, which examined the connection between attitude and intention to recycle p-waste, and this result agrees with the findings of Dhir et al. [66]. Similar to H1, H2 is also supported, indicating a positive association between intentions and subjective norms, and this outcome is consistent with earlier research [18].
Additionally, among the factors influencing recycling p-waste, subjective norms impact intentions to recycle. Such results may be attributed to the collectivistic nature of Pakistani culture, which values collaboration and synergy. As a result, the end users’ activities are impacted by how their social circle perceives him or her.
H3a looked at the relationship between PBC and the intention to recycle p-waste. According to the results, H3a is not significant, which is in line with the findings of Shi et al. [67]. The finding of H4a is validated and suggests that environmental concern significantly impacts intentions to recycle p-waste, and this result is consistent with a research on pro environmental intentions [67]. Around the globe, environmental deterioration is a problem. To address the issue, initiatives in the form of CE practices are required.
The findings show that respondents are aware of environmental problems and are eager to implement CE strategies, such as recycling p-waste. As the present research is the first endeavor to comprehend end users’ adoption behavior toward p-waste recycling, our results on H3b and H5 are exceptional in p-waste management. H3b investigated the impact of PBC on the adoption of recycling p-waste, demonstrating that PBC has a significant impact on the adoption of recycling p-waste, and Sanchez et al. [68] showed similar findings about reducing noise pollution. Results also show that PBC strongly predicts p-waste recycling adoption. The findings also show that H5, which looked at the impact of intention on the adoption of p-waste recycling, is validated. This result is in line with other research that found a positive effect of intentions on the adoption of recycling p-waste [69]. Therefore, respondents are aware of the harmful effects of p-waste and are prepared to recycle them.
6. Conclusions and Policy Recommendations
In CE, waste becomes valuable material and can be reused and recycled. The current research uses TPB to evaluate the end users’ adoption of recycling p-waste. The study analyzes seven hypotheses and six variables, for example, attitude, perceived behavioral control, EC, SN, intention, and adoption. Countries are developing strict policies to ensure effective p-waste management since p-waste is becoming a global concern. Most nations require manufacturers to be financially responsible for managing p-waste, which exerts monetary pressure on the producers. P-waste management is also sometimes a nonprofitable business due to uncertainties (quantity, quality, and time of p-waste dumping), which could endanger the survival of concerned firms for CE. Therefore, financial responsibility for p-waste management should be shared among all stakeholders to continue the reuse or recycling of p-waste. According to the study findings, the end users’ adoption of recycling p-waste positively correlates with PBC and recycling intentions. Meanwhile, p-waste recycling intentions indirectly impact the end users’ adoption to recycle p-waste due to attitude, SN, and EC.
The current study provides insightful information about end users’ intentions to support reverse logistics for legislators and decision makers. Several types of research indicate that people are becoming more concerned about environmental damage; results show that they want to adopt recycling behavior. Similarly, we discover a favorable correlation between PBC and the adoption of recycling p-waste. In contrast to Western civilization, Pakistani society is a socialistic society where family, coworkers, friends, role models, and other significant individuals are the main factors affecting people’s decisions. Our findings support this, which shows that SN is the main predictor of intentions to recycle p-waste. SN could be promoted by (1) using role models and influencers to spread information, (2) offering instruction on subjects in universities and schools, (3) planning awareness campaigns, and (4) utilizing social media platforms to interact with others, as many do so to remain in touch and make new relationships. Besides, people appear to have a positive attitude toward recycling p-waste, as evidenced by the positive correlation between attitude, EC, and intentions.
The main conclusions of our study suggest promoting farmers’ recycling behavior of p-waste, boosting social norms, improving farmers’ attitudes, EC, and enhancing PBC. The specific actions that can be taken are as follows: (1) to construct an easy p-waste recycling policy system; (2) to give knowledge of a good environment and the importance of recycling; (3) through the publicity of concern content of p-waste, to convey to farmers to start p-waste recycling; (4) to start pilot programs of recycling in key regions; and (5) by upgrading the framework to help p-waste recycling, to enlarge the number of recycling points, by saving time and the economic cost of the farmers. Additionally, as necessary, incentives can be considered while putting these measures into practice.
The current investigation uses cross-sectional data, which might be affected by social desirability bias. Therefore, further work might confirm our results by using various research designs, such as experimental designs, longitudinal studies, or multisource data, in which social desirability is not a concern. The research is being conducted in the city of Faisalabad, which is located in Pakistan. Study findings may be modified to apply them to other developing nations. As a result, we advocate for more research to evaluate and verify this work in contexts that span different regions to broaden its applicability.
Author Contributions
Conceptualization, A.R. and S.A.A.N.; methodology, M.A.M. and B.H.; writing—review and editing, M.U., A.A.S. and S.A. All authors have read and agreed to the published version of the manuscript.
Funding
This research received no external funding.
Institutional Review Board Statement
Not applicable.
Informed Consent Statement
Not applicable.
Data Availability Statement
Data will be provided upon serious request.
Acknowledgments
The authors are very grateful to all those who provided help during this research.
Conflicts of Interest
The authors declared no potential conflict of interest.
List of Acronyms
| ADP | adoption to recycle p-waste |
| ATT | Attitude |
| CE | circular economy |
| EC | environmental concern |
| INT | intention |
| PLS-PM | partial least squares path modeling |
| PBC | perceived behavioral control |
| p-waste | pesticide container waste |
| PLS | partial least square |
| SEM | simultaneous equation modeling |
| SN | subjective norms |
| TPB | theory of planned behavior |
Appendix A
Figure A1.
Histograms of a path coefficient.


References
- Wang, R.; Yuan, Y.; Yen, H.; Grieneisen, M.; Arnold, J.; Wang, D.; Wang, C.; Zhang, M. A review of pesticide fate and transport simulation at watershed level using SWAT: Current status and research concerns. Sci. Total Environ. 2019, 669, 512–526. [Google Scholar] [CrossRef] [PubMed]
- Silva, V.; Mol, H.G.; Zomer, P.; Tienstra, M.; Ritsema, C.J.; Geissen, V. Pesticide residues in European agricultural soils–A hidden reality unfolded. Sci. Total Environ. 2019, 653, 1532–1545. [Google Scholar] [CrossRef] [PubMed]
- Huici, O.; Skovgaard, M.; Condarco, G.; Jørs, E.; Jensen, O.C. Management of empty pesticide containers—A study of practices in Santa Cruz, Bolivia. Environ. Health Insights 2017, 11, 1178630217716917. [Google Scholar] [CrossRef] [PubMed] [Green Version]
- Damalas, C.A.; Telidis, G.K.; Thanos, S.D. Assessing farmers’ practices on disposal of pesticide waste after use. Sci. Total Environ. 2008, 390, 341–345. [Google Scholar] [CrossRef]
- Jaeken, P.; Debaer, C. Risk of water contamination by plant protection products (PPP) during pre-and post-treatment operations. Annu. Rev. Agric. Eng. 2005, 4, 93–114. [Google Scholar]
- FAO; WHO. International Code of Conduct on the Distribution and Use of Pesticides: Guidelines on Management Options for Empty Pesticide Containers. 2008. Available online: http://www.fao.org/fileadmin/templates/agphome/documents/Pests_Pesticides/Code/Containers08.pdf (accessed on 26 May 2022).
- FAOSTAT. Food Agriculture and Organization. 2019. Available online: http://www.fao.org/faostat/en/#data/QC (accessed on 26 May 2022).
- Waheed, S.; Halsall, C.; Sweetman, A.J.; Jones, K.C.; Malik, R.N. Pesticides contaminated dust exposure, risk diagnosis and exposure markers in occupational and residential settings of Lahore, Pakistan. Environ. Toxicol. Pharmacol. 2017, 56, 375–382. [Google Scholar] [CrossRef] [Green Version]
- AL-Zaidi, A.A.; Baig, M.B.; Muneer SE, T.; Hussain, S.M.; Aldosari, F.O. Farmers’ level of knowledge on the usage of pesticides and their effects on health and environment in northern Pakistan. J. Anim. Plant Sci. 2019, 29, 1501–1515. [Google Scholar]
- Johansen, M.R.; Christensen, T.B.; Ramos, T.M.; Syberg, K. A review of the plastic value chain from a circular economy perspective. J. Environ. Manag. 2022, 302, 113975. [Google Scholar] [CrossRef]
- Christos, A.D. Understanding benefits and risks of pesticide use. Sci. Res. Essays 2009, 4, 945–949. [Google Scholar]
- Bondori, A.; Bagheri, A.; Sookhtanlou, M.; Allahyari, M.S.; Damalas, C.A. Retracted: Pesticide use in cereal production in Moghan Plain, Iran: Risk knowledge and farmers’ attitudes. Crop. Prot. 2018, 110, 117–124. [Google Scholar] [CrossRef]
- Padilla-Rivera, A.; do Carmo, B.B.T.; Arcese, G.; Merveille, N. Social circular economy indicators: Selection through fuzzy delphi method. Sustain. Prod. Consum. 2021, 26, 101–110. [Google Scholar] [CrossRef]
- Huyen, V.N.; Van Song, N.; Thuy, N.T.; Hoan, L.K. Effects of pesticides on farmers’ health in Tu Ky district, Hai Duong province, Vietnam. Sustain. Futures 2020, 2, 100026. [Google Scholar] [CrossRef]
- Sharafi, K.; Pirsaheb, M.; Maleki, S.; Arfaeinia, H.; Karimyan, K.; Moradi, M.; Safari, Y. Knowledge, attitude and practices of farmers about pesticide use, risks, and wastes; a cross-sectional study (Kermanshah, Iran). Sci. Total Environ. 2018, 645, 509–517. [Google Scholar] [CrossRef] [PubMed]
- Shammi, M.; Sultana, A.; Hasan, N.; Rahman, M.M.; Islam, M.S.; Bodrud-Doza, M.; Uddin, M.K. Pesticide exposures towards health and environmental hazard in Bangladesh: A case study on farmers’ perception. J. Saudi Soc. Agric. Sci. 2020, 19, 161–173. [Google Scholar] [CrossRef]
- Ullah, R.; Nawab, K. Pesticides use in Khyber Pakhtunkhwa Province Pakistan: Present scenario. Int. J. Biosci. 2019, 14, 197–208. [Google Scholar]
- Hakeem, K.R.; Akhtar, J.; Sabir, M. Pesticides pollution in agricultural soils of Pakistan. In Soil Science: Agricultural and Environmental Prospectives; Springer: Berlin/Heidelberg, Germany, 2016; pp. 199–229. [Google Scholar]
- Kumar, A. Exploring young adults’e-waste recycling behaviour using an extended theory of planned behaviour model: A cross-cultural study. Resour. Conserv. Recycl. 2019, 141, 378–389. [Google Scholar] [CrossRef]
- Thuy, P.T.; Van Geluwe, S.; Nguyen, V.A.; Van der Bruggen, B. Current pesticide practices and environmental issues in Vietnam: Management challenges for sustainable use of pesticides for tropical crops in (South-East) Asia to avoid environmental pollution. J. Mater. Cycles Waste Manag. 2012, 14, 379–387. [Google Scholar] [CrossRef]
- Buczynska, A.; Szadkowska-Stanczyk, I. Identification of health hazards to rural population living near pesticide dump sites in Poland. Int. J. Occup. Med. Environ. Health 2005, 18, 331–339. [Google Scholar]
- Liu, E.K.; He, W.Q.; Yan, C.R. ‘White revolution’to ‘white pollution’—Agricultural plastic film mulch in China. Environ. Res. Lett. 2014, 9, 091001. [Google Scholar] [CrossRef] [Green Version]
- Plianbangchang, P.; Jetiyanon, K.; Wittaya-Areekul, S. Pesticide use patterns among small-scale farmers: A case study from Phitsanulok, Thailand. Southeast Asian J. Trop. Med. Public Health 2009, 40, 401. [Google Scholar]
- Patarasiriwong, V.; Wongpan, P.; Korpraditskul, R.; Jeerapong, L. Pesticide packaging waste management model for Thailand. J. Environ. Sci. Eng. 2013, 2.1B, 1. [Google Scholar]
- Veiga, M.M. Analysis of efficiency of waste reverse logistics for recycling. Waste Manag. Res. 2013, 31 (Suppl. S10), 26–34. [Google Scholar] [CrossRef] [PubMed]
- Yang, X.; Wang, F.; Meng, L.; Zhang, W.; Fan, L.; Geissen, V.; Ritsema, C.J. Farmer and retailer knowledge and awareness of the risks from pesticide use: A case study in the Wei River catchment, China. Sci. Total Environ. 2014, 497, 172–179. [Google Scholar] [CrossRef] [PubMed]
- Agrawal, S.; Singh, R.K.; Murtaza, Q. A literature review and perspectives in reverse logistics. Resour. Conserv. Recycl. 2015, 97, 76–92. [Google Scholar] [CrossRef]
- Chau, N.D.G.; Sebesvari, Z.; Amelung, W.; Renaud, F.G. Pesticide pollution of multiple drinking water sources in the Mekong Delta, Vietnam: Evidence from two provinces. Environ. Sci. Pollut. Res. 2015, 22, 9042–9058. [Google Scholar] [CrossRef] [PubMed]
- Abadi, B. The determinants of cucumber farmers’ pesticide use behavior in central Iran: Implications for the pesticide use management. J. Clean. Prod. 2018, 205, 1069–1081. [Google Scholar] [CrossRef]
- Aldosari, F.; Mubushar, M.; Baig, M.B. Assessment of farmers knowledge on pesticides and trainings on pesticide waste management in central Punjab–Pakistan. J. Exp. Biol. Agric. Sci. 2018, 6, 168–175. [Google Scholar] [CrossRef]
- Bagheri, A.; Emami, N.; Allahyari, M.S.; Damalas, C.A. Pesticide handling practices, health risks, and determinants of safety behavior among Iranian apple farmers. Hum. Ecol. Risk Assess. Int. J. 2018, 24, 2209–2223. [Google Scholar] [CrossRef]
- Jin, S.; Bluemling, B.; Mol, A.P. Mitigating land pollution through pesticide packages–The case of a collection scheme in Rural China. Sci. Total Environ. 2018, 622, 502–509. [Google Scholar] [CrossRef] [Green Version]
- Bagheri, A.; Bondori, A.; Allahyari, M.S.; Damalas, C.A. Modeling farmers’ intention to use pesticides: An expanded version of the theory of planned behavior. J. Environ. Manag. 2019, 248, 109291. [Google Scholar] [CrossRef]
- Bagheri, A.; Emami, N.; Damalas, C.A.; Allahyari, M.S. Farmers’ knowledge, attitudes, and perceptions of pesticide use in apple farms of northern Iran: Impact on safety behavior. Environ. Sci. Pollut. Res. 2019, 26, 9343–9351. [Google Scholar] [CrossRef] [PubMed]
- Ali, M.P.; Kabir, M.M.M.; Haque, S.S.; Qin, X.; Nasrin, S.; Landis, D.; Holmquist, B.; Ahmed, N. Farmer’s behavior in pesticide use: Insights study from smallholder and intensive agricultural farms in Bangladesh. Sci. Total Environ. 2020, 747, 141160. [Google Scholar] [CrossRef] [PubMed]
- Van den Berg, H.; Gu, B.; Grenier, B.; Kohlschmid, E.; Al-Eryani, S.; da Silva Bezerra, H.S.; Nagpal, B.N.; Chanda, E.; Gasimovg, E.; Velayudhan, R.; et al. Pesticide lifecycle management in agriculture and public health: Where are the gaps? Sci. Total Environ. 2020, 742, 140598. [Google Scholar] [CrossRef] [PubMed]
- Li, M.; Wang, J.; Chen, K.; Wu, L. Willingness and behaviors of farmers’ green disposal of pesticide packaging waste in Henan, China: A perceived value formation mechanism perspective. Int. J. Environ. Res. Public Health 2020, 17, 3753. [Google Scholar] [CrossRef] [PubMed]
- Acerbi, F.; Sassanelli, C.; Taisch, M. A conceptual data model promoting data-driven circular manufacturing. Oper. Manag. Res. 2022, 15, 838–857. [Google Scholar] [CrossRef]
- Sassanelli, C.; Rosa, P.; Rocca, R.; Terzi, S. Circular economy performance assessment methods: A systematic literature review. J. Clean. Prod. 2019, 229, 440–453. [Google Scholar] [CrossRef]
- Vinante, C.; Sacco, P.; Orzes, G.; Borgianni, Y. Circular economy metrics: Literature review and company-level classification framework. J. Clean. Prod. 2020, 288, 125090. [Google Scholar] [CrossRef]
- Bagheri, A.; Emami, N.; Damalas, C.A. Farmers’ behavior towards safe pesticide handling: An analysis with the theory of planned behavior. Sci. Total Environ. 2021, 751, 141709. [Google Scholar] [CrossRef]
- Garbounis, G.; Komilis, D. A modeling methodology to predict the generation of wasted plastic pesticide containers: An application to Greece. Waste Manag. 2021, 131, 177–186. [Google Scholar] [CrossRef]
- Salmenperä, H.; Pitkänen, K.; Kautto, P.; Saikku, L. Critical factors for enhancing the circular economy in waste management. J. Clean. Prod. 2021, 280, 124339. [Google Scholar] [CrossRef]
- Cishahayo, L.; Yang, Q.; Zhu, Y.; Wang, F. Learning behavior, environmental awareness, and agricultural waste management of banana farmers in China. Soc. Behav. Personal. Int. J. 2022, 50, 1–11. [Google Scholar] [CrossRef]
- Zhang, Z.; Malik, M.Z.; Khan, A.; Ali, N.; Malik, S.; Bilal, M. Environmental impacts of hazardous waste, and management strategies to reconcile circular economy and eco-sustainability. Sci. Total Environ. 2022, 807, 150856. [Google Scholar] [CrossRef] [PubMed]
- Velasco-Muñoz, J.F.; Aznar-Sánchez, J.A.; López-Felices, B.; Román-Sánchez, I.M. Circular economy in agriculture. An analysis of the state of research based on the life cycle. Sustain. Prod. Consum. 2022, 34, 257–270. [Google Scholar] [CrossRef]
- Naidoo, V.; Buckley, C.A. Survey of Pesticide Wastes in South Africa and Review of Treatment Options; Water Research Commission: Pretoria, South Africa, 2003. [Google Scholar]
- Wong, S.C.; Lim, J.Y.; Lim, C.S.; Hong, K.T. An Empirical Study on Career Choices Among Undergraduates: A PLS-SEM Hierarchical Component Model (HCM) Approach. Int. J. Hum. Resour. Stud. 2019, 9, 276–298. [Google Scholar] [CrossRef]
- Garson, K. Reframing internationalisation. Can. J. High. Educ. 2016, 46, 19–39. [Google Scholar] [CrossRef]
- Memon, M.A.; Ramayah, T.; Cheah, J.H.; Ting, H.; Chuah, F.; Cham, T.H. PLS-SEM statistical programs: A review. J. Appl. Struct. Equ. Model. 2021, 5, 1–14. [Google Scholar] [CrossRef]
- Hair, J.F., Jr.; Sarstedt, M.; Hopkins, L.; Kuppelwieser, V.G. Partial least squares structural equation modeling (PLS-SEM): An emerging tool in business research. J. Fam. Bus. Strategy 2014, 5, 105–115. [Google Scholar]
- Sreejesh, S.; Mohapatra, S.; Anusree, M.R. Business research design: Exploratory, descriptive and causal designs. In Business Research Methods; Springer: Berlin/Heidelberg, Germany, 2014; pp. 25–103. [Google Scholar]
- Ponelis, S.R. Using interpretive qualitative case studies for exploratory research in doctoral studies: A case of information systems research in small and medium enterprises. Int. J. Dr. Stud. 2015, 10, 535. [Google Scholar] [CrossRef]
- Hair, J.F.; Ringle, C.M.; Sarstedt, M. Partial least squares structural equation modeling: Rigorous applications, better results and higher acceptance. Long Range Plan. 2013, 46, 1–12. [Google Scholar] [CrossRef]
- Fornell, C.; Larcker, D.F. Evaluating structural equation models with unobservable variables and measurement error. J. Mark. Res. 1981, 18, 39–50. [Google Scholar] [CrossRef]
- Mateos-Aparicio, G. Partial least squares (PLS) methods: Origins, evolution, and application to social sciences. Commun. Stat. Theory Methods 2011, 40, 2305–2317. [Google Scholar] [CrossRef] [Green Version]
- Hair, J.F.; Risher, J.J.; Sarstedt, M.; Ringle, C.M. When to use and how to report the results of PLS-SEM. Eur. Bus. Rev. 2019, 31, 2–24. [Google Scholar] [CrossRef]
- Hair, J.F.; Ringle, C.M.; Sarstedt, M. PLS-SEM: Indeed a silver bullet. J. Mark. Theory Pract. 2011, 19, 139–152. [Google Scholar] [CrossRef]
- Hair, J.F.; Sarstedt, M.; Ringle, C.M.; Mena, J.A. An assessment of the use of partial least squares structural equation modeling in marketing research. J. Acad. Mark. Sci. 2012, 40, 414–433. [Google Scholar] [CrossRef]
- Henseler, J.; Ringle, C.M.; Sarstedt, M. A new criterion for assessing discriminant validity in variance-based structural equation modeling. J. Acad. Mark. Sci. 2015, 43, 115–135. [Google Scholar] [CrossRef] [Green Version]
- Ali, F.; Rasoolimanesh, S.M.; Sarstedt, M.; Ringle, C.M.; Ryu, K. An assessment of the use of partial least squares structural equation modeling (PLS-SEM) in hospitality research. Int. J. Contemp. Hosp. Manag. 2018, 30, 514–538. [Google Scholar] [CrossRef] [Green Version]
- Chin, W.W. How to write up and report PLS analyses. In Handbook of Partial Least Squares; Springer: Berlin/Heidelberg, Germany, 2010; pp. 655–690. [Google Scholar]
- Cohen, J. A power primer. In Methodological Issues and Strategies in Clinical Research; Kazdin, A.E., Ed.; American Psychological Association: Washington, DC, USA, 2016; pp. 279–284. [Google Scholar] [CrossRef]
- Rasoolimanesh, S.M.; Roldán, J.L.; Jaafar, M.; Ramayah, T. Factors influencing residents’ perceptions toward tourism development: Differences across rural and urban world heritage sites. J. Travel Res. 2017, 56, 760–775. [Google Scholar] [CrossRef]
- Tudi, M.; Daniel Ruan, H.; Wang, L.; Lyu, J.; Sadler, R.; Connell, D.; Chu, C.; Phung, D.T. Agriculture development, pesticide application and its impact on the environment. Int. J. Environ. Res. Public Health 2021, 18, 1112. [Google Scholar] [CrossRef]
- Hellweg, S.; Geisler, G. Life cycle impact assessment of pesticides. Int. J. Life Cycle Assess. 2003, 8, 310–312. [Google Scholar] [CrossRef]
- Dhir, A.; Koshta, N.; Goyal, R.K.; Sakashita, M.; Almotairi, M. Behavioral reasoning theory (BRT) perspectives on E-waste recycling and management. J. Clean. Prod. 2021, 280, 124269. [Google Scholar] [CrossRef]
- Shi, H.; Wang, S.; Zhao, D. Exploring urban resident’s vehicular PM2. 5 reduction behavior intention: An application of the extended theory of planned behavior. J. Clean. Prod. 2017, 147, 603–613. [Google Scholar] [CrossRef]
- Sánchez, M.; López-Mosquera, N.; Lera-López, F.; Faulin, J. An extended planned behavior model to explain the willingness to pay to reduce noise pollution in road transportation. J. Clean. Prod. 2018, 177, 144–154. [Google Scholar] [CrossRef]
Figure 1.
Research framework for the study.

Figure 2.
Path diagram of the measurement model.

Figure 3.
Path diagram for the structural model.


Table 1.
Demographic characteristics of respondents.
| Variable | Frequency | Percentage (%) | Mean | SD |
|---|---|---|---|---|
| Age (Years) | 48.39 | 10.74 | ||
| ≤30 | 14 | 6.7 | ||
| 31–45 | 69 | 32.9 | ||
| 46–60 | 103 | 49.0 | ||
| ≥61 | 210 | 11.4 | ||
| Education level (Years) | 6.95 | 4.39 | ||
| ≤5 | 99 | 47.1 | ||
| 6–10 | 80 | 38.1 | ||
| 11–14 | 20 | 9.5 | ||
| ≥16 | 11 | 5.2 | ||
| Farming experience (Years) | 24.0 | 11.05 | ||
| ≤10 | 38 | 18.1 | ||
| 11–25 | 79 | 37.6 | ||
| 26–40 | 78 | 37.1 | ||
| ≥61 | 15 | 7.1 | ||
| Total monthly income (PKR) | 70,549.50 | 31,514.53 | ||
| ≤50,000 | 64 | 30.5 | ||
| 50,001–100,000 | 122 | 58.1 | ||
| ≥100,001 | 24 | 11.4 | ||
| Number of household members employed | 1.76 | 0.77 | ||
| 1 | 89 | 42.4 | ||
| 2 | 87 | 41.4 | ||
| 3 | 29 | 13.8 | ||
| 4 | 5 | 2.4 | ||
| Marital status | ||||
| Married | 197 | 93.8 | ||
| Single | 13 | 6.2 | ||
| Household head | ||||
| Yes | 163 | 77.6 | ||
| No | 47 | 22.4 | ||
| Cattle | ||||
| Yes | 126 | 60.0 | ||
| No | 84 | 40.0 | ||
| Smartphone | ||||
| Yes | 93 | 44.3 | ||
| No | 117 | 55.7 | ||
| Technical education | ||||
| Yes | 24 | 11.4 | ||
| No | 186 | 88.6 | ||
| Female participation | ||||
| Yes | 40 | 19.0 | ||
| No | 170 | 81.0 | ||
| Health facilities | ||||
| Yes | 183 | 87.1 | ||
| No | 27 | 12.9 | ||
| Sanitation facilities | ||||
| Yes | 192 | 91.4 | ||
| No | 18 | 8.6 |
Table 2.
Items with VIF, outer loadings, CA, rho_A, CR, and AVE.
| Construct | Items | VIF | Loadings | CA | Rho_A | CR | AVE |
|---|---|---|---|---|---|---|---|
| Adoption to recycle pesticide container waste | ADP1 | 1.046 | 0.462 | 0.642 | 0.765 | 0.814 | 0.610 |
| ADP2 | 2.434 | 0.924 | |||||
| ADP3 | 2.382 | 0.873 | |||||
| Attitude | Att1 | 1.471 | 0.817 | 0.804 | 0.883 | 0.880 | 0.710 |
| Att2 | 2.341 | 0.917 | |||||
| Att3 | 2.053 | 0.789 | |||||
| Environmental concerns | EC1 | 2.358 | 0.878 | 0.738 | 0.745 | 0.853 | 0.662 |
| EC2 | 1.162 | 0.699 | |||||
| EC3 | 2.342 | 0.852 | |||||
| Intentions | INT1 | 1.931 | 0.852 | 0.717 | 0.728 | 0.838 | 0.634 |
| INT2 | 1.170 | 0.753 | |||||
| INT3 | 1.884 | 0.781 | |||||
| Perceived behavioral control | PBC1 | 3.253 | 0.929 | 0.771 | 0.842 | 0.870 | 0.696 |
| PBC2 | 1.193 | 0.653 | |||||
| PBC3 | 3.166 | 0.893 | |||||
| Subjective norms | SN1 | 1.557 | 0.845 | 0.768 | 0.828 | 0.862 | 0.677 |
| SN2 | 2.050 | 0.904 | |||||
| SN3 | 1.548 | 0.707 |
Table 3.
Results of discriminant validity.
| Fornell-Larcker Criterion | Att | EC | INT | PBC | SN | ADP |
|---|---|---|---|---|---|---|
| Att | 0.843 | |||||
| EC | 0.148 | 0.813 | ||||
| INT | 0.239 | 0.234 | 0.796 | |||
| PBC | 0.125 | 0.200 | 0.142 | 0.834 | ||
| SN | 0.049 | −0.120 | 0.210 | −0.056 | 0.823 | |
| ADP | 0.249 | 0.125 | 0.253 | 0.305 | −0.113 | 0.781 |
| HTMT ratio | ||||||
| Att | ||||||
| EC | 0.182 | |||||
| INT | 0.275 | 0.310 | ||||
| PBC | 0.148 | 0.288 | 0.185 | |||
| SN | 0.103 | 0.197 | 0.243 | 0.082 | ||
| ADP | 0.363 | 0.208 | 0.402 | 0.392 | 0.169 | |
Table 4.
Cross-loadings of the outer model.
| Items | Att | EC | INT | PBC | SN | ADP |
|---|---|---|---|---|---|---|
| Att1 | 0.817 | 0.115 | 0.201 | 0.194 | −0.016 | 0.255 |
| Att2 | 0.917 | 0.146 | 0.249 | 0.051 | 0.116 | 0.209 |
| Att3 | 0.789 | 0.104 | 0.104 | 0.074 | −0.025 | 0.144 |
| EC1 | 0.144 | 0.878 | 0.196 | 0.205 | −0.131 | 0.136 |
| EC2 | 0.139 | 0.699 | 0.205 | 0.078 | −0.038 | 0.068 |
| EC3 | 0.069 | 0.852 | 0.165 | 0.202 | −0.121 | 0.096 |
| INT1 | 0.167 | 0.189 | 0.852 | 0.115 | 0.188 | 0.268 |
| INT2 | 0.247 | 0.210 | 0.753 | 0.146 | 0.216 | 0.148 |
| INT3 | 0.135 | 0.143 | 0.781 | 0.057 | 0.055 | 0.183 |
| PBC1 | 0.183 | 0.110 | 0.140 | 0.929 | −0.081 | 0.321 |
| PBC2 | 0.021 | 0.272 | 0.115 | 0.653 | 0.015 | 0.191 |
| PBC3 | 0.071 | 0.158 | 0.094 | 0.893 | −0.055 | 0.225 |
| SN1 | 0.008 | −0.158 | 0.192 | −0.048 | 0.845 | −0.163 |
| SN2 | 0.048 | −0.044 | 0.200 | −0.045 | 0.904 | −0.053 |
| SN3 | 0.089 | −0.107 | 0.100 | −0.050 | 0.707 | −0.049 |
| ADP1 | 0.283 | −0.029 | 0.261 | 0.086 | 0.044 | 0.462 |
| ADP2 | 0.207 | 0.145 | 0.190 | 0.348 | −0.160 | 0.924 |
| ADP3 | 0.133 | 0.130 | 0.179 | 0.215 | −0.090 | 0.873 |
Table 5.
Result of the structural model.
| Hypothesis | Path Coef. | Std. Error | T Stat. | p-Values | Statistical Support | |
|---|---|---|---|---|---|---|
| H1 | Att → INT | 0.184 | 0.050 | 3.674 | 0.000 | Yes |
| H2 | SN → INT | 0.232 | 0.063 | 3.692 | 0.000 | Yes |
| H3a | PBC → INT | 0.088 | 0.066 | 1.347 | 0.179 | No |
| H3b | PBC → ADP | 0.289 | 0.068 | 4.253 | 0.000 | Yes |
| H4a | EC → INT | 0.217 | 0.072 | 3.019 | 0.003 | Yes |
| H4b | EC → ADP | 0.068 | 0.081 | 0.833 | 0.405 | No |
| H5 | INT → ADP | 0.209 | 0.082 | 2.550 | 0.011 | Yes |
Disclaimer/Publisher’s Note: The statements, opinions and data contained in all publications are solely those of the individual author(s) and contributor(s) and not of MDPI and/or the editor(s). MDPI and/or the editor(s) disclaim responsibility for any injury to people or property resulting from any ideas, methods, instructions or products referred to in the content. |
© 2022 by the authors. Licensee MDPI, Basel, Switzerland. This article is an open access article distributed under the terms and conditions of the Creative Commons Attribution (CC BY) license (https://creativecommons.org/licenses/by/4.0/).
Share and Cite
MDPI and ACS Style
Raza, A.; Naqvi, S.A.A.; Mehdi, M.A.; Usman, M.; Ali, S.; Shah, A.A.; Hussain, B. An Analysis of the Circular Economy Practices of Pesticide Container Waste in Pakistan. Recycling 2023, 8, 4. https://doi.org/10.3390/recycling8010004
AMA Style
Raza A, Naqvi SAA, Mehdi MA, Usman M, Ali S, Shah AA, Hussain B. An Analysis of the Circular Economy Practices of Pesticide Container Waste in Pakistan. Recycling. 2023; 8(1):4. https://doi.org/10.3390/recycling8010004
Chicago/Turabian StyleRaza, Ali, Syed Asif Ali Naqvi, Muhammad Abuzar Mehdi, Muhammad Usman, Sadia Ali, Ashfaq Ahmad Shah, and Bilal Hussain. 2023. "An Analysis of the Circular Economy Practices of Pesticide Container Waste in Pakistan" Recycling 8, no. 1: 4. https://doi.org/10.3390/recycling8010004