Article

A High-Performance Vortex Adjustment Design for an Air-Cooling Battery Thermal Management System in Electric Vehicles

1
School of Engineering, University of Tasmania, Hobart, TAS 7005, Australia
2
School of Management, Guizhou University, Guiyang 550025, China
3
School of Mechanical and Automotive Engineering, Shanghai University of Engineering Science, 333 Longteng Road, Songjiang, Shanghai 201620, China
*
Author to whom correspondence should be addressed.
Batteries 2023, 9(4), 208; https://doi.org/10.3390/batteries9040208
Submission received: 22 January 2023 / Revised: 25 March 2023 / Accepted: 29 March 2023 / Published: 30 March 2023
(This article belongs to the Special Issue Thermal Management System for Lithium-Ion Batteries)

Abstract

:
To boost the performance of the air-cooling battery thermal management system, this study designed a novel vortex adjustment structure for the conventional air-cooling battery pack used in electric vehicles. T-shape vortex generating columns were proposed to be added between the battery cells in the battery pack. This structure could effectively change the aerodynamic patterns and thermodynamic properties of the battery pack, including turbulent eddy frequency, turbulent kinetic energy, and average Reynolds number, etc. The modified aerodynamic patterns and thermodynamic properties increased the heat transfer coefficient with little increase in energy consumption and almost no additional cost. Different designs were also evaluated and optimized under different working conditions. The results showed that the cooling performance of the Design 1 improved at both low and high air flow rates. At a small flow rate of 11.88 L/s, the Tmax and ΔT of Design 1 are 0.85 K and 0.49 K lower than the conventional design with an increase in pressure drop of 0.78 Pa. At a relative high flow rate of 47.52 L/s, the Tmax and ΔT of the Design 1 are also 0.46 K and 0.13 K lower than the conventional design with a slight increase in pressure drop of 17.88 Pa. These results demonstrated that the proposed vortex generating design can improve the cooling performance of the battery pack, which provides a guideline for the design and optimization of the high-performance air-cooling battery thermal management systems in electric vehicles.

1. Introduction

In recent years, lithium-ion batteries (LIB) have been dominating the energy storage component market for electric vehicles (EV) [1]. For every EV original equipment manufacturer (OEM), their product reliability and safety are always the priority in list of company missions and responsibilities [2]. Thermal runaway is a serious safety concern for all the LIB systems [3]. The fire and explosive failures of the LIB system due to the ineffective battery thermal management can cause catastrophic losses to OEMs and EV owners [4]. To tackle this problem, battery thermal management system (BTMS) plays a critical role to provide a suitable operating thermal environment for the LIB cells [5].
The major cooling methods for the commercial EV BTMS are air cooling and liquid cooling [6]. Just like every other cooling technology, both technical paths have their unique pros and cons [7]. Liquid-cooling BTMS performs better than other technologies due to its superior control of the maximum temperature and temperature difference performances within the battery packs to prolong battery cell cycle life [8]. Especially for the cold-plate liquid-cooling technique, Pulugundla et al. [9] had proven the higher heat transfer rate of a liquid-cooling cold-plate design with optimal channel size and configuration over passive or forced-air cooling BTMS by three dimensional time-accurate computational fluid dynamics simulations. Bakhshi et al. [10] developed novel face liquid-cooling configuration to achieve an optimal overall cooling performance with the lowest cell temperature and thermal gradient across battery pack under all operating conditions. Dubey et al. [11] compared cold-plate based and immersion liquid-cooling BTMS designs by three dimensional time-accurate methods and found that immersion liquid-cooling could deliver lower maximum temperature and temperature gradients at high discharging rates in addition to a smaller coolant pressure drop. Admittedly, liquid-cooling has been adopted as the mainstream battery cooling approach for many North American and European OEMs due to its extraordinary cooling capacity and compact arrangement [12].
On the hand, air-cooling BTMS is well-known for its robust performance, low cost, simple structure, and safe character (no coolant leakage risk) [13]. With more and more fierce competitions in the global EV industry, cost reduction becomes a fundamental methodology for each OEM to make some profits and survive in the market. It is still favored by many Asian OEMs such as Toyota and SAIC for their small vehicle models. Current EV air-cooling BTMS are all designed for pouch or prismatic cells. There are almost no air-cooling applications for cylindrical cells. To find the missing piece of the puzzle, this research will be focusing on optimizing the cooling performance of a basic air-cooling BTMS design of cylindrical cells for the EV battery thermal management to improve this existing gap.
The air-cooling BTMS improvement has been a hot research topic in the last decade. The major improving methods are categorized as battery pack design, cooling channel, inlet/outlet design, thermally conductive materials, and secondary channel design improvement [14]. Zhao et al. [15] proposed a novel variable cell spacing layout for the battery pack design and improved the cooling performance of the conventional constant spacing one. They also created an innovative trapezoid layout for the battery pack design to increase the heat transfer coefficient [16]. For the cooling channel improvement method, Liu et al. [17] combined Z-type and U-type channel designs into a J-type one to optimize the control strategy according to the feedback of the thermal conditions of the battery pack. By alternating the positions and sizes of the inlets and outlets, Zhao et al. investigated a double inlets double outlets battery pack and optimized the outlet dimension to reach the highest cooling performance. Li et al. [18] invented a double silica plates with copper mesh inside structure to enhance the heat dissipation performance of the pouch cell battery pack. Zhang et al. [19] added an additional double-layer plates to increase the thermal conductivity between battery cells and the cooling air. The plate is made of anodized Aluminium 6061, which is a very effective thermally conductive material.
The vortex adjustment structure design can be categorized into the secondary channel design improvement. Early in 2006, Chomdee et al. [20] designed a delta winglet vortex generator for the air cooling of electronic modules. It was proven to enhance the adiabatic heat transfer coefficients. Ye et al. [21] developed a cylinder vortex generator at the inlet of the air flow channel and improved the temperature uniformity of the battery pack effectively. In recent years, the vortex generator designs are becoming more popular for the air-cooling BTMS improvement. Mondal et al. [22] added winglet configurations as the vortex generators in the air flow channels to increase the overall heat transfer. The results showed that the maximum temperature and temperature difference within the cells were reduced. Xie et al. [23] compared four mainstream types of the vortex generators: delta wing, delta winglet, rectangular wing, and rectangular winglet. The delta winglet design had been proven to generate more vortices and mix different air flows more sufficiently. Shahid et al. [24] introduced a multiple delta winglet vortex generator design to enhance the turbulence before the air flow enters the battery pack. The temperature uniformity was substantially improved. Different from those conventional vortex generators usually placed on the wall surface or inlet of the battery packs, this study innovatively embedded the new T-shape vortex generating columns (VGCs) between the battery cells through the battery pack to change the patterns of the turbulent eddy frequency (TEF) and turbulent kinetic energy (TKE), which substantially affect the average Reynolds number (Re) and average surface Nusselt number (Nu) of the air flow field. Hence the heat transfer between the cooling air and battery might be increased due to the improvement of the overall heat transfer coefficient. The T-shape VGC is ultimately a simple structure which does not largely increase the cost while it effectively improves the cooling performance.
The main objective of this research is to find a simple structure, high reliability, and low manufacturing cost air-cooling BTMS design to deliver high cooling performance for EV cylindrical cell battery packs. To achieve this objective, the novel VGC structures were added to a basic air-cooling BTMS to enhance the heat transfer by changing its TEF, TKE, Re, and Nu patterns.

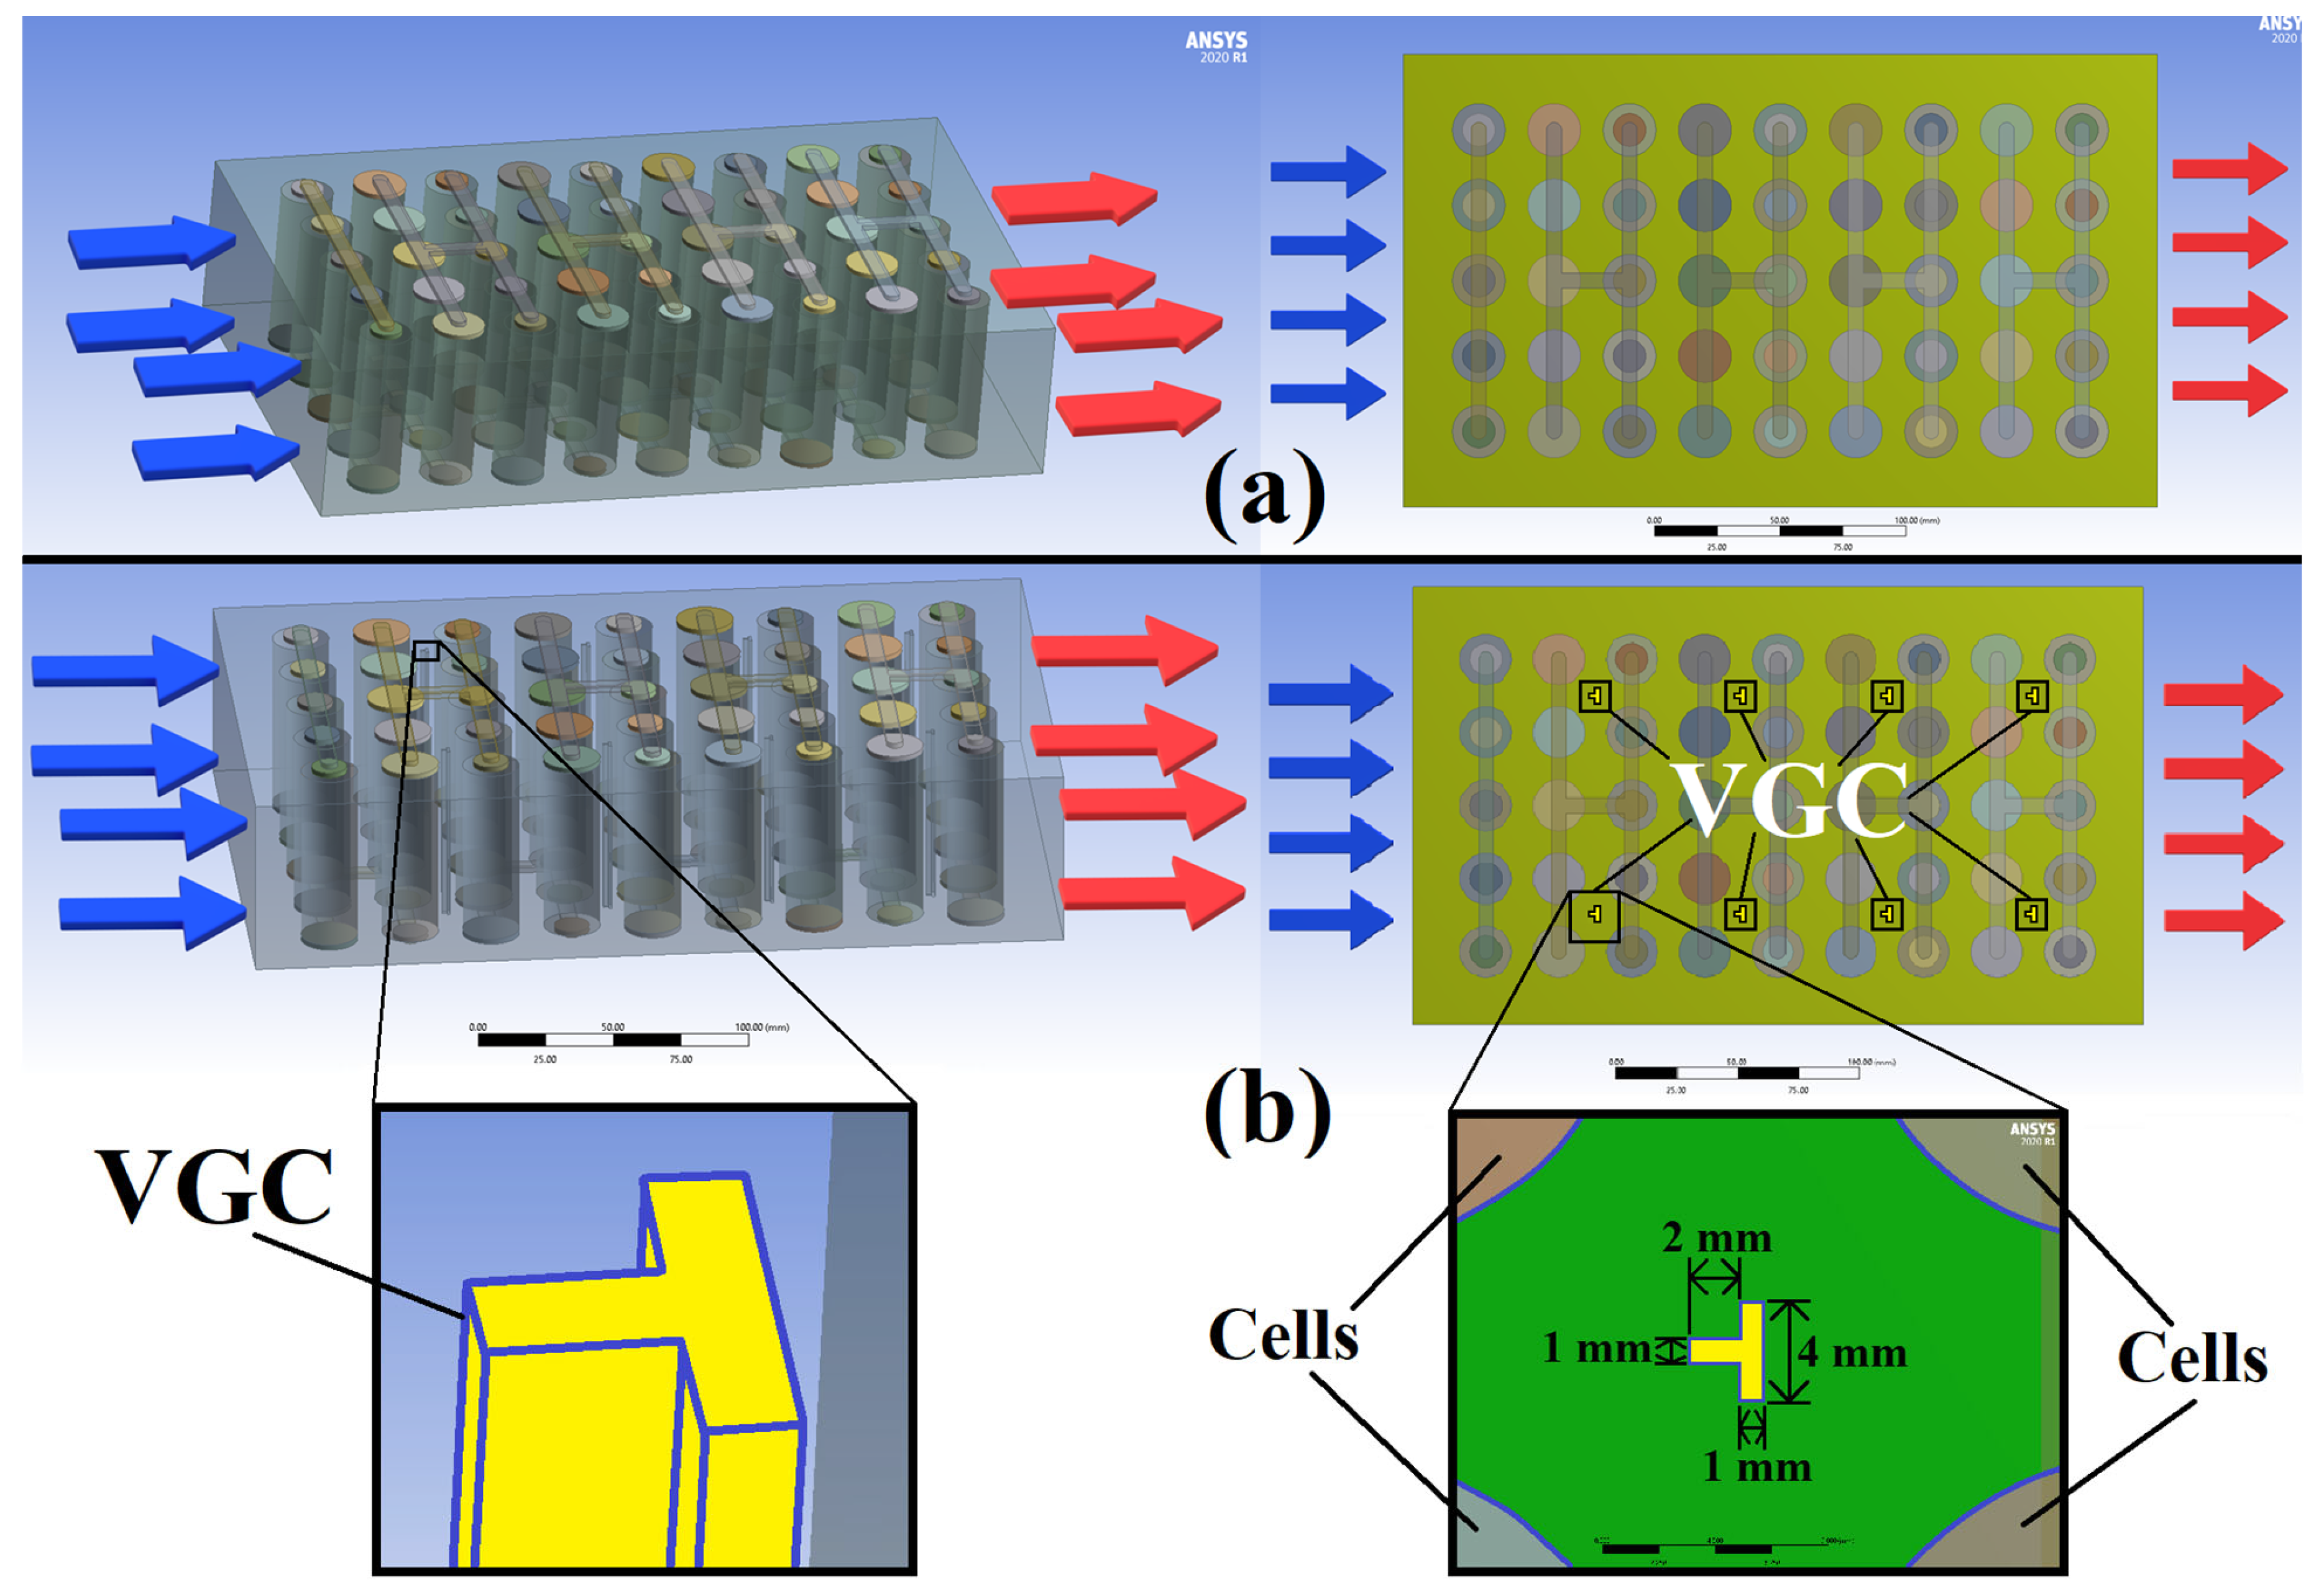
2. Conventional Design and Vortex Generating Columns

The conventional design is a battery pack of 5 × 9 21700 cylindrical cells in a 5p9s connection (5 cells in parallel as a group and 9 groups in series). One of the 5-cell side is the inlet (blue inlet arrows) and the other 5-cell side is the outlet (red outlet arrows) as shown in Figure 1a. Both horizontal and vertical adjacent cell centres distances are 30 mm. All the distances between the cell centres to the case wall are 30 mm. The discharging rate is set as 2 C as it is generally considered as the highest discharging rate for the normal operations of EVs [25]. The inlet air flow velocities are set as 1, 2, 3, 4, and 5 m/s. The width, height, and length of the air volume are 0.18 m, 0.066 m, and 0.3 m, respectively. The area of the inlet/outlet is 0.01188 m2. So, the corresponding inlet air flow rates at five inlet air flow velocities are 11.88, 23.76, 35.64, 47.52 and 59.40 L/s, respectively.
To change the TKE, TEF, Re and Nu patterns of the air flows during the active cooling, the proposed basic VGC design (Design 1) adds eight novel T-shape VGCs in the clearances between the battery cells as shown in Figure 1b. Its shape and dimensions are shown in the magnification boxes in Figure 1b. All the T-shape VGCs are placed in the geometric centre of any 2 × 2 cell group. Both horizontal and vertical distances between the geometric centre point of VGC and four adjacent battery cell centres are 15 mm. The rationales of choosing the T-shape as the optimal contour of the VGCs in this study will be clarified and validated in Section 5.

3. Mathematical Models and Major Parameters

This study is one of the series studies on the design improvements of the air-cooling BTMS from our research team, the mathematical models including heat generation and transfer models are similar to those of the previous published papers [13,15,16]. To simplify the manuscript, only critical formulars are presented here.

3.1. Battery Cell Heat Generation Model

The electric potentials on the surfaces of the electrodes are calculated by Newman’s electrochemistry model in Equation (1) [26]:
V · σ ϕ d V = A j d A
where ∇ is the Del operator which denotes a partial derivative of a quantity with respect to all directions in the chosen coordinate system, ϕ is the electric potential, j is the volumetric transfer current density, A is the surface area of the interface, σ is the electrical conductivity.
The battery thermal and electrical fields are expressed by Equations (2)–(4) [27]:
ρ b C p b T t · ( k b T b ) = q b
· ( σ + φ + ) = j
· ( σ φ ) = j
where ρ b is the battery mass density, C p b is the battery specific heat capacity, T b is the battery temperature, k b is the battery thermal conductivity, q b is the battery heat generation rate which consists of the Joule heat, the electrochemical reaction heat, and the entropic heat, σ + and σ are the anode and cathode effective electrical conductivities, φ + and φ are the anode and cathode phase potentials.

3.2. Heat Transfer Model

As one of the three basic thermodynamic equations for a fluid flow field, the mass conservation equation (continuity equation) for the cooling air flows is expressed by Equation (5) [28]:
ρ a t = · ( ρ a v a )
where ρ a is the air mass density, v a is the air flow velocity vector.
The momentum conservation equation (Navier-Stokes equation) is expressed by Equation (6):
( ρ a v a ) t + · ( ρ a v a v a ) ) = p + · ( τ ¯ ¯ )
where p is the static pressure, τ ¯ ¯ is the stress tensor.
The energy conservation equation (total energy equation) is expressed by Equation (7):
ρ a C p a T a + ρ b C p b T b t = k a 2 T a + k b 2 T b + q b
where C p a is the air specific heat capacity, k a is the air thermal conductivity, T a is the air temperature, 2 is the Laplace operator.

3.3. Major Cooling Performance Indicators

The maximum temperature (Tmax) and the temperature difference (ΔT) between the Tmax and the minimum temperature (Tmin) within a battery pack are mostly used to indicate the overall cooling performances of an air-cooling BTMS by previous research [5,29,30]. In this study, Tmax reduction and ΔT reduction are also adopted as the major cooling performance indicators. Tmax shows the cooling capacity of the design in terms of suppressing the highest temperature of the hot spots within the battery pack. It is crucial for battery safety and longer cycle life. From the previous research, the ideal operating temperature range for LIB is between 25 °C (298.15 K) and 40 °C (313.15 K) [31,32,33]. Higher operating temperatures could cause accelerated degradation, capacity fading, and thermal runaway [4]. The cooling capacities of the air-cooling BTMS will be greatly compromised at higher operating temperatures, so the ambient and inlet air temperatures are initially set as 20 °C (293.15 K) in this study to provide a prerequisite cooling environment.
However, only lower Tmax is not enough, inconsistent battery cell temperatures within a battery pack could lead to different degradation rates and cause some cells to reach their end of life faster than others, compromising the overall battery pack cycle life. So, ΔT is defined as the difference values between the maximum and minimum temperatures within a battery pack to evaluate the evenness of the temperature field within a battery pack. It shows the overall cooling performance on every cell within the battery pack in addition to just suppressing the maximum temperature of a hot spot. ΔT is expressed by Equation (8):
Δ T = T m a x T m i n
To protect the LIB cells from operating beyond the ideal temperature ranges, 35 °C (308.15 K) and 5 °C (5 K) are selected as the upper limit of the Tmax and ΔT following some relevant research [34,35]. Tmax is always considered as the first priority to evaluate different designs. When the Tmax performances of different designs are close to each other, ΔT will be considered as the secondary evaluation criterion to decide the optimal design. Moreover, pressure difference (ΔP) of the average pressure values between the inlet and outlet is used to indicate the overall system power consumptions. Although ΔP does not reflect the cooling performance directly, it is a critical indicator of the system energy efficiency which can be used as a last priority evaluation criterion when there is a tie on all other evaluation aspects.

3.4. Advanced Design Improvement Parameters

Besides the major cooling performance indicators such as Tmax and ΔT, this study explored the influences of some aerodynamic and thermodynamic properties such as TEF, TKE, Re, and Nu on the overall cooling performances.
TEF could decay the turbulence intensity from the inlet, so the downstream turbulence intensity can be much smaller than that at the inlet, causing different heat transfer performances and uneven temperature distributions. The turbulence eddy frequency ω can be calculated by the shear-stress transport k-ω Equation (9) developed by Menter [36]:
( ρ ω ) t + ( ρ U ¯ j ω ) x j = α ω k P k ρ β ω 2 + x j ν + ν t σ ω ω x j + 2 1 F 1 ρ ω σ ω , 2 k x j ω x j + P S A S
where k is the turbulent kinetic energy, U ¯ j is the mean velocity component, P k is the production term of the turbulent kinetic energy, ν is the kinematic viscosity, α, β, σ ω , and σ ω , 2 are model parameters, F 1 is the first blending function in the SST model, and P S A S is the additional source term in the transport equation for the turbulence eddy frequency [37].
Different TKE spatial and temporal distributions could have different influences on the surface heat transfer coefficient [38]. The constant viscosity and density TKE can be calculated by transport Equation (10) [39]:
D ¯ k D ¯ t = x j u j p ρ + 2 ν u i s i j 1 2 u i u j u j 2 ν s i j s i j u i u j s i j
where p is the pressure, u is the flow velocity, the subscripts i, j represent the Cartesian directions, s i j is the strain rate tensor. In the right-hand side, the first term is consisted of pressure, viscous stresses, and Reynolds stresses transport of TKE. The second term is the KTE dissipation rate. The third term is the turbulence production.
The geometrical differences, even a very small angle, could cause sensitive air flow vortex dynamics variations, leading to significantly different TKE in the wake [40]. Kim et al. [41] found that smaller TKE could lead to the degradation of the heat transfer performances by comparing the TKE values on flat, concave, and convex surfaces. The buildup of TKE in the stagnation regions or the loss of TKE in the peripheral regions shall be avoided by adding VGCs subtly and appropriately to improve the TKE uniformity, leading to more balanced temperature distribution and better cooling performances.
The increase in the Re could also lead to the growth in heat transfer coefficient due to the beneficial effects of forced convection [42,43]. The Re can be calculated by Equation (11) [44]:
R e = u D H ν
where u is the flow velocity, DH is hydraulic diameter of the pipe, and ν is the kinematic viscosity.
The increase in the turbulence level due to the increase in friction factor and surface Nu have been proven to cause the heat transfer augmentation [45]. The Nu usually increases with increasing Re [46]. The Nu can be calculated by Equation (12) [47]:
N u = h a L k a
where h a is the convective heat transfer coefficient of the air flow, L is the characteristic linear dimension, and k a is the air thermal conductivity.

4. Numerical Modelling and Validation

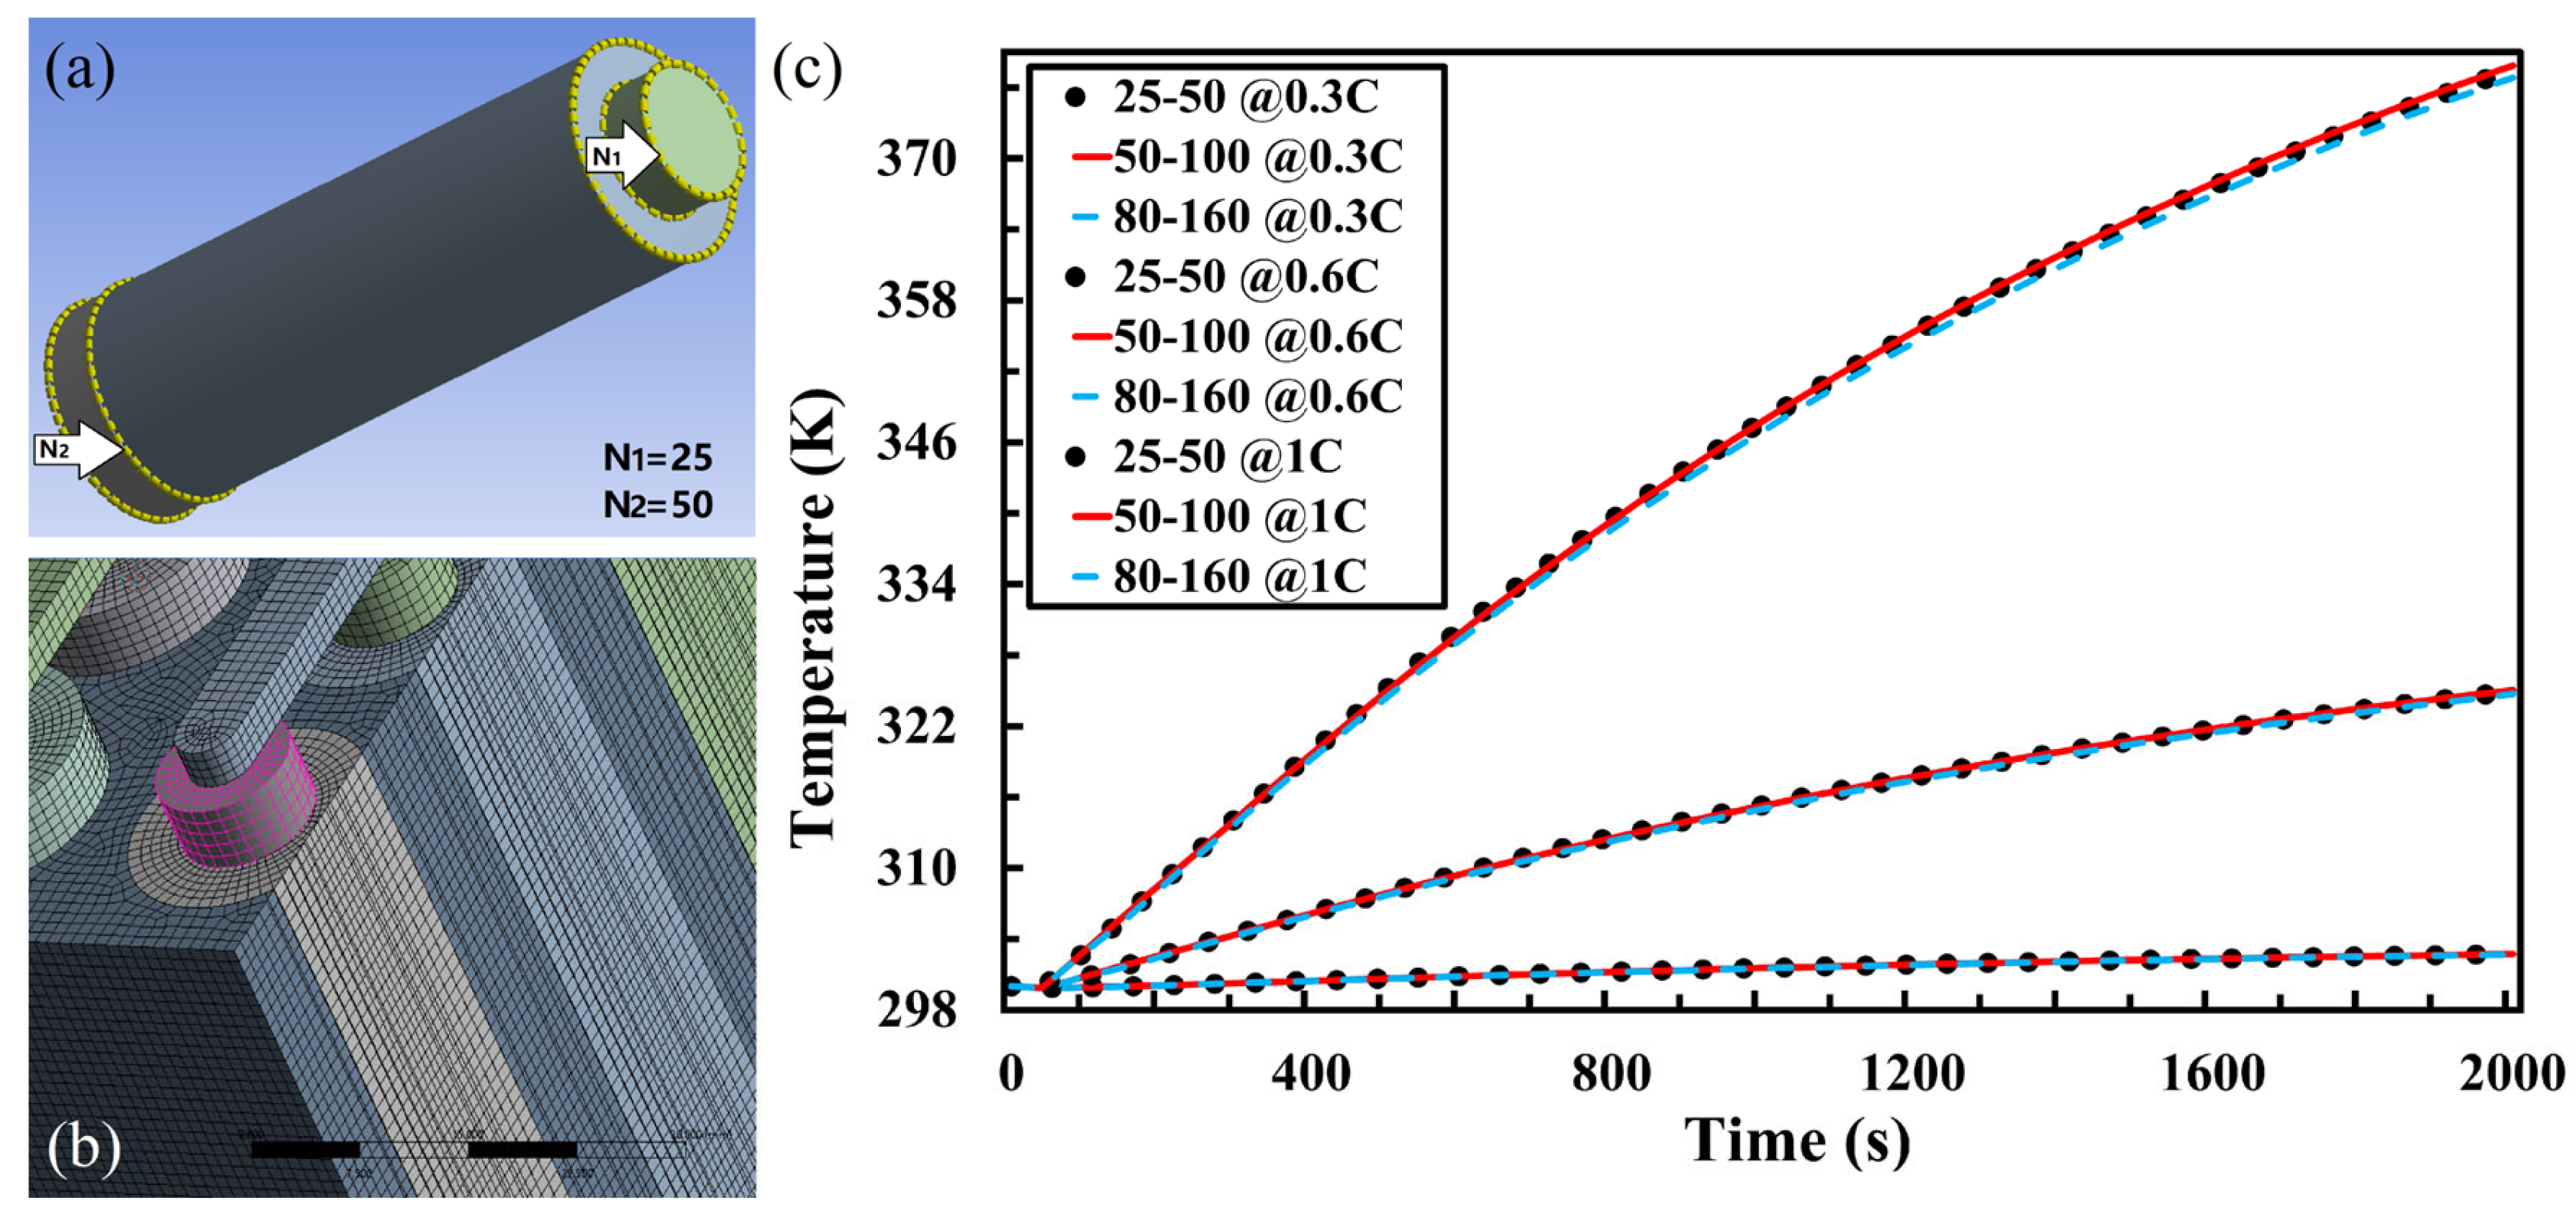
4.1. Mesh Independence Study

The mesh generation and quality can influence the accuracy of the numerical results [48]. The meshing software used in this study is also ANSYS® Fluent. Figure 2c shows the simulation results of different mesh element sizes at three discharging rates (0.3 C, 0.6 C and 1 C). For the legend “Mesh N1-N2 @ 0.3 C”, N1 refers to the mesh division number of anode tab perimeter (40.84 mm) as shown in Figure 2a. When division numbers N1 = 25, 50 and 80, the lengths of each division are 1.63 mm, 0.82 mm and 0.51 mm, respectively. N2 refers to the mesh division number of cathode tab perimeter (65.97 mm) as shown in Figure 2a. When division numbers N2 = 50, 100 and 160, the lengths of each division are 1.32 mm, 0.66 mm and 0.41 mm, respectively. “@ 0.3 C” refers to the discharging rate is 0.3 C. The mesh numbers of nodes/elements at different N1-N2 of 25–50, 50–100 and 80–160 are 20353/18268, 105589/99025 and 329047/314304, respectively.
Figure 2b shows the detailed mesh image for the boundary layer between cells and cooling air within the battery pack. The comparison results in Figure 2c show that three mesh element sizes have almost the same temperature prediction results during different C-rates discharging. The average standard deviations (SDs) of any two among the three mesh element size simulation results during 0.3 C, 0.6 C, and 1 C discharging are 0.014 K, 0.124 K and 0.371 K, respectively. Therefore, the smallest mesh division number N1-N2 of 25–50 is selected as the basic mesh setting to obtain accurate simulation results with the minimum calculation cost.

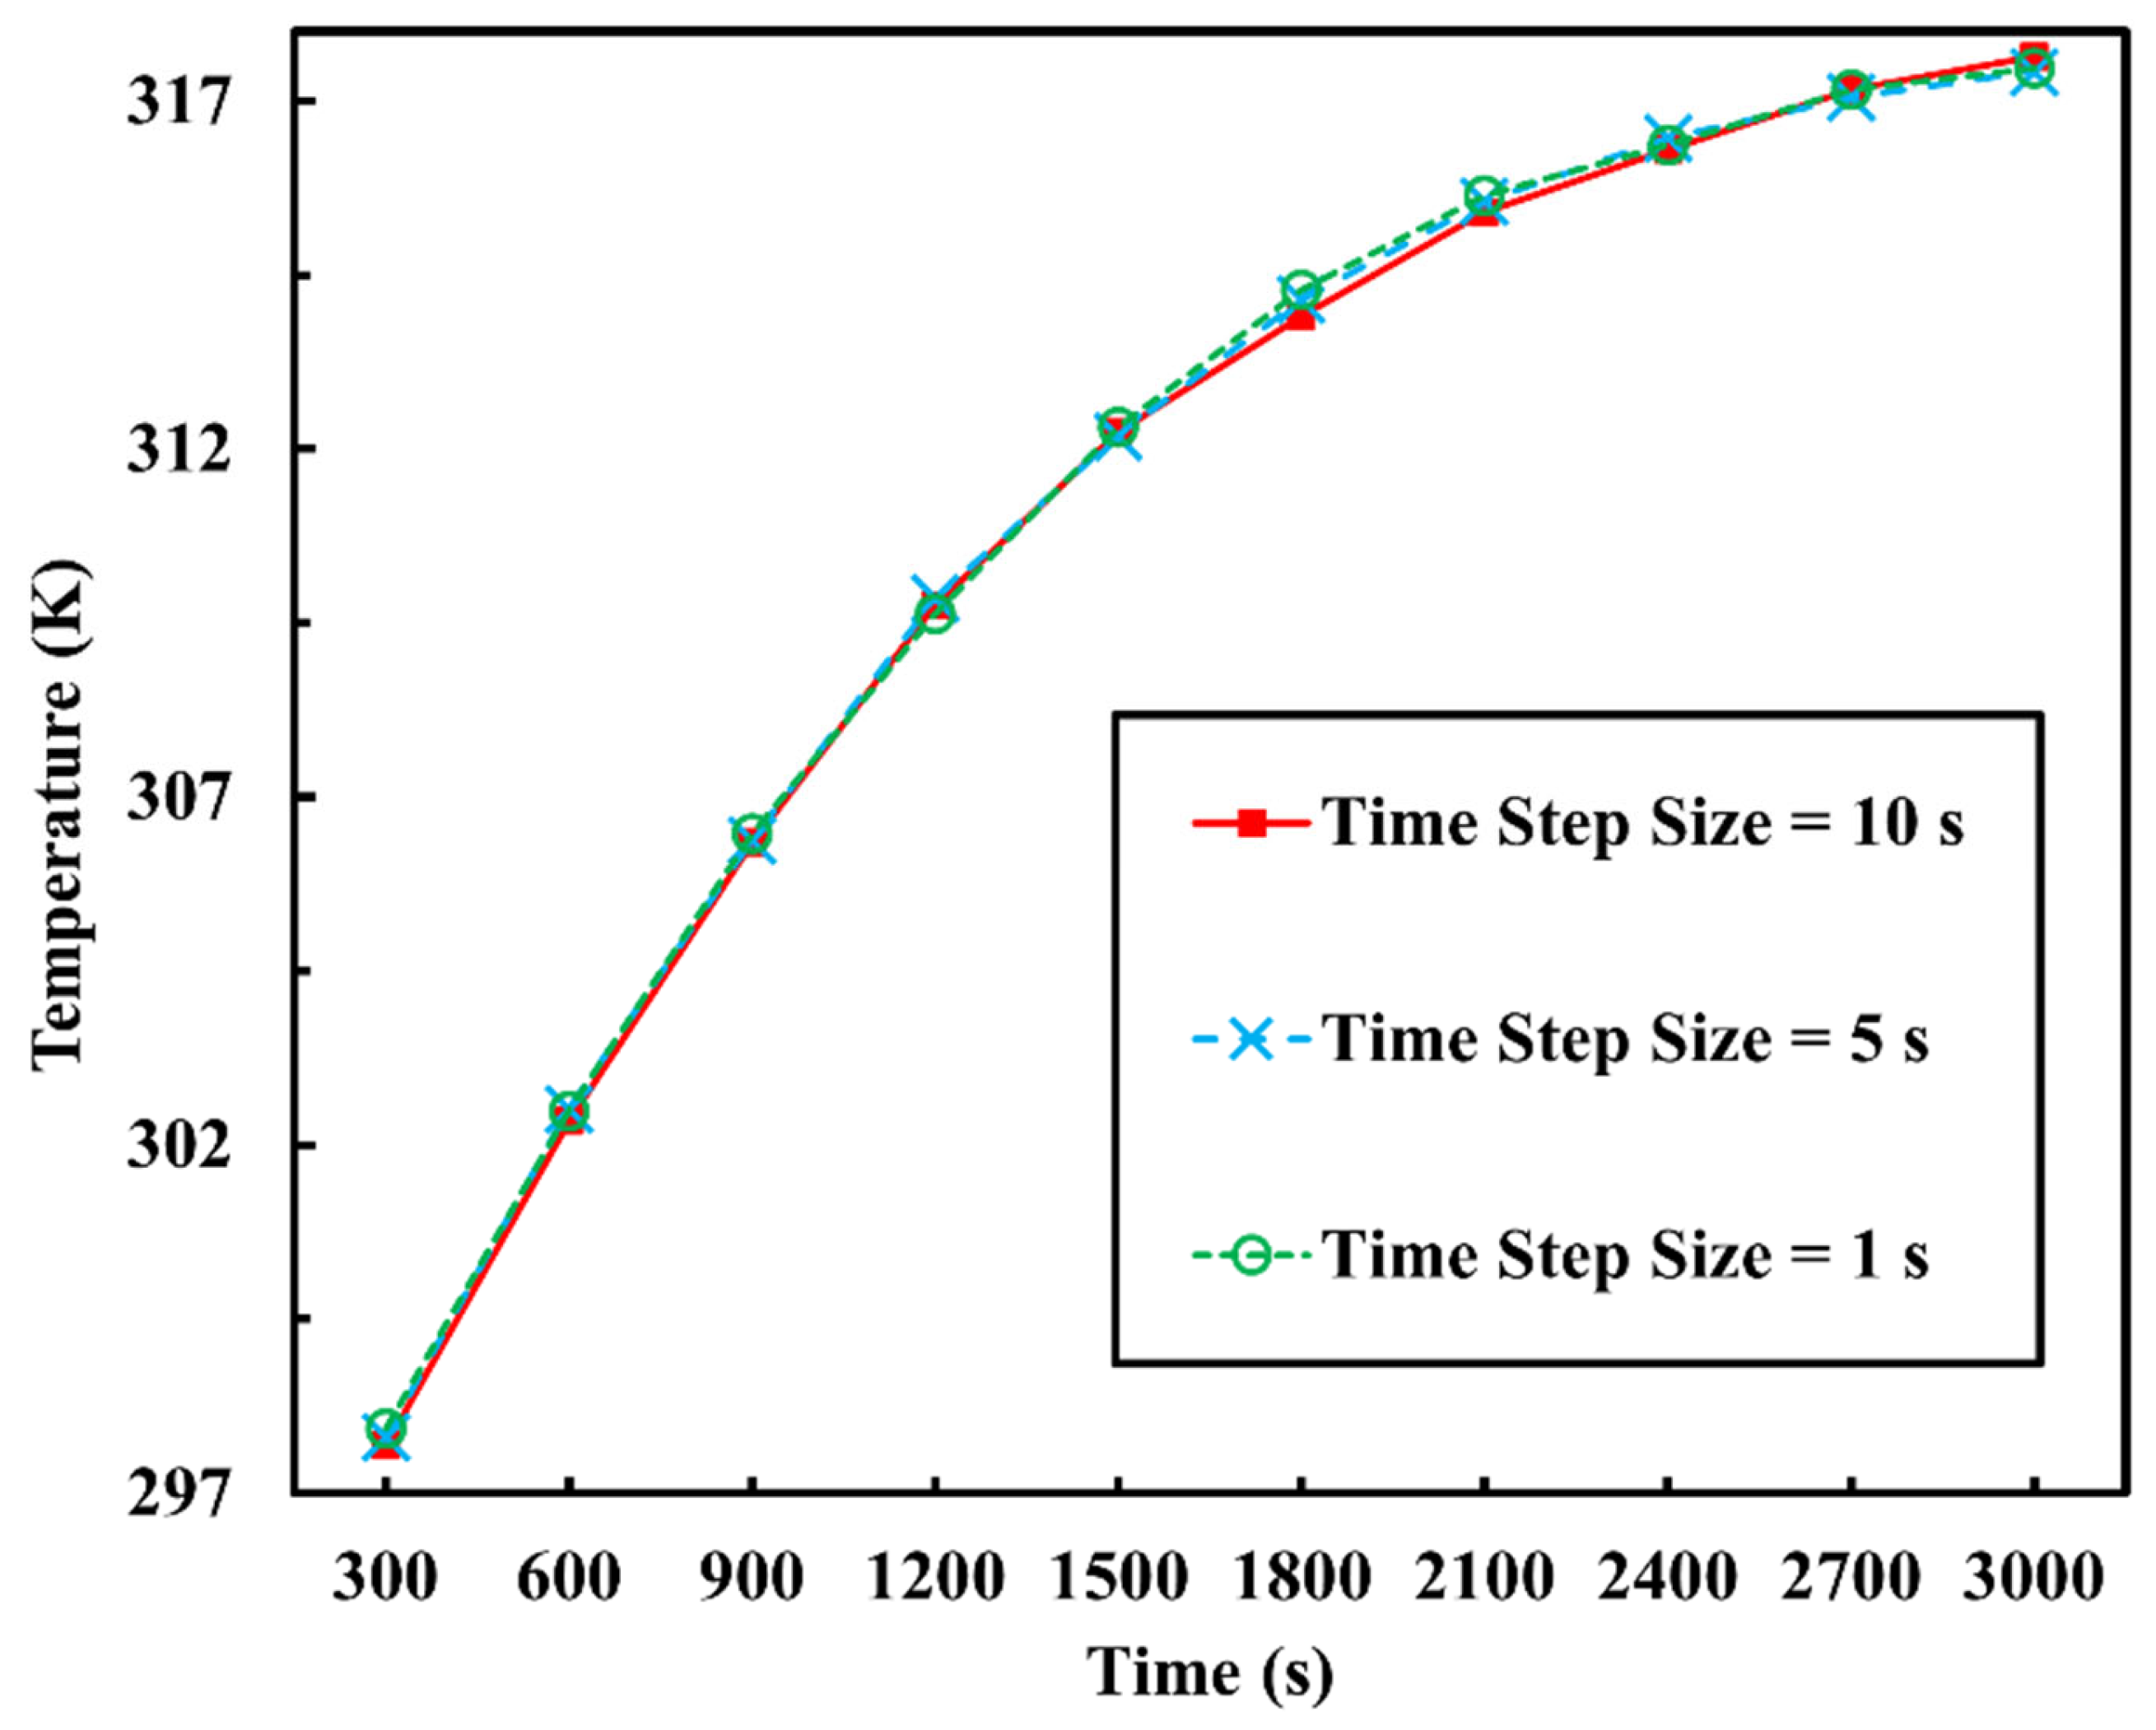
4.2. Time Step Size Independence Study

In addition to the mesh independence study, time step size independence study had also been conducted in this research. In numerical calculations, small time step size usually means more calculation iterations, leading to longer calculation time and more computational resources. However, although large time step size could save calculation time and resources, it is usually not convergent, and its results could be inaccurate. The purpose of time step size independence is to find out the maximum yet most suitable time step size to obtain accurate simulation results at the costs of relatively lowest computational resources. In this study, three different time step size are selected: 10 s, 5 s and 1 s. The results are shown in Figure 3. All three time step size results almost coincide with each other completely, showing the required convergent value which represents the highest accuracy. On the other hand, the total calculation time of 1 s time step size simulation is almost ten times longer than the 10 s time step size one. As a result, 10 s has been selected as the universal time step size for all the numerical simulations in this research.

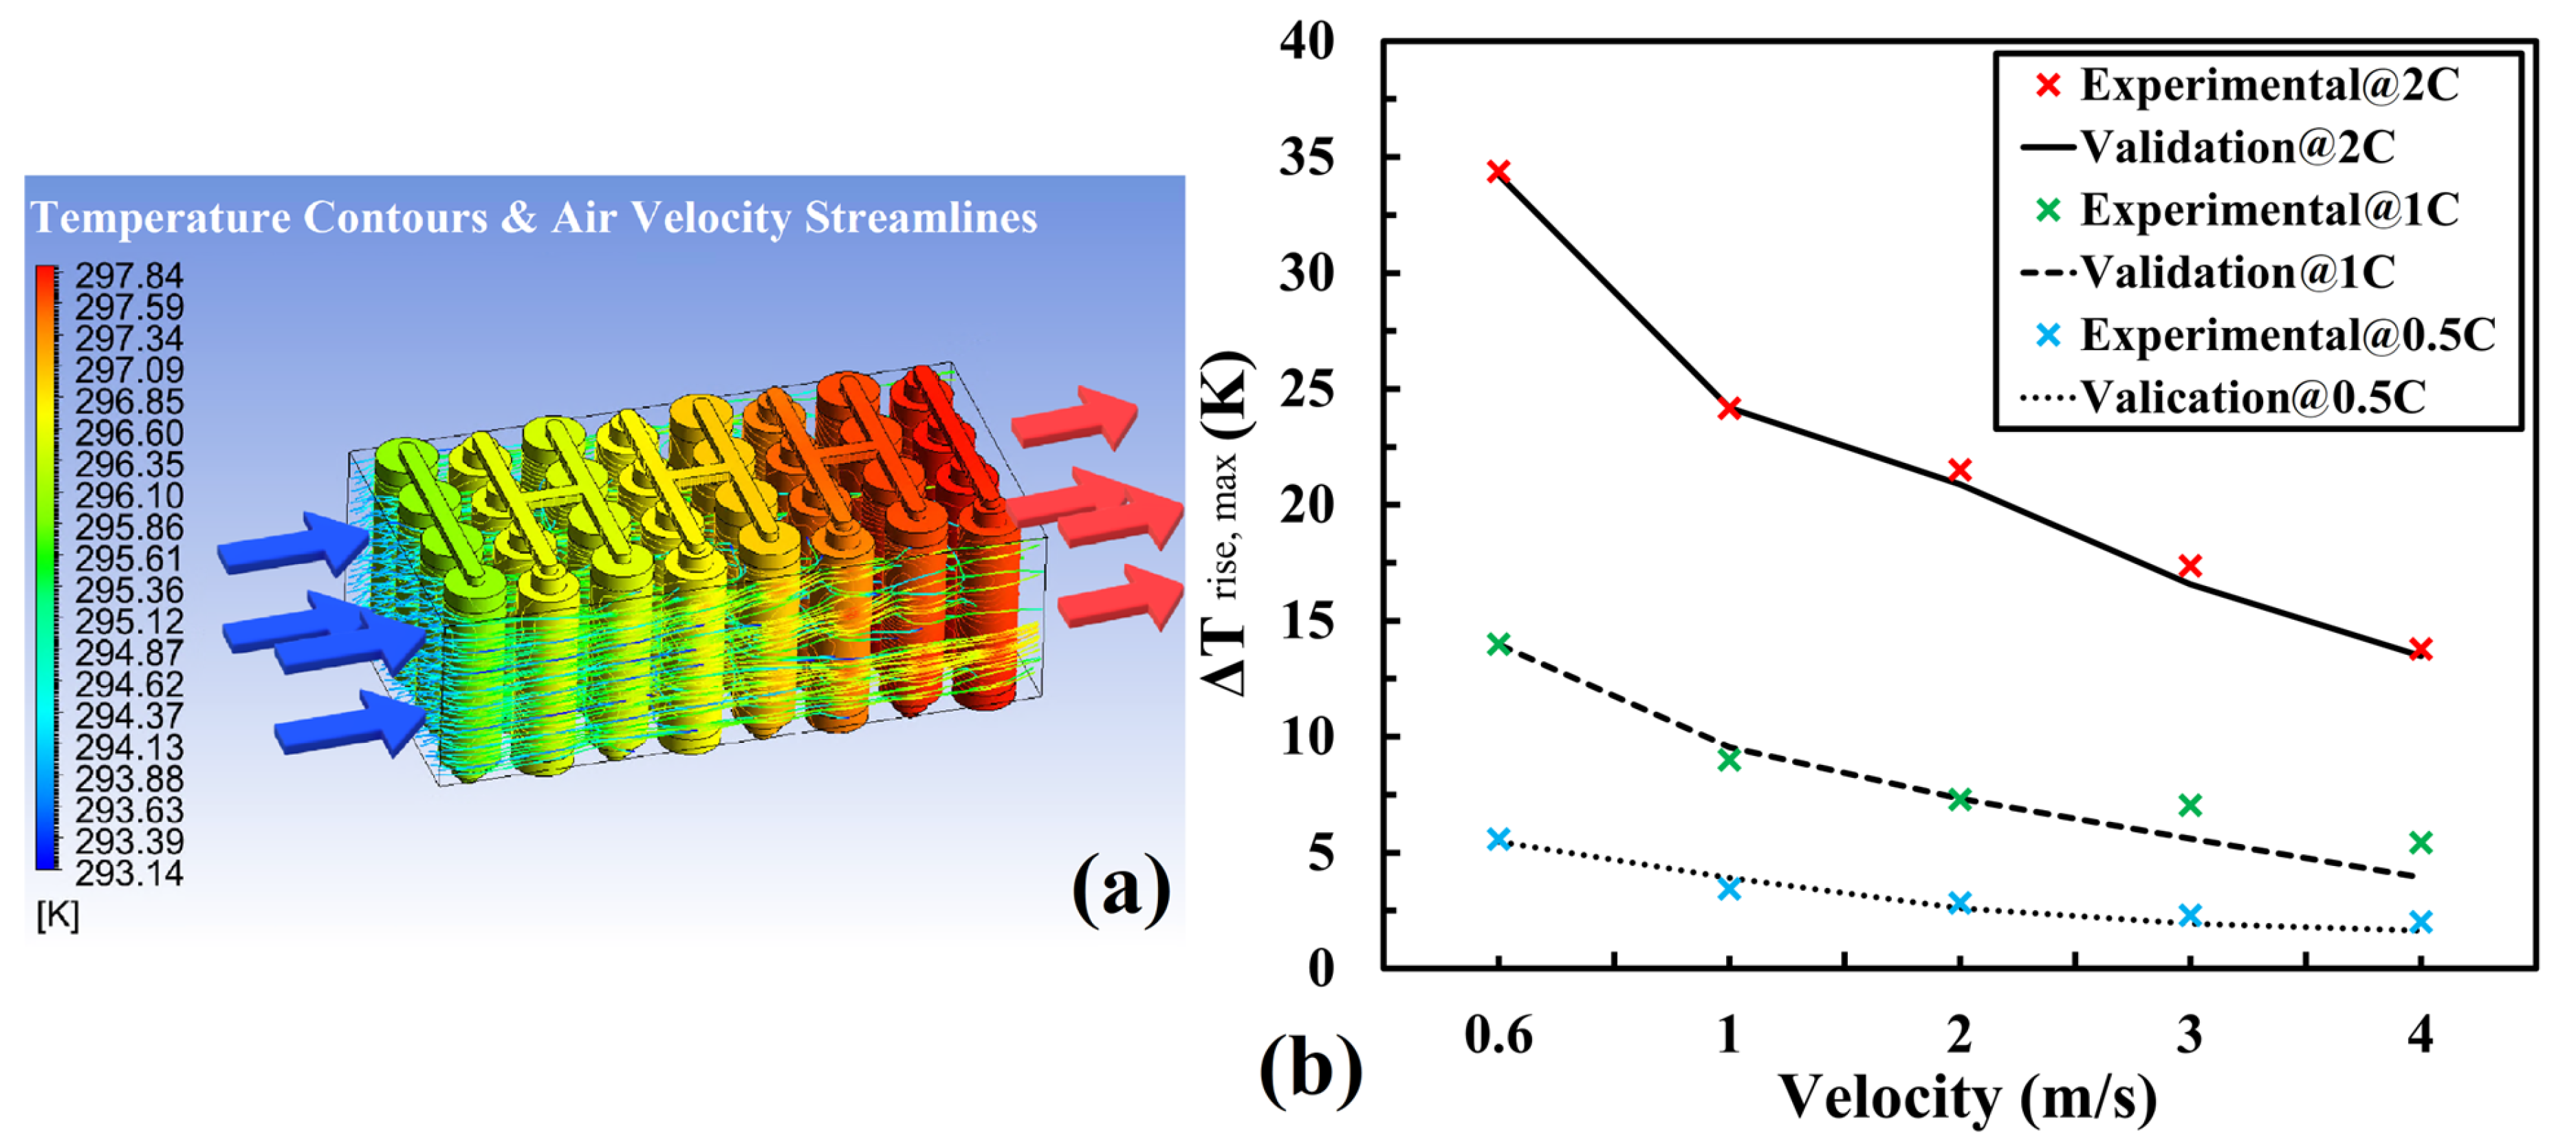
4.3. Numerical Model Validation

The cylindrical 21700 LIB cell length and diameter are 70 mm and 21 mm, respectively. The anode tab diameter and height are 21 mm and 5 mm, respectively. The cathode tab diameter and height are 13 mm and 5 mm, respectively. The nominal cell capacity is 4 Ah. The maximum and minimum stop voltages are 4.3 V and 3 V, respectively. The initial state of charge is 1 (100% charged). To validate both the heat generation and transfer simulation, the experimental data of an air cooling BTMS with a rectangular battery pack of 4 × 818,650 cylindrical cells in an acrylic wind tunnels in Ref. [49] are adopted as shown in Figure 4a. The cells connection type is 4p8s (4 cells in parallel as a group and 8 groups in series). The cooling air is blowing through the inlet along the blue arrows at the velocities of 0.6 m/s, 1 m/s, 2 m/s, 3 m/s and 4 m/s. The cell centre distance is 22 mm. The distance between the acrylic wall and the cell centres is 13 mm. Both the ambient temperature and the inlet temperature are 20 °C. The battery pack are discharged at 0.5 C, 1 C and 2 C, respectively.
The comparisons between the simulation results and the experimental data during 0.5 C, 1 C and 2 C discharging are shown in Figure 4b. The differences of the average errors at five different velocities during 0.5 C, 1 C and 2 C discharging are 0.12 K, 0.47 K and 0.37 K, respectively. The differences of the SDs of the errors at five different velocities during 0.5 C, 1 C and 2 C discharging are 0.35 K, 0.94 K and 0.33 K, respectively. The results had successfully exhibited the accuracy and reliability of the numerical model adopted in this study.

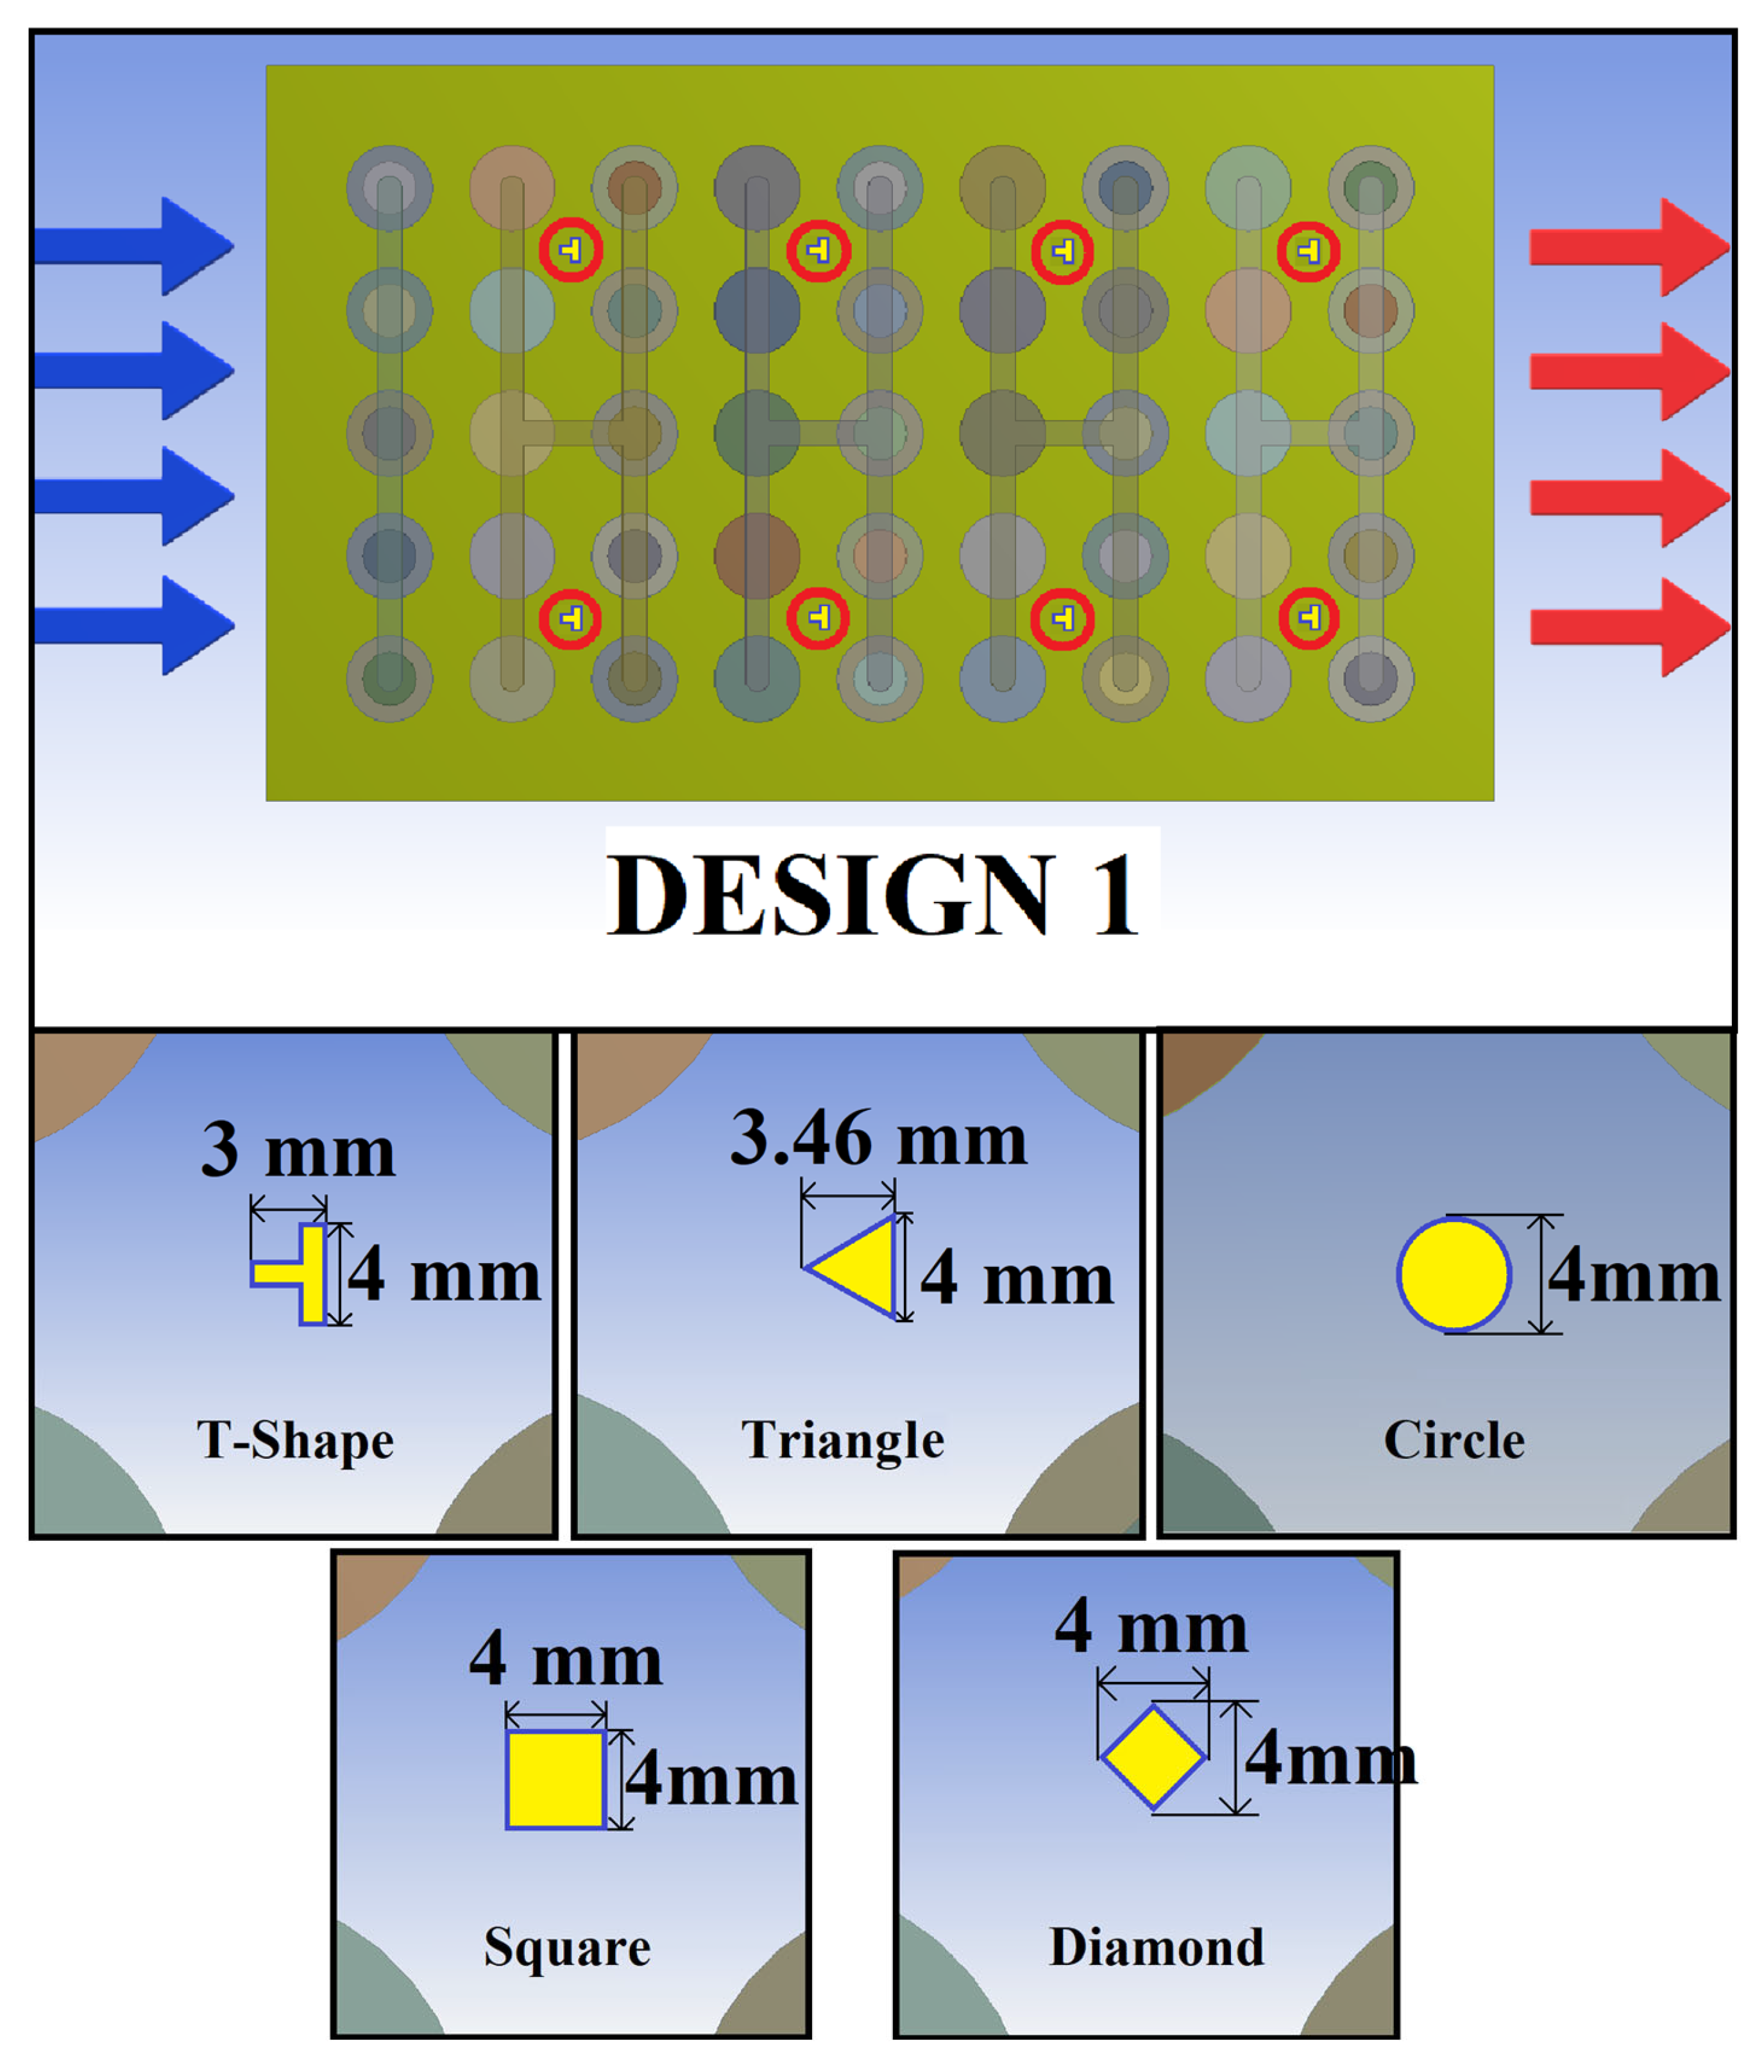
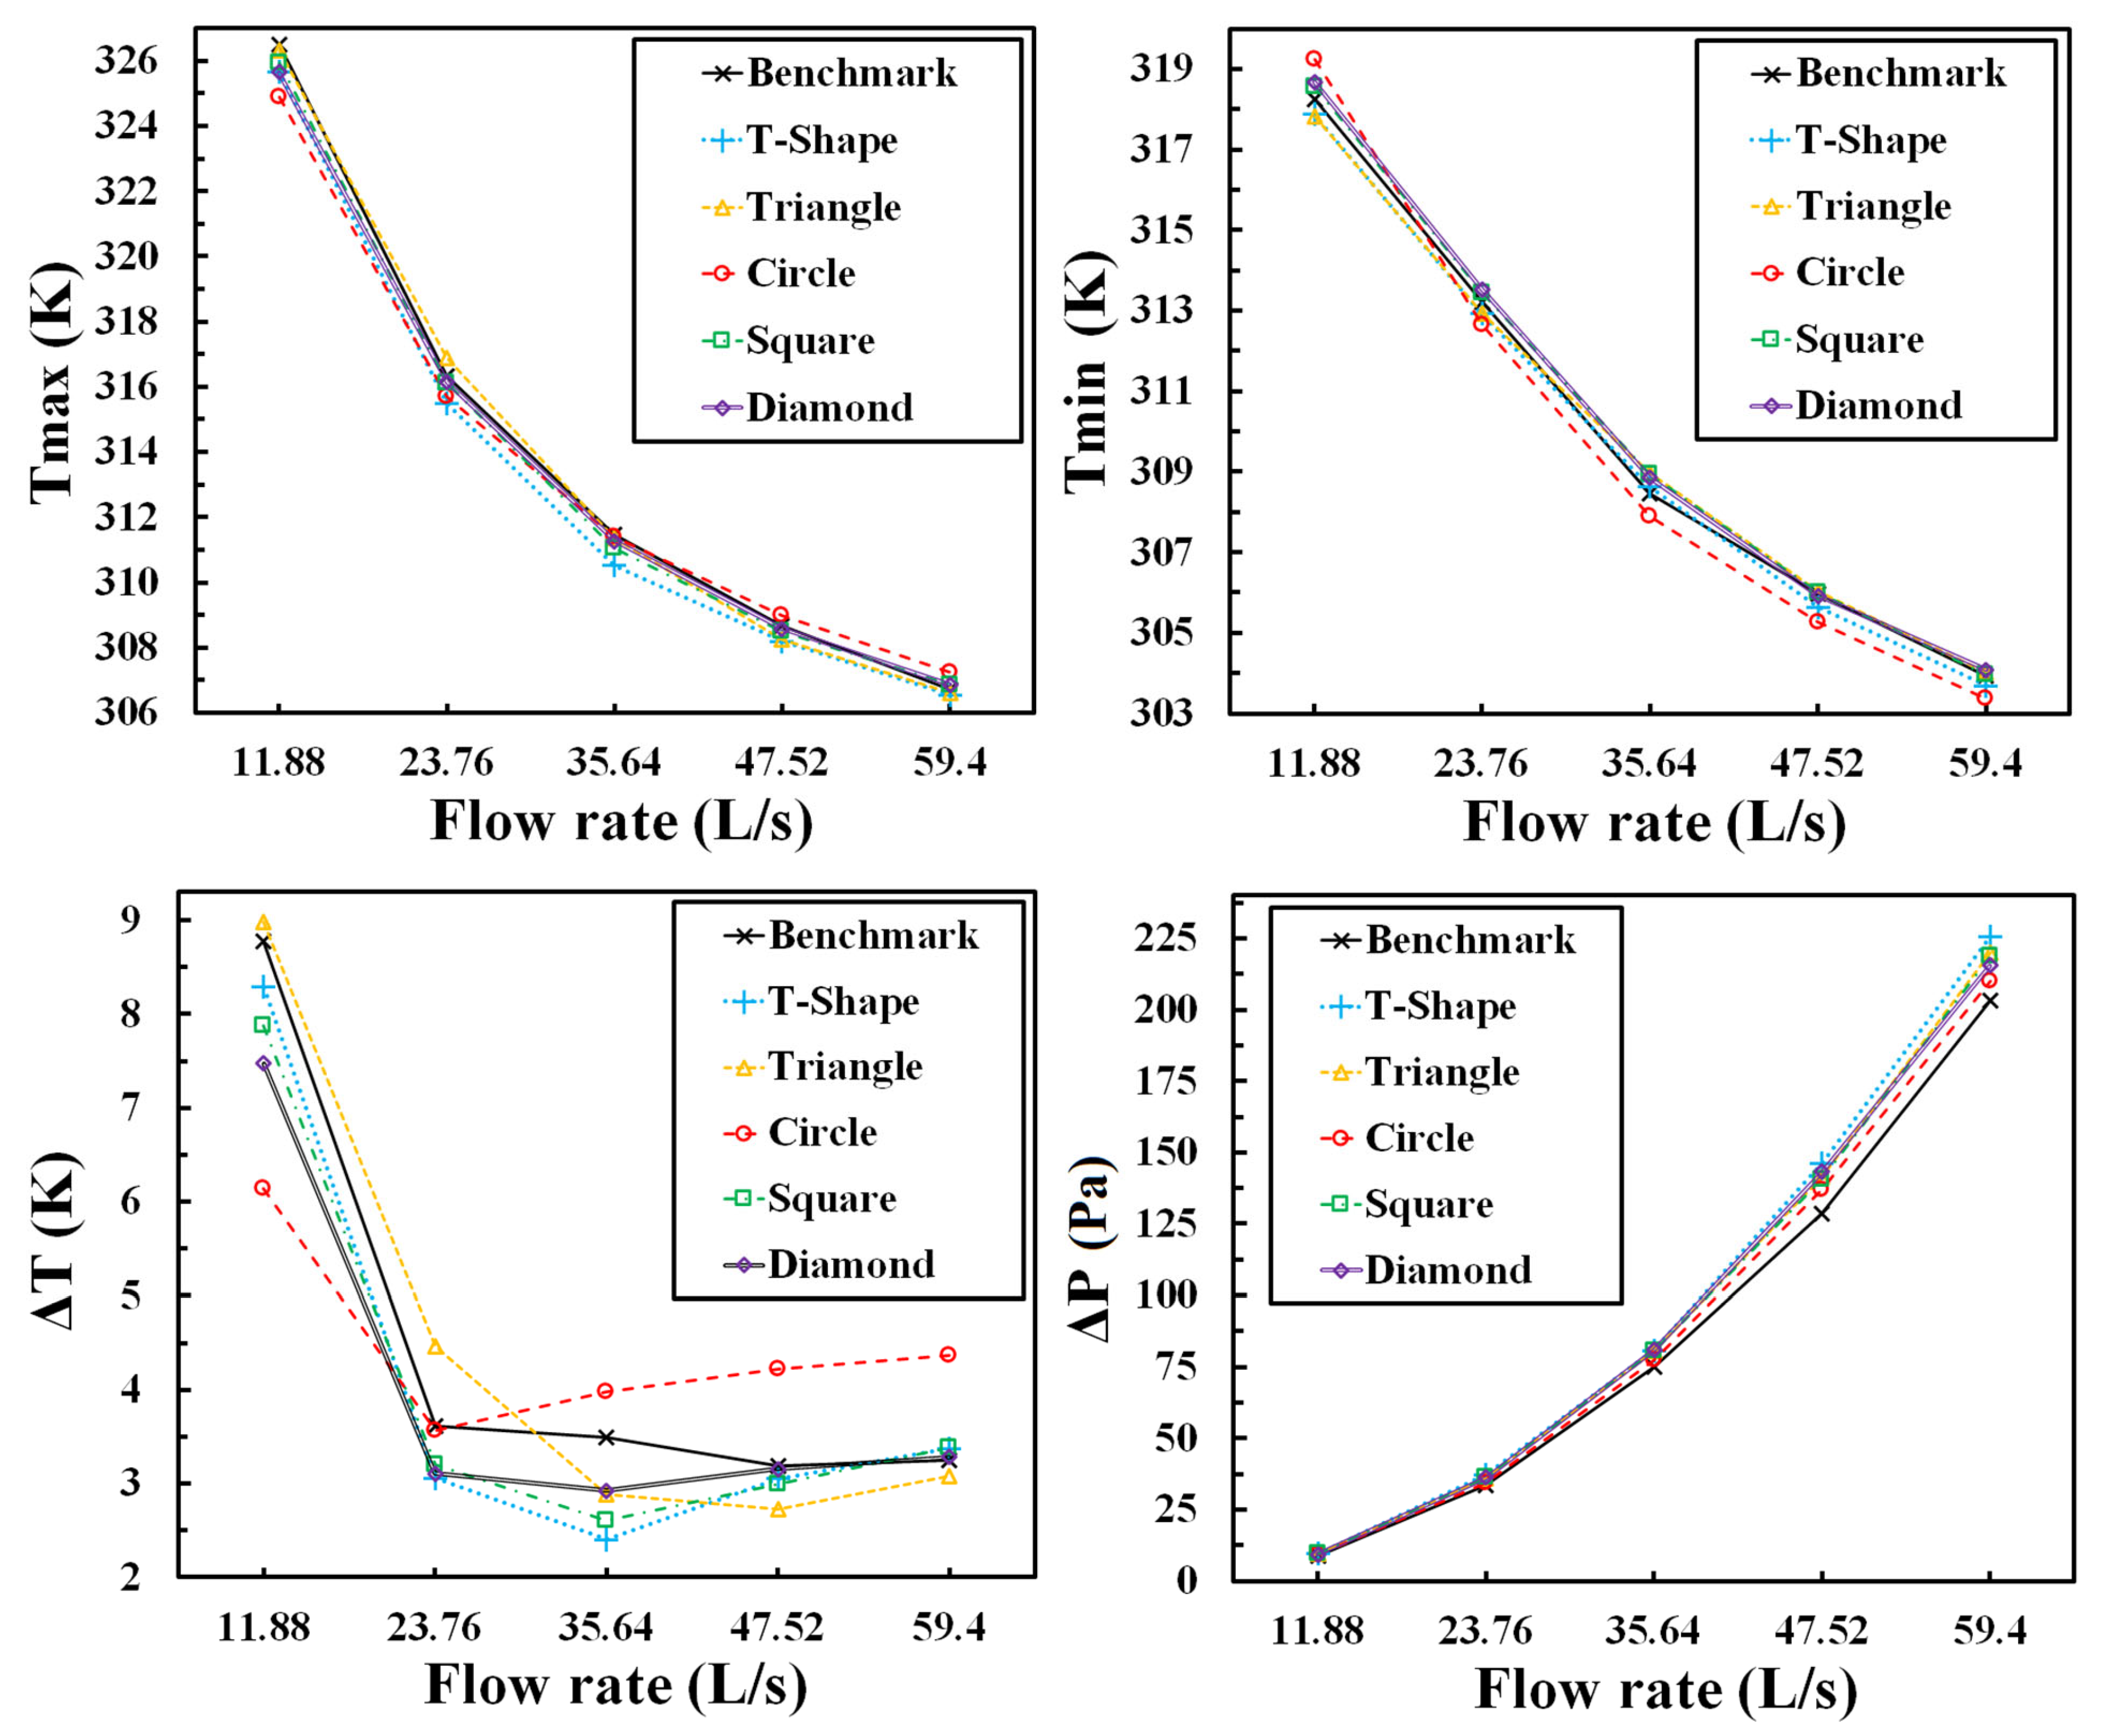
5. Optimization of the VGC Contour Shape

The T-shape VGC contour shape is one of the major innovations in this study. To find out the optimal contour shape, the cooling performances of the basic Design 1 with different contour shape VGCs are investigated. The proposed VGC contour shapes include T-shape, triangle, circle, square, and diamond as shown in Figure 5.
The windward side of all the VGCs is the left side. To make a fair comparison, the breadths of windward projection area of all the contour shapes are set as 4 mm to obtain the closest initial wind resistances for all designs. However, due to different shapes, the capacities to produce turbulences and different aerodynamics properties (including TKE, TEF, Re and Nu, etc.) of each design are different, leading to different cooling performances. The operating conditions are the 2 C discharging processes at inlet air flow rates of 11.88, 23.76, 35.64, 47.52 and 59.40 L/s, respectively. The simulation results of the cooling performances of Design 1 with different contour shape VGCs are shown in Figure 6.
Except at the inlet air flow rate of 11.88 L/s, the T-shape VGCs design could deliver the lowest Tmax values at 23.76, 35.64, 47.52 and 59.40 L/s, respectively. In addition, it also has the lowest ΔT values at 23.76 and 35.64 L. The only disadvantage of the T-shape VGCs is its ΔP values are among the highest at most of the inlet air flow rates, but the incremental changes are just 0.78, 3.61, 5.66, 17.88 and 22.38 Pa at 11.88, 23.76, 35.64, 47.52 and 59.40 L/s, respectively. Compared with the gains of the cooling performance improvements, the ΔP increases are negligible. The circle VGCs design only has the lowest Tmax and ΔT values at 11.88 L/s, showing its excellent cooling capacity at low inlet air flow rate. However, with the increase in the flow rates, its cooling performances are becoming worse, especially its ΔT values are always the highest among all designs. The triangle VGCs design has the lowest ΔT values at 47.52 and 59.4 L/s, but its Tmax values are always higher than the T-shape VGCs design. As a conclusion, the T-shape is selected as the optimal contour shape for the VGCs added in the conventional air-cooling BTMS, which is also a key innovation of this study.

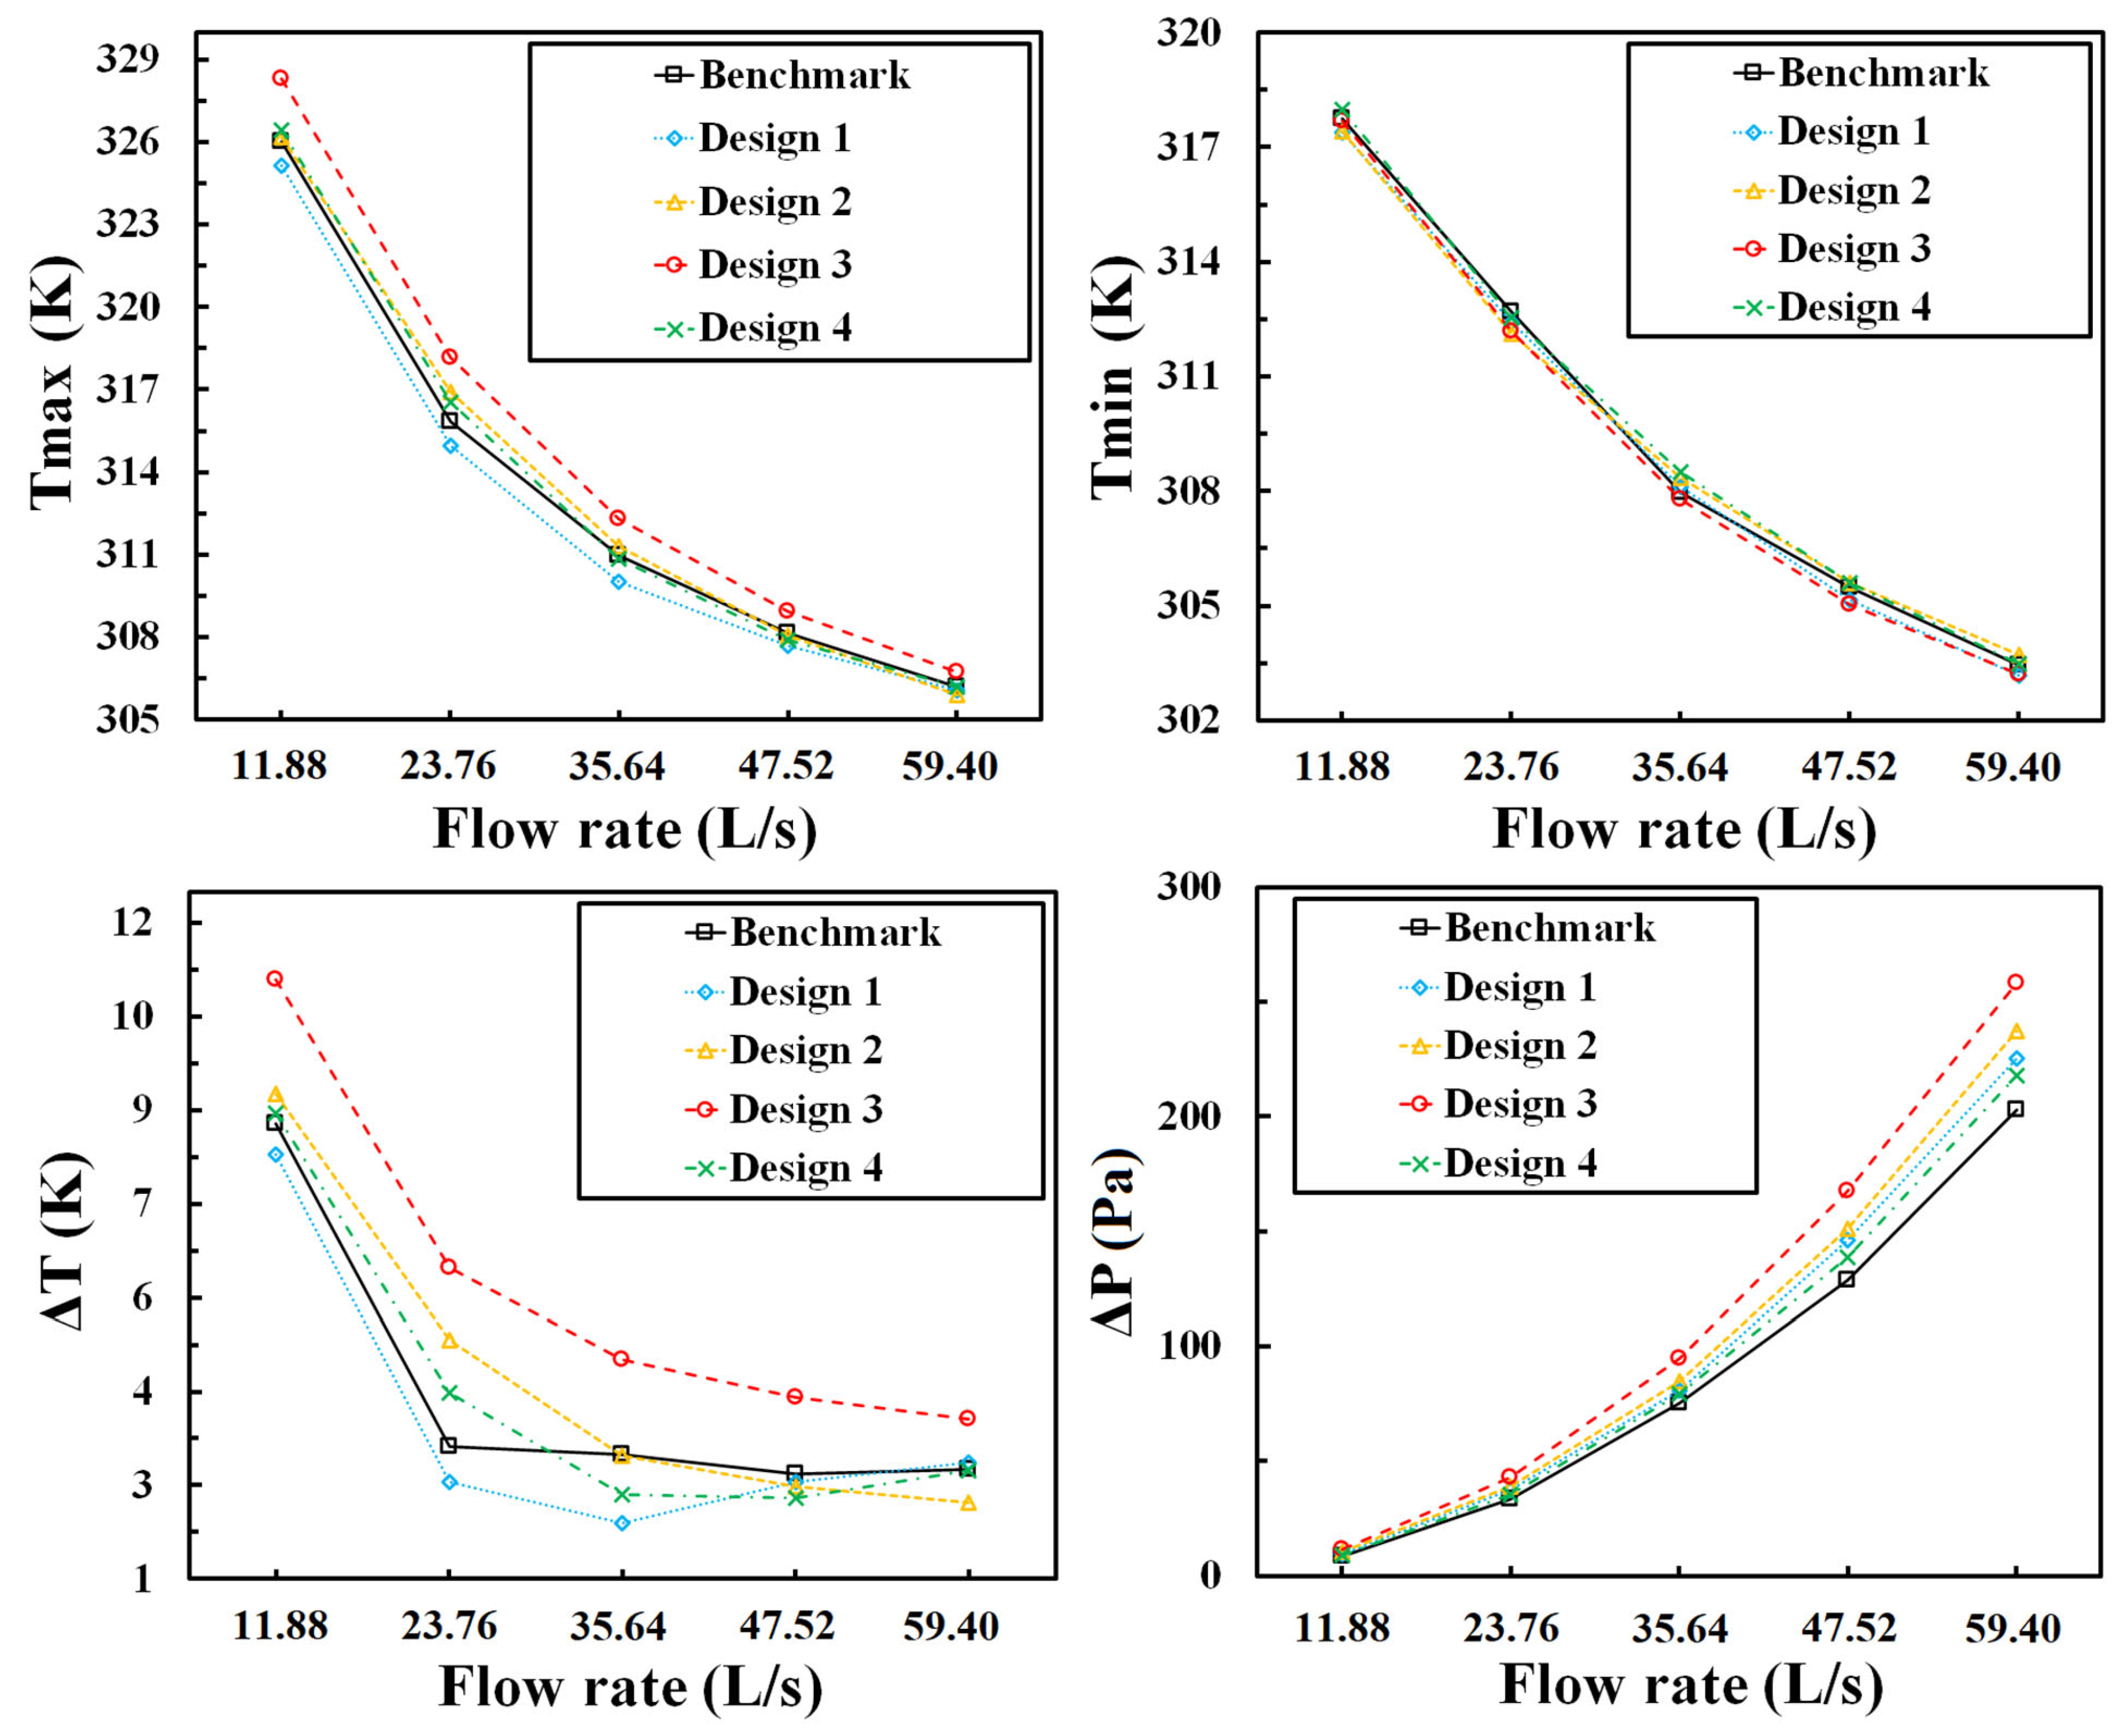
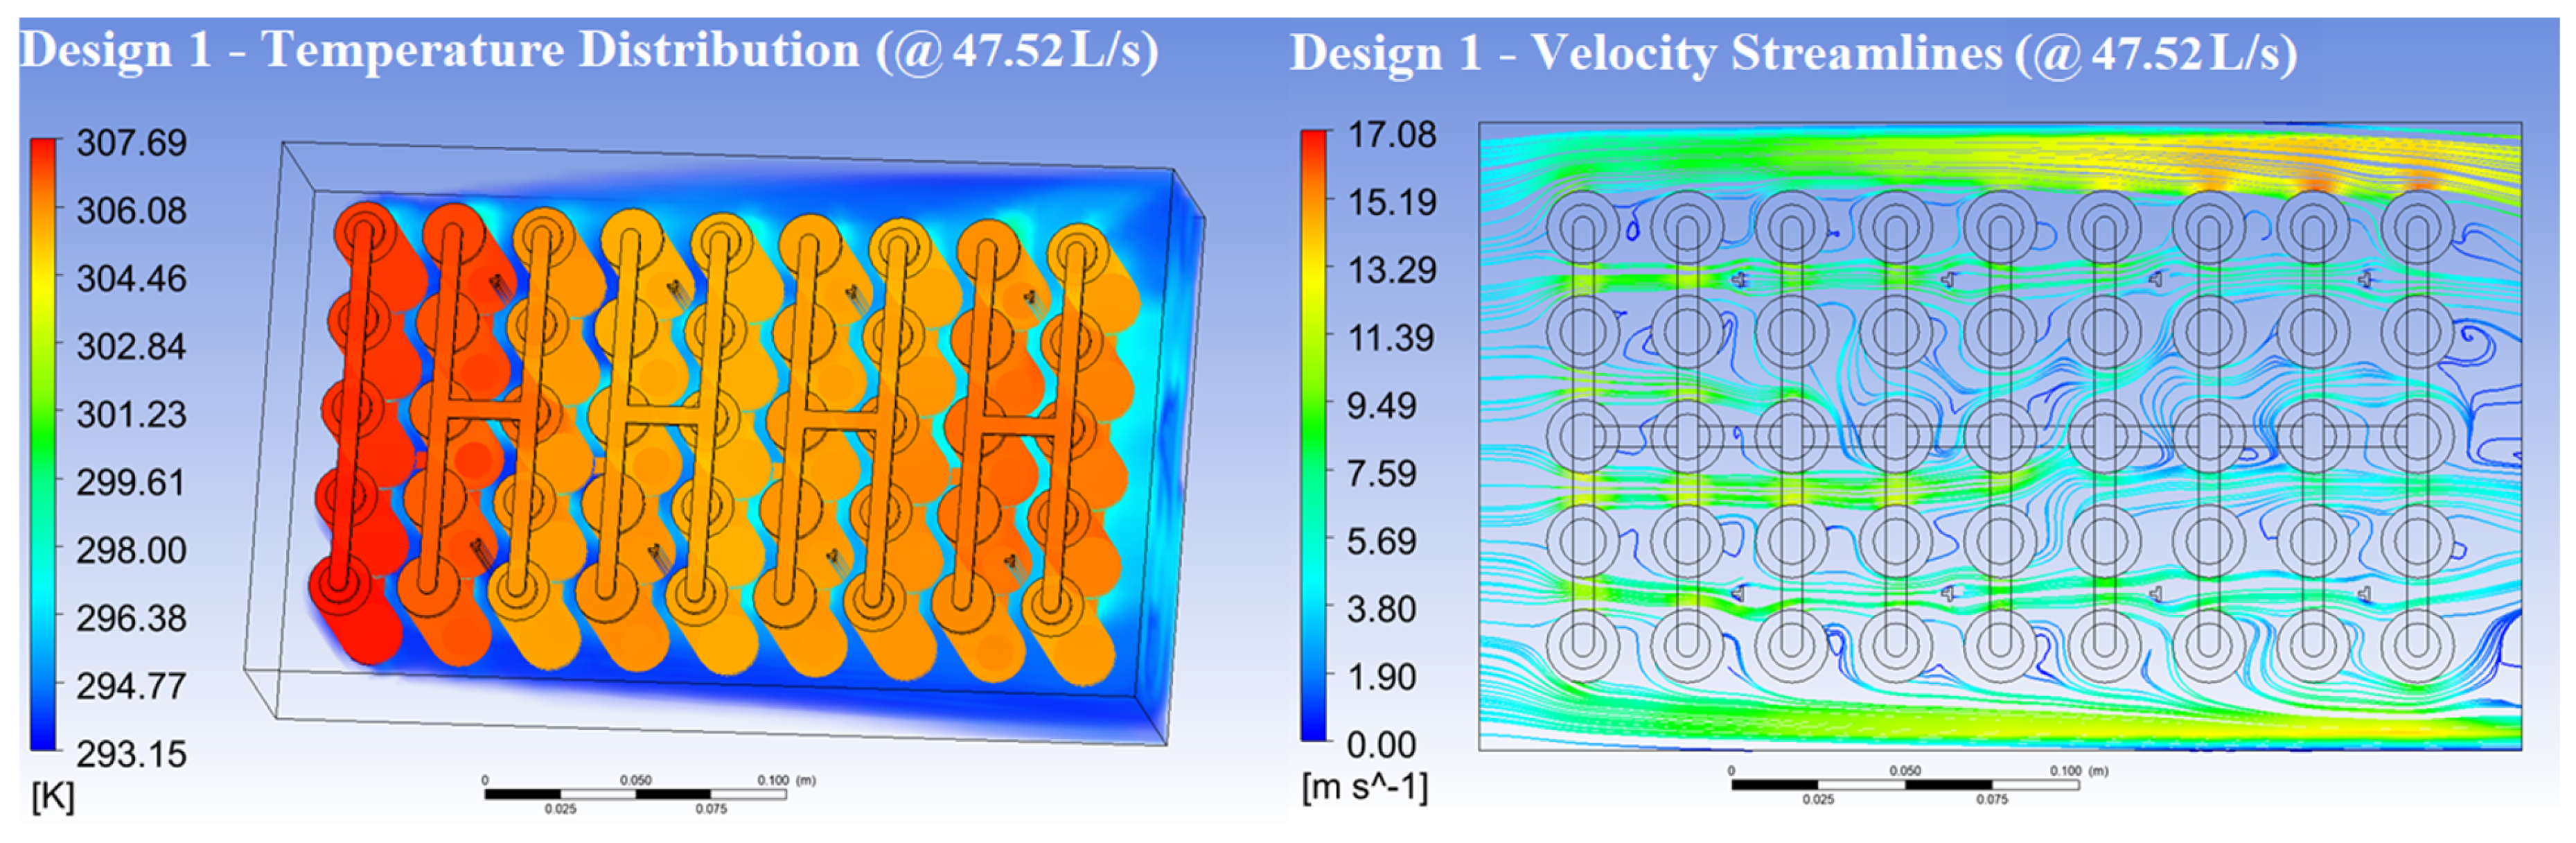
6. Optimization of the VGCs Distributions

6.1. Different VGC Distribution Designs

After the optimal contour shape is decided, the optimal distribution of the VGCs in the battery pack will be explored in this section. Based on the conventional air-cooling BTMS design without any VGC, four derivative designs with different VGC distributions including the basic Design 1 are proposed in Figure 7. Since the VGCs are quite small compared with the whole battery pack in true scale, the positions of the VGCs in each design are highlighted in the small red circles. Design 1 has 8 VGCs on the intersection points of the 2nd, 4th, 6th and 8th clearance columns and the 1st and 4th clearance rows. In addition to Design 1, Design 2 has 8 more VGCs (16 VGCs in total) on the intersection points of the 1st, 3rd, 5th and 7th clearance columns and the 2nd and 3rd clearance rows. Design 3 has 32 VGCs on all the intersection points of every clearance column and row. Design 4 has 8 VGCs on the intersection points of the 2nd, 4th, 6th and 8th clearance columns and the 2nd and 3rd clearance rows.
The simulation results of the comparison between the conventional design and four derivation designs are shown in Figure 8. Design 3 is the design with full VGCs on all the intersection points in the clearance area. However, its cooling performance is the worst. It has both highest Tmax and ΔT values at all five flow rates (higher than the conventional design), which means the full VGC arrangement would adversely influence the cooling performance. Design 2 has less VGCs than Design 3 but more VGCs than Design 1 and 4. Its Tmax and ΔT values are in the middle rankings at 11.88–47.52 L/s inlet air flow rates. However, at 59.40 L/s, Design 2 exhibits the best cooling performance with both lowest Tmax (305.92 K) and ΔT (2.22 K). Both Design 1 and 4 have 8 VGCs. Design 4 has the VGCs on the middle clearance rows while Design 1 has them on the bilateral clearance rows. The position differences cause different cooling performances. The Tmax values of Design 4 are among average, but its ΔT (2.29 K) at 47.52 L/s is the lowest due to its high Tmin values. Design 1 has the lowest Tmax values at 11.88–47.52 L/s inlet air flow rates. Its Tmin values are not the lowest at some inlet air flow rates (23.76 L/s and 35.64 L/s). Its ΔT values are the lowest at 11.88–35.64 L/s inlet air flow rates.
It can be observed that not all the VGC designs performed better than the conventional design. The Tmax values of the conventional design rank 2nd, 2nd, 3rd, 4th and 3rd among all five designs at all five flow rates, respectively. The ΔT values of the conventional design rank 2nd, 2nd, 4th, 4th and 4th among all five designs at 11.88–59.40 L/s. For the criteria of the Tmax (<308.15 K) and ΔT (<5 K), Design 1 reached the minimum Tmax (307.69 K) and qualified ΔT 2.55 K at 47.52 L/s, outperforming the conventional and all other VGC designs. The Tmax and ΔT of Design 1 are 0.46 K and 0.13 K lower than those of the conventional design with a negligible ΔP increase in 17.88 Pa. As a result, Design 1 could be regarded as the optimal design in this group.
Four major aerodynamic and thermodynamic properties of these five designs at different flow rates are listed in Table 1. Design 1 has the highest TKE, Re and Nu values at almost all air flow rates, indicating a positive relationship between higher parameters and better cooling performances. Especially the Nu numbers of Design 1 are the highest at five flow rates, reflecting the optimal heat transfer coefficient performance among all designs. In conclusion, the distribution of the T-shape VGCs in Design 1 could effectively adjust its aerodynamic and thermodynamic properties to the optimal values and achieve the top cooling performance.

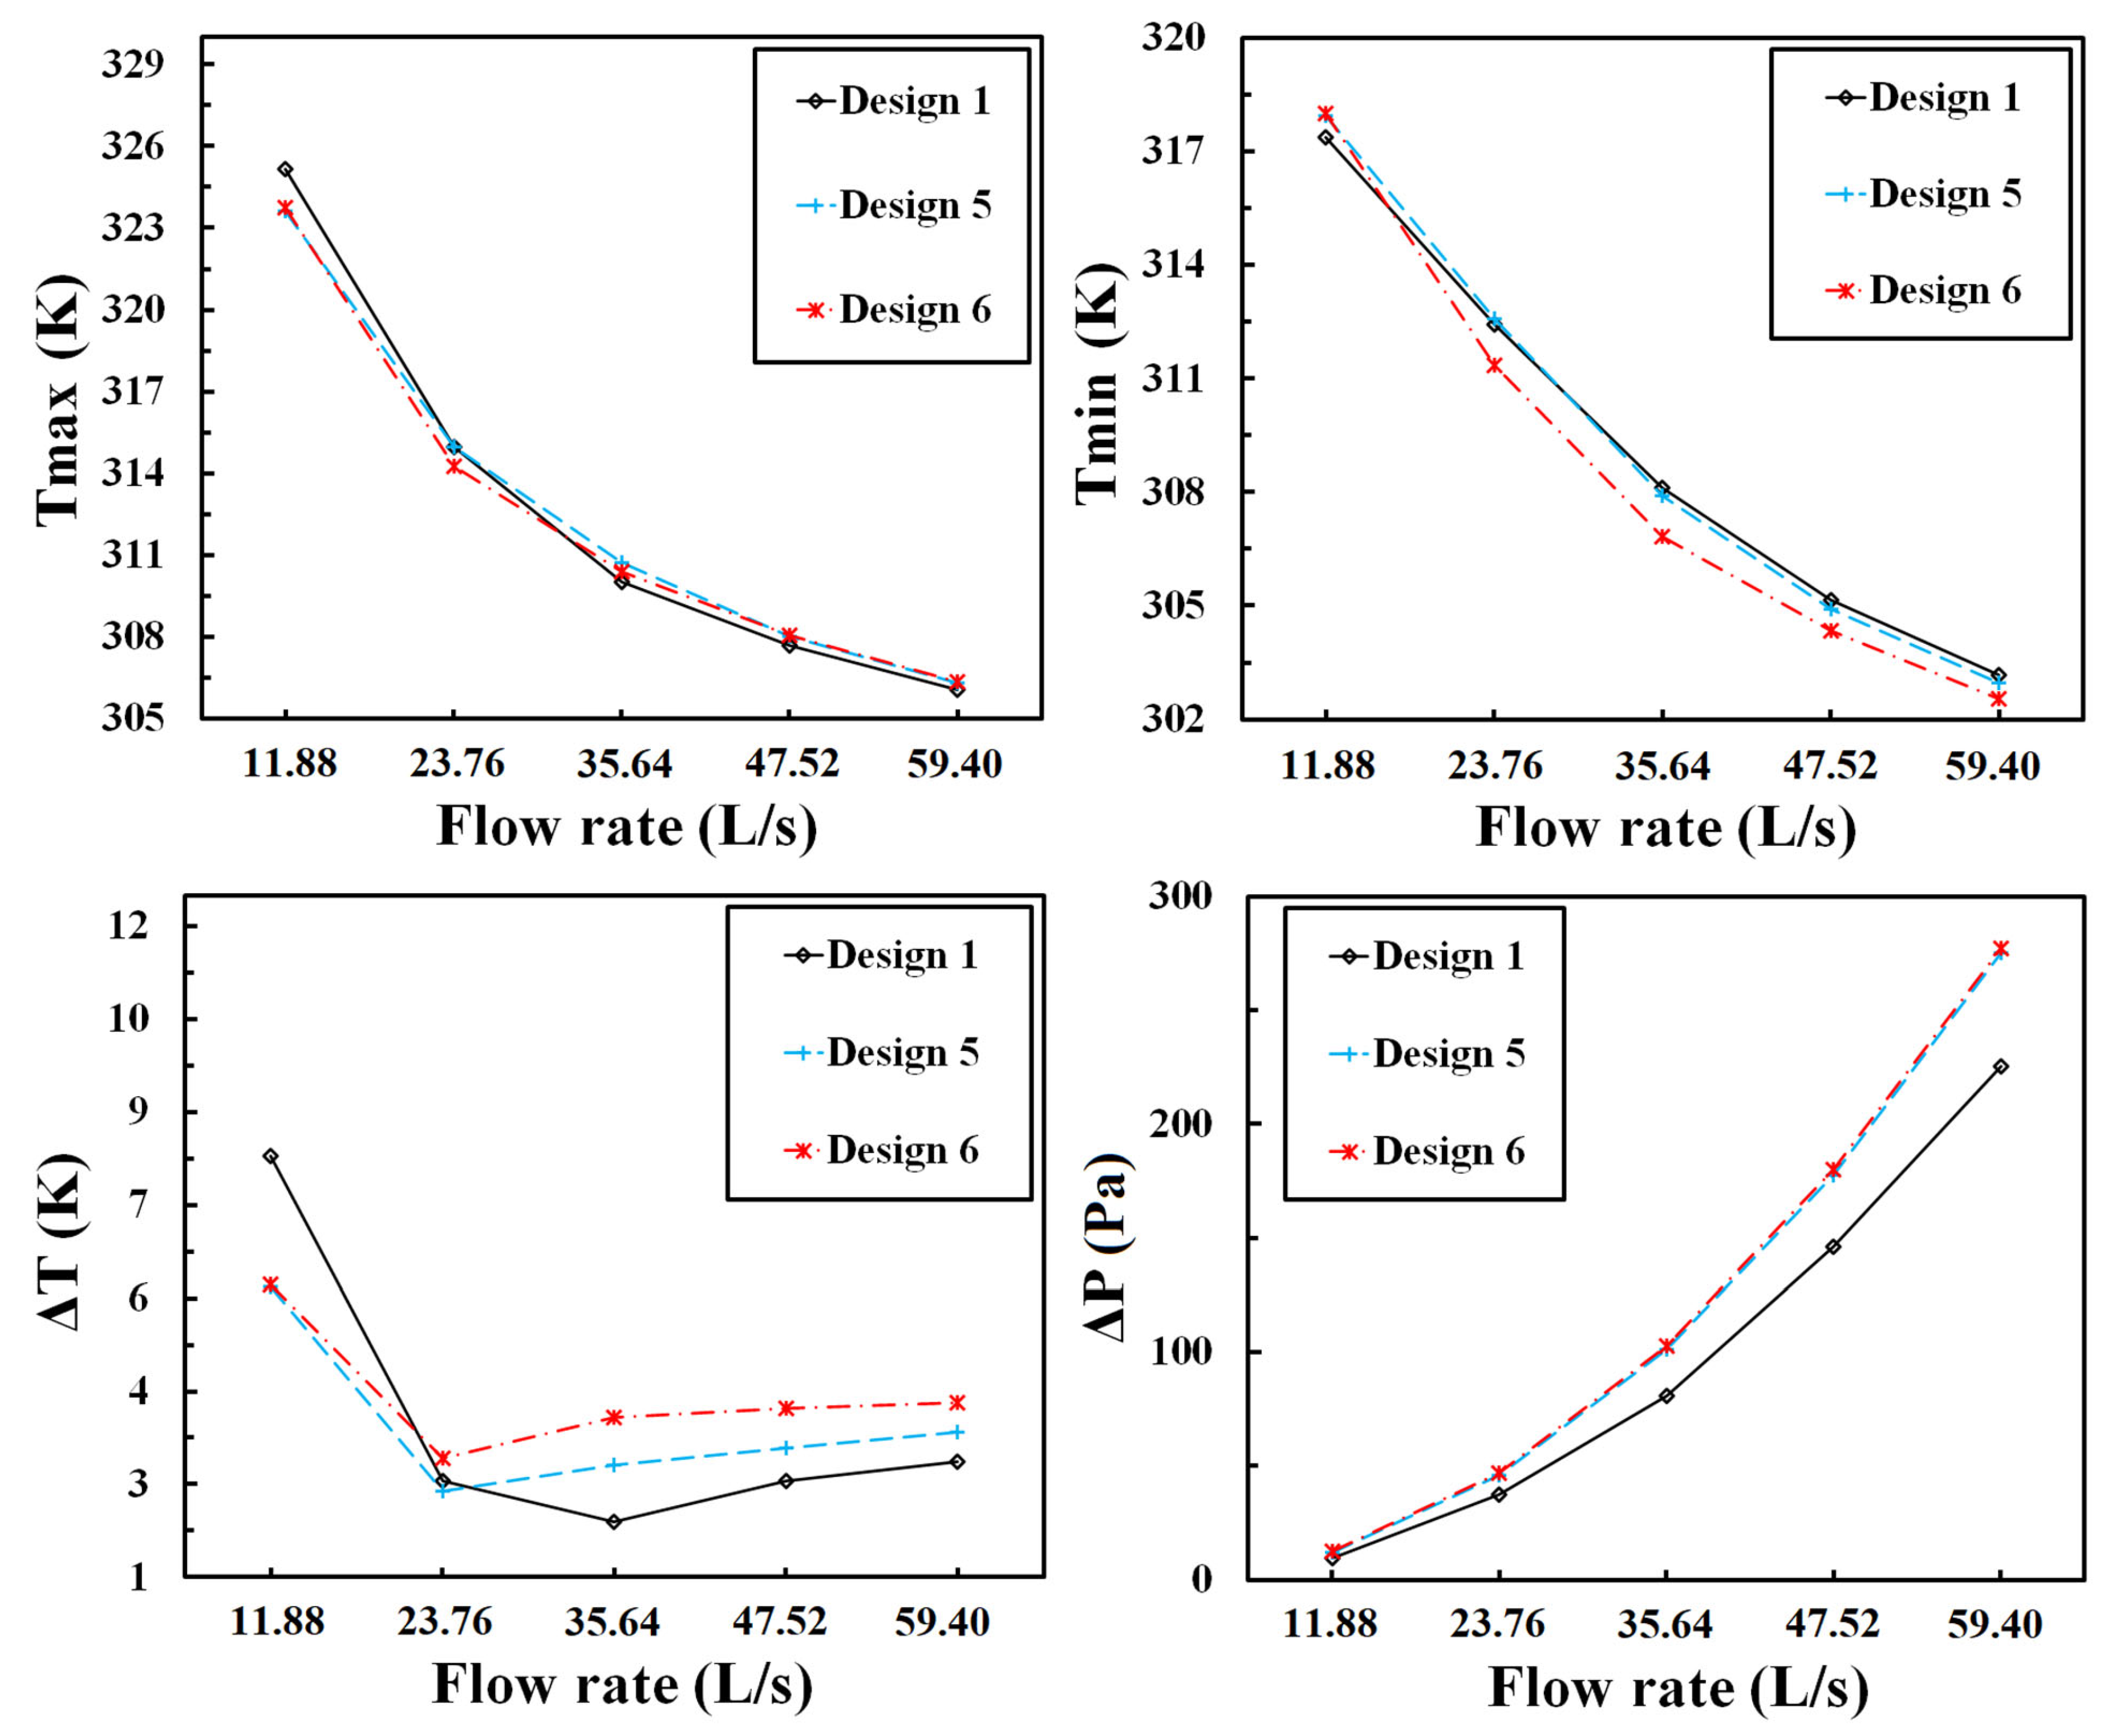
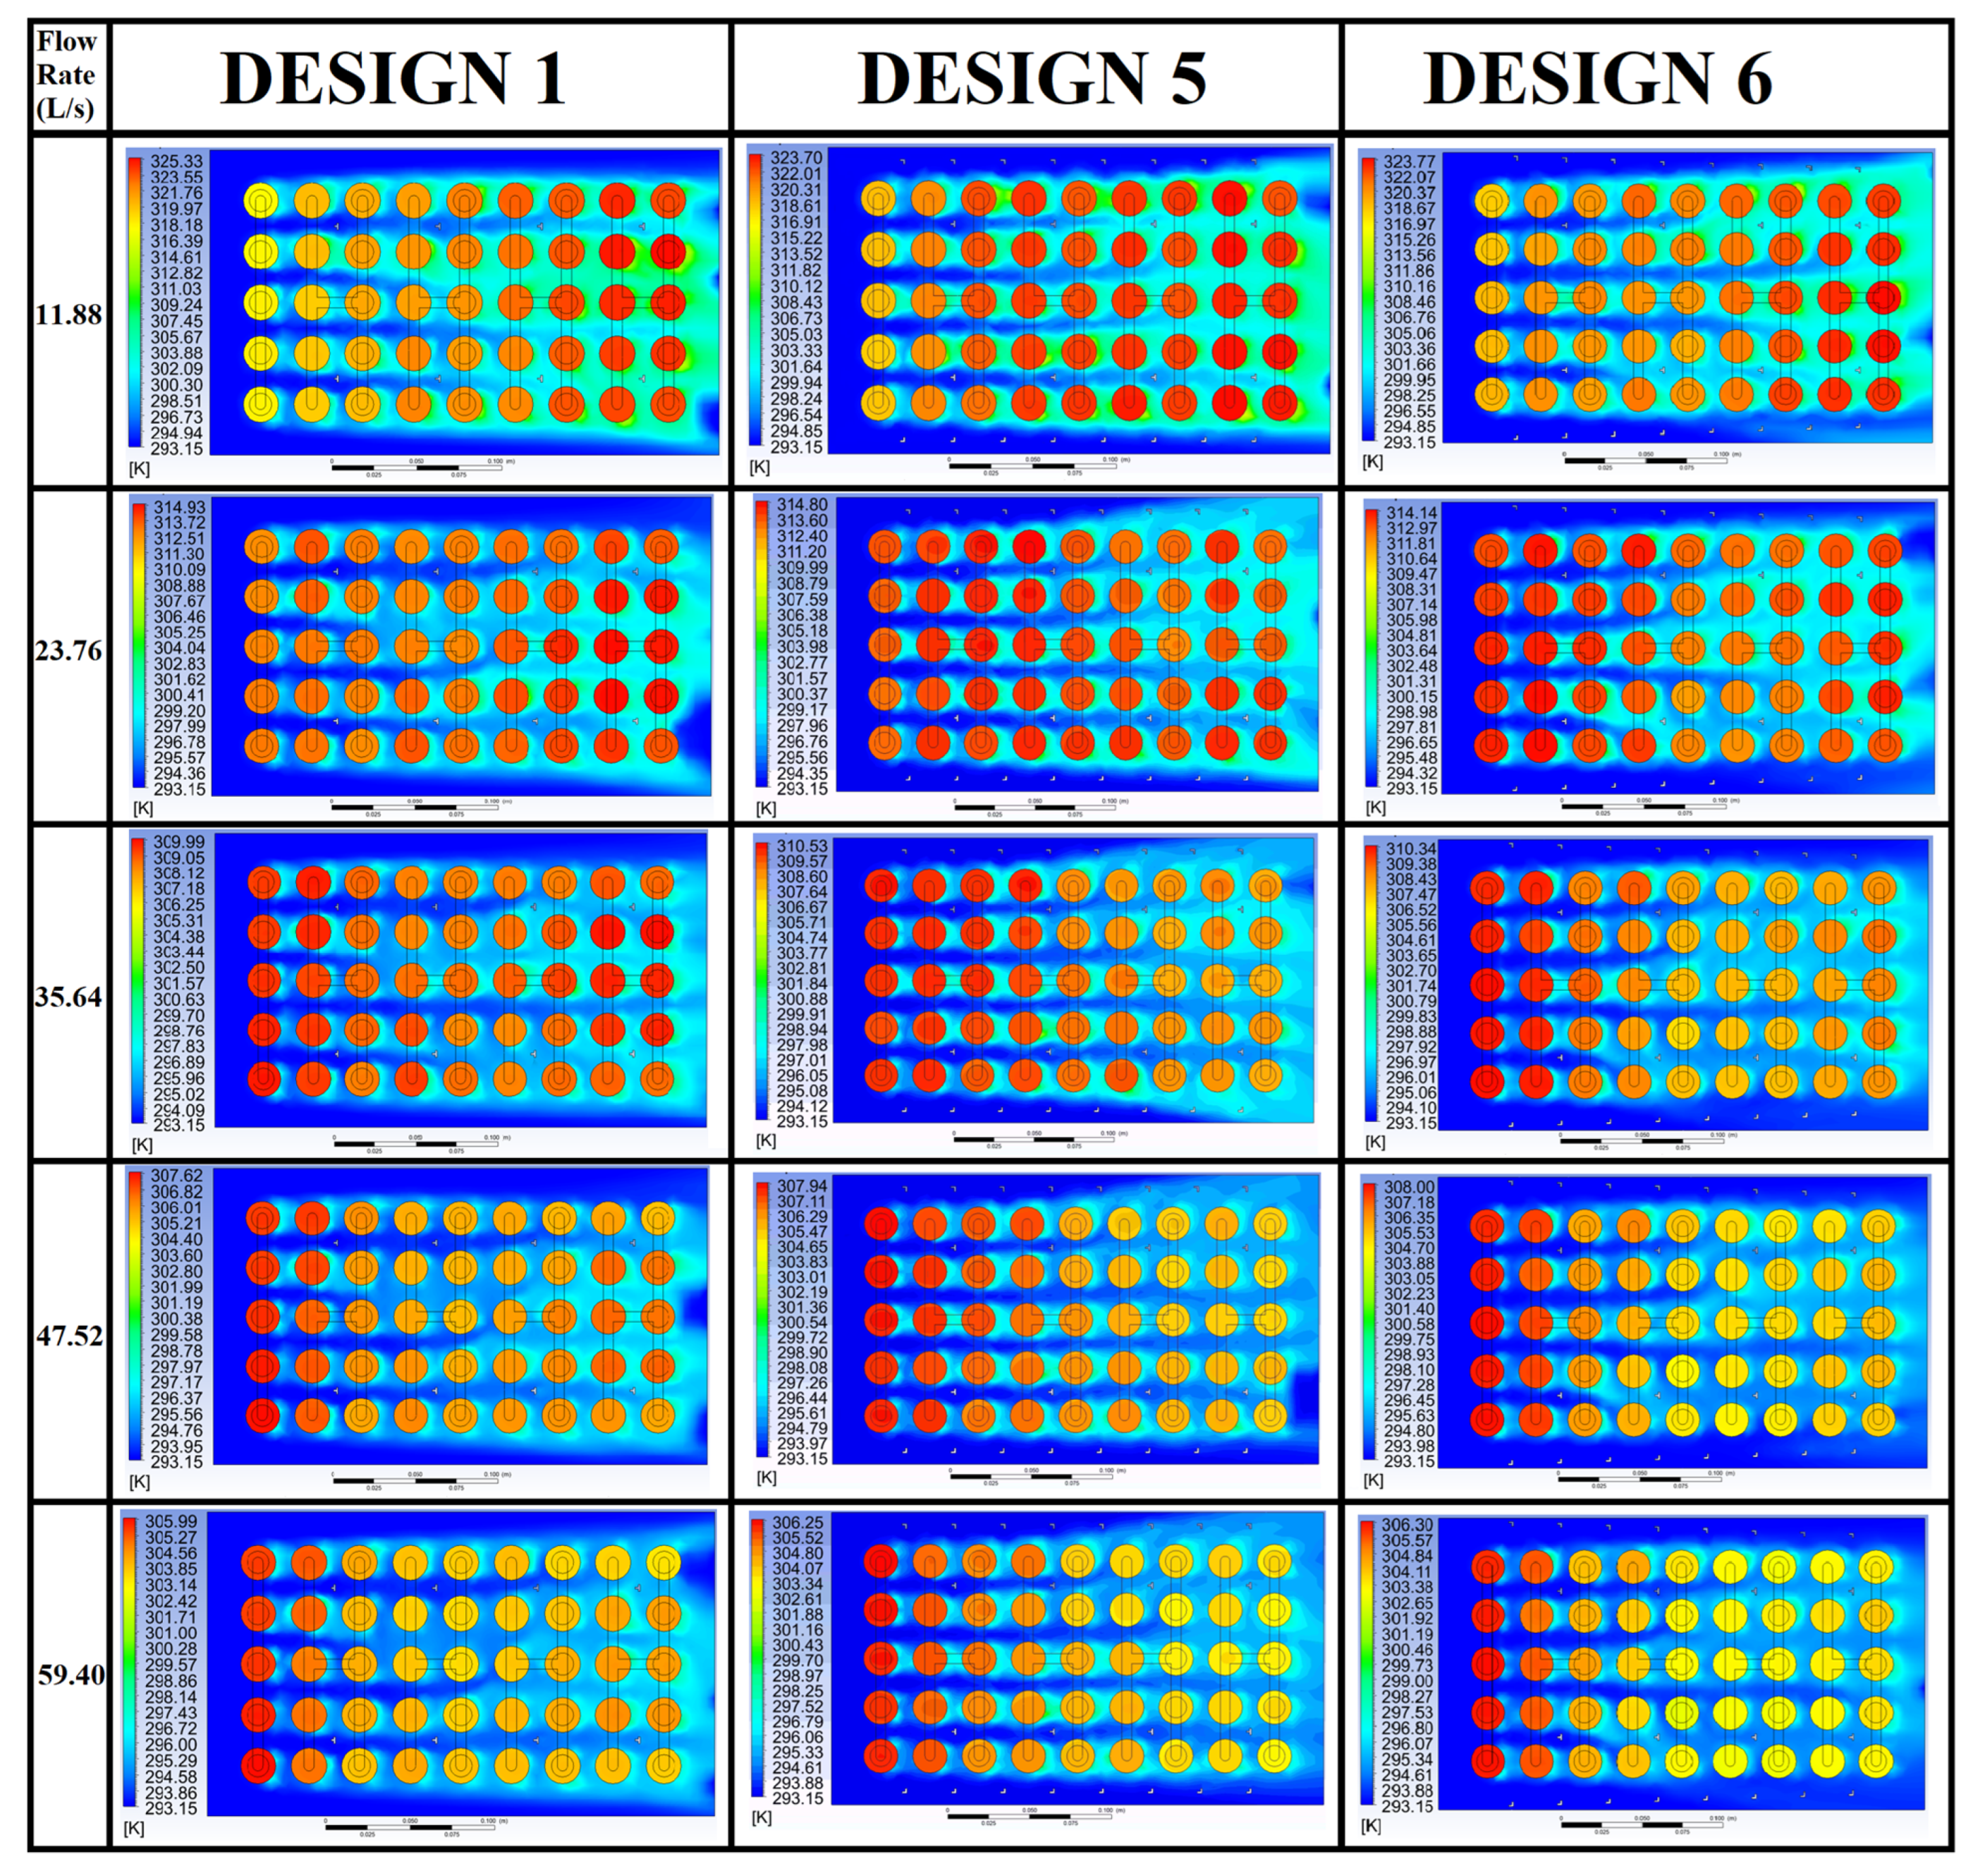
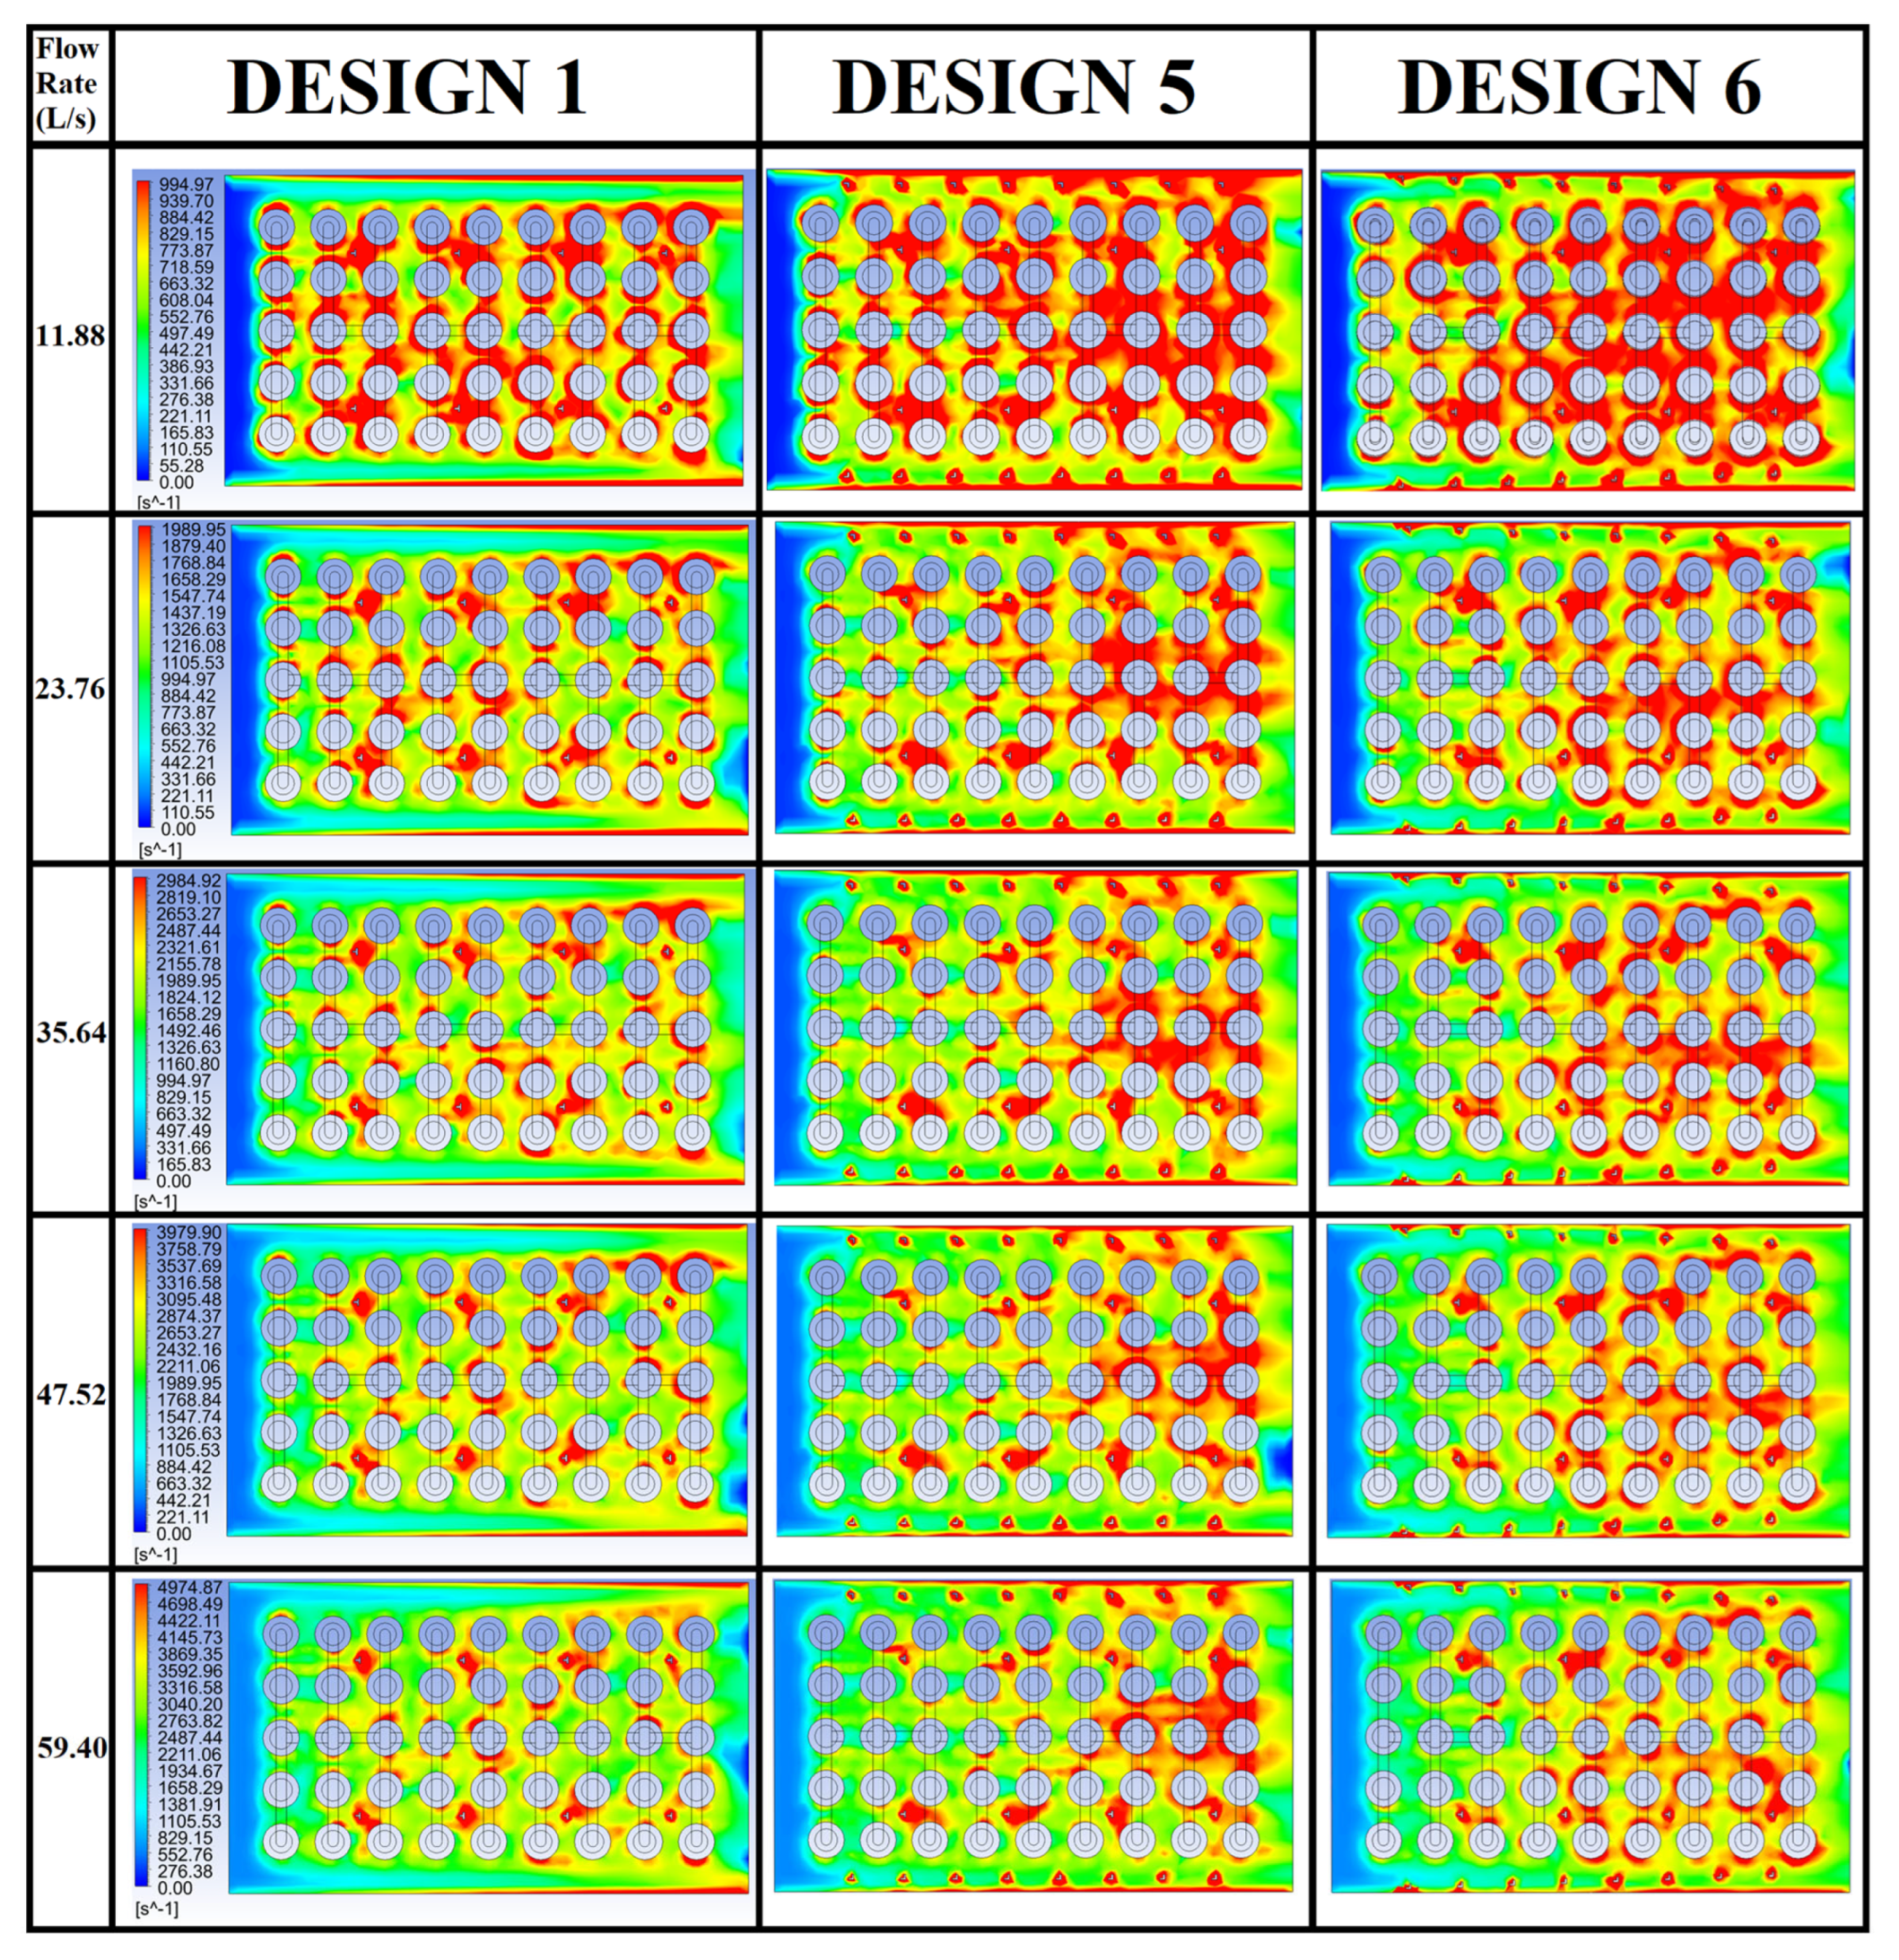
6.2. Bilateral Additional VGC Designs

Although Design 1 could meet all the temperature requirement at 47.52 L/s, its major disadvantage is the high density of the velocity streamlines on the two sides of the battery pack near the case walls as shown in Figure 9. These air streamlines directly flow out of the battery pack from inlet to outlet without sufficient heat exchange processes with the battery cells, causing the waste of cooling air and energy consumptions.
Two rows of additional L-shaped VGCs are added in the bilateral clearances in Design 5 and 6 to solve the problem of the surplus accumulations of the wasted air flow streamlines on the bilateral clearances as shown in Figure 10. The additional VGCs in Design 5 are aligned parallel to the case walls while those in Design 6 have a small inclination angle (2°) with the walls to create a convergent cooling channel along the air flow direction from inlet to outlet.
The simulation results of Design 1, 5 and 6 are shown in Figure 11. At 11.88 L/s, the Tmax values of Design 5 and 6 are 1.53 K and 1.43 K lower than Design 1. Moreover, the ΔT values of Design 5 and 6 are 2.1 K and 2.06 K lower than Design 1, showing a significant improvement in the cooling performance by adding the bilateral VGCs at low air flow rate. However, when the flow rates are increased to 35.64 L/s or over, Tmin values of both Design 5 and 6 are becoming lower than those of Design 1 and Tmax values are higher than Design 1, leading to much worse ΔT performances of the bilateral VGC designs at higher flow rates.
As a more visually perceptible explanation to the simulation results, the temperature patterns of Design 1, 5 and 6 at all flow rates are shown in Figure 12. In all figures, the inlets are on the left-hand side and the outlets are on the right-hand side. It can be generalized that the temperature distributions of all three designs are following some shared patterns: (a) cell temperatures range from low to high along the air flow direction at low flow rate (11.88 L/s); (b) cell temperatures range from high to low along the air flow direction at high flow rates (47.52 L/s and 59.40 L/s); (c) cell temperature distributions are more uniform at medium flow rates (23.76 L/s and 35.64 L/s).
To find out the influences of the TEF values on the temperature performances, the TEF patterns of Design 1, 5 and 6 at all flow rates are shown in Figure 13. Different TEF patterns mainly attribute to the battery pack internal structures. Although there are two more rows of bilateral VGCs in Design 5 and 6, the general TEF patterns of all these three designs are similar: the TEF values range from low to high along the air flow direction at all flow rates. The additional parallel bilateral VGCs in Design 5 could boost the gradient degree of the TEF patterns while the convergent bilateral VGCs in Design 6 could further enhance the gradient degree of the TEF patters as shown in Figure 13. Since all the legends are unified with same TEF ranges at each flow rate (0–1000 at 11.88 L/s, 0–2000 at 23.76 L/s, 0–3000 at 35.64 L/s, 0–4000 at 47.52 L/s and 0–5000 at 59.40 L/s), it can be observed that the consequence of the average TEF values is “Design 6 > Design 5 > Design 1”. When the flow rate is low (11.88 L/s), the cells with the higher temperatures are close to the outlet as shown in Figure 12. The higher TEF values of Design 5 and 6 effectively cool down these cells near the outlet and reduce both Tmax and ΔT values, leading to the cooling performance improvement of the bilateral VGC designs at low flow rate. However, when the flow rates are increased to 35.64 L/s or higher, the cells with lower temperatures are mostly distributed closer to the outlet as shown in Figure 12. The higher TEF values of Design 5 and 6 could further reduce the temperatures of these colder cells, adversely augmenting the temperature differences between the cells near the inlet and outlet. As a result, the bilateral VGC designs are only effective to improve the cooling performance at lower flow rates (11.88–23.76 L/s) and not beneficial to the cooling performances (especially the ΔT values) at higher flow rates (35.64–59.40 L/s).

7. Conclusions

The advantages of the air-cooling BTMS are its simple structure, high reliability and low manufacturing cost. To magnify its high-performance advantage, this study improved a basic air-cooling BTMS by adding the novel VGCs to change its TEF, TKE, Re and Nu patterns. The cooling performance improvement of the optimal design (Design 1) is proven by the simulation results: (a) At 11.88 L/s flow rate, the Tmax and ΔT of Design 1 are 0.85 K and 0.49 K lower than the conventional design; (b) at 47.52 L/s flow rate (when the criteria of Tmax < 308.15 K and ΔT < 5 K are met by most of the designs), the Tmax and ΔT of Design 1 are 0.46 K and 0.13 K lower than the conventional design. Compared with Design 2 and Design 3, Design 1 has less VGC numbers, which shows that the quantity of the VGCs is not the higher the better. Compared with Design 4, the VGCs in Design 1 have a sparser distribution. Design 5 and Design 6 with bilateral VGCs could only improve the cooling performance at low air flow rates compared with Design 1. When the flow rate increases, they became less effective than Design 1. The analysis demonstrated that VGCs could change the air flow aerodynamic and thermodynamic properties (TEF, TKE, Re and Nu, etc.) of the air-cooling BTMS. However, the specific distribution of the VGCs should be optimized respectively according to different battery cells arrangement and inlet air flow rates. This provides a guideline for engineers in the design and optimization of the air-cooling BTMS.

Author Contributions

Conceptualization, G.Z. and X.W.; methodology, G.Z., X.W. and M.N.; software, G.Z.; validation, G.Z., X.W. and M.N.; formal analysis, G.Z.; investigation, G.Z.; resources, G.Z.; data curation, G.Z.; writing—original draft preparation, G.Z.; writing—review and editing, X.W., M.N., C.L., H.Z. and Y.C.; visualization, G.Z.; supervision, X.W. and M.N.; project administration, X.W.; funding acquisition, M.N. All authors have read and agreed to the published version of the manuscript.

Funding

This research was funded by the Australian Research Council, grant number LP170100879. And The APC was funded by the UTAS research support for HDR students.

Data Availability Statement

Not applicable.

Conflicts of Interest

The authors declare no conflict of interest.

Nomenclature

Abattery surface area (m2)
Cpspecific heat capacity (J·kg−1⋅K−1)
DHhydraulic diameter of the pipe (m)
F1first blending function in the SST model
hconvective heat transfer coefficient (W∙m−2∙K−1)
jvolumetric transfer current density (A∙m−2)
kthermal conductivity (W·m−1·K−1)
turbulent kinetic energy (J·kg−1)
P, ppressure (Pa)
Pkproduction term of the turbulent kinetic energy
PSASadditional source term in the transport equation for the turbulence eddy frequency
qheat generation rate (W·m−3)
sstrain rate tensor
Ttemperature (K)
U ¯ mean velocity component (m·s−1)
uair flow velocity (m·s−1)
v air flow velocity vector (m·s−1)
Greek Symbols
α, βmodel parameters
ρmass density (kg∙m−3)
σelectrical conductivity (Siemens∙m−1)
σ ω , σ ω , 2 model parameters
τ ¯ ¯ stress tensor
νkinematic viscosity (m2·s−1)
ϕelectric potential (V)
φelectrode phase potential (V)
Del operator used as the partial derivative of a quantity with respect to all directions in the chosen coordinate system (m−1)
2 Laplace operator
Subscripts
aair
bbattery
i, jCartesian directions
+anode
cathode
Abbreviations
BTMSbattery thermal management system
EVelectric vehicle
LIBlithium-ion battery
OEMoriginal equipment manufacturer
SDstandard deviation
TEFturbulent eddy frequency
TKEturbulent kinetic energy
VGCvortex generating column

References

  1. Zhao, G.; Wang, X.; Negnevitsky, M. Connecting Battery Technologies for Electric Vehicles from Battery Materials to Management. iScience 2022, 25, 103744. [Google Scholar] [CrossRef]
  2. Jing, J.; Liu, Y.; Wu, J.; Huang, W.; Zuo, B. Research on power management and allowed propulsion control in pure electric vehicle. Energy Rep. 2022, 8, 178–187. [Google Scholar] [CrossRef]
  3. Saechan, P.; Dhuchakallaya, I. Numerical study on the air-cooled thermal management of Lithium-ion battery pack for electrical vehicles. Energy Rep. 2022, 8, 1264–1270. [Google Scholar] [CrossRef]
  4. Allen, J. Review of polymers in the prevention of thermal runaway in lithium-ion batteries. Energy Rep. 2020, 6, 217–224. [Google Scholar] [CrossRef]
  5. Lyu, Y.; Siddique, A.; Majid, S.H.; Biglarbegian, M.; Gadsden, S.; Mahmud, S. Electric vehicle battery thermal management system with thermoelectric cooling. Energy Rep. 2019, 5, 822–827. [Google Scholar] [CrossRef]
  6. Zhao, G.; Wang, X.; Negnevitsky, M.; Li, C. An Up-to-date Review on the Design Improvement and Optimization of the Liquid-Cooling Battery Thermal Management System for Electric Vehicles. Appl. Therm. Eng. 2022, 219 Pt B, 119626. [Google Scholar] [CrossRef]
  7. Liu, W.; Placke, T.; Chau, K. Overview of batteries and battery management for electric vehicles. Energy Rep. 2022, 8, 4058–4084. [Google Scholar] [CrossRef]
  8. Deng, Y.; Feng, C.; Jiaqiang, E.; Zhu, H.; Chen, J.; Wen, M.; Yin, H. Effects of different coolants and cooling strategies on the cooling performance of the power lithium ion battery system: A review. Appl. Therm. Eng. 2018, 142, 10–29. [Google Scholar] [CrossRef]
  9. Pulugundla, G.; Dubey, P.; Srouji, A. Time-Accurate CFD Analysis of Liquid Cold Plates for Efficient Thermal Performance of Electric Vehicle Li-ion Battery Modules; 0148-7191; Technical Paper; SAE: Warrendale, PA, USA, 2019. [Google Scholar]
  10. Bakhshi, S.; Dubey, P.; Srouji, A.; Wu, Z. Comparison of different liquid cooling configurations for effective thermal management of li-ion pouch cell for automotive applications. In Proceedings of the Heat Transfer Summer Conference, Online, 13–15 July 2020; p. V001T011A011. [Google Scholar]
  11. Dubey, P.; Pulugundla, G.; Srouji, A. Direct comparison of immersion and cold-plate based cooling for automotive Li-ion battery modules. Energies 2021, 14, 1259. [Google Scholar] [CrossRef]
  12. Buidin, T.I.C.; Mariasiu, F. Battery thermal management systems: Current status and design approach of cooling technologies. Energies 2021, 14, 4879. [Google Scholar] [CrossRef]
  13. Zhao, G.; Wang, X.; Negnevitsky, M.; Zhang, H. A design optimization study of an air-cooling battery thermal management system for electric vehicles. Proc. Inst. Mech. Eng. Part E J. Process Mech. Eng. 2022, 09544089221116418. [Google Scholar] [CrossRef]
  14. Zhao, G.; Wang, X.; Negnevitsky, M.; Zhang, H. A review of air-cooling battery thermal management systems for electric and hybrid electric vehicles. J. Power Sources 2021, 501, 230001. [Google Scholar] [CrossRef]
  15. Zhao, G.; Wang, X.; Negnevitsky, M. A Study of Variable Cell Spacings to the Heat Transfer Efficiency of Air-Cooling Battery Thermal Management System. Appl. Sci. 2021, 11, 11155. [Google Scholar] [CrossRef]
  16. Zhao, G.; Wang, X.; Negnevitsky, M.; Zhang, H.; Li, C. Performance Improvement of a Novel Trapezoid Air-Cooling Battery Thermal Management System for Electric Vehicles. Sustainability 2022, 14, 4975. [Google Scholar] [CrossRef]
  17. Liu, Y.; Zhang, J. Design a J-type air-based battery thermal management system through surrogate-based optimization. Appl. Energy 2019, 252, 113426. [Google Scholar] [CrossRef]
  18. Li, X.; He, F.; Zhang, G.; Huang, Q.; Zhou, D. Experiment and simulation for pouch battery with silica cooling plates and copper mesh based air cooling thermal management system. Appl. Therm. Eng. 2019, 146, 866–880. [Google Scholar] [CrossRef]
  19. Xu, Y.; Zhang, H.; Xu, X.; Wang, X. Numerical analysis and surrogate model optimization of air-cooled battery modules using double-layer heat spreading plates. Int. J. Heat Mass Transf. 2021, 176, 121380. [Google Scholar] [CrossRef]
  20. Chomdee, S.; Kiatsiriroat, T. Enhancement of air cooling in staggered array of electronic modules by integrating delta winglet vortex generators. Int. Commun. Heat Mass Transf. 2006, 33, 618–626. [Google Scholar] [CrossRef]
  21. Ye, Y.; Saw, L.H.; Shi, Y.; Tay, A.A. Numerical analyses on optimizing a heat pipe thermal management system for lithium-ion batteries during fast charging. Appl. Therm. Eng. 2015, 86, 281–291. [Google Scholar] [CrossRef]
  22. Mondal, B.; Lopez, C.F.; Verma, A.; Mukherjee, P.P. Vortex generators for active thermal management in lithium-ion battery systems. Int. J. Heat Mass Transf. 2018, 124, 800–815. [Google Scholar] [CrossRef]
  23. Xie, J.; Xie, Y.; Yuan, C. Numerical study of heat transfer enhancement using vortex generator for thermal management of lithium ion battery. Int. J. Heat Mass Transf. 2019, 129, 1184–1193. [Google Scholar] [CrossRef]
  24. Shahid, S.; Agelin-Chaab, M. Development of hybrid thermal management techniques for battery packs. Appl. Therm. Eng. 2021, 186, 116542. [Google Scholar] [CrossRef]
  25. Zhang, Y.; Li, Y.; Tao, Y.; Ye, J.; Pan, A.; Li, X.; Liao, Q.; Wang, Z. Performance assessment of retired EV battery modules for echelon use. Energy 2020, 193, 116555. [Google Scholar] [CrossRef]
  26. Tiedemann, W.; Newman, J. Mathematical modeling of the lead-acid cell. In Proceedings of the Symposium on Battery Design and Optimization, Seattle, WA, USA; 1979; p. 79-1. [Google Scholar]
  27. Lee, K.-J.; Smith, K.; Pesaran, A.; Kim, G.-H. Three dimensional thermal-, electrical-, and electrochemical-coupled model for cylindrical wound large format lithium-ion batteries. J. Power Sources 2013, 241, 20–32. [Google Scholar] [CrossRef]
  28. Pinto, A.M.; Oliveira, V.S.; Falcão, D.S.C. Direct Alcohol Fuel Cells for Portable Applications: Fundamentals, Engineering and Advances; Academic Press: Cambridge, MA, USA, 2018. [Google Scholar] [CrossRef]
  29. Huang, R.; Li, Z.; Hong, W.; Wu, Q.; Yu, X. Experimental and numerical study of PCM thermophysical parameters on lithium-ion battery thermal management. Energy Rep. 2020, 6, 8–19. [Google Scholar] [CrossRef]
  30. Liang, G.; Li, J.; He, J.; Tian, J.; Chen, X.; Chen, L. Numerical investigation on a unitization-based thermal management for cylindrical lithium-ion batteries. Energy Rep. 2022, 8, 4608–4621. [Google Scholar] [CrossRef]
  31. Pesaran, A.A. Battery thermal models for hybrid vehicle simulations. J. Power Sources 2002, 110, 377–382. [Google Scholar] [CrossRef]
  32. Zhao, C.; Cao, W.; Dong, T.; Jiang, F. Thermal behavior study of discharging/charging cylindrical lithium-ion battery module cooled by channeled liquid flow. Int. J. Heat Mass Transf. 2018, 120, 751–762. [Google Scholar] [CrossRef]
  33. Patil, M.S.; Seo, J.-H.; Panchal, S.; Jee, S.-W.; Lee, M.-Y. Investigation on thermal performance of water-cooled Li-ion pouch cell and pack at high discharge rate with U-turn type microchannel cold plate. Int. J. Heat Mass Transf. 2020, 155, 119728. [Google Scholar] [CrossRef]
  34. Shang, Z.; Qi, H.; Liu, X.; Ouyang, C.; Wang, Y. Structural optimization of lithium-ion battery for improving thermal performance based on a liquid cooling system. Int. J. Heat Mass Transf. 2019, 130, 33–41. [Google Scholar] [CrossRef]
  35. Choudhari, V.; Dhoble, A.; Panchal, S. Numerical analysis of different fin structures in phase change material module for battery thermal management system and its optimization. Int. J. Heat Mass Transf. 2020, 163, 120434. [Google Scholar] [CrossRef]
  36. Menter, F.R. Two-equation eddy-viscosity turbulence models for engineering applications. AIAA J. 1994, 32, 1598–1605. [Google Scholar] [CrossRef] [Green Version]
  37. Končar, B.; Košmrlj, S. Simulation of turbulent flow in MATIS-H rod bundle with split-type mixing vanes. Nucl. Eng. Des. 2018, 327, 112–126. [Google Scholar] [CrossRef]
  38. Tanov, S.; Pachano, L.; Andersson, Ö.; Wang, Z.; Richter, M.; Pastor, J.V.; García-Oliver, J.M.; García, A. Influence of spatial and temporal distribution of Turbulent Kinetic Energy on heat transfer coefficient in a light duty CI engine operating with Partially Premixed Combustion. Appl. Therm. Eng. 2018, 129, 31–40. [Google Scholar] [CrossRef]
  39. Wang, G.; Yang, F.; Wu, K.; Ma, Y.; Peng, C.; Liu, T.; Wang, L.-P. Estimation of the dissipation rate of turbulent kinetic energy: A review. Chem. Eng. Sci. 2021, 229, 116133. [Google Scholar] [CrossRef]
  40. Ching, D.S.; Banko, A.J.; Milani, P.M.; Eaton, J.K. Machine learning modeling for RANS turbulent kinetic energy transport in 3D separated flows. In Proceedings of the 11th International Symposium on Turbulence and Shear Flow Phenomena, Southampton, UK, 30 July–2 August 2019. [Google Scholar]
  41. Kim, D.J.; Jeong, S.; Park, T.; Kim, D. Impinging sweeping jet and convective heat transfer on curved surfaces. Int. J. Heat Fluid Flow 2019, 79, 108458. [Google Scholar] [CrossRef]
  42. Ajarostaghi, S.S.M.; Zaboli, M.; Nourbakhsh, M. Numerical evaluation of turbulence heat transfer and fluid flow of hybrid nanofluids in a pipe with innovative vortex generator. J. Therm. Anal. Calorim. 2021, 143, 1583–1597. [Google Scholar] [CrossRef]
  43. Bazdar, H.; Toghraie, D.; Pourfattah, F.; Akbari, O.A.; Nguyen, H.M.; Asadi, A. Numerical investigation of turbulent flow and heat transfer of nanofluid inside a wavy microchannel with different wavelengths. J. Therm. Anal. Calorim. 2020, 139, 2365–2380. [Google Scholar] [CrossRef]
  44. Maithani, R.; Kumar, A.; Gholamali Zadeh, P.; Safaei, M.R.; Gholamalizadeh, E. Empirical correlations development for heat transfer and friction factor of a solar rectangular air passage with spherical-shaped turbulence promoters. J. Therm. Anal. Calorim. 2020, 139, 1195–1212. [Google Scholar] [CrossRef]
  45. Kumar, A.; Layek, A. Nusselt number and friction factor correlation of solar air heater having twisted-rib roughness on absorber plate. Renew. Energy 2019, 130, 687–699. [Google Scholar] [CrossRef]
  46. Acır, A.; Ata, İ. A study of heat transfer enhancement in a new solar air heater having circular type turbulators. J. Energy Inst. 2016, 89, 606–616. [Google Scholar] [CrossRef]
  47. Taler, D. Mathematical modeling and experimental study of heat transfer in a low-duty air-cooled heat exchanger. Energy Convers. Manag. 2018, 159, 232–243. [Google Scholar] [CrossRef]
  48. Meyers, L.M.; Msomi, V. Hydrodynamic analysis of an underwater glider wing using ANSYS fluent as an investigation tool. Mater. Today Proc. 2021, 45, 5456–5461. [Google Scholar] [CrossRef]
  49. Fan, Y.; Bao, Y.; Ling, C.; Chu, Y.; Tan, X.; Yang, S. Experimental study on the thermal management performance of air cooling for high energy density cylindrical lithium-ion batteries. Appl. Therm. Eng. 2019, 155, 96–109. [Google Scholar] [CrossRef]
Figure 1. (a) The conventional design; (b) The design with vortex generating columns.
Batteries 09 00208 g001
Figure 2. Mesh independence study: (a) single-cell electrode perimeter mesh division number N1 = 25, N2 = 50; (b) mesh image of boundary layers; (c) simulation results comparison between different mesh element sizes at three discharging rates (0.3 C, 0.6 C and 1 C).
Batteries 09 00208 g002
Figure 3. Time step size independence study results.
Batteries 09 00208 g003
Figure 4. (a) Simulation results of the battery surface temperature contours and air velocity streamlines during 0.5 C discharging with 4 m/s inlet air velocity at 293.15 K (20 °C); (b) The comparison between the simulation results and the experimental data in Ref. [49].
Batteries 09 00208 g004
Figure 5. The basic Design 1 with different contour shape VGCs.
Batteries 09 00208 g005
Figure 6. Simulation results of Design 1 with different contour shape VGCs.
Batteries 09 00208 g006
Figure 7. Design 1–4 with different VGC distributions.
Batteries 09 00208 g007
Figure 8. Simulation results of Design 1–4 at five air flow rates.
Batteries 09 00208 g008
Figure 9. Temperature distribution volume rendering and velocity streamlines of Design 1 at 47.52 L/s.
Batteries 09 00208 g009
Figure 10. Design 5 and 6 with bilateral additional VGCs.
Batteries 09 00208 g010
Figure 11. Simulation results of Design 1–4 at five air flow rates.
Batteries 09 00208 g011
Figure 12. Temperature patterns of Design 1, 5 and 6 at all flow rates.
Batteries 09 00208 g012
Figure 13. TEF patterns of Design 1, 5 and 6 at all flow rates.
Batteries 09 00208 g013
Table 1. Thermodynamic properties of the conventional design and Design 1–4.
Thermodynamic PropertiesFlow Rate (L/s)ConventionalDesign 1Design 2Design 3Design 4
Average Turbulent Kinetic Energy (J/kg)11.880.050.050.050.050.05
23.760.200.210.200.200.20
35.640.440.460.450.460.44
47.520.760.810.760.800.79
59.401.161.241.211.231.21
Average Reynolds Number11.8868.9468.7466.5762.5868.14
23.76135.44138.24132.12124.56134.71
35.64205.36204.87200.06189.14199.90
47.52272.22272.51258.73249.13268.54
59.40336.25337.85325.12308.42333.47
Average Nusselt Number11.88127.44129.47129.53125.90122.79
23.76179.07183.52180.33177.33172.53
35.64225.37228.94226.29223.48216.28
47.52265.13268.94265.54263.89255.35
59.40300.12304.44301.12298.81289.40
Disclaimer/Publisher’s Note: The statements, opinions and data contained in all publications are solely those of the individual author(s) and contributor(s) and not of MDPI and/or the editor(s). MDPI and/or the editor(s) disclaim responsibility for any injury to people or property resulting from any ideas, methods, instructions or products referred to in the content.

