Article

Thermal Management for Battery Module with Liquid-Cooled Shell Structure under High Charge/Discharge Rates and Thermal Runaway Conditions

School of Mechanical and Automotive Engineering, Shanghai University of Engineering Science, 333 Longteng Road, Songjiang, Shanghai 201620, China
*
Author to whom correspondence should be addressed.
Batteries 2023, 9(4), 204; https://doi.org/10.3390/batteries9040204
Submission received: 18 January 2023 / Revised: 15 March 2023 / Accepted: 28 March 2023 / Published: 29 March 2023
(This article belongs to the Section Battery Modelling, Simulation, Management and Application)

Abstract

:
In this paper, the thermal management of a battery module with a novel liquid-cooled shell structure is investigated under high charge/discharge rates and thermal runaway conditions. The module consists of 4 × 5 cylindrical batteries embedded in a liquid-cooled aluminum shell with multiple flow channels. The battery module thermal management and the suppression of thermal propagation were experimentally examined. The temperature rise of the battery in the discharging process is significantly greater than that in the charging phase. As the coolant flow speed increases, the maximum temperature of the battery module decreases slightly, while the temperature difference remains at the same level, at the expense of a much-increased pressure drop. With the presented liquid-cooled shell, the suppression of thermal propagation was investigated for both internal and corner battery thermal runaway. It is found that the temperature of the adjacent battery can be maintained at under 70 °C, indicating that the propagation of thermal runaway can be successfully suppressed by heat dissipation through the surrounding liquid flow. In addition, the electrically induced thermal profile along the battery interconnection was identified through thermal imaging. Hot spots were found on the confluence busbars of the batteries in series connection. In order to improve the safety of battery modules, a parallel battery connection in the battery module is recommended, which can reduce the busbar temperature by 4.86 °C, as determined through numerical simulations. Experimental measurements were also conducted to verify the simulation results.

1. Introduction

The development of new energy vehicles is a key industrial development direction in China, which plays an indispensable role in achieving the carbon neutrality goal [1,2,3]. Electric vehicles have used lithium-ion batteries for years due to their high energy density, long service life, and low self-discharge rate, and they have gradually become the fundamental power source for new energy vehicles [4,5]. However, Li-ion batteries still face thermal management and thermal safety issues [6,7,8]. The performance of lithium-ion batteries is very sensitive to the ambient temperature from 10 °C to 45 °C [9]. The heat generation of lithium batteries during charging and discharging due to internal resistance will increase the temperature of the battery, and the heat generation is more significant in the case of a high discharge rate. Insufficient heat dissipation in the battery module results in a high battery temperature, which affects the lifetime and safety of the battery. As such, it is important to design a high-quality BTMS (battery thermal management system) to ensure that the temperature of the battery module remains stable [10,11,12].
The methods of thermal management for batteries include air cooling [13], liquid cooling [14], and phase-change cooling [15]. For low-power small vehicles, air cooling is an efficient thermal management system due to its simple structure, ease of implementation, and low cost [16,17]. Wu et al. selected the typical unit cell of tubular heat exchangers to numerically optimize the thermal performance of a heat exchanger. The optimal structure was obtained by focusing on the heat transfer rate and fan power at the air side [18]. However, the low thermal conductivity of air and the obvious heating effect along the course make it difficult to meet the thermal management requirements of long-range high-power battery packs, not to mention the suppression of thermal propagation. Phase change cooling is a passive cooling of the cell using the latent heat of a PCM (phase change material) without additional energy consumption, but the disadvantage is that the thermal conductivity is low and the heat dissipation capability is largely lost after complete melting [19]. In comparison, liquid cooling performs better than air cooling due to its higher heat capacity and coefficient of heat transfer. Lai et al. [20] proposed a parallel curved liquid cooling structure for cylindrical battery module cooling. Zhao et al. [21] arranged serpentine channels on the surface of cylindrical cells to cool their cell modules and obtained a good uniform temperature performance at a 5C discharge rate. C indicates the charge/discharge rate of a lithium-ion battery, which is defined as the ratio of charge/discharge current to nominal current. Wu et al. [22] provided a design method for the design of a power battery hybrid thermal management system, combining active cooling and passive cooling. A kind of new hybrid thermal management system combining phase change materials with a series of liquid cooling was designed. Using the same structure, experiments have examined the impact of the thermal management performance of different cooling methods on the battery pack and ambient temperature. Liu et al. [23] designed a novel liquid cooling flow channel structure with vertical layout channel or horizontal layout configuration. The vertical layout of the runner structure has better cooling performance than the horizontal layout. However, a novel battery module type with a liquid-cooled shell structure was proposed, with multiple horizontal and vertical flow channels built into the shell. It is noted that most of liquid cooling techniques are examined under normal operation without considering an accidental battery thermal runaway scenario with excessive heat generation.
A key component of thermal management is the suppression of thermal propagation. The thermal propagation behavior in battery modules due to thermal runaway have been reported under different conditions. Jin et al. [24] used multiple heaters in a square battery module and discussed the thermal runaway propagation characteristics of the battery module under multiple heating powers. Lopez et al. [25] investigated the influence of the nickel busbar connection configuration on thermal runaway propagation. Additionally, the busbar connection configuration was varied by using the M type and the S type. A nickel busbar of M type extends to the terminals of other batteries with multiple branches to form positive and negative terminals of the battery module. These tests showed that the M-type tab configuration with multiple batteries in parallel has a lower temperature and may be safer than the S-type module. Li et al. [26] triggered the thermal runaway of a battery by heating it with a heater which was the same size and shape as the battery. The heat transfer path of the battery under different heating powers was analyzed. Zhong et al. [27] simulated thermal runaway cells in a 3 × 3 module thermal runaway propagation experiment using a heater of the same size as the cells. Amano et al. [28] studied the thermal runaway of lithium-ion batteries heated by a heater with a maximum heater power of 400 W. Wang et al. [29] selected eight NMC811-type 18650 Li-ion battery modules with a 300 W power heater to test the triggering of adjacent cells to study the effects of different cell spacings and critical temperatures on thermal runaway propagation. Increasing the thermal runaway triggering temperature and cell spacing can reduce the risk of thermal propagation. Rui et al. [30] studied the thermal runaway propagation of square battery modules through numerical simulations to explore the characteristics of bottom liquid cooling to suppress the thermal runaway propagation of battery modules. Nonetheless, much more work is required to mitigate and suppress the thermal propagation of battery thermal runaway in battery packs.
In order to improve the safety of a battery module, the temperature of the battery module should be controlled at an acceptable level at both high charge/discharge rates and in the extreme heat generating case of thermal runaway. However, battery module thermal management systems with the above functions are not well reported in the literature. To achieve such a design goal, the thermal management and thermal propagation performances of lithium-ion battery modules configured with a new type of liquid-cooled shell are investigated through experiments and simulations. The effects of multiple flow speeds and coolant temperatures on the thermal management performance of battery modules are discussed through experiments, and the recommended flow speed and coolant temperature for lithium-ion battery thermal management were proposed. The temperature profiles of the busbar in the battery module were recorded by a thermal imaging camera, and the highest temperature was found at the positive and negative ports and the confluence busbar connection in series. Adopting a test battery as the thermal runaway battery, the thermal suppression performance of the liquid-cooled shell was experimentally examined. The thermal performance on the thermal runaway propagation of the battery to adjacent cells at multiple flow speeds was examined experimentally. In order to further improve the safety of battery modules, an improved busbar connection mode for the battery module is proposed. It is demonstrated by numerical simulation that the presented liquid-cooled shell has excellent thermal performance for both thermal management and suppression of the thermal propagation across the battery module.

2. Experimental Setup and Numerical Models

2.1. Experimental System for the Battery Module

The battery used in the experiment was a commercial 18650 LIB with NMC (nickel–manganese–cobalt). The nominal capacity of the battery was 2.5 Ah and the operating voltage ranged from 2.5 V to 4.2 V. As shown in Figure 1, a liquid-cooled experimental system for the battery module was built, including a circulating thermostatic water tank, a flow meter, a charge/discharge tester, a differential pressure meter, and a temperature data collector. Two test sections were built. One was for battery thermal management under normal charge and discharge conditions, and the other was for the battery module with a triggering heater to investigate the suppression of the thermal runaway. The experimental test system is shown in Figure 1, together with both test sections. The novel liquid-cooled shell heat dissipation structure was fabricated with 4 × 5 holes to house the 18650 Li-ion batteries. The batteries were arranged in four rows, and five batteries in each row were connected by a nickel busbar to form the 5P4S connection. To monitor the battery module temperature, cells #1, #2, #5, #9, #13, and #17 were tin-soldered with thermocouples on top of them, with the red dot representing the thermocouple soldering location for both the thermal management battery module and the battery module to suppress the thermal runaway. Plastic insulating plates covered the top and bottom of the case structure to prevent the short circuiting of the battery module. The liquid-cooled shell was wrapped with 20 mm of aerogel to minimize the natural convection heat loss to the ambient. The wire diameter of all the K-type thermocouples was 0.25 mm.
The objective of this study is to examine the suppression effect on thermal runaway propagation in battery modules; two test batteries installed with multiple heaters, denoted as #14 and #20, simulate the thermal runaway scenario. As shown in Figure 1, the battery module thermal propagation experimental device consists of eighteen real batteries and the two test batteries. As a result of battery thermal runaway, a large amount of heat is generated, causing the battery temperature to rise sharply, which would then induce more thermal runaway batteries and thus is referred to as thermal propagation. For the thermal runaway suppression test, only the thermal performance was examined without really triggering the battery thermal runaway. During the experiment, the temperatures of both test batteries (#14 and #20) and the temperatures of the adjacent batteries were monitored. The test batteries were connected to DC power. The test batteries have four built-in heater rods, each with a maximum heating power of 150 W, and thus the maximum power of both of the two test batteries is 600 W.

2.2. Novel Battery Module Liquid-Cooled Shell Model

In this paper, a novel battery module type with a liquid-cooled shell structure was proposed and is schematically shown in Figure 2. The liquid-cooled shell is equipped with 4 × 5 through-holes of 18.5 mm in diameter to accommodate the 18650 Li-ion batteries, with multiple horizontal and vertical flow channels built into the shell. The batteries were arranged in four rows, and five batteries in each row were connected in parallel by a nickel busbar to form the 5P4S connection. The distance between the adjacent battery centers is 26.5 mm, except for the middle two rows of battery through-holes, for which the distance between the adjacent battery centers was expanded to 28.5 mm to facilitate the fabrication of inlet channels. The clearance between the battery through holes at the corners and the lateral side is 18.25 mm. The overall shell size is 142.5 mm × 118 mm × 59 mm. More details on the dimensions can be found in Figure 2b.
In order to enhance the heat transfer, circular fluid channels, indicated as green blocks in Figure 2, were placed on the two large lateral sides of the shell structure with a cross-sectional diameter of 4 mm. The inlet flows went through the internal flow channels with the same diameter of 4 mm, and then came out of the shell structure through the horizontal and vertical branching channels inside the shell. The inlet and outlet confluence grooves were installed in the shell structure to connect to the external liquid cooling system.

2.3. ECM Model

The ECM model lithium-ion battery electrochemical heat production equation is as follows:
q E C h = I V o l [ V o c v ( φ + φ ) T d U d T ]
where Vol is the volume of the battery, I is the current, Vocv is the open circuit voltage, and φ+ and φ are the positive and negative voltages, respectively.
The electrical behavior of the battery is represented by the ECM (equivalent circuit model). This equivalent circuit model has a 4P model (one RC loop) and a 6P model (two RC loops) (resistor-capacitance). Considering the accuracy of the battery model simulation in calculating the heat generation rate, the 6P model was chosen. The second-order RC circuit model includes three resistors and two capacitors. The voltage–current relationship satisfies the following circuit equation:
V = V o c v ( S O C ) V 1 V 2 R S ( S O C ) I t
d V 1 d t = 1 R 1 ( S O C ) C 1 ( S O C ) V 1 1 C 1 ( S O C ) I ( t )
d V 2 d t = 1 R 2 ( S O C ) C 2 ( S O C ) V 2 1 C 2 ( S O C ) I ( t )
d ( S O C ) d t = I ( t ) 3600 Q r e f
where R1 and R2 are the resistance values of resistors 1 and 2, respectively, and V1 and V2 are the voltages of resistors 1 and 2, respectively. R1 and R2 connect in parallel with C1 and C2, respectively, and they form two RC links. Rs is the resistance value of the resistor and Qref is the nominal capacity of the battery. The second-order ECM parameter fitting is based on HPPC (hybrid pulse power characterization) data. The temperature of the battery rises during charging and discharging, and its internal equivalent circuit parameters change with temperature. Additionally, these equivalent circuit parameters will change with the change in battery SOC.

2.4. Boundary Conditions and Control Equations

A thermal simulation analysis of the battery module was performed by ECM in Ansys Fluent 2021R1 with the following assumptions:
1. The thermal properties of the materials are assumed to be constant.
2. Only the natural convection effects for the top and bottom of the cell are considered, whereas the other sides of the shell structure are set to adiabatic conditions, except for the inlet and outlets.
3. There is no consideration of the contact thermal resistance between the cell and the structure.
4. The coolant (water) is assumed to be an incompressible Newtonian fluid, and the thermal properties are set to the corresponding values at room temperature.
The ambient temperature and inlet coolant are both 25 °C and the heat transfer coefficient of the top and bottom for the cell is 5 W/(m2∙K) under natural convection. The relative pressure at the outlet is zero and the flow speed at the inlet is fixed at 1 m/s.
The amount of heat dissipated can be found using Equation (1), according to Newton’s law of cooling, where Ta is the ambient temperature and ha is the convective heat transfer coefficient of fluid.
q a = h a ( T b T a )
The energy conservation equation for the battery is shown in Equation (7), where ρb, cb, Qb, and Tb are the density, heat capacity, heat source, and temperature of the battery, respectively. The energy equation of the battery can be expressed as:
ρ b c b T b t = λ x 2 T b x 2 + λ y 2 T b y 2 + λ z 2 T b z 2 + Q b
The two equations that represent mass and momentum conservation are shown below, where P (Pa) is the static pressure.
ρ w t + ( ρ w u ) = 0
t ( ρ w u ) + t ( ρ w u u ) = P
The standard k-ε equations are as follows:
( ρ k ) t + ( ρ k u j ) x j = x j ( u t σ x k x j ) + G k + G b ρ ε
( ρ k ) t + ( ρ ε u j ) x j = x j [ ( μ + μ t σ ε ) · ε x j ] + C 1 ε G k ε k C 2 ε ρ ε 2 k
μ t = ρ C μ k 2 ε
The parameters of the material used in numerical simulations are shown in Table 1. The grid independence of the simulation model was verified before numerically simulating the structure, as shown in Figure 2c. The number of meshes for comparison includes 709,875, 942,150, 1,303,645, 1,702,364, and 2,259,827, and as the number of meshes increases, the temperature tends to be smooth, as shown in Figure 3. The maximum temperature and temperature difference of the battery module changed very little when the calculation grid number was increased from 1,303,645 to 2,259,827, with relative deviations of 0.20% and 0.43%, respectively. Balancing the calculation time and accuracy, a grid number of 1,303,645 was used in this work.

2.5. Data Uncertainty Analysis

It is important to note that the experimental test was mostly characterized by the presence of system errors and random errors. In this work, the uncertainty of a K-type thermocouple with class 1 accuracy was estimated to be 2%, considering a temperature accuracy of 0.2 °C within the temperature rise of 10 °C. The uncertainty caused by specific experimental instruments in each experiment is shown in Table 2. An uncertainty analysis was performed using the root mean square method. Hence, the uncertainty of T could be approximately expressed as follows:
δ T t o t a l T = δ U U 2 + δ I I 2 + δ T t h e r m o c o u p l e T 2 + δ T s y s T 2
where Tthermocouple is the temperature of the thermocouple and Tsys is the temperature of the data acquisition instrument. Taking into account the uncertainties associated with the measurement equipment as well as random errors resulting from multiple tests, the uncertainty of the temperature ( δ T t o t a l T ) was around 2.65% at the ambient temperature of 25 °C. Some minor fluctuation ~0.05 °C due to the wireless receiver of the Hioki data acquisition apparatus was also found, which is also included in the uncertainty analysis.

2.6. Validation

The changes in battery temperature of the battery modules under different charging and discharging rates, coolant flow speeds, and coolant temperatures were first investigated experimentally. Then, the battery modules were subjected to thermal runaway tests to examine the suppression effect of thermal runaway on adjacent cell temperatures. The battery was discharged to the cut-off voltage with constant current and charged to the cut-off voltage with the constant current–constant voltage technique. The 1C discharge of the battery module was tested and compared with the simulation model in Figure 4 for battery #1 in the battery module. As shown in Figure 4, the error of the numerical simulation and experimental test is very small. With this validation, the numerical simulation model can be used to optimize the arrangement of the busbar connection in the battery module.

3. Results and Discussion

3.1. Thermal Management of the Battery Module: Effect of Different Charge/Discharge Rates

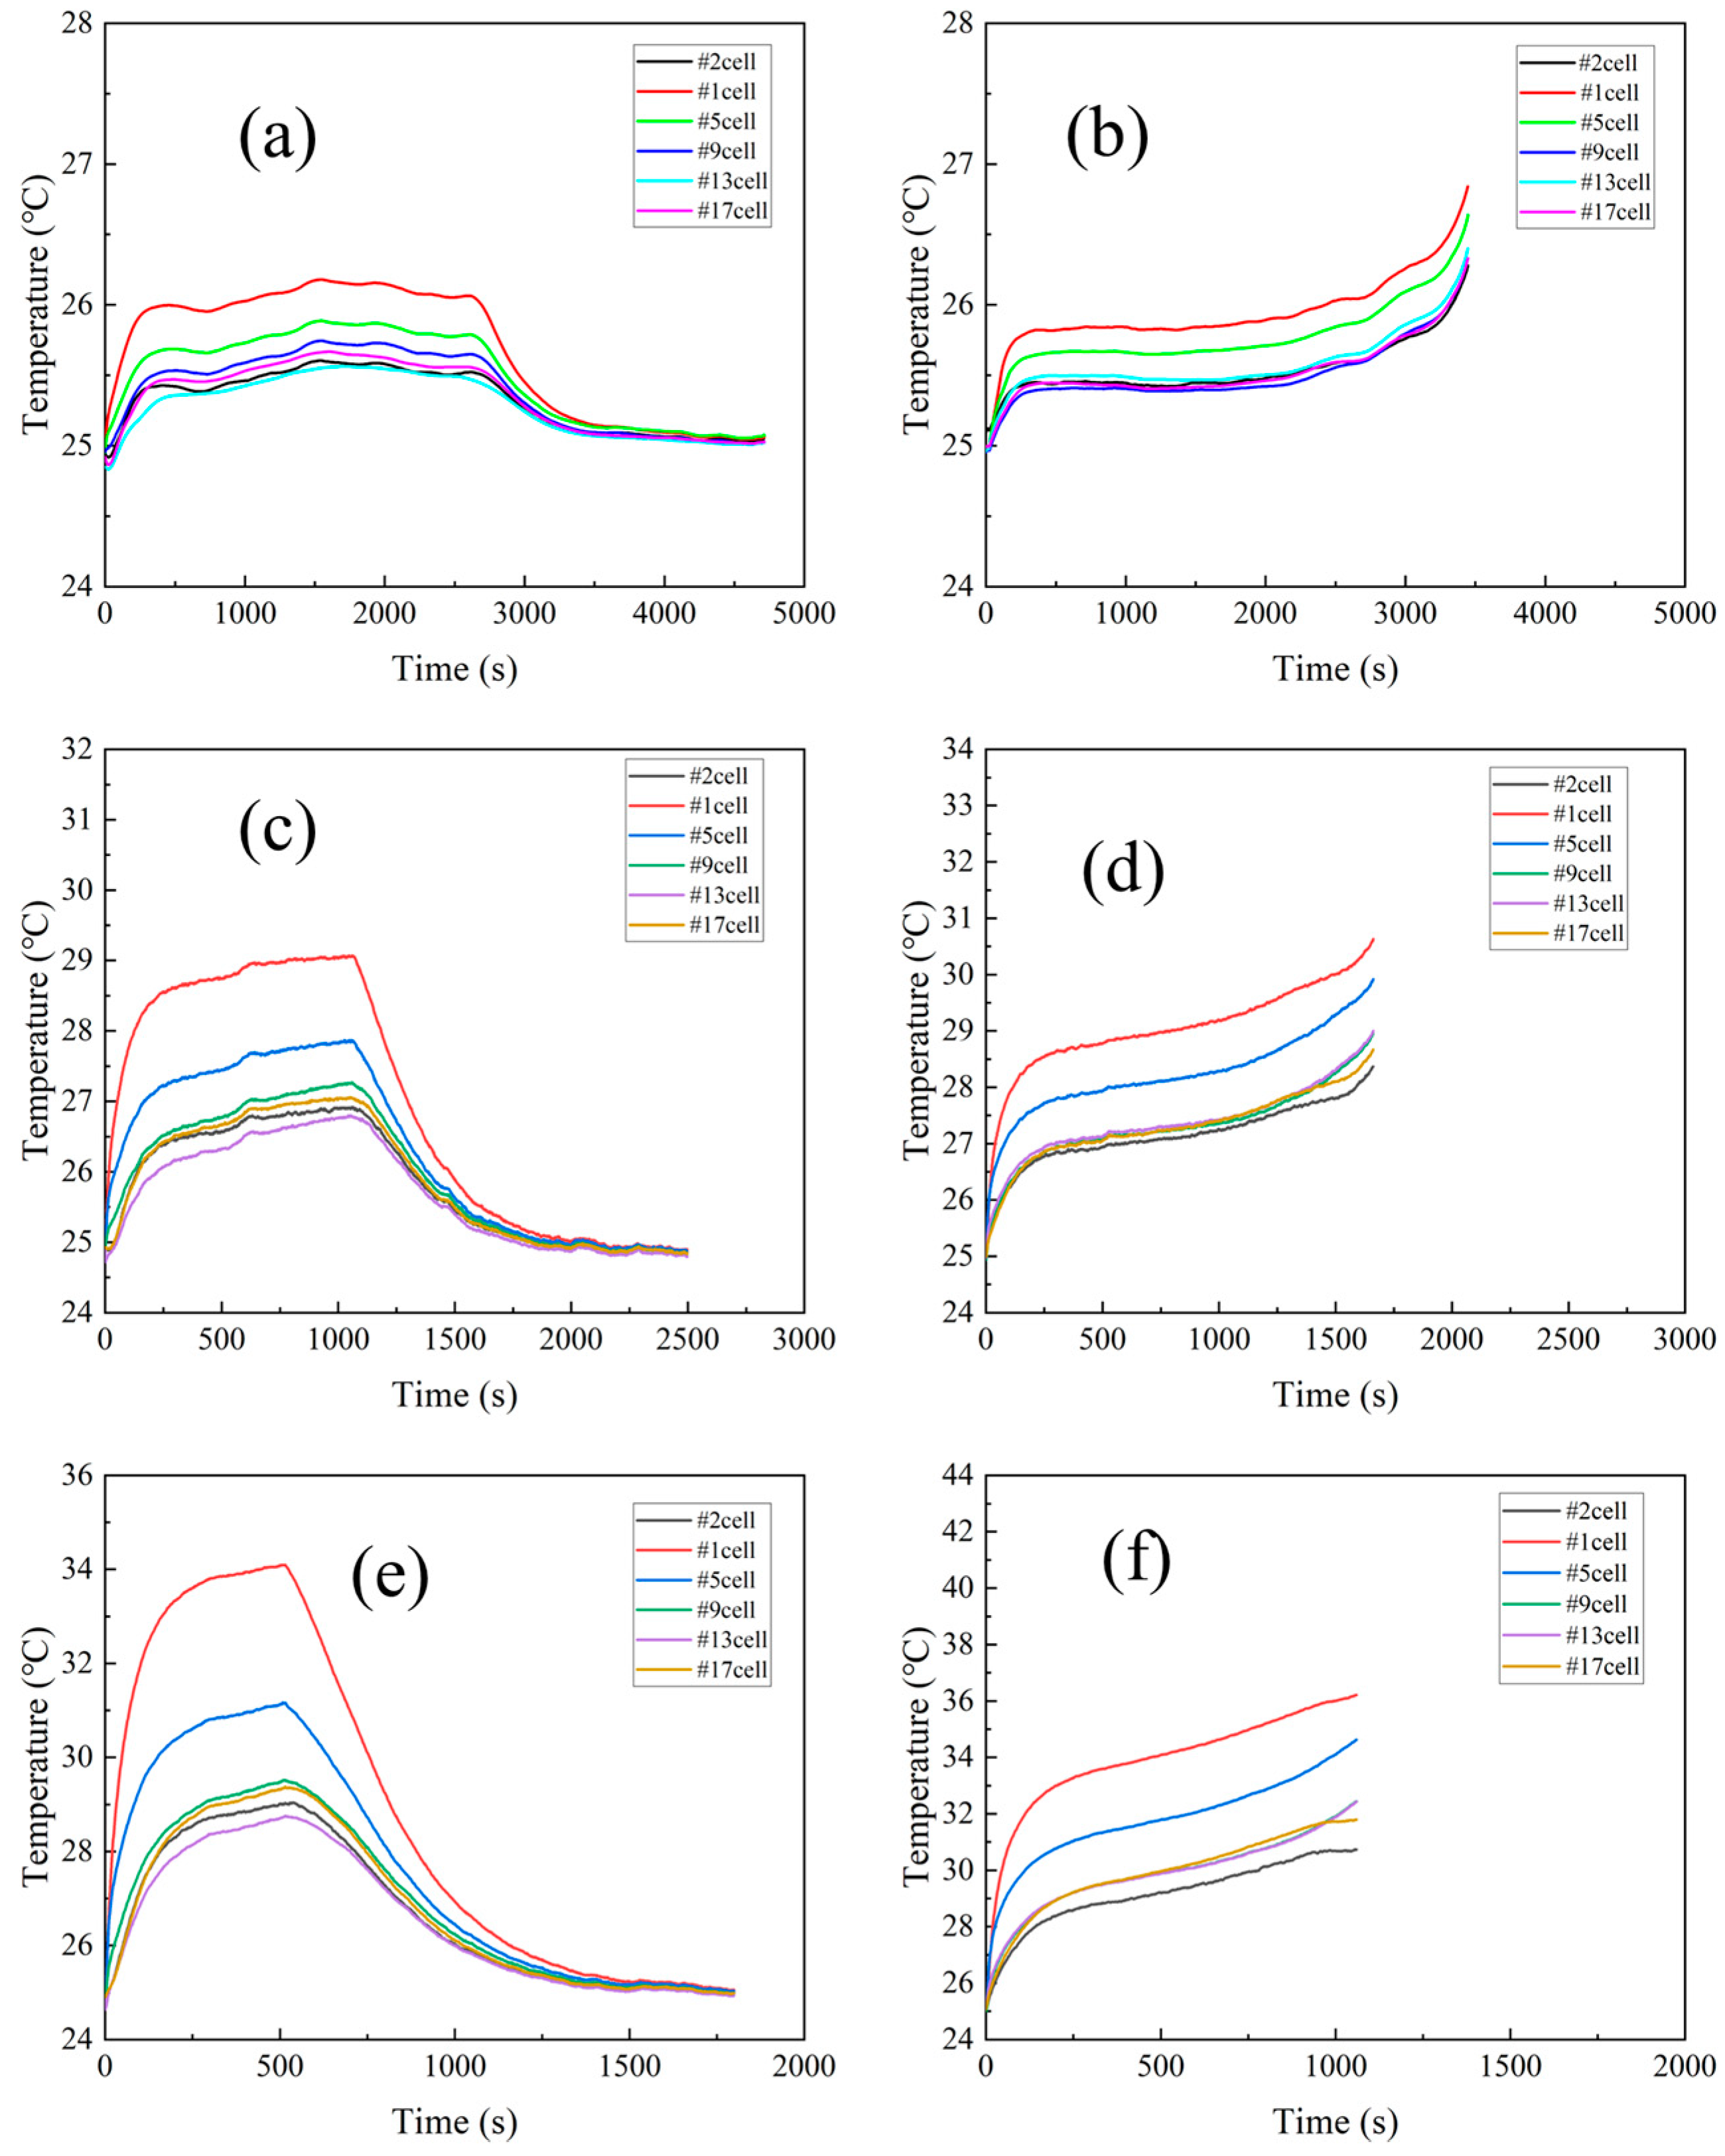
The temperature of the battery module at different charge/discharge rates was experimentally investigated, and the results for battery module temperature at different rates are shown in Figure 5. The results show that the temperature of the battery rose quickly at the beginning of constant current charging and slows down in the middle of the battery charging. Subsequently, it reached the cut-off voltage and turned to constant voltage charging, the current gradually decreased, and the battery heat generation rate decreased, resulting in a rapid decrease in battery temperature until reaching the cut-off current. On the other hand, the temperature of the battery under constant current discharge conditions rose steadily until it was discharged to the cut-off voltage. The confluence busbar connected in series between cell #1 and cell #2 causes the highest temperature of cell #1 due to the heat generation effect of the nickel busbar sink. The maximum temperatures of the battery module were 26.85 °C at 1C, 30.42 °C at 2C, and 36.21 °C at 3C discharge rates, which is well below the threshold temperature of 40 °C. Considering the heat dissipation and temperature uniformity properties of the novel liquid-cooled shell structure, it can be concluded that it has good performance during battery charging and discharging.

3.2. Thermal Management of Battery Module: Effect of Different Coolant Flow Speeds

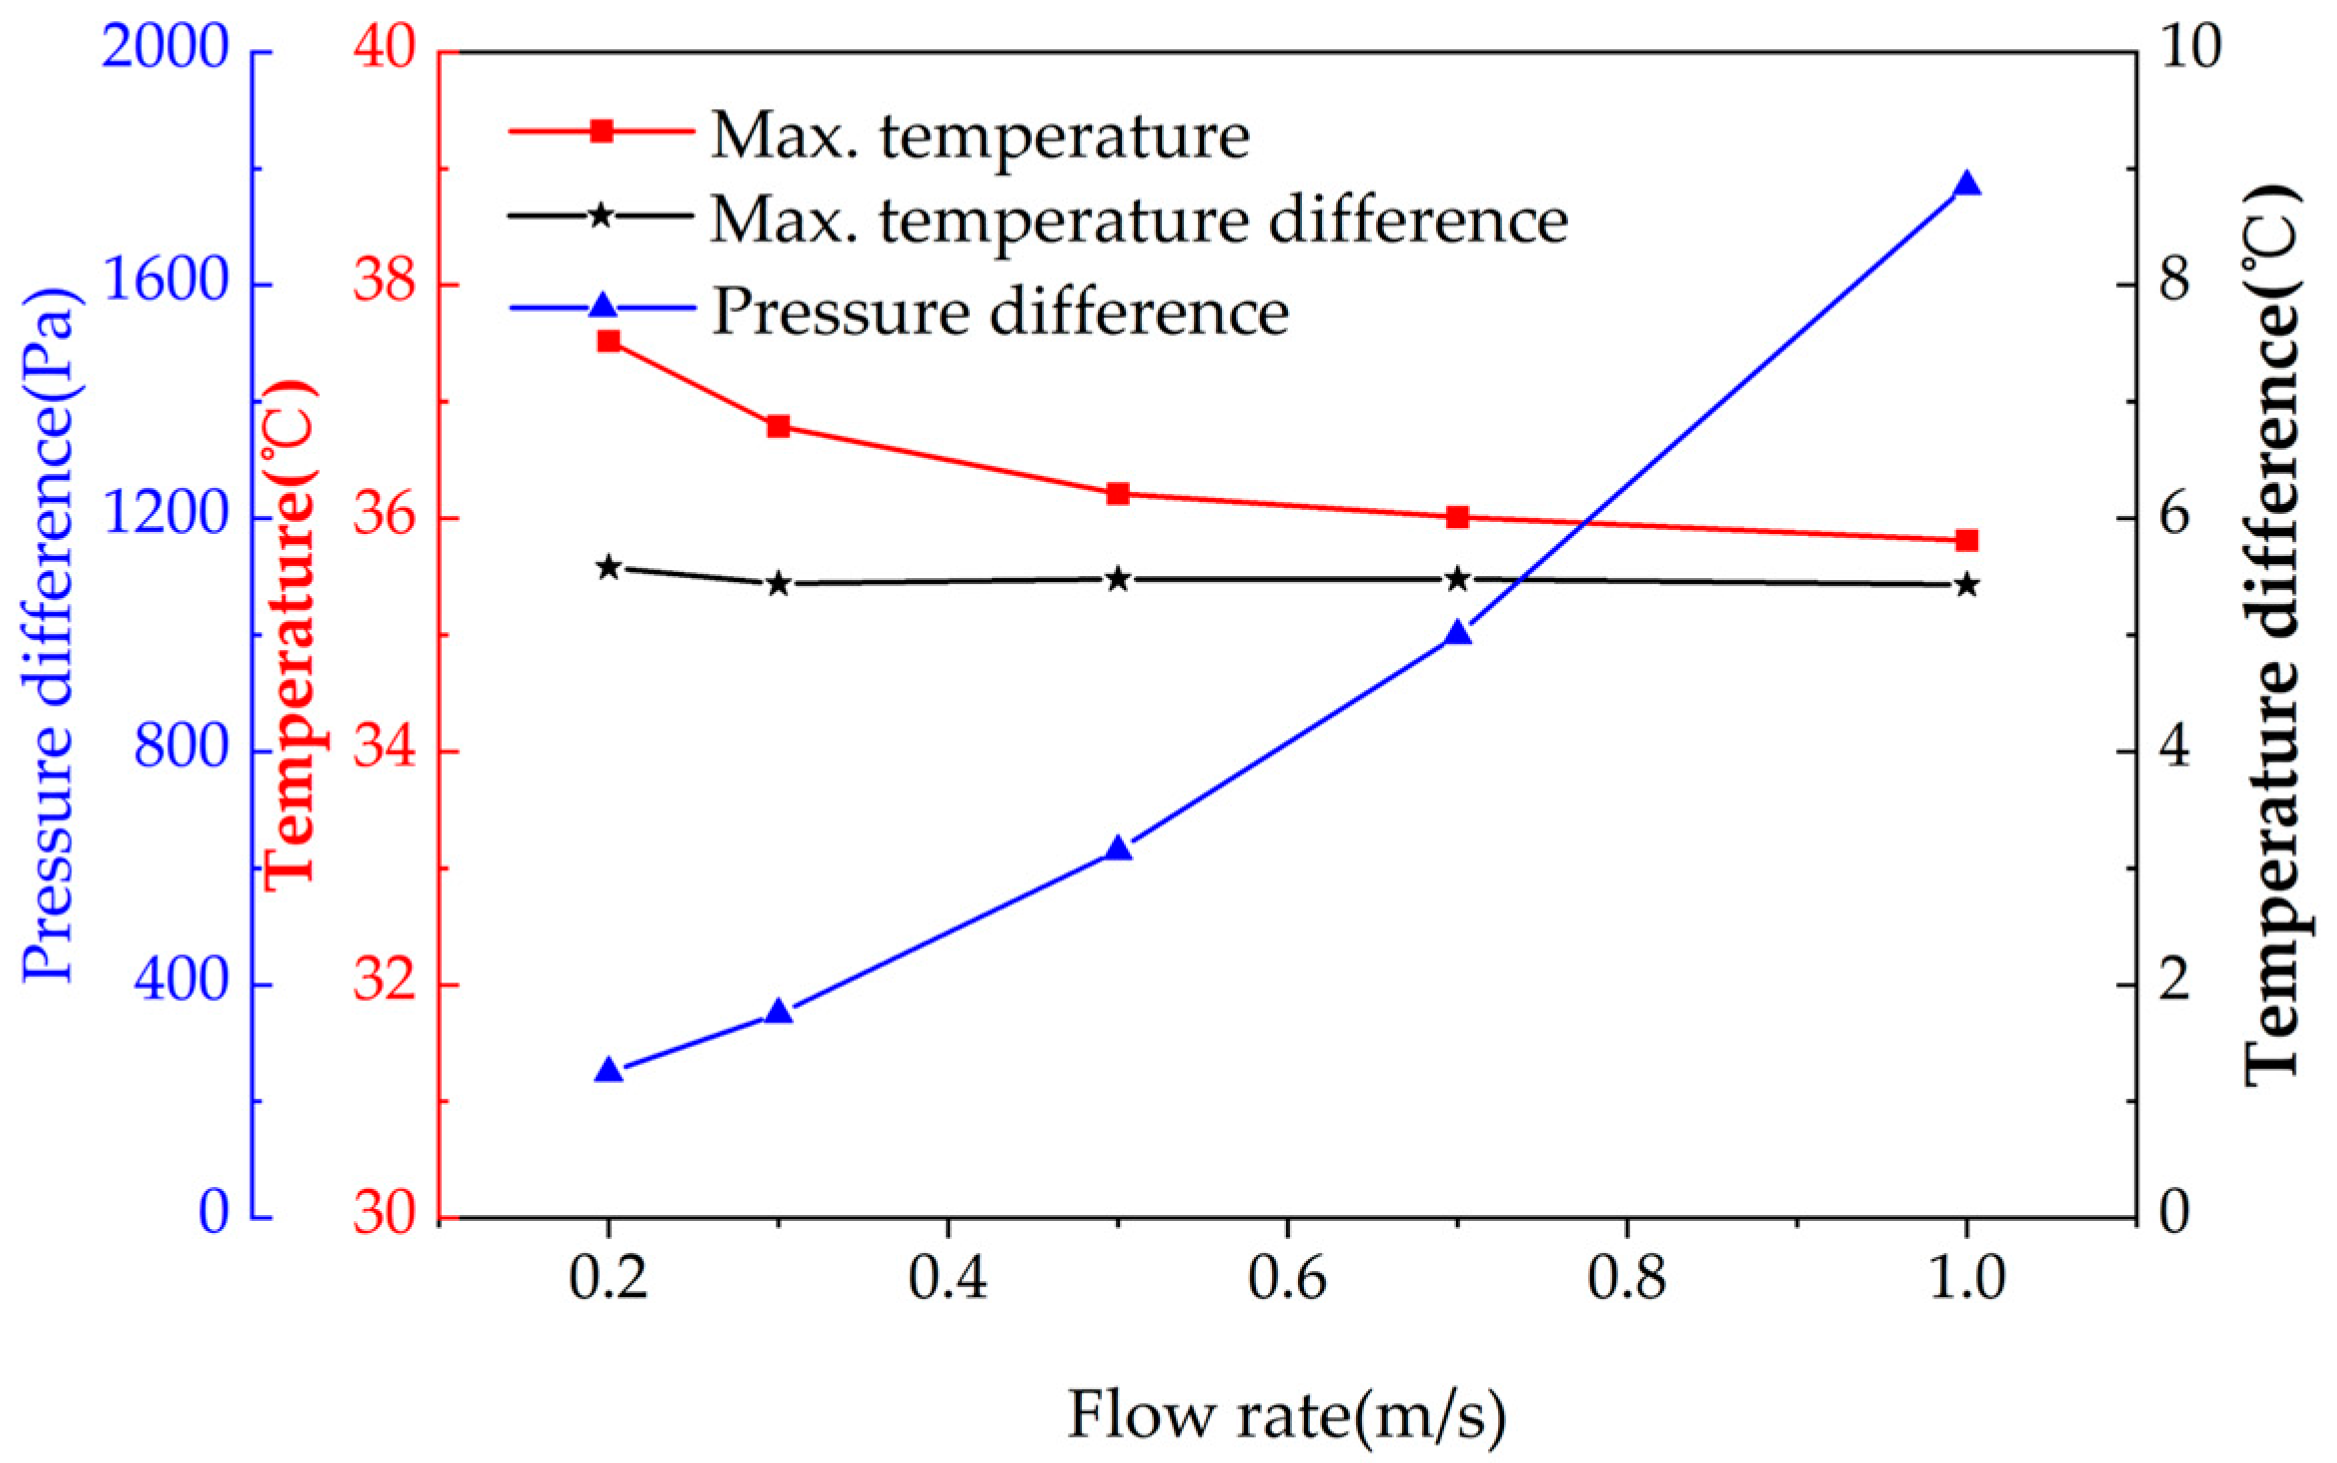
The change in battery module temperature with discharge time at different flow rates is shown in Figure 6. The variation in the battery module temperature, the temperature difference, and the inlet/outlet pressure drop with coolant flow speed are shown in Figure 7. The battery module was discharged at a rate of 3 C during the experiment. The flow speeds were tested in the sequence of 20 L/h (0.2 m/s), 30 L/h (0.3 m/s), 50 L/h (0.5 m/s), 70 L/h (0.7 m/s), and 100 L/h (1.0 m/s). As can be seen from Figure 6, the trend in the battery temperature change was the same for different flow speeds at the 3C discharge rate. As the flow speed increases, the maximum temperature of the battery module gradually decreases.
Nonetheless, the temperature difference does not change significantly, whereas the pressure drop keeps increasing at a quadratic rate. Therefore, the use of a high flow speed is not cost-effective for the novel heat dissipation structure. Instead, a small flow speed of around 0.3~0.5 m/s is sufficient to meet the temperature requirements of the battery module under normal operating conditions.
The present work was compared with recently published work on liquid cooling in Table 3 [32,33,34,35,36]. The 18650 cylindrical battery modules are mostly liquid-cooled for side cooling, and configured with parallel or series flow channels. Lv et al. [32] applied the composite cooling structure of liquid cooling and PCM to a battery module. For instance, during the fast charging process of 3C, the maximum temperature of the battery module was as low as 42.0 °C, and the corresponding temperature difference was controlled to below 5 °C. Compared with serial cooling, Cao et al. [34] experimented with a typical module of a battery pack (consisting of 180 cells), charging and discharging at different C rates at specified flow rates. Wang [35] and Gao [36] showed that parallel flow channels have better heat dissipation capabilities and lower battery module temperatures. The maximum temperature of the battery module was 35.81 °C and the maximum temperature difference was 5.43 °C in the present work, which basically meets the thermal management requirements of the battery module. Most studies used high discharge rates at room temperature 25 °C, and few have been performed at high or low temperatures. The liquid-cooled shell maintains the battery module in the optimal operating temperature range. In addition, when thermal runaway occurs in the battery, a large amount of heat is released in a short period of time, and if the battery module thermal management system does not dissipate the heat in time, it will cause the battery to spread thermal runaway. When battery thermal runaway occurs, the battery module thermal management system can appropriately dissipate heat and suppress the spread of thermal runaway of the battery module.

3.3. Thermal Management of Battery Module: Effect of Different Coolant Temperatures

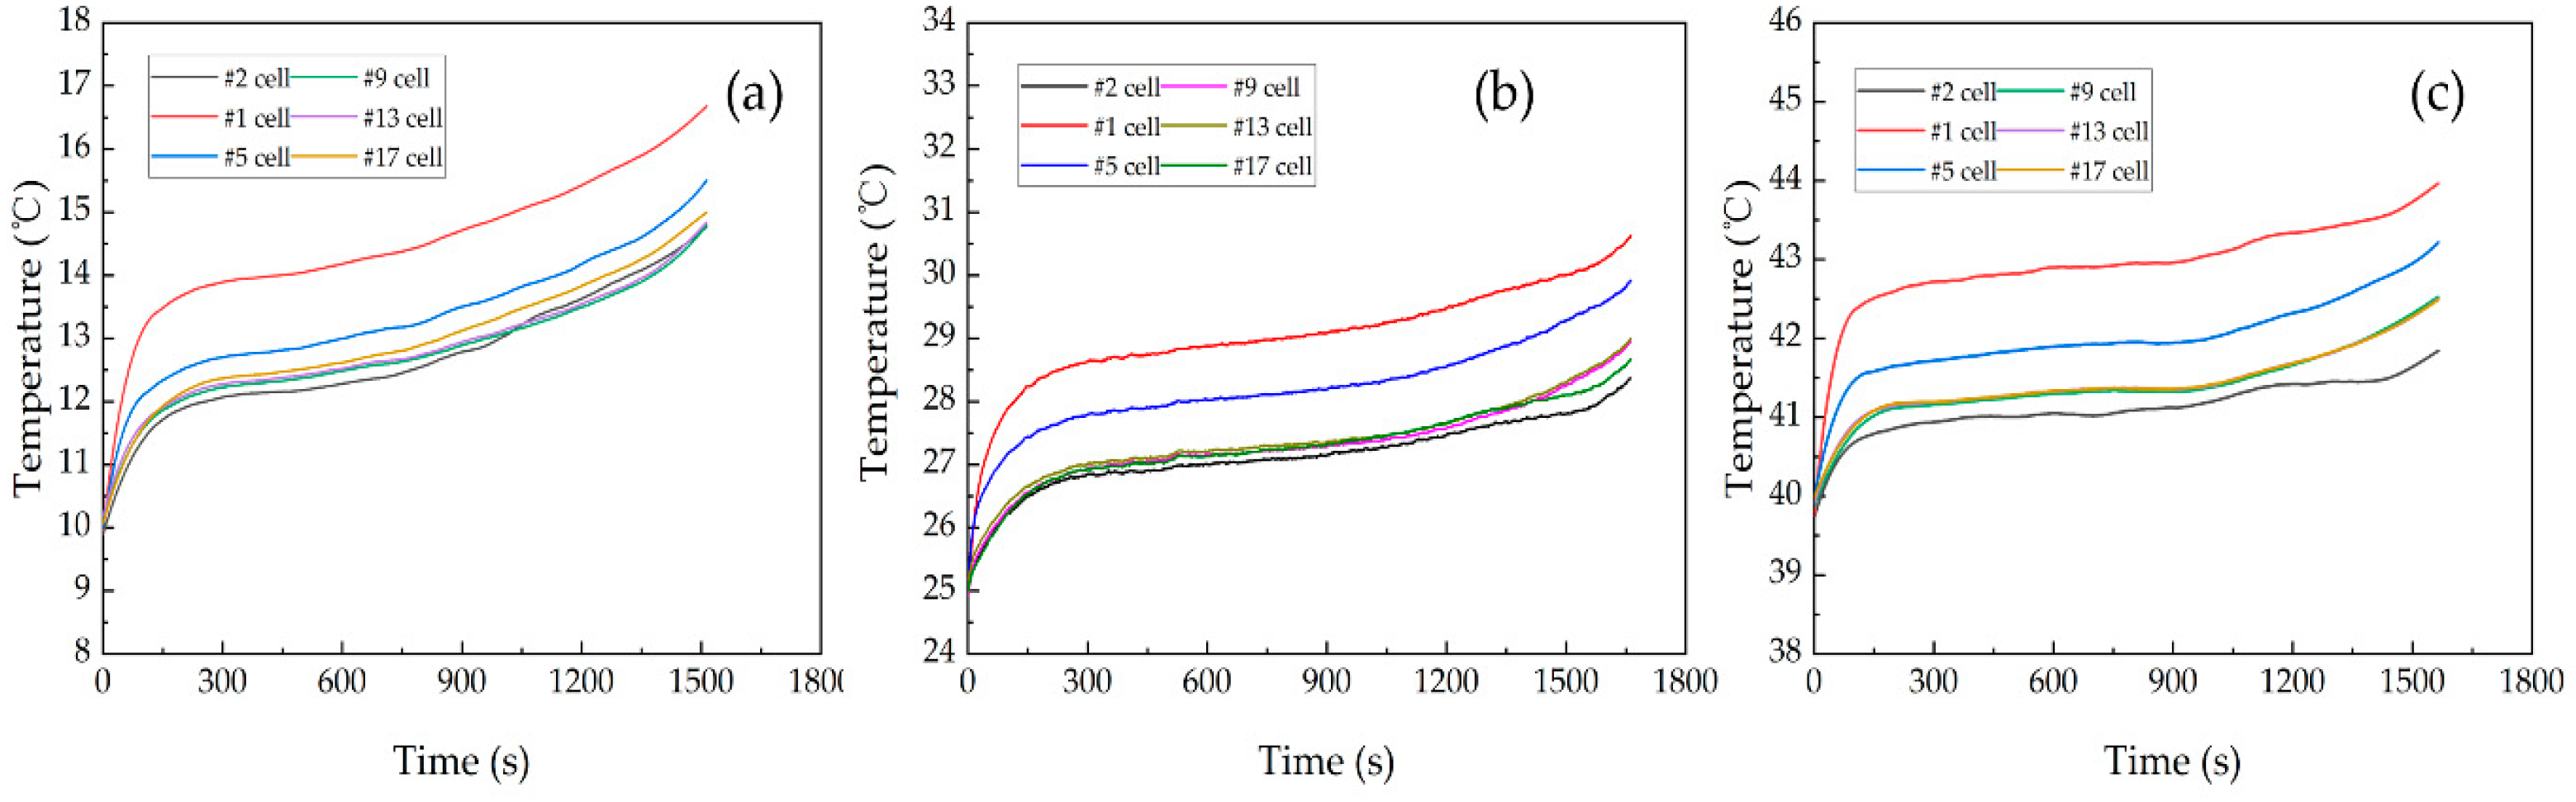
The coolant temperature has a significant impact on the amount of heat generated by lithium-ion batteries and the efficiency of their discharge. The experiments were conducted with a battery module discharge rate of 2C, a coolant flow speed of 0.5 m/s, and coolant temperatures of 10 °C, 25 °C, and 40 °C. After adjusting the coolant temperature and running for a period of time, for example, 10 min, the battery module temperature gradually converged to the same coolant temperature, and then the battery module started to discharge. Figure 8 shows the temperature change curve of the battery module under 2C discharge at different coolant temperatures. The highest temperatures in cell #1 were 16.68 °C, 30.63 °C, and 43.96 °C, for the inlet coolant temperature of 10 °C, 25 °C, and 40 °C, respectively. Obviously, as the coolant temperature increased, the battery module temperature rose at a slower rate. A low temperature will lead to an increased viscosity of the electrolyte, a decreased electrochemical reaction rate, an increased internal resistance of battery, an increased heat generation rate of battery, and a decreased discharge efficiency. This is due to the smaller internal resistance of the battery at higher coolant temperatures, resulting in a lower ohmic heat of the battery and thus a lower temperature rise. As the battery module temperature rose, the battery module discharge time and discharge efficiency gradually increased, and the discharge efficiencies of the battery module at 10 °C, 25 °C, and 40 °C were 88.5%, 95%, and 96%, respectively. This indicates that the optimal operating temperature range of the battery is between 25 °C and 40 °C. When the temperature of battery is higher, the active materials inside the battery are more active, which improves the battery electrochemical reaction rate and energy conversion efficiency. However, a temperature higher than 40 °C would lead to electrochemical side reactions, resulting in a fast capacity fade, which is also not favorable in practice.

3.4. Thermal Imaging of Battery Module Nickel Busbar under High Temperature

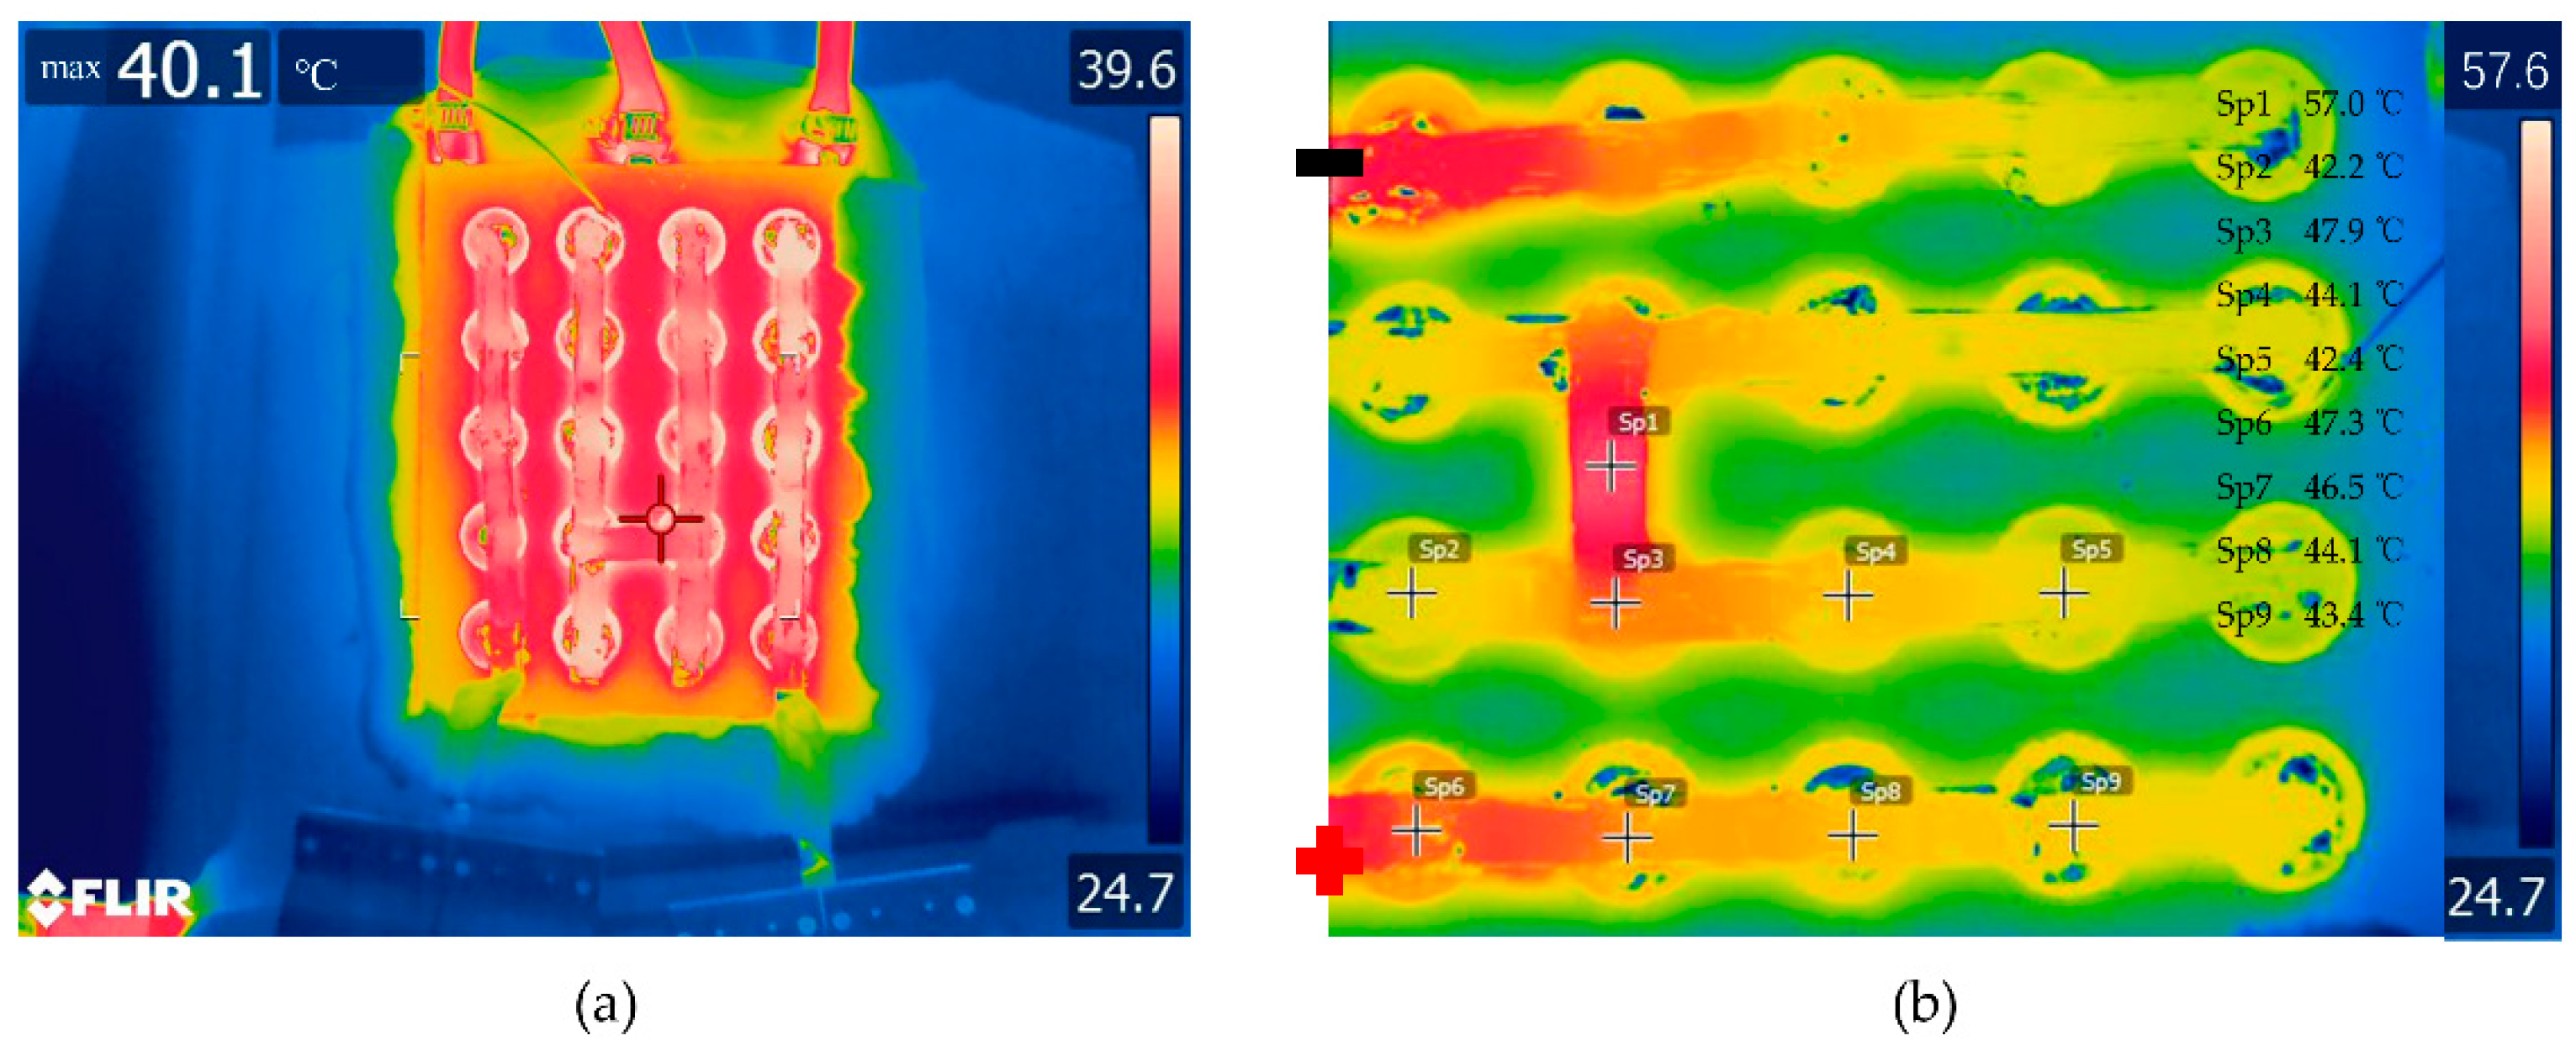
As the battery module is charged and discharged, not only does the battery itself generate a great deal of heat, but so does the nickel busbar as well. Due to the nickel sheet with its own internal resistance and high current output, a large ohmic heat is generated, resulting in high temperatures of the battery. The batteries were arranged in four rows, and five batteries in each row were connected in parallel by a nickel busbar to form the 5P4S connection. The nickel busbar was soldered to the positive and negative surfaces of the battery. In order to study the heating of the nickel busbar connecting the batteries in the battery module, a thermal infrared camera (FLIR TC650s) was used to record the temperature images of the discharge at different times under high ambient temperature conditions. Due to its reflective nature, the nickel busbar was painted with a thin layer of thermal grease, which exhibited an emissivity of around 0.95. The thermal images taken at a discharge rate of 2C at different time points are shown in Figure 9. Due to the connection of the positive and negative terminals of the battery module with the battery test system with a current up to 25A (2C), the nickel busbars generated more heat, resulting in a higher temperature of the nickel busbar compared to the battery. The temperature of the series-connected nickel busbars of the battery module were 57.0 °C at Spot #1, denoted by Sp1, as shown in Figure 8b, while the temperature of the battery module was around 43 °C in Figure 8c. The temperatures of the series-connected nickel busbars of the battery module were much higher than those of the parallel-connected nickel busbars. The temperatures of the parallel-connected nickel busbars of the battery module were 47.3 °C at point Sp6 in the lower left corner of Figure 8b, 46.5 °C at point Sp7, 44.1 °C at point Sp8, and 43.4 °C at point Sp9. The nickel busbar temperature decreased sequentially along the parallel nickel busbars at the positive end port.

3.5. Suppression of Thermal Runaway Propagation of Batteries at Different Locations

It has been demonstrated that the present liquid-cooled shell is capable of meeting the demands of battery module thermal management and maintaining battery module charging and discharging within acceptable temperatures. In the case of abnormal battery heating, the thermal suppression requirement is exerted on the same thermal management system to minimize the thermal runaway propagation across batteries. In this section, test batteries with heaters were used to simulate thermal runaway in the battery modules and real 18650 batteries were used for the remaining batteries. When a sudden thermal runaway or abnormally high heat production occurs in the middle or corner of the battery module, the adjacent batteries could be thermally shielded from the thermal runaway battery with the present configuration. Two locations of the thermal runaway batteries were experimentally investigated. In Case 1, the runaway was set near the middle of the battery module (#14) and in Case 2, the runaway was set in the corner (#20). Regardless of the location of thermal runaway, the thermal spread should be suppressed. For localized overheating phenomena, the cooling performance can be improved by increasing the flow speed. The effect of coolant flow speeds on suppressing the thermal propagation of batteries was investigated.

3.5.1. Case 1: Thermal Runaway near the Middle (Cell #14)

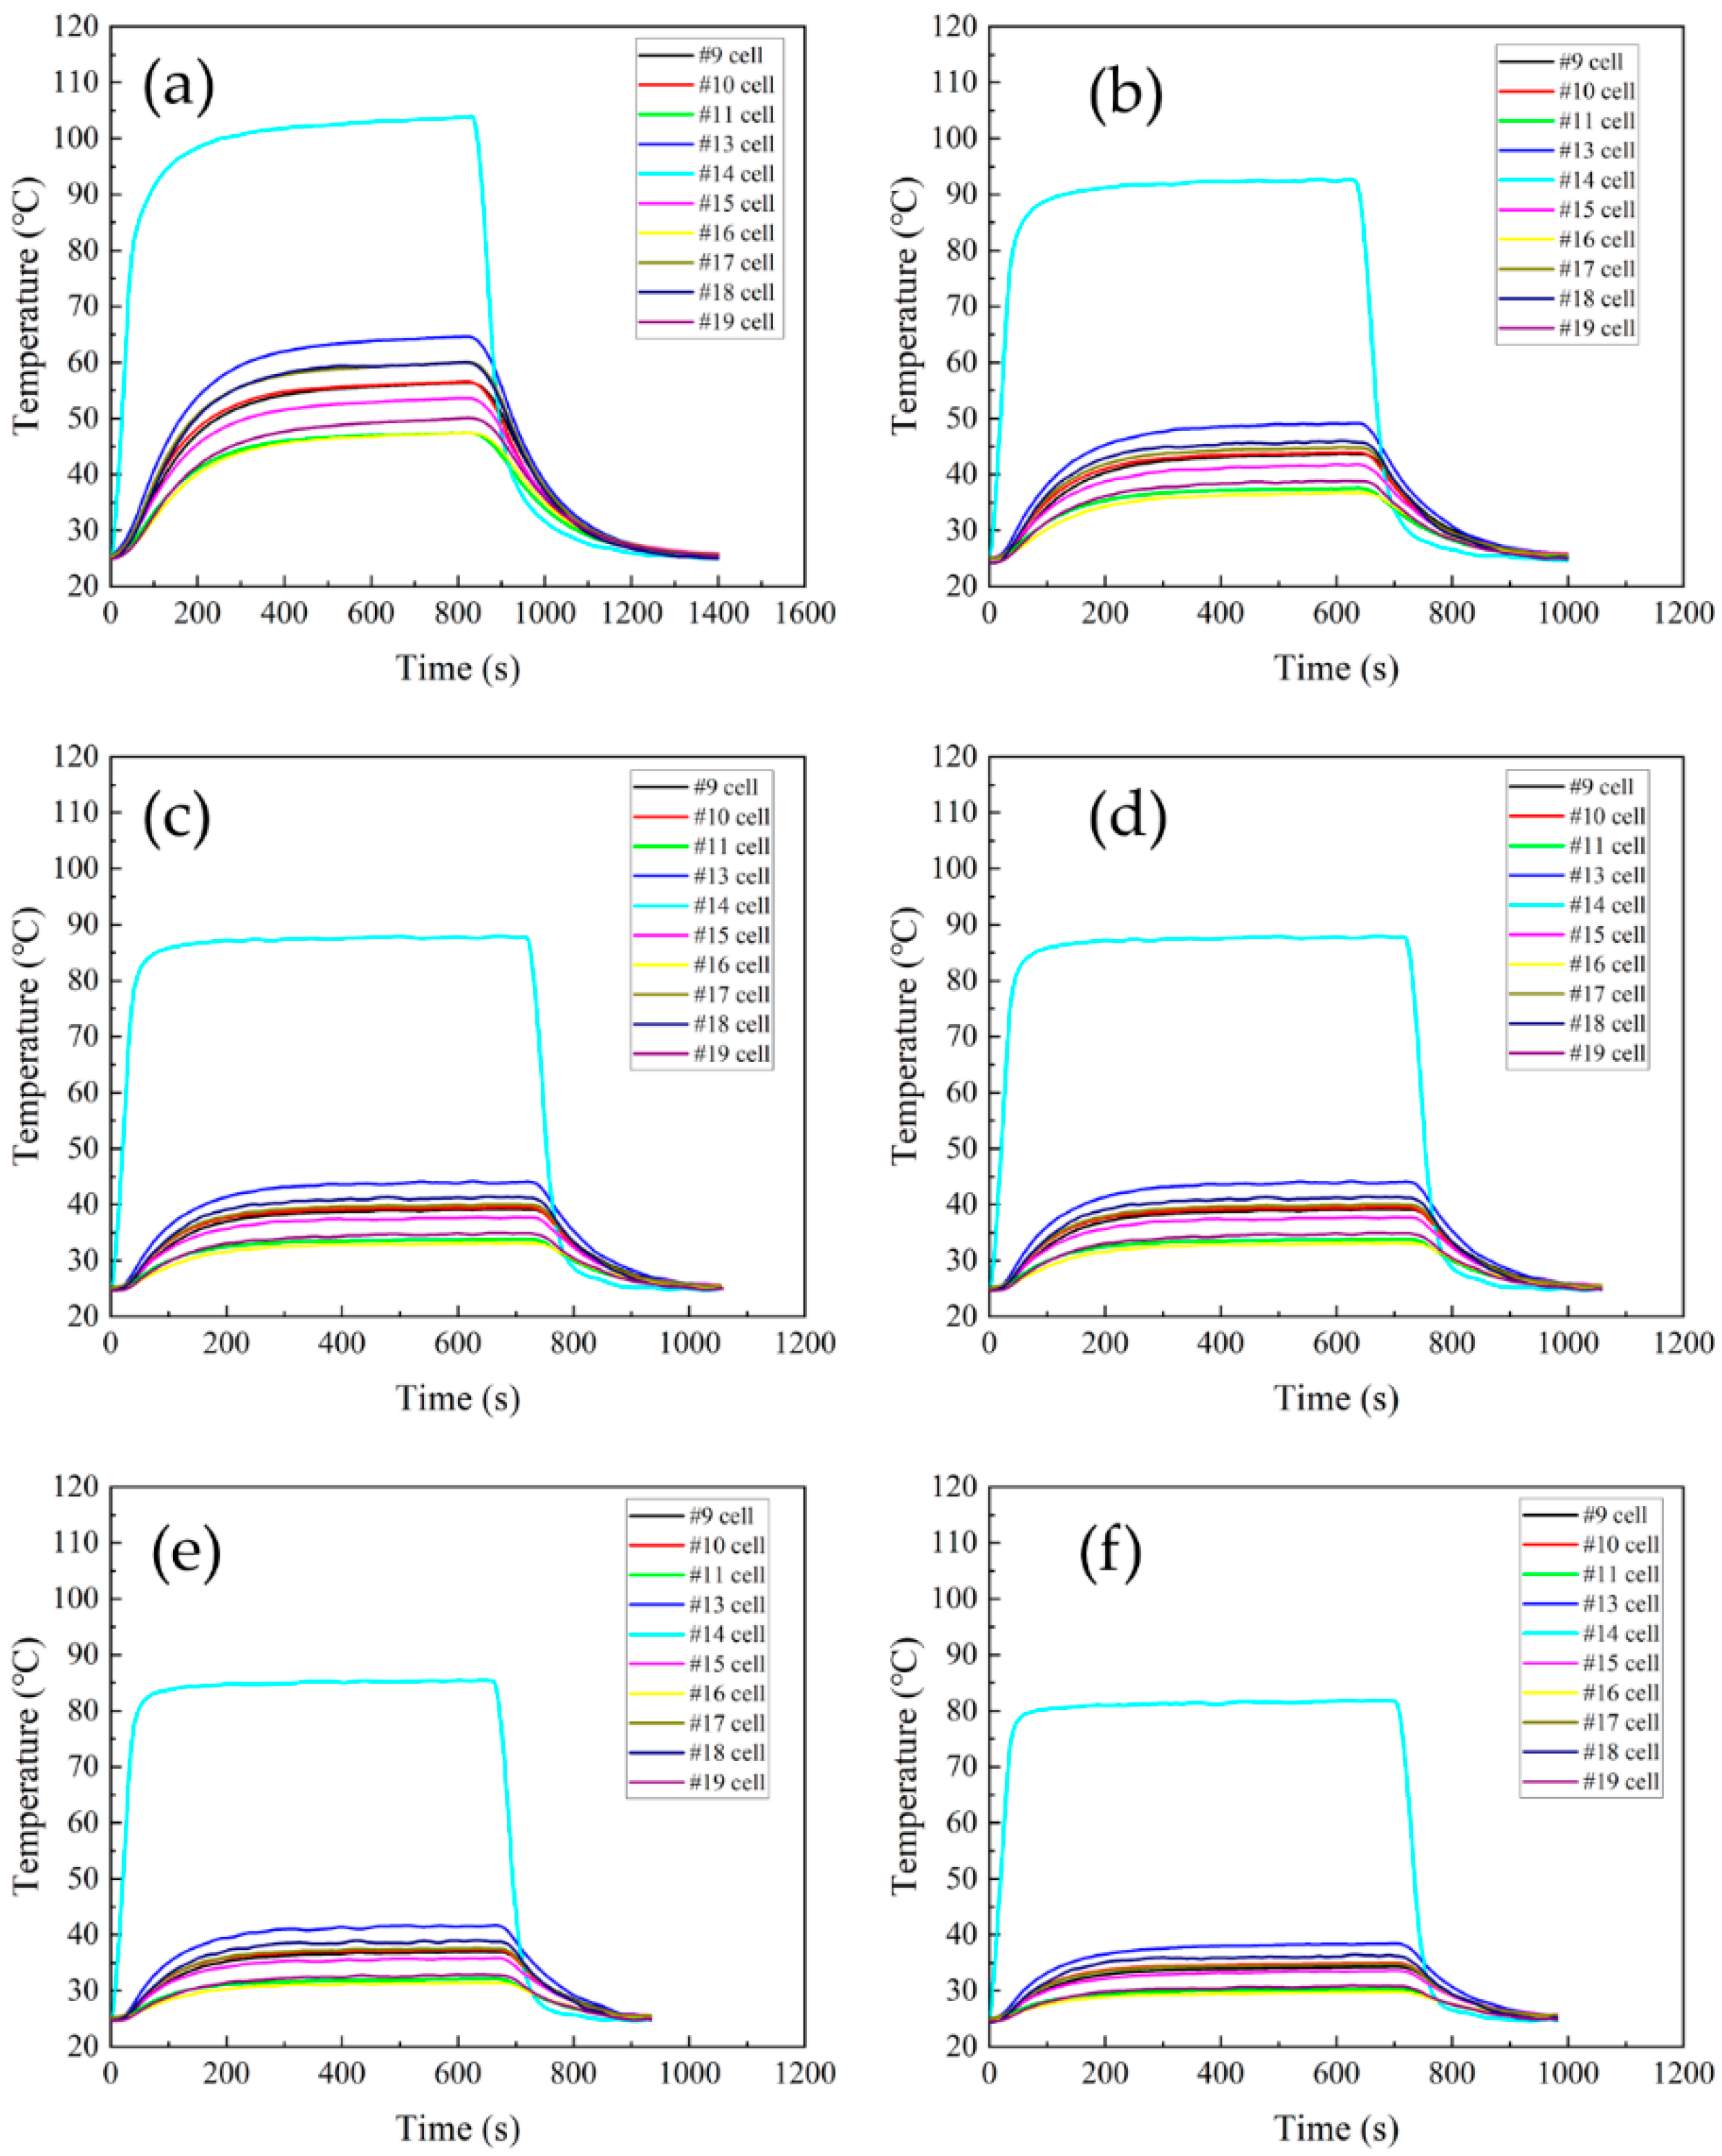
The temperatures of test cell #14 and the adjacent cells at different flow speeds are shown in Figure 10. The heating power of test cell #14 was 600 W. The experimental test was first started by turning on the liquid cooling circulation equipment to circulate the cooling liquid for a period of time until the batteries reached the ambient temperature of 25 °C. Then, the heater was switched on, which heated up itself and then spread heat to the adjacent batteries. After the battery module reached a steady state (10~15 min), the battery temperatures were recorded and then the heater was turned off to let the battery module cool down to the ambient temperature.
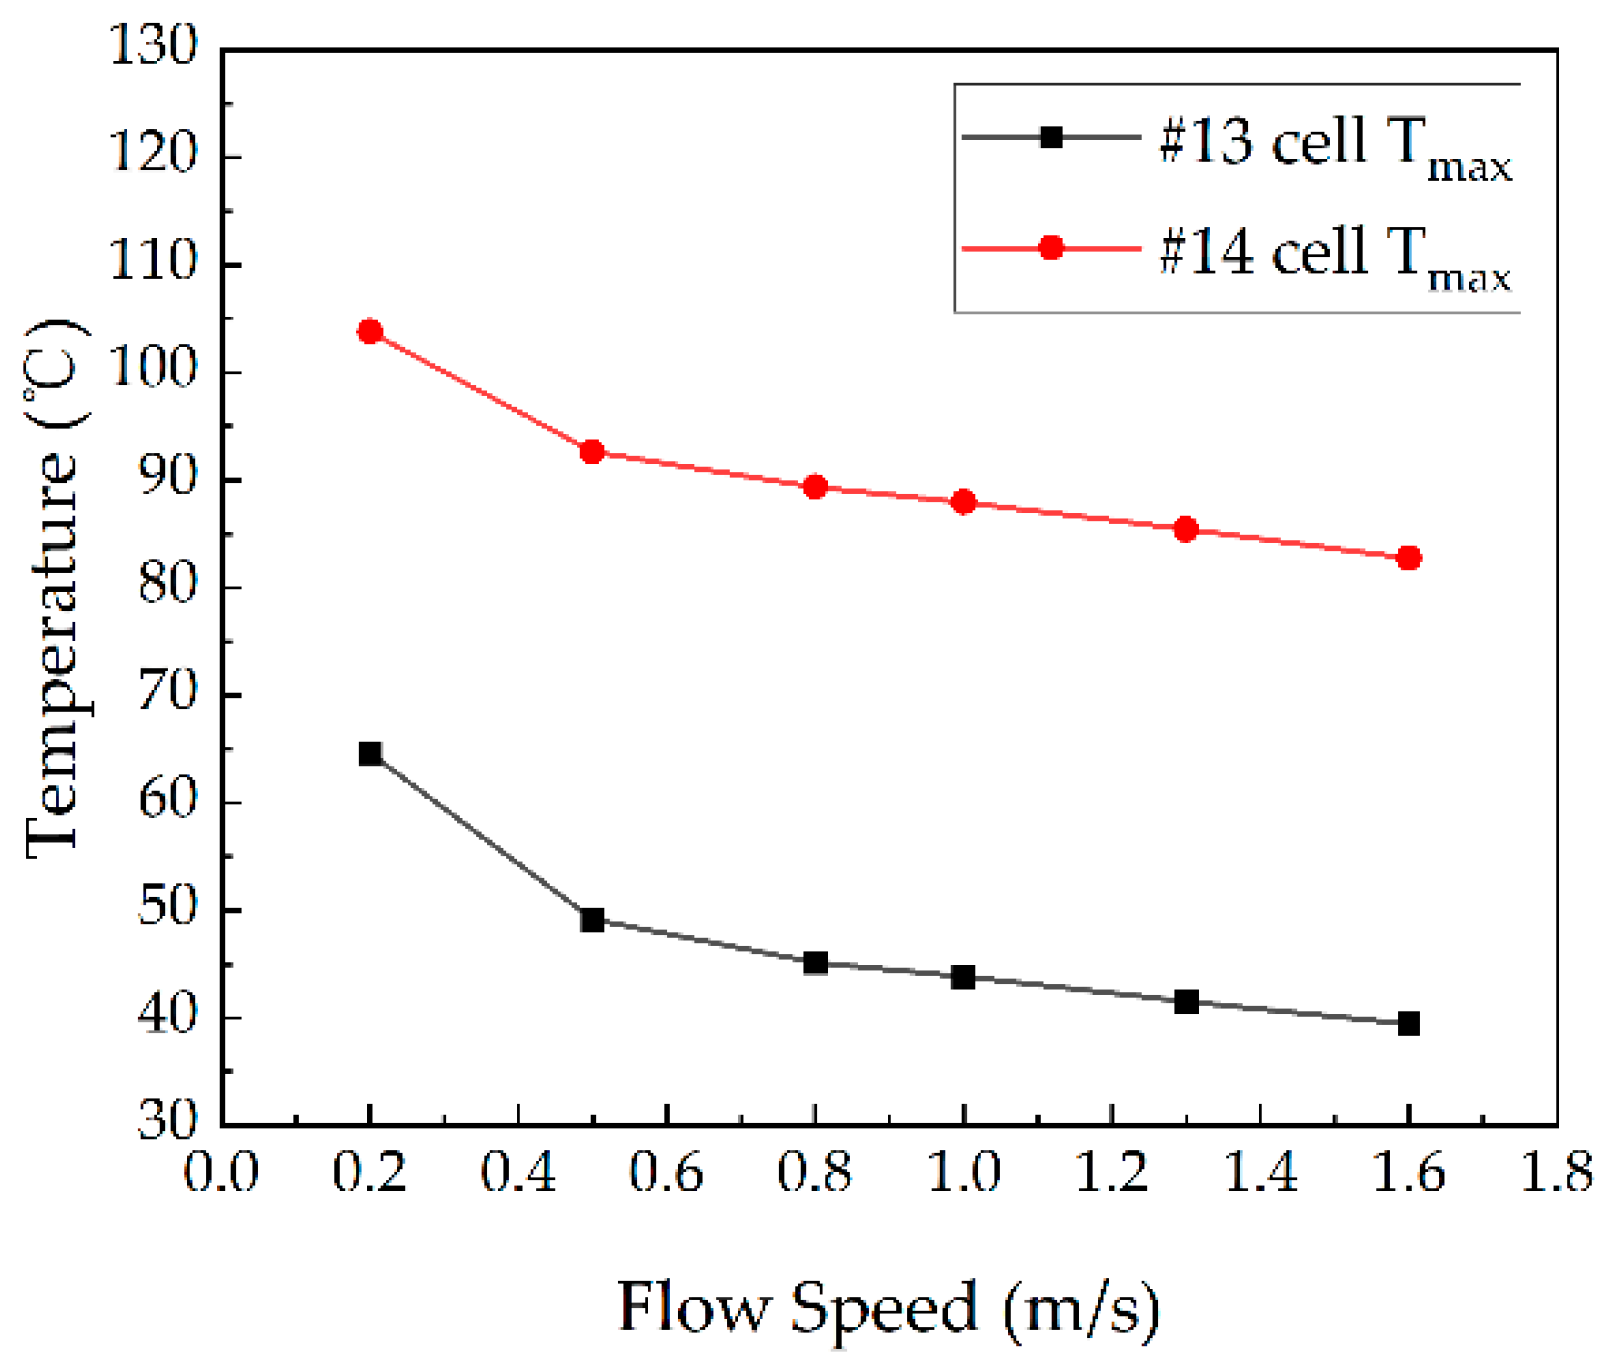
The maximum temperatures of the battery module at different flow speeds are shown in Figure 11. As the coolant flow speed increased, the temperature of the test battery and the adjacent battery decreased significantly. At a maximum flow speed of 1.6 m/s, the temperature of the battery module and the test battery are shown in Figure 9, with the maximum temperatures of 82.75 °C for test cell #14 and 39.46 °C for cell #13. Even at the minimum flow speed of 0.2 m/s, the temperature of the adjacent battery (#13) was 64.62 °C, which was below the self-heating temperature of around 80 °C. Thus, it seems that the thermal runaway battery located in the middle of the module does not induce thermal runaway propagation under the present liquid shell cooling configuration.

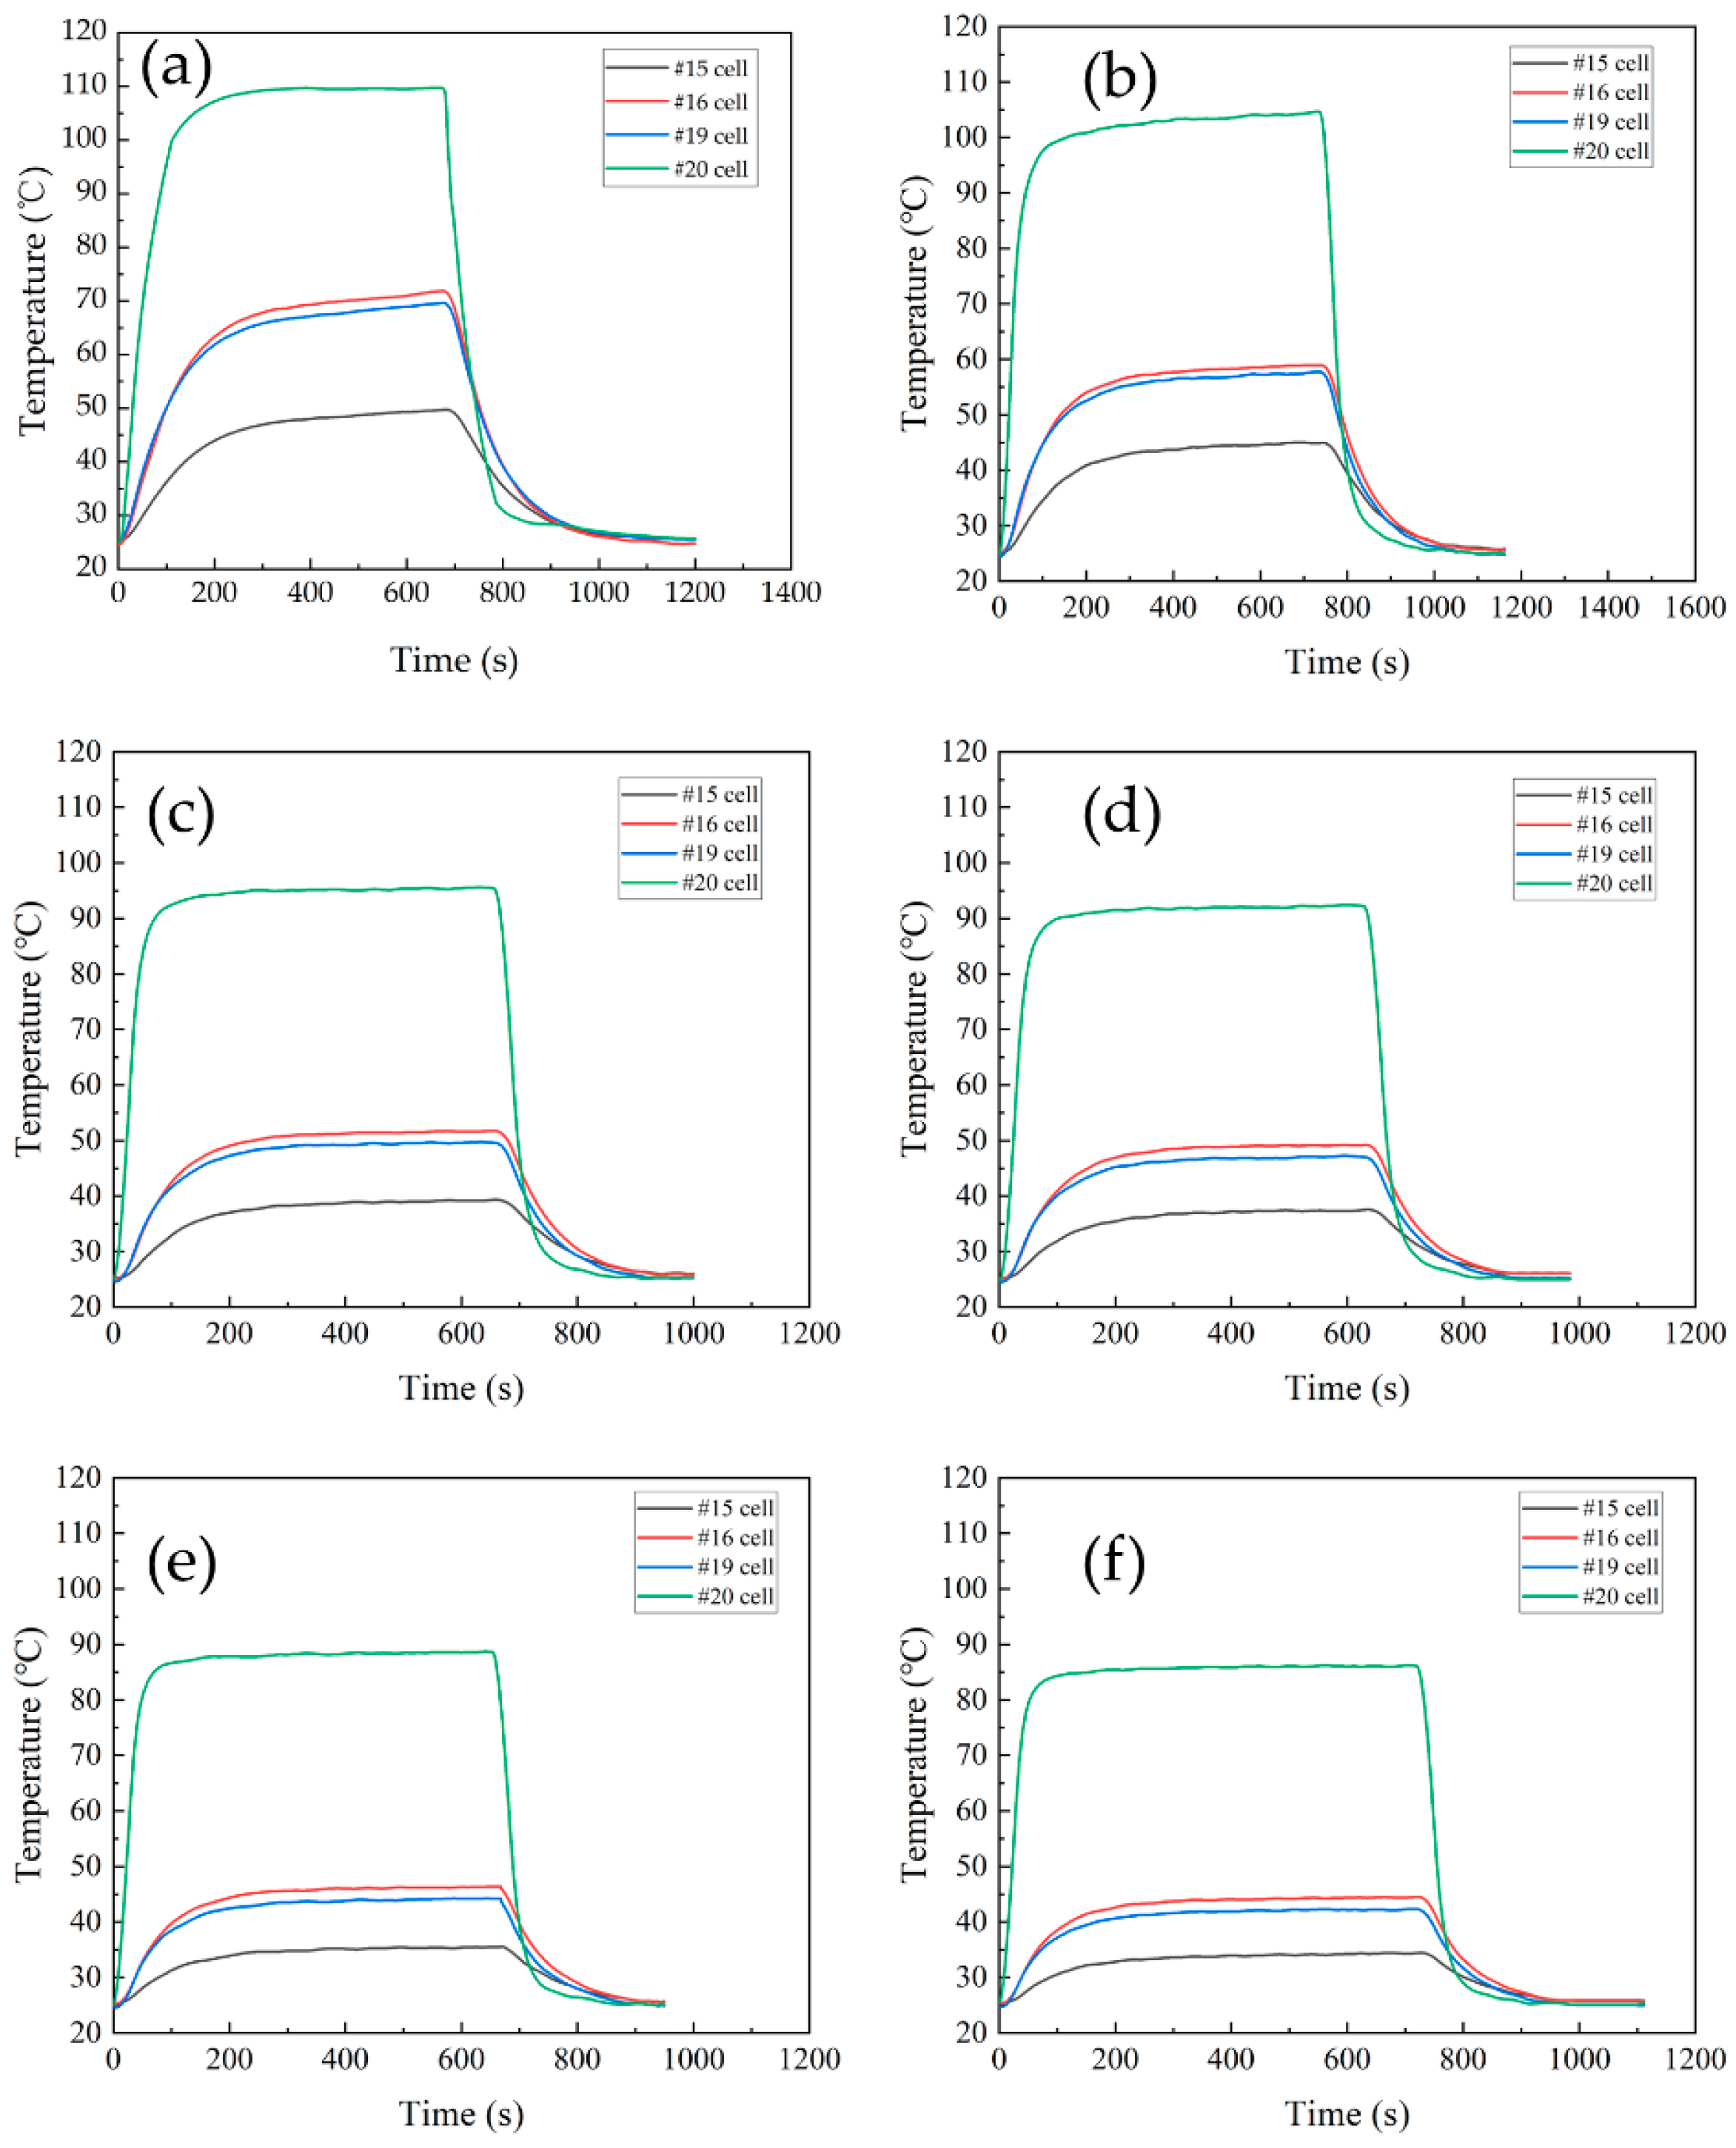
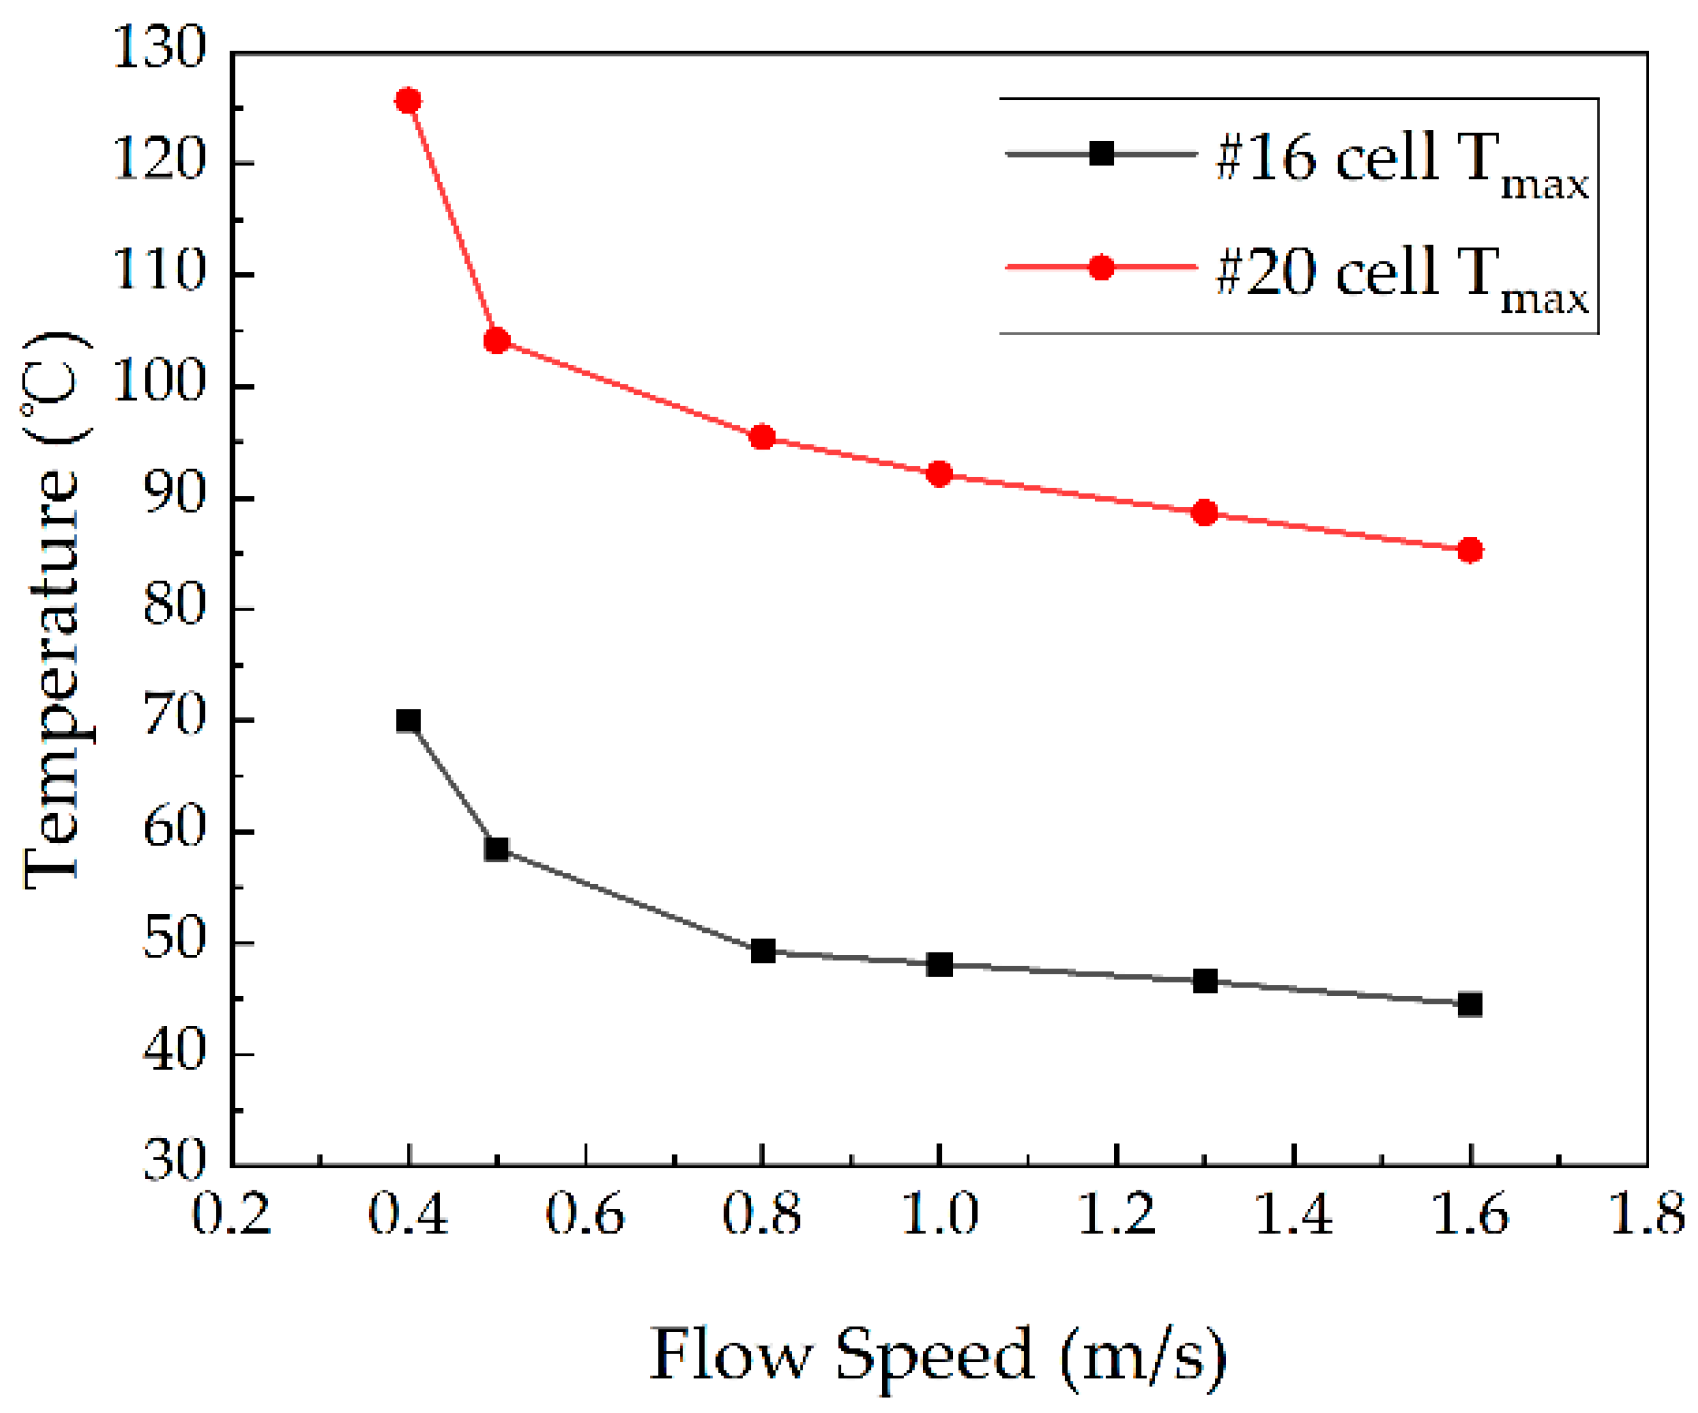
3.5.2. Case 2: Thermal Runaway in the Corner (Cell #20)

In the thermal runaway test, the heating power of test battery #20 was 600 W, whereas the coolant and ambient temperatures were stabilized at 25 °C. In the case of the liquid cooling cycle, the #20 cell located in the corner was abnormally heated and the temperature of the adjacent cell was monitored. The temperature of the thermal runaway cell (#20) located in the corner and the maximum temperature of the adjacent cells at different flow speeds are shown in Figure 12. When test cell #20 underwent thermal runaway, its own temperature rose rapidly, the heat spread, and the adjacent battery was heated up at the same time. Due to the liquid-cooled channels embedded in the shell, the adjacent battery temperature rise was much lower than that of test battery #20. In comparison, the temperature of the battery module and the test battery at the maximum flow speed of 1.6 m/s are shown in Figure 13, with the maximum temperature of 85.29 °C for test cell #20 and only 44.51 °C for the adjacent cell (#16). The temperature of test cell #20 was higher than the temperature of cell #16 when it was operating. In both cases, the maximum temperature of the adjacent battery was maintained below 70 °C, which is below the thermal safety temperature at the flow speed range under investigation. Solid electrolyte interface (SEI) is a meta-stable material on the surface of the negative electrode of the battery, which may start to decompose at temperature 70 °C~90 °C [37].

3.6. Optimization of Battery Module Busbar Connection

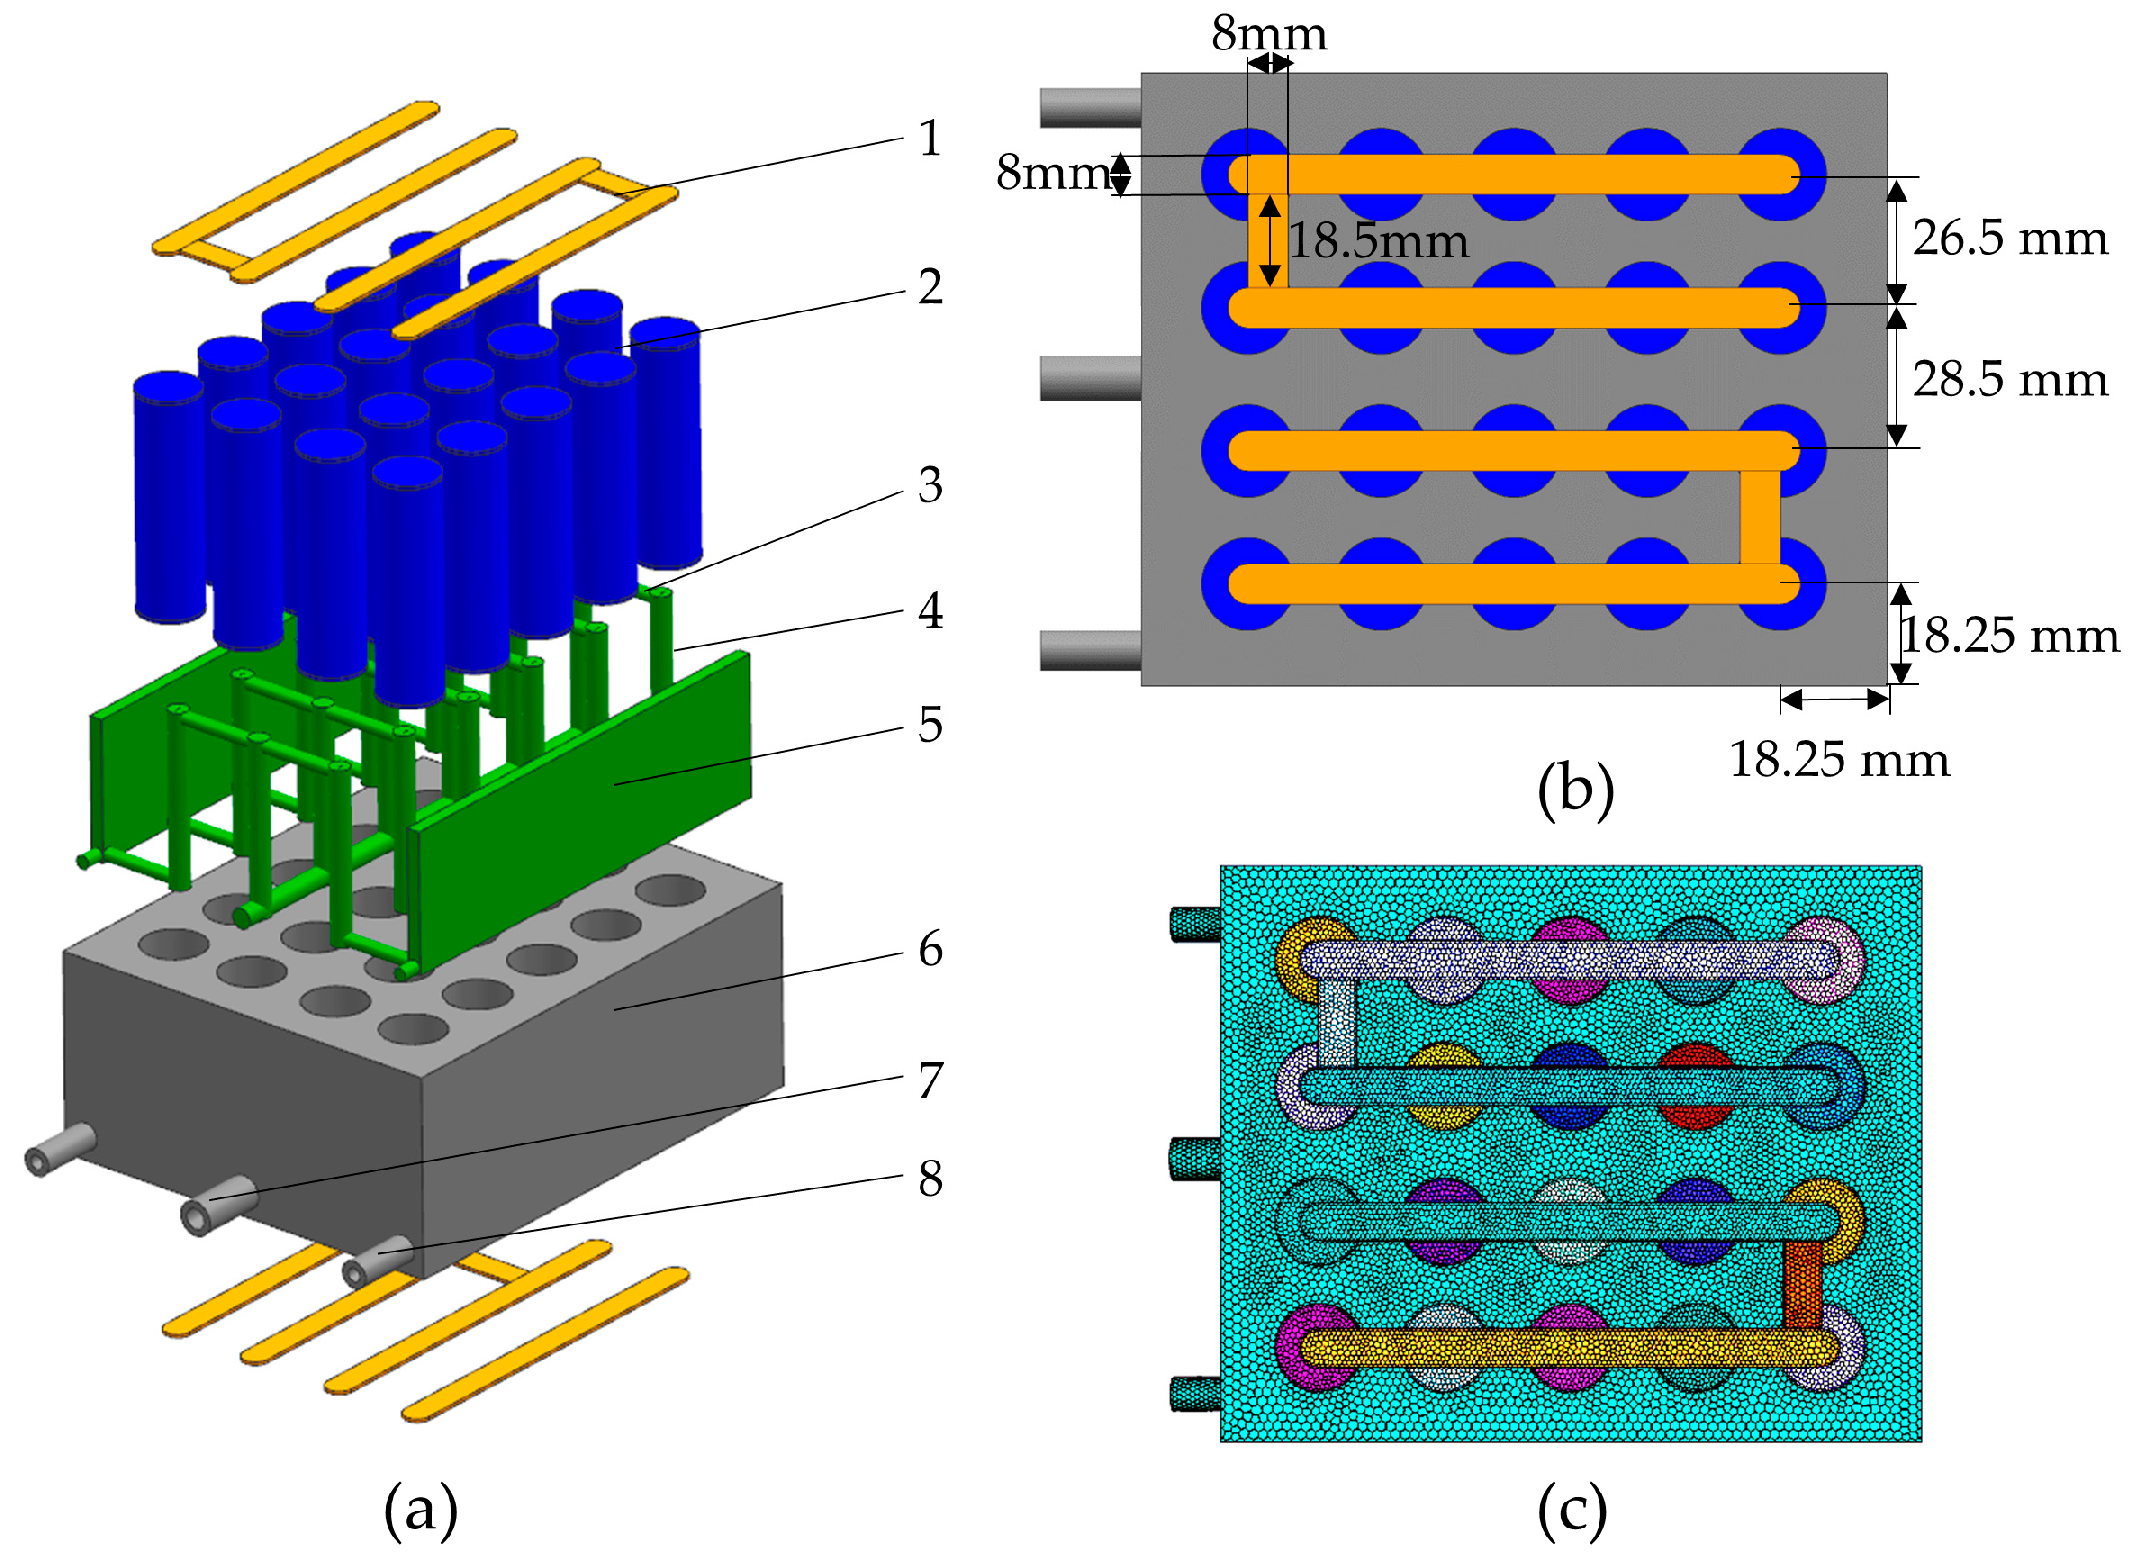
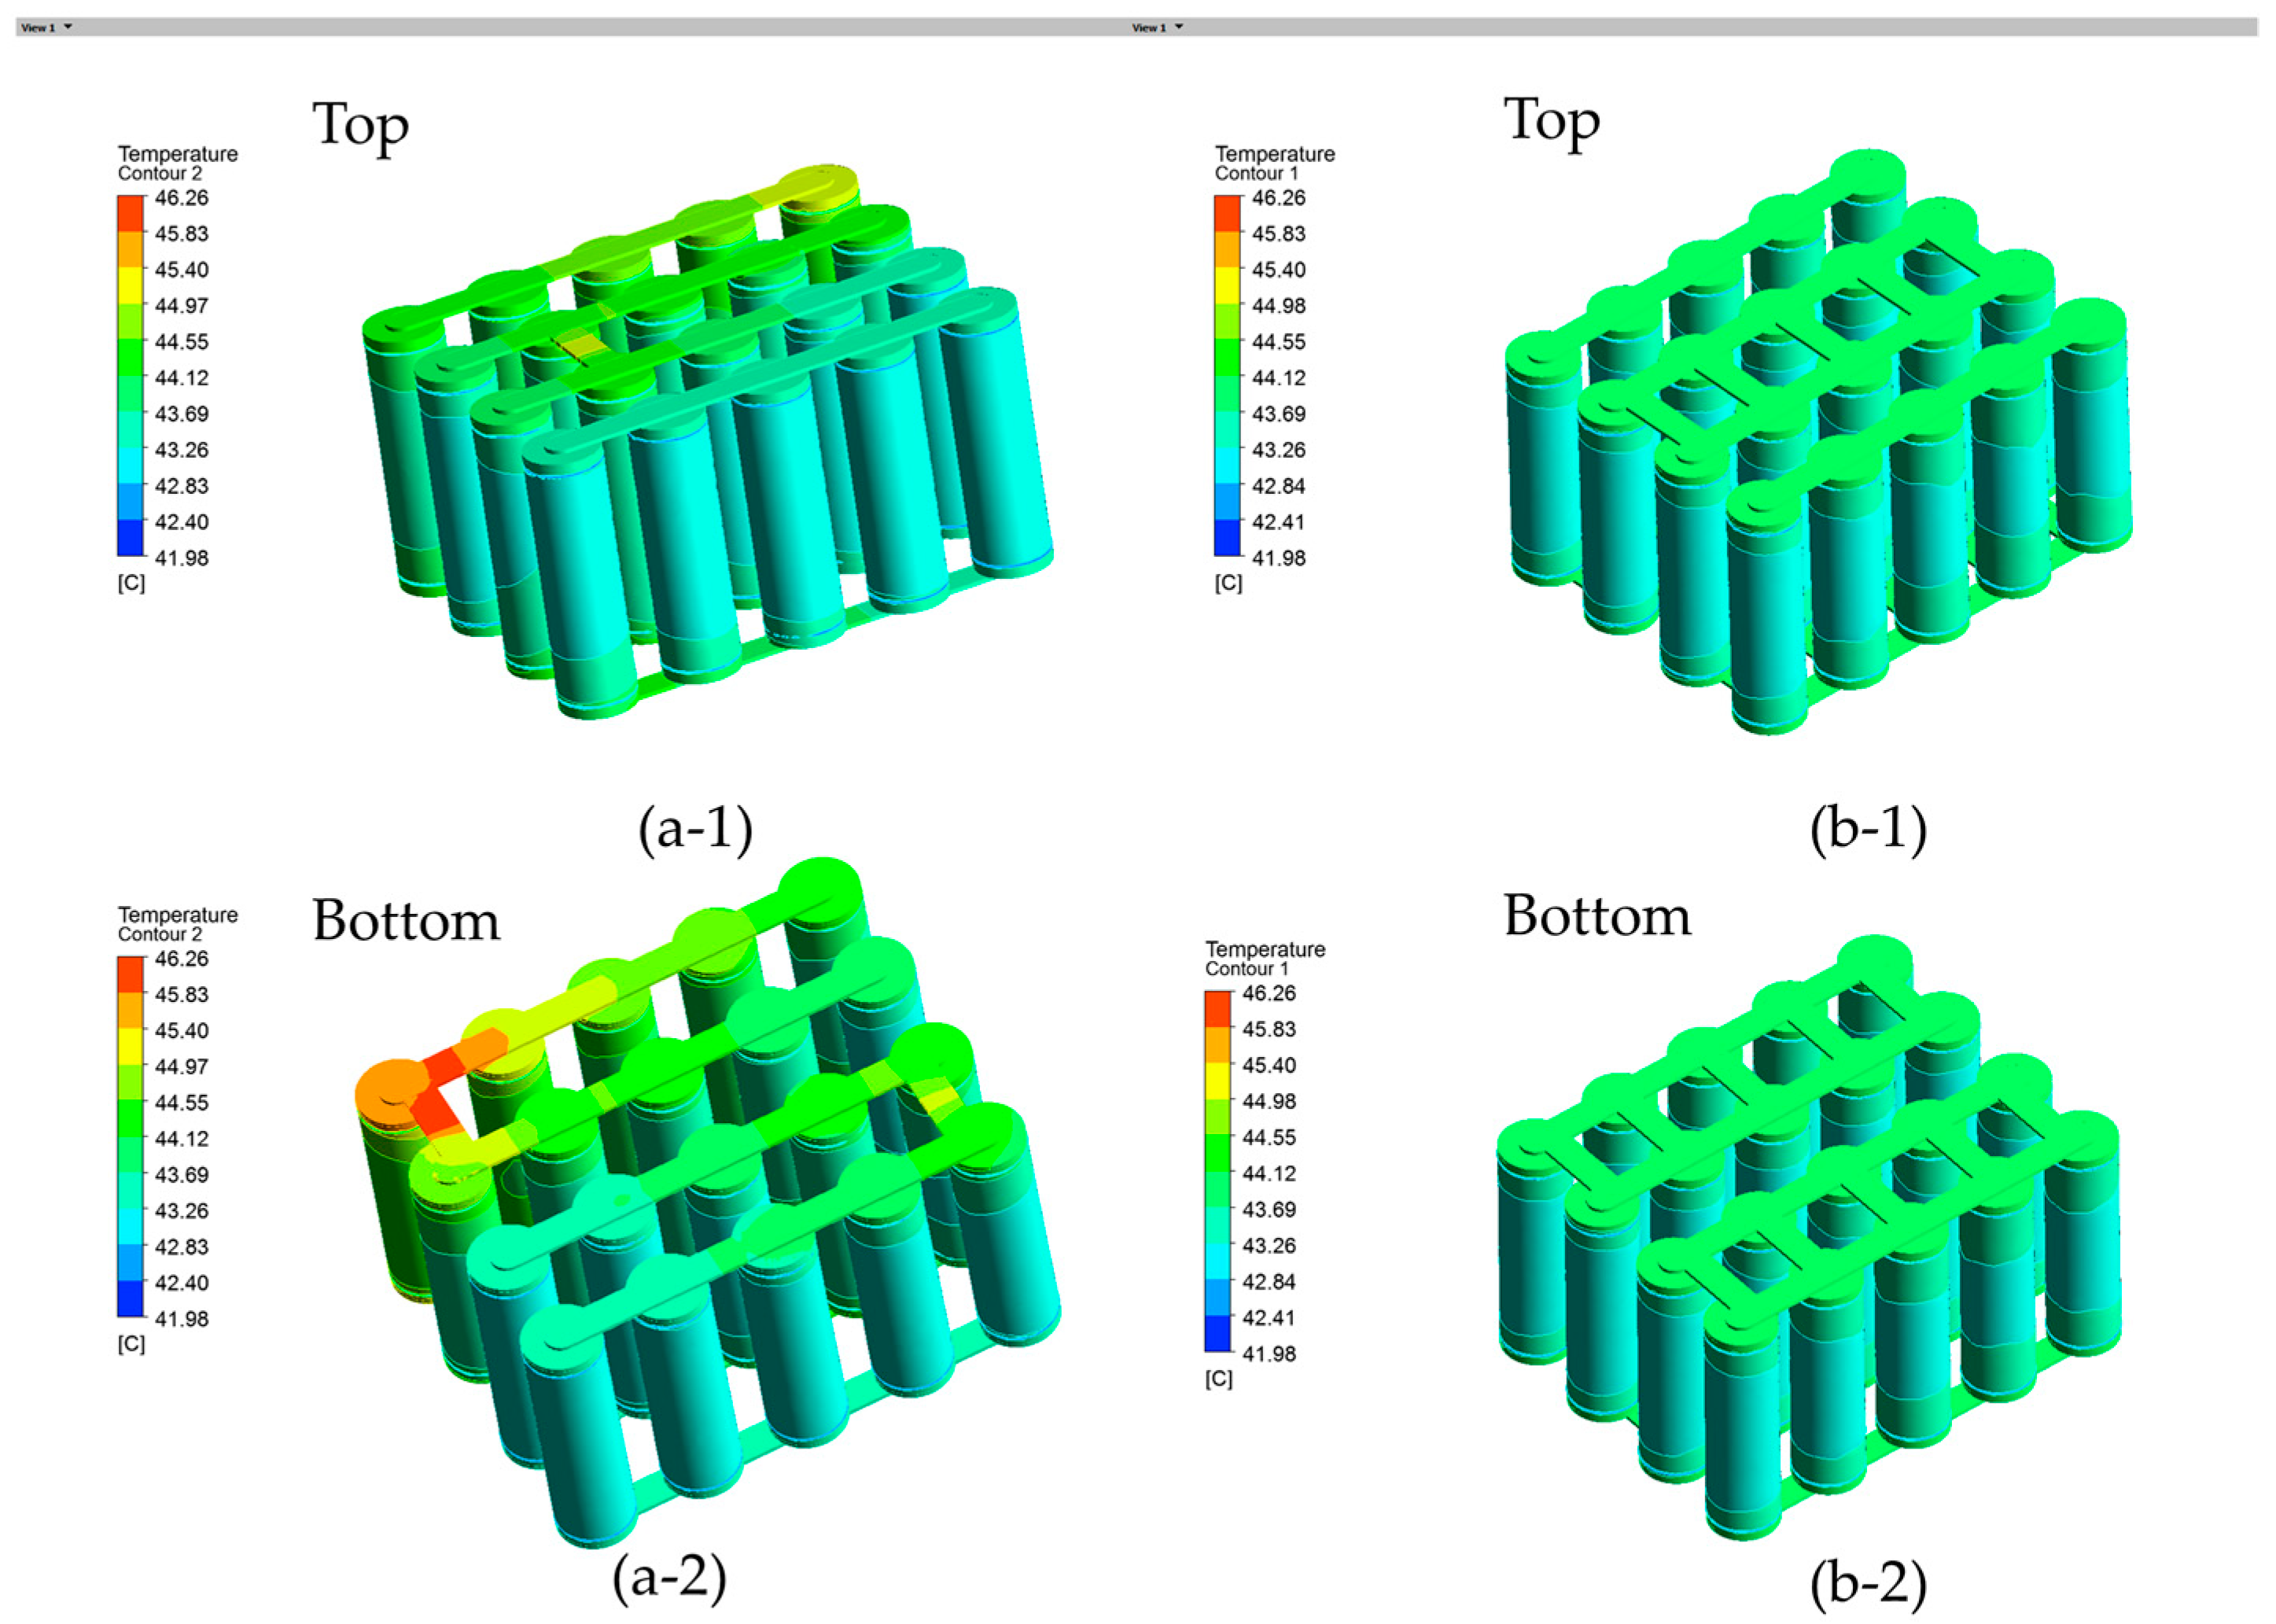
The battery module nickel busbar connection may cause a high battery surface temperature. It is noted that the busbar connection may cause additional hot spots in the battery module. For the present battery module with twenty cells in five parallel and four series connections, the initial thermal model (model A) was built to examine the temperature profile. The terminal surface of the battery in each row was connected in parallel with the positive terminal and connected in series with the negative terminal of the battery in the next row. The numerical simulation model of fluid-solid thermal coupling in the battery module was established in Ansys Fluent software, including the heat generation of the battery and the heat generation of the nickel busbar. The series-connected nickel busbars in the battery module generate a large amount of local ohmic heat, due to their own internal resistance and confluence current, especially at high discharge rates. Therefore, multiple parallel-connected nickel busbars were used to connect the positive and negative terminals of the battery, named as model B. In this way, the high current passing through the busbar could be reduced and thus the hot spot temperature can be minimized to mitigate the fire risk.
The left model A with series busbar connections and the right model B with parallel busbar connections are shown in Figure 14. As shown in Figure 14(a-1), with a 2C discharge rate and a 40 °C ambient temperature, the maximum temperature of the left model A at the busbar is 46.26 °C, while the maximum temperature of the right model B at the busbar is 43.97 °C. This indicates that the present configuration is more capable of minimizing the hot spots on the busbar. On the other hand, the battery temperatures remain almost the same for the two configurations without much difference. It is also noted that the present battery temperature based on numerical simulations is close to the temperature in the thermal images shown in Figure 9. It should be noted, however, that the temperature of the busbar in the experimental test is higher than the temperature in the numerical simulations. This could be due to the contact electrical resistance in the soldering of the nickel busbar, which is not taken into account in the numerical simulations.
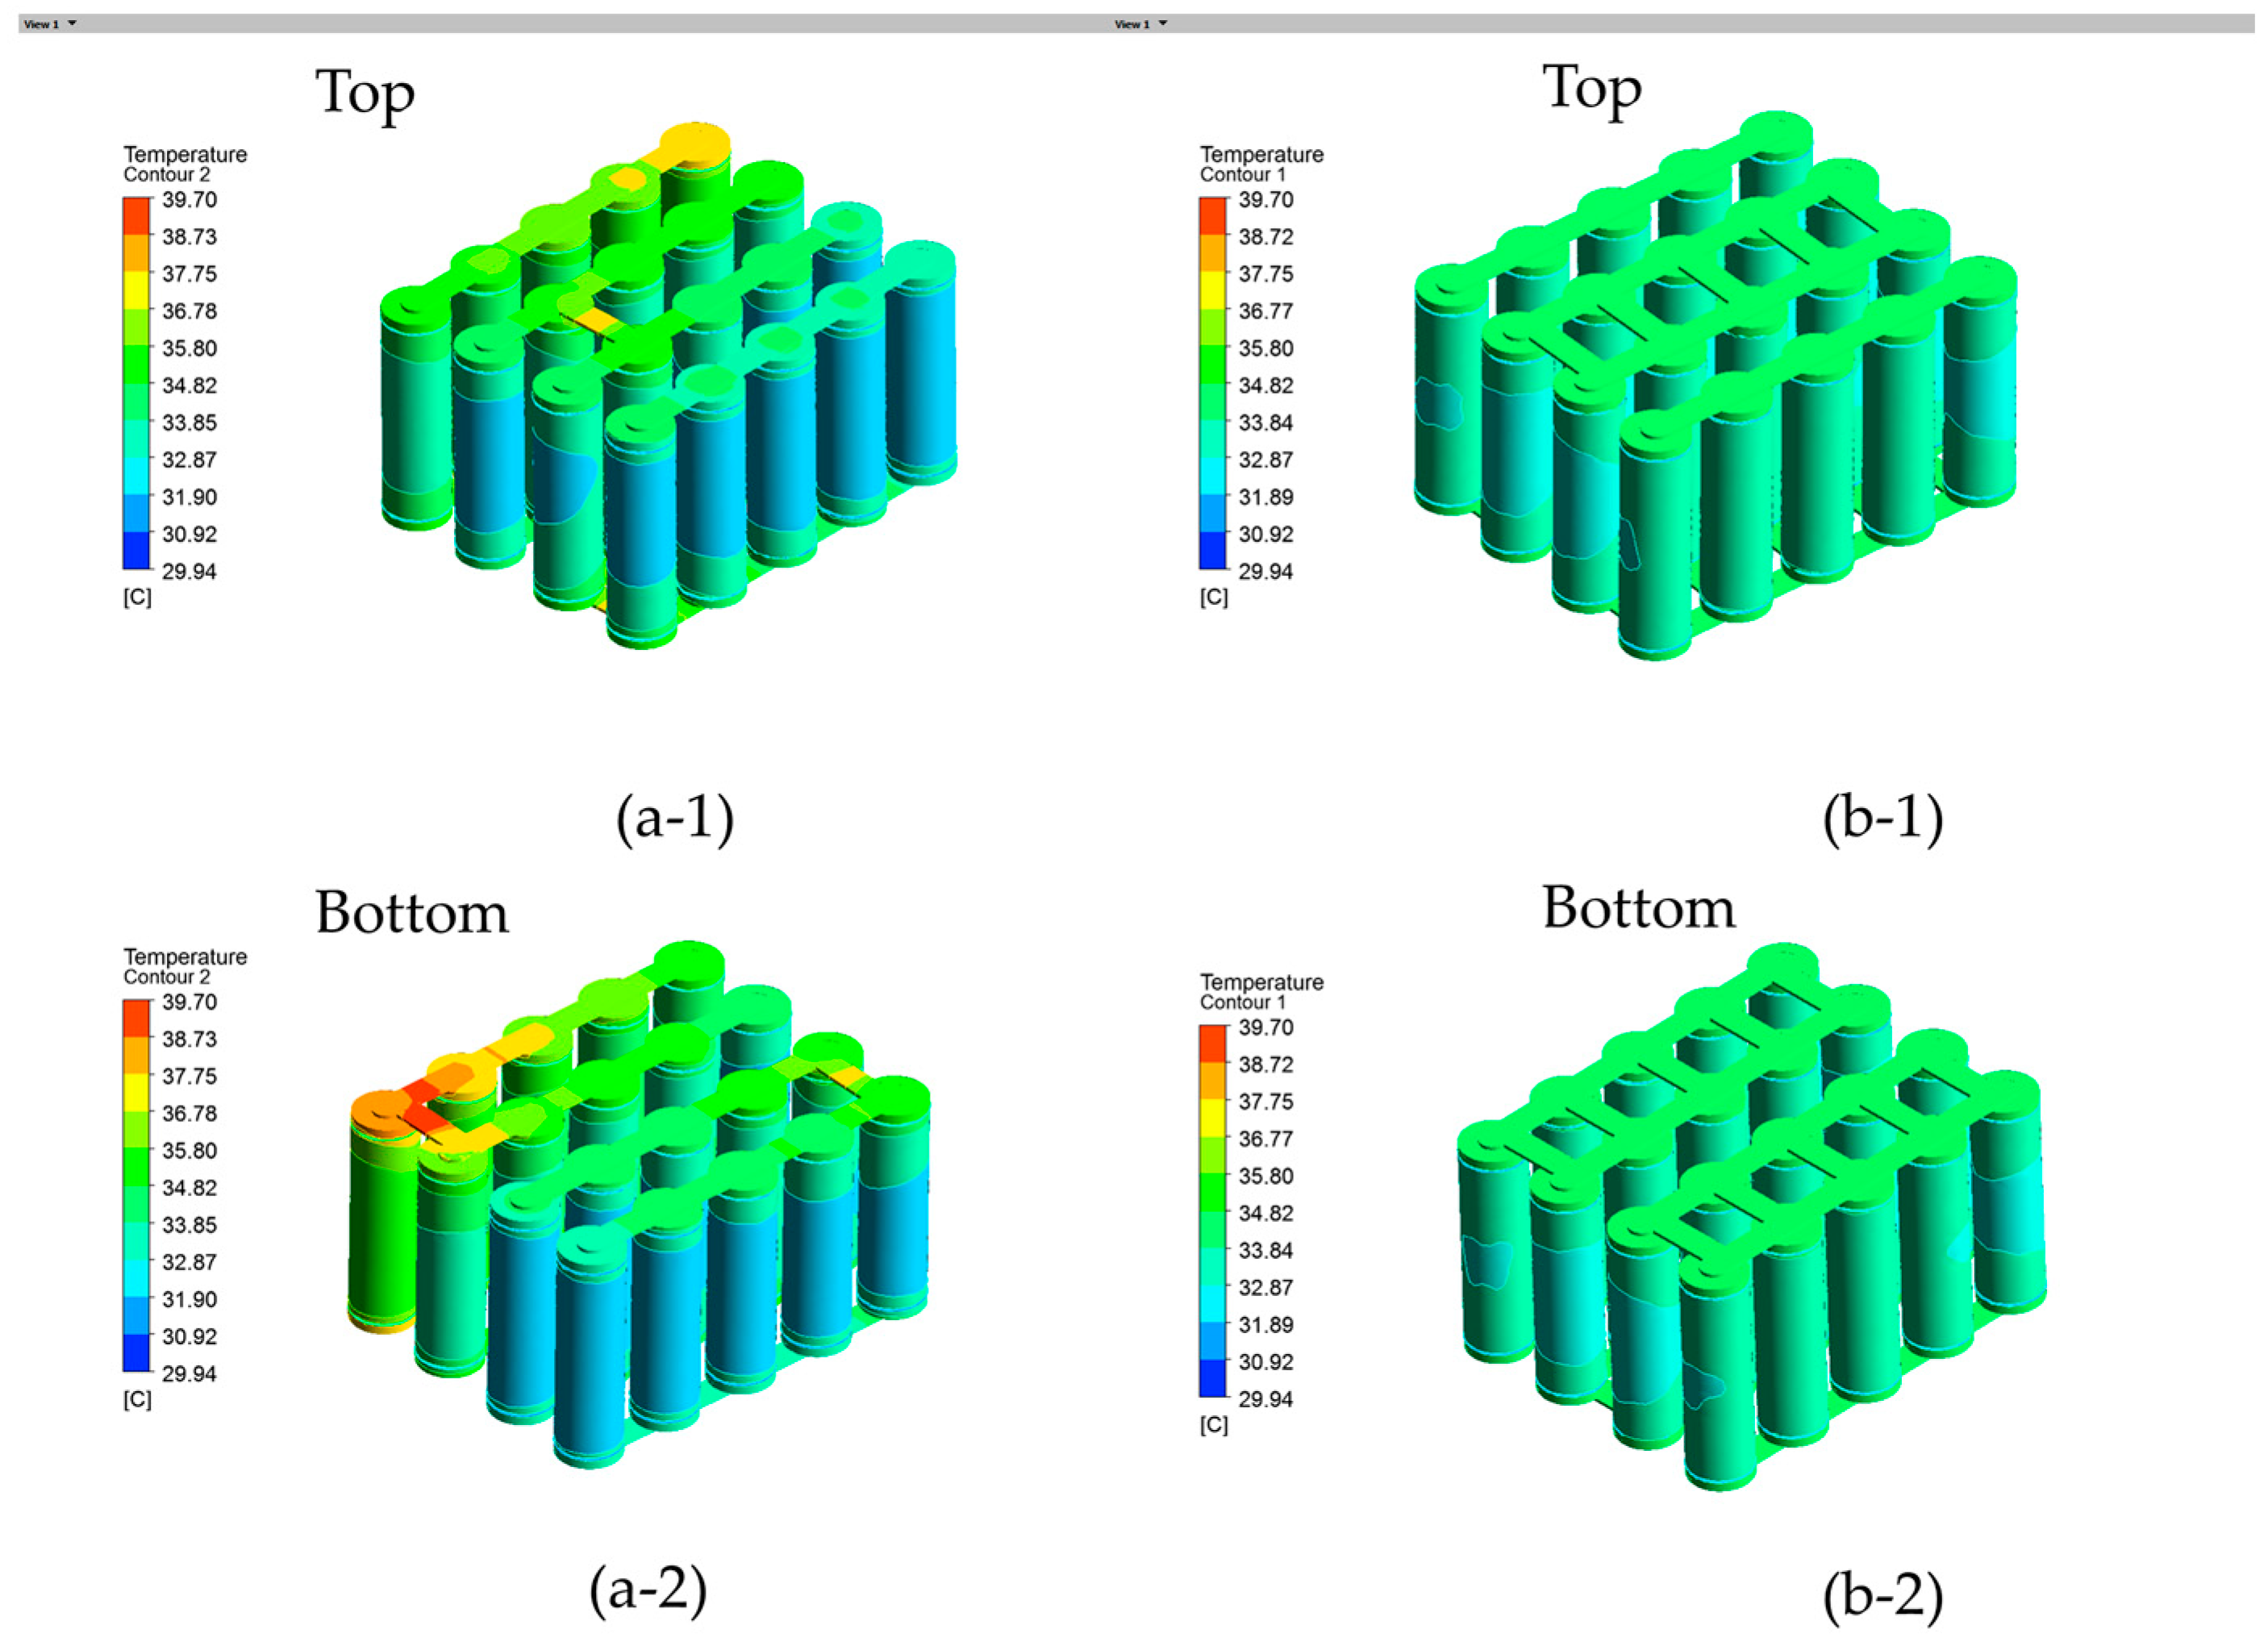
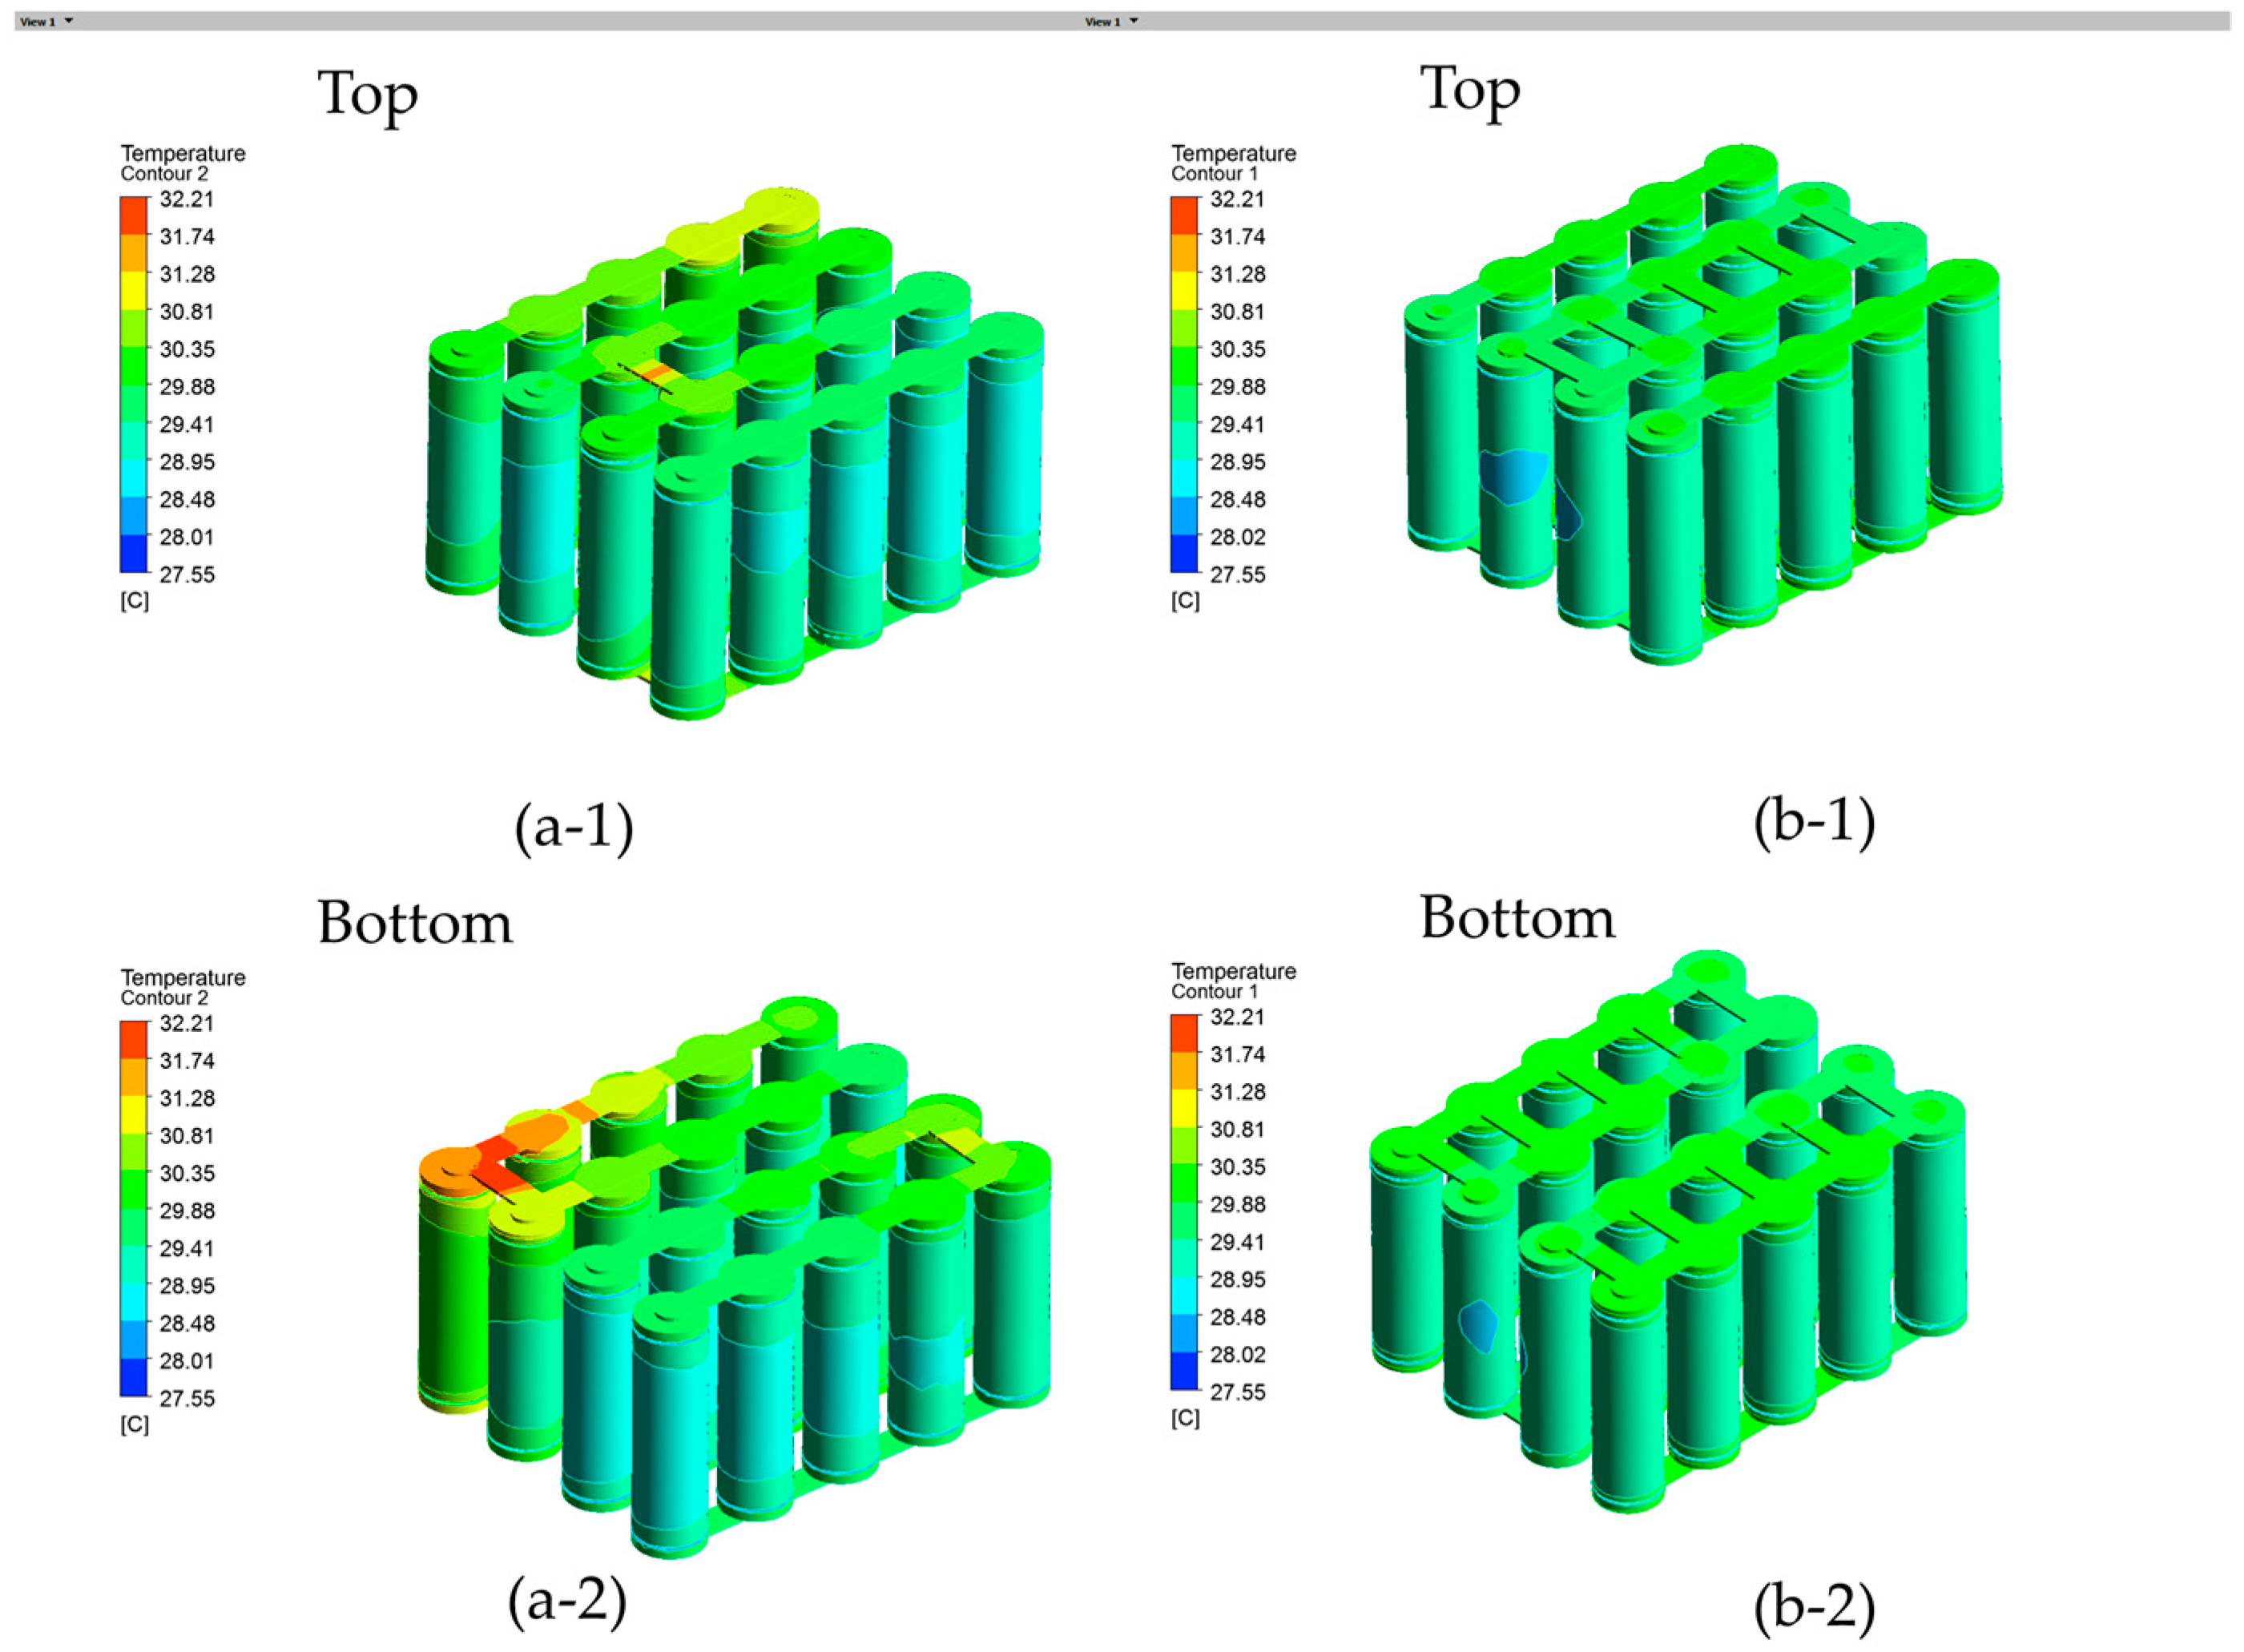
The temperature profiles under a 3C discharge rate are shown in Figure 15(a-1) for the series connection with one confluence busbar made of nickel. It is observed that the busbar temperature reached 39.70 °C between the first row and the second row, which is even higher than the adjacent battery temperatures. In order to further mitigate the safety risks of the battery module, the battery module nickel busbar connection was redesigned with multiple parallel connections, named as model B, which exhibited a temperature 4.86 °C lower than the initial configuration. As shown in Figure 15(b-1), five nickel busbar connections were made between the first row and second row in model B. Additionally, the maximum temperature of the nickel busbar in model B is 34.84 °C, with a more uniform temperature across the busbar connections, indicating the effective removal of hot spots from the busbar connections. It is clear that the parallel connections in model B led to a more uniform temperature profile by mitigating the hot spots on the busbar and thus model B more favored in practice. The temperature profiles under a 2C discharge rate are shown in Figure 16 for the battery module. The maximum temperature of the Model B is 30.10 °C, which is 2.11 °C lower than that of the Model A.

4. Conclusions

In this paper, the thermal management and suppression of thermal propagation in a lithium-ion battery module with a liquid-cooled shell were investigated through experiments. It has been demonstrated that the presented liquid-cooled shell can meet the demands of battery module thermal management at high charging and discharging rates. When the battery module is discharged at a high temperature, the temperature of the busbar of the battery module is recorded by a thermal imaging camera. Furthermore, it can prevent the spread of thermal runaway of the battery module. Additionally, a numerical simulation model is constructed in order to optimize the connections between the battery modules. The conclusions are summarized as follows.
(1) The maximum temperature of the battery module increases with the increase in the discharging or charging rate, and under the same current, the temperature of the battery during the discharge process is significantly higher than the temperature of the battery during the charging process. The maximum temperature of the battery module is 35.81 °C and the maximum temperature difference in the battery module is 5.43 °C at a discharging rate of 3C. The efficiency of battery modules will be reduced when discharging at low temperatures compared with high temperatures.
(2) Besides the battery temperature, the busbar connection also has an effect on the system temperature profile. Hot spots were found on the confluence busbar of the batteries in series connection. The effect of nickel heating on the battery is also demonstrated by infrared thermography.
(3) Thermal runaway can be suppressed by a thermal management system for battery modules. Two thermal runaway locations were experimentally examined for the present battery module. When thermal runaway occurred in the middle of the battery module, thermal runaway propagation could be well suppressed, even at an inlet flow speed as low as 0.2 m/s. Additionally, when thermal runaway occurred in the corner of the battery module, the adjacent battery was thermally suppressed below 70 °C at the inlet flow speed of 0.4 m/s. Further reductions in the flow speed may lead to higher temperatures and risk the thermal runaway of the adjacent battery cell. In both cases, the maximum temperature of the adjacent battery will not exceed 70 °C at a moderate flow speed of 0.4 m/s or more.
(4) In order to improve the safety of battery modules, a parallel busbar connection mode for the battery module is recommended, which demonstrated a 4.86 °C lower temperature than the initial configuration with series busbar connections at a discharge rate of 3C in model simulations. The temperature consistency of the battery module is also improved.

Author Contributions

Conceptualization, K.X. and J.Z.; methodology, software, and validation, K.X., G.Q. and J.Z.; writing—original draft preparation, K.X., J.Z. and H.Z.; writing—review and editing, K.X., J.Z. and H.Z.; supervision, H.Z. All authors have read and agreed to the published version of the manuscript.

Funding

This research was funded by the Natural Science Foundation of China (51876113) and Shanghai Municipal Natural Science Foundation (21ZR1426300).

Data Availability Statement

Not applicable.

Acknowledgments

Support from the Natural Science Foundation of China (51876113), Shanghai Municipal Natural Science Foundation (21ZR1426300) are acknowledged.

Conflicts of Interest

The authors declare no conflict of interest.

Nomenclature

CbSpecific heat capacity (J/kgK)
C1Capacitor #1 in the 2nd order ECM model (F)
C2Capacitor #2 in the 2nd order ECM model (F)
haConvective heat transfer coefficient (W/(m2∙K))
ICurrent (A)
RSResistance in series (mΩ)
R1Resistance #1 in the 2nd order ECM model (mΩ)
R2Resistance #2 in the 2nd order ECM model (mΩ)
tTime (s)
TTemperature (°C)
TaTemperature of the battery (°C)
UVoltage (V)
VocvOpen circuit voltage (V)
VolVolume of battery (mm3)
TmaxTemperature maximum (°C)
ΔTTemperature nonuniformity (°C)
Acronyms
DCDirect current
ECMElectrical circuit model
HPPCHybrid pulse power characterization
LIBLithium-ion battery
NMCNickel–manganese–cobalt
PParallel
PCMPhase change material
SSeries
SEISolid electrolyte interface
SOCState of charge

References

  1. Patel, J.R.; Rathod, M.K. Recent developments in the passive and hybrid thermal management techniques of lithium-ion batteries. J. Power Sources 2020, 480, 228820. [Google Scholar] [CrossRef]
  2. Rao, Z.; Qian, Z.; Kuang, Y.; Li, Y. Thermal performance of liquid cooling based thermal management system for cylindrical lithium-ion battery module with variable contact surface. Appl. Therm. Eng. 2017, 123, 1514–1522. [Google Scholar] [CrossRef]
  3. Aris, A.M.; Shabani, B. An Experimental Study of a Lithium Ion Cell Operation at Low Temperature Conditions. Energy Procedia 2017, 110, 128–135. [Google Scholar] [CrossRef]
  4. Xie, L.; Huang, Y.; Lai, H. Coupled prediction model of liquid-cooling based thermal management system for cylindrical lithium-ion module. Appl. Therm. Eng. 2020, 178, 115599. [Google Scholar] [CrossRef]
  5. Huang, Y.; Wang, S.; Lu, Y.; Huang, R.; Yu, X. Study on a liquid cooled battery thermal management system pertaining to the transient regime. Appl. Therm. Eng. 2020, 180, 115793. [Google Scholar] [CrossRef]
  6. Gao, Y.; Jiang, J.; Zhang, C.; Zhang, W.; Ma, Z.; Jiang, Y. Lithium-ion battery aging mechanisms and life model under different charging stresses. J. Power Sources 2017, 356, 103–114. [Google Scholar] [CrossRef]
  7. Onda, K.; Ohshima, T.; Nakayama, M.; Fukuda, K.; Araki, T. Thermal behavior of small lithium-ion battery during rapid charge and discharge cycles. J. Power Sources 2006, 158, 535–542. [Google Scholar] [CrossRef]
  8. Liu, H.; Wei, Z.; He, W.; Zhao, J. Thermal issues about Li-ion batteries and recent progress in battery thermal management systems: A review. Energy Convers. Manag. 2017, 150, 304–330. [Google Scholar] [CrossRef]
  9. Väyrynen, A.; Salminen, J. Lithium ion battery production. J. Chem. Thermodyn. 2012, 46, 80–85. [Google Scholar] [CrossRef]
  10. Lindgren, J.; Lund, P.D. Effect of extreme temperatures on battery charging and performance of electric vehicles. J. Power Sources 2016, 328, 37–45. [Google Scholar] [CrossRef]
  11. Yetik, O.; Karakoc, T.H. A study on lithium-ion battery thermal management system with Al2O3 nanofluids. Int. J. Energy Res. 2022, 46, 10930–10941. [Google Scholar] [CrossRef]
  12. Liao, L.; Zuo, P.; Ma, Y.; Chen, X.; An, Y.; Gao, Y.; Yin, G. Effects of temperature on charge/discharge behaviors of LiFePO4 cathode for Li-ion batteries. Electrochimica Acta 2012, 60, 269–273. [Google Scholar] [CrossRef]
  13. Pordanjani, A.H.; Aghakhani, S.; Afrand, M.; Zhang, P.; Tang, R.; Mahian, O.; Wongwises, S.; Rashidi, M.M. Thermo-electrochemical simulation of the cooling process in a compact battery pack considering various configurations. J. Power Sources 2023, 553, 232112. [Google Scholar] [CrossRef]
  14. Li, X.; Zhao, J.; Duan, J.; Panchal, S.; Yuan, J.; Fraser, R.; Fowler, M.; Chen, M. Simulation of cooling plate effect on a battery module with different channel arrangement. J. Energy Storage 2022, 49, 104113. [Google Scholar] [CrossRef]
  15. Choudhari, V.; Dhoble, A.; Panchal, S. Numerical analysis of different fin structures in phase change material module for battery thermal management system and its optimization. Int. J. Heat Mass Transf. 2020, 163, 120434. [Google Scholar] [CrossRef]
  16. Liu, Y.; Zhang, J. Design a J-type air-based battery thermal management system through surrogate-based optimization. Appl. Energy 2019, 252, 113426. [Google Scholar] [CrossRef]
  17. Das, H.S.; Rahman, M.M.; Li, S.; Tan, C.W. Electric vehicles standards, charging infrastructure, and impact on grid integration: A technological review. Renew. Sustain. Energy Rev. 2020, 120, 109618. [Google Scholar] [CrossRef]
  18. Wu, G.; Zhang, H.; Xu, Y.; Wu, X. Air-Side Fin Geometry of a Tube-Strip Heat Exchanger for Fuel Cell Vehicles. Automot. Innov. 2021, 4, 176–188. [Google Scholar] [CrossRef]
  19. El Idi, M.M.; Karkri, M.; Tankari, M.A. A passive thermal management system of Li-ion batteries using PCM composites: Experimental and numerical investigations. Int. J. Heat Mass Transf. 2021, 169, 120894. [Google Scholar] [CrossRef]
  20. Lai, Y.; Wu, W.; Chen, K.; Wang, S.; Xin, C. A compact and lightweight liquid-cooled thermal management solution for cylindrical lithium-ion power battery pack. Int. J. Heat Mass Transf. 2019, 144, 118581. [Google Scholar] [CrossRef]
  21. Zhao, C.; Sousa, A.C.; Jiang, F. Minimization of thermal non-uniformity in lithium-ion battery pack cooled by channeled liquid flow. Int. J. Heat Mass Transf. 2018, 129, 660–670. [Google Scholar] [CrossRef]
  22. Wu, X.; Wang, K.; Chang, Z.; Chen, Y.; Cao, S.; Lv, C.; Liu, H.; Wang, Y. Experimental and numerical study on hybrid battery thermal management system combining liquid cooling with phase change materials. Int. Commun. Heat Mass Transf. 2022, 139, 106480. [Google Scholar] [CrossRef]
  23. Liu, Z.; Liu, X.; Meng, H.; Guo, L.; Zhang, Z. Numerical analysis of the thermal performance of a liquid cooling battery module based on the gradient ratio flow velocity and gradient increment tube diameter. Int. J. Heat Mass Transf. 2021, 175, 121338. [Google Scholar] [CrossRef]
  24. Jin, C.; Sun, Y.; Wang, H.; Zheng, Y.; Wang, S.; Rui, X.; Xu, C.; Feng, X.; Wang, H.; Ouyang, M. Heating power and heating energy effect on the thermal runaway propagation characteristics of lithium-ion battery module: Experiments and modeling. Appl. Energy 2022, 312, 118760. [Google Scholar] [CrossRef]
  25. Lopez, C.F.; Jeevarajan, J.A.; Mukherjee, P.P. Experimental Analysis of Thermal Runaway and Propagation in Lithium-Ion Battery Modules. J. Electrochem. Soc. 2015, 162, A1905–A1915. [Google Scholar] [CrossRef]
  26. Li, H.; Chen, H.; Zhong, G.; Wang, Y.; Wang, Q. Experimental study on thermal runaway risk of 18650 lithium ion battery under side-heating condition. J. Loss Prev. Process. Ind. 2019, 61, 122–129. [Google Scholar] [CrossRef]
  27. Zhong, G.; Li, H.; Wang, C.; Xu, K.; Wang, Q. Experimental Analysis of Thermal Runaway Propagation Risk within 18650 Lithium-Ion Battery Modules. J. Electrochem. Soc. 2018, 165, A1925–A1934. [Google Scholar] [CrossRef]
  28. Amano, K.O.A.; Hahn, S.-K.; Tschirschwitz, R.; Rappsilber, T.; Krause, U. An Experimental Investigation of Thermal Runaway and Gas Release of NMC Lithium-Ion Pouch Batteries Depending on the State of Charge Level. Batteries 2022, 8, 41. [Google Scholar] [CrossRef]
  29. Wang, W.; He, T.; He, S.; You, T.; Khan, F. Modeling of thermal runaway propagation of NMC battery packs after fast charging operation. Process. Saf. Environ. Prot. 2021, 154, 104–117. [Google Scholar] [CrossRef]
  30. Rui, X.; Feng, X.; Wang, H.; Yang, H.; Zhang, Y.; Wan, M.; Wei, Y.; Ouyang, M. Synergistic effect of insulation and liquid cooling on mitigating the thermal runaway propagation in lithium-ion battery module. Appl. Therm. Eng. 2021, 199, 117521. [Google Scholar] [CrossRef]
  31. Zhu, J.; Zhang, H.; Xu, K.; Xu, S.; Li, P. Study of structure optimization and thermal spread suppression based on liquid-cooled battery modules. Energy Storage Sci. Technol. 2022, 11, 2620–2628. [Google Scholar] [CrossRef]
  32. Lv, Y.; Zhou, D.; Yang, X.; Liu, X.; Li, X.; Zhang, G. Experimental investigation on a novel liquid-cooling strategy by coupling with graphene-modified silica gel for the thermal management of cylindrical battery. Appl. Therm. Eng. 2019, 159, 113885. [Google Scholar] [CrossRef]
  33. Li, K.; Yan, J.; Chen, H.; Wang, Q. Water cooling based strategy for lithium ion battery pack dynamic cycling for thermal management system. Appl. Therm. Eng. 2018, 132, 575–585. [Google Scholar] [CrossRef]
  34. Cao, W.; Zhao, C.; Wang, Y.; Dong, T.; Jiang, F. Thermal modeling of full-size-scale cylindrical battery pack cooled by channeled liquid flow. Int. J. Heat Mass Transf. 2019, 138, 1178–1187. [Google Scholar] [CrossRef]
  35. Wang, H.; Tao, T.; Xu, J.; Mei, X.; Liu, X.; Gou, P. Cooling capacity of a novel modular liquid-cooled battery thermal management system for cylindrical lithium ion batteries. Appl. Therm. Eng. 2020, 178, 115591. [Google Scholar] [CrossRef]
  36. Gao, R.; Fan, Z.; Liu, S. A gradient channel-based novel design of liquid-cooled battery thermal management system for thermal uniformity improvement. J. Energy Storage 2022, 48, 104014. [Google Scholar] [CrossRef]
  37. Feng, X.; Zheng, S.; Ren, D.; He, X.; Wang, L.; Cui, H.; Liu, X.; Jin, C.; Zhang, F.; Xu, C.; et al. Investigating the thermal runaway mechanisms of lithium-ion batteries based on thermal analysis database. Appl. Energy 2019, 246, 53–64. [Google Scholar] [CrossRef]
Figure 1. Liquid-cooled battery module test system with the battery modules for thermal management and suppression of thermal propagation.
Batteries 09 00204 g001
Figure 2. An illustration of the new liquid-cooled shell battery module: (a) overall structure of battery module system with both positive and negative connections (yellow color); (b) top view of the battery module with positive terminal connection; (c) grid model. 1-busbar, 2-cell, 3-lateral channel, 4-longitudinal channel, 5-liquid channel, 6-shell, 7-inlet, 8-outlet.
Batteries 09 00204 g002
Figure 3. The verification of grid independence.
Batteries 09 00204 g003
Figure 4. Comparison of experimental and simulation results for the temperature of cell #1 in the battery module.
Batteries 09 00204 g004
Figure 5. The change in battery module temperature with different discharge and charge rates. (a) 1C charge, (b) 1C discharge, (c) 2C charge, (d) 2C discharge, (e) 3C charge, and (f) 3C discharge.
Batteries 09 00204 g005
Figure 6. The change of battery module temperature with discharge time at different flow speeds [31]: (a) 0.2 m/s, (b) 0.3 m/s, (c) 0.5m/s, (d) 0.7 m/s.
Batteries 09 00204 g006
Figure 7. The change in maximum temperature, maximum temperature difference, and pressure difference with different flow rates.
Batteries 09 00204 g007
Figure 8. The change of battery module temperature with discharge time at different coolant temperatures: (a) 10 °C [31], (b) 25 °C [31], (c) 40 °C.
Batteries 09 00204 g008
Figure 9. Thermal imaging of battery module nickel busbars under the conditions of 2C, 40 °C, and (a) 0 s or (b) 1590 s (the end of discharge), with the spot temperatures Sp1–9 marked in the right upper corner.
Batteries 09 00204 g009
Figure 10. The change in battery module temperature with time at different flow speeds. (a) 0.2 m/s, (b) 0.5 m/s, (c) 0.8 m/s, (d) 1.0 m/s, (e) 1.3 m/s, and (f) 1.6 m/s. (For #14 near the middle.)
Batteries 09 00204 g010
Figure 11. The maximum temperature of the battery module at different flow speeds. (For #14 near the middle.)
Batteries 09 00204 g011
Figure 12. The change in battery module temperature with time at different flow speeds. (a) 0.4 m/s, (b) 0.5 m/s, (c) 0.8 m/s, (d) 1.0 m/s, (e) 1.3 m/s, and (f) 1.6 m/s. (For #20 in the corner.)
Batteries 09 00204 g012
Figure 13. Variations in the maximum temperature of the battery at different flow rates. (For #20 in the corner.)
Batteries 09 00204 g013
Figure 14. Battery module temperature contour viewed from the top and bottom at 2 C discharge rate and 40 °C ambient temperature: (a-1) and (a-2) are model A and (b-1) and (b-2) are model B.
Batteries 09 00204 g014
Figure 15. Battery module temperature contour viewed from top and bottom at a 3C discharge rate and 25 °C ambient temperature: (a-1) and (a-2) are model A and (b-1) and (b-2) are model B.
Batteries 09 00204 g015
Figure 16. Battery module temperature contour viewed from top (upper) and bottom (lower) at a 2C discharge rate and 25 °C ambient temperature: (a-1) and (a-2) are model A and (b-1) and (b-2) are model B.
Batteries 09 00204 g016
Table 1. Material thermal property parameters.
MaterialsDensity (kg/m3)Specific Heat Capacity (J/kg∙K)Thermal Conductivity (W/m∙K)
Water996.954178.50.6
Cell2510102536.96 (X)/1.63 (Y/Z)
Cathode pole2791871155
Anode pole8978381387.6
Shell2791871155
Busbar8900460.691.7
Table 2. Uncertainty analysis of experimental apparatus.
ApparatusModelRangeUncertainty
ThermocoupleETA-TK-30−200–260 °C 2%
Data acquisitionHIOKI LR8410-30−200–2000 °C 1%
DC power supplyGWINSTEK-PSW0–160 V/0–21.6 A1%
Table 3. Comparison with the published work on liquid cooling of battery modules.
SourceC-RateTmax (°C)ΔT (°C)Number of Batteries
Lv [32]3C42.004.9225
Li [33]3C56.2029.516
Cao [34]2C43.006.82180
Wang [35]3C37.675.7620
Gao [36]2C35.212.8316
Present work3C35.815.4320
Disclaimer/Publisher’s Note: The statements, opinions and data contained in all publications are solely those of the individual author(s) and contributor(s) and not of MDPI and/or the editor(s). MDPI and/or the editor(s) disclaim responsibility for any injury to people or property resulting from any ideas, methods, instructions or products referred to in the content.

