Article

Preparation of Electrospun Membranes and Their Use as Separators in Lithium Batteries

1
Department of Energy Technologies and Renewable Sources, ENEA CR Casaccia, S. Maria di Galeria, 00123 Rome, Italy
2
Sustainability Department, ENEA CR Casaccia, S. Maria di Galeria, 00123 Rome, Italy
3
Nanofaber S.r.l., Via Anguillarese 301, 00123 Rome, Italy
*
Author to whom correspondence should be addressed.
Batteries 2023, 9(4), 201; https://doi.org/10.3390/batteries9040201
Submission received: 26 January 2023 / Revised: 14 March 2023 / Accepted: 21 March 2023 / Published: 28 March 2023
(This article belongs to the Special Issue Advanced Materials for Batteries)

Abstract

:
In this work, electrospun nanofiber membranes are investigated as separators for lithium batteries. Membrane consisting of polyacrylonitrile-polycaprolactone mixtures were produced following a combinatorial approach inspired by design of experiments to identify the relationships between process parameters and microstructural properties. The microstructure of the non-woven fibrous mats was characterized by scanning electron microscopy to measure thickness and fiber distribution. Temperature and relative humidity during membrane deposition were also tracked to include them in the statistical analysis and highlight their influence on the properties of the resulting membranes. The functional evaluation of the membranes was conducted by electrochemical impedance spectroscopy, after soaking the membrane in the electrolyte, to measure ion transport properties. All the separators showed specific conductivities higher than 1.5 × 10⁻³ S. The electrochemical performance was also evaluated when the membranes were used as actual separators in coin-cells assembled in-house, stacking the electrolyte-soaked membranes between a lithium anode and a LiFePO4-based cathode. Among all, the PAN/PCL 50:50 showed excellent cycling stability, with a high initial capacity of 150 mAhg−1 and a coulombic efficiency of 99.6%.

Graphical Abstract

1. Introduction

Since the invention of lead-acid batteries, numerous efforts have been made to find new rechargeable battery cells. In fact, the failure of this type of battery represented the main obstacle to its further development and application [1]. Research on new batteries has been oriented towards different elements such as, for example, aluminum [2], potassium [3], vanadium [4], magnesium [5], silicon [6], sulfur [7], and sodium [8,9]. To date, lithium-ion batteries (LIBs) remain the most performing storage system [10,11,12]. Nevertheless, for future energy applications, such as electric vehicles and energy storage systems, the performance of LIBs needs to be further improved [13]. Efforts are aimed to increase power density, cycling strength, flexibility, safety, and cost-effectiveness. Improvements along all these dimensions are crucial in the upcoming energy scenario where the foreseen use of renewable and green energy is pervasive and increasingly predominant. To achieve high energy density, batteries should be based on cathode and anode active materials with large difference in electrical potential and light atomic or molecular weights. Although the separator element is, in principle, not directly involved in the active mechanism of the battery, it plays a crucial role on both performance and safety of the device. The separator has been indeed the subject of numerous studies to increase the efficiency of the devices [14]. From a manufacturing standpoint, next-generation batteries also demand advanced manufacturing techniques, with higher throughputs and flexibility in form factors, to meet the demand of energy storage systems for mobility, house-hold applications, and innovative applications, including wearable systems. In that respect, electrospinning is a promising and scalable manufacturing strategy to deliver battery separator based on micro- and nano-fibrous membranes endowed with desirable features, such as interconnected open-pore microstructure with very high porosity (usually >80%), and large surface-to-volume ratio [15]. The main function of the separator, inside a battery, is to avoid direct contacts and consequent internal short circuits between the electrodes, while allowing for rapid ionic transport [16].
Current commercial separators are commonly based on microporous membranes made of polyethylene, polypropylene or by a combination of different polymers in multilayer films [17]. Advantages of polyolefins lay in the high mechanical strength, chemical stability, and low-cost, yet two of their main limiting shortcomings are poor thermal stability and low wettability towards typical electrolytes. When subject to high temperature operations, polyolefins are subject to thermal shrinkage, with the consequent possibility of causing a short-circuit. The low wettability instead can result in a high overpotential and a decrease in performance during cycling at high discharge rates [17]. Therefore, the development of novel separators represents an important research domain for the next generation of batteries [18]. The objective of this study is to prepare a textile-non-textile (TNT) polymeric fabric by electrospinning to be used as a lithium battery separator. To this end, the polymeric fabric must primarily demonstrate sufficient chemical, thermal and mechanical stability. In addition, it must be durable and economical, with relevant electrochemical performances, and low environmental impact.
Electrospun non-woven membranes have become increasingly studied since early 2000’s [19]. The sub-micrometric microstructure of electrospun materials can be very similar to glass fibers TNT or Celgard™ [Celgard LLC, Charlotte, North Carolina, USA], which are commonly used as separators in lithium batteries. In addition, the electrospinning process can yield unique polymer-based TNT separators, with characteristic fiber diameters (FDs) down to the nanoscale [20], combined with high porosity, excellent pores interconnection and high surface-to-volume ratio [21]. Due to these properties, the electrospinning method has been widely used to fabricate polymeric separators for LIBs [15,22]. Various polymers have been used to make LIB separators, including polyimide [23], poly(ethylene terephthalate) [24], poly(m-phenylene isophthalamide) [25], poly(ether ether ketone [26] poly (phthala-zine ether sulfone ketone) [27], poly(arylene ether ketone), poly(vinyl alcohol) [28] and polyacrylonitrile (PAN) [29]. In some cases, mixtures of two polymers have also been used to integrate the benefits from different components and address the problems of each of them individually. For example, in polysulfonamide (PSA) sandwich structure-like PSA/PAN/PSA the PAN component was used to improve the tensile strength, and the PSA component to increase the ionic conductivity of the composite membranes [30]. In a previous work, our group conducted some trials using purely polycaprolactone (PCL) as largely tunable material for electrospinning to obtain prototype separators for LIBs with a tailored microstructure characterized by a compact randomly oriented microfiber stack, with a highly porous (>80%) percolating structure of sub-micrometric pores [31]. Despite the expected low performance in terms of chemical and thermal stability, as confirmed by an insufficient durability under sustained cycling, those PCL separators showed good electrochemical performance in terms of capacity and discharge rate because of their microstructure. Following up to such experience, the present work focuses on the manufacturing of electrospun separators retaining the PCL microstructure while increasing chemical stability by means of a replacement strategy, where PCL is partially or totally replaced by polyacrylonitrile (PAN), a known and suitable material in LIBs [32]. Several combinations of PAN/PCL mixtures are therefore produced and benchmarked, trying to use PAN primarily to stabilize the microstructure and ranking the different membranes by their electrochemical performance as separators in lithium metal batteries. Demonstrating the feasibility of such a replacement strategy is a far-reaching objective since it could be pursued for other binary systems, beyond PAN/PCL. Figure 1 offers a schematic of the experimental flow implemented in this study.

2. Materials and Methods

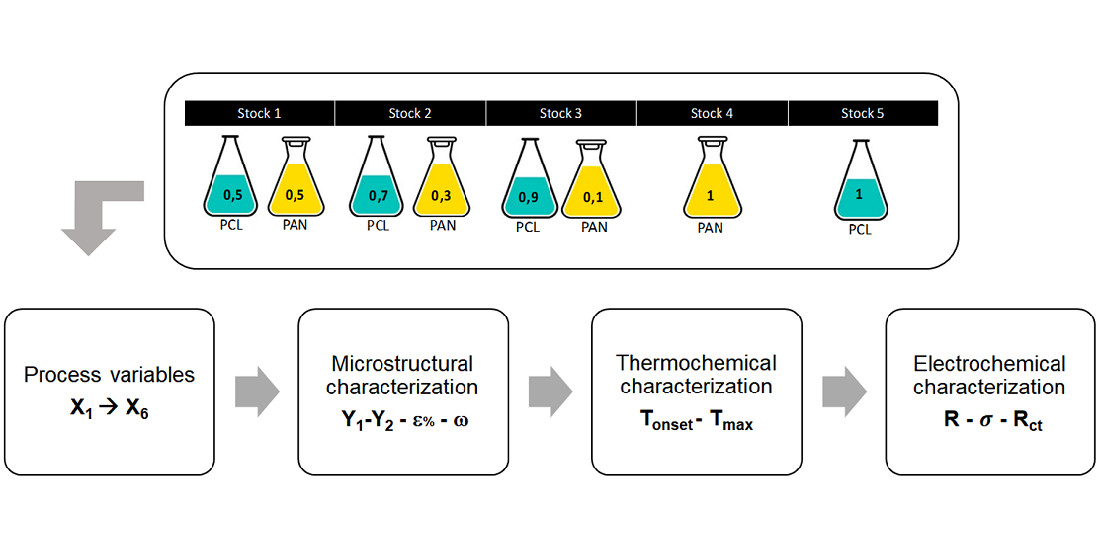
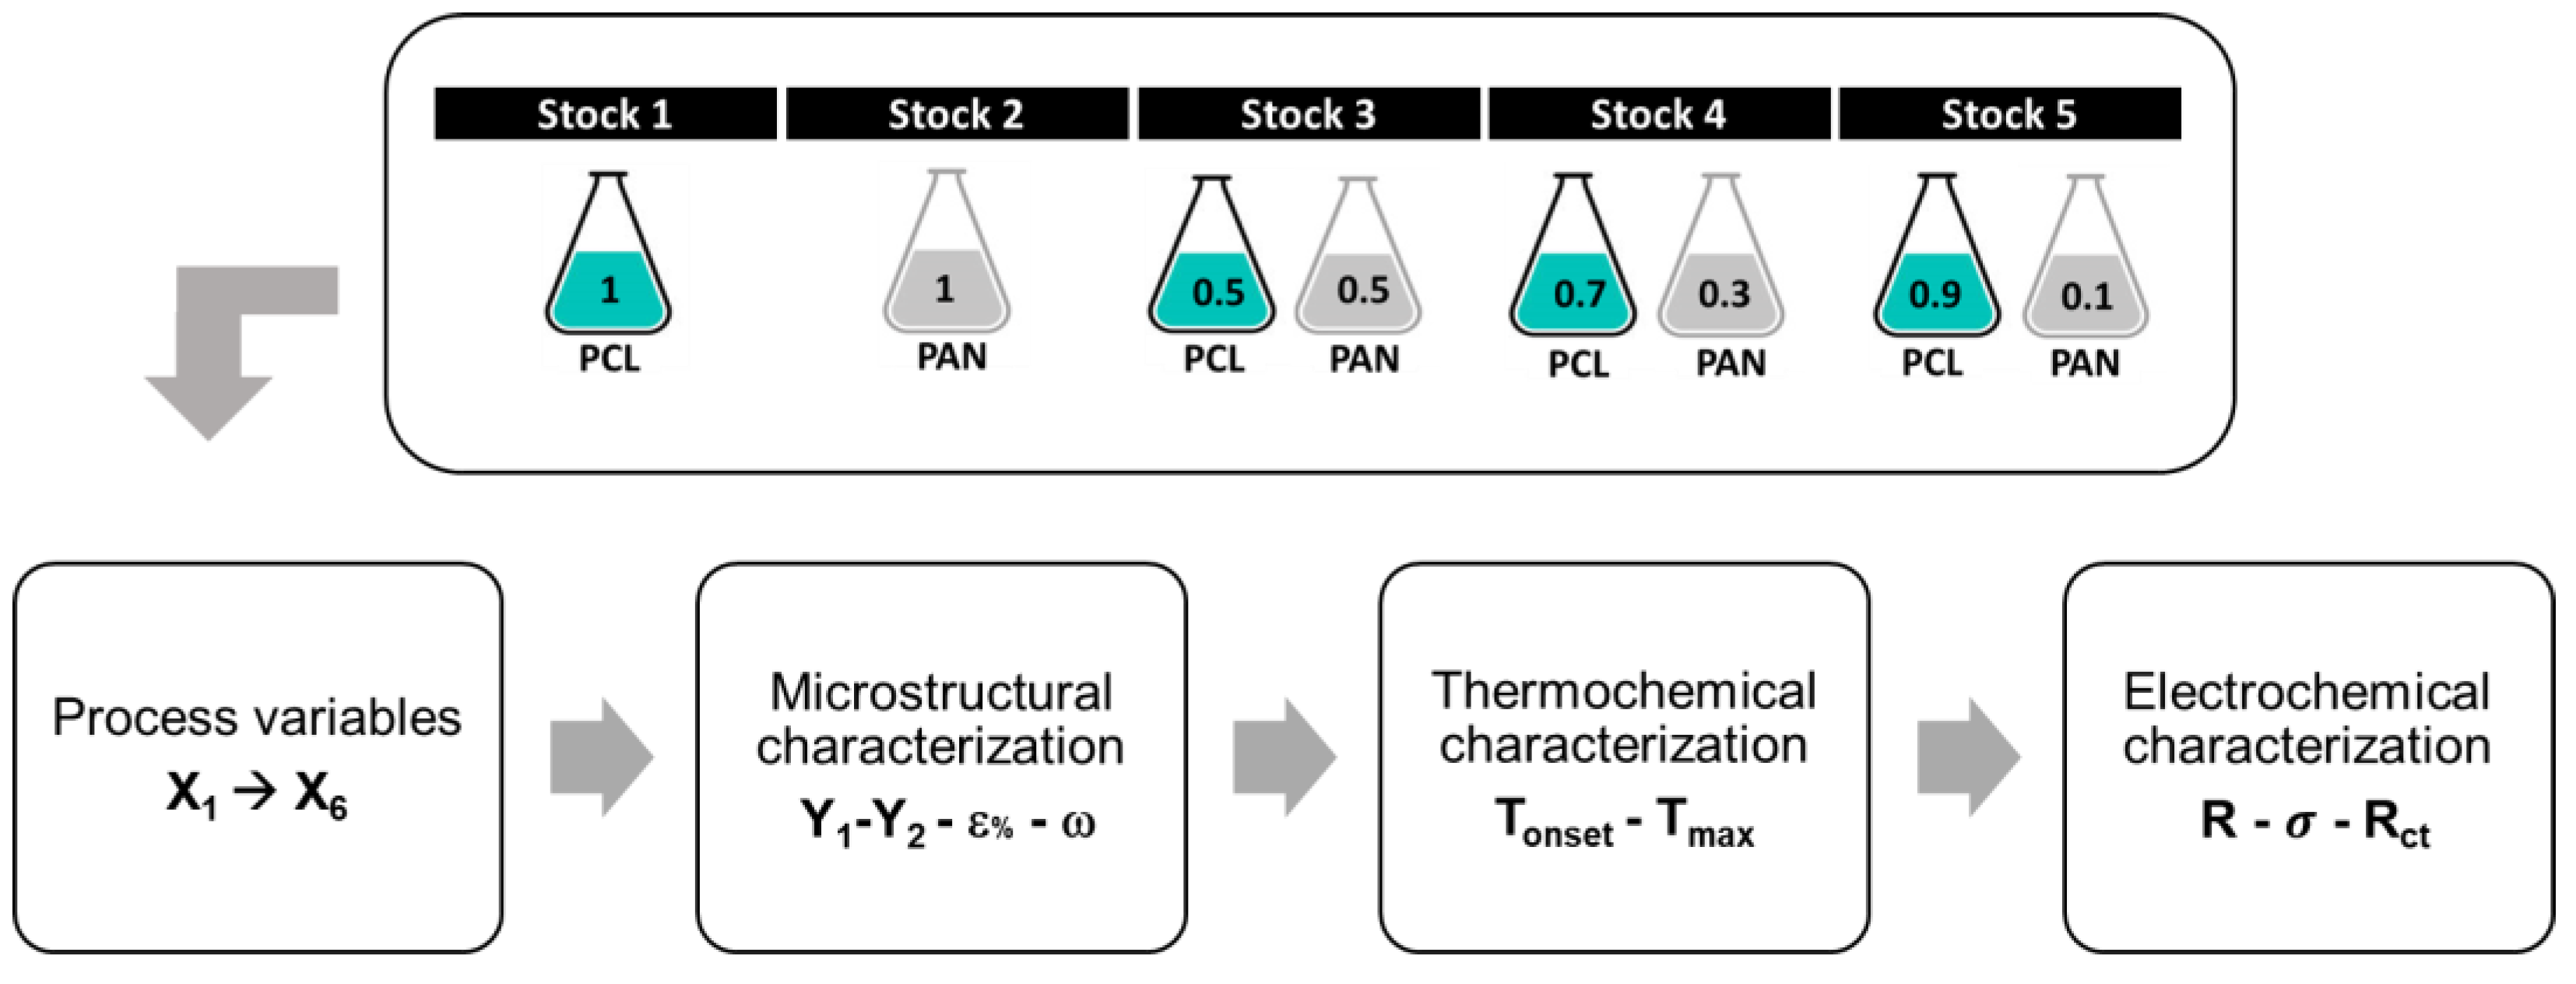
2.1. Membranes Production by Electrospinning Manufacturing

PCL e PAN stock solutions were obtained by dissolving 12 wt.% PCL (CAPA 6500, Perstorp©, Perstorp Holding AB, Malmö, Sweden, 50,000 MW) and 12 wt.% PAN (powder, Aldrich) in DMF (≥99.8% ACS, VWR Chemicals BDH®). The electrospun separators were prepared using the stock solutions or mixed PAN/PCL solutions. Three binary mixtures were prepared, consisting of xi percent of PAN stock solution and (1 − xi) percent of PCL stock solution, with xi = {0.5, 0.7, 0.9}. The electrospun fibers were manufactured with a pilot electrospinning station (Fluidnatek LE100, Bioinicia SL, Valencia, Spain) equipped with a stationary planar collector (x-y plane) measuring 40 cm × 40 cm, placed under a single mobile emitter driven on both x and y axes, with independent variable ranges and speeds for each axis, to cover the area of interest (roughly A6 sheet format in this specific case). The velocity of the needle along the x and the y axes was 50 mm min−1 and 5 mm min−1, respectively. The distance between collector and emitter along the z-axis was set at a fixed value of 12 cm. The emitter and the collector were connected each to its own high voltage generator capable of providing a maximum voltage difference of 60 KV, obtainable by polarizing up to +30 KV the emitter and at −30 KV the collector. The polymer solution was fed to the emitter at a tuneable flowrate. The relative humidity (RH) and ambient temperature during the deposition process were recorded.

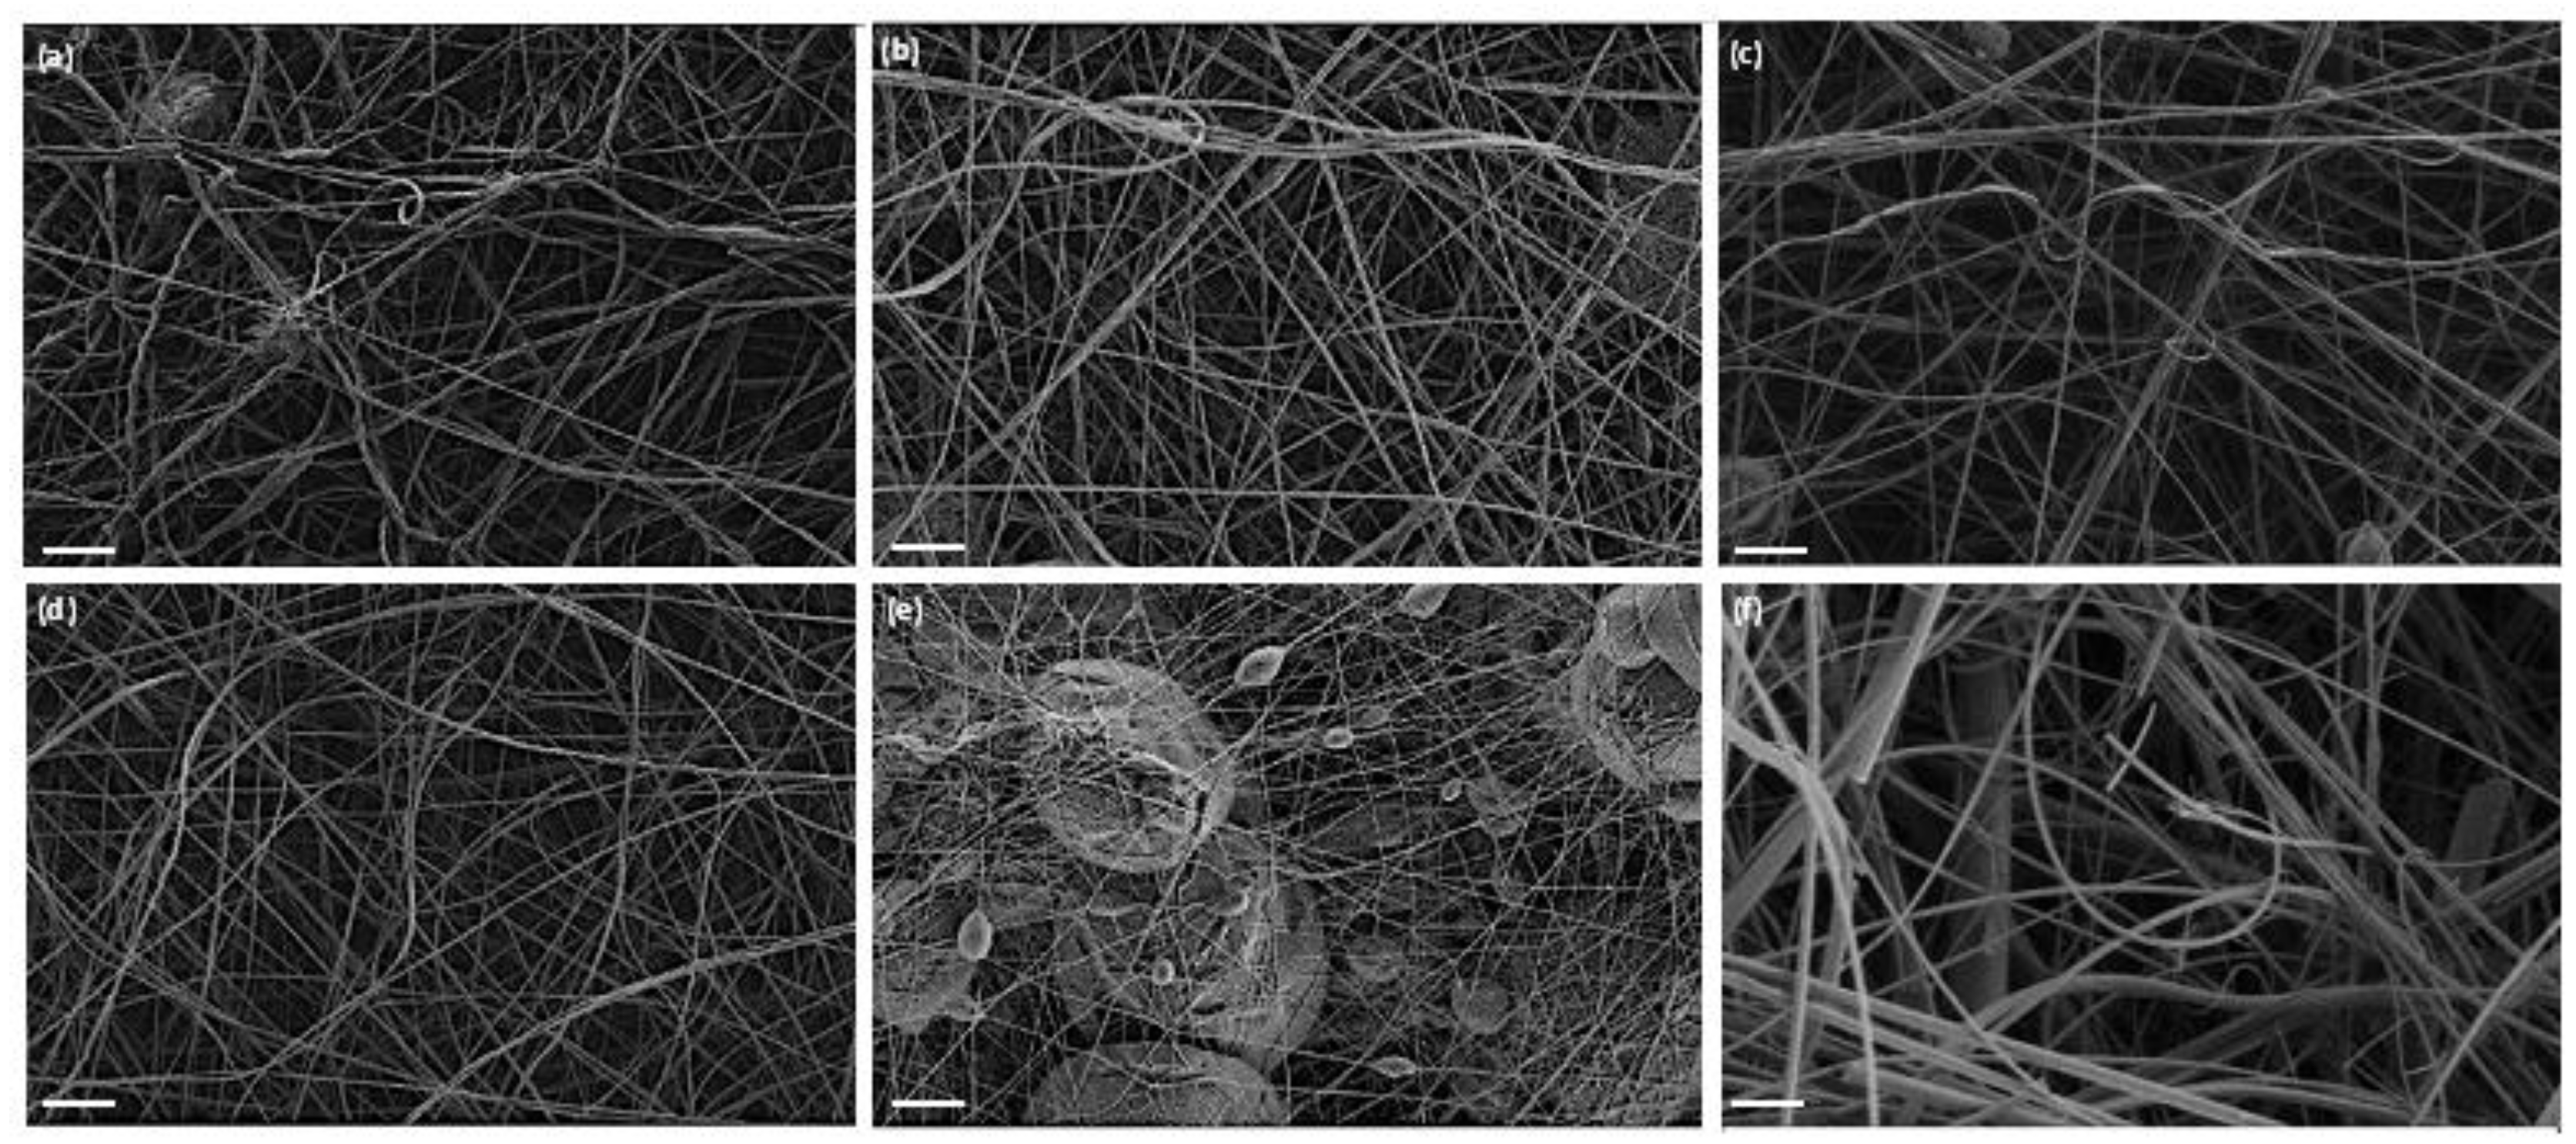
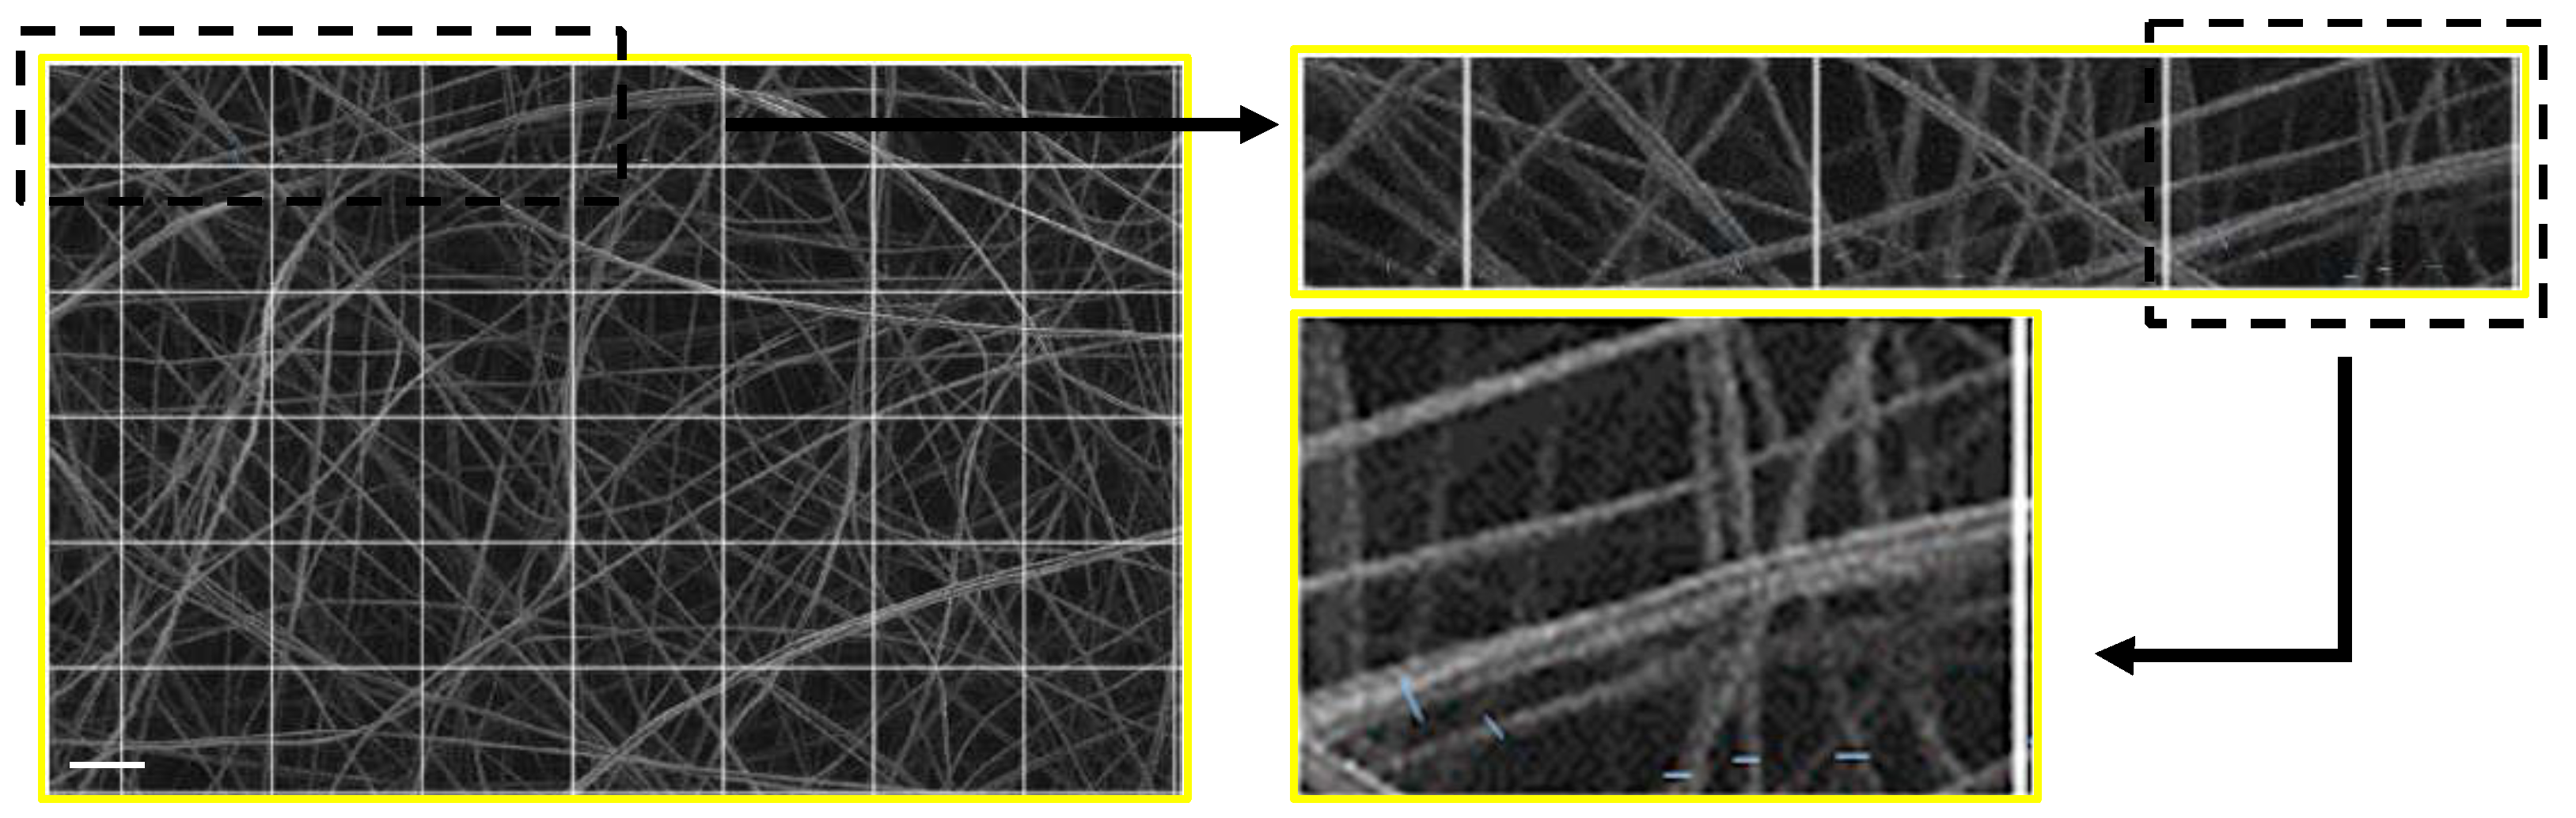
2.2. Microstructural Characterization and Porosity

Scanning electron microscopy (SEM) was used to characterize the microstructure and the membrane thickness, as it best allows the measurement of FDs in the micrometric and sub-micrometric range (Figure 2). SEM micrographs were obtained by a field emission gun SEM (FEG-SEM Leo1530, Zeiss, Germany) working at low accelerating voltage to conduct high resolution observations of the polymeric (inherently dielectric) separators without the use of conductive coating. The mean membrane thickness was measured from cross-view of cut-out samples, averaging over locations per sample.
The porosities of the electrospun membranes were measured using the liquid penetration method, also known as liquid displacement method, as implemented in [33,34]. Ethanol (Merck, Darmstadt, Germany) was chosen as penetrating liquid because it could permeate through the porous membrane without swelling or shrinking the material, while having lower density (ρEtOH ≅ 0.790 g/mL) than the polymers under consideration. The percent porosity ( ε % ) was evaluated as
ε% = (m3 − m4 − m1)/(m2 − m4) × 100
by determining the weights m1, m2, m3, and m4 by a scale (ORMA, BCA120, UK) at a temperature of 20 °C. For any given piece of membrane of arbitrary shape, m1 is the “as-dry” weight, m2 is the weight a “control” graduated bottle filled with ethanol up to a given “control volume”, m3 is the weight of the same bottle after the piece of membrane is inserted and immersed in the ethanol and the displaced excess volume of ETOH is carefully removed with a pipette to re-establish the control volume, and finally m4 is the weight of the bottle with the remaining ethanol after the wet membrane is removed.
From the measurement of the average FD and of ε % , it is also possible to indirectly obtain a first order estimate of the pore size distribution fitting the porosity network from the statistical model by Eichhorn and Sampson [35,36] providing the average pore radius ( ω )
ω = average   FD l n 1 / ε %

2.3. Regression Modelling of Microstructural Properties

Linear regression models provide relationships of engineering usefulness to link the properties of one membrane with the process variables, here including control parameters and environmental variables. Limiting the scope to microstructural properties only, linear models can render first order approximations of the dependence of each output variable (Yi in Table 1) on the process variables (Xi in Table 1). Equation (3) shows the general form of a regression model in case of three regressors.
y = C0 + Cixi + + Cijxixj + Cijkxixjxk → (i, j, k = 1 to 3)
Each membrane in Table 1 corresponds to a unique combination of Xs levels, called “treatment”. The output data obtained from experimental characterization is correlated to the corresponding Xs by means of analysis of variance (ANOVA), aided by modern statistical packages such as JMP-pro (SAS Institute, Cary, NC, USA) or MINITAB© (Minitab Inc., State College, PA, USA). The analysis here was aimed at the search of optimal models with fewer parameters as implemented by means of a subset analysis. Table 1 shows the process parameters, the environmental variables, and the output variables. Given the high number of variables and in agreement with [37], in developing the model we used at most three parameters and we selected the best model according to the Cp-Mallow technique [38].
The model is fitted in coded variables x*, obtained from the natural variables by linear transformations:
x i * ( x i ) = x i x ¯ i   x H I G H x L O W / 2     ( i = 1 to 3 )
with HIGH and LOW mapping to maximum and minimum levels ranges in Table 1. Coding is implied throughout the discussion and in Equation (3), with the “*” superscripts omitted for readability sake. The actual order of treatments from Table 1 was randomized during execution of the experiment to mitigate the effect of any uncontrolled ambient variable.
In subset analysis, the Equation (3) is built by either adding or removing extra terms, for example removing an effect or interaction terms when statistically non-significant, i.e., exhibiting a “p-value” statistics higher than a threshold value (the “p-value” herein is defined as the probability of randomly observing a certain value against a reference statistical distribution). A significance level of 10% is used throughout the discussion as it yields adequate sensitivity in our analysis to discriminate between significant and non-significant terms in Equation (3) adapted to our data. The reader is redirected to reference [38,39] for more details about p-value and hypothesis testing.
To assess the quality of the resulting design of experiments model from ANOVA the coefficient of determination R2 is the first indicator for the quality of fit and represents the percent of the variation to 100% as the fitting improves. Because the R2 monotonically increases with the number of parameters p in the model (excluding the constant term), it is often appropriate to consider also the R2adj:
R a d j 2 = 1 ( 1 R 2 ) p n p 1
which is always less than R2 and adjusts the R2 for the number of predictors (p) relative to the number of data points (n) in multiple regression models encompassing two or more terms.

2.4. Thermochemical Characterization

The thermal degradation of the electrospun membranes was studied using a TA Instruments Q600 system analyser, using high purity aluminium oxide as the reference material. The nickel Curie point was used as a reference to calibrate the temperature. The temperature at which the thermal phenomenon began was calculated by the thermal analysis software (Universal Analysis version 4.3) as the point where the inflection of the weight vs. temperature intersected the baseline. High purity alumina crucibles were used to perform the analysis. The samples, weighing about 6 mg, were placed in the crucible and the temperature was increased from room temperature up to 650 °C. The heating rate was set at 10 °C min−1. The measurement was carried out both in air and nitrogen atmosphere. The gases were fluxed at 100 mL min−1.

2.5. Electrochemical Tests

The electrochemical properties of the membrane as battery separator and the cycling properties of cells were investigated by using coin-type cells (CR 2016). A commercial solution (LP30, Merck, Darmstadt, Germany) consisting of 1.0 M LiPF6 in a 1:1 ethylene carbonate/diethyl carbonate mixture was used as the electrolyte. The membranes were all immersed in the electrolyte solution so that this could penetrate inside them. After a given period, the membranes were dried between two sheets of blotting paper. The separators soaked in the electrolyte solution were inserted between two 1.4 cm diameter lithium metal electrodes. AC impedance spectroscopy was performed with a frequency response analyser (Solartron 1260, Solartron Analytic, Farnborough, UK) over a frequency range of 1 MHz to 0.1 Hz. Electrode tapes were prepared by a wet aqueous method by casting a slurry consisting of 70 wt.% lithium iron phosphate (LFP, Süd-Chemie, München, Germany), 20 wt.% Super-P carbon black (Super P, MMM Carbon, Belgium), and 10 wt.% ethyl vinyl acetate (Vinavil SpA, Milano, Italy) used as binder, onto an aluminium foil backing. Then, the tape was heated at 100 °C to remove the solvent. Disks with a diameter of 12 mm were die-punched from the tapes and used as electrodes. The electrodes were impregnated with the same electrolytic solution used to soak the membranes (i.e., LP30). A 14 mm diameter lithium disc was used as anode. The weight of the electrodes varied between 7.32 mg and 12.64 mg, corresponding to a weight of active material between 5.13 mg and 8.85 mg. The theoretical capacity of the electrodes was estimated between 0.87 and 1.50 mAh. Charge and discharge were carried out galvanostatically at 0.1 C and at various current rate as 0.1 C, 0.2 C, 1.0 C, 2.0 C, 3.0 C, and 5.0 C between the cut-off potentials of 2.0–4.2 V vs. Li/Li+. Cycling was carried out using a series battery tester (Maccor 4000, Maccor Inc., Tulsa, OK, USA). Materials handling, cell assembling, and testing were performed at 20 °C in a dry room (RH ≤ 0.1% at 20 °C). To compare the results obtained with the electrospun membranes, a commercial glass microfibre filter (GF/B Grade Whatman, Aldrich) was used as a reference.

3. Results

3.1. Membranes Production

Twelve prototype membranes were prepared by varying composition, flow rate, or deposition time, as summarized in Table 1 that shows the labels of the different polymeric membranes, along with the composition, the deposition parameters, and the environmental variables set or recorded for each run. The percent content of PAN was increased from 50% up to 90% by mixing the stock PAN and PCL solutions accordingly, up to full homogeneity. The choice of screening such a wide span of mixing ratios between PAN and PCL was dictated by the purpose of ascertaining the role of PAN (in replacement of PCL) towards an improved separator with increasingly bettered electrochemical stability inherited from an increasing content of PAN, while monitoring the corresponding transformation of the microstructure. 100% PAN or PCL membranes were also produced by employing the two stock solutions and used as controls to interpolate experimental data over the entire mixing range. Figure 2 shows the SEM micrographs of membranes obtained with different PAN/PCL ratio.
All the samples, except for the stock PCL 100% one, have a filamentous structure, with long and thin fibers that closely resemble the microstructure of the glass fiber used as reference. The occurrence of fibers with slightly varying diameter along variable their length is acceptable considering that the purpose of this study was to use a recipe with some set parameters (e.g., voltage, working distance) for all blends under consideration. In this regard, the formation of beads (i.e., corpuscular polymer clusters of relatively large dimensions) is also associated to a non-optimized recipe. Noteworthy, beads are not observed in presence of PAN. On the contrary, the PCL 100% sample appears formed by fibers mixed with beads. In the case of PCL, though, it is important to note that the DMF-based protocol, applied in this work to ensure a complete mixability with PAN, does not return the same microstructure from our previous work on membranes made of pure PCL [31]. Yet, while not a morphologically identical replica, the new PCL sample retains the fundamental character of the original PCL separator.
Figure 3 shows the fiber sampling approach adopted to estimate the sampling fiber distribution, which is assumed normal and is fully characterized by the mean value and the mean square error. The distribution of the fibres was estimated for each sample from the frequency distributions obtained by measuring the FDs detected on the top-view micrographs of proper magnification (i.e., 5000× in this case), according to a typical methodology for fibrous samples [37,38,39]. The sampling of the fibers was obtained by counting the FDs that intersect one family of parallel lines, ensuring to count each fiber only once (Figure 3). By assuming a continuous and normal (unimodal and symmetrical) reference distribution of the fibers, the sampling distributions from N observation is considered an acceptable estimation of the reference distributions for each sample, where the actual mean and standard deviation are estimated from the average diameter value and from the mean square error of the sample, which are then necessary and sufficient descriptors of the reference distribution for each sample [38]. Regardless from the hypothesis of normality of the distribution, the mean fiber diameter is, in general, a first order indicator of the fiber distribution for each sample while the standard deviation is a descriptor of the dispersion of the fibers with respect to the mean value. Apart from fiber distribution, the sample thickness was measured on cross section cut-out from the membrane using similar working condition for obtaining the SEM images.
The values of RH, along with the fiber distribution parameters Y1 and Y2, reveal at a glance that this environmental parameter strongly affects the FD distribution. It is well known that RH is a determining component during electrospinning as it governs charge dissipation and solvent evaporation [39].
For the membranes made with 50% or 70% PAN, the increase in RH is clearly associated with a significant increase in the average diameter, as well as in standard deviations. For the membranes containing 90% PAN (i.e., PANPCL_05 and 06 produced with closer values of RH) both the average and dispersion in fiber diameters are similar. The membranes of pure PAN, despite the very similar RH values, showed a variability in the average diameter of the fibers ranging from 0.38 mm to 0.54 mm. The membranes of pure PCL showed an increase in the average diameter of the fibers from 0.27 mm to 0.32 mm following the increase in RH from 50 to 56%.
In statistical terms, the content of PAN (X1) and the deposition time (X2) turned out to be the most important process parameters to control the membrane microstructure. However, to explain the variability with sufficient accuracy it is also necessary to consider the effect of the environmental variable RH (X3). The best models for Y1 and Y2 containing just main effects are reported in Table 2, indicating that the overall fit explains about 70% of the data variability and provide some insight in terms of the relative importance of each parameter X included in the model. Greater details about the results for Y1 (the mean FD) are offered by Table 3 and Table 4.
The former demonstrates what are the most relevant parameters when added one by one, whereas Table 2 reports the full ANOVA, with the p-value of each parameter. Remarkably while the parameter X2 would be not strictly significant at a p-value > 0.1, it is retained considering a more accurate model, with higher R2 and lower Cp-Mallow.
The model for Y2 was fitted following the same procedure and analogous considerations hold. Both models in Table 2 provide a useful tool to direct the manufacturing process and clearly highlight that the composition (X1) and relative humidity (X3) play the bigger role, which was one main objective of this study. As a refinement, the contribution from interaction terms was considered by repeating the subset analysis on the hierarchical models from Table 2 augmented with two-way interactions.
In this case, the subsets analysis renders two different scenarios for Y1 and Y2, since Table 5 highlights just a marginal improvement in the overall fit for Y1, whereas the search a Y2 model augmented with interaction X1*X2 renders a marked improvement in fit in Table 6, with R2 raising up at around 90%. Then, while the FD mean value in this dataset is mostly affected by main effects, the FD spread is significantly dependent on interactions.
The detailed analysis and model fitting for Y2 are beyond the present scope but the ANOVA analysis and fitted model for the augmented model of Y2 are reported in Table 7 for completeness, noting that the term X1 could be dropped from the equation to yield a simpler reduced model.

3.2. Thickness and Porosity

In addition to the determination of FD, the microstructural characterization also encompasses the measurement of the thickness and of the percent porosity ε % , which corresponds to the gross void fraction of these membranes. Table 8 reports the mean thickness, as well as the average and standard deviations of the ε % for all samples. The value ε % represents the basic descriptor of the open porosity network that characterizes these electrospun materials. The determination of the three-dimensional pore radii is a highly non-trivial task that can be pursed nowadays with nano and micro-tomographic tools, albeit out of scope in this paper. However, some analytical expressions, such as Equation (2), are available in literature to provide estimates for the average pore size starting from the knowledge of the FD and of ε % . The results are reported in Table 8 as well.

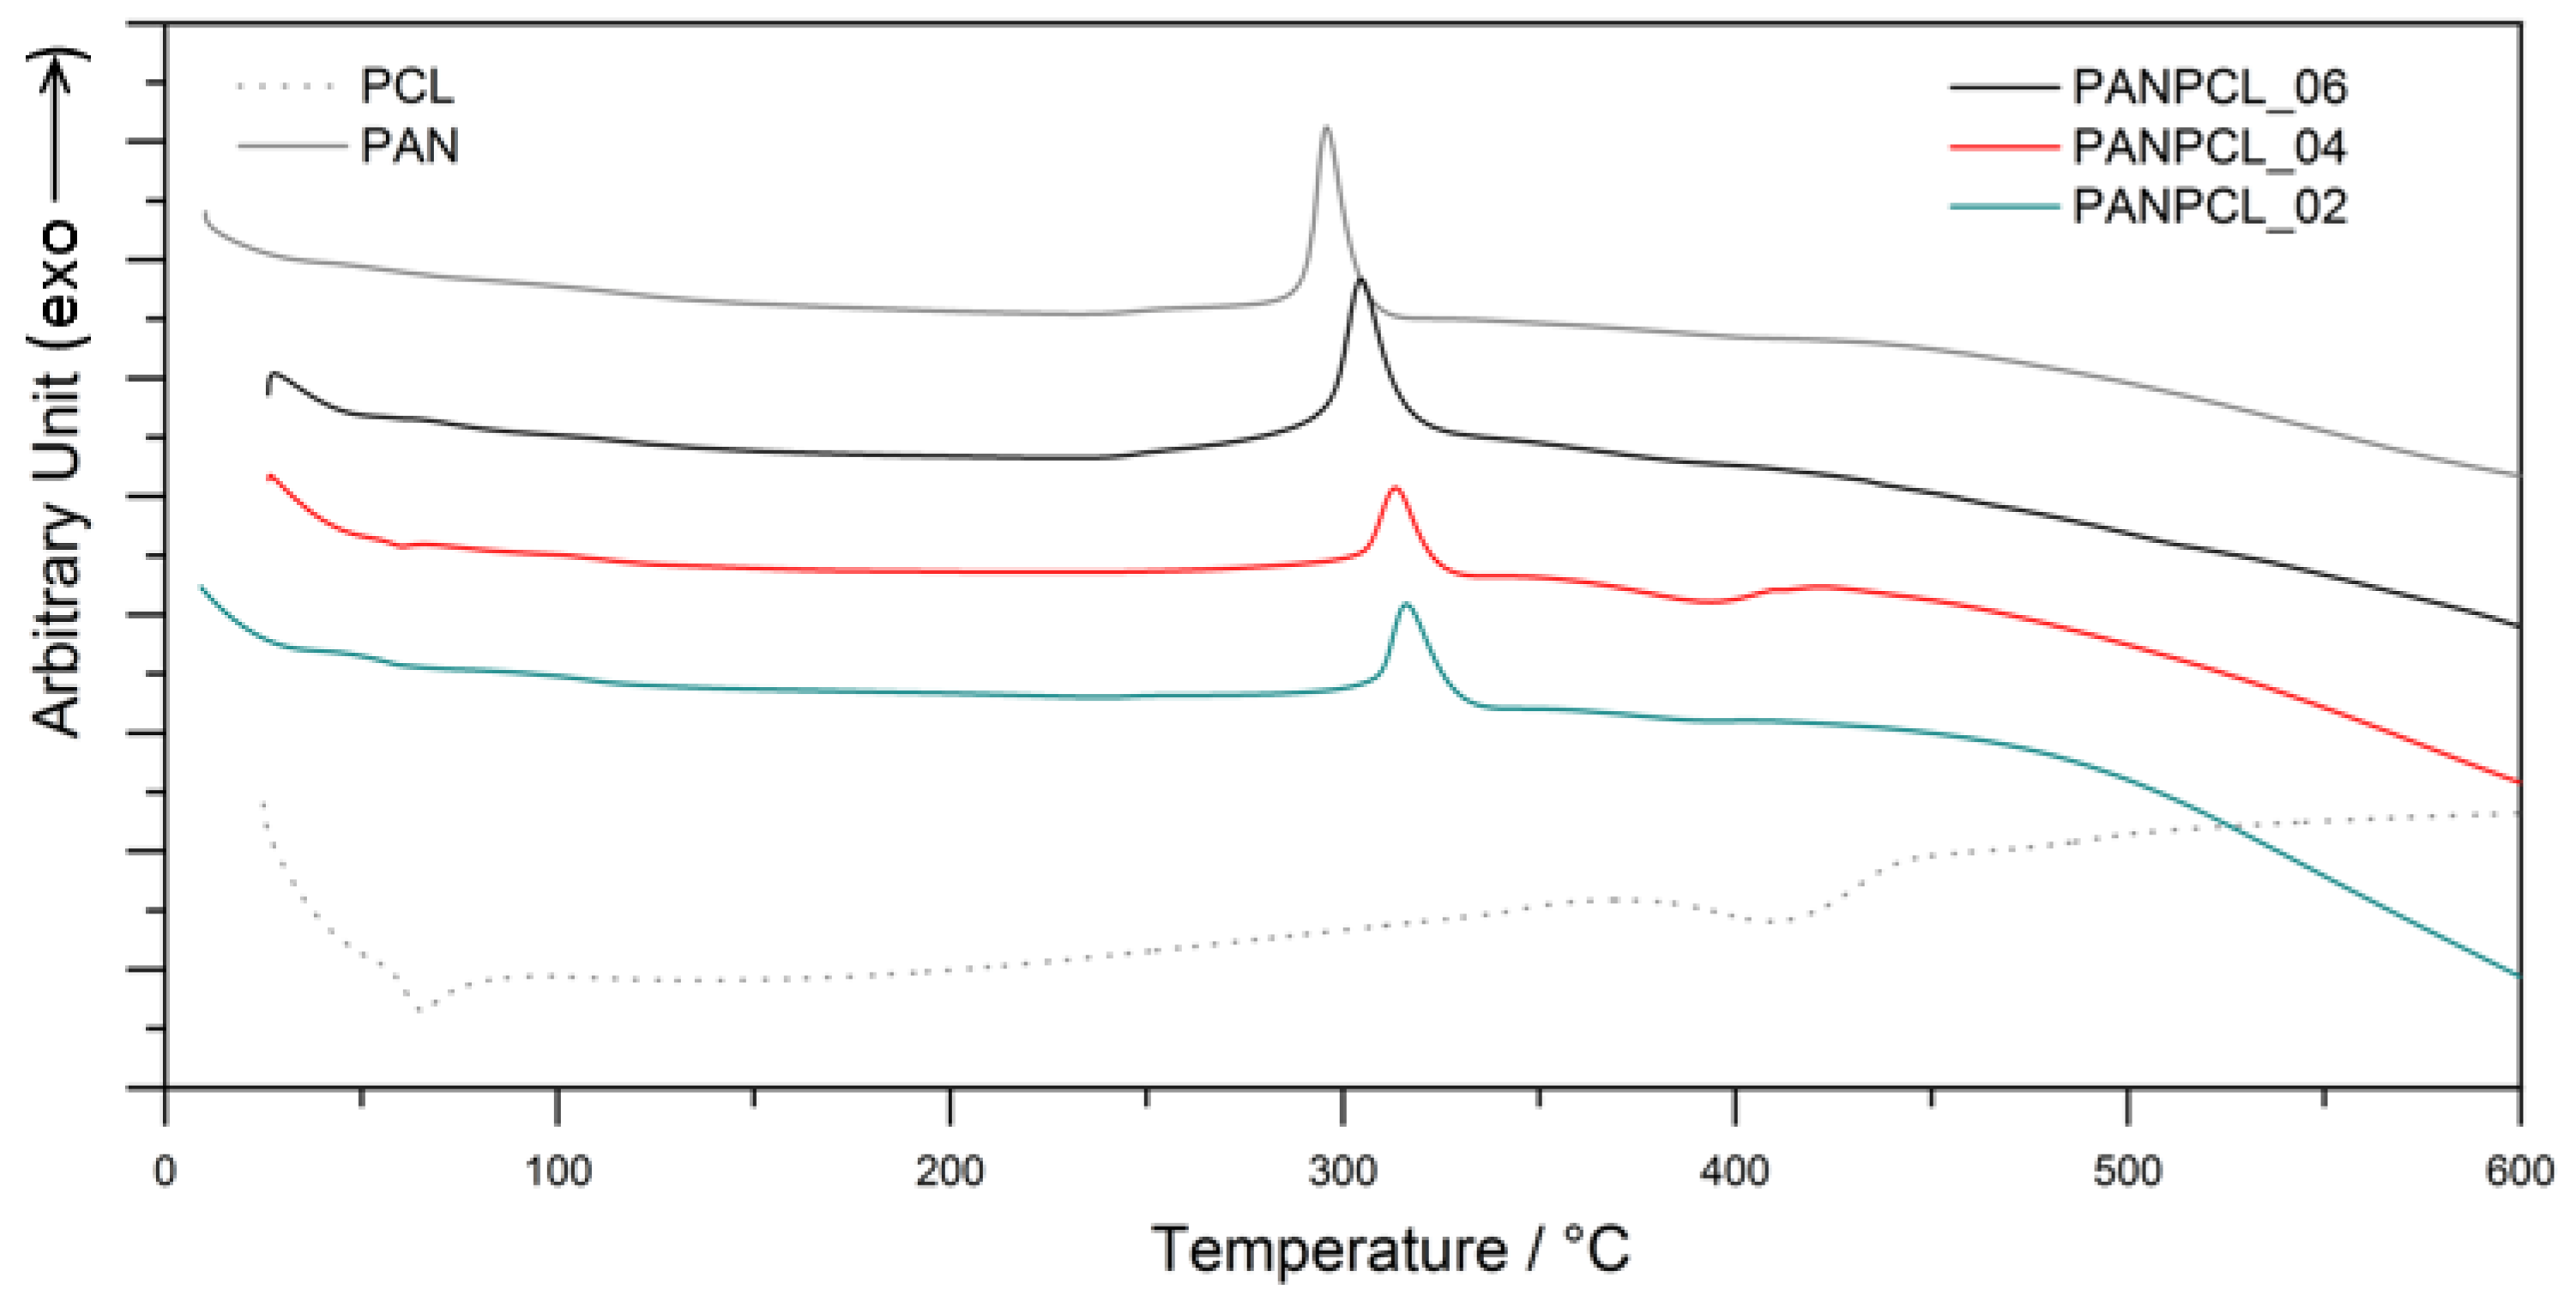
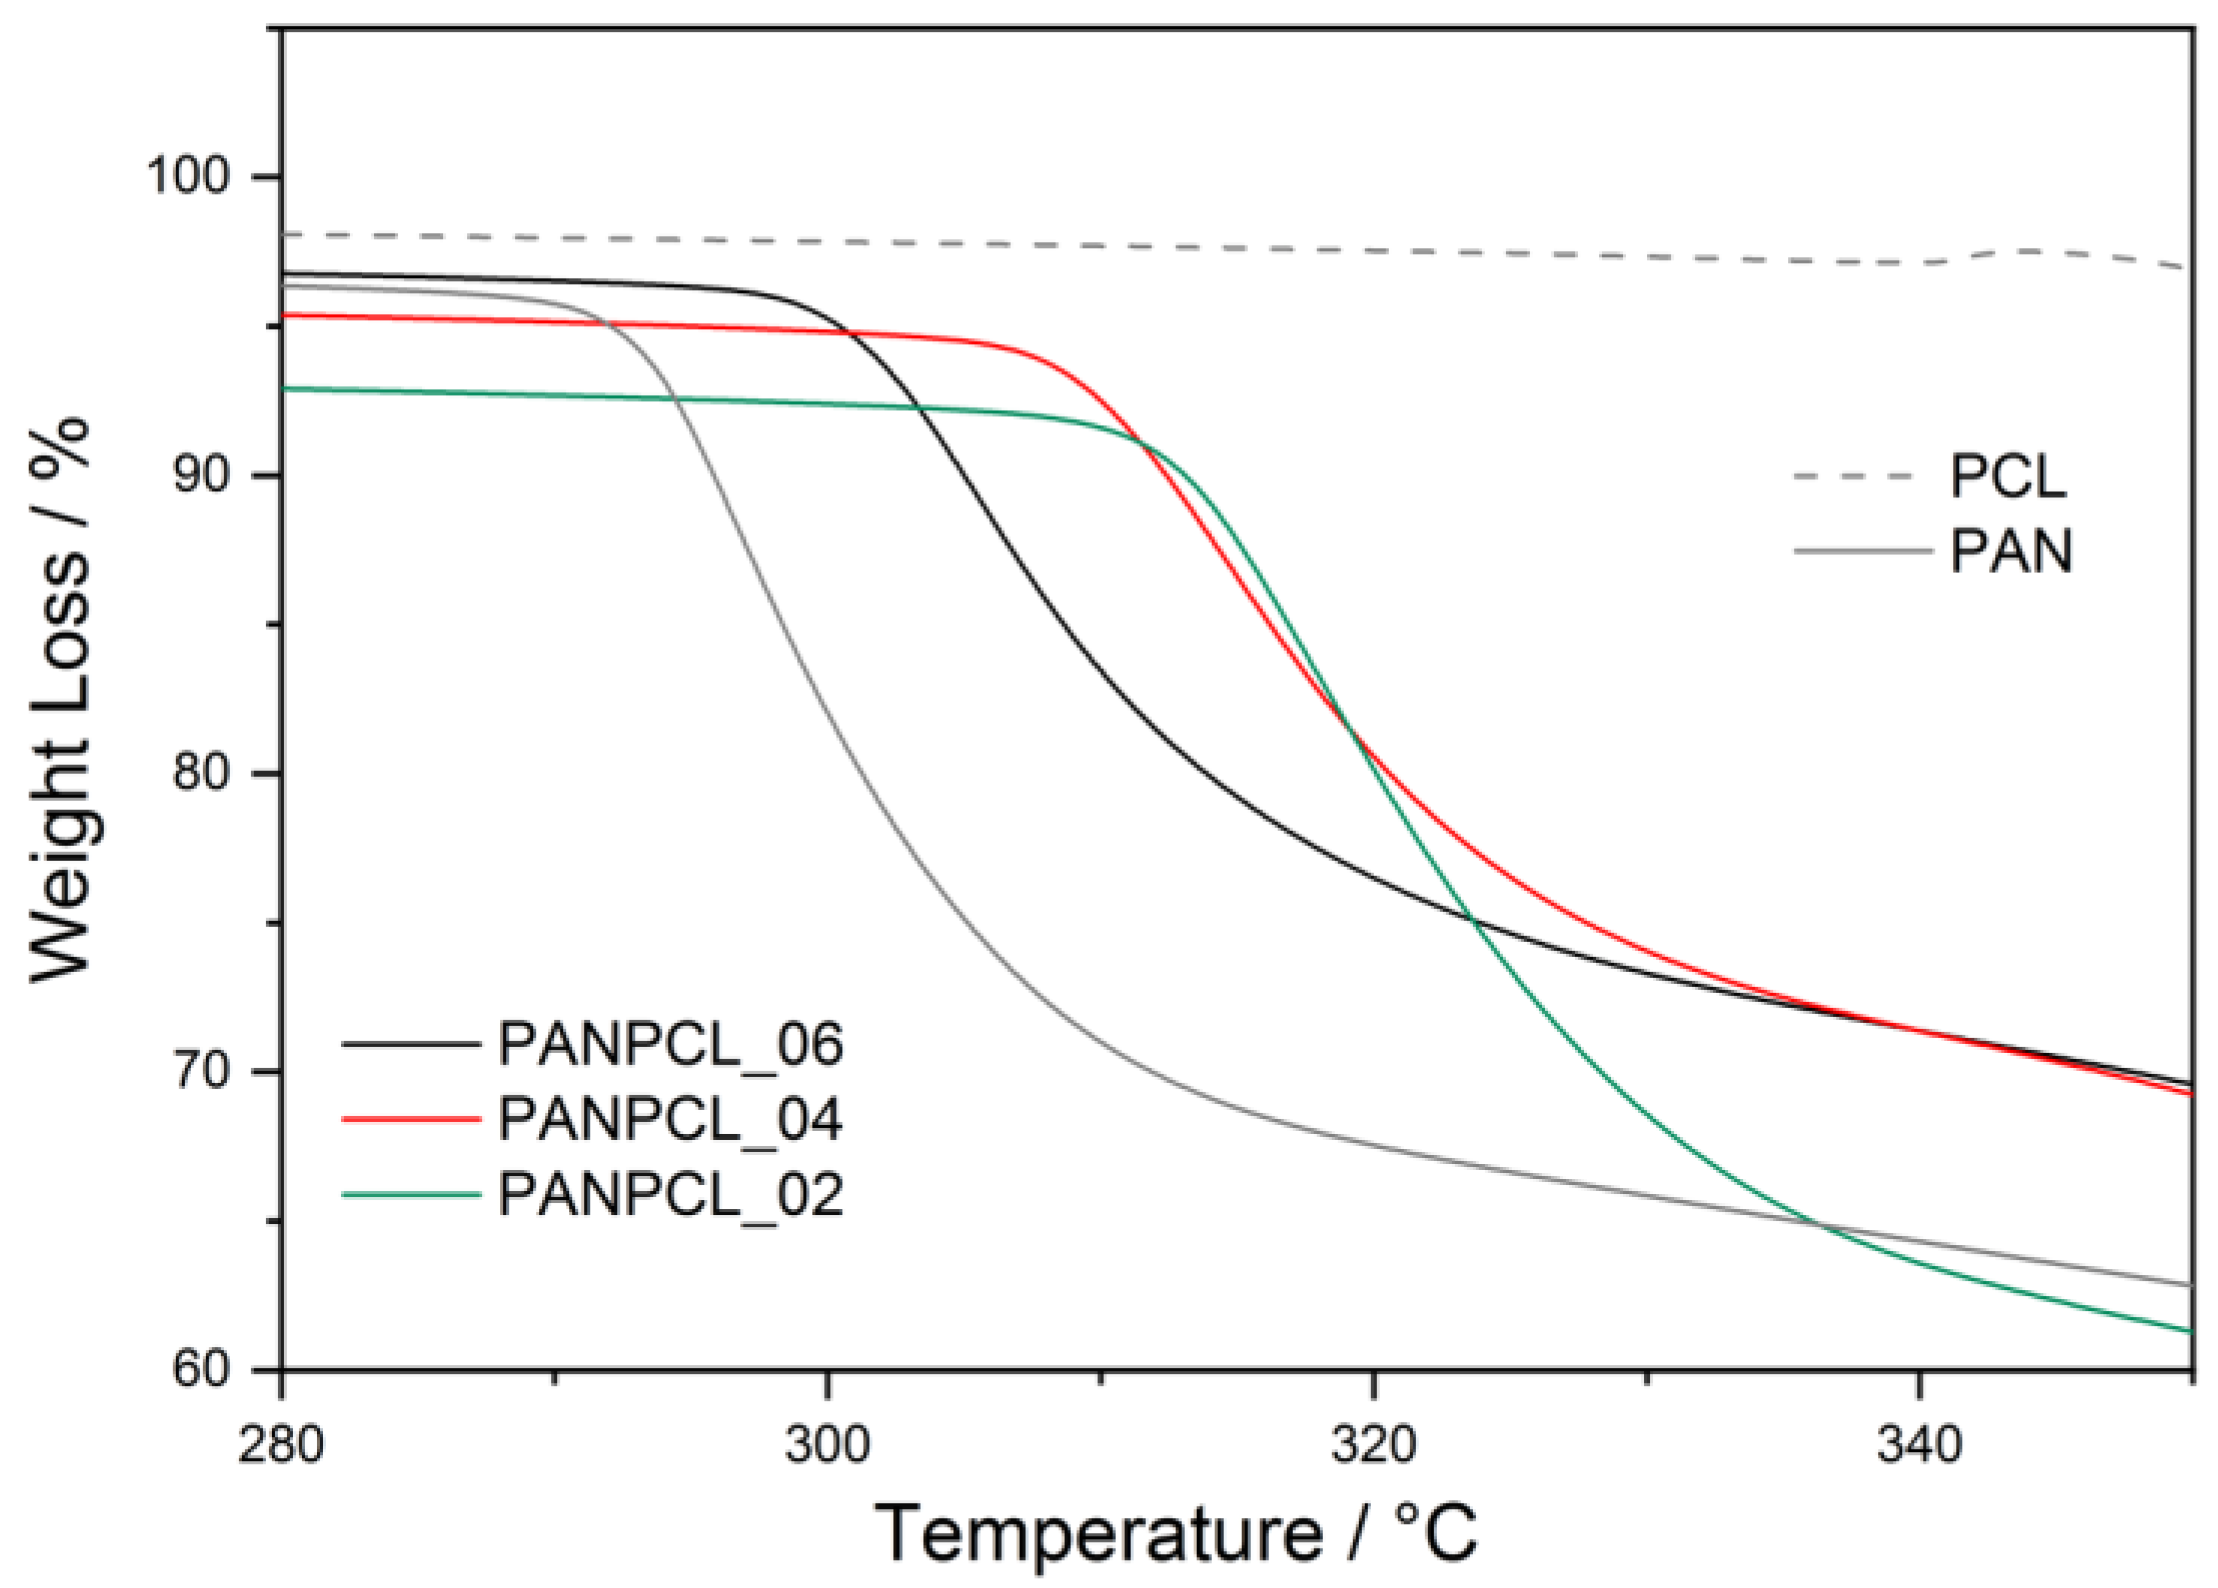
3.3. Thermochemical Characterization

The DTA curves for all binary mixtures of PAN/PCL are reported in Figure 4. For comparison, the DTA curves of pure PAN and PCL polymer have been also reported.
PAN exhibits a main sharp exothermic peak with its maximum value at 295 °C, corresponding to the degradation process. The slight shoulder al lower temperature, which shows the onset temperature of 238 °C, is attributed to the homopolymer cyclization process yielding a ladder type structure, as reported in the literature [40]. PCL thermal decomposition process, indeed, occurs at higher temperature and it is identified by a broader peak at about 400 °C. The polymer, moreover, shows a characteristic endothermic peak at about 65 °C, which does not correspond to any loss of weight (Figure 5) ad it is ascribable to the melting of the PCL crystalline phase [41]. From the comparison between the PAN polymer and binary mixtures, it is consistently observed that the stability of the polymeric mixture increases as the percentage of PCL increases. The exothermic peak associated with the decomposition of PAN, shifts upwards by 20 °C, towards higher temperatures. The onset temperature of the exothermic shoulder remains unchanged (see Table 9). PAN exhibits a main sharp exothermic peak with its maximum value at 295.5 °C, corresponding to the degradation process. The slight shoulder al lower temperature, which shows the onset temperature of 238 °C, is attributed to the homopolymer cyclization process yielding a ladder type structure, as reported in the literature [40]. Also, the PAN cyclization process is not affected by the composition of the mixture, showing that no chemical reaction between PAN and PCL occurs. A physical interaction can be responsible of the slight shift of PAN decomposition toward higher temperatures. A less effective mixing of the two polymers in PANPCL_04 sample could be the reason of the less evidence of PCL peaks on DTA curve.
Figure 5 shows the TGA curves of the separators in the significant temperature range between 280 °C and 350 °C.
Pure PAN starts degrading at 292.5 °C while degradation temperature of PCL is out of the range (about 400 °C as showed in Figure 4). In the mixture, the degradation temperature shifts towards higher value with the increasing of PCL percentage, reaching the onset temperature value of 311.75 °C in PANPCL_02 sample (PAN 50%).

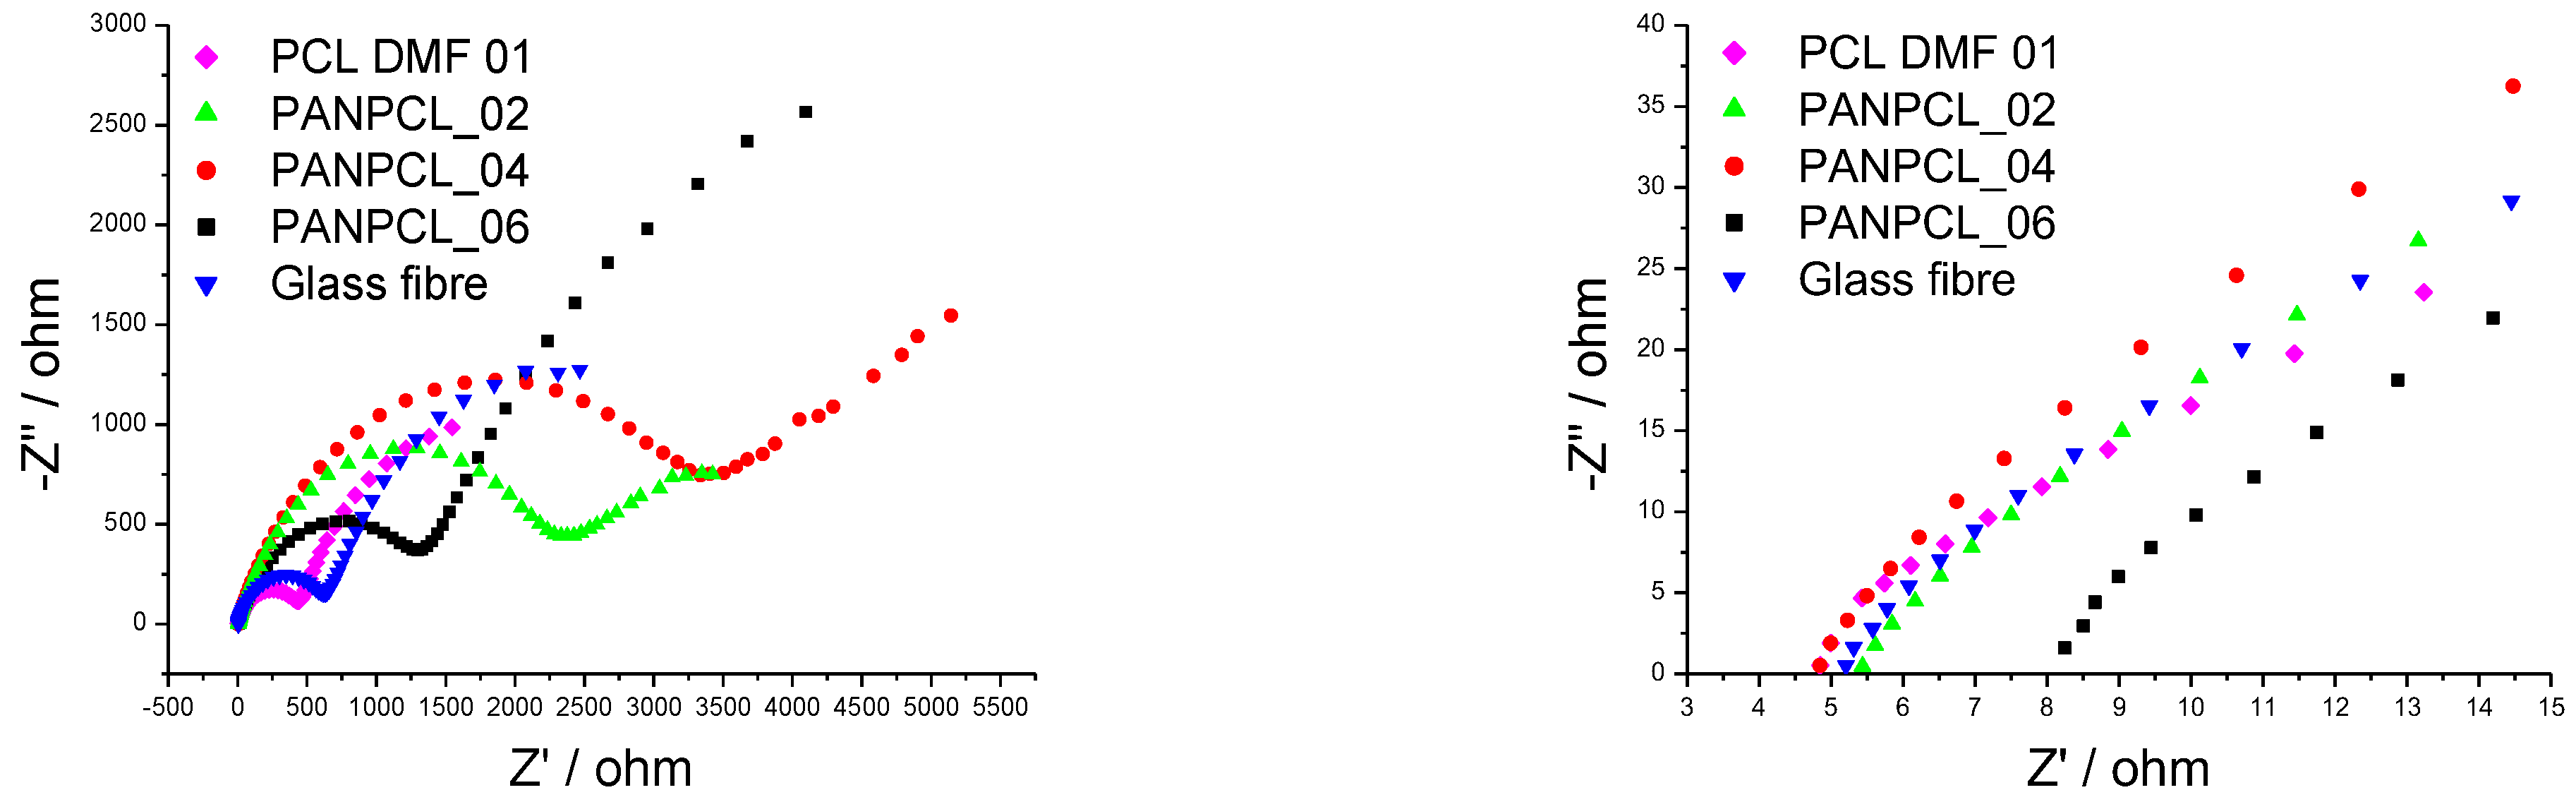
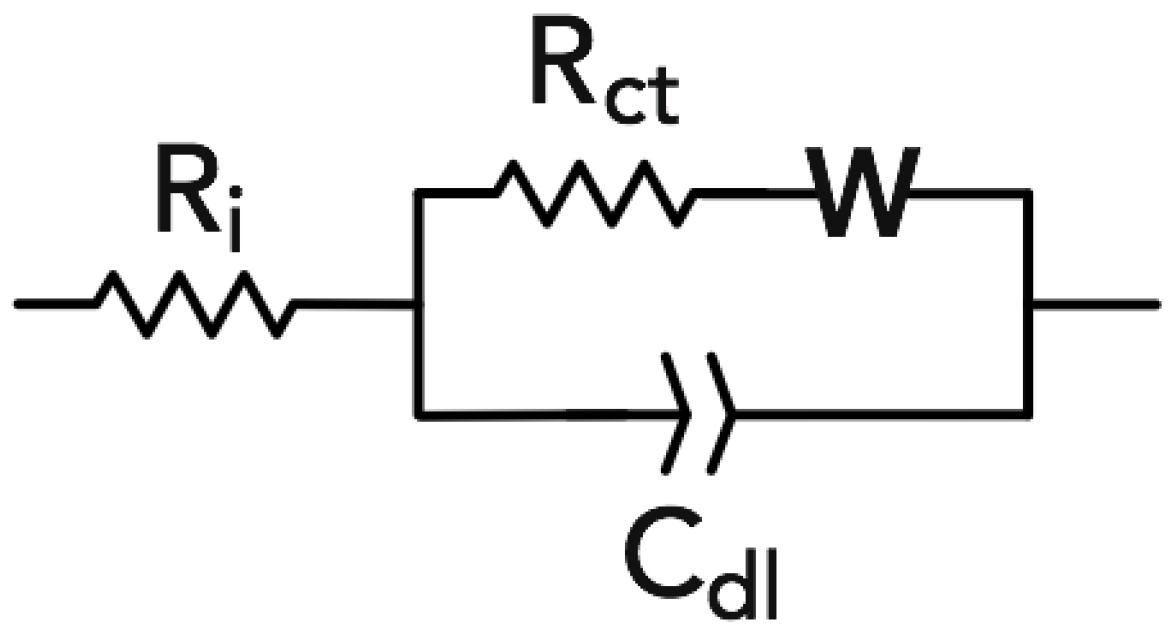
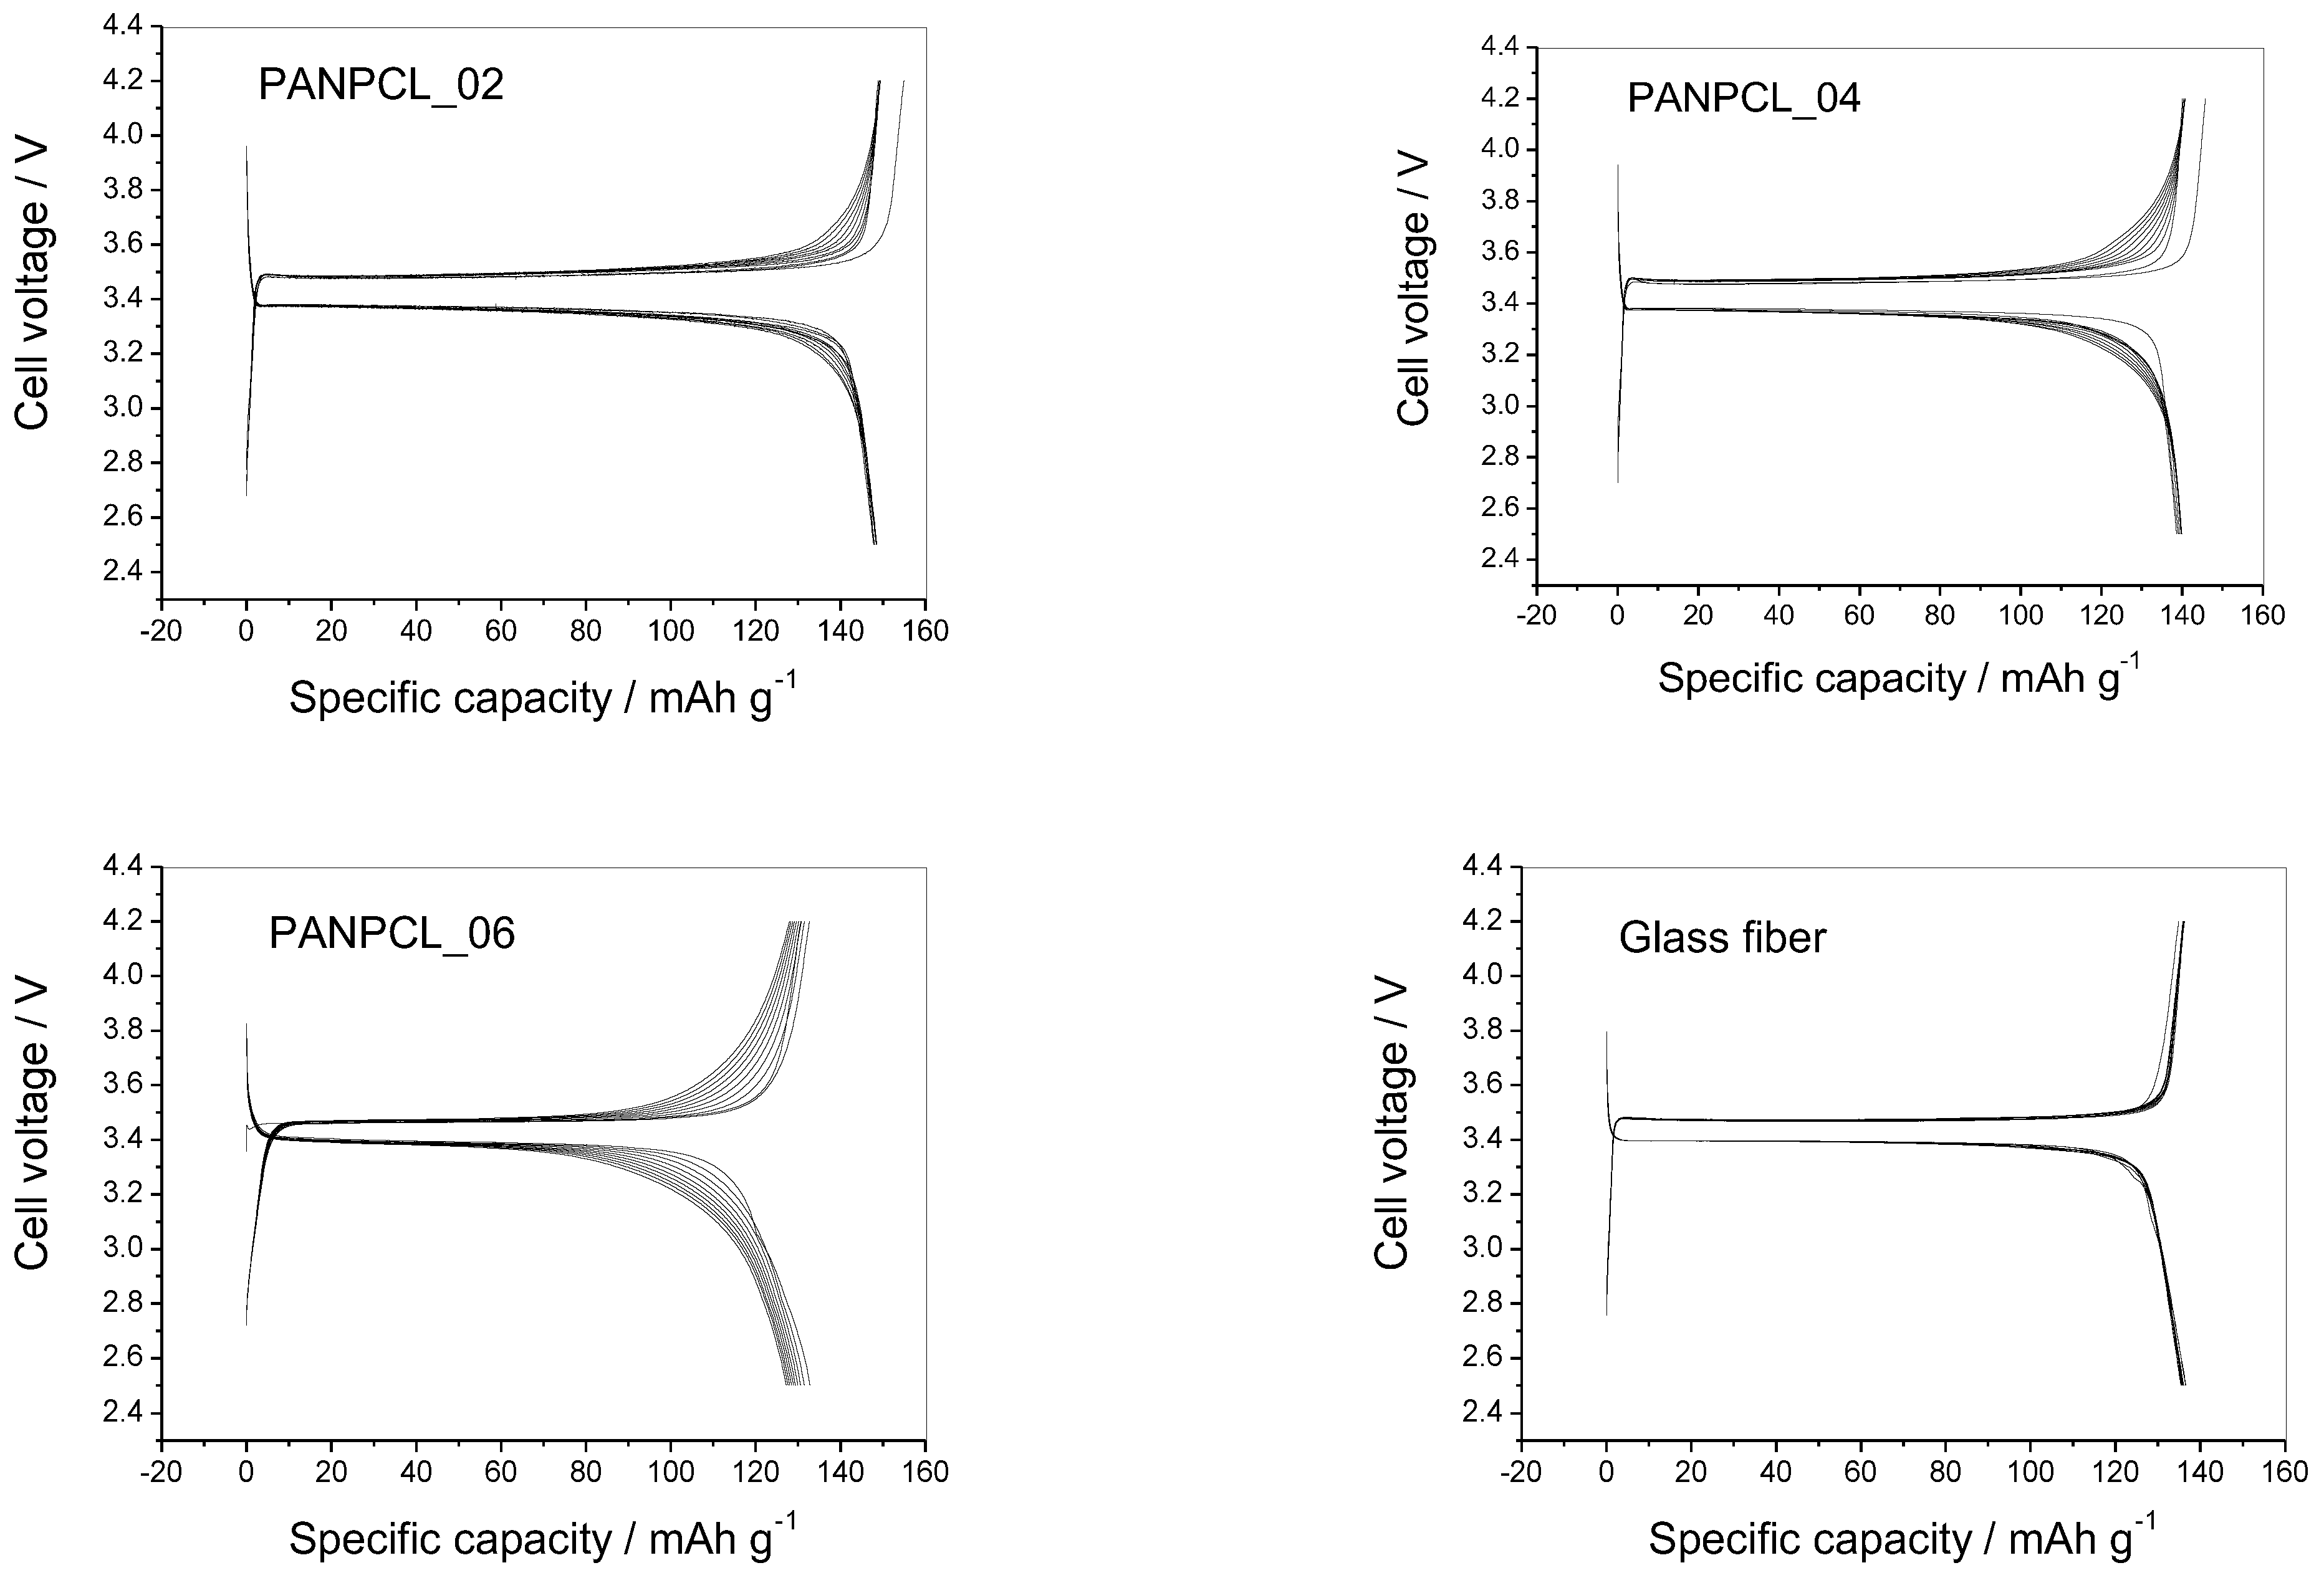
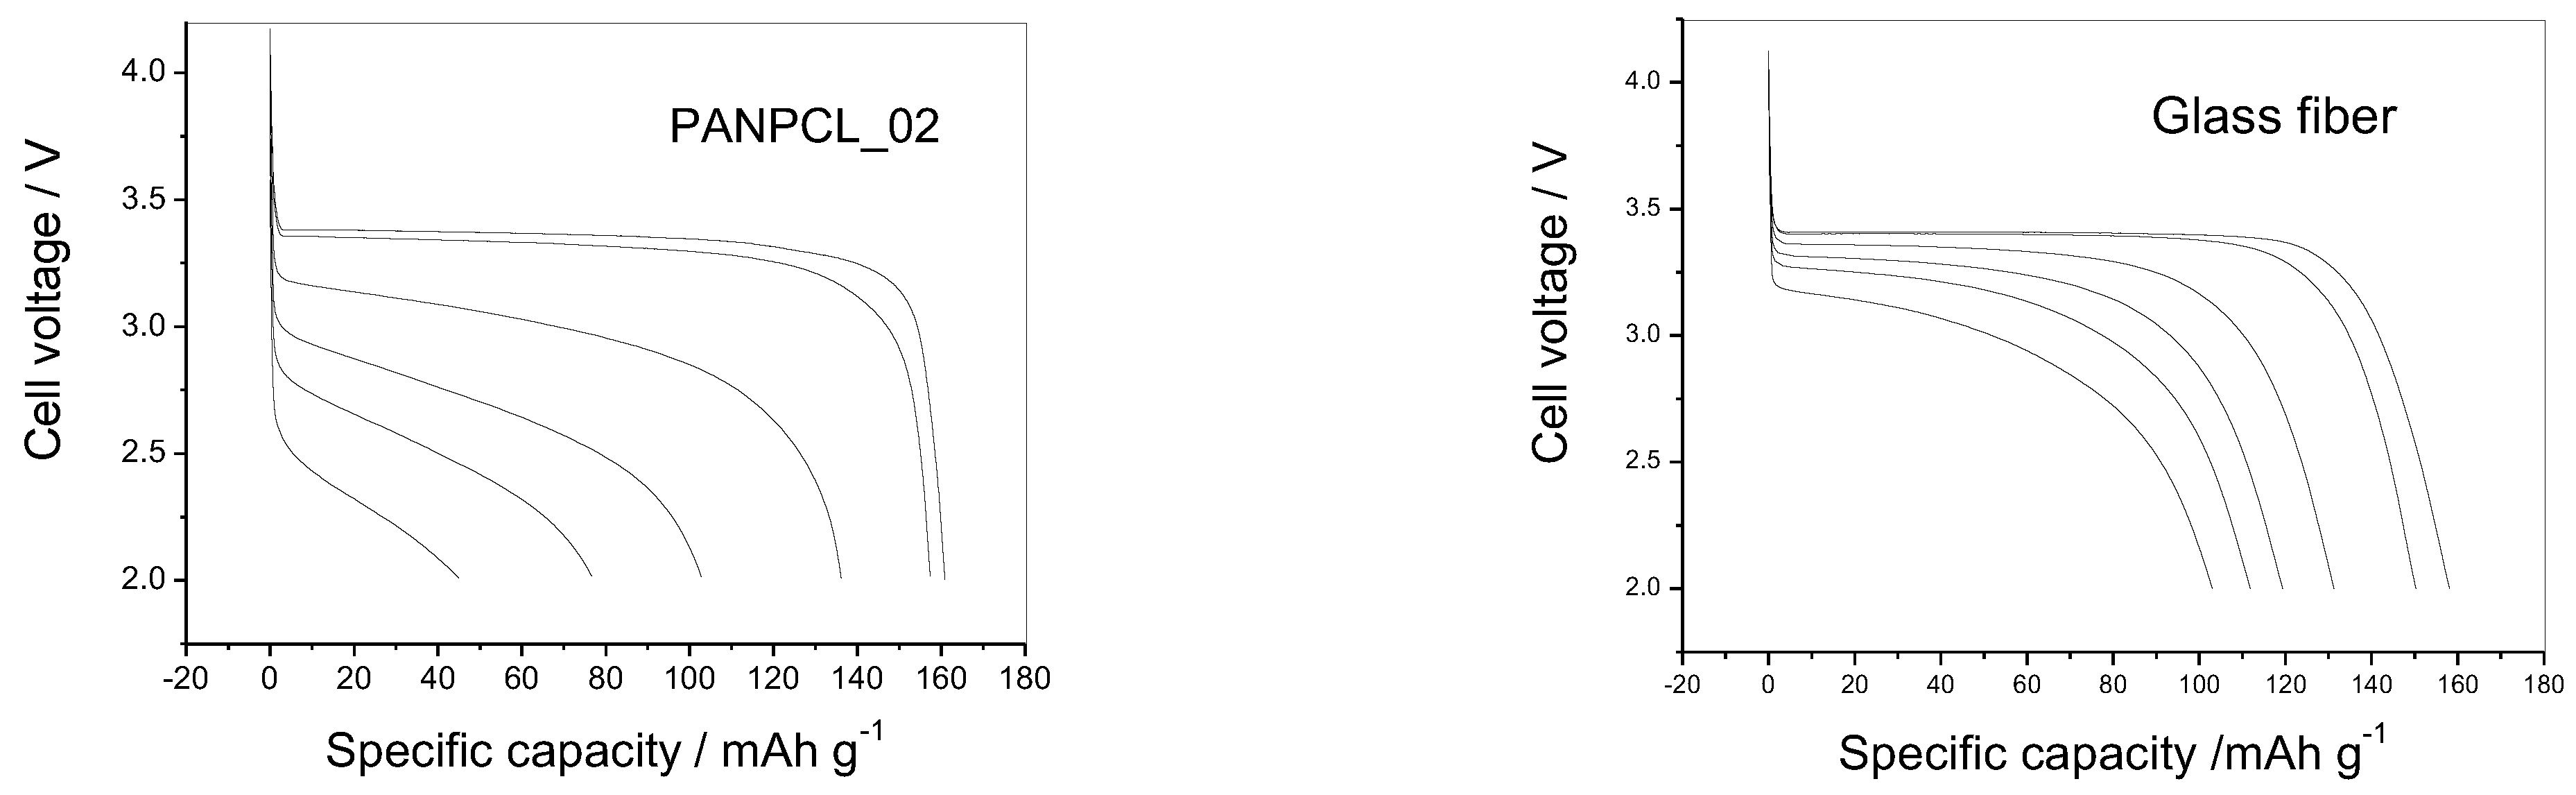
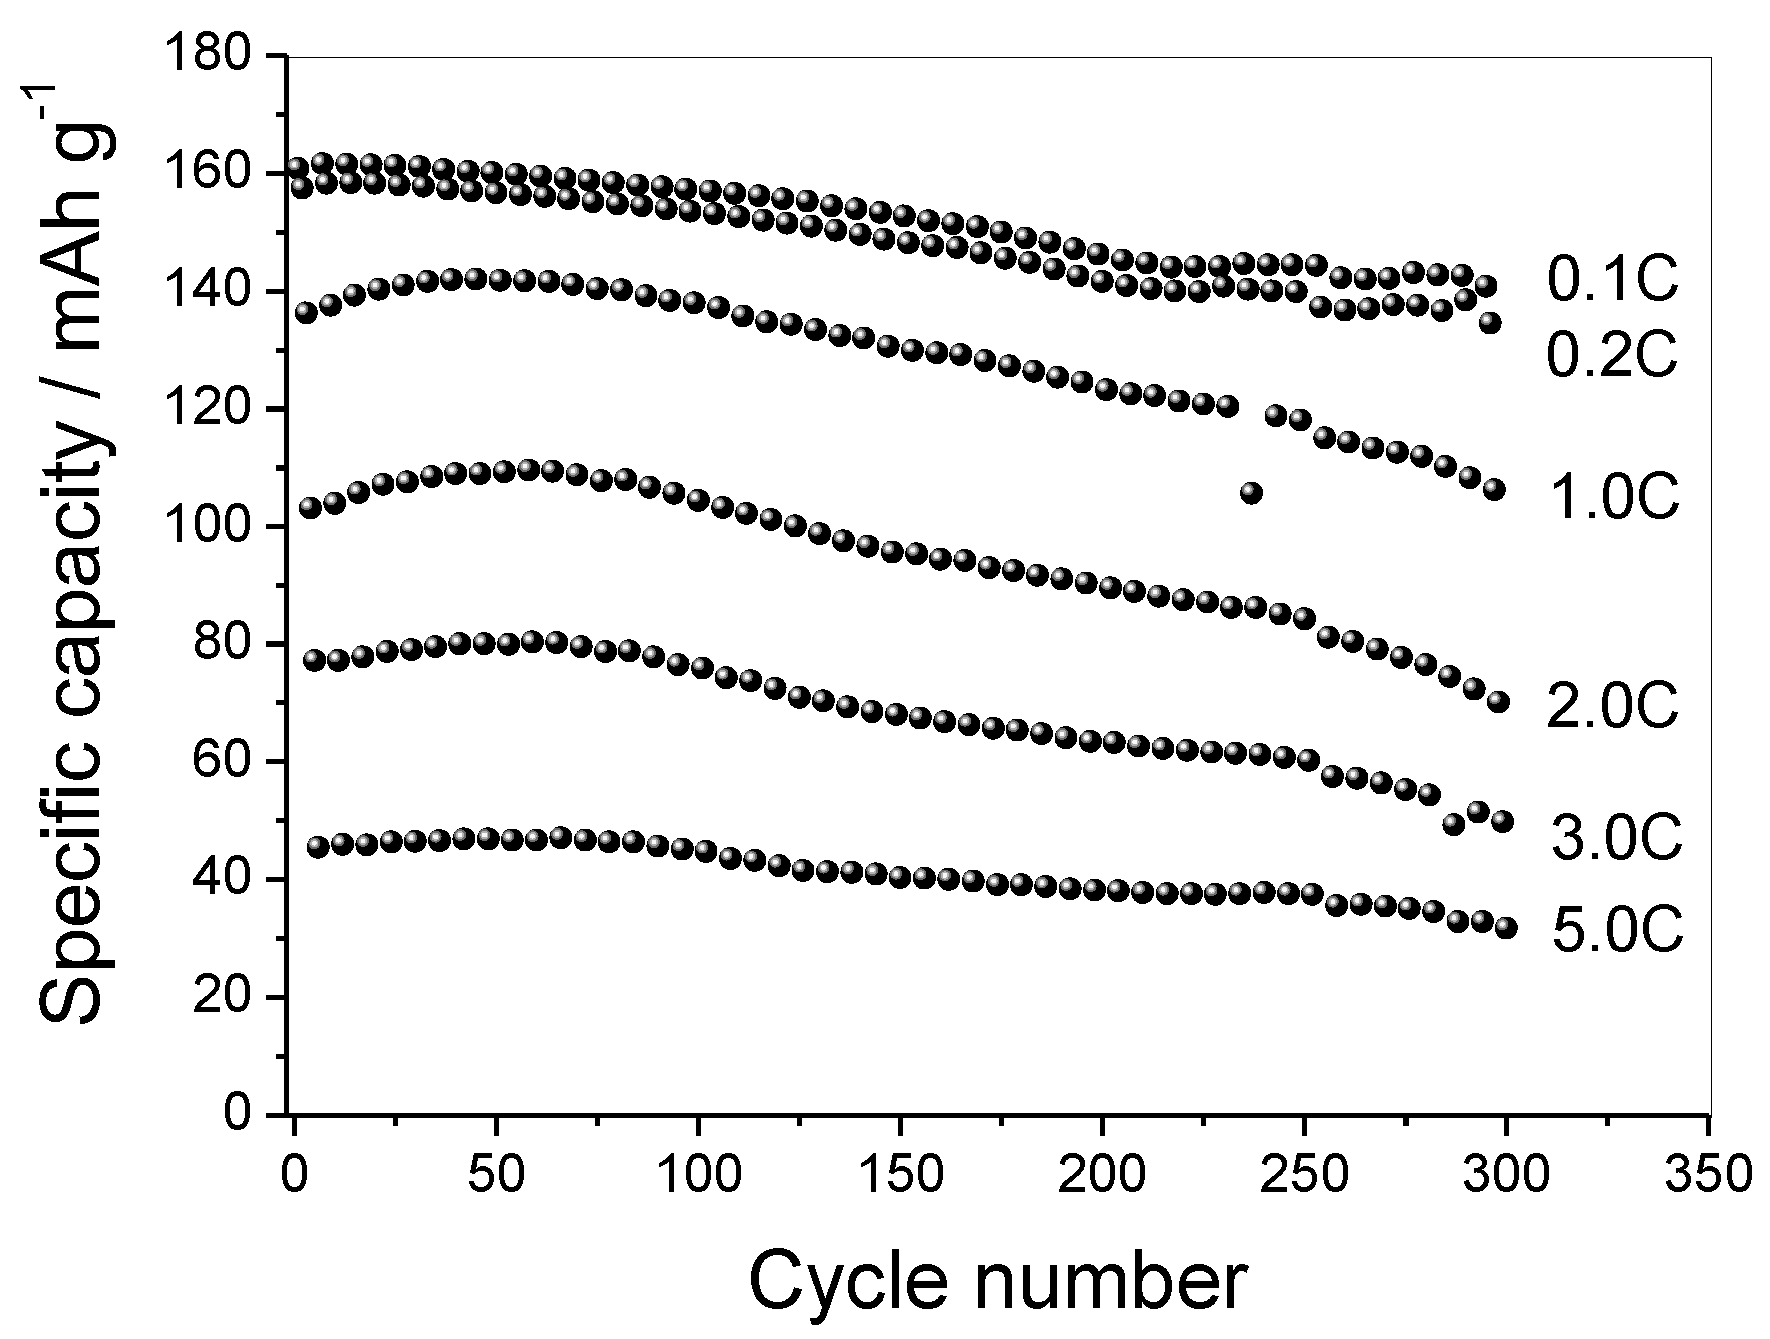
3.4. Electrochemical Test

Figure 6 shows the electrochemical impedance spectra recorded for symmetrical Li/separator/Li cells. The impedance spectra are characterized by two semicircles: the higher frequency semicircle refers to the ionic resistance of the lithium ions within the separator (Rs) while the low frequency semicircle is attributed to the charge transfer resistance (Rct). The impedance spectra appear as flattened and partially symmetrical semicircles when compared to that of the glass fiber separator. The graph shows that all the separators have a low ionic resistance, of the order of a few Ohms, showing a fair resistance to charge transfer, which varies in a range between 1510–3570 Ohms.
No substantial differences are observed among samples prepared at different values of the RH (data not shown). The electrochemical impedance spectra were fitted using Randles’ circuit shown in Figure 7. In this model, Ri represents the resistance of the electrolyte. Rct//Cdl represents the resistance to charge transfer of the electroactive species and its capacity relative to the electrode/electrolyte interface. The diffusional resistance element (the Warburg impedance, W), is positioned in series with Rct.
The results of the equivalent circuit fitting parameters are summarized in Table 10.
The specific conductivities appear to be comparable with that exhibited by the glass fiber used as a reference which in any case has the highest specific conductivity ever. The resistance exhibited to charge transfer by the samples is instead significantly higher for membranes than for glass fiber.
To demonstrate the practical application of PAN/PCL membranes as separators, laboratory scale battery cells were assembled using LiFePO4 as the active cathode material and lithium metal as the anode. Figure 8 shows the voltage profiles as a function of the specific capacity of cells made with separators at different PAN/PCL ratios for the first ten cycles conducted at C/10 rate. For reference, the voltage profiles for a cell made with the glass fiber separator are also reported.
For all cells, except for the reference one, there is a gradual but constant increase in voltage near the end of the charge and near the end of discharge. On the contrary, the plateau tension remains almost constant. However, the variation of the charge and discharge profile does not involve a significant variation of the accumulated or discharged capacity. In fact, the capacities settle almost constant during the cycles within the range between 135 and 145 mAhg−1. The cells assembled with the PAN/PCL 50:50 separators showed excellent cycling stability, with a high initial capacity of 150 mAhg−1 and a coulombic efficiency of 99.6%. This cell showed higher electrochemical performances in terms of both coulombic efficiency and specific capacity compared to those assembled with PAN/PCL 90:10 and PAN/PCL 70:30 based electrodes. In practice, even observing the behaviour of the cell prepared only with PCL [31], the best functioning is attributable to the presence of PCL. The decrease in this component leads to a deterioration in performance. This result can be explained by considering that the PLC interacted with the electrolyte forming a gel that, as the results show, maintains good ionic conduction properties. The addition of PAN, which does not interact with the electrolyte, limits the formation of the gel and reduces the ionic conductivity of the separator.
To evaluate the power response and cyclability, a cell assembled with the separator PAN/PCL 50:50 was made to cycle at various discharge currents (corresponding to 0.1 C, 0.2 C, 1.0 C, 2.0 C, 3.0 C, and 5.0 C) and Figure 9 (left) shows the corresponding voltage profiles. For reference, the voltage profiles for a cell made with the glass fiber separator are also reported.
Increasing the discharge current, as expected, the capacity progressively reduces due to the lower utilization of the active material, while maintaining high values: the electrode shows a good rate capability, being able to supply 30% of the capacity discharged at 0.1 C when discharged with currents 50 times higher. Despite the good performances of the cell prepared with the electrospun separator, the one prepared with the glass fiber as separator are superior, especially at high discharge currents. Also, the cyclability was good (Figure 10): the capacity retention after 300 cycles was about 88% at 0.1 C rate and decreases at 70% when the discharge rate was increased up to 5 C.
Possible correlations between these electrochemical data and the porosity parameters are of great interest and it is observed that PAN/PCL 50:50 exhibits minimum values of ε % and ω in this set, respectively at 65% and 2.01 µm. However, this relationship is not obvious and deserves to be further investigated in subsequent studies, since optimal cell performance results from the complex interplay between percent porosity, porosity distribution, FD distribution, and PAN/PCL ratio.

4. Conclusions

In this work a method of preparation of polymeric membranes by means of an electrospinning procedure using PAN and PCL dissolved in DMF, were developed. These membranes were designed to be used as separators for lithium batteries, trying to use the PAN primarily to stabilize the microstructure of the PCL. Out of the different electrospinning membranes obtained from different concentration PAN/PCL 50:50 appeared to deliver the best electrochemical performance. Indeed, PAN/PCL 50:50 membrane, in addition to showing an adequate value of ionic conductivity, exhibited the highest value of specific capacity when used in lithium metal batteries compared to LiFePO4-based cathodes. This membrane was selected to further evaluate the rate capability and cycling properties, proving that the battery built with the PAN/PCL 50:50 separator could indeed be discharged at high power with satisfactory rate capability and good capacity retention after more than three hundred cycles. The results indicate that the proposed design approach may provide a rationale tool to develop electrospun membranes with optimized microstructure to be used as separators for lithium batteries. In this study RH was just recorded and allowed to fluctuate freely. Since it was found that, besides the mixture composition, the control of RH is a fundamental environmental parameter that deeply influences the microstructural properties of the membranes, future studies could focus on the control of RH as actual process parameter.

Author Contributions

Conceptualization, A.R. and P.P.P.; validation, A.R. and P.P.P.; investigation, M.D.C., A.A. and N.F.; writing—review and editing, P.P.P.; project administration, P.P.P. All authors have read and agreed to the published version of the manuscript.

Funding

This work was carried out within the activities “Ricerca Sistema Elettrico” funded through contributions to research and development by the Italian Ministry of Economic Development and the Ministry of Ecological Transition.

Data Availability Statement

Data are available from the corresponding author on reasonable request.

Conflicts of Interest

The authors declare no conflict of interest.

References

  1. Yang, J.; Hu, C.; Wang, H.; Yang, K.; Liu, J.B.; Yan, H. Review on the research of failure modes and mechanism for lead-acid batteries. Int. J. Energy Res. 2017, 41, 336–352. [Google Scholar] [CrossRef]
  2. Das, S.K.; Mahapatra, S.; Lahan, H. Aluminium-ion batteries: Developments and challenges. J. Mater. Chem. A 2017, 5, 6347–6367. [Google Scholar] [CrossRef]
  3. Ji, B.; Zhang, F.; Wu, N.; Tang, Y. A dual-carbon battery based on potassium-ion electrolyte. Adv. Energy Mater. 2017, 7, 1700920. [Google Scholar] [CrossRef]
  4. Lourenssen, K.; Williams, J.; Ahmadpour, F.; Clemmer, R.; Tasnim, S. Vanadium redox flow batteries: A comprehensive review. J. Energy Storage 2019, 25, 100844. [Google Scholar] [CrossRef]
  5. Huie, M.M.; Bock, D.C.; Takeuchi, E.S.; Marschilok, A.C.; Takeuchi, K.J. Cathode materials for magnesium and magnesium-ion based batteries. Coord. Chem. Rev. 2015, 287, 15–27. [Google Scholar] [CrossRef] [Green Version]
  6. Prosini, P.P.; Cento, C.; Rufoloni, A.; Rondino, F.; Santoni, A. A lithium-ion battery based on LiFePO4 and silicon nanowires. Solid State Ion 2015, 269, 93–97. [Google Scholar] [CrossRef]
  7. La Monaca, A.; De Giorgio, F.; Soavi, F.; Tarquini, G.; Di Carli, M.; Prosini, P.P.; Arbizzani, C. 1,3-Dioxolane: A strategy to improve electrode interfaces in Latium ion and lithium-sulfur batteries. ChemElectroChem 2018, 5, 1272–1278. [Google Scholar] [CrossRef]
  8. Yabuuchi, N.; Kubota, K.; Dahbi, M.; Komaba, S. Research development on sodium-ion batteries. Chem. Rev. 2014, 114, 11636–11682. [Google Scholar] [CrossRef]
  9. Opra, D.; Gnedenkov, S.; Sokolov, A.; Podgorbunsky, A.; Ustinov, A.Y.; Mayorov, V.Y.; Kuryavyi, V.; Sinebryukhov, S. Vanadium-doped TiO2-B/anatase mesoporous nanotubes with improved rate and cycle performance for rechargeable lithium and sodium batteries. J. Mater. Sci. Technol. 2020, 54, 181–189. [Google Scholar] [CrossRef]
  10. Rangarajan, S.S.; Sunddararaj, S.P.; Sudhakar, A.; Shiva, C.K.; Subramaniam, U.; Collins, E.R.; Senjyu, T. Lithium-Ion Batteries—The Crux of Electric Vehicles with Opportunities and Challenges. Clean Technol. 2022, 4, 908–930. [Google Scholar] [CrossRef]
  11. Yoshio, M.; Brodd, R.J.; Kozawa, A. Lithium-Ion Batteries: Science and Technologies; Springer: Berlin/Heidelberg, Germany, 2009. [Google Scholar]
  12. Scrosati, B.; Garche, J. Lithium Batteries: Status, Prospects and Future. J. Power Sources 2010, 195, 2419–2430. [Google Scholar] [CrossRef]
  13. Bashir, T.; Ismail, S.A.; Song, Y.; Irfan, R.M.; Yang, S.; Zhou, S.; Zhao, J.; Gao, L. A review of the energy storage aspects of chemical elements for lithium-ion based batteries. Energy Mater. 2021, 1, 100019. [Google Scholar] [CrossRef]
  14. Luiso, S.; Fedkiw, P. Lithium-ion battery separators: Recent developments and state of art. Curr. Opin. Electrochem. 2020, 20, 99–107. [Google Scholar] [CrossRef]
  15. Li, Y.; Li, Q.; Tan, Z. A review of electrospun nanofiber-based separators for rechargeable lithium-ion batteries. J. Power Sources 2019, 443, 227262. [Google Scholar] [CrossRef]
  16. Orendorff, C.J. The Role of Separators in Lithium-Ion Cell Safety. Electrochem. Soc. Interface 2012, 21, 61–65. [Google Scholar] [CrossRef]
  17. Lee, H.; Yanilmaz, M.; Toprakci, O.; Fu, K.; Zhang, X. A Review of Recent Developments in Membrane Separators for Rechargeable Lithium-Ion Batteries. Energy Environ. Sci. 2014, 7, 3857–3886. [Google Scholar] [CrossRef]
  18. Mecerreyes, D.; Porcarelli, L.; Casado, N. Innovative Polymers for Next-Generation Batteries. Macromol. Chem. Phys. 2020, 221, 1900490. [Google Scholar] [CrossRef]
  19. Choi, S.W.; Jo, S.M.; Lee, W.S.; Kim, Y.R. An electrospun poly(vinylidene fluoride) nanofibrous membrane and its battery applications. Adv. Mater. 2003, 15, 2027–2032. [Google Scholar] [CrossRef]
  20. Yang, C.; Jia, Z.; Guan, Z.; Wang, L. Polyvinylidene fluoride membrane by novel electrospinning system for separator of Li-ion batteries. J. Power Sources 2009, 189, 716–720. [Google Scholar] [CrossRef]
  21. Bansal, D.; Meyer, B.; Salomon, M. Gelled membranes for Li and Li-ion batteries prepared by electrospinning. J. Power Sources 2008, 178, 848–851. [Google Scholar] [CrossRef]
  22. Kianfar, P.; Bongiovanni, R.; Ameduri, B.; Vitale, A. Electrospinning of Fluorinated Polymers: Current State of the Art on Processes and Applications. Polym. Rev. 2023, 63, 127–199. [Google Scholar] [CrossRef]
  23. Miao, Y.-E.; Zhu, G.-N.; Hou, H.; Xia, Y.-Y.; Liu, T. Electrospun polyimide nanofiber-based nonwoven separators for lithium-ion batteries. J. Power Sources 2013, 226, 82–86. [Google Scholar] [CrossRef]
  24. Hao, J.; Lei, G.; Li, Z.; Wu, L.; Xiao, Q.; Wang, L. A novel polyethylene terephthalate nonwoven separator based on electrospinning technique for lithium ion battery. J. Membr. Sci. 2013, 428, 11–16. [Google Scholar] [CrossRef]
  25. Zhang, H.; Zhang, Y.; Xu, T.; John, A.E.; Li, Y.; Li, W.; Zhu, B. Poly(m-phenylene isophthalamide) separator for improving the heat resistance and power density of lithium-ion batteries. J. Power Sources 2016, 329, 8–16. [Google Scholar] [CrossRef]
  26. Li, Z.; Wang, W.; Han, Y.; Zhang, L.; Li, S.; Tang, B.; Xu, S.; Xu, Z. b Ether modified poly(ether ether ketone) nonwoven membrane with excellent wettability and stability as a lithium ion battery separator. J. Power Sources 2018, 378, 176–183. [Google Scholar] [CrossRef]
  27. Qi, W.; Lu, C.; Chen, P.; Han, L.; Yu, Q.; Xu, R. Electrochemical performances and thermal properties of electrospun Poly(phthalazinone ether sulfone ketone) membrane for lithium-ion battery. Mater. Lett. 2012, 66, 239–241. [Google Scholar] [CrossRef]
  28. Xiao, W.; Zhao, L.; Gong, Y.; Liu, J.; Yan, C. Preparation and performance of poly(vinyl alcohol) porous separator for lithium-ion batteries. J. Membr. Sci. 2015, 487, 221–228. [Google Scholar] [CrossRef]
  29. Cho, T.H.; Tanaka, M.; Onishi, H.; Kondo, Y.; Nakamura, T.; Yamazaki, H.; Tanase, S.; Sakai, T. Battery performances and thermal stability of polyacrylonitrile nano-fiber-based nonwoven separators for Li-ion battery. J. Power Sources 2008, 181, 155–160. [Google Scholar] [CrossRef]
  30. Xu, T.; Binjie, X.; Zan, L.; Weihong, G.; Fuli, Z. Electrospun sandwich polysulfonamide/polyacrylonitrile/polysulfonamide composite nanofibrous membranes for lithium-ion batteries. RSC Adv. 2019, 9, 11220–11229. [Google Scholar] [CrossRef] [Green Version]
  31. Di Carli, M.; Caso, M.F.; Aurora, A.; Della Seta, L.; Prosini, P.P. Electrospinning nanofibers as separators for lithium-ion batteries. AIP Conf. Proc. 2019, 2145, 020009. [Google Scholar] [CrossRef]
  32. Khodaverdi, F.; Vaziri, A.; Javanbakht, M.; Jahanfar, M. Improvement of PAN separator properties using PVA/malonic acid by electrospinning in lithium ion-batteries. J. Appl. Polym. Sci. 2021, 138, 50088. [Google Scholar] [CrossRef]
  33. Oh, S.H.; Park, I.K.; Kim, J.M.; Lee, J.H. In vitro and in vivo characteristics of PCL scaffolds with pore size gradient fabricated by a centrifugation method. Biomaterials 2007, 28, 1664–1671. [Google Scholar] [CrossRef] [PubMed]
  34. Deng, A.; Yang, Y.; Du, S. Tissue Engineering 3D Porous Scaffolds Prepared from Electrospun Recombinant Human Collagen (RHC) Polypeptides/Chitosan. Nanofibers Appl. Sci. 2021, 11, 5096. [Google Scholar] [CrossRef]
  35. Eichhorn, S.J.; Sampson, W.W. Statistical geometry of pores and statistics of porous nanofibrous assemblies. J. R. Soc. Interface 2005, 2, 309–318. [Google Scholar] [CrossRef]
  36. Soliman, S.; Pagliari, S.; Rinaldi, A.; Forte, G.; Fiaccavento, R.; Pagliari, F.; Franzese, O.; Minieri, M.; Di Nardo, P.; Licoccia, S.; et al. Multiscale three-dimensional scaffolds for soft tissue engineering via multimodal electrospinning. Acta Biomater. 2010, 6, 1227–1237. [Google Scholar] [CrossRef] [Green Version]
  37. Seyedmahmoud, R.; Rainer, A.; Mozetic, P.; Giannitelli, S.M.; Basoli, F.; Trombetta, M.; Traversa, E.; Licoccia, S.; Rinaldi, A. A primer of statistical methods for correlating parameters and properties of electrospun poly(L-lactide) scaffolds for tissue engineering—Part 2: Regression. J. Biomed. Mater. Res. Part A 2015, 103, 103–114. [Google Scholar] [CrossRef]
  38. Box, G.E.P.; Hunter, J.S.; Hunter, W.G. Statistics for Experimenters: Design, Innovation, and Discovery, 2nd ed.; Wiley: New York, NY, USA, 2006; ISBN 978-0-471-71813-0. [Google Scholar]
  39. Szewczyk, P.K.; Stachewicz, U. The impact of relative humidity on electrospun polymer fibers: From structural changes to fiber morphology. Adv. Colloid Interface Sci. 2020, 286, 102315. [Google Scholar] [CrossRef]
  40. Zhang, H.; Quan, L.; Gao, A.; Tong, Y.; Shi, F.; Xu, L. Thermal Analysis and Crystal Structure of Poly(Acrylontirile-Co-Itaconic Acid) Copolymers Synthesized in Water. Polymers 2020, 12, 221. [Google Scholar] [CrossRef] [Green Version]
  41. Su, T.T.; Jiang, H.; Gong, H. Thermal Stabilities and the Thermal Degradation Kinetics of Poly (ε-Caprolactone). Polym. Plast. Technol. Eng. 2008, 47, 398–2403. [Google Scholar] [CrossRef]
Figure 1. Experimental workflow, highlighting the selection of input variables and solutions with different PAN/PCL ratios for electrospinning manufacturing, as well as the selected output variables from the characterization of the membranes.
Batteries 09 00201 g001
Figure 2. SEM micrographs at different magnification (from 5000× to 7000×) of the membranes obtained with different PAN/PCL ratio. (a) PAN 50%; (b) PAN 70%; (c) PAN 90%; (d) stock PAN 100%, (e) stock PCL 100%, (f) reference glass microfiber. Scale bars = 4 μm for (af).
Batteries 09 00201 g002
Figure 3. Sampling of the fibers to determine the average diameter for sample PANPCL_02 (PAN 50%) at a suitable magnification of 5000×. A grid is superimposed on the SEM micrograph and diameters are measured once for each fiber that intersects the grid, as indicated by blue lines. Scale bar = 4 μm.
Batteries 09 00201 g003
Figure 4. DTA of PAN/PCL samples of different composition performed under nitrogen atmosphere at the heating rate of 10 °C per min.
Batteries 09 00201 g004
Figure 5. TGA of PAN/PCL samples of different composition performed under nitrogen atmosphere at the heating rate of 10 °C per min.
Batteries 09 00201 g005
Figure 6. Electrochemical Impedance Spectroscopy of a symmetric Li/separator/Li cell. The graph on the right is an enlargement of the high frequency domain.
Batteries 09 00201 g006
Figure 7. Equivalent circuit used to fit the impedance spectra.
Batteries 09 00201 g007
Figure 8. Voltage profiles as a function of the specific capacity for the first ten charge/discharge cycles of cells made with separators with different PAN/PCL ratios conducted at 0.1 C rate. For reference, the voltage profiles for a cell made with the glass fiber separator are also reported.
Batteries 09 00201 g008
Figure 9. Voltage profiles as a function of the specific capacity for a cell made with the PANPCL_02 separator (left) and one made with the glass fiber separator (right) when cycled at various discharge rate (0.1 C, 0.2 C, 1.0 C, 2.0 C, 3.0 C, and 5.0 C).
Batteries 09 00201 g009
Figure 10. Discharge specific capacity as a function of the cycle number for the cell made with the PANPCL_02 separator.
Batteries 09 00201 g010
Table 1. Complete table matrix of seven process parameters and environmental variables (Xi) and two output variables (Yi).
X1X2X3X4X5X6Y1Y2
LabelPAN

(wt.%)
Flow Rate

(mL h−1)
Deposition
Time
(min)
Emitter
Voltage
(V)
Collector
Voltage
(V)
R.H.

(%)
T

(°C)
Mean FD

(µm)
Std. Dev. FD

(µm)
PANPCL_00506155−253526.10.370.18
PANPCL_01506155−255521.70.760.36
PANPCL_02506305−255122.00.450.24
PANPCL_03706305−254323.60.530.25
PANPCL_04706155−253824.60.390.18
PANPCL_05906305−203624.90.440.15
PANPCL_06906155−203525.70.420.16
PAN_0011004305−252821.00.380.13
PAN_ 0021004305−252723.40.420.12
PAN_0031004155−252723.70.540.14
PCLDMF_0106305−205624.00.320.12
PCLDMF_0204300−155026.00.270.09
Table 2. Best hierarchical model from MINITAB© with just main effects for Y2 (FD mean in µm) and Y1 (spread FD in µm).
Output VariableModel EquationR2R2adj
Y1 Y1 = −0.354 + 0.478 X1 − 0.00573 X2 + 0.01558 X371.15% 60.33%
Y2 Y2 = −0.325 + 0.2508 X1 − 0.00338 X2 + 0.01051 X376.69% 67.95%
Table 3. Results of best-subset analysis search from MINITAB© for Y1 (FD mean in µm), comparing best models with 1, 2 or 3 main parameters only. Selected choice marked with “*”.
VarsR2R2adjCp-MallowsSX1 X2 X3
114.86.316.10.12231
259.350.35.50.089103
3 *71.260.34.20.079596
Table 4. The ANOVA for the model of output variable Y1 in coded variables containing only main effects.
SourceDFSeq SSContributionAdj SSAdj MSF-Valuep-Value
Regression30.1250171.15%0.125010.0416696.580.015
X1: PAN%10.016749.53%0.092640.09264214.620.005
X2: time10.0193611.02%0.020770.0207713.280.108
X3: RH(%)10.0889150.61%0.088910.08890914.030.006
Error80.0506828.85%0.050680.006336
Total110.17569100.00%
Table 5. Results of best-subset analysis search from MINITAB© for Y1, comparing the prior model augmented with two ways interactions. Selected choice marked with “*”.
VarsR2R2
adj.
Press.R2
Pred.
Cp-MallowsSX1 X2 X3 X1*X2X1*X3X2*X3
174.760.20.40.03.40.079711
2 *76.757.30.30.05.00.082627
376.748.70.80.07.00.090504
Table 6. Results of best-subset analysis search from MINITAB© for Y2, comparing the prior model augmented with two ways interactions. Selected choice marked with “*”.
VarsR2R2
adj.
Press.R2
Pred.
Cp-MallowsSX1 X2 X3 X1*X2X1*X3X2*X3
1 *89.283.00.069.63.70.030835
290.382.20.040.55.10.031529
390.579.00.10.07.00.034249
Table 7. The ANOVA for the model of output variable Y2 in coded variables augmented with interaction term X1*X2. The term X1, could be removed to obtain a reduced model.
SourceDFSeq SSContributionAdj SSAdj MSF-Valuep-Value
Regression40.054811 89.17% 0.054811 0.013703 14.41 0.002
X1: PAN%10.000000 0.00% 0.001068 0.001068 1.12 0.324
X2: time10.006661 10.84% 0.012288 0.012288 12.92 0.009
X3: RH(%)10.040479 65.86% 0.033069 0.033069 34.78 0.001
X1*X210.007670 12.48% 0.007670 0.007670 8.07
Error70.006656 10.83% 0.006656 0.000951
Total110.061467 100.00%
Y2_augmented = −0.163 X1 − 0.01327 X2 + 0.00966 X3 + 0.01415 X1*X2
R2 = 89.17%
R2adj = 82.98%
Table 8. Measured percent porosity and estimated average pore radius for all samples.
Sample%PANTime (min)Thickness (µm) ε % ω (µm)
Averagestd. dev.
PAN-PCL 0050157165%4.1%2.01
PAN-PCL 0150158273%10.2%5.56
PAN-PCL 02503018466%7.3%2.49
PAN-PCL 03703018979%2.7%5.17
PAN-PCL 04701512479%19.5%3.89
PAN-PCL 05903033787%8.9%7.31
PAN-PCL 06901521876%0.6%3.51
PAN 002100307777%5.7%3.61
PAN 003100153661%8.3%2.54
PCL DMF 010308875%1.2%2.56
PCL DMF 020308241%0.4%0.70
Table 9. Tonset and Tmax values of DTA curves related to the polymer composition.
SamplePAN PercentageTonsetTmax
PCL DMF 010%238.2 °C295.8 °C
PANPCL_0250%239.0 °C313.1 °C
PANPCL_0470%239.1 °C313.3 °C
PANPCL_0690%238.7 °C304.6 °C
Table 10. Thickness, resistance, specific conductivity, and charge transfer resistance values obtained by electrochemical impedance spectroscopy for samples containing various PAN:PCL ratios. The results obtained for a glass fiber sample are also reported.
IDPAN/
PCL
(wt.%)
Thickness
(µm)
Resistance
(Ω)
Specific
Conductivity
(S)
Charge Transfer
Resistance
(Ω)
PCL DMF 010:100884.851.2 × 10−3450
PANPCL_0250:501835.432.2 × 10−32430
PANPCL_0470:302184.852.9 × 10−33570
PANPCL_0690:101838.141.5 × 10−31510
Glass fiber-2605.193.2 × 10−3720
Disclaimer/Publisher’s Note: The statements, opinions and data contained in all publications are solely those of the individual author(s) and contributor(s) and not of MDPI and/or the editor(s). MDPI and/or the editor(s) disclaim responsibility for any injury to people or property resulting from any ideas, methods, instructions or products referred to in the content.

