3.1. In Situ XPS Measurements
To our knowledge, no data about Al current collector material covered with RTIL and polarised anodically (i.e., positively) and investigated in situ using the soft XPS method have been published so far. In situ soft XPS investigation results characterising an Al current collector covered also with N4111(TFSI) but polarised cathodically (i.e., negatively) were published recently [
36].
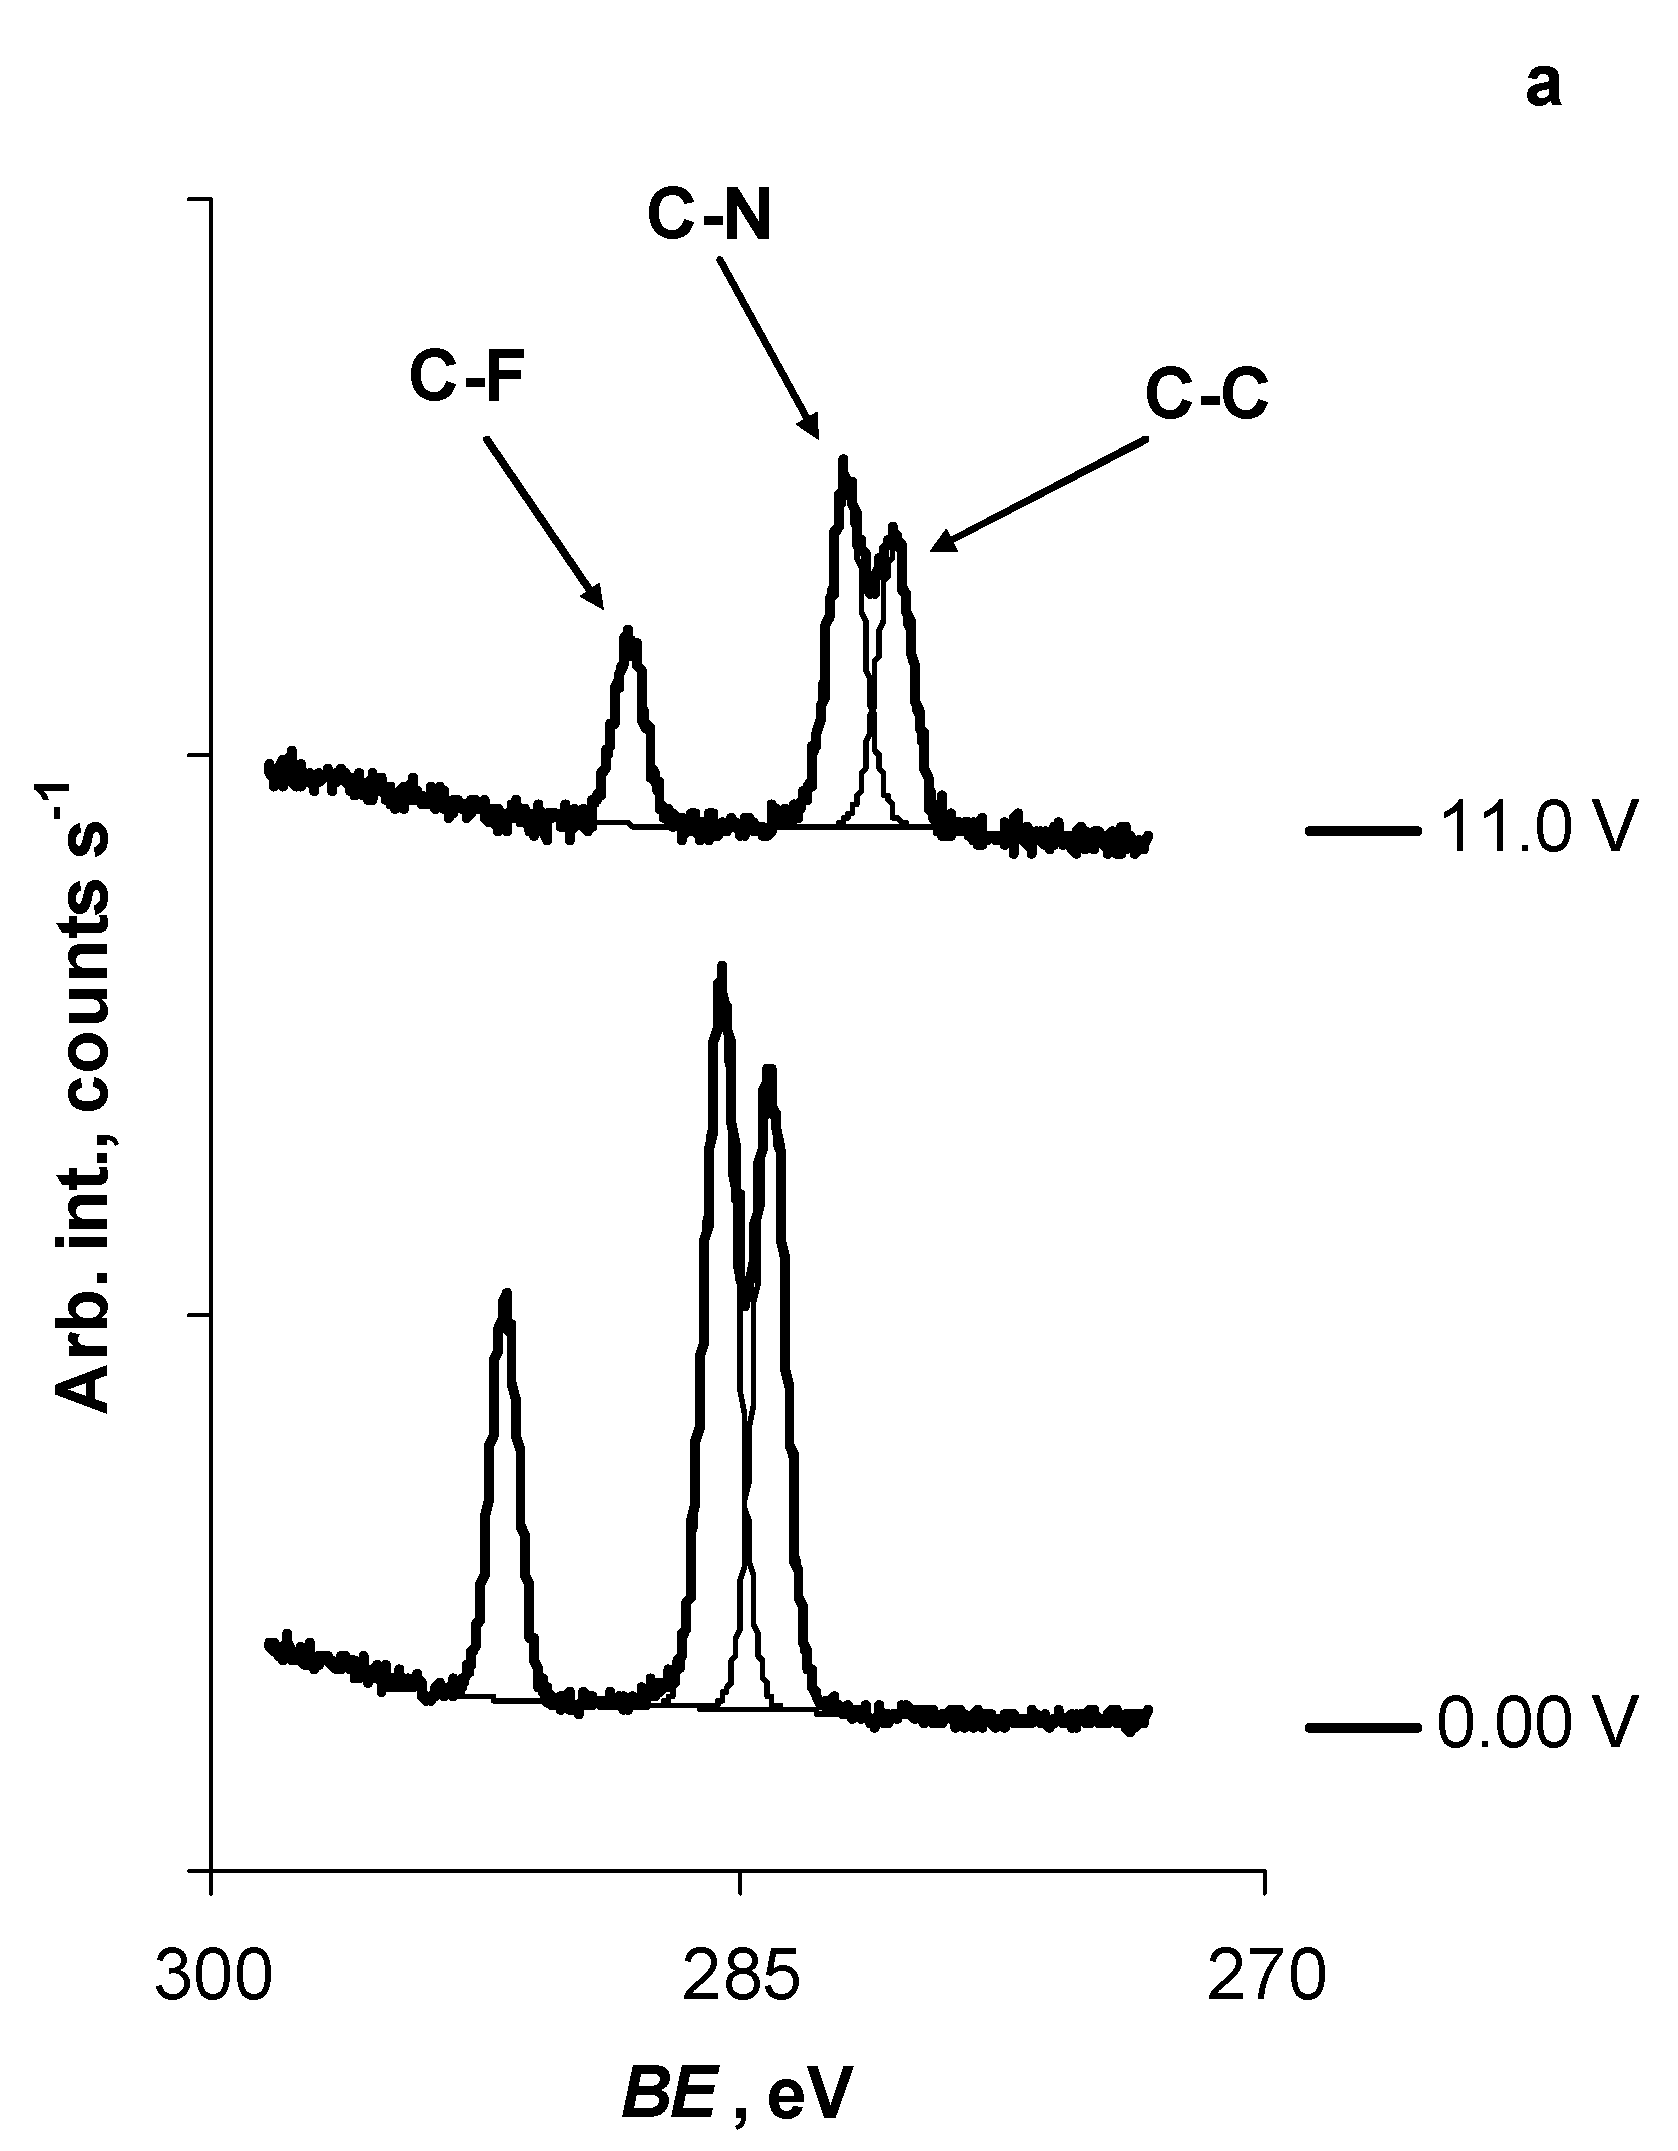
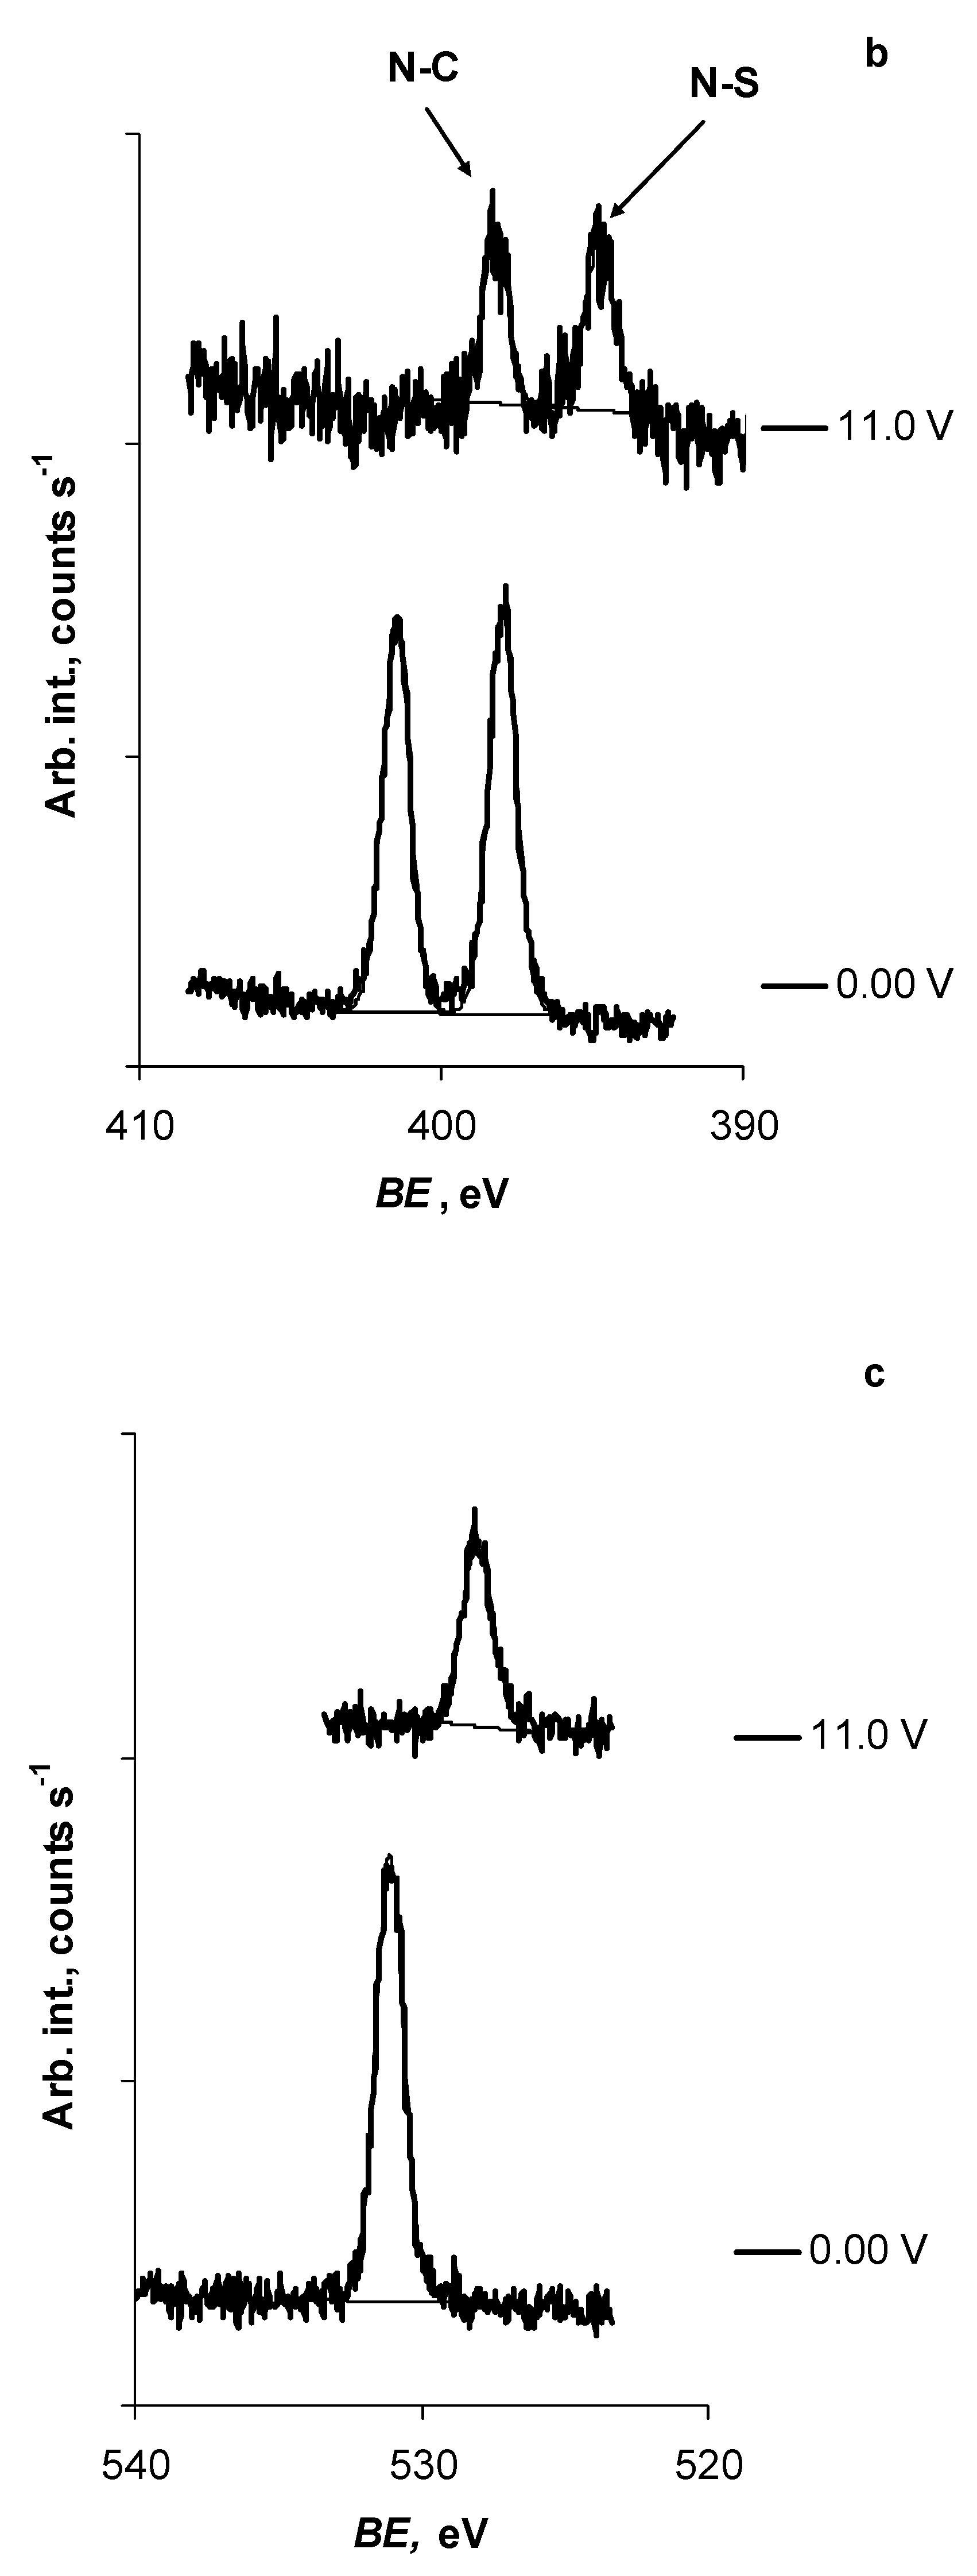
The shapes of the C 1s, N 1s, O 1s, F 1s, and S 2p XPS spectra collected at a positively polarised Al current collector covered with N4111(TFSI) were stable within the potential (
E) range from 0.00 V to 11.0 V (
Figure 1a–e). It is important to note that no Al 2p signal was observed at the RTIL|vacuum interface within the potential range explored. This confirms that if the Al
3+-containing substances formed at the Al | N4111(TFSI) interface during Al oxidation they did not dissolve in N4111(TFSI). Additionally, the N4111(TFSI) layer at the Al/Al
2O
3 electrode was thick enough and therefore no photoelectrons were detected from a clean Al surface or from its compounds (i.e., Al
2O
3, AlF
3, and Al(TFSI)
3) formed and located at the N4111(TFSI)|Al interface (i.e., forming the Al electro-oxidation resisting layer, i.e., solid-electrolyte interface—SEI).
However, the slopes of the
BE vs.
E relationships for C 1s, N 1s, O 1s, F 1s, and S 2p in situ XPS signals collected at the N4111(TFSI) | vacuum interface anodically polarised Al-current-collector surface were very interesting (
Table 1 and
Supplementary information Figure S1a–i). For all elements investigated within the potential range from 0.00 V to 3.00 V, the values of d
BE d
E−1 = −0.82…−0.86 eV V
−1, thus, being very close to the value −1.0 eV V
−1, indicating the non-specific adsorption [
37,
38] of N4111(TFSI) on the Al/Al
2O
3 surface. At more positive potentials, i.e., for region from 3.00 V to 4.50 V, the values of d
BE d
E−1 were close to zero (0.09…0.14 eV V
−1), indicating very strong adsorption of N4111(TFSI) at the Al/Al
2O
3 surface (i.e., a surface-compound formation between N4111(TFSI) and Al/Al
2O
3) [
37,
38] at
E ≥ 3.00 V. No gas-bubble formation was noted at the Al/Al
2O
3 electrode covered with N4111(TFSI) in the potential range of 3.0 V <
E < 4.5 V; thus, we suppose that N4111
+ or TFSI
− did not electro-oxidise and decompose. Zhou at al. [
38], investigating the adsorption of 4,4′-dithiodipyridine (PySSPy) at Au(111), noted that
BE of S 2p
3/2 electrons did not change at the potentials where the strong adsorption of PySSPy had taken place. Although the core-electron BE of the other elements composing PySSPy changed by −0.9 eV V
−1, they concluded that the sulphur located in PySSPy adsorbed at the Au(111) electrode and formed a bond with Au. Based on that study [
38] and the information collected in this study by the in situ XPS method for the N4111(TFSI)|Al interface, we suppose that the TFSI
− anion adsorbed strongly at the Al/Al
2O
3 surface or even reacted with the Al
3+ cations formed. Although d
BE vs. d
E was nearly zero for the inner core electrons for the elements composing the N4111
+ cation, we suppose that N4111
+ remained somehow attached to the TFSI
− anion combined with the Al/Al
2O
3 or Al
3+ cations.
At very highly positive potentials (8.5 ≤
E ≤ 11.0 V), the
BE vs.
E slopes were very variable for the elements analysed, ranging from −0.3…−0.4 eV V
−1 for O 1s, F 1s, and S 2p
3/2; to −0.6 eV V
−1 for N 1s; and to −0.9 eV V
−1 for C 1s (
Table 1,
Figure S1a–i). Thus, it seems that the oxygen, fluorine, and sulphur atoms were strongly (because of the partial-charge transfer (oxidation) step), nitrogen atoms were moderately, and carbon atoms were weakly attached to the aluminium-electrode surface within the potential range of 8.50 ≤
E ≤ 11.0 V. The very large variation in the d
BE d
E−1 values observed for the elements studied could indicate the electrochemical decomposition of TFSI
− anion at very high anodic potentials and the electrochemical instability (i.e., electrochemical decomposition (oxidation)) of the SEI formed at less positive potentials. (This phenomenon will be discussed in more detail in the following section describing the results of the electrochemical-impedance spectroscopy measurements.) Extrapolating
BE vs.
E relationships measured within the potential range of 3.00 V to 4.50 V and 8.5 to 11.0 V into the potential range of 4.5 V <
E < 8.5 V, it seems that the two d
BE d
E−1 lines crossed at ca.
E = 7.5 V for F 1s and S 2p, at ca. 8 V for O 1s, at ca. 8.3 V for N 1s, and at ca. 8.7 V for C 1s (
Figure S1a–i).
3.2. Information from CV Measurements
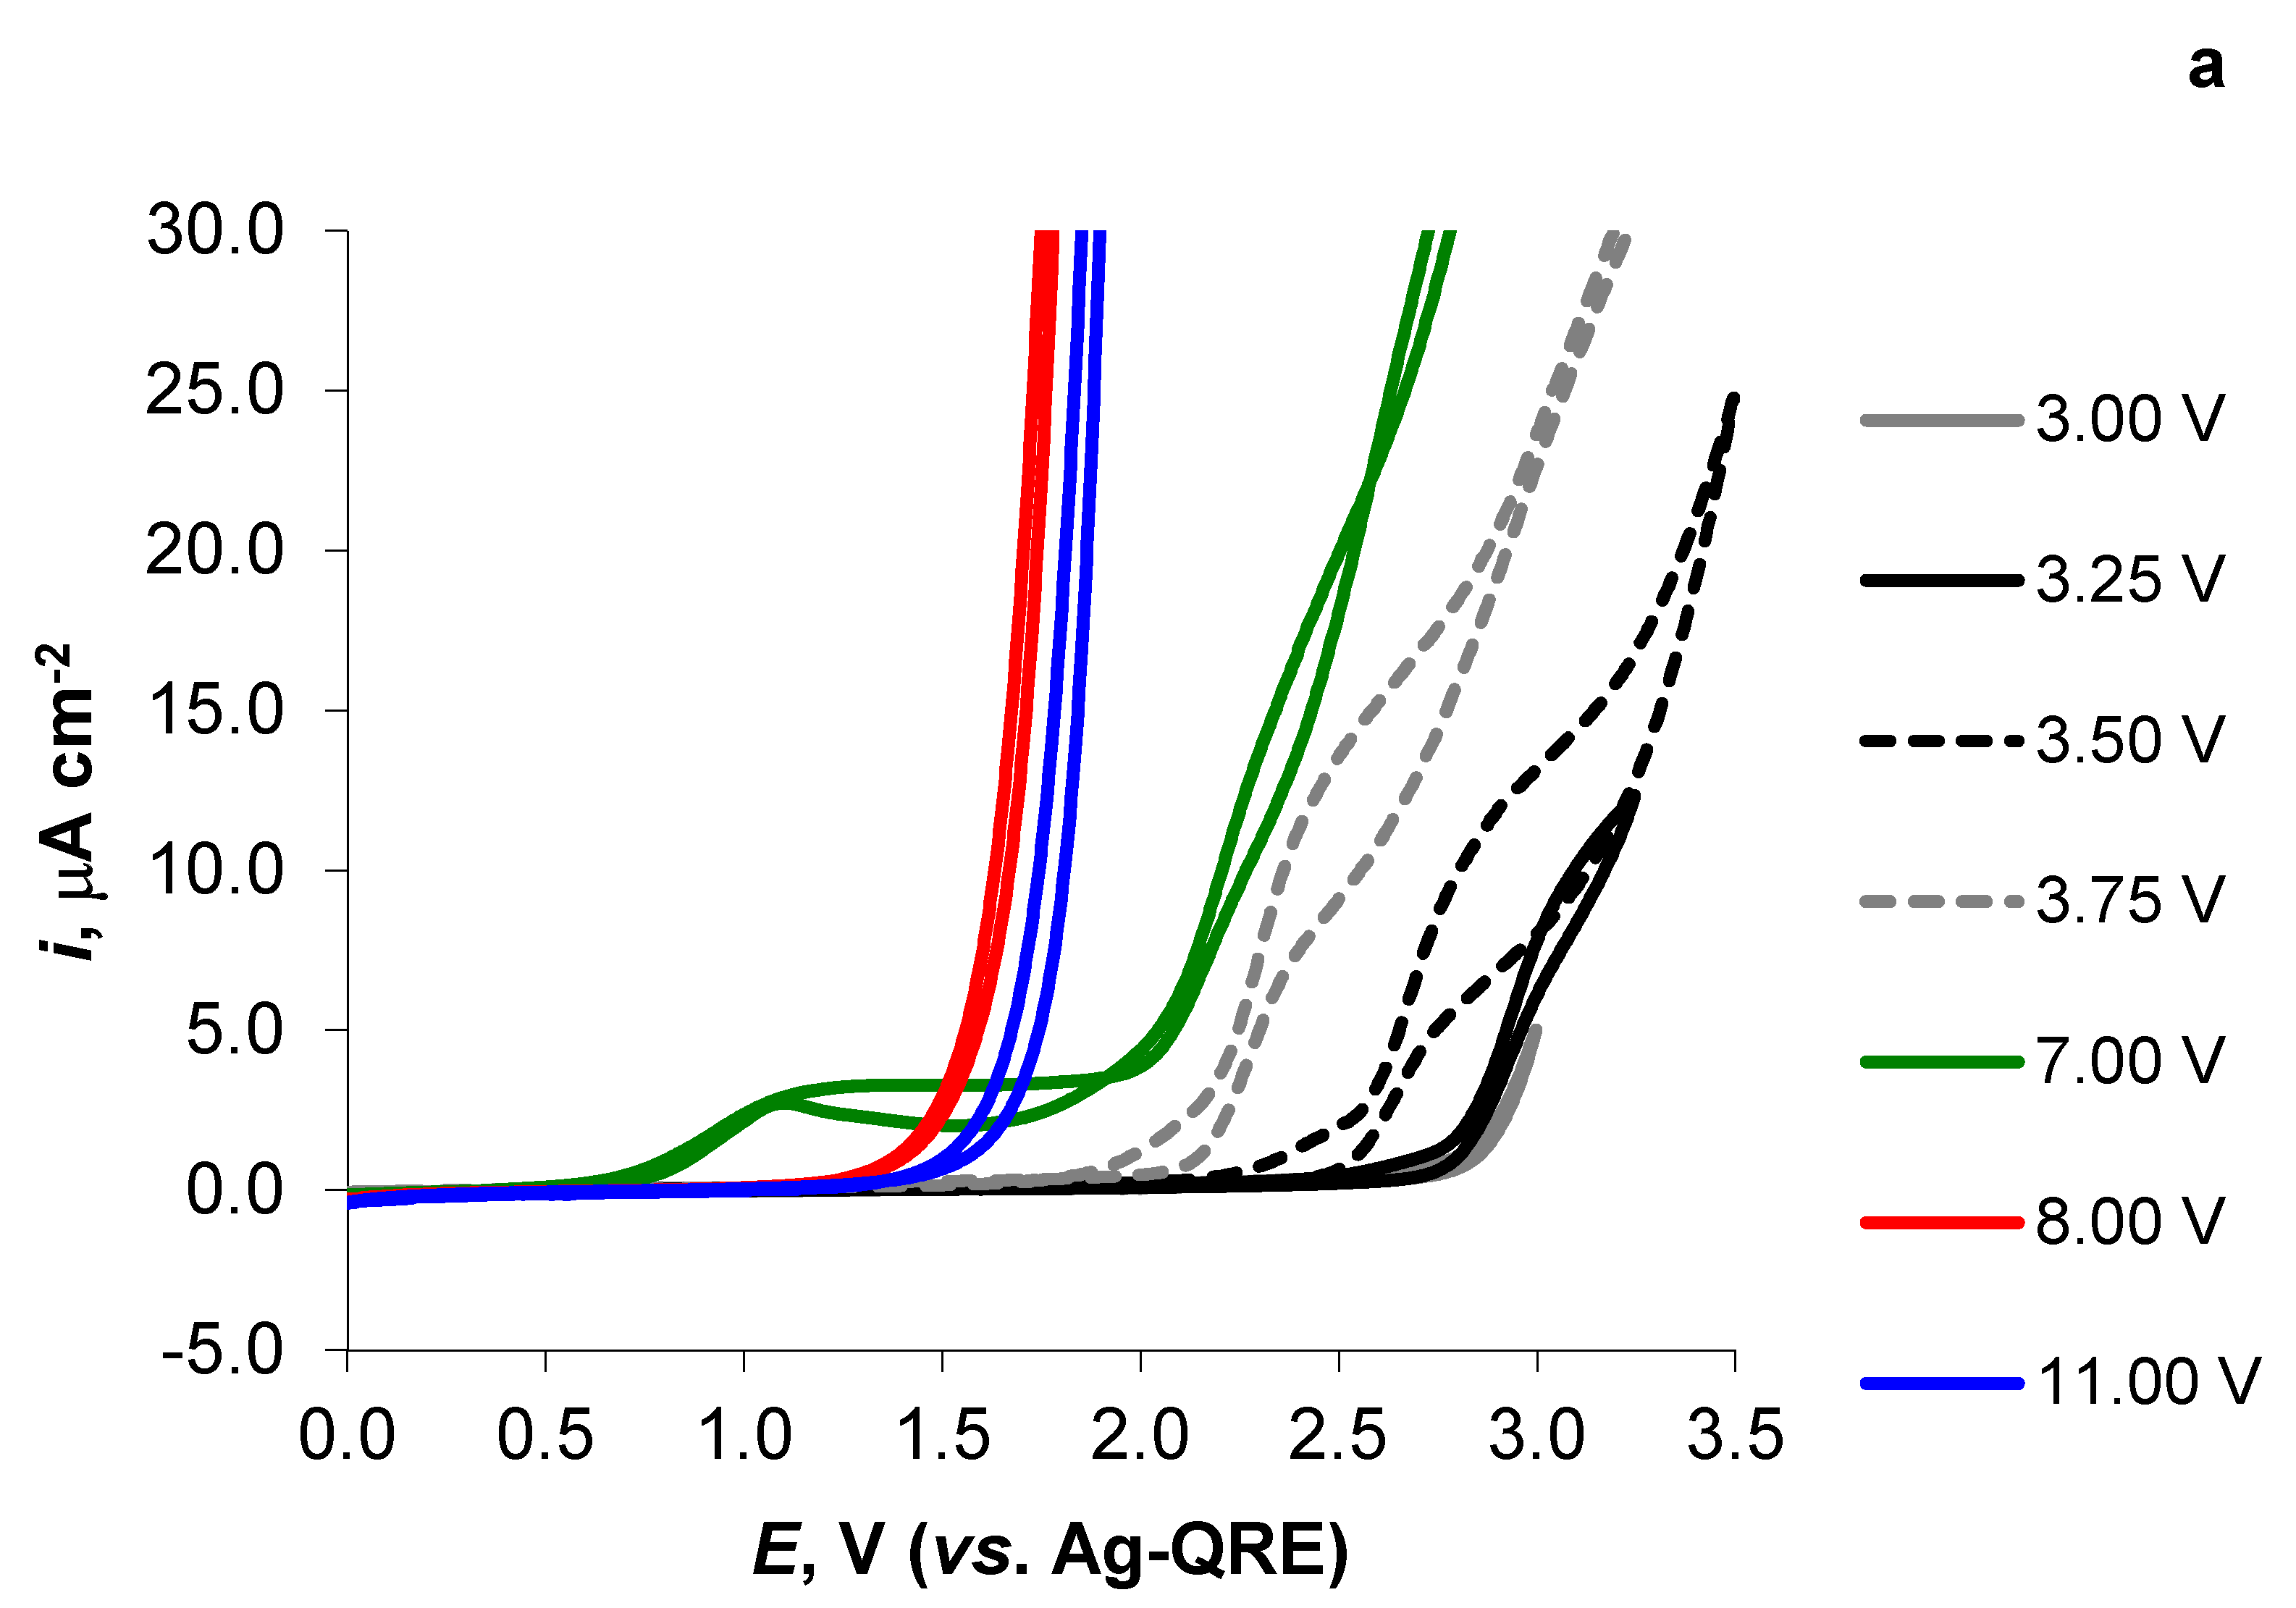
In order to investigate the electrochemical properties of the N4111(TFSI)|Al interface in detail, first the CV measurements were initiated. The CV scans were always started at E = 0.00 V and then swept up to a more positive (i.e., turn-over) desired potential; after that, the potential was returned to the initial value. Two consecutive scans were conducted at every selected turn-over potential that was then increased stepwise. The data of the second scan were used in the data-analysis process and are discussed in the text and shown in the figures.
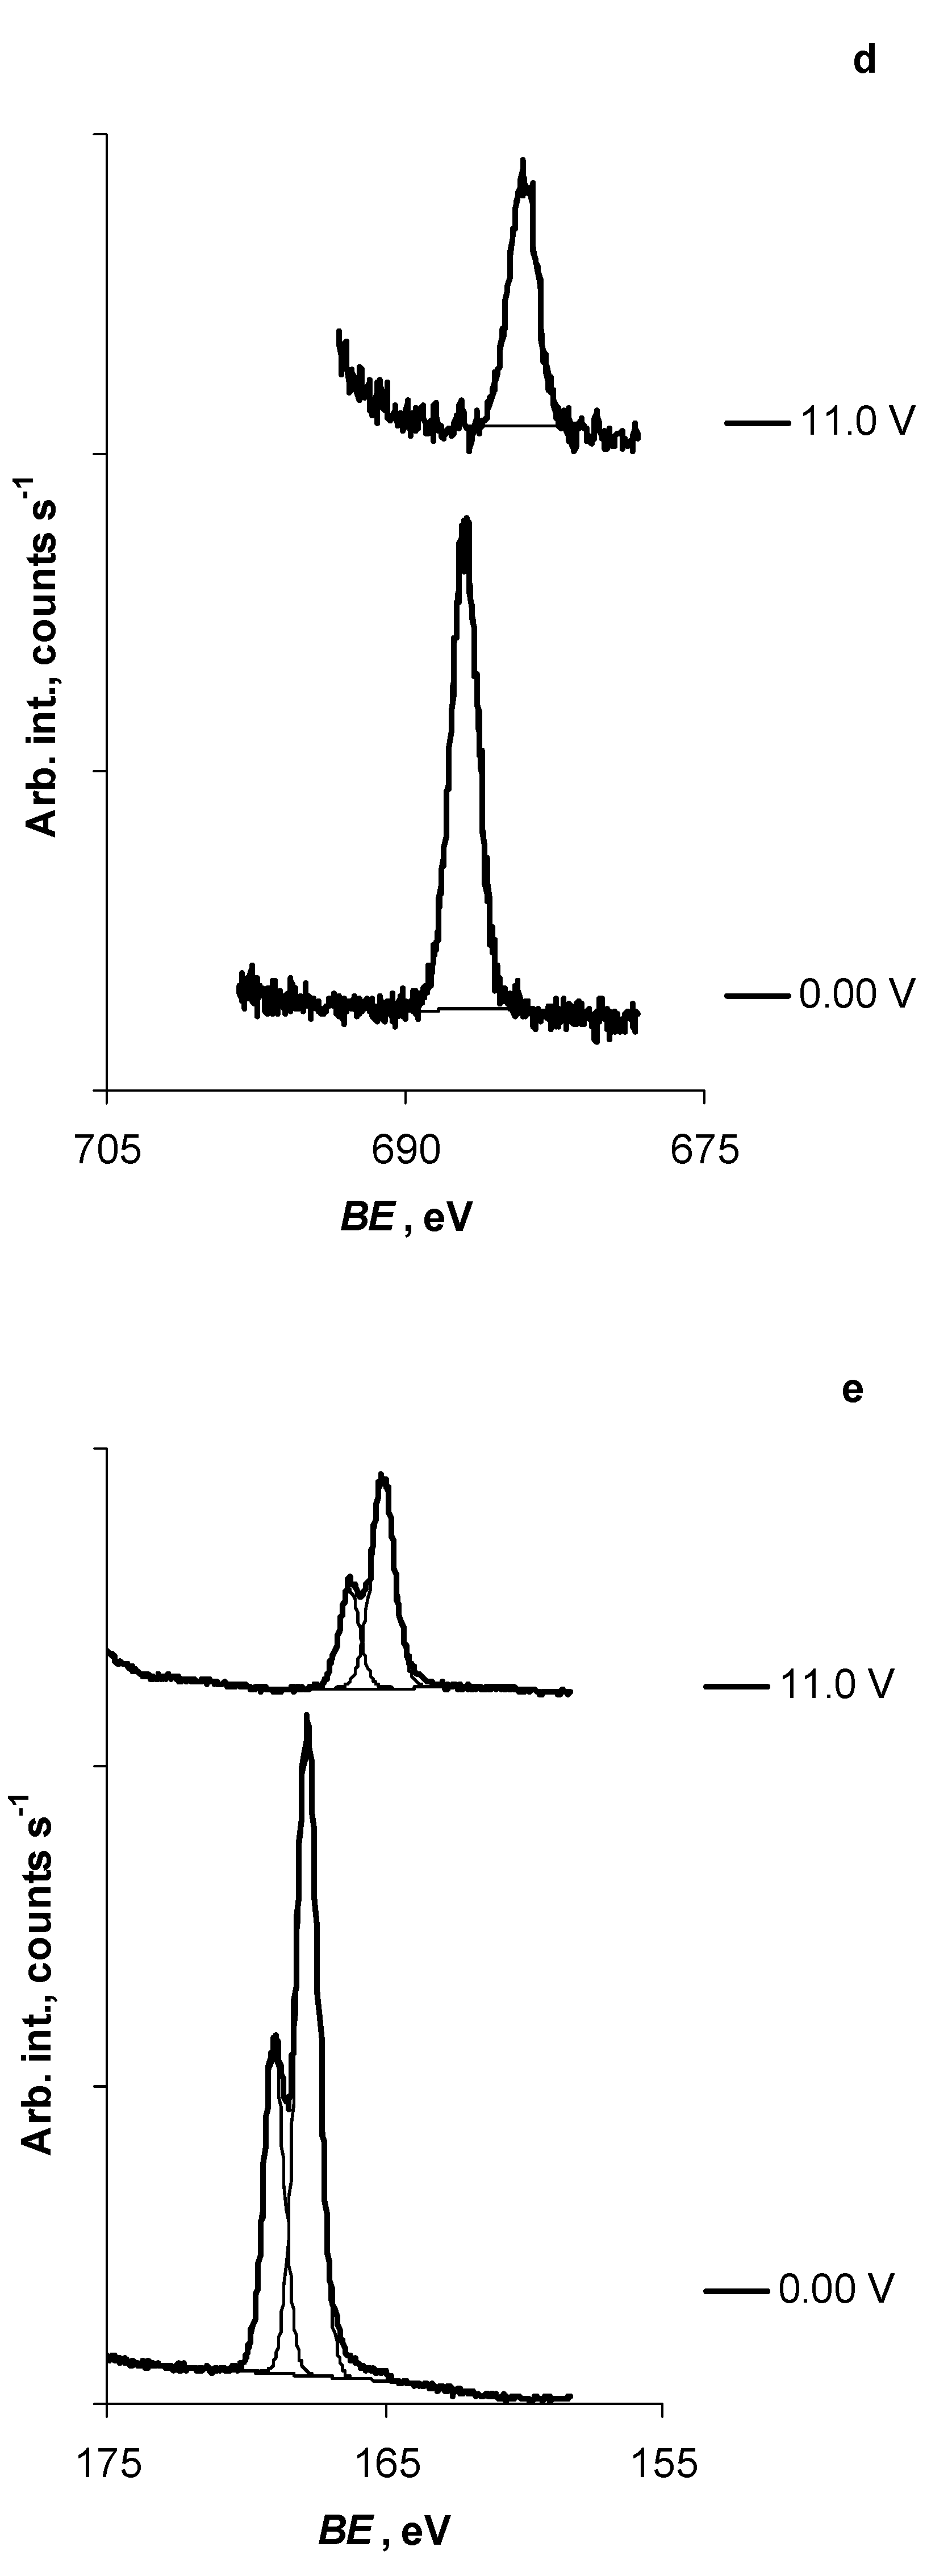
The CV measurement (
Figure 2), performed in the potential range of 0.00 V to 1.00 V (and reverse) at the potential sweep rate of
v = 1.0 mV s
−1, showed two voltammetric waves at
E = 0.38 V and
E = 0.65 V. Both waves slowly disappeared as the CV potential sweep ranges were expanded towards more positive values. A very slow increase in the anodic current at
E ≥ 0.75 V was also reported in the studies by Kityk et al. [
31], who explained this as the temporal event of the electro-oxidation of Al located at the end of micropores located in the Al
2O
3 layer covering the Al electrode. When the CV sweep ranges were extended towards more positive potentials, the anodic currents recorded near the maximum potential applied were higher than measured in the previous CV at less positive potentials (
Figure S2a,b). It should be mentioned that this anodic process was totally irreversible. Additionally, the electro-oxidation process currents, measured during the potential forward sweeps, were smaller than they were at the same potential in the previous CV performed in the narrower potential range. Thus, the increase in the anodic currents applying more positive turnover potentials and the anodic current-value reduction at the same potential in the following CVs indicates the thickening of the Al
2O
3 passivating layer because of the possible electrochemical decomposition of some trace water that still very likely remained in N4111(TFSI) after very careful pre-treatment. This Al
2O
3 passivating layer-thickening process has been observed and explained in detail previously [
4,
5,
6,
11,
12,
13,
14,
17,
22,
23,
25,
26]. It is interesting to note that the values of d
BE d
E−1 were in the range of −0.82…−0.85 eV V
−1 (
Table 1), showing the almost non-specific adsorption (interaction) of N4111(TFSI) at the Al surface up to
E = 3.00 V.
The electro-oxidation current measured voltammetrically began to increase intensively at
E = 2.75 V, when the CV potential sweep was conducted from 0.00 V to 3.00 V and reverse (
Figure 3a and
Figure S2a–d). It is noteworthy that the
BE vs.
E dependence slope, calculated from in situ XPS
BE vs.
E data from 3.00 V to 4.50 V, increased to 0.10…0.15 eV V
−1, marking the chemosorption of N4111(TFSI) (
Table 1). Thus, based upon the CV and in situ XPS data, we can conclude that at
E ≥ 2.75 V the irreversible electrochemical oxidation of Al started leading to the formation and deposition of N4111(TFSI)-insoluble Al(TFSI)
3 onto the Al surface. Extending the CV sweep ranges toward more positive values than
E = 3.5 V, the Al/Al
2O
3 electrode became more activated step by step while the anodic currents had already started to increase at less positive potentials (
Figure S2a–c). Thus, it seems that the Al-electrode-passivating Al
2O
3 layer decomposed and detached from the Al-electrode surface at
E ≥ 3.0 V and Al
3+ cations formed at the Al surface reacted with (TFSI)
− anions, leading to the specific adsorption of N4111(TFSI) at the Al electrode (
Table 1). However, the formed Al(TFSI)
3 SEI could not prevent continuous Al-current-collector electro-oxidation [
11,
17,
22,
25,
26,
39].
When the CV sweep was reversed at
E = 7.00 V, an intensive electrochemical process started at
E = 0.65 V, forming an anodic current peak at
E = 1.10 V (
i = 2.7 mA cm
−2) (
Figure 3a, green line, and
Figure S3a–d). This electrochemical process can be connected with the intensive electro-oxidation of the Al
2O
3-film unprotected Al electrode and by the formation of Al(TFSI)
3, as described previously (
Figure 2,
Figure 3a and
Figure S2a–c). It is important to note that when the Al electrode potential started to decrease during the CV reverse sweep, the current almost followed the path of the previous anodic (forward) sweep. After intensive electrochemical oxidation of Al at
E = 7.0 V, changing the potential sweep direction towards the initial potential,
E = 0.0 V, the current stood at a plateau from
E = 1.85 V to
E = 1.20 V. Thereafter, the anodic current decreased somewhat, forming an S-shaped voltammetric wave. No more electrochemical processes were observed in the potential range of 0.0 V ≤
E ≤ 0.60 V, which indicates the electrochemical stability of Al in this potential range (
Figure 3a,
Figures S2a–c and S3a–d). It should be noted that the shape of the measured CV curve (
Figure 3a, green line) is very similar to the potential linear-sweep data presented by Kityk et al. [
31] and measured during the Al-electropolishing process.
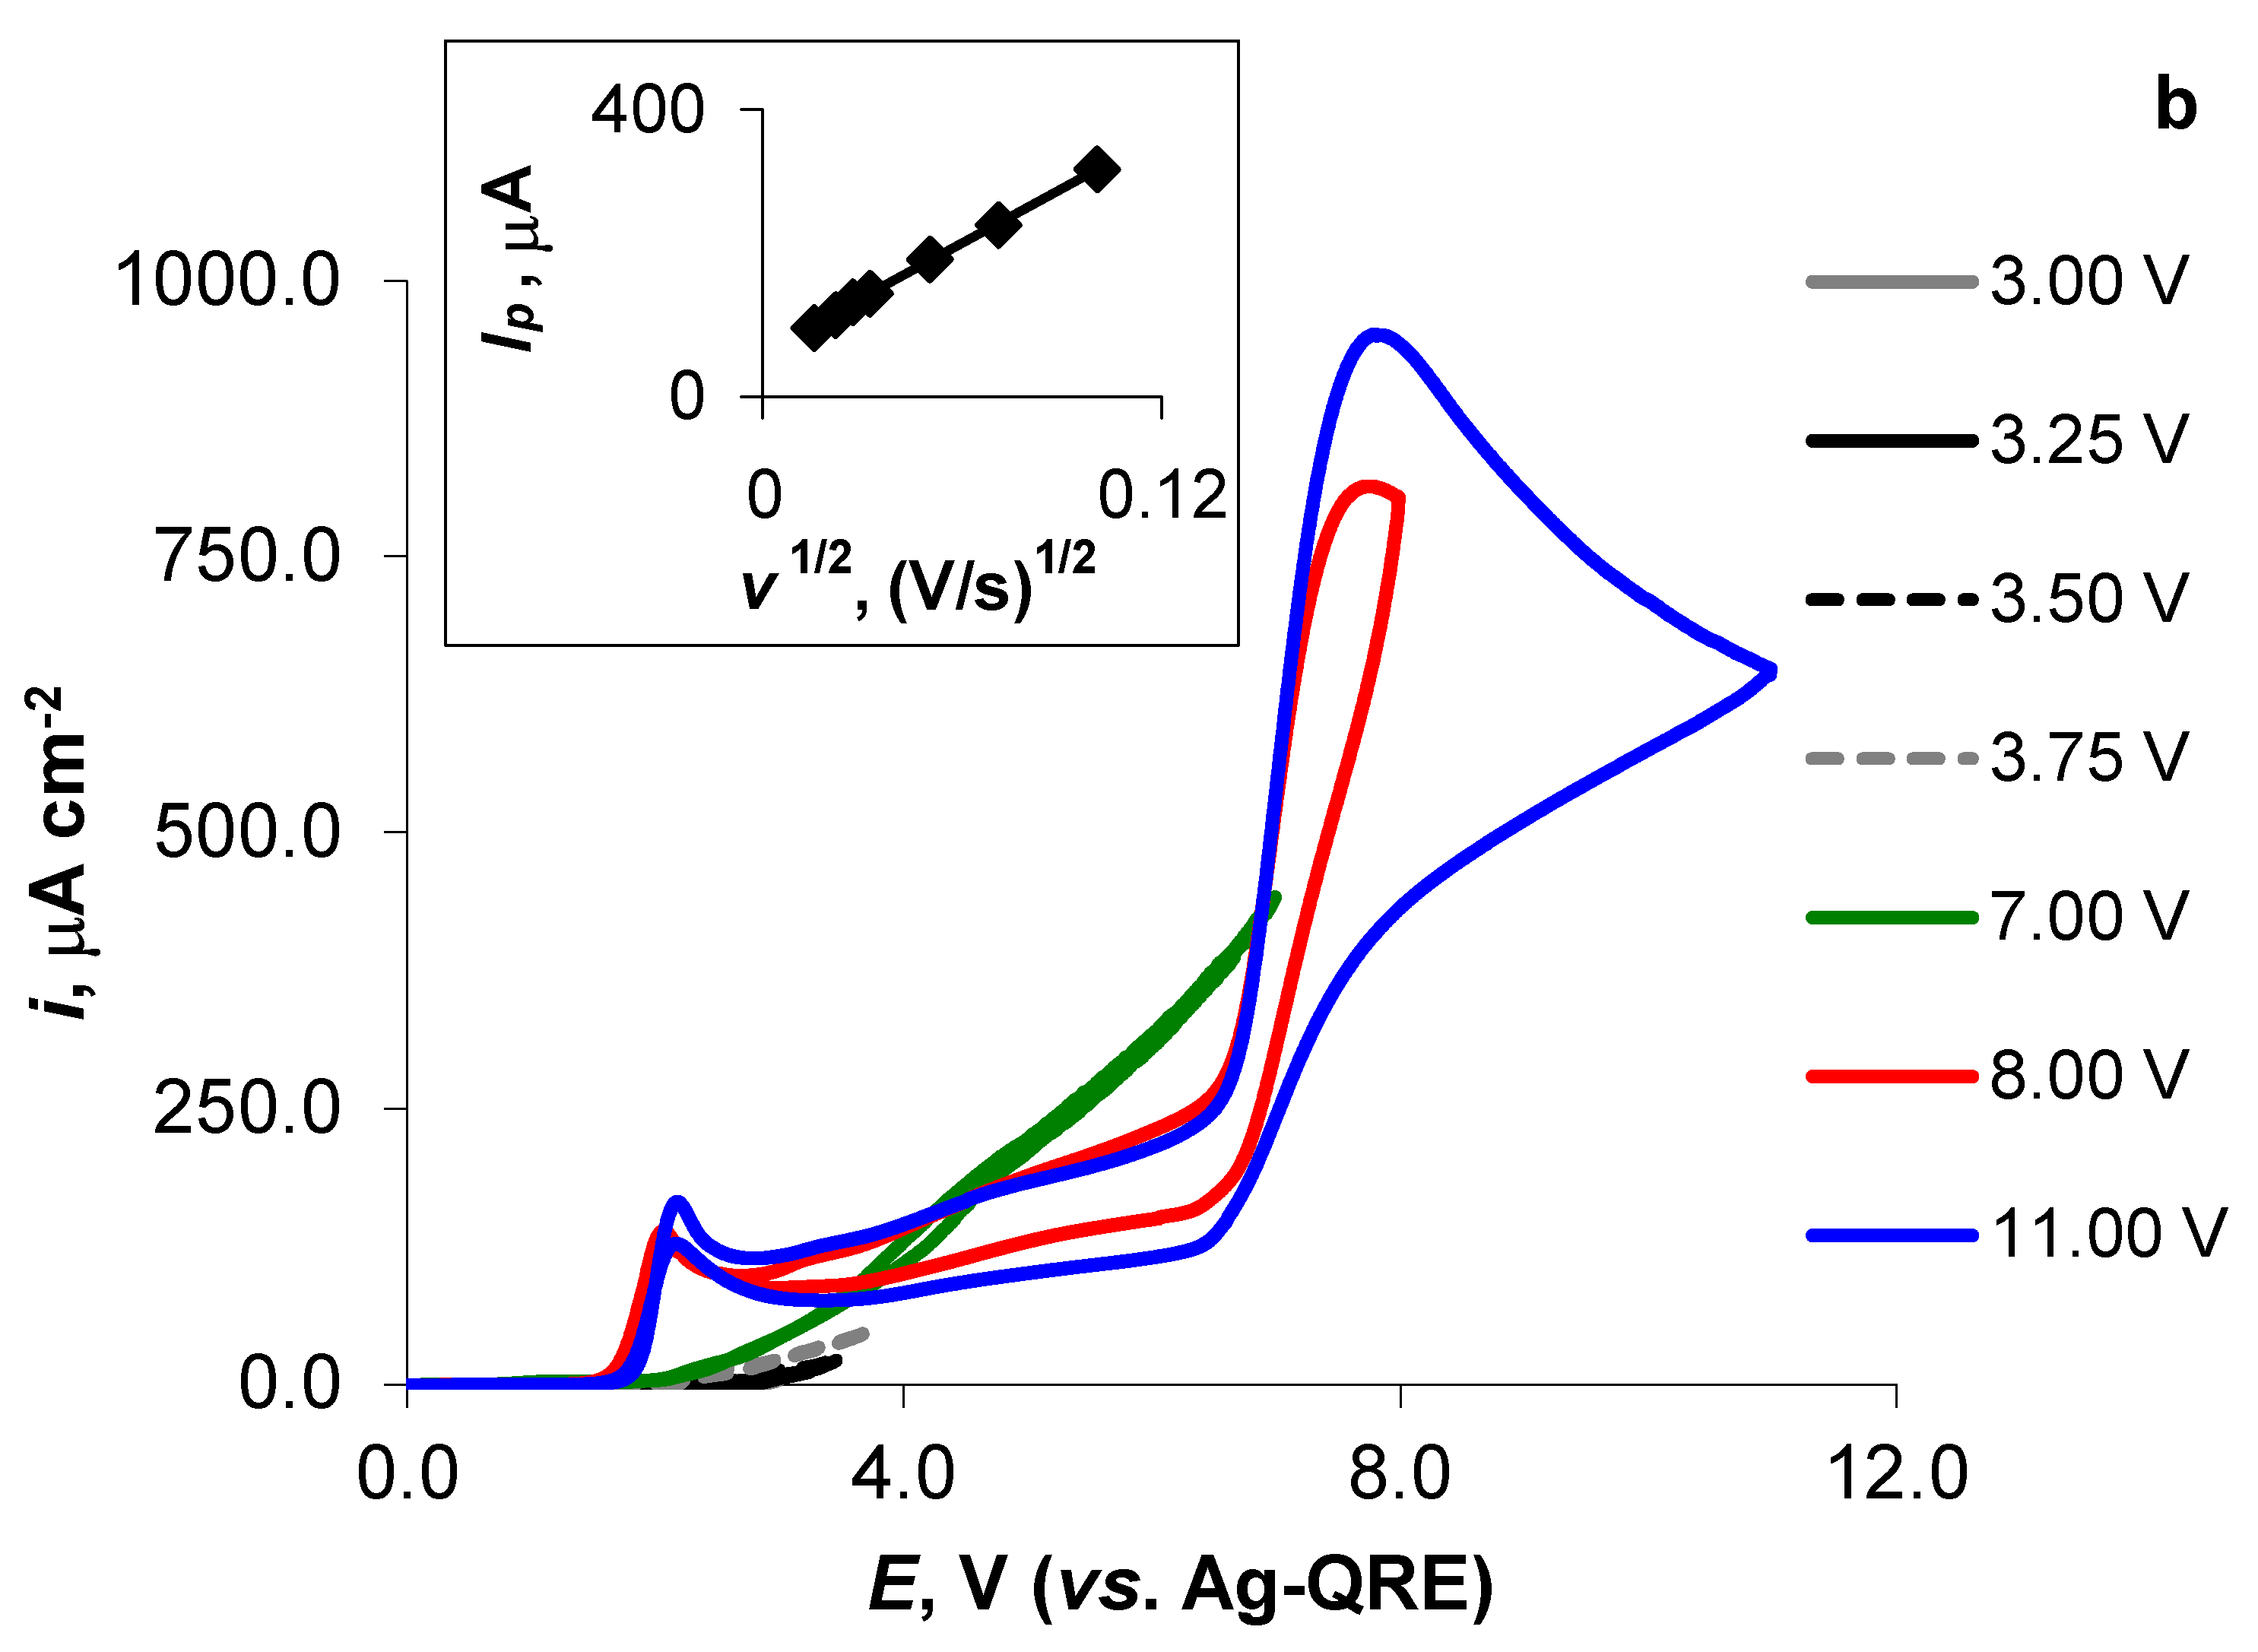
When performing the CV measurements within the potential range of 0.00 V to 8.00 V and 0.00 V to 11.0 V and reverse, a voltammetric peak formed in the forward and reverse scans at
E = 2.1 V (
Figure 2c,d and
Figure 3b). The anodic-current peak (
Ip) values for the forward scan, measured at
E = 2.1 V, were in a linear correlation with the
v applied (10 mV s
−1 <
v < 50 mV s
−1,
R2 = 1.00). The shape of the measured CV curves near
E = 2 V and the oxidation-current peak behaviour (e.g., the irreversibility of the electro-oxidation process) indicate the specific adsorption/desorption process of TFSI
− anions (as well as of N4111(TFSI),
Table 1,
Figure S1a–i) taking place at ca.
E = 2.1 V at the previously activated Al electrode (
Figure 3b and
Figure S2c,d). We believe that the electrochemical decomposition of N4111(TFSI) was unlikely near
E = 2 V, as that process should have a diffusion speed-limited character, and we did not see visually or from the shape of the
I vs.
E relationships the formation of gas bubbles.
Continuing the potential forward scan, the oxidation current started to increase again at
E ≥ 6.50 V, leading to the formation of an anodic-current peak at ca.
E = 7.85 V (
Figure 3b and
Figure S2c,d). This oxidation-peak size increased when the CV forward-sweep range was extended to more positive values, indicating electrochemical activation of the Al electrode.
The analysis of the CV data, measured in the potential range of 0.0 V to 11.0 V and at various potential scan rates, indicated that the electro-oxidation process forming a current peak at
E = 7.80 V (
v = 1.0 mV s
−1,
i = 0.91 mA cm
−2) was diffusion-speed limited, whereas the relationship between the oxidation
Ip vs.
v1/2 was linear with a slope of 2.6 × 10
−3 A s
1/2 V
−1/2 (0.25 mV s
−1 ≤
v ≤ 50 mV s
−1,
R2 = 1.00) (
Figure 3b, inset). Thus, due to the very large intensity, irreversibility, and the shape of the CV curves near
E = 7.8 V, we believe that this diffusion-speed-limited process is connected with the electro-oxidation of the TFSI
− anion itself. The electrochemical oxidation of the TFSI
− anion can also explain the large variations in the
BE vs.
E slope values for the 1 s in situ X-ray spectra of the elements studied (
Table 1). However, although no changes are distinguishable in the shapes of the in situ X-ray spectra (measured in the potential range of
E = 0.0 V to
E = 11.0 V (
Figure 1)), except for the reduction of the PE-signal intensity, the formed TFSI
− electro-oxidation products remained very likely at the N4111(TFSI)|Al/Al
2O
3 interface (i.e., under thick N4111(TFSI) layer) or evaporated into the vacuum.
Although no Al 2p XPS signal was observed in situ within the potential range applied and studied, it confirms the results of previous studies [
4,
23,
40,
41] that all Al
3+ ions formed at the Al surface left near the N4111(TFSI)|Al/Al
2O
3 interface (i.e., that the salts of Al are insoluble in RTIL).
3.3. Results of Potentiostatic EIS Measurements
The potentiostatic EIS data were collected within the frequency range of 300 kHz down to 4 mHz, and a potential modulation amplitude of 5 mV was applied. The N4111(TFSI)|Al/Al2O3 system was given 120 s to relax at the selected potential before the start of the EIS measurement. The data of the second measurement were used for the following analysis. At the end of the second EIS measurement, the Al electrode potential was changed to a value 0.1 V higher. Using this method, the Al current collector was polarised and investigated in the range of 0.0 V to 8.0 V.
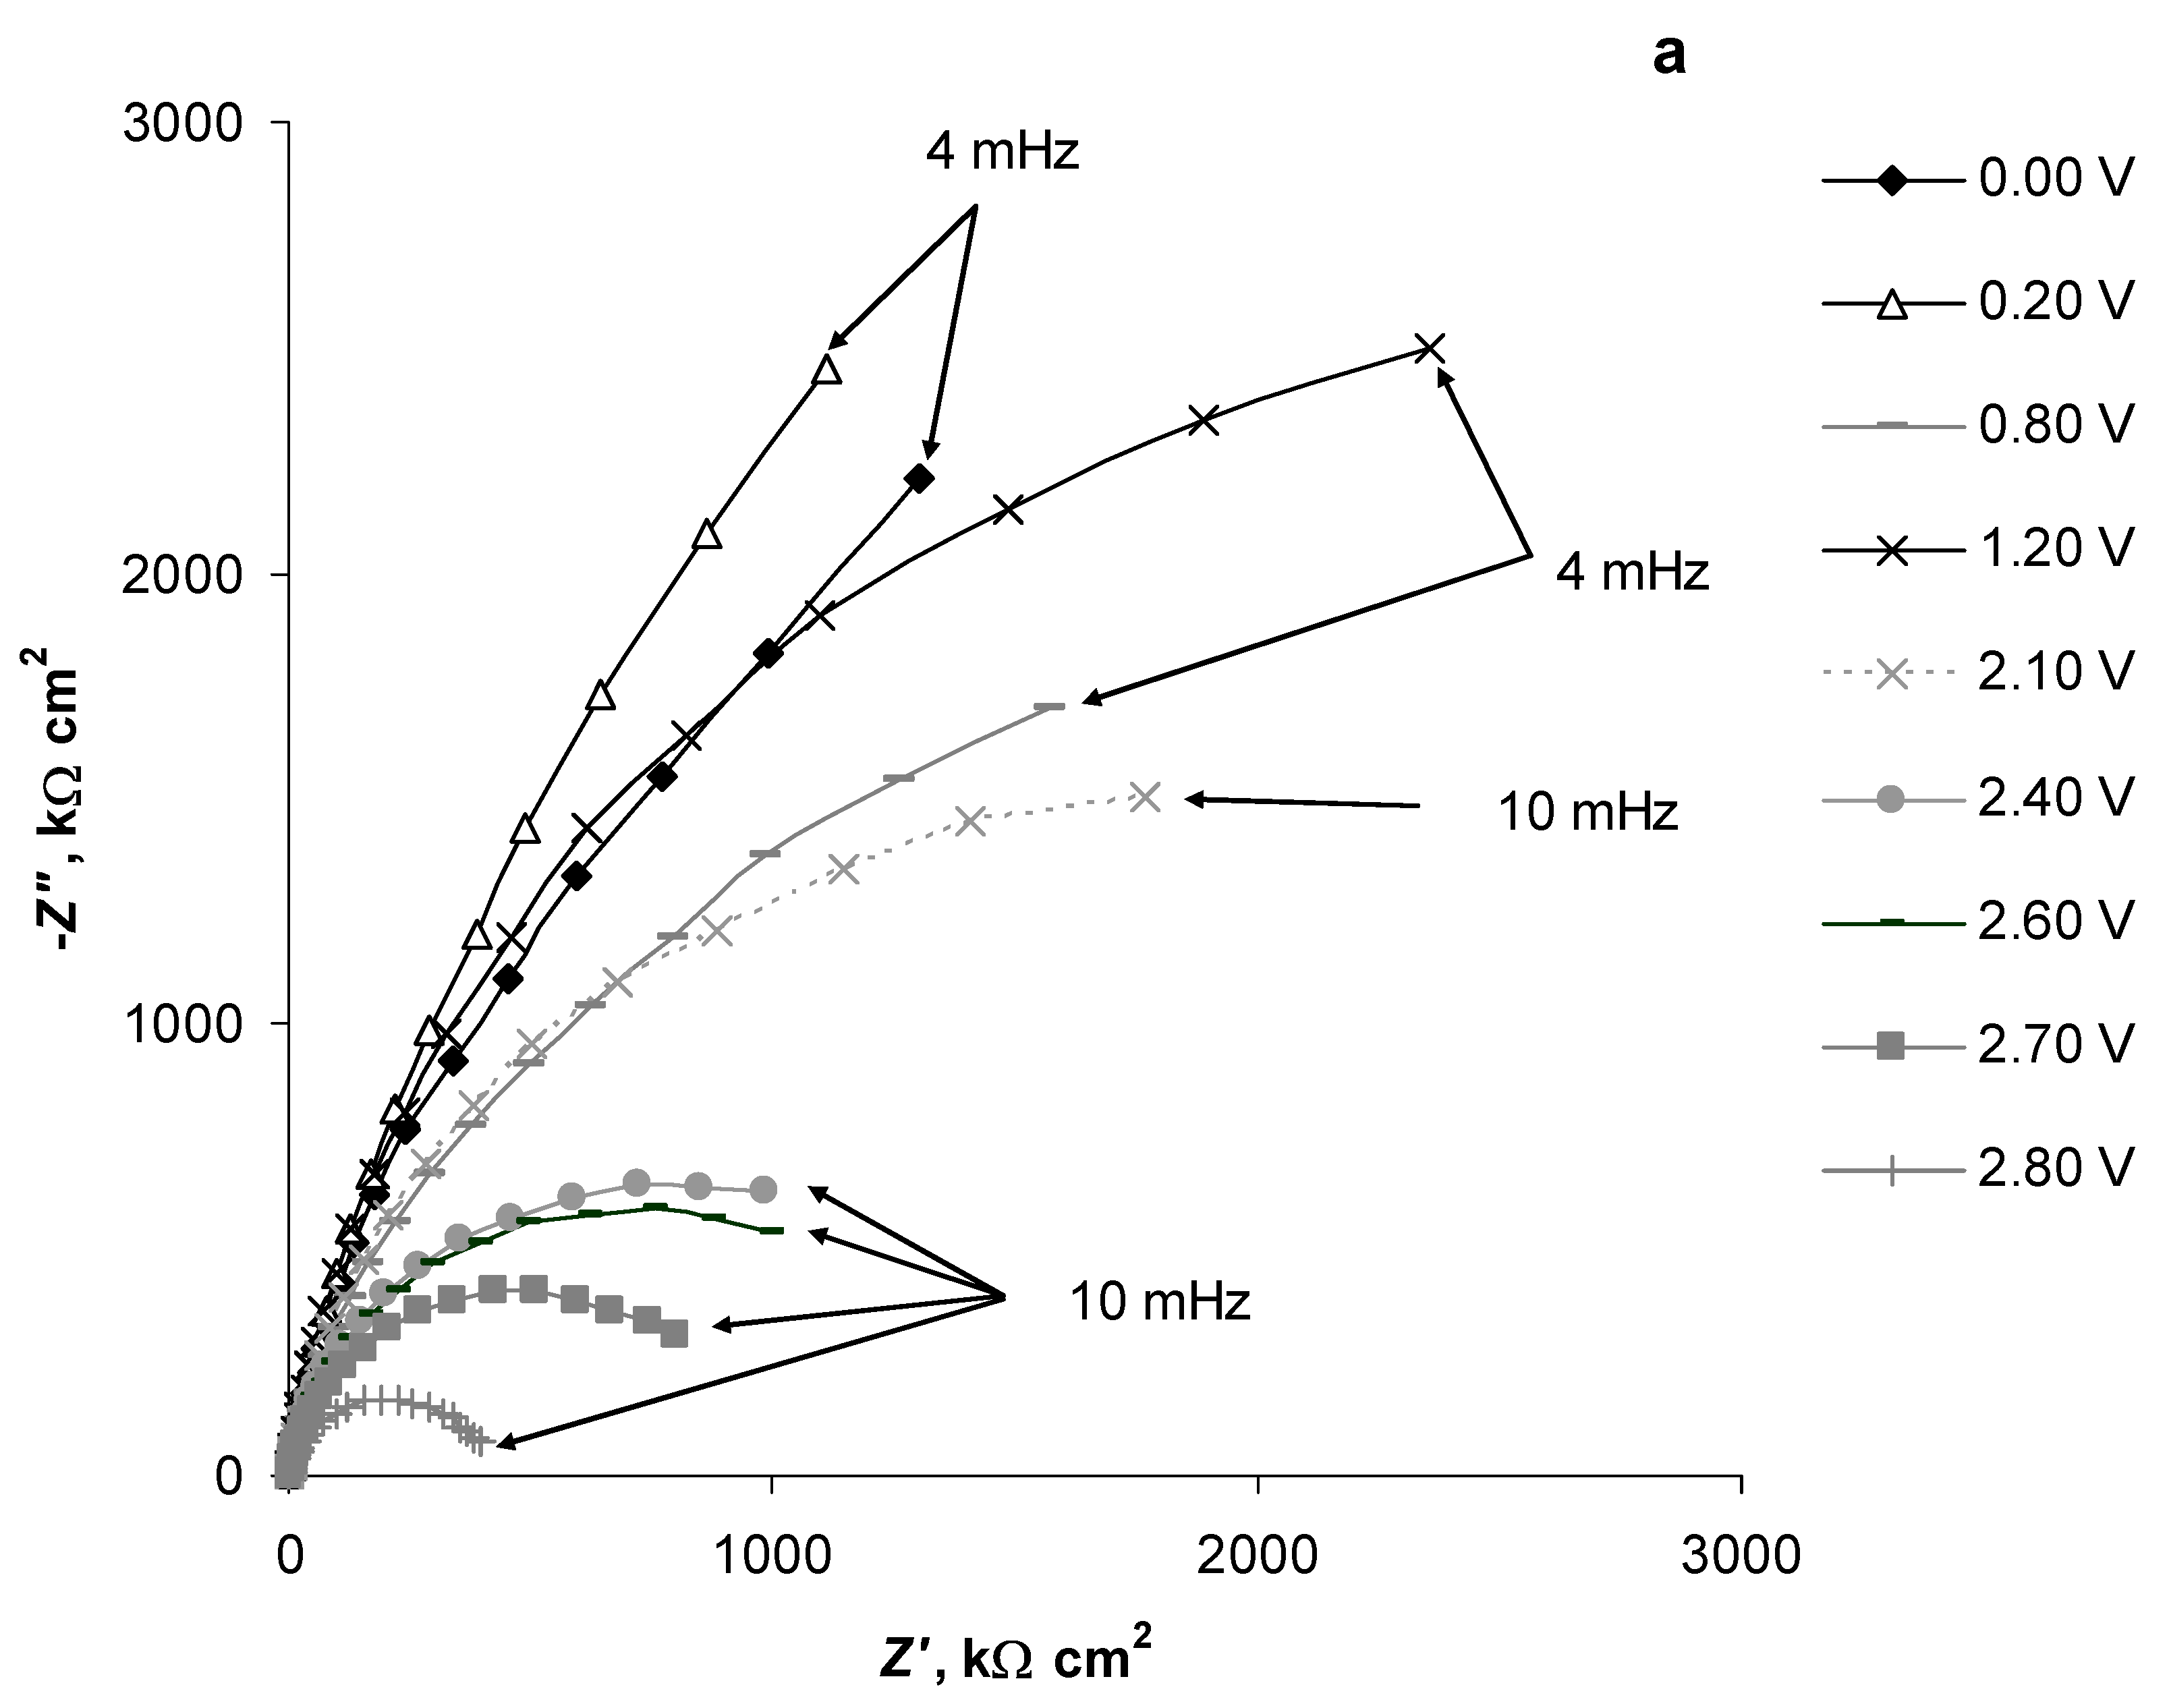
Nyquist plots, i.e., the relationships of the imaginary vs. real parts (−
Z″ vs.
Z′) of the electrochemical impedance measured in the potentiostatic regime, are presented in
Figure 4a–c. The −
Z″ vs.
Z′ dependences are characteristic for mixed kinetic processes (adsorption and mass-transfer step limited) and showed high −
Z″ values at very low frequencies within the potential range of 0.00 V to 0.50 V (
Figure 4a), indicating the absence of faradic processes and marking that the Al surface covered with Al
2O
3 [
11,
17,
22,
25,
26] behaved like an ideal capacitor. The Nyquist plot measured at
E = 0.70 V had much lower
Z′ and −
Z″ values at lower comparable frequencies and were moderately bent, indicating a finite length-diffusion process at Al/Al
2O
3 (i.e., some pitting corrosion) process at that potential (
Figure 4a), notable also in the CVs (
Figure 2). At
E ≥ 0.80 V, the size of −
Z″ vs.
Z′ curves increased somewhat towards larger
Z′ and –
Z″ values, indicating the filling of the pits and pores, leading to the decreasing of the pitting-corrosion speed at the Al electrode.
It is remarkable that the curves had the highest impedance values at the potentials 1.20 V and 1.30 V (higher than at
E = 0.70 V or 0.80 V), marking intermediate passivity of the N4111(TFSI)|Al system. At more positive potentials than
E = 1.30 V the
Z′ and –
Z″ values started slowly to reduce, and at
E > 2.10 V a steep activation of the N4111(TFSI)|Al system took place due to the start of the electro-oxidation of Al (discussed previously and notable in
Figure 3a), leading to a significant reduction of the appropriate impedance values and the formation of the semi arcs in the Nyquist-plot characteristic for diffusion and faradic step-limiting processes (
Figure 4a). The measured impedances were similar within the potential range from 2.40 V to 2.60 V, forming a group of semicircles. A current plateau was also notable in
Figure 4 at 2.30 V <
E < 2.60 V. At
E ≥ 2.70 V; the activity of the N4111(TFSI)|Al system started to increase further (
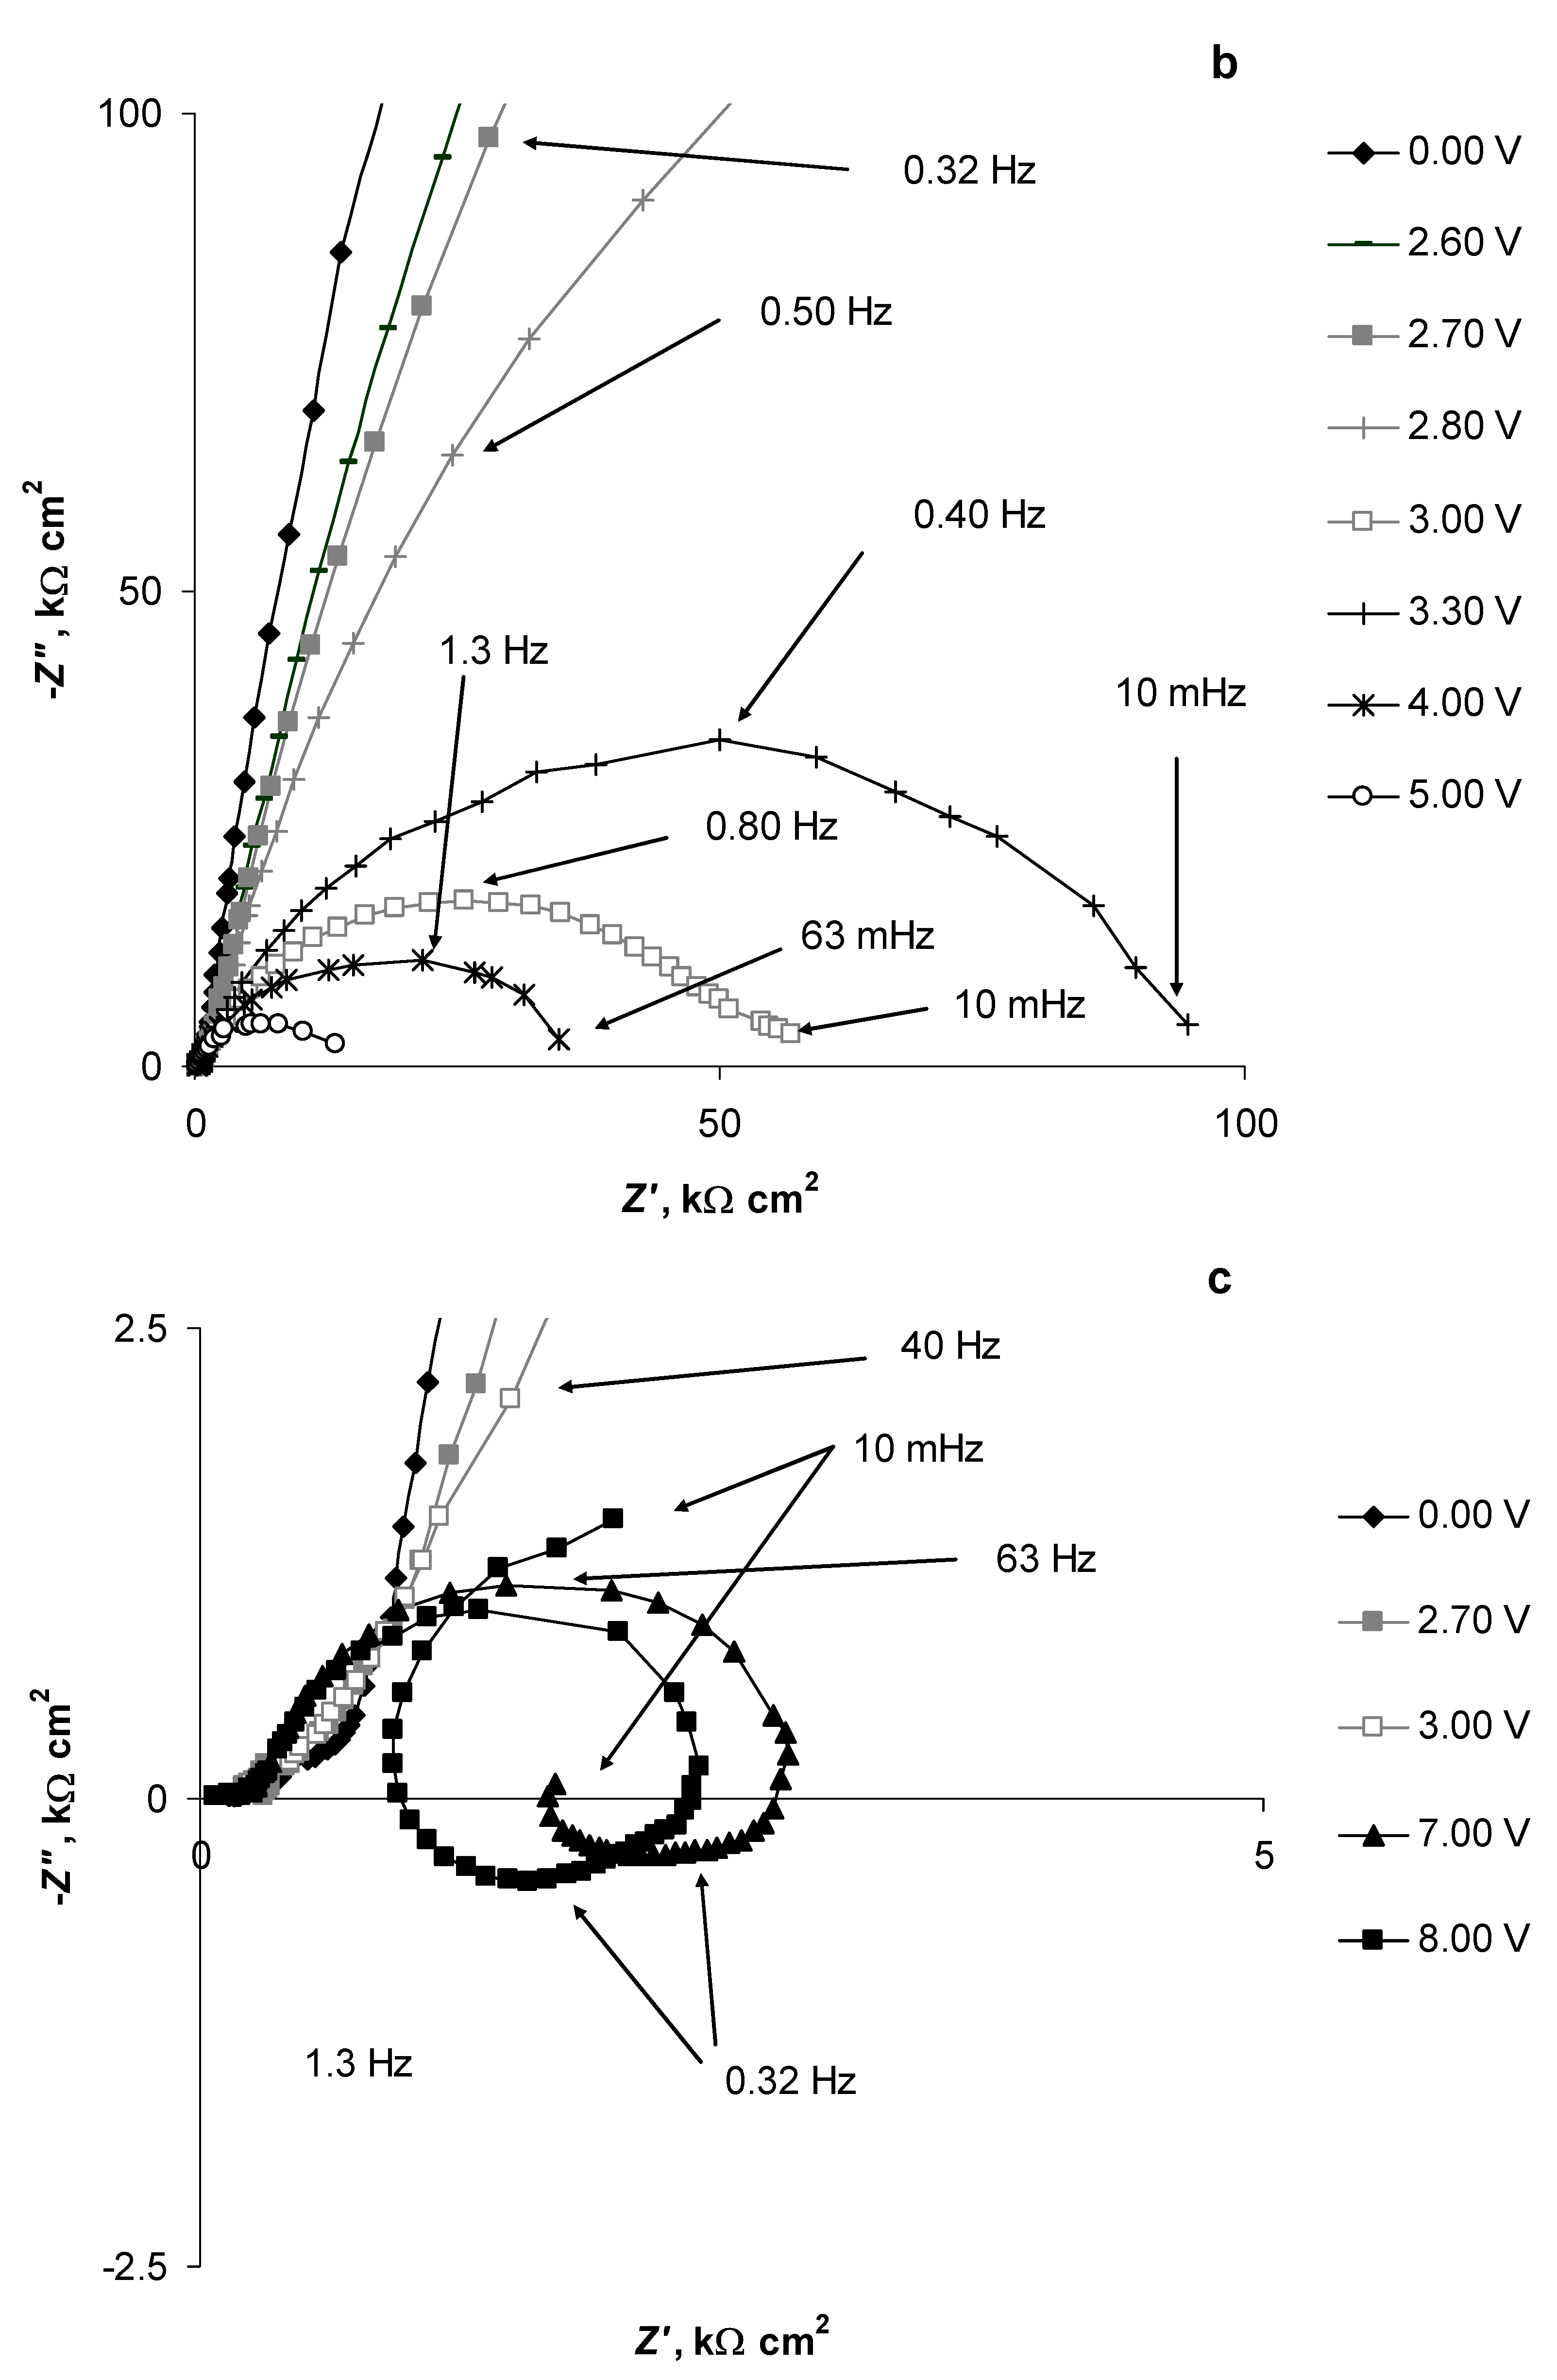
Figure 4a). A tiny semicircle formed in the Nyquist plot at
E = 3.00 V, indicating the intensification of the electrochemical processes at the N4111(TFSI)|Al/Al
2O
3 interface (
Figure 4b). This corresponds to the potential when the N4111(TFSI) started to chemosorb as the
BE vs.
E slopes became close to unity for the studied elements (
Figure 3a and
Table 1). The semicircle size (i.e., the maximum values of
Z′ and −
Z″) increased thereafter for a moment and continued to decrease again at
E > 3.30 V (
Figure 4b). (It is possible that this temporal reduction in the Al oxidation speed was caused by partial blocking of the Al/Al
2O
3 surface by adsorbed N4111(TFSI) and formed Al(TFSI)
3.) The following reduction of the
Z′ and −
Z″ values parallel with the increase of the Al electrode potential indicates the intensification of the Al electro-oxidation process. At
E = 7.00 V and 8.00 V (
Figure 4c), inductive loops formed in the low-frequency part of the EIS spectrum, indicating intense electrochemical oxidation and dissolution of the Al electrode, leading to probable roughening and expansion of its surface (
Figure 4c), which is also visible as the high-intensity electro-oxidation current peak in the CV curve at
E = 7.90 V in
Figure 3b. This means that at ca.
E = 7.0 V, when the TFSI
− anions electro-oxidation started (discussed previously), Al started to dissolve non-uniformly and the surface became rough. It is likely that the intense Al surface (e.g., expansion of the Al surface area) or near the Al surface-related relaxation processes, initiated by the intensive electrochemical oxidation of TFSI
− anions, are responsible for the formation of the inductive loops in the low-frequency part of the EIS Nyquist plot (
Figure 4c) [
13,
42]. Due to the high physical instability of the N4111(TFSI)|Al/Al
2O
3 system, the measured EIS data were noisy at the potentials higher than 8.00 V, and therefore, at more positive potentials collected EIS data analysis was impossible.
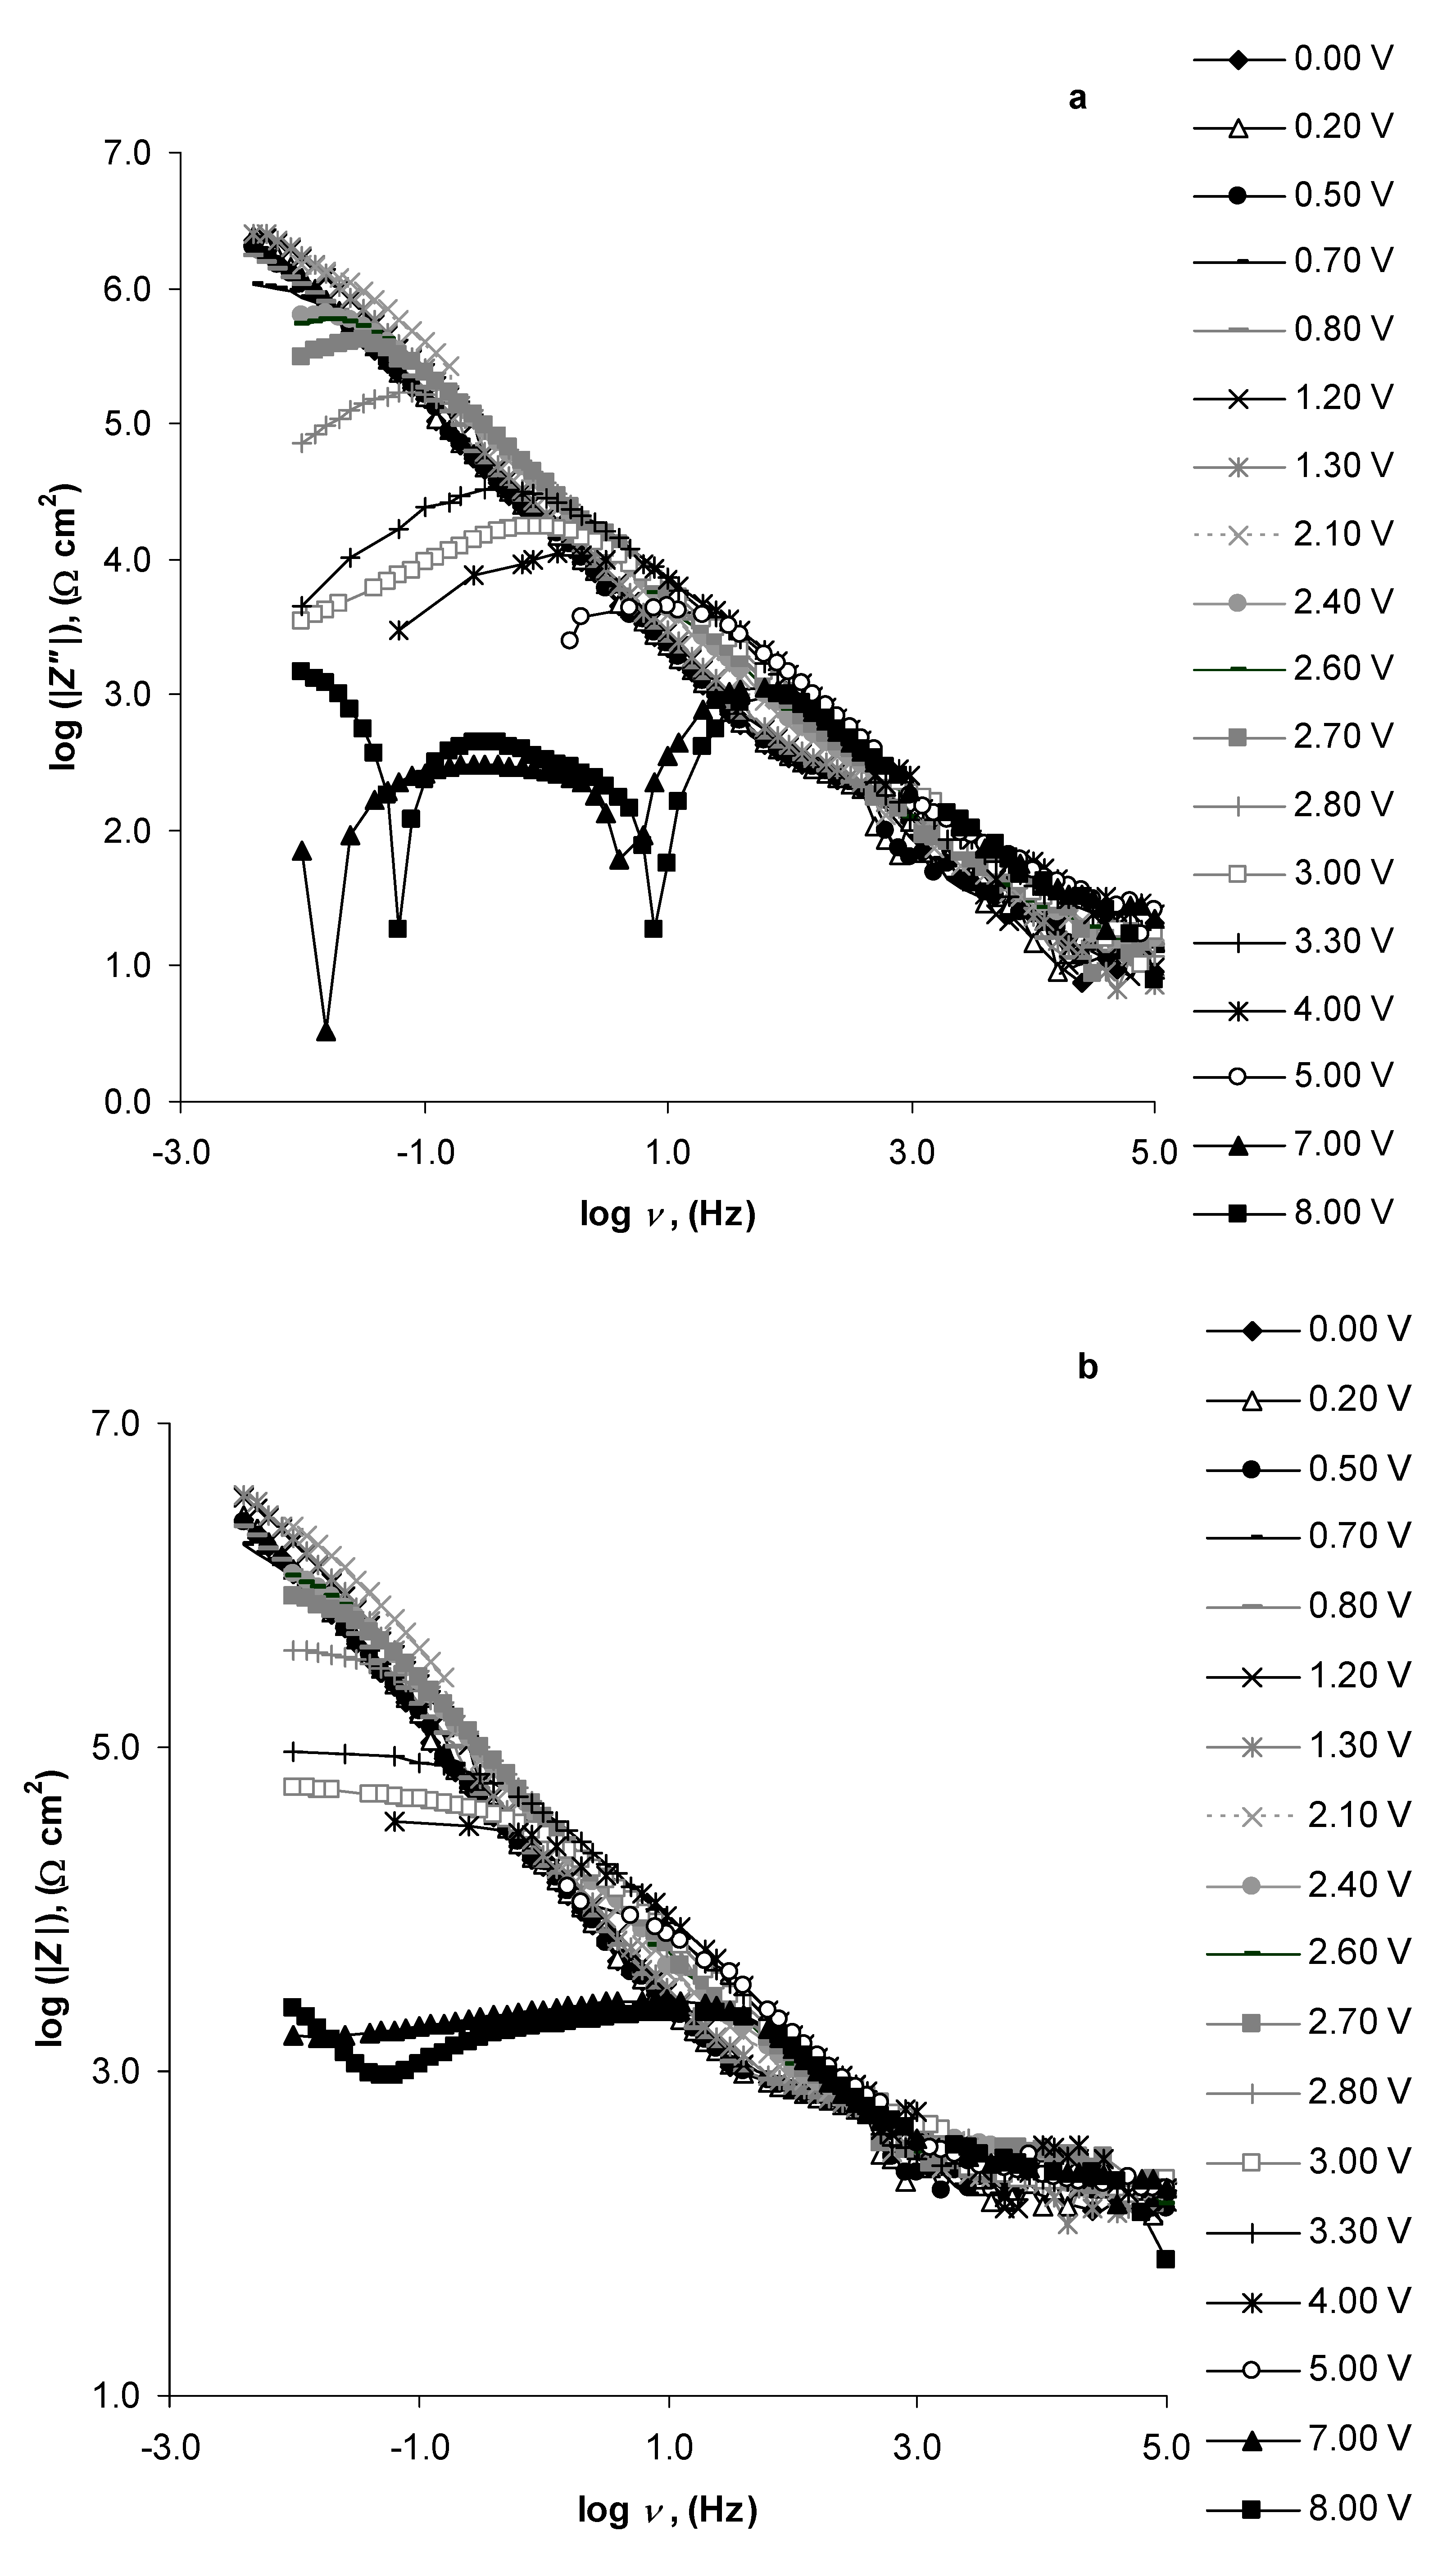
Figure 5a shows that the log |
Z″| vs. log-frequency (
ν) plots were linear with a slope of −0.84 in the log
ν range from −1.60 (Hz) to 3.80 (Hz) and in the potential range of 0.00 V to 2.10 V, indicating that the N4111(TFSI)|Al/Al
2O
3 system behaved almost like an ideally polarisable system. At
E ≥ 2.40 V, a maximum started to form at low frequencies. By increasing the Al/Al
2O
3 electrode potential, this log |
Z″| maximum moved towards higher frequencies and obtained a peak-like shape. This change in the log |
Z″| vs. log
ν plot shapes indicated the activation of the Al/Al
2O
3 electrode and the start of faradic processes. The log |
Z″| vs. log
ν plots, measured at
E = 7.00 V and
E = 8.00 V, had two characteristic minimums at
ν = 3.9 Hz and
ν = 16 mHz, and at
ν = 7.9 Hz and
ν = 63.2 mHz (corresponding to |
Z″| = 0 in the Nyquist plots), respectively (
Figure 5a).
Log |
Z| vs. log
ν plots were linear in the log
ν range from −2.40 to 1.60 (Hz) and in the potential range from 0.00 V to 2.40 V with a slope of –0.88 (
Figure 5b). However, at
E ≥ 2.40 V it started to bend, and at the lowest frequencies it formed a plateau, indicating that the N4111(TFSI)|Al/Al
2O
3 system entered the mixed kinetic region. As the Al-electrode potential increased, the plateau started to form at higher frequencies and had a lower log |
Z| value. The log |
Z| vs. log
ν plot, measured at
E = 7.0 V, had a log |Z| plateau that started to form at log
ν ≤ 1.60 (Hz), obtaining a log |Z| maximum at log
ν = 0.95 (Hz), and then started to continuously decrease with a very small slope at lower frequencies (
Figure 5b). The log |
Z| vs. log
ν plot, measured at
E = 8.0 V, also started to form a log |
Z| plateau at
E ≤ 1.60 (Hz); however, since it passed a log |
Z| maximum at log
ν = 1.09 (Hz), the values of log |
Z| started very slowly to reduce again. At log
ν = −0.6 (Hz) the reduction intensified and formed a minimum (log |
Z| = 2.97) at log
ν = −1.30 (Hz) (
Figure 5b). The minimum formed at the
E = 8.0 V measured log |
Z| vs. log
ν plot’s low-frequency section overlapped with the low-frequency inductive loop and the start of a new semi-circle (visible in the Nyquist plot,
Figure 4c), indicating the presence of a slow reorganisation process at the N4111(TFSI)|Al interface.
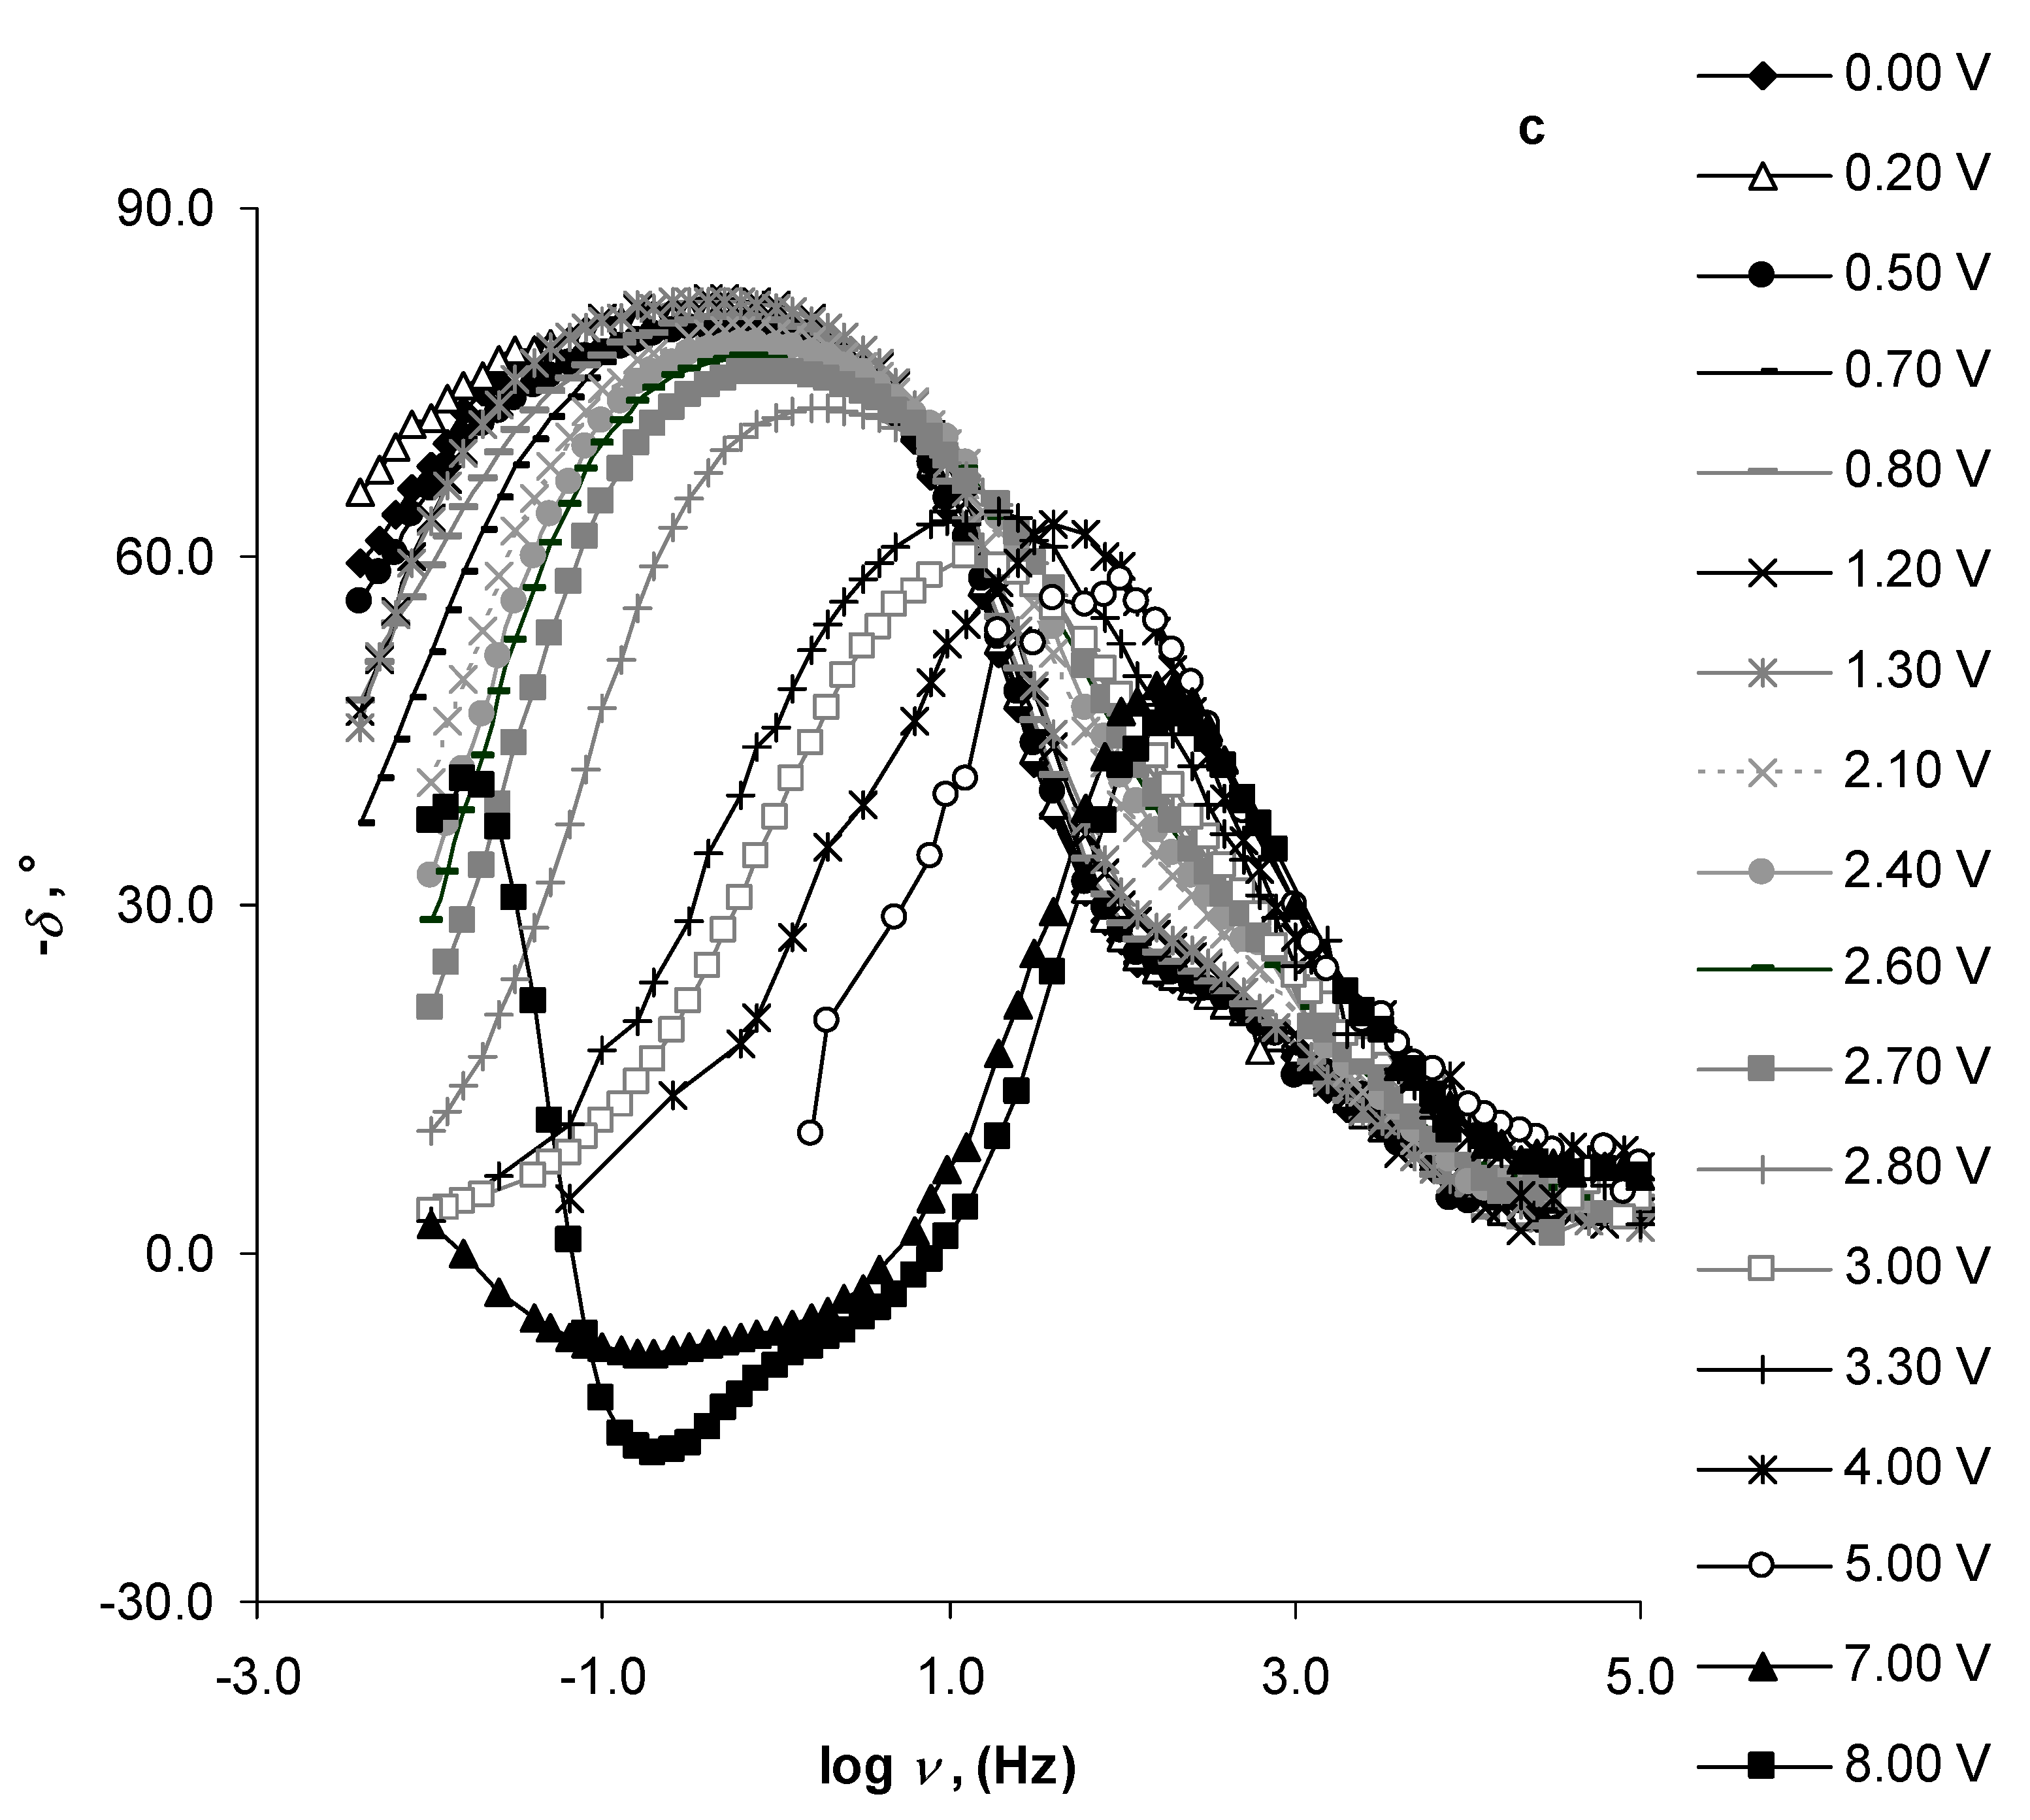
The phase angle (
δ) vs. log
ν plots (
Figure 5c) show that the N4111(TFSI)|Al/Al
2O
3 system was nearly ideally polarisable at
E = 1.20 V and
E = 1.30 V, when the phase angles were the most negative
δ = −82° (
ν = 0.40 Hz), as noted in the Nyquist plots at the same potentials (
Figure 4a). At more positive Al potentials, the phase-angle values started slowly to increase. That process intensified at
E > 2.60 V, marking the start of faradic processes. It is remarkable that the second phase-angle peak formed in the –
δ vs. log
v plot at
E = 8.00 V and log
v = −1.80 (Hz) (
Figure 5c). This phase-angle peak indicates the presence of the second adsorption-step limited electrochemical process, having a much smaller time constant and running parallel to the Al electro-oxidation process.
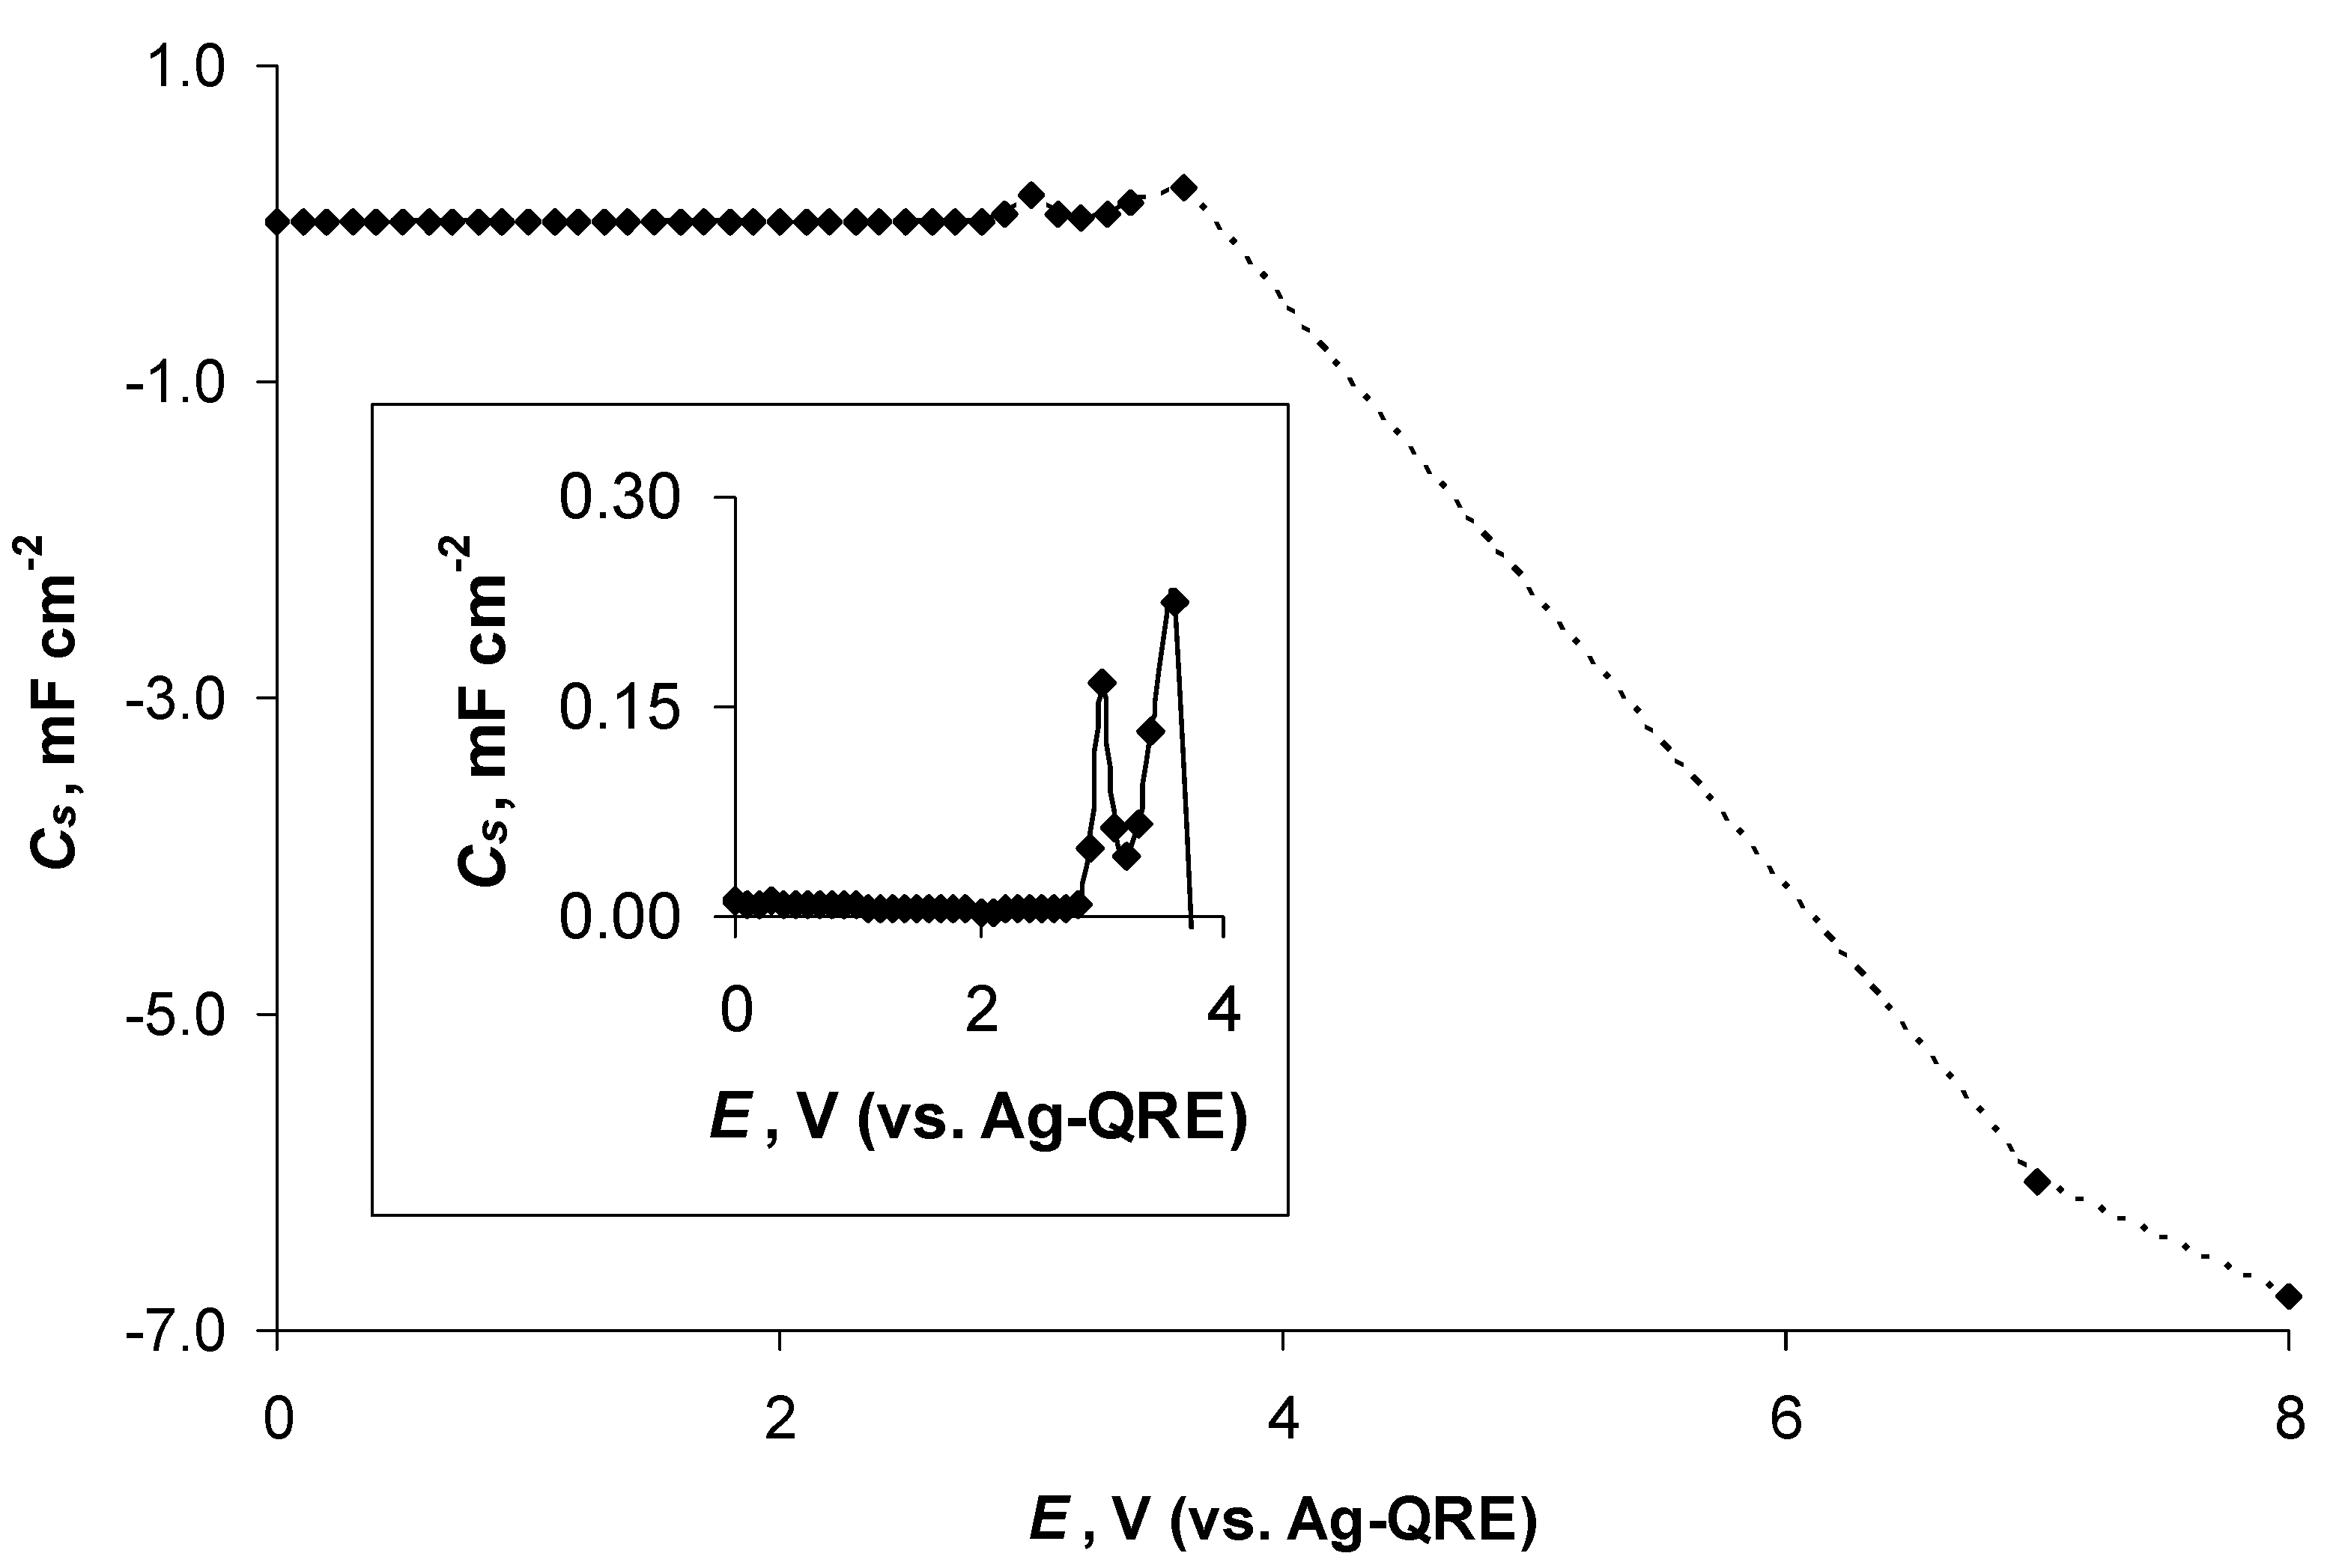
The series-capacitance (
Cs) values, measured at the EIS modulation frequency
ν = 0.10 Hz and calculated as described in Refs. [
43,
44], were very stable until
E = 3.00 V, when a capacitance peak formed (
Cs = 0.17 mF cm
−2), indicating a strong (specific) adsorption or faradic process at the Al electrode. The second
Cs increase was at
E = 3.60 V (
Figure 6), indicating the expansion of the SEI layer. This information is in good agreement with the in situ XPS and CV data discussed previously and confirms N4111(TFSI)-specific adsorption with a partial charge-transfer step at the Al/Al
2O
3 electrode, followed by Al(TFSI)
3 formation at the electrode surface.
It should be mentioned that it was impossible to analyse EIS data, collected at
ν = 0.10 Hz, for the N4111(TFSI)|Al system within the potential range of 3.60 V <
E < 7.00 V while the recorded spectrum was unstable at low modulation frequencies. This instability was caused by intensive electro-oxidation of the Al electrode, adsorption of N4111(TFSI) at the Al/Al
2O
3 interface, and the formation of Al(TFSI)
3. The
Cs values at
E = 7.00 V and
ν = 0.10 Hz (
Cs = −6.1 mF cm
−2) and
E = 8.00 V and
ν = 0.10 Hz (
Cs = −6.8 mF cm
−2) were negative due to the formation of the inductive loops in the EIS spectra caused by intensive electrochemical oxidation of the TFSI
− anion, dissolution of the Al electrode, and reorganisation of the Al surface at these potentials (
Figure 4c,
Figure 5a–c and
Figure 6) [
13,
42].
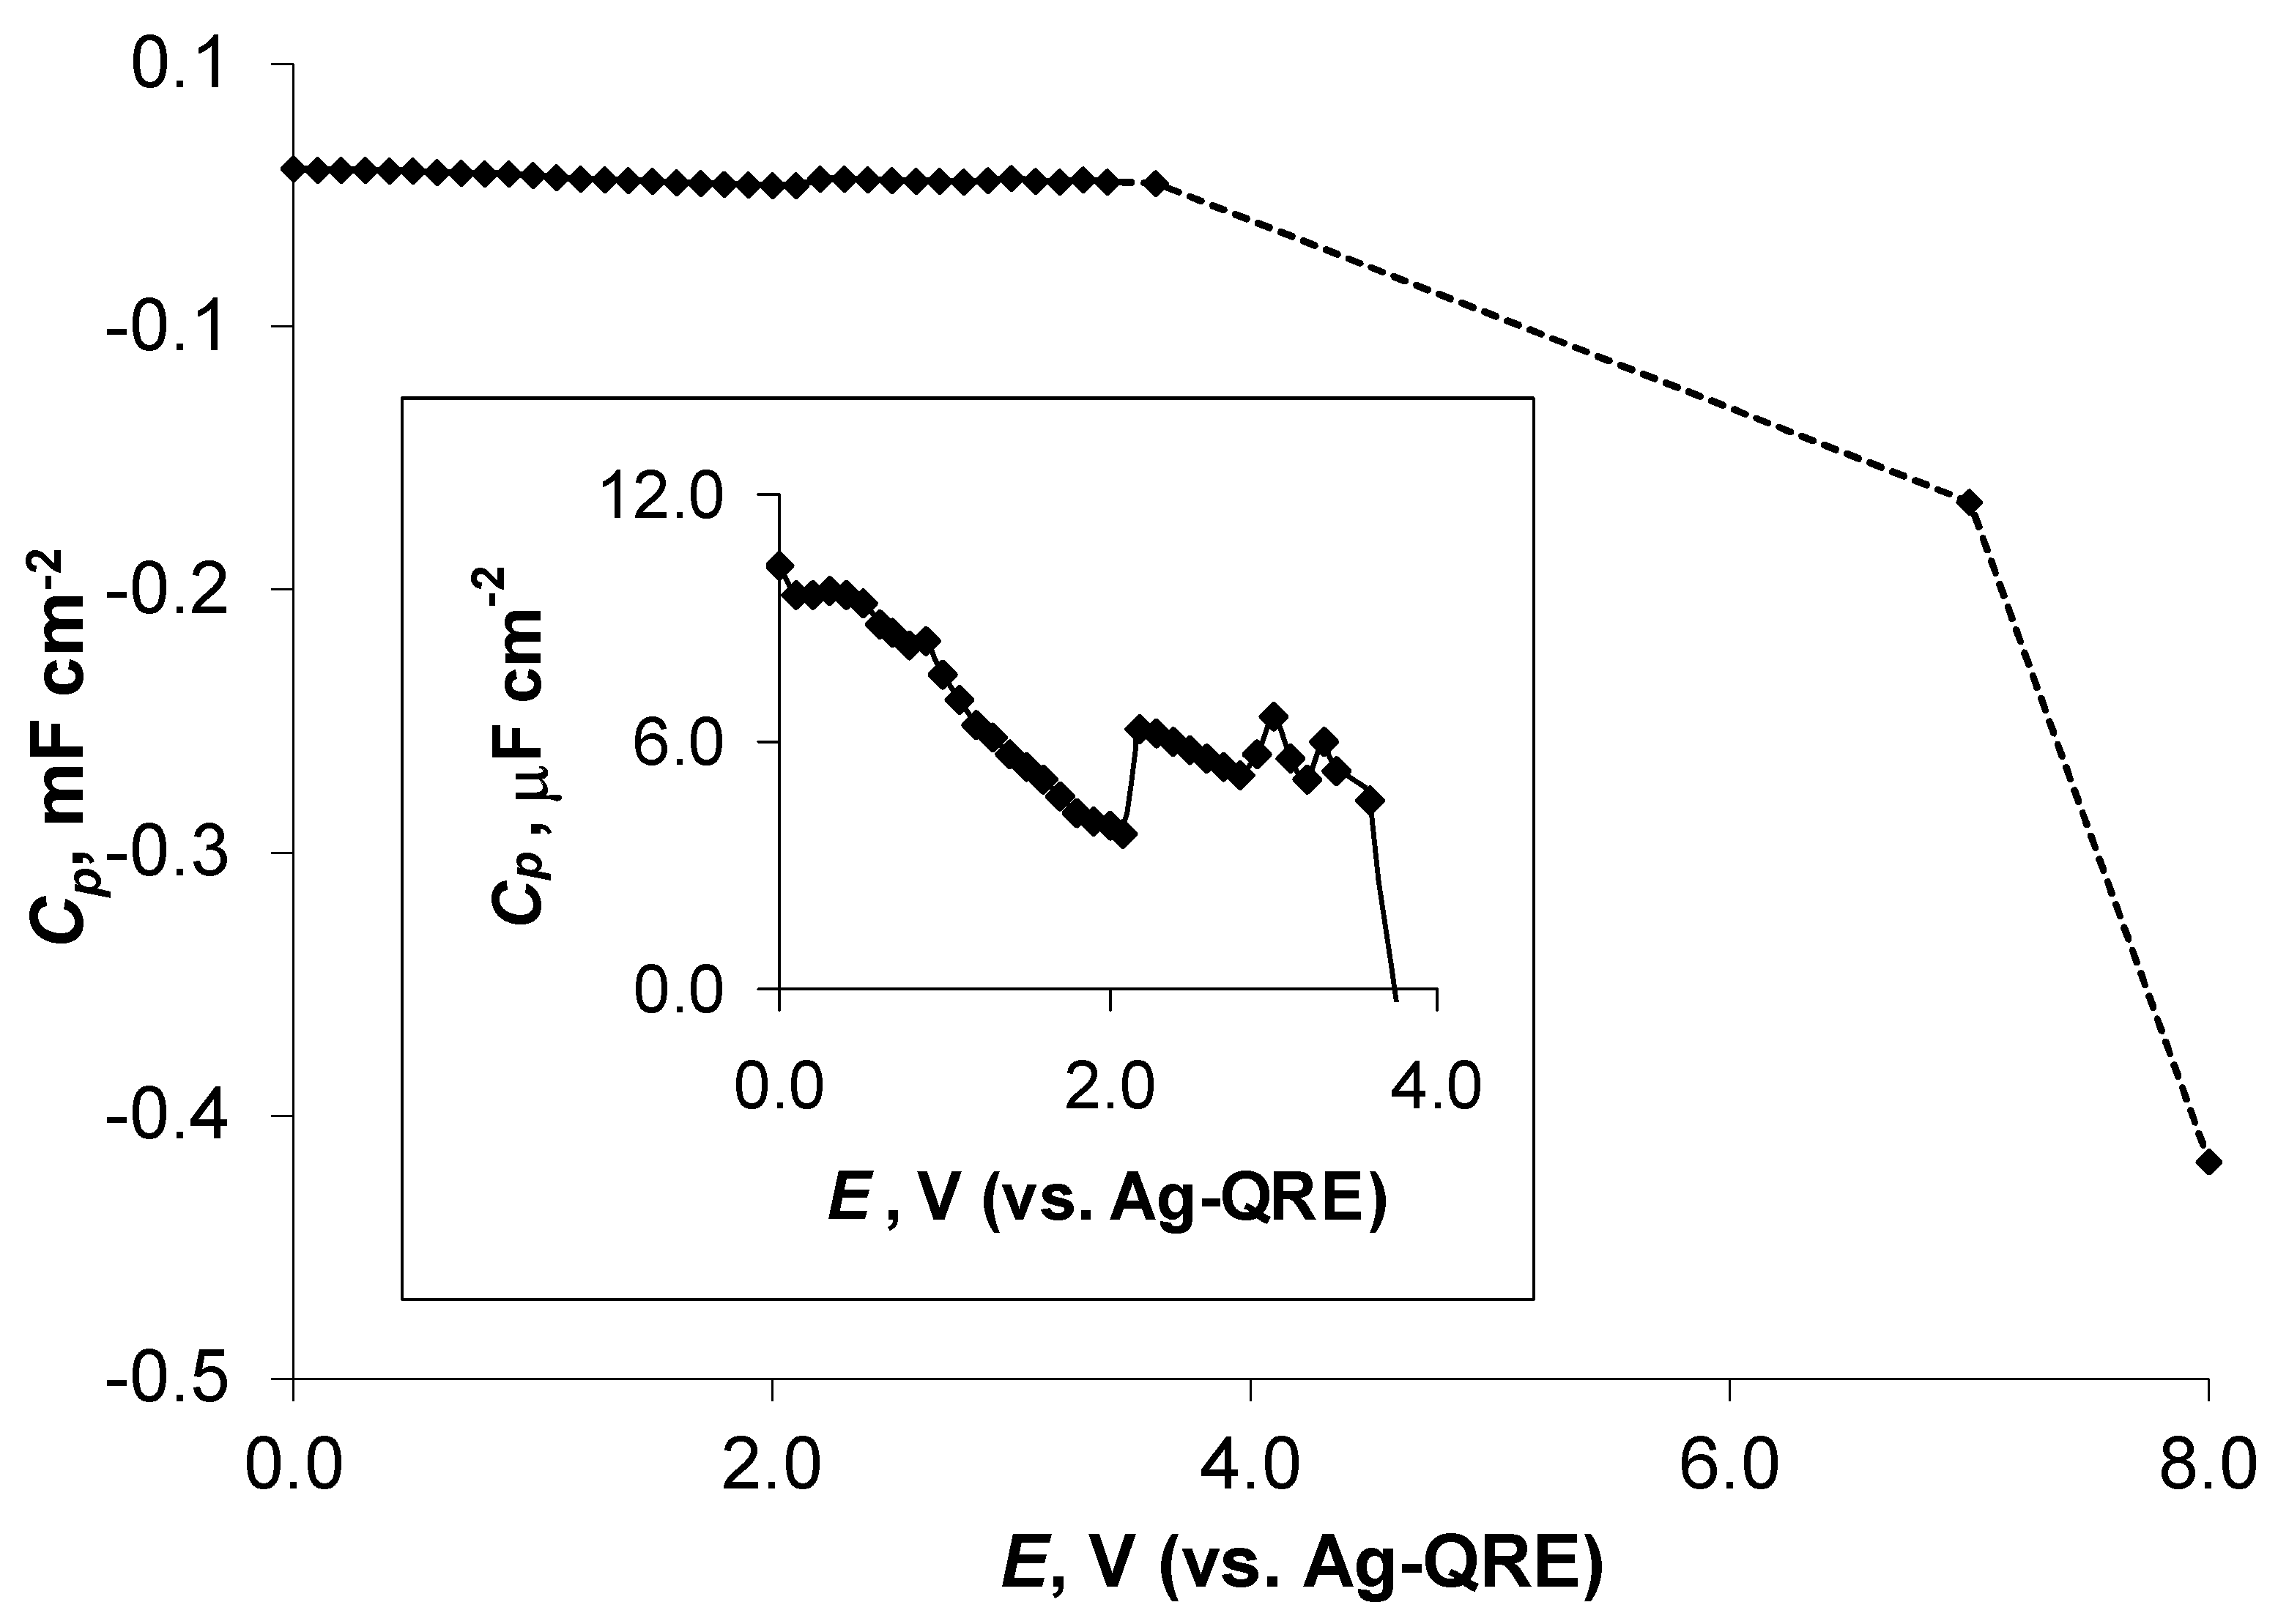
The parallel-capacitance (
Cp) values (describing the capacitance of the electrical double layer at the electrode surface), measured at the modulation frequency
ν = 0.10 Hz and calculated from the impedance data [
44], showed a similar trend, presented in
Figure 6, for
Cs. Values of
Cp slightly decreased from 0.00 V to 3.60 V, indicating that the properties of the electrical double layer changed very little at N4111(TFSI)|Al/Al
2O
3 in this potential region (
Figure 7). At
E > 3.60 V, the N4111(TFSI)|Al system became unstable. However, the
Cp values, calculated from the EIS low-frequency data measured at
E = 7.00 V and
E = 8.00 V, were significantly reduced. The negative values of
Cp = −0.12 mF cm
−2 at
E = 7.00 V and −0.37 mF cm
−2 at
E = 8.00 V were caused by intensive electrochemical oxidation processes, leading to the formation of the inductive loop in the EIS Nyquist plot at the low-frequency section. Thus, the intensive electro-oxidation and dissolution of the Al electrode, electro-oxidation of the TFSI
− anion, and variable relaxation processes, including the instability of the electrical double layer, took place at the N4111(TFSI)|Al interface [
13,
42].
The dependence of the ratio
Cp ·
Cs−1 on
E, being an indicator of the ideal polarisability of an investigated electrochemical system [
44], had the closest values to the unity from
E = 0.00 V to
E = 2.60 V (from
Cp ·
Cs−1 = 0.97 to 0.88, respectively) (
Figure 8). The N4111(TFSI)|Al system was nearly ideally polarisable up to
E = 2.60 V (
Cp ·
Cs−1 = 0.88), marking the end of the high-stability region for the N4111(TFSI)|Al interface. At more positive potentials, a steep decrease in the
Cp ·
Cs−1 values took place, obtaining a minimum at
E = 3.00 V (
Cp ·
Cs−1 = 0.04) corresponding to a high-intensity charge-transfer process due to the start of intensive electrochemical oxidation of the Al electrode (
Figure 3a and
Figure 8).
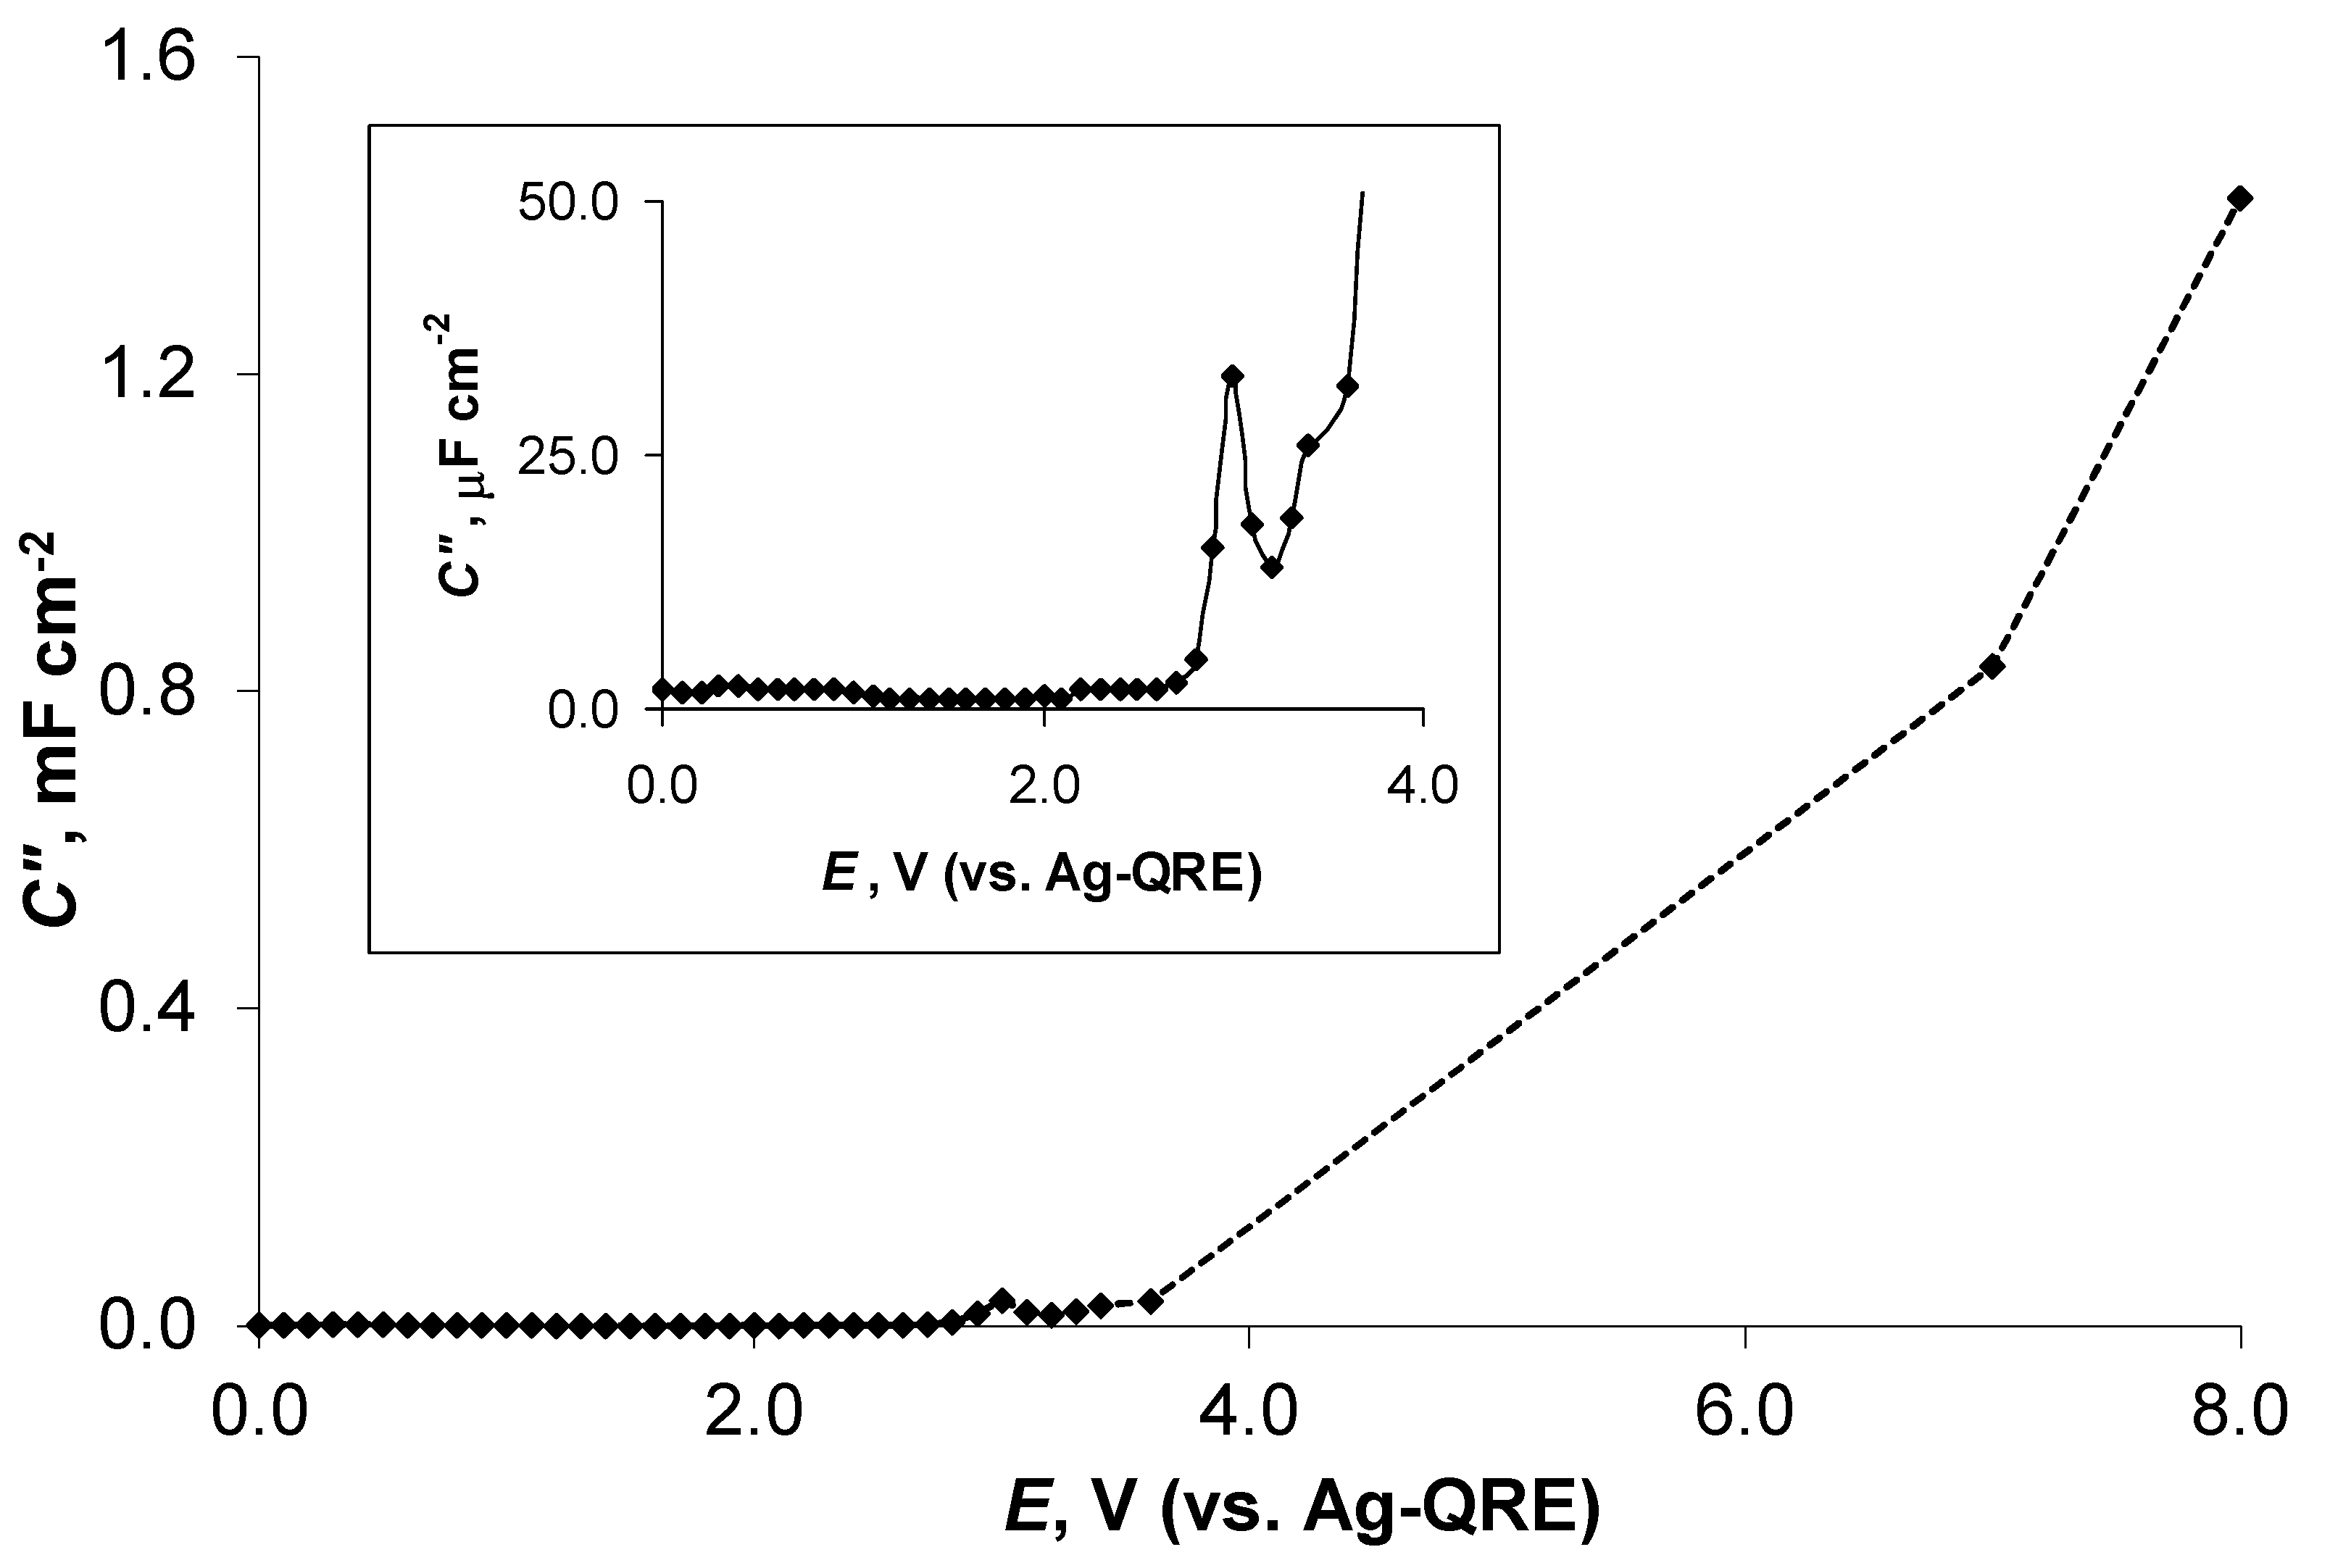
The values of imaginary capacitance
C″, measured at the modulation frequency
ν = 0.10 Hz, were calculated as in refs. [
44,
45]. High
C″ values indicate the presence of energy dissipation by an irreversible electro-oxidation process that leads to the appearance of hysteresis (e.g., to the formation of the current hysteresis in the CV curves (
Figure 3a and
Figures S2a–d and S3a–d) or to the formation of the inductive loops in the Nyquist plots at very low
ν values (
Figure 4c)) [
45]. The
C″ vs.
E graph showed a peak at
E = 3.00 V (
C″ = 33 μF cm
−2), i.e., at the potential of starting the specific adsorption of N4111(TFSI) and electro-oxidation processes at Al (i.e., the formation of Al(TFSI)
3) according to the in situ XPS measurements (
Table 1), followed by a continuous increase in the values of
C″ at
E > 3.20 V up to
C″ = 1.4 mF cm
−2 at
E = 8.00 V (
Figure 9) when the low-frequency inductive loop appeared in the Nyquist plot (
Figure 4c). It must also be mentioned that at 3.00 V <
E < 6.50 V, intensive Al electro-oxidation and the formation of N4111(TFSI)-insoluble Al(TFSI)
3 was observed. Thus, the
C″ data are in very good agreement with the in situ XPS and voltammetric-measurement results.
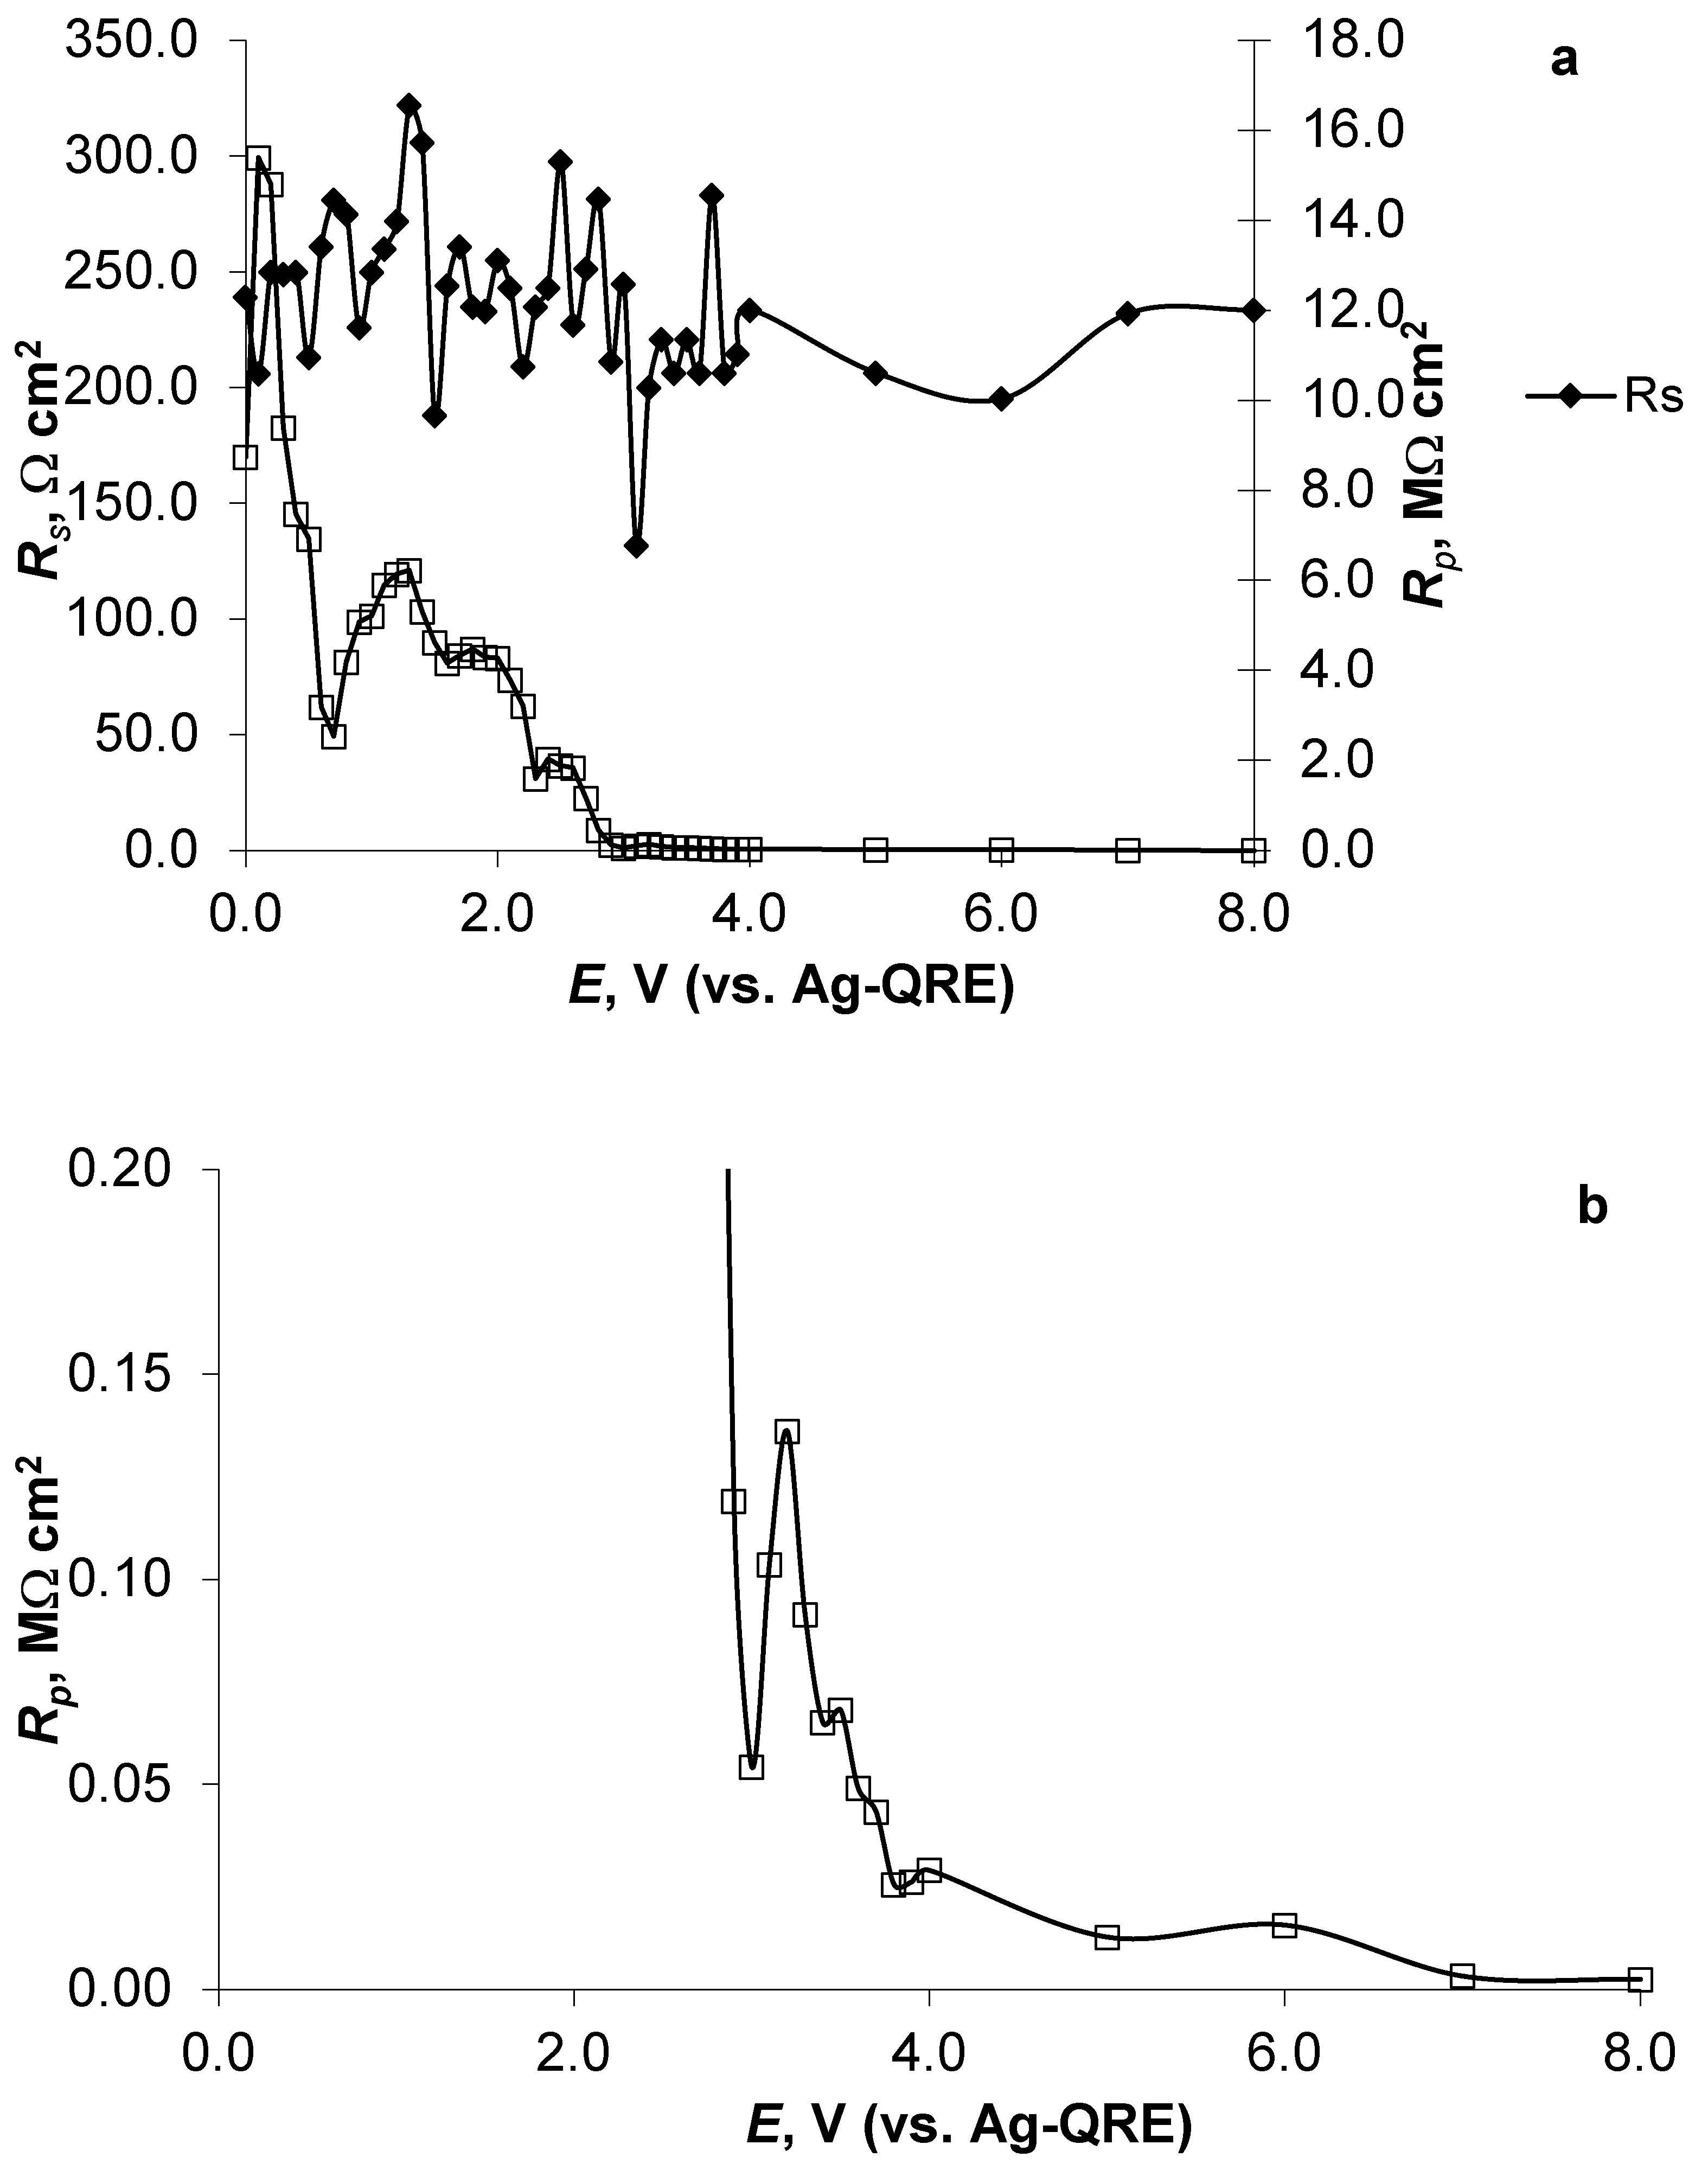
It should be noted that the series resistance (
Rs), calculated from the EIS fitting data and describing the electrode material (i.e., current collector) + SEI + electrolyte resistance, was stable (
Rs = 250 ± 50 Ω cm
2) throughout the potential range applied (0.00 V ≤
E ≤ 8.00 V) (
Figure 10a). This indicates that the electrolyte resistance gave the largest contribution to the
Rs value. The high values of parallel resistance (
Rp), calculated from the EIS fitting data and reflecting the low intensity of faradic processes or the slow mass-transport step of ions through the SEI layer, were reduced with the application of more positive potentials passing an intermediate minimum at
E = 0.70 V (
Rp = 2.5 MΩ cm
2) and a maximum at
E = 1.30 V (
Rp = 6.2 MΩ cm
2), decreasing continuously thereafter due to the intensification of the faradic processes (
Figure 10a).
Cs, Cp, Cp Cs−1, Rs, and Rp data reflect the complicated and sophisticated nature of the N4111(TFSI)|Al/Al2O3 system and the SEI-formation process at the Al/Al2O3 surface in N4111(TFSI). The EIS data indicate that Al current collectors, covered initially only with a thin layer of Al2O3 and formed in dry air at room temperature, can be polarised in N4111(TFSI) (as the electrolyte in the EDLC) up to E = 2.6 V. At more anodic potentials, intensive faradic processes started to be reflected by the steep reduction of the Cp Cs−1 ratio. We propose that at E > 2.6 V, intensive electro-oxidation process of the Al-current-collector interface started leading to the formation of an Al(TFSI)3 (and probably also AlF3) layer at E ≥ 3.00 V.
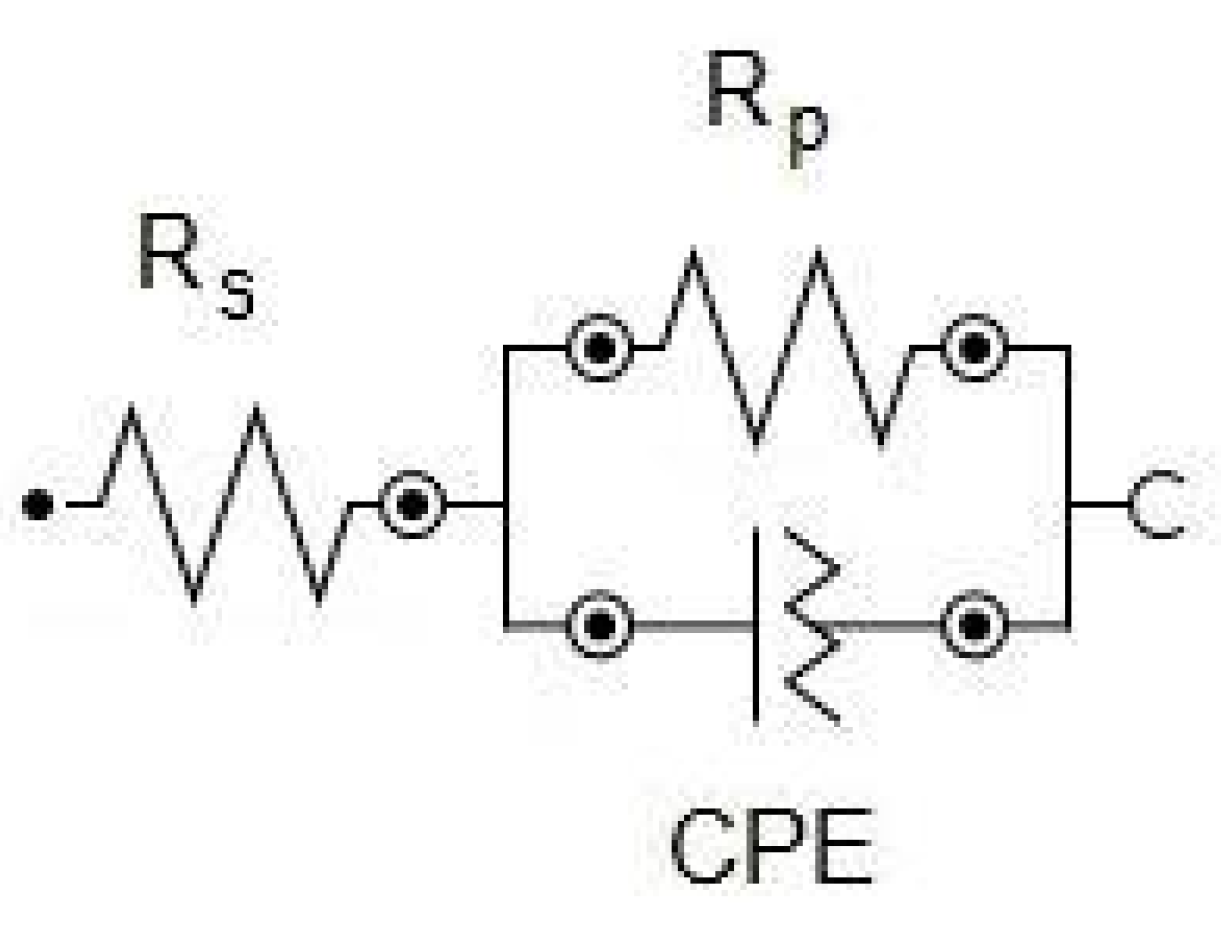
It should be mentioned that the
Rs and
Rp values at
E = 7.00 V and
E = 8.00 V, respectively, were calculated from the EIS data based on the simple equivalent circuit shown in
Scheme 1. However, it is obvious from the Nyquist and Bode plots that this simple circuit did not describe the real situation, i.e., the formation of the low-frequency inductive loops at
E = 7.00 V and
E = 8.00 V, respectively. Therefore, the EIS data at
E = 7.00 V should be fitted using the equivalent circuit shown in
Scheme 2a, which is very similar to the one described in [
13,
46,
47,
48]. This equivalent circuit contains (1) a resistor in series (R
s), (2) a first oscillation ring containing a resistor (R
1) and a constant phase element (CPE
1) connected in parallel, and (3) a second oscillation ring containing a resistor (R
2 marking charge-transfer resistance), a constant phase element (CPE
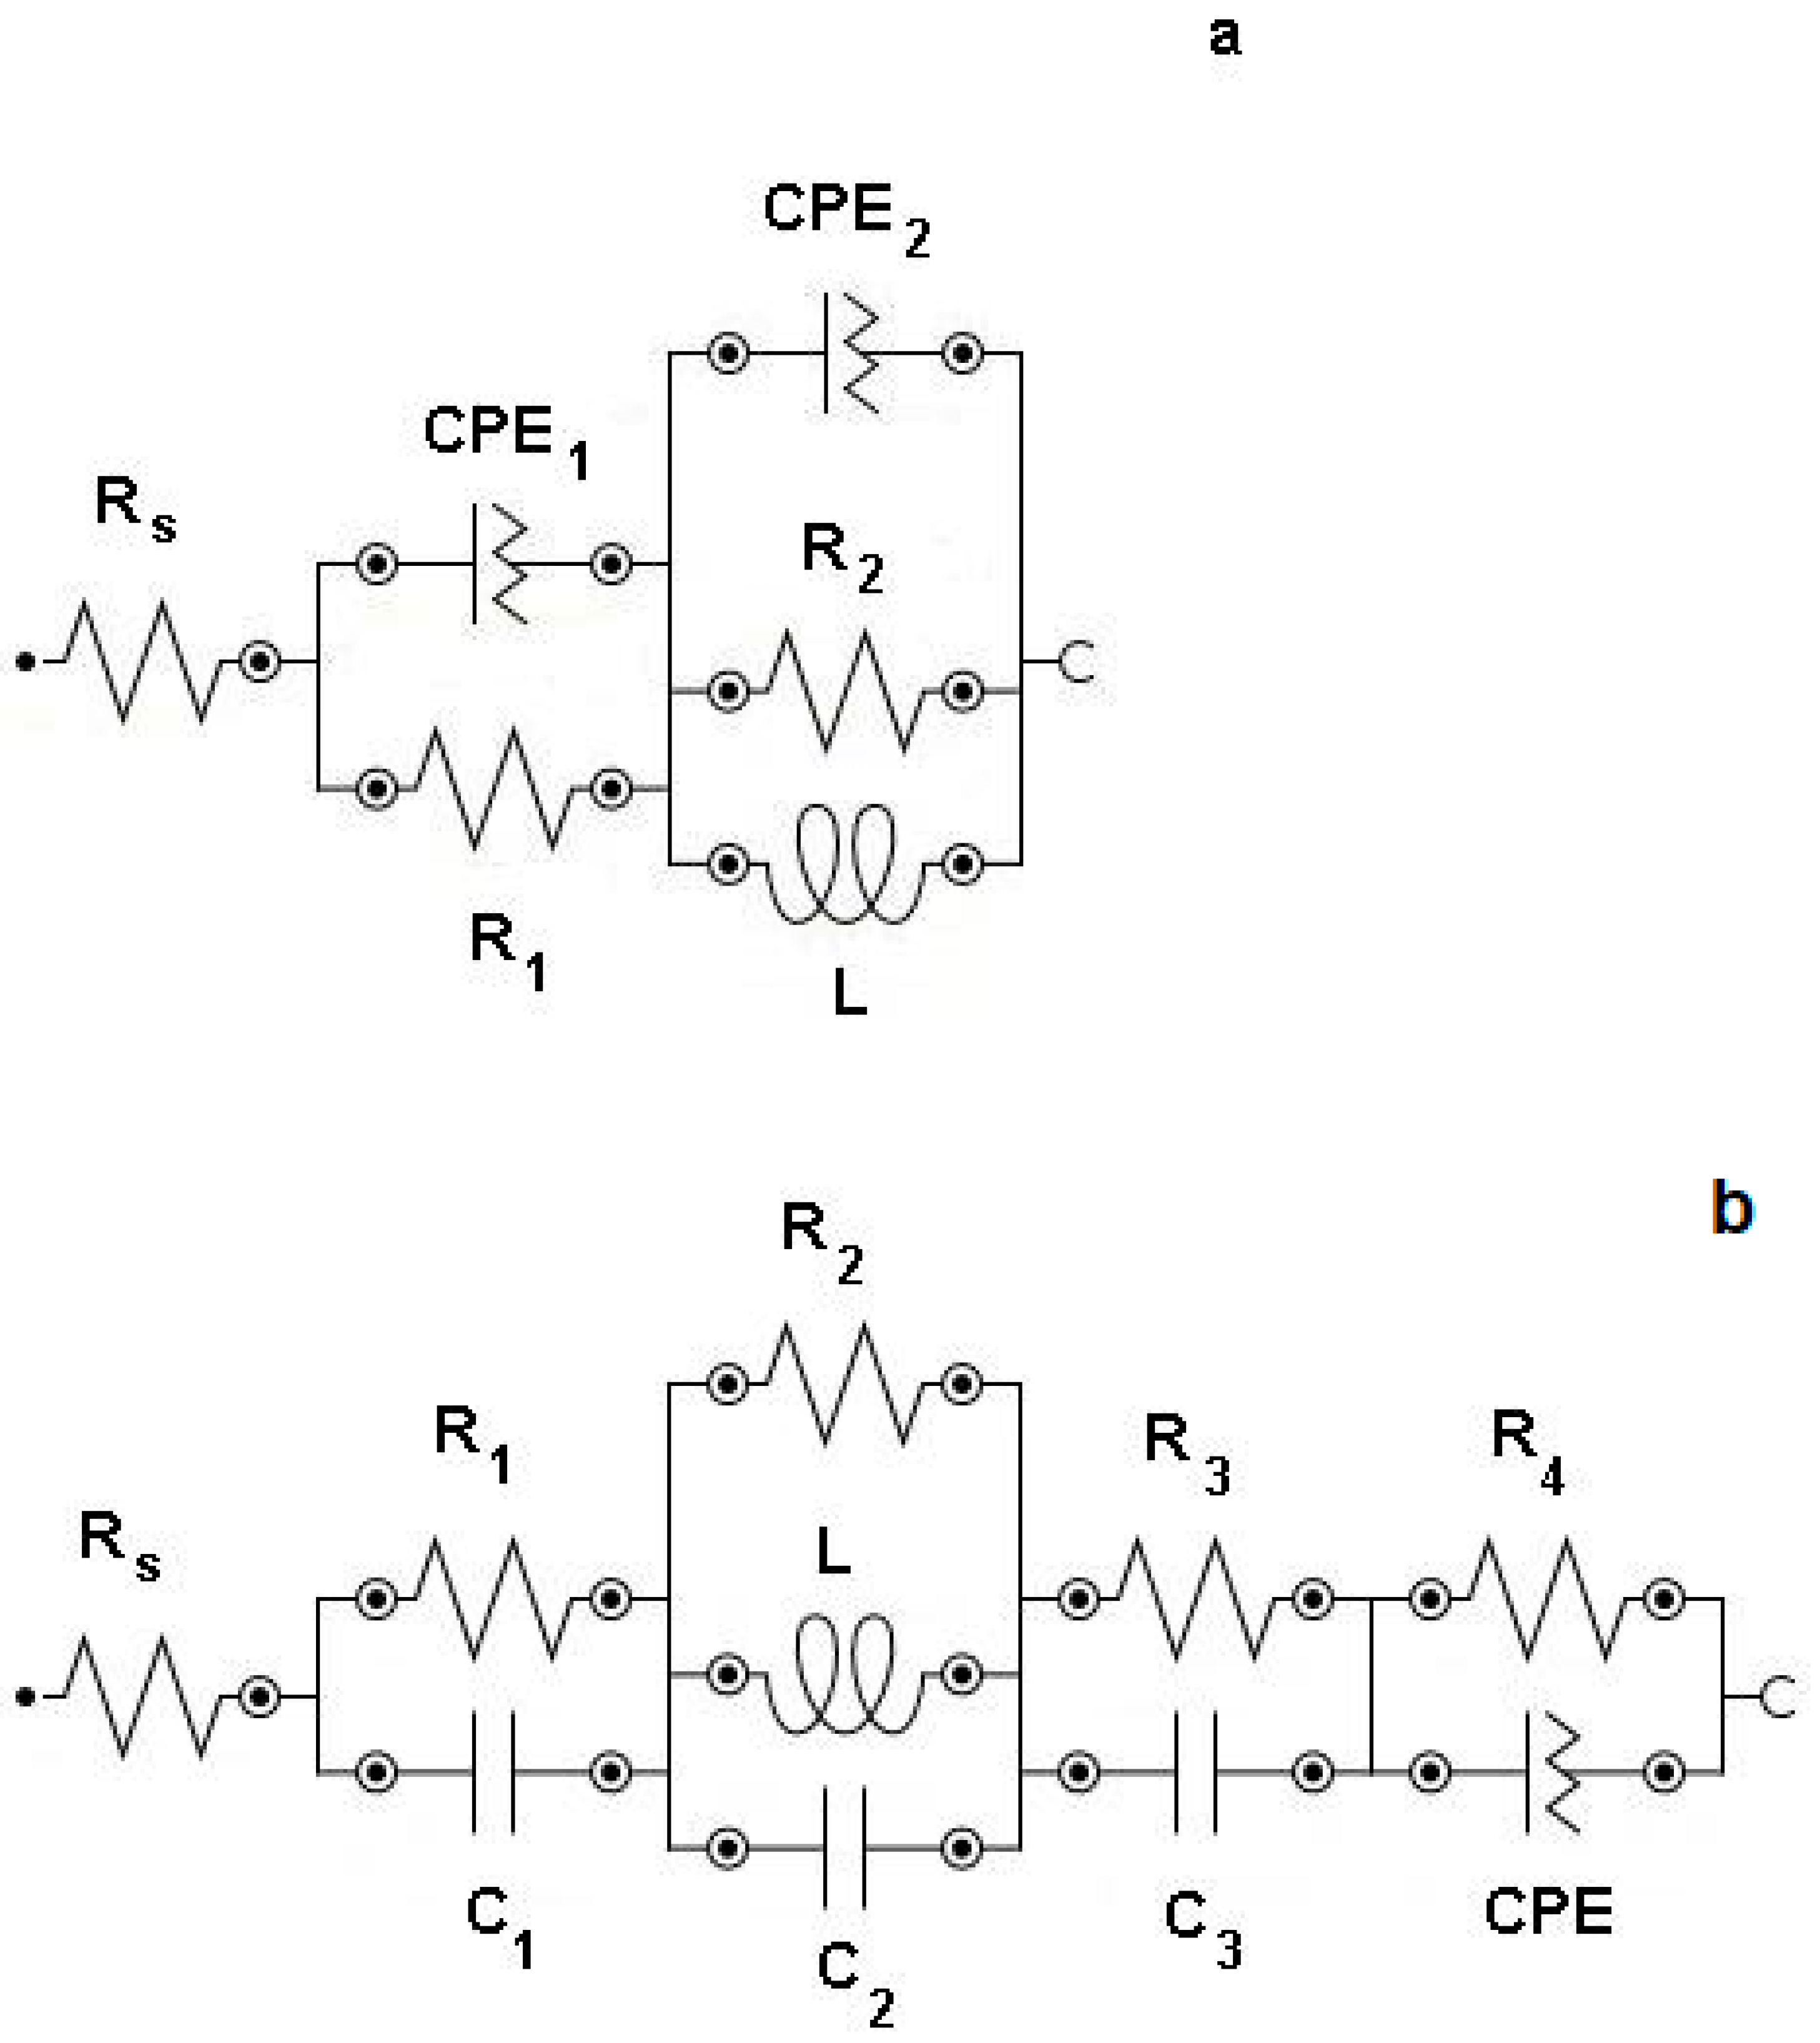
2), and an inductor (describing the expansion of the electrochemically active surface area of the Al electrode, i.e., the increase in the surface roughness) connected in parallel. The first (i.e., high-frequency) oscillation ring describes the restricted mass transport through the porous SEI formed at the Al electrode. The second (i.e., mid-frequency) oscillation ring describes the irreversible electro-oxidation of the Al electrode and the expansion of the Al-electrode area (i.e., the roughening of the Al-electrode surface). In the fitting process obtained, the Nyquist plot is shown (see
Figure S4). The equivalent circuit elements had the following values: R
s = 0.22 kΩ cm
2, R
1 = 1.7 kΩ cm
2, CPE
1 = 950 nF cm
−2, R
2 = 0.89 kΩ cm
2, CPE
2 = 26 μF cm
−2 (a = 0.85), and L = 1.1 kH. Although the Kramers–Kronig test yielded the result
X2 (
Z) = 7.0 · 10
−12, we consider that the recorded EIS data and the numerical values of the circuit elements calculated in the fitting process are trustworthy.
The constructed equivalent circuit for the fitting of the EIS data measured at
E = 8.00 V is based on the model used to describe the delayed breakdown and re-formation processes of the passive layer (SEI) taking place at oxidation (corrosion) Al [
48]. The completed equivalent circuit is shown in
Scheme 2b and is similar to the one described previously in
Scheme 2a; however, some CPEs were replaced with real capacitors and one additional RC and R-CPE low-frequency oscillation ring was added. The third oscillation ring (R
4 and CPE) describes a process that has a very long time-constant value. The Kramers–Kronig test yielded for this equivalent circuit the result
X2 (
Z) = 9.4 · 10
−6, and therefore we consider that the linearity condition was preserved at such a high anodic potential and intensive charge-transfer speed. The equivalent circuit elements had the following values: R
s = 0.20 kΩ cm
2, R
1 = 0.76 kΩ cm
2, C
1 = 2.5 μF cm
−2, R
2 = 1.1 kΩ cm
2, C
2 = 1.8 μF cm
−2, L = 1.1 kH, R
3 = 5.4 kΩ cm
2, C
3 = 9.3 mF cm
−2, R
4 = 0.19 kΩ cm
2, and CPE = 5.2 mF cm
−2 (a = 0.72). R
2 has also been defined in the literature [
48] as the charge-transfer resistance. It should be noted that large inductance was found during the EIS data-modelling process, obtained at
E = 7.00 V and
E = 8.00 V. It is obvious that intensive electro-oxidation of the Al electrode, the adsorption of ions at the N4111(TFSI)|Al interface, and the reorganisation of the SEI reduced the quality of the measured EIS data at
E > 4.0 V.
The normalised active power P(w)/S(w) (marked by the consumer-consumed charge (e.g., a faradic reaction) or electric power) and normalised reactive power Q(w)/S(w) (marked by the energy-source reflected power, the so-called capacitive power) values were calculated as in [
10,
43,
44,
45,
49,
50,
51,
52] and their dependences upon the log
ν are shown for selected potentials in
Figure S6. It is remarkable that the crossing of the P(w)/S(w) vs. log
ν and Q(w)/S(w) vs. log
ν lines took place at P(w)/S(w) = Q(w)/S(w) = 0.70 instead of at 0.50, which was observed for electrical double-layer capacitors with a reversible charging–discharging mechanism [
10,
43,
44,
45]. It should be noted that the crossing of the normalised power lines at P(w)/S(w) = Q(w)/S(w) = 0.70 was also observed in the literature [
49,
50,
51,
52]. P(w)/S(w) vs. log ν and Q(w)/S(w) vs. log ν lines crossed twice, indicating the existence of processes with two relaxation time constants [
10,
43,
44,
45,
49,
50,
51,
52] for the N4111(TFSI)|Al/Al
2O
3 system at all potential applied. These relaxation time constants can be estimated graphically as the frequency of the normalised power-line crossings (
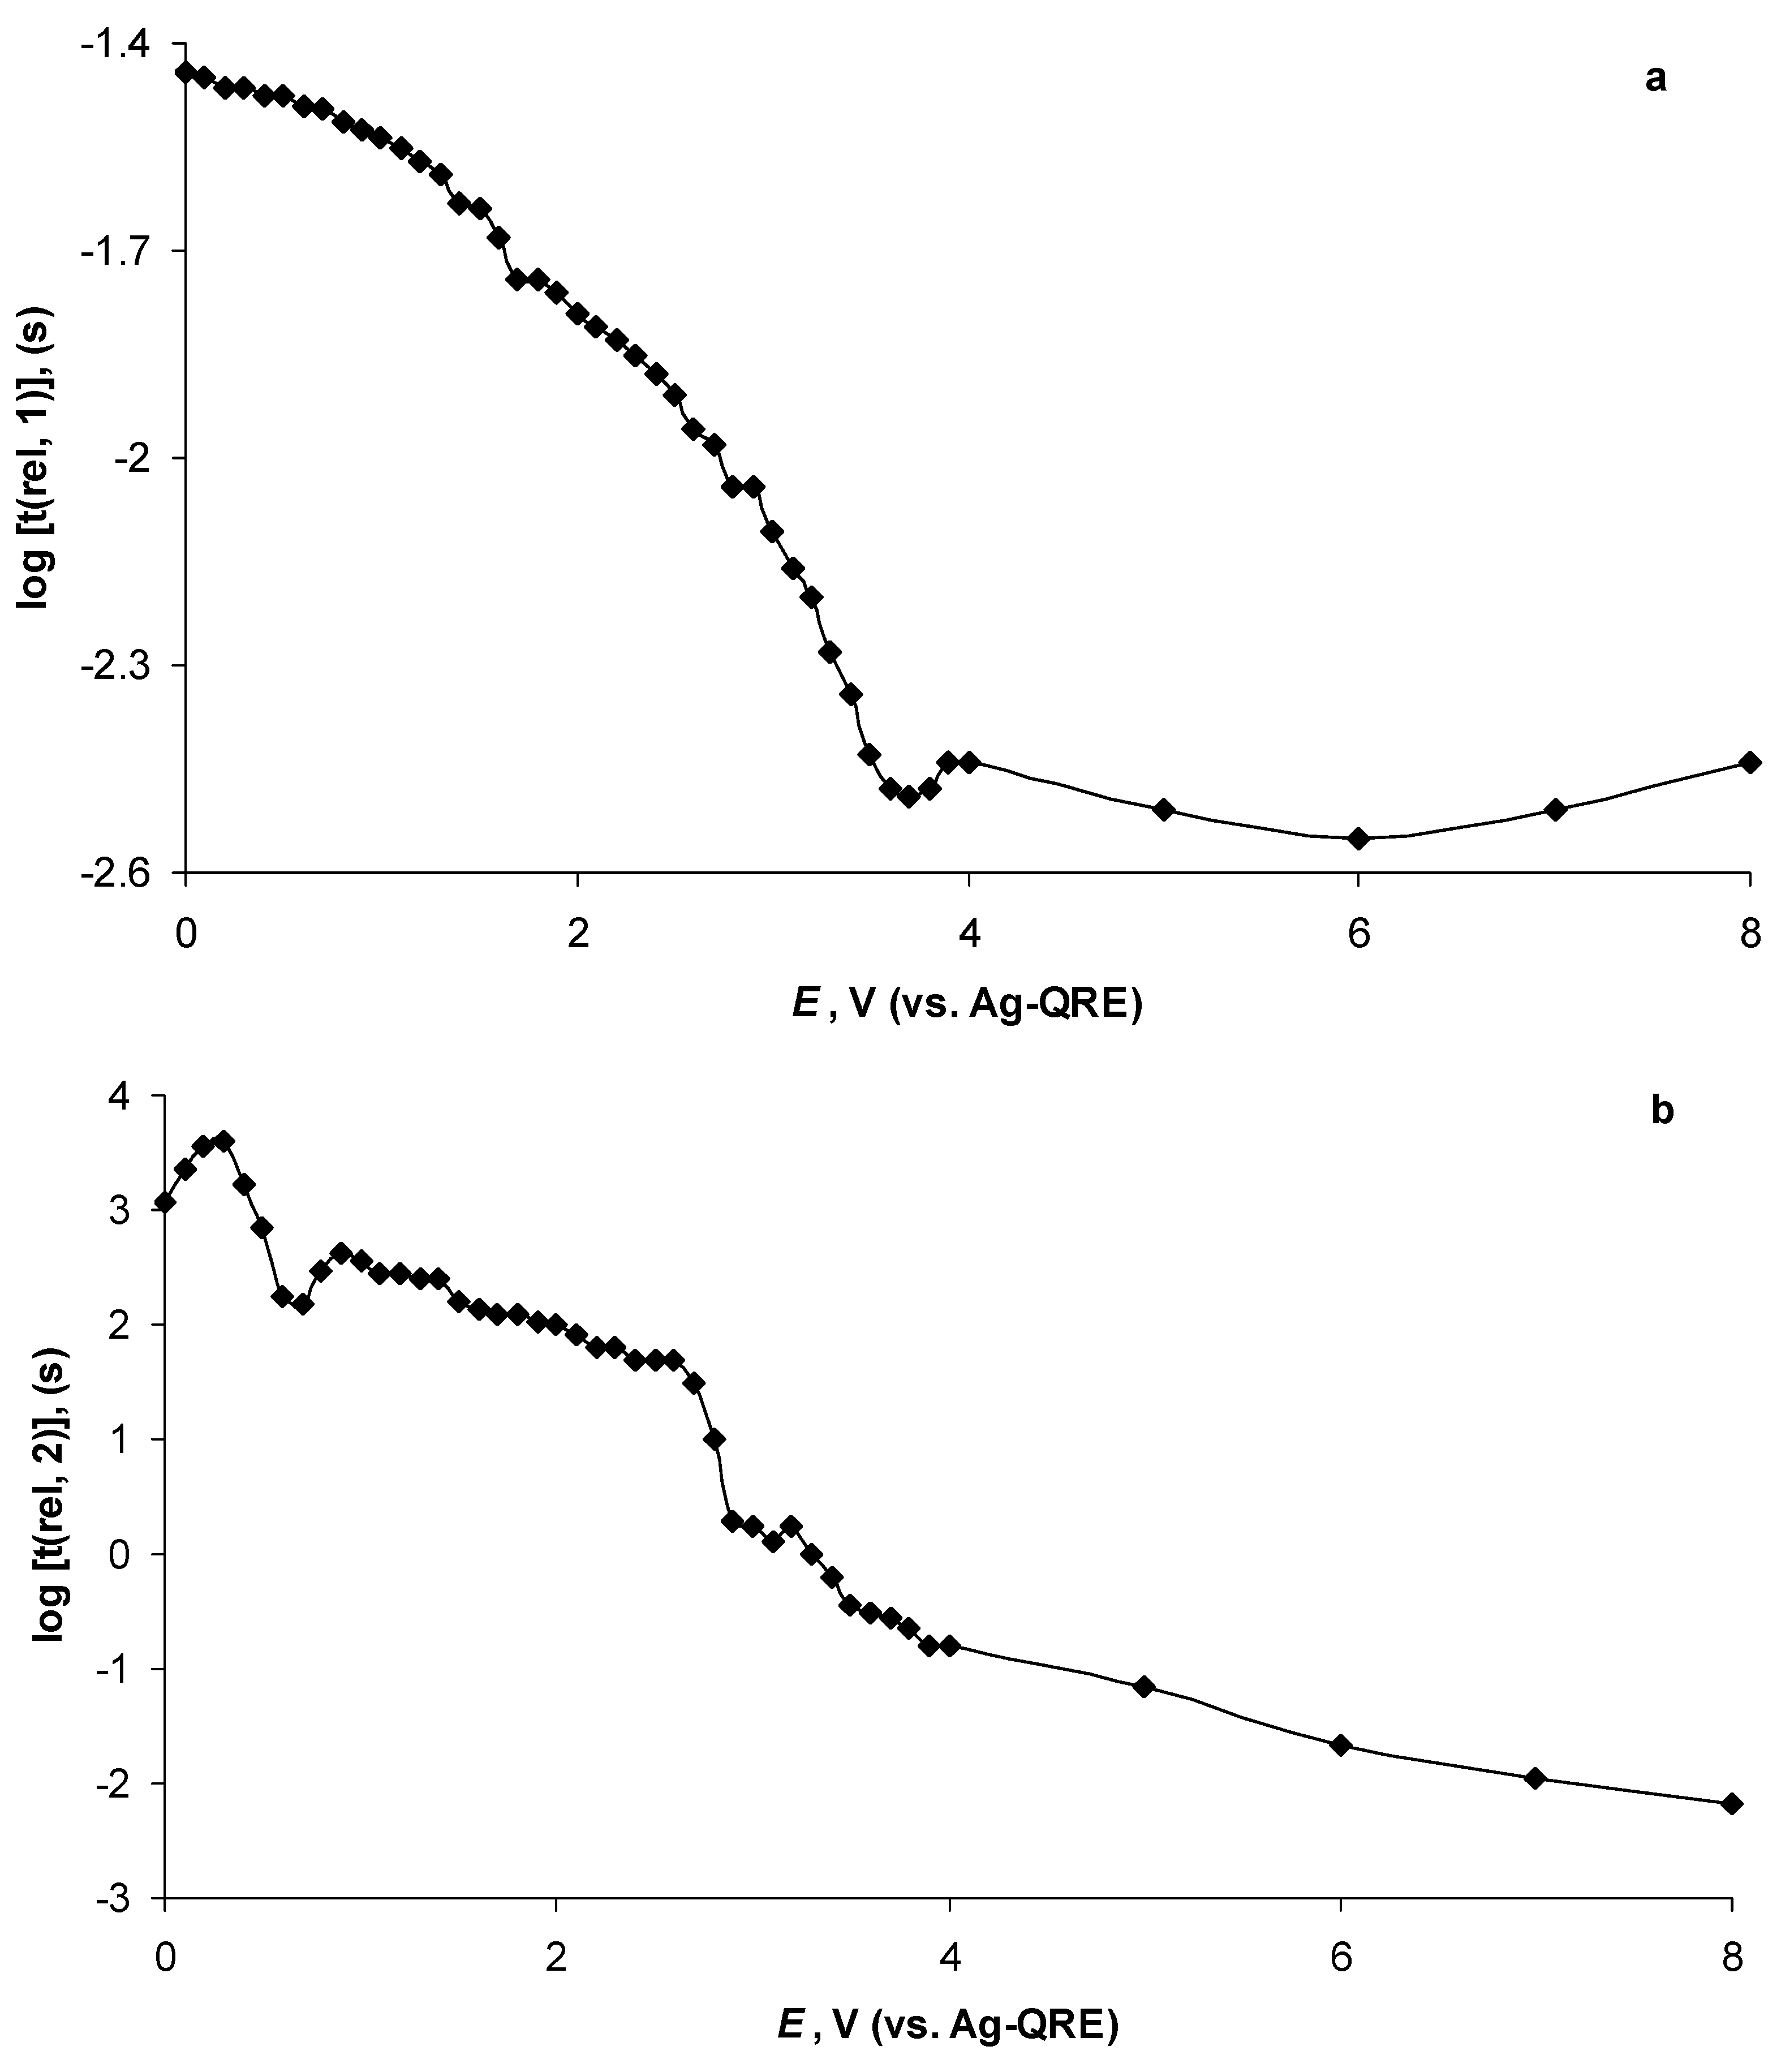
Figure S6). It is characteristic that the value of both the mid-frequency relaxation time constant t(rel, 1) (
Figure 11a) and the low-frequency relaxation time constant t(rel, 2) (
Figure 11b) increased as the Al-electrode potential increased. However, their different dependences upon the potential applied to the Al electrode indicates the varied and sophisticated nature of these processes. The t(rel, 1) decreased monotonously with the application of more positive potentials from t(rel, 1) = 0.036 s at
E = 0.00 V to t(rel, 1) = 0.0032 s at
E = 3.70 V linearly (slope = −0.01 s V
−1, R
2 = 0.99). At
E > 3.70 V, it obtained an almost stable value: t(rel, 1) = 0.003…0.004 s until the highest potential applied to the Al electrode, i.e., t(rel, 1) = 0.0036 s at
E = 8.00 V (
Figure 11a). It should be mentioned that at
E > 3.60 V the EIS spectrum measured became extremely unstable due to specific adsorption of N4111(TFSI) at the Al surface (
Table 1) and intensive electro-oxidation of Al (probably leading to the roughening and expansion of the Al electrode surface) and the deposition of the Al-oxidation products (e.g., Al(TFSI)
3) forming a porous and expanding SEI layer at the N4111(TFSI)|Al interface (
Figure 3,
Figure 4,
Figure 5,
Figure 6,
Figure 7,
Figure 8,
Figure 9 and
Figure 10).
The values of t(rel, 2), estimated graphically from P(w)/S(w) vs. log ν and Q(w)/S(w) vs. log ν plots measured at low potentials applied, were unstable, probably because of difficulties in their precise estimation from the graphs at
E ≤ 0.60 V. However, the estimated values of t(rel, 2) seemed to increase from the initial value (t(rel, 2) = 1200 s,
E = 0.00 V), as the Al/Al
2O
3 electrode potential was changed stepwise to be more positive, forming a maximum t(rel, 2) = 4000 s at
E = 0.30 V (
Figure 11b). Thereafter, a steep reduction in log [t(rel, 2)] values was observed, showing a minimum at
E = 0.60 V and
E = 0.70 V. At more positive potentials than
E > 0.90 V (t(rel, 2 = 420 s), a monotonous reduction in log [t(rel, 2)] values continued until a steeper decrease occurred at
E ≥ 2.7 V (
Figure 11b). This remarkable change in t(rel, 2) values overlapped with the activation of the Al electrode (steep reduction in the
Cp Cs−1 values,
Figure 8). At
E > 2.90 V (when a
Cs peak formed at
E = 3.00 V,
Figure 6), a slow continuous decrease in the t(rel, 2) values to t(rel, 2) = 0.0067 s was notable until the final potential of
E = 8.00 V was applied (
Figure 11b). Thus, the values of t(rel, 2) reflect the electrochemical activity of the N4111(TFSI)|Al interface.
The approximation of t(rel, 1) and t(rel, 2) values, parallel to the increase in the Al electrode potential, is notable in
Figure S6 as the formation of the overlapping P(w)/S(w) vs. log
ν and Q(w)/S(w) vs. log
ν line peaks after
E ≥ 3.00 V. For the P(w)/S(w) vs. log
ν and Q(w)/S(w) vs. log
ν relationships, measured at
E = 7.00 V and
E = 8.00 V, the presence of small “peaks” at log
ν = −0.70 (Hz) is characteristic (
Figure S6). Their formation indicates the start of new electrochemical processes running in parallel. These new processes could involve the relaxation (e.g., slow adsorption–desorption) processes at the N4111(TFSI)|Al interface, yielding a new low-frequency arc in the Nyquist plot measured at
E = 8.00 V (
Figure 4c and
Figure S5).

 ,
, 


