Article

Lithium-Ion Battery State-of-Charge Estimation Using Electrochemical Model with Sensitive Parameters Adjustment

1
College of Electrical Engineering, Sichuan University, Chengdu 610065, China
2
Electric Power Research Institute, State Grid Sichuan Electric Power Company, Chengdu 610041, China
*
Author to whom correspondence should be addressed.
Batteries 2023, 9(3), 180; https://doi.org/10.3390/batteries9030180
Submission received: 21 January 2023 / Revised: 14 March 2023 / Accepted: 18 March 2023 / Published: 20 March 2023
(This article belongs to the Special Issue Advanced Lithium-Ion Battery Management in Renewable Energy Systems)

Abstract

:
State-of-charge (SOC) estimation of lithium-ion (Li-ion) batteries with good accuracy is of critical importance for battery management systems. For the model-based methods, the electrochemical model has been widely used due to its accuracy and ability to describe the internal behaviors of the battery. However, the uncertainty of parameters and the lack of correction from voltage also induce errors during long-time calculation. This paper proposes a particle filter (PF) based method to estimate Li-ion batteries’ SOC using electrochemical model, with sensitive parameter identification achieved using the particle swarm optimization (PSO) algorithm. First, a single particle model with electrolyte dynamics (SPME) is used in this work to reduce the computational burden of the battery electrochemical model, whose sensitive parameters are selected through the elementary effect test. Then, the representative sensitive parameters, which are difficult to measure directly, are adjusted by PSO for a high efficiency. Finally, a model-based SOC estimation framework is constructed with PF to achieve accurate Li-ion battery SOC. Compared with extended Kalman filter and equivalent circuit model, the proposed method shows high accuracy under three different driving cycles.

1. Introduction

With the energy crisis and the deterioration of the ecological environment, electric vehicles (EVs) and smart grids have received widespread attention around the world. Among the existing energy storage devices, lithium-ion (Li-ion) batteries have been widely utilized for their distinctive advantages, such as high energy density, long service life, low self-discharging rate, and no memory effect [1,2,3]. In order to ensure the safety and reliability and achieve the best working performance of the energy storage system with a proper management strategy, accurate state monitoring is needed for the battery management system (BMS). Battery state is a complicated concept that usually includes multitudes of branches, such as state of charge (SOC), state of health (SOH), state of power (SOP), etc. One of the key variables that must be estimated in the BMS is the SOC, which is the ratio of the battery’s current remaining capacity to its maximum value [4,5,6].
However, it is inaccessible to accomplish the direct SOC measurement by BMS. Usually, some relevant measurable variables, such as current, voltage, and temperature, are needed for battery SOC estimation. The commonly used SOC estimation methods include the ampere-hour integration method [7,8], the open circuit voltage (OCV) method [9,10], and the model-based method. The ampere-hour integration method has obvious drawbacks of the measurement error accumulation and the uncertainty of the initial SOC, whereas it is the simplest method. Besides, the ampere-hour integration method only uses the current to estimate SOC without the correction and information from terminal voltage. The OCV method can recompense the abovementioned shortcoming utilizing the determinate relationship between SOC and OCV. Nevertheless, the SOC estimation cannot be achieved online by the OCV method because battery OCV measurement requires a long relaxation period to reach its internal equilibrium.
The model-based methods commonly deploy the equivalent circuit model (ECM) or the electrochemical model (EM) to reach the goal of SOC estimation. Based on battery model, filtering algorithm, such as extended Kalman filter (EKF) [11], unscented Kalman filter (UKF) [12], and particle filter (PF) [13], can be applied to achieve SOC estimation. Meanwhile, a battery model can be combined with an observer, such as Luenberger observer (LO) [14], sliding-mode observer (SMO) [15], or nonlinear observer (NO) [16], to reach the same goal. ECM [17,18], including the Rint model, Thevenin model [19,20], first-order RC model [21], partnership for new generation of vehicles (PNGV) model, etc., use resistors, inductors, and capacitors to simulate the external characteristics of a Li-ion battery, and have been widely applied to estimate SOC in practice thanks to their simple structure, high calculation efficiency, and few parameters to be identified. However, there remain some drawbacks for ECM, e.g., parameters of the ECM are not directly related to the electrochemical reactions inside the Li-ion battery. In this way, the parameters in ECM lose their specific physical meaning in reality, which further contributes to the incapability to reflect the internal states, such as the overpotential and the lithium-ions concentration, and also leading to limitations in terms of modeling accuracy. The SOC estimation errors can be divided into dynamic transient error and steady state error. The dynamic transient error can be eliminated if the gain of observer is selected to be a big value. However, the steady state error is independent of the observer gain and cannot be neglected. So, one consensus for the model-based SOC estimation method is that the estimation algorithm cannot well handle the battery modeling errors, which restricts the usage of ECMs for advanced BMS applications [22,23]. Meanwhile, the EM can provide more internal details on the battery, which could support an accurate battery model, as well as the charging strategy and power prediction of the Li-ion battery. Thus, researchers focus on using EM to obtain a superior model-based SOC estimation method.
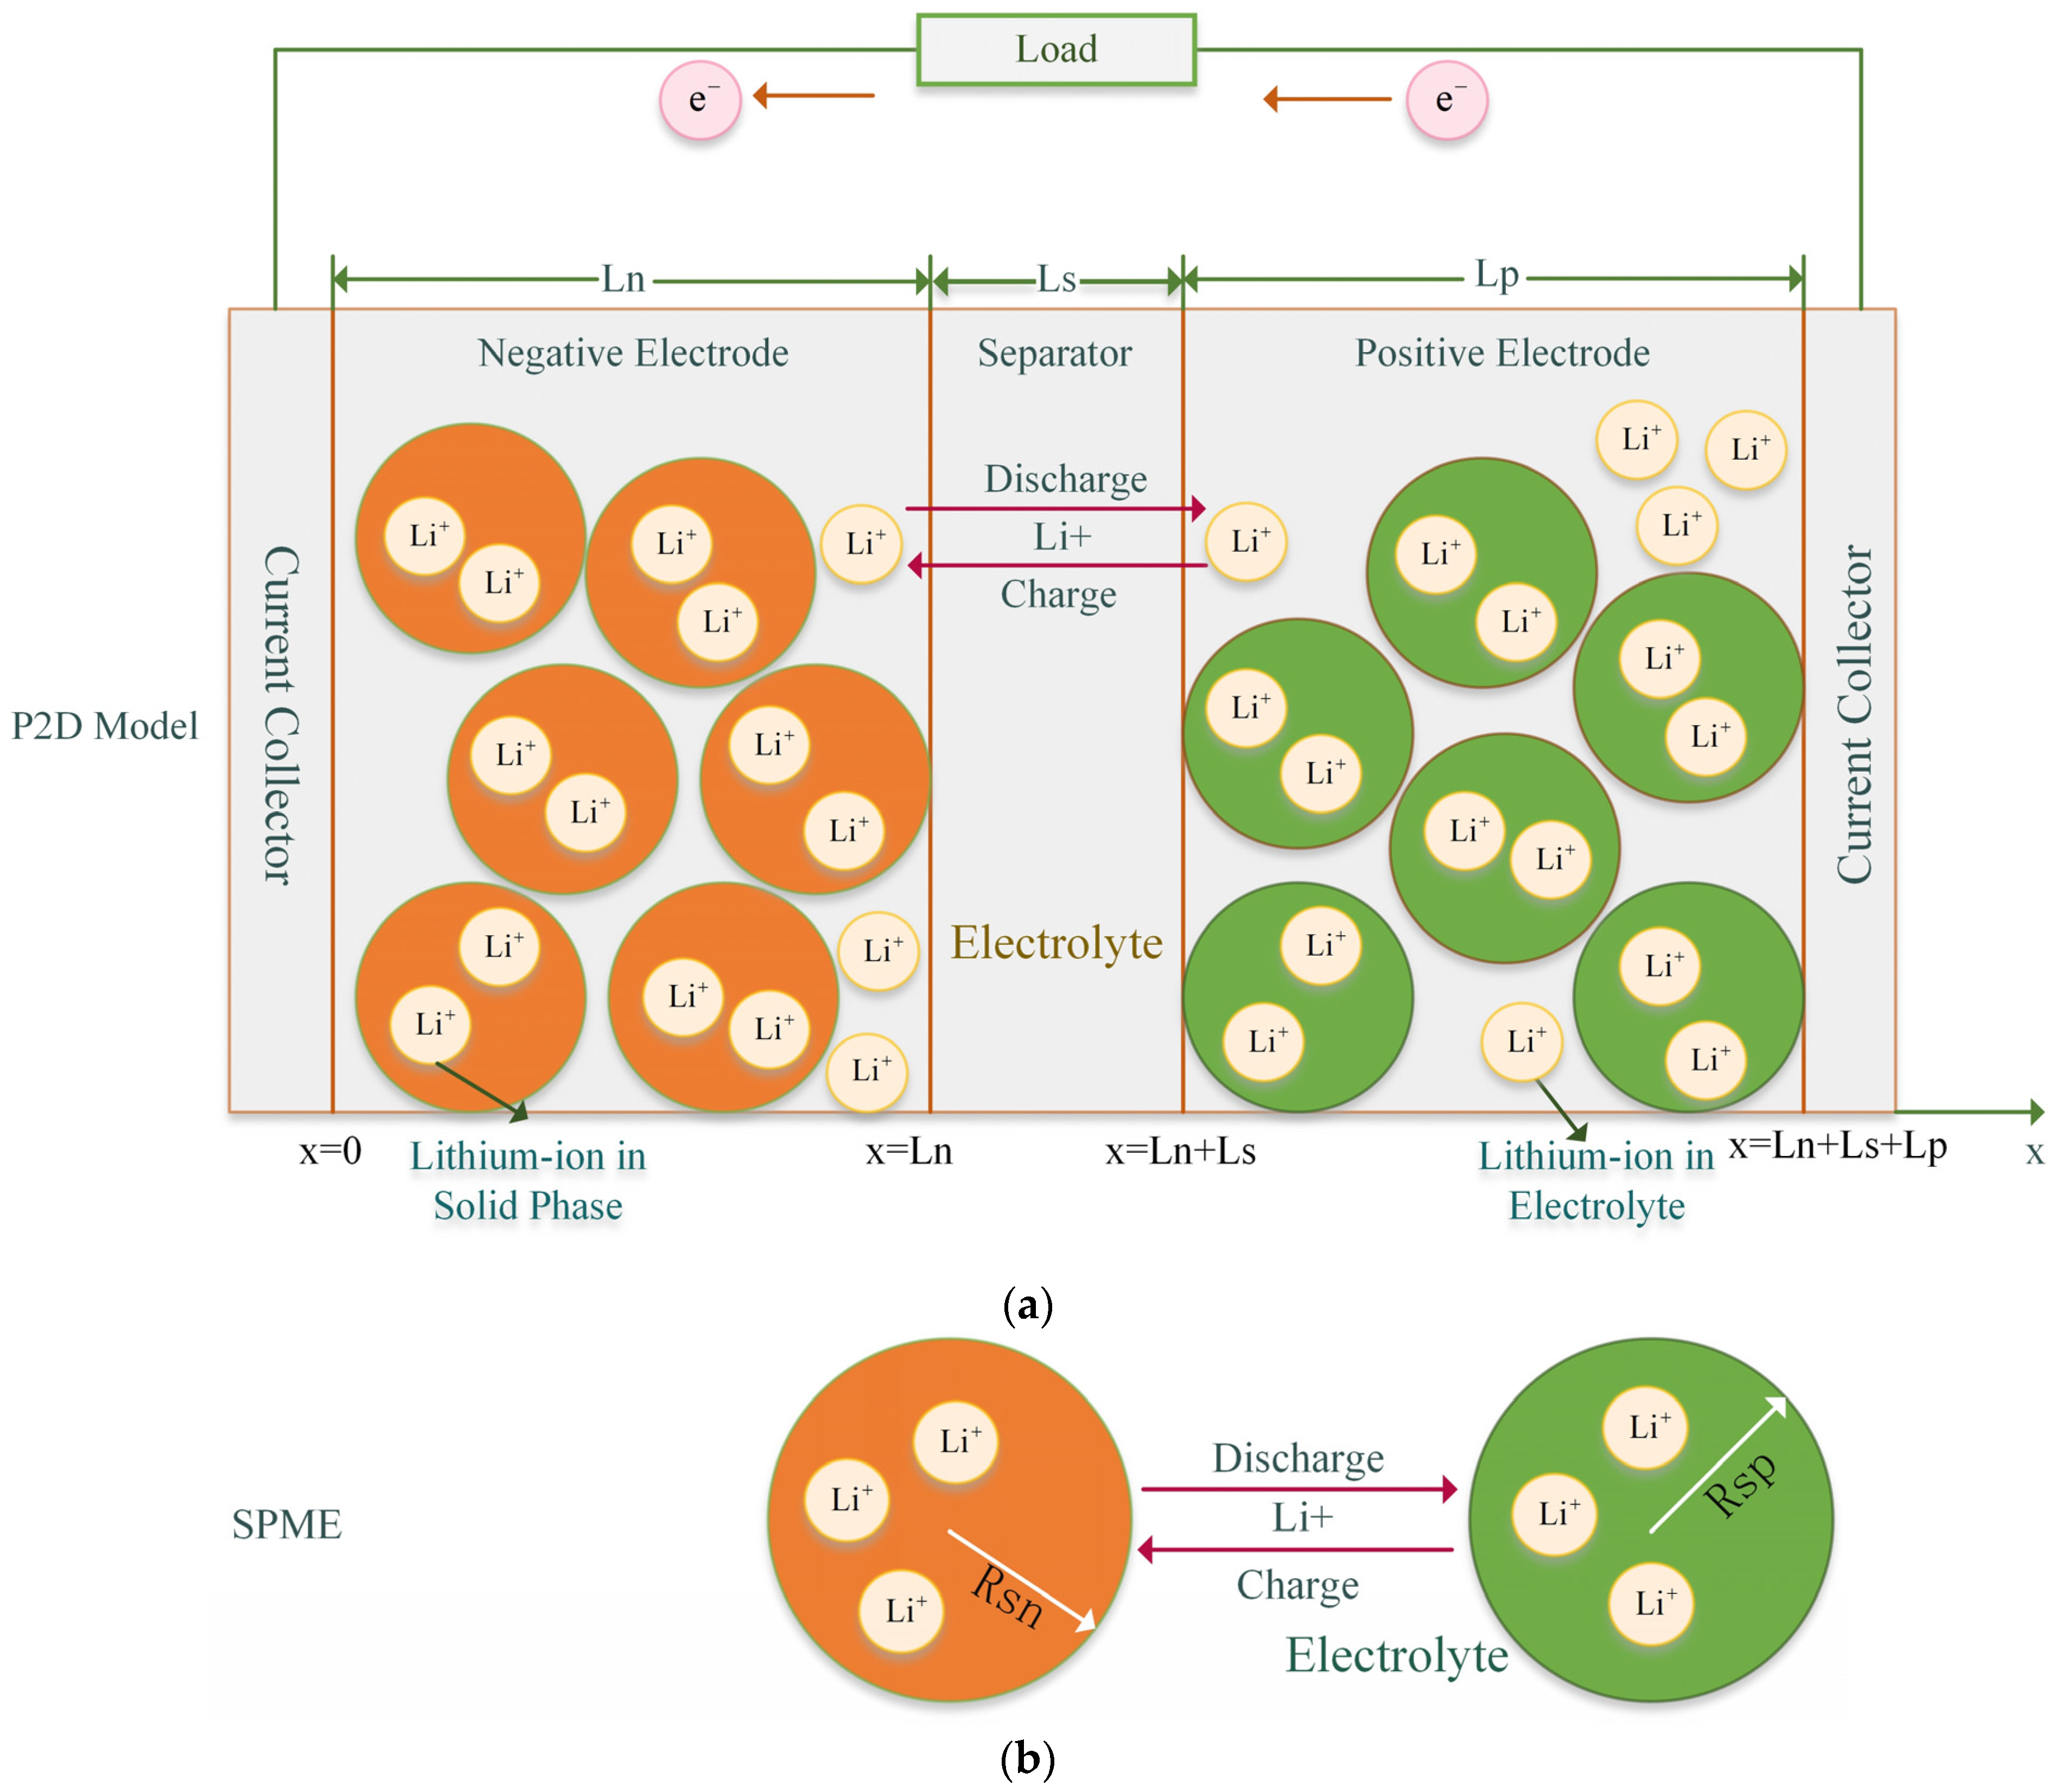
The original EM is a pseudo-two-dimensional porous electrode (P2D) model proposed by Doyle, Fuller, and Newman [24,25]. The P2D model describes the battery internal reactions according to five subsections: porous positive electrode, porous negative electrode, separator, and the current collector in both positive and negative area. The P2D model is composed of a series of coupled partial differential equations (PDEs) that reflect the internal electrochemical reactions of the Li-ion battery, including the diffusion equation in solid and electrolyte phase, ohm equation in solid and electrolyte phase, charge conservation equation, and the Butler–Volmer equation. Although it can improve the modelling accuracy and widens the application range of the battery model to some extent, the computational burden of EM is aggravated owing to the difficulty of solving the coupled PDEs [26]. An immense amount of research has emerged to reduce the complexity of EM. Mathematical approaches, such as finite element method (FEM) [27], method of linear (MOL) [28], finite difference method (FDM) [29], finite volume method (FVM) [30], and Padé approximation [31], have been widely studied. Meanwhile, B. Haran et al. [30] propose the concept of the single particle model (SPM) [32] using single spherical particles to represent the positive and negative electrodes. It is assumed the current is uniformly distributed in the electrode and the electrolyte dynamics are ignored. In this way, the mathematical calculation of the EM is simplified, and the SPM is widely used for the online estimation of SOC [33,34,35]. Unfortunately, the simplification of electrolytes may decrease the calculation burden, and at the same time cause some unwanted errors which limit the application of the SPM in low C-rates circumstances. It is noted that SPM will lose fidelity once the C-rates is above C/2. Therefore, one challenge here is to properly choose a suitable EM for Li-ion battery SOC estimation.
Since the EM has a good interpretability and can precisely describe the state variations inside the battery, it has become a trend in the future development of the model-based SOC estimation method. The computational accuracy of EM depends remarkably on the accuracy of the parameters, so how to obtain parameters for such an intricate model is a crucial yet challenging task [36]. Some parameters can be acquired by directly disassembling the commercial battery through laboratorial tests, such as geometric parameters and SOC-OCV curves in the electrodes. However, those microscopic parameters, such as diffusion coefficients and kinetic reaction rates, cannot be measured experimentally and need to be identified by specific algorithms. Li-ion battery parameter identification is generally performed using the nonlinear least squares (NLS) method [37,38], genetic algorithm (GA) [39,40], and particle swarm optimization (PSO) method [41,42]. Due to the simplicity of the components and the fewness of parameters in ECM, the NLS method can well complete the identifying task. However, the parameters required to reflect the internal electrochemical reaction mechanisms are extensively increasing in EM. Meanwhile, EM has become highly nonlinear and due to a lack of analytical solutions, more advanced algorithms for parameter identification are in an urgent demand. Hence, the second challenge using EM for SOC estimation is the demand for a parameter adjustment strategy, which should be a trade-off of the accuracy and complexity. Although GA and PSO can well identify the parameters in EM, a large number of microscopic parameters will increase the computing burden.
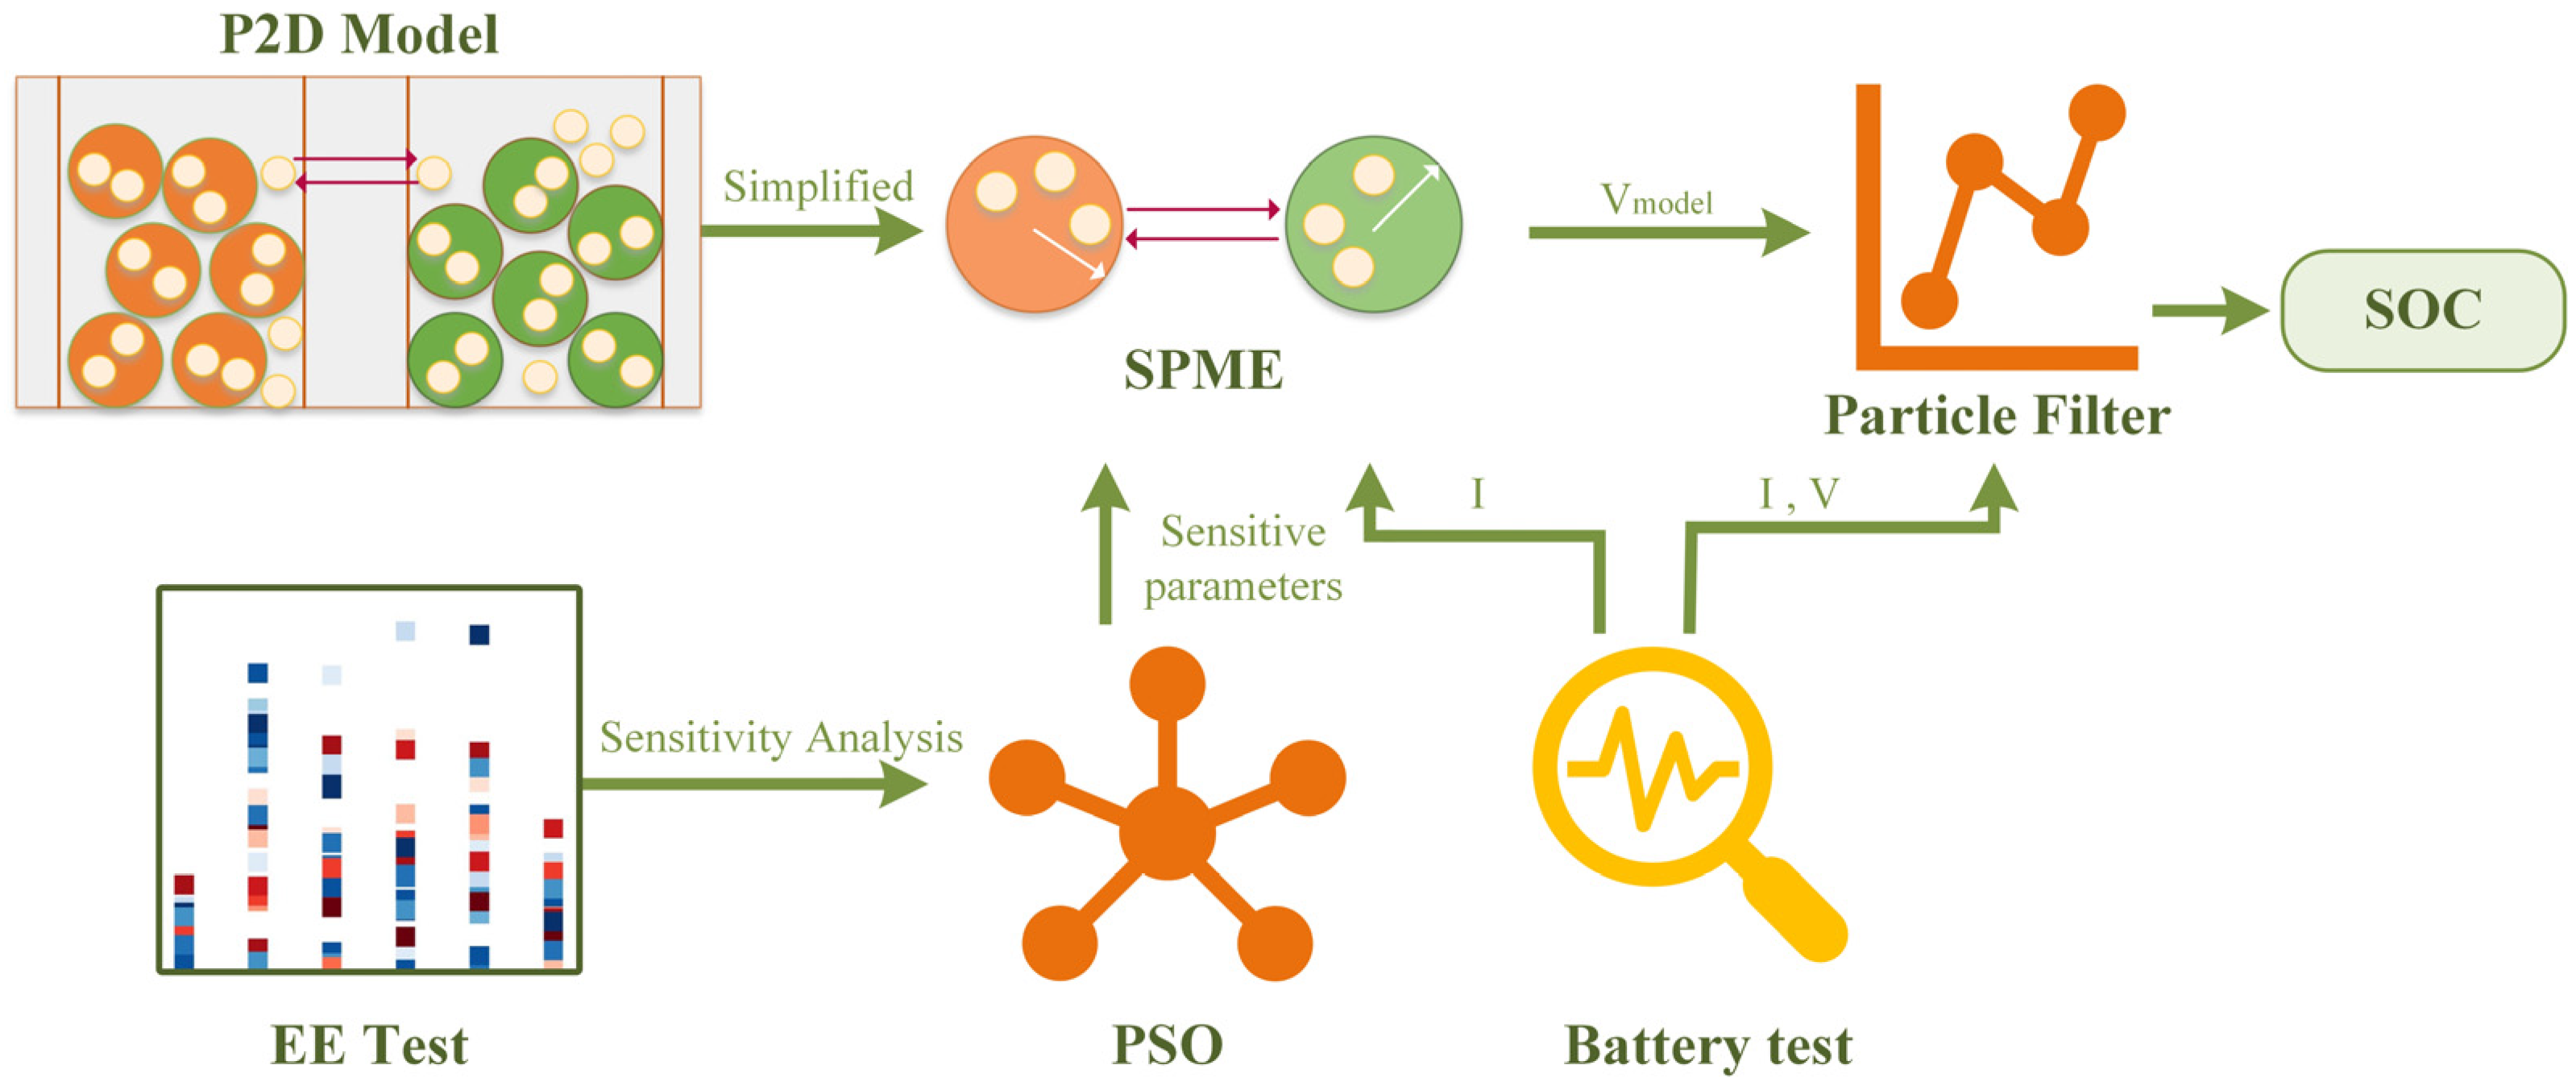
This paper attempts to solve the abovementioned issues by utilizing a single particle model with electrolyte dynamics (SPME) based SOC online estimation framework using a sensitive parameter adjustment strategy and PF. In this thread, a proper selection procedure is designed to choose only the representative ones from SPME for parameter adjustment. There are three main contributions in this paper:
(1)
A simplification of the P2D model, SPME, is combined with PF for Li-ion battery SOC estimation, which involves a trade-off of both the modeling accuracy and simplicity.
(2)
The elementary effect test (EET) is used for the parameter sensitivity analysis (SA) of EM to improve the calculational efficiency, and only highly sensitive parameters are identified by PSO.
(3)
The performance of the proposed method is validated on three different driving cycles and compared with the EKF and the SPME without PF.
The remainder of this paper is organized as follows. Section 2 introduces the SPM with electrolyte dynamics and its simplification procedure. Section 3 describes representative parameter selection and the adjustment strategy with SA, EET, and PSO. 
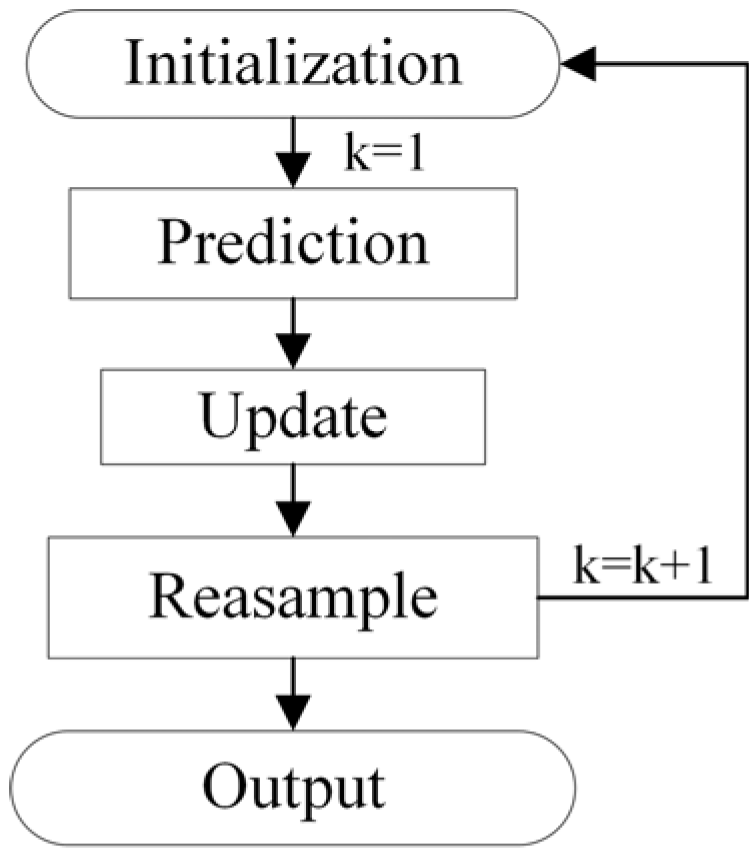
Section 4 illustrates the state-space equation about the lithium-ions concentration in the solid phase, and then the SOC online estimator based on the PF and the SPME. The experimental results are exhibited in Section 5, and the conclusion is provided in Section 6.

2. Electrochemical Model

An accurate and effective model is the key to precisely estimating the Li-ion batteries SOC. This section will start with the classic EM for Li-ion battery, the P2D model. One flaw of P2D is that it contains multitudes of PDEs and boundary conditions, which aggravates the computational burden. Thus, P2D model is simplified into SPME, which reduces the computational burden and retains accuracy at the same time.

2.1. P2D Model

The mechanism of P2D model is shown in Figure 1a, which geometrically divides the Li-ion battery into five regions: positive electrode, negative electrode, separator, and current collectors beside the electrodes. The negative electrode is generally made of graphite for its lattice can store the lithium ions. The material of positive electrode is usually the lithium metal oxide, such as lithium cobalt oxide, lithium manganate, lithium-ion phosphate, etc. Meanwhile, a physical isolation is formed between two electrodes by the separator, allowing the lithium ions to pass through and preventing the flow of electrons at the same time. During the charging process, in response to the external electric field, lithium ions in the positive electrode de-intercalate from the positive material into the electrolyte, passing through the separator, and finally intercalating into the negative electrode, or the graphite lattice. At the same time, electrons are released from the positive electrode, flowing to the negative electrode through the external electrical circuit. During the discharging process, lithium ions de-intercalate from the graphite lattice and intercalate into the positive material in an opposite way.
The input and output of the P2D model are current and voltage, respectively. For the simulation, six sets of PDEs are usually coupled together, which is capable of reflecting the lithium-ions concentration in solid phase and electrolyte. The mathematical equations of the P2D model contain the following aspects:
(1)
Electrolyte lithium ions diffusion equations in positive electrode, negative electrode, and separator according to Fick’s second law.
(2)
Solid phase lithium ions diffusion equations in electrodes due to Fick’s second law.
(3)
Electrolyte ohm equations in electrodes and separator.
(4)
Solid phase ohm equations in positive electrode and negative electrode.
(5)
Charge conservation equations, including positive electrode, negative electrode, and separator.
(6)
Butler–Volmer (BV) kinetic equations at the surface of particles in electrodes.
(7)
More details and boundary conditions are list in Table 1 [43].
In Table 1, r is the coordinate axis along the radius of the solid-phase particle, where r = 0 is the center of the particle. α a and α c are the reaction transfer coefficients of anode and cathode, separately. Normally, we define α a = α c = 0.5 . ε f . is the filler volume fraction, where ε f = 1 ε e ε s . The nomenclature of parameters is shown in Nomenclature. For the parameters with superscript eff, such as D e e f f , κ e f f , and σ e f f , can be given by Bruggeman relationship, where D e e f f = D e ε e b r u g , κ e f f = κ ε e b r u g , σ e f f = σ ( ε s + ε f ) b r u g . The symbol ‘brug’ is the Bruggeman porosity, which equals to 1.5 under normal circumstances. However, this model contains dozens of PDEs and their boundary conditions, which will bring multitudes of computational burdens. To reduce such a burden, a simplified model SPME is introduced in Section 2.

2.2. SPM with Electrolyte Dynamics

Regarding the complicated coupling series of PDEs in the P2D model, it is easy to understand the P2D model suffers from the computing burden when used in a real application. Thus, the simplification of P2D model has become increasingly indispensable for EM in online battery SOC estimation. The P2D model is conventionally simplified into the SPM [44] assuming each electrode is a porous spherical particle and ignoring the electrolyte dynamics. In addition, there remaining leaves a primary limitation for the SPM, that is, once the C-rates exceeds 0.5 C, the model will have a steep increase in voltage error. Hence, the SPM with electrolyte dynamics (SPME) is used in this paper for balancing the simplicity and fidelity. The schematic diagram of SPME is shown in Figure 1b.
In order to clarify the SPME, the following assumptions are given for enabling the transformation from P2D to SPME [45]:
(1)
The solid phase lithium ion concentration is uniformly distributed in each electrode along the spatial x-axis, i.e., it is assumed that c s ( x , r , t ) and j n ( x , t ) are constant on the coordinate x.
(2)
The exchange current density i 0 ( x , t ) is replaced by its average value along the x-axis i 0 ( t ) approximately, i.e., i 0 ( x , t ) is assumed to be independent of x.
(3)
The moles of lithium ions in electrolyte and solid phases, n L i , e , n L i , s , are conserved in sum. The molar fluxes j n can be written as proportional to current density I thanks to the combination of this assumption and assumption (1).
(4)
The electrolyte activity coefficient ( d ln f c / a / d ln c e ) ( x , t ) is constant on the x-axis and can be approximated by ( d ln f c / a / d ln c e ) ( t ) . Besides, the electrolyte ionic conductivity κ is assumed to be constant.
By combining the above assumptions with the mathematical equations of the P2D model, the simplified SPME can be obtained. The molar flux of lithium ions at the surface of the active particles can be written as a proportional to current:
j n , n ( t ) = I ( t ) F a p L p ,   j n , p ( t ) = I ( t ) F a n L n
Note that the subscripts n, p, and s represent the negative electrode, positive electrode, and separator, respectively; a is the specific surface area of the active particles, where a = 3 ε s / R s . The simplified electrolyte diffusion equations can be described by Equations (2)–(4), using the same boundary conditions as the P2D model.
c e , n t ( x , t ) = x [ D e e f f ( c e , n ) ε e , n c e , n x ( x , t ) ] + 1 t + 0 ε e , n F L n I ( t )
c e , s t ( x , t ) = x [ D e e f f ( c e , s ) ε e , s c e , s x ( x , t ) ]
c e , p t ( x , t ) = x [ D e e f f ( c e , p ) ε e , p c e , p x ( x , t ) ] 1 t + 0 ε e , p F L p I ( t )
The simplified solid diffusion equations are expressed by Equation (5).
c s , n / p t ( r , t ) = 1 r 2 r [ D s , n / p r 2 c s , n / p r ( r , t ) ]
Following the boundary conditions:
c s , n / p t ( 0 , t ) = 0 ,   c s , n / p t ( R s , n / p , t ) = 1 D s , n / p F a n / p L n / p I ( t )
The simplified electrolyte ohm equations are given by Equations (7) and (8).
ϕ e , p ( t ) ϕ e , n ( t ) = L n + 2 L s + L p 2 κ I ( t ) + 2 R T F ( 1 t + 0 ) k f [ l n c e , p ( t ) l n c e , n ( t ) ]
k f ( t ) = 1 + d ln f c / a d ln c e ( t )
According to the BV kinetic equation, the electrochemical reaction overpotential can be obtained by Equation (9).
η n / p ( t ) = R T α F sinh 1 ( ± I ( t ) 2 a n / p L n / p i 0 , n / p ( t ) )
The solid potential at the current collectors is described in Equation (10).
ϕ s , n / p ( t ) = η n / p ( t ) + ϕ e , n / p ( t ) + U O C V . n / p F R f j n ( t )
where R f is the resistivity of the SEI film formed during the battery degradation. Eventually, we can obtain the terminal voltage as Equation (11).
V ( t ) = ϕ s , p ( t ) ϕ s , n ( t ) = h ( c s s , n ( t ) , c s s , p ( t ) , c e , n ( t ) , c e , p ( t ) , I ( t ) )
As we can see, SPME does solve the problem of the computational burden. However, electrochemical parameters are still hard to obtain, not to mention that some parameters, e.g., D, ε , and κ , can be changed with battery aging. So, it is important to chase down the sensitive parameters and implement the parameter identification to improve the accuracy of SPME.

3. Global Sensitivity Analysis and Parameter Identification

As previously described, the EM usually comprises a group of microscopic parameters related to battery design. Abovementioned parameters, such as solid phase lithium ions concentration c s ( x , r , t ) , exchange current density i 0 ( x , t ) , moles of lithium ions n L i , and electrolyte activity coefficient ( d ln f c / a / d ln c e ) ( x , t ) , are simplified in SPME, that is, assumed to be constant at any positions in electrodes and invariable along the x-coordinate. In order to achieve the goal of accurate SOC estimation and voltage prediction, more than twenty parameters still need to be identified in SPME. The parameters of the EM can be divided into the following three categories, as shown in Table 2. One is the geometric parameters which can be obtained through the battery disassembling test, the thickness of electrodes and separator L p , L n , L s , and the area of electrodes S belong to this kind of parameters. Another is the performance parameters, including diffusion coefficients, solid phase conductivity σ , electrolyte ionic conductivity κ , volume fraction ε , etc., which can be obtained from the relevant literature or parameter identification method. The third category is those fixed parameters, such as the molar gas constant R, Faraday’s constant F, reaction transfer coefficients α , etc. It should be noted that the performance parameters are difficult to obtain directly from experimentation, while those parameters greatly affect the accuracy of the EM. Considering the computational burden of the BMS, the sensitivity of the parameters is analyzed and further identified by a special designed algorithm in this work.

3.1. Global Sensitivity Analysis

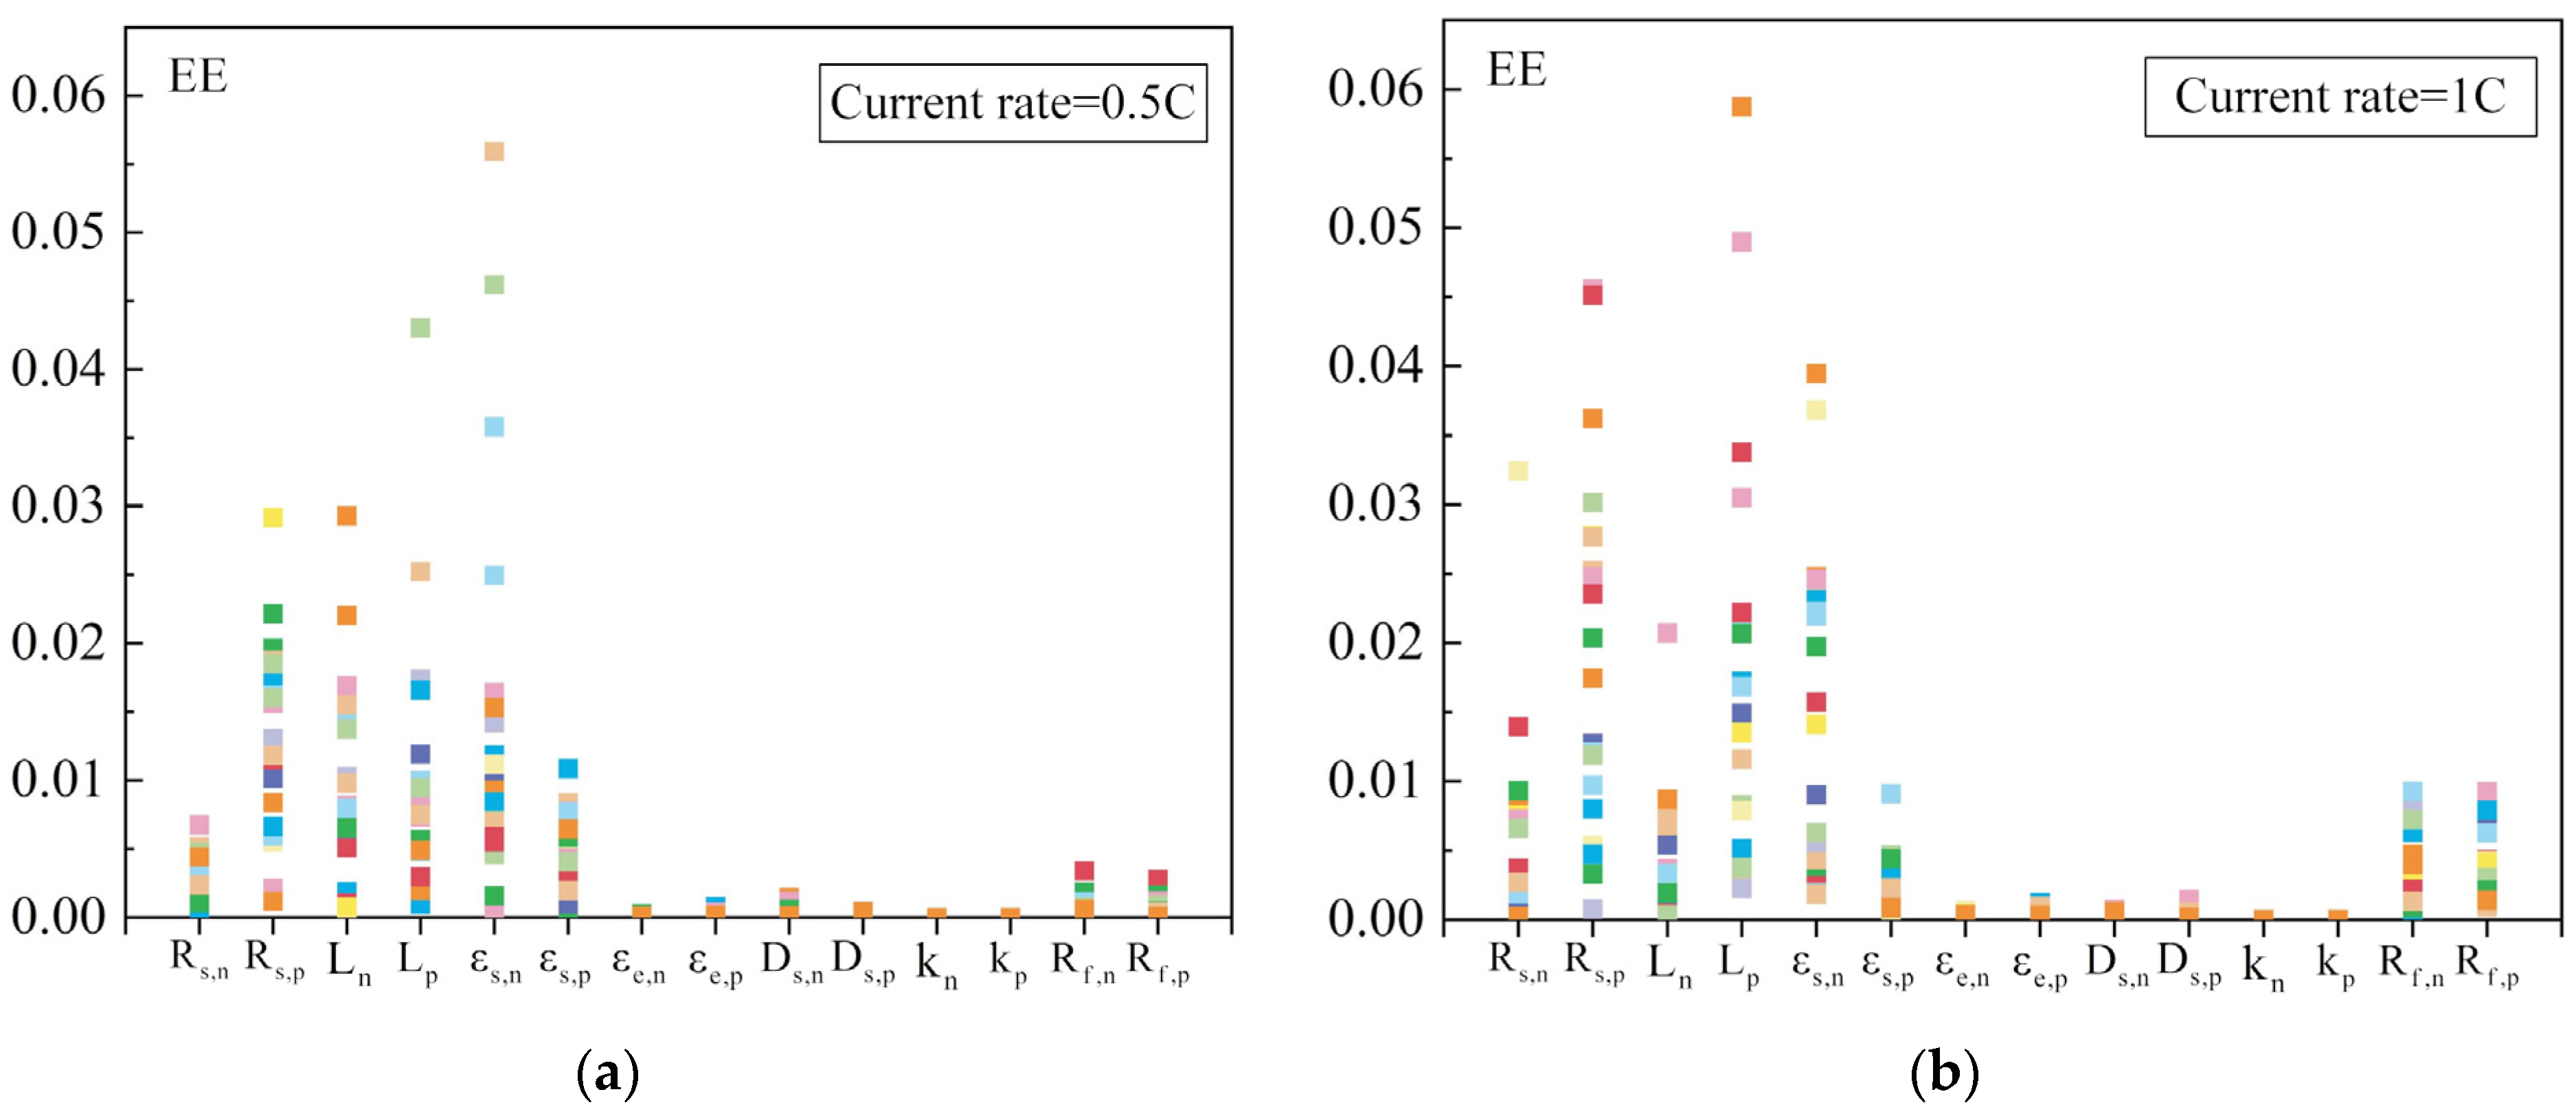
SA is used to verify the influence of the specific parameters on the output of the model. Through sensitivity analysis, the significant parameters of the EM can be selected from numerous variables to reduce the labor of parameter identification. One way to qualify the SA is changing the parameters within a specific range to evaluate the variation of the EM’s output. This paper uses the EET to analyze the parameters’ sensitivity [46]. Assuming that the state-space equation of the system is:
z · = f ( z , t , u , p )
y = h ( x , t , u , p )
where z is the state vector, y is the output vector, t represents the time, u is the system input, and p is the system parameters. Assuming each parameter p i (i = 1,2,…,n) is independent in the system and varies in n-dimensional space, the elementary effect (EE) of j-th trajectory, i.e., the effect of i-th parameter on the output, can be defined as:
E E i j = y ( p 1 j , p 2 j , , p i j + Δ i j , , p n j ) y ( p 1 j , p 2 j , , p i j , , p n j ) Δ i j
Here, we set two metrics to evaluate the parameters: the average μ i and the standard deviation s i of EE.
μ i = 1 r j = 1 r E E i j ,   s i = 1 r 1 j = 1 r ( E E i j μ i ) 2
A high value of μ i means that the parameter has a significant effect on the output, in which indicates the parameter is sensitive. Similarly, a high s i means that the parameter interacts with other parameters, or that the effect of this parameter is nonlinear. Then, these interactions should be taken into consideration for parameter identification. After understanding the sensitive parameters, PSO can be used to identify these parameters. The principle and calculating steps are described as follows.

3.2. Parameter Identification Based on PSO

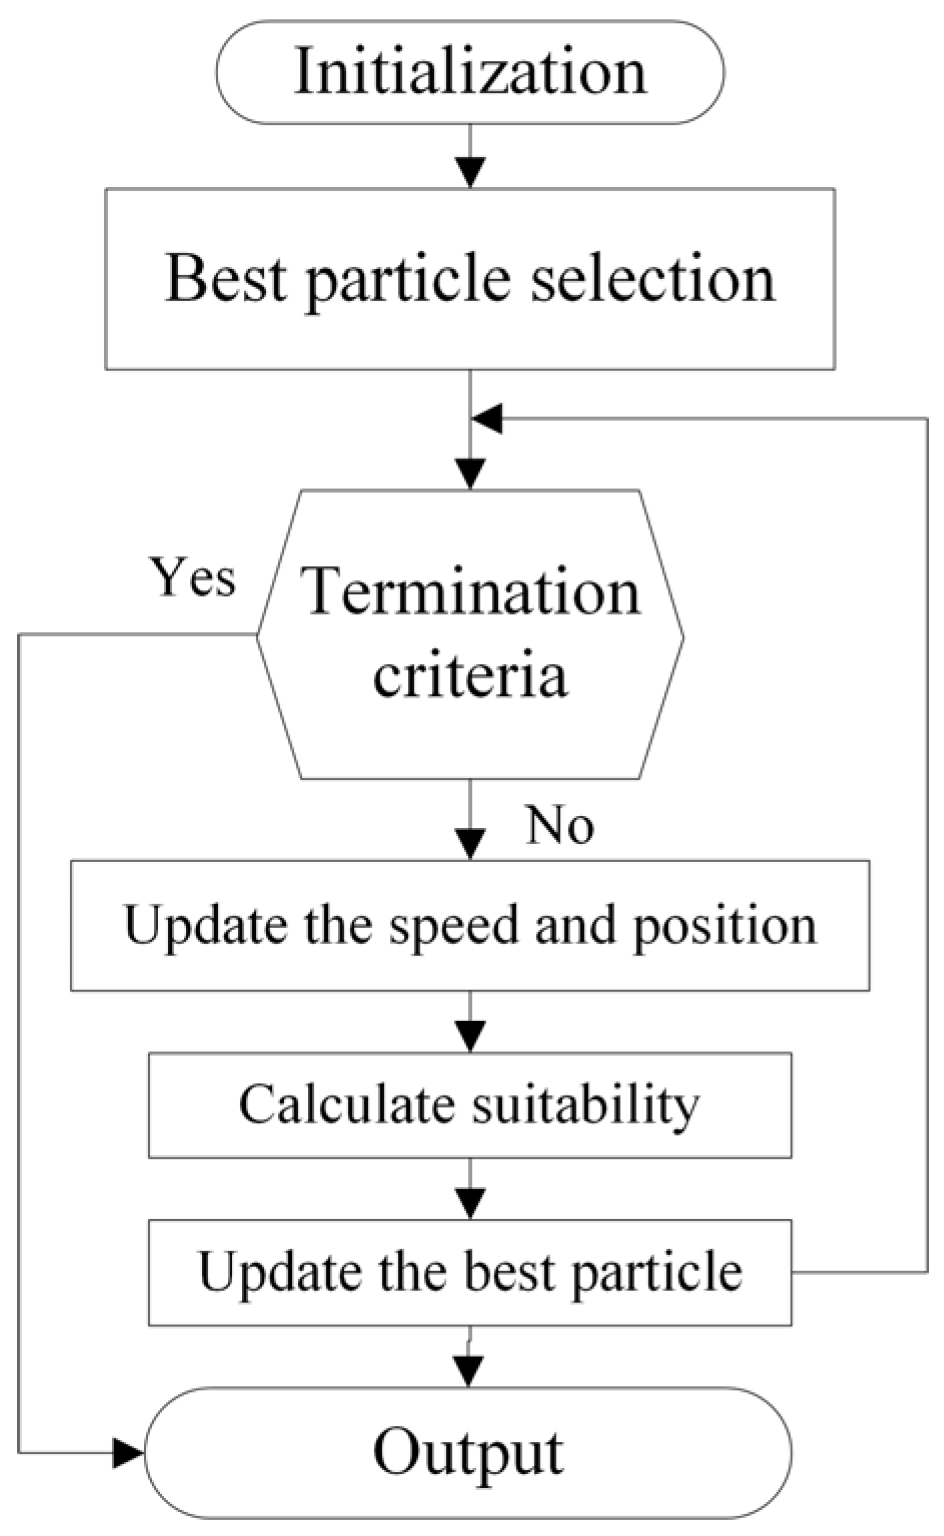
PSO is originally inspired by the behavior of birds foraging in nature. Through the cooperation and information sharing between individuals of the swarm, PSO can achieve the goal of finding the optimal solution. This algorithm treats each individual as a particle without weight and volume, flying with a certain speed in the n-dimensional searching space. The flying speed is synchronously affected by the flying experience of the individual and swarm. The flowchart of PSO is illustrated in Figure 2 and detailed steps are as follows:
(1) Initialization: Randomly initialize the particle swarm, the position of i-th particle in n-dimensional space is expressed as X i = ( X i 1 , X i 2 , , X i n ) , the velocity can be described as V i = ( V i 1 , V i 2 , , V i n ) .
(2) Best particle selection: Record individual suitability, individual optimal suitability, and global optimal suitability; the particle with individual optimal suitability is the personal best particle P i = ( P i 1 , P i 2 , , P i n ) . Similarly, the particle with global optimal suitability is defined as the global best particle G i = ( G i 1 , G i 2 , , G i n ) .
(3) Update: Update the speed and position of particle flight.
V i = w × V i + c 1 × R a n d × ( P i X i ) + c 2 × R a n d × ( G X i )
X = X i + X i
where w is the inertial coefficient, c 1 , c 2 are the learning factors representing the influence of the best particles. If the suitability is more optimal, then update the best particle; otherwise, continue the algorithm.
(4) Recursion: Determine whether the termination criterion is met. The termination criterion could be the value of suitability or the cycle number.

4. Li-Ion Battery SOC Estimation

After all of the electrochemical parameters are obtained and adjusted, SPME with higher accuracy is built up. We proceed with the model-based SOC estimation through PF. Two SOC estimating methods are introduced in this section, the traditional ampere-hour integration method and electrochemical-model-based method.

4.1. Ampere-Hour Integration Method

SOC is defined as the ratio of the current stored to the available capacity, generally expressed as percentage. EM can achieve the purpose of SOC estimation by monitoring the average solid-phase lithium ion concentration of electrodes and the lithium ion concentration on solid particles’ surface. For scenarios where there is no model-based method, SOC can only be estimated by the ampere-hour integration method [47] as expressed in Equation (18).
S O C a m p ( t ) = S O C 0 1 3600 C t 0 t S I ( τ ) d τ
where S O C a m p is the estimated SOC value using ampere-hour integration method, S O C 0 is the value of SOC at the initial time t 0 , C is battery capacity. However, the accumulated errors due to the long-time operation and the uncertainty of the initial SOC cannot be ignored. Besides, this method accomplishes the SOC estimation from only the current without the correction from voltage, which is why the accuracy of SOC estimation will deteriorate.

4.2. Model-Based Method

The battery’s SOC is closely related to the solid phase lithium ions concentration, where the SOC of positive and negative electrodes can be described as Equation (19) and Equation (20), respectively. The SOC of negative electrode indicates the number of lithium ions that can be extracted from the active material in the electrode before depletion [3], and the SOC of positive electrode represents the number of lithium ions that can be absorbed by the active material in the electrode before saturation.
S O C p = c ¯ s , p c s , p 0 % c s , p 100 % c s , p 0 %
S O C n = c ¯ s , n c s , n 0 % c s , n 100 % c s , n 0 %
where c ¯ s , p , c ¯ s , n is the average solid phase lithium ions concentration.
Theoretically, the SOC of positive and negative electrodes should be equal, the average of them is taken as the battery SOC considering the calculation error.
S O C = S O C p + S O C n 2 = c ¯ s , p c s , p 0 % c s , p 100 % c s , p 0 % + c ¯ s , n c s , n 0 % c s , n 100 % c s , n 0 % 2
To achieve the acquisition of the above two state variables c ¯ s , p , c ¯ s , n , the dispersion of solid diffusion equations is needed. Refs. [43,45] use the FDM to simplify the solid diffusion equations, dividing the solid particles into n layers evenly along the radius direction with the spherical center as the original point. The state-space equation of the negative electrode is shown in Equations (22) and (23).
[ c ˙ s , n 1 ( t ) c ˙ s , n 2 ( t ) c ˙ s , n ( n 1 ) ( t ) ] = D s , n Δ r n 2 [ 2 2 0 0 0 0 1 2 2 3 2 0 0 0 0 0 0 n 3 n 2 2 n 1 n 2 0 0 0 0 n 2 n 1 n 2 n 1 ] [ c s , n 1 ( t ) c s , n 2 ( t ) c s , n ( n 1 ) ( t ) ] + [ 0 0 0 n n 1 ] j n ( t ) Δ r n
c s s , n ( t ) = c s , n ( n 1 ) ( t ) Δ r n D s , n j n
where c s , n k is the lithium ions concentration of the k-th layer in the solid particle, Δ r n = R s , n / n . In the FDM, if the value of n is too small, the calculation error will be increased. If the value of n is too large, a large number of state variables will be introduced, and the computational burden will also be increased. In this paper, a three-parameter parabola approximation method [16] is used to simplify the solid diffusion equations, as shown in Equations (24)–(26).
d d t c s ¯ = 3 j R s
d d t c f ¯ s + 30 D s R s 2 c f ¯ s + 45 j 2 R s 2 = 0
c s s = c ¯ s + 8 R s 35 c f ¯ s R s 35 D s j
where c f ¯ s is the average concentration flux of lithium ions in active material.
In this way, the state-space equation is shown in Equation (27), and the output function can be expressed in Equation (28).
[ c ¯ ˙ s , n ( t ) c ¯ ˙ s , p ( t ) c f ¯ · s , n ( t ) c f ¯ · s , p ( t ) ] = [ 0 0 0 0 0 0 0 0 0 0 30 D s , n R s , n 2 0 0 0 0 30 D s , p R s , p 2 ] [ c ¯ s , n ( t ) c ¯ s , p ( t ) c f ¯ s , n ( t ) c f ¯ s , p ( t ) ] + [ 1 F S n L n ε s , n 1 F S p L p ε s , p 15 2 F R s , n S n L n ε s , n 15 2 F R s , p S p L p ε s , p ] I ( t )
V ( t ) = h ( c s s , n ( t ) , c s s , p ( t ) , c e , n ( t ) , c e , p ( t ) , I ( t ) )

4.3. Particle Filter

After the state-space equation is build up, it is combined with PF to achieve our final goal: SOC estimation. The flowchart of PF is showed in Figure 3. PF, using the sequential Monte Carlo and recursive Bayesian estimation, is a recently rising statistical filtering method with high potential. PF uses the Monte Carlo method to estimate the state value and uses random samples in the state space to estimate the posterior probability density. In general, the steps of PF are as follows [48].
(1) Initialize: Assuming the initial value z 0 follows a normal distribution N ( μ , s 2 ) , defining the state-space equation of a nonlinear system as Equations (29) and (30), generate random samples z 0 ( i ) , (i = 1, 2,…, n) and weights w 0 ( i ) , where the weights w 0 ( i ) can be distributed proportionally, or define w 0 ( i ) = 1 / n .
z k = f k ( z k 1 , u k 1 )
y k = h k ( z k , q k )
where f k ( ) is the state transfer function, h k ( ) is the observation function, and u k , q k are the noise sequences of states and observations, separately.
(2) Predict: Predictions are made for each sample point z 0 ( i ) based on the state-space equation of the system, generating initial sample points z 1 ( i ) when k = 1.
(3) Update: Step (2) generates the sample points z 1 ( i ) while the output function is generated by the observation sample points y 1 ( i ) , which can be used to compare with the real observation value and update the weight values of sample points. After normalization, the new particle z 1 ( i ) and its weight w 1 ( i ) are obtained by Equations (31) and (32), and the normalization function is shown in Equation (33).
z 1 ( i ) = f ( x 0 ( i ) , u 0 )
w 1 ( i ) = f r [ y 1 h ( z 1 ( i ) ) ] w 0 ( i )
w k ( i ) ¯ = w k ( i ) i = 1 n w k ( i )
where f r ( ) is the probability density function (PDF) of the observation noise, and w k ( i ) ¯ is the new weight after normalization. Generally, we assume that the observation noise r k follows a normal distribution.
(4) Resample: During the recursion of PF, the problem of particle degradation will arise in some circumstances, that is, a small number of particles have high weight values, while the remaining large number of particles have extremely low weight values. Even there is a possibility that after a few steps of recursion, only one particle may have a non-zero weight. Therefore, Equation (34) is defined to determine particle degradation and resampling is used to reduce the possible problem of the failures caused by particle degradation.
N e f f = 1 i = 1 n ( w k ( i ) ) 2
The smaller N e f f is, the more particles are degraded and the more urgent resampling is needed.
(5) Recursion: Repeating steps (2)–(4) while k = k + 1, the predicted value of z k can be obtained by calculating mathematical expectation as follows.
z k + = E ( x ) = i = 1 n z k ( i ) w k ( i )
The work of this paper can be summed as follows. Firstly, the EE is applied in this paper to achieve SA and to find out the sensitive parameters. Then, PSO is used to identify those sensitive parameters. Afterwards, SPME is built up with more accurate parameters, which can improve the accuracy of SOC estimation drastically. Finally, through the PF, SOC estimation is achieved. The framework of the online SOC estimation using the EM-based method combined with PF is illustrated in Figure 4.

5. Validation and Discussion

The Li-ion battery used in this paper is a 2.6Ah cylindrical 18650 Li-ion battery of type ICR18650-26J manufactured by SAMSUNG. The specifications of the battery are summarized in Table 3. The battery experimental testing equipment are shown in Figure 5, and can be divided into temperature control box, charge and discharge tester, and host computer. During the charge and discharge test, the battery is put into the thermostat to ensure that the ambient temperature is unchanged. The charge and discharge tester can provide various complicated working conditions according to the test requirements. Values of current, cut-off voltage, cut-off current, charge time, etc., can be controlled by the host computer, and an automatic cycle test can be conducted by setting the cycle number in the host computer.

5.1. Parameter Identification

Considering the high accuracy of parameters as the foundation of accurate SOC estimation, parameter identification is first implemented with the SA. Before parameter identification, global sensitivity analysis is applied under 1 C and 0.5 C separately to reduce the calculational burden. Hence, 14 parameters are analyzed, as shown in Figure 6, and the initial parameters of the battery are shown in Table 4.
After the SA, we can find from the results that the radius of spherical active particles R s , thickness of the electrode L, and volume fraction ε are highly sensitive parameters. Since the thickness of electrodes and separator L indicates geometric parameters, the radius of spherical active particles R s and the volume fraction are identified using PSO. Meanwhile, some SOC-related parameters, such as lithium ions concentration when SOC = 0 and SOC = 1, are identified as well. The results of parameter identification are shown in Table 5. Squares in different colors represent elementary effect in different trajectory.

5.2. Model Validation

A precise model is indispensable for a model-based SOC online estimation. Hence, for better feasibility and applicability, the simulation experiments are carried out under different working conditions. NEDC, FTP, and UDDS working conditions are applied in this paper. The errors under different conditions are analyzed as well, as shown in Figure 7. Despite the error rises, the current increases sharply in normal circumstances. The error of voltage varies in the range of 0–0.08 V under the NEDC conditions, and it is 0–0.09 V under FTP conditions, 0–0.04 V under UDDS conditions. Such results imply the phenomenon that if the discharging current increases, the model error will increase as well. However, even in FTP conditions, which contain the greater error among the three conditions, the MAE = 0.04856 shows the great accuracy of the model. The results of the experiments imply that the SPME model has sufficient accuracy for SOC estimation.

5.3. SOC Estimation Results

According to the abovementioned works, the online SOC estimation is implemented using PF with SPME. It is worth mentioning that even though the SPME itself has the ability to monitor the lithium ions concentration change inside the solid particles, without the correctness from the voltage, the errors will be significant compared to the SPME with the assistance from PF. As shown in Figure 8, the proposed method is compared to the SPME model itself and the ECM with the EKF [49]. It is obvious that the error of SPME has reduced dramatically compared to the ECM method. For example, while the maximum error of the ECM method is 0.078 under NEDC conditions, the maximum error of SPME has reduced to 0.045 under the same conditions. However, without the correction from voltage, the error of SPME shows an increasing trend. By combining SPME and PF, the maximum error has reduced to 0.00064 under NEDC conditions and the increasing trend is alleviated as well. The same trend can be seen in Figure 8b,c, both in FTP and UDDS conditions. The maximum error has reduced to 0.010 under FTP conditions and the error under UDDS is less than 0.011 in normal circumstances.
As shown in Figure 9, the evaluation criteria are mean absolute error (MAE) and root mean square error (RMSE). The method combined both SPME and PF can achieve the SOC estimation with MAE = 0.0025, RMSE = 0.0039 under NEDC condition, MAE = 0.0058, RMSE = 0.0074 under FTP condition, and MAE = 0.0076, RMSE = 0.0086 under UDDS condition. The working conditions applied in this experiment present distinctive differences in discharge rate, discharge time, and the waveform of current and voltage, which shows the inestimable potential presented by the higher accuracy and wider application range of the proposed method.

6. Conclusions

This paper developed SPME using PF to achieve the online accurate estimation of SOC under different conditions. Considering the accuracy and fidelity of EM, this paper uses SPME to find a compromise involving both accuracy and low computational burden. After completing the battery model, the elementary test was applied for the SA of parameters to reduce the calculational burden, and eight parameters were identified using PSO algorithm. The solid diffusion equations were simplified and transformed into state-space equations to adjust the PF and achieve the SOC estimation.
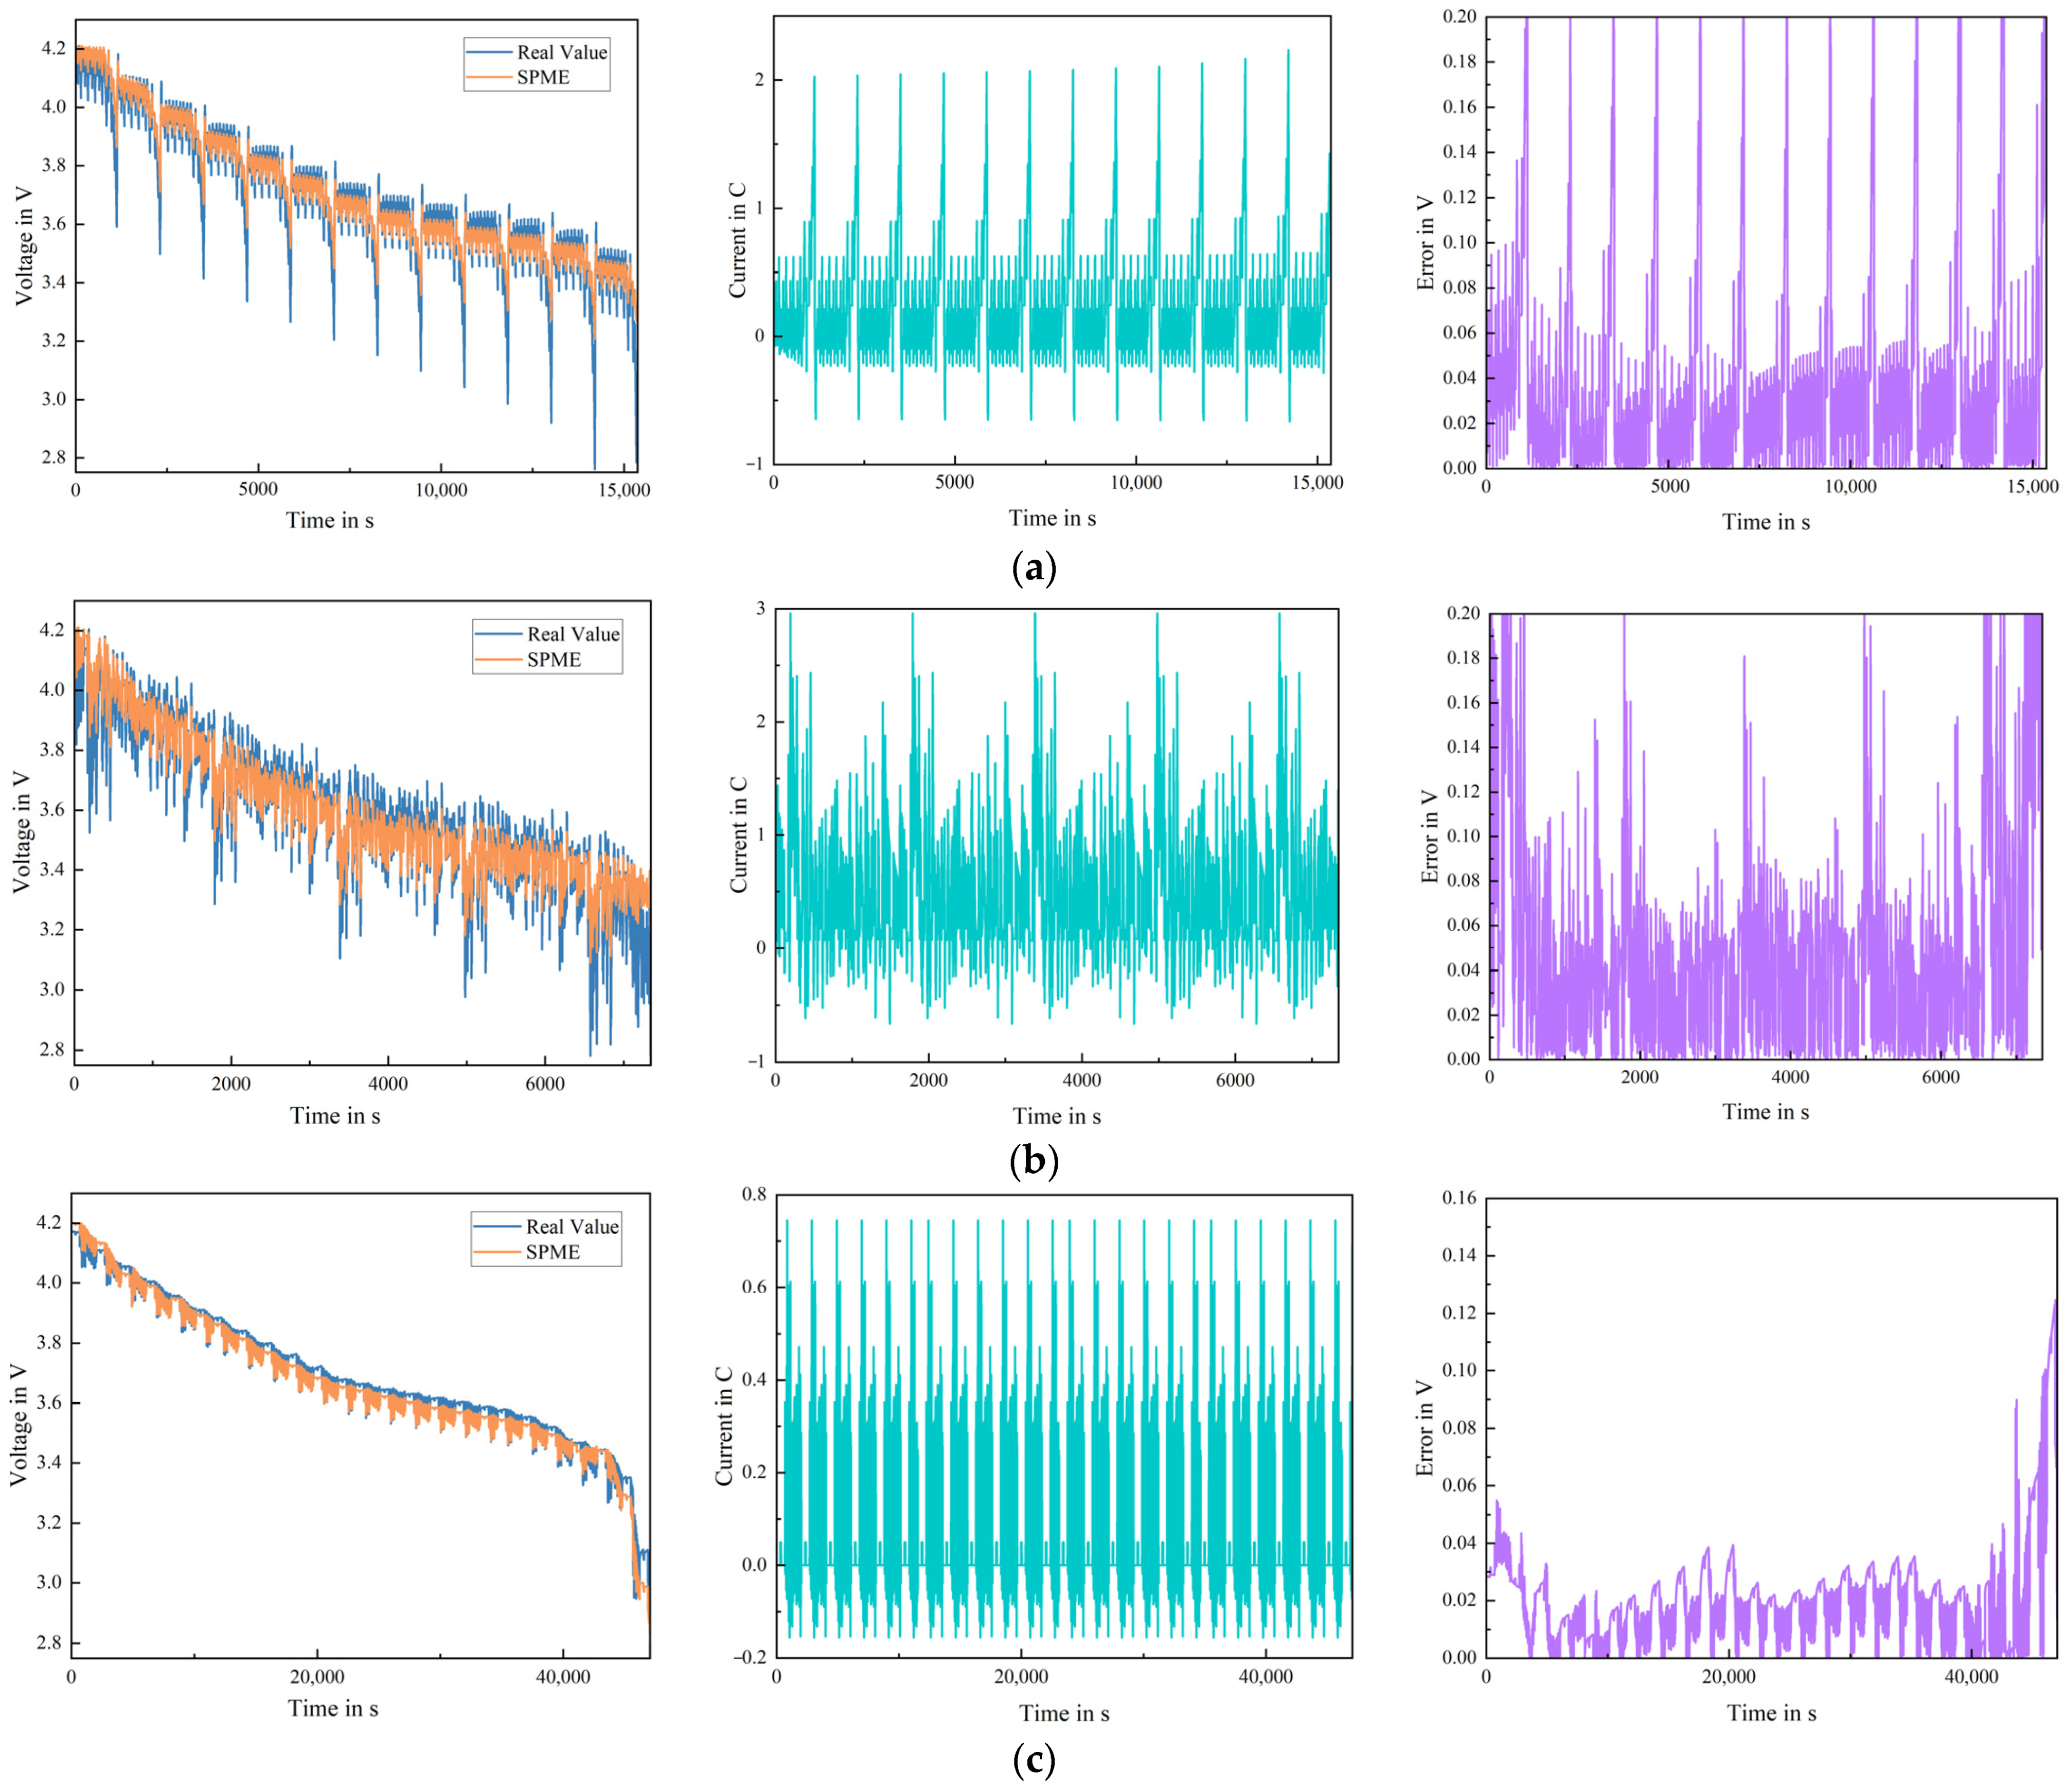
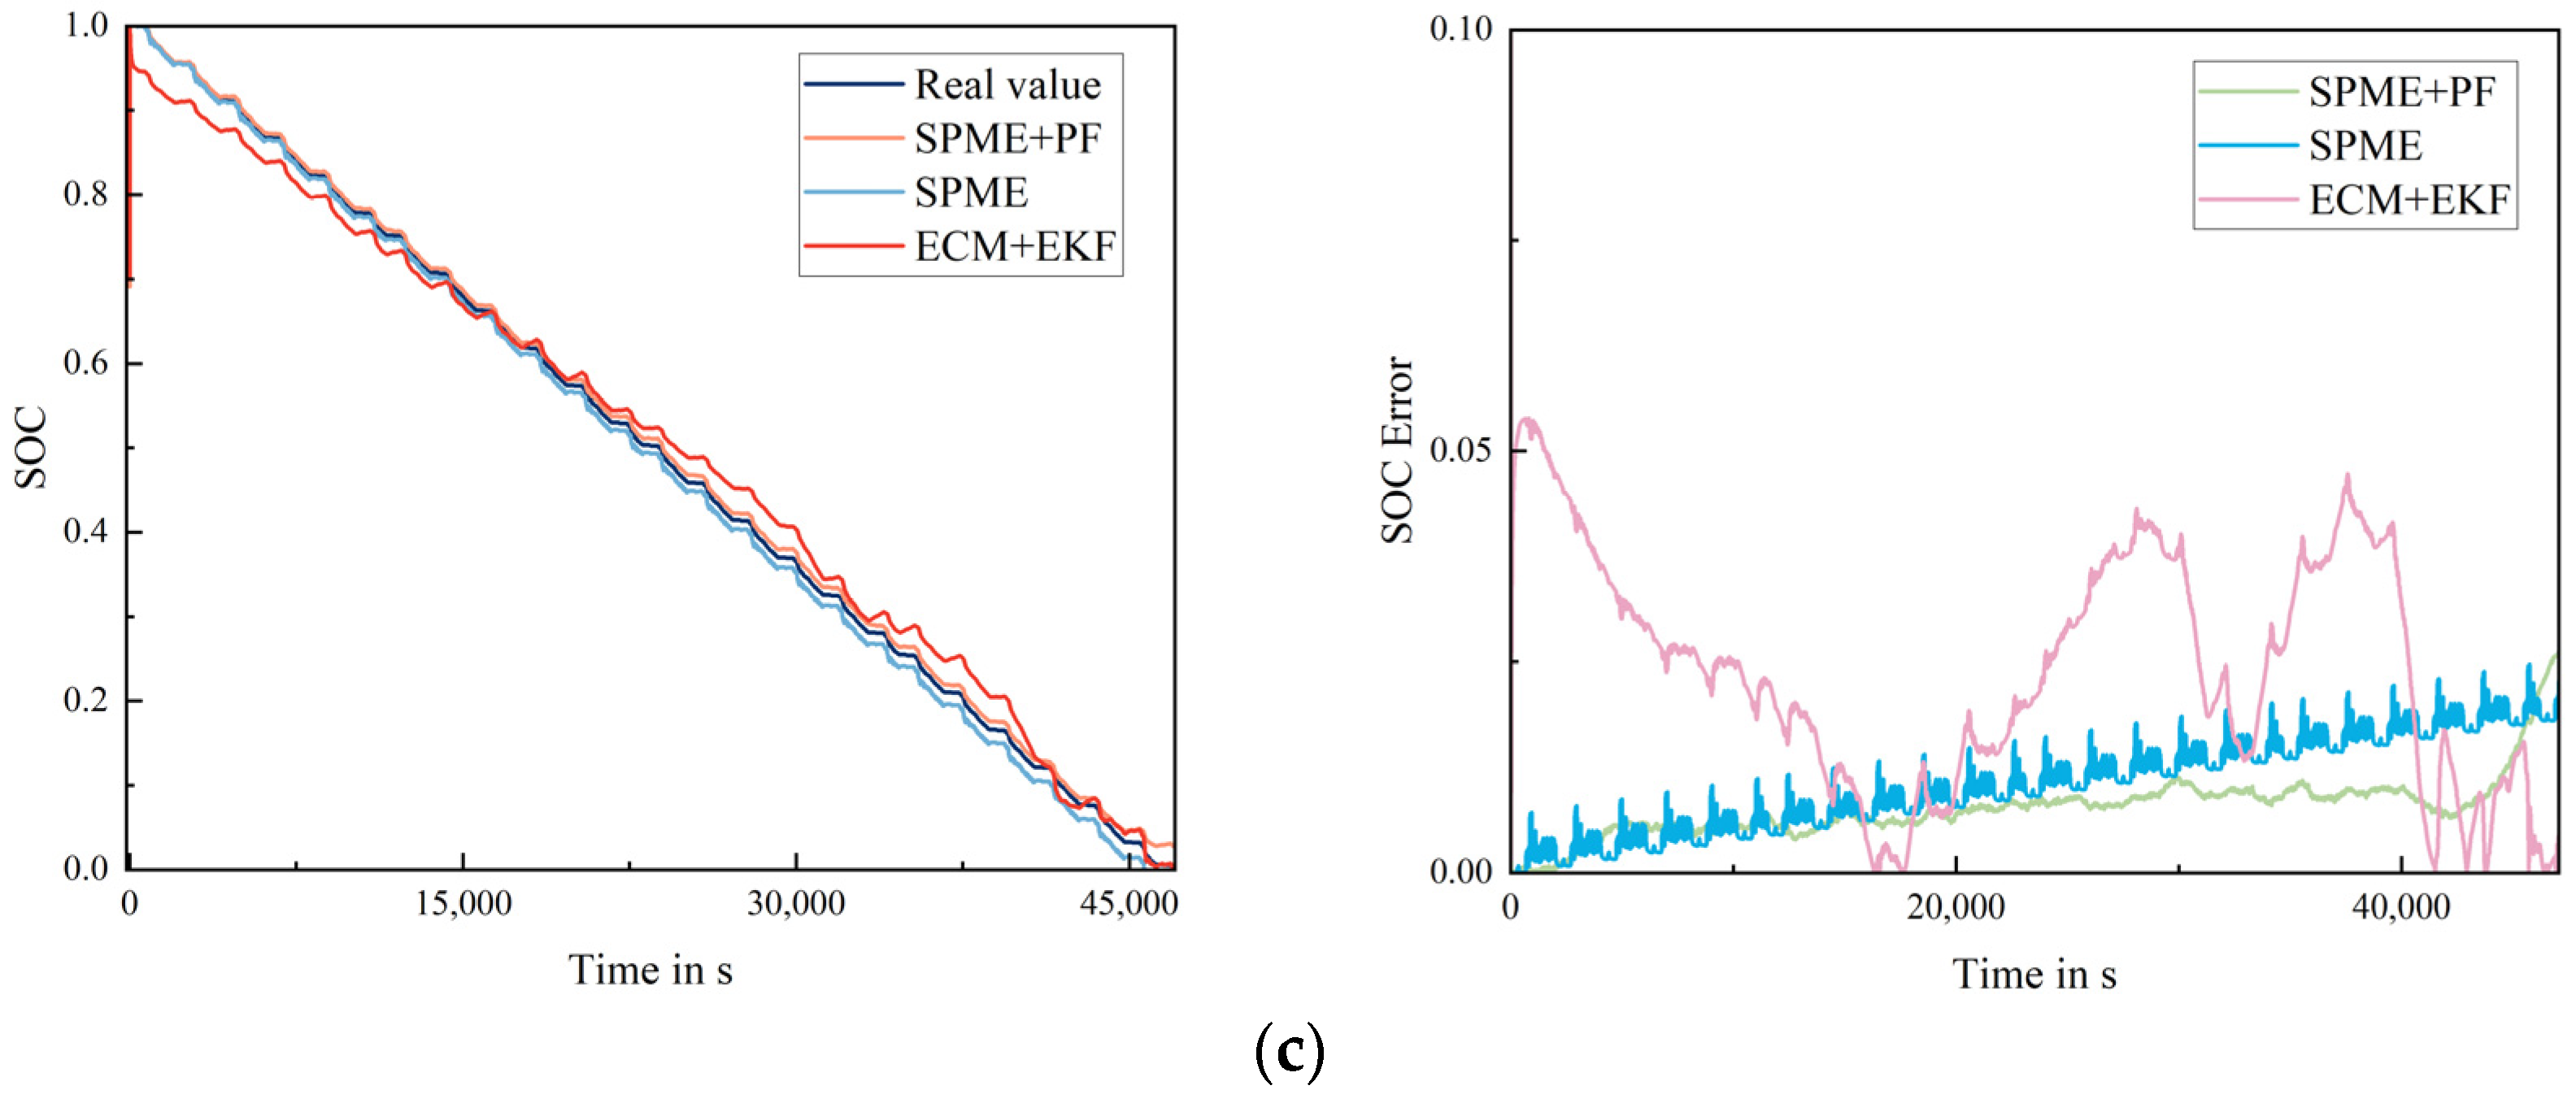
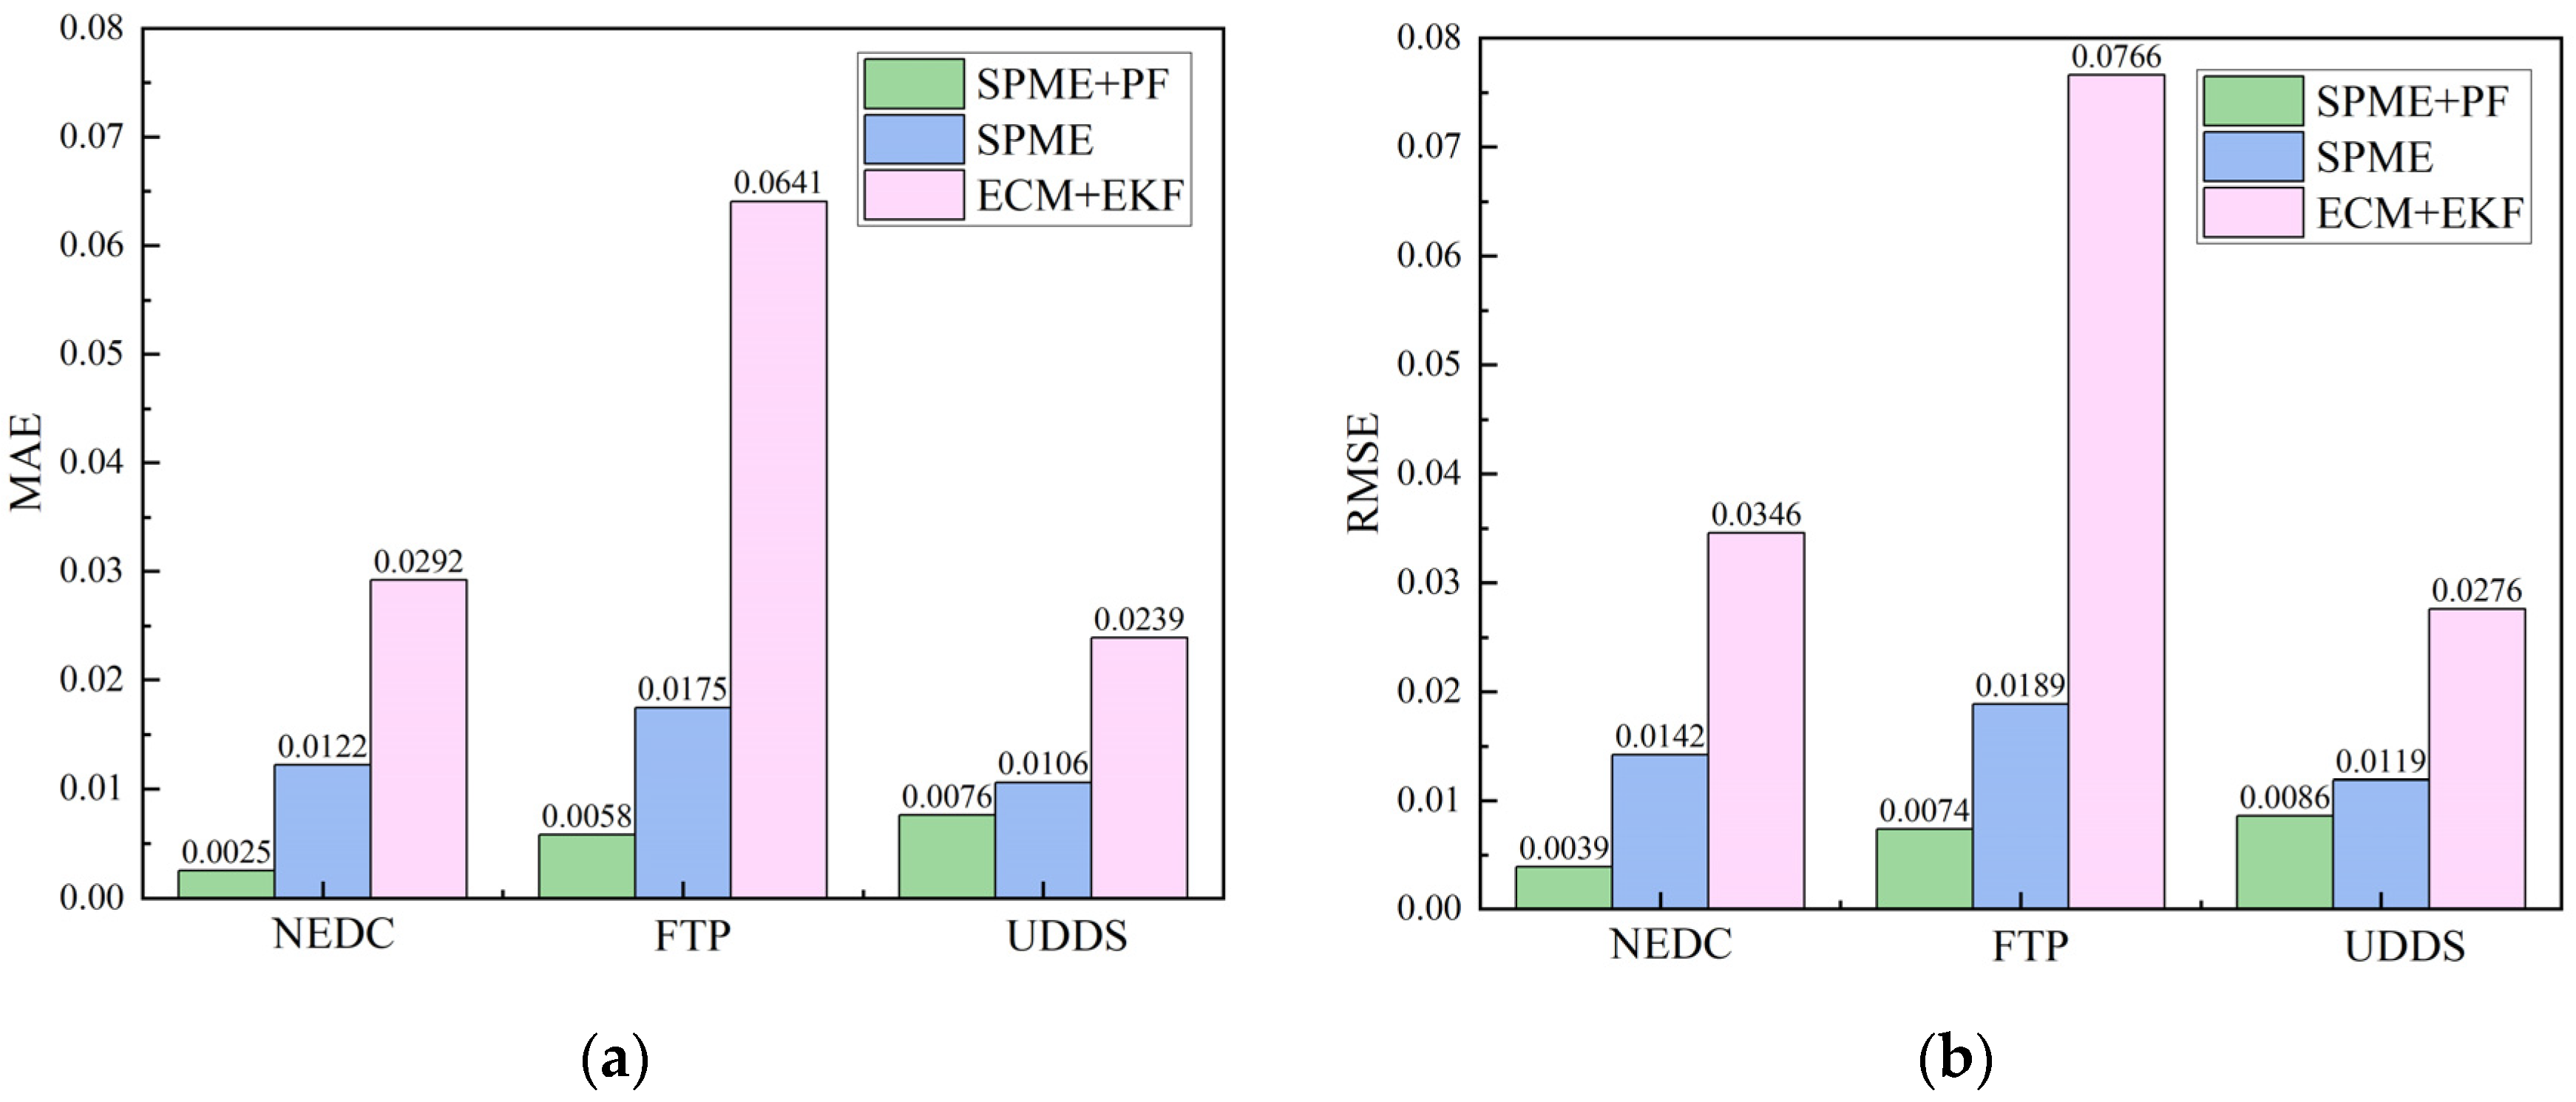
The battery tests were applied under NEDC, FTP, and UDDS conditions. The experimental results show that the method introduced in this paper has high accuracy. Among three different working conditions, the proposed method has maximum MAE = 0.0076, RMSE = 0.0086, while another model-based method has maximum MAE = 0.0641, RMSE = 0.0766. Therefore, the proposed method demonstrates remarkable robustness and reliability for different battery working conditions.
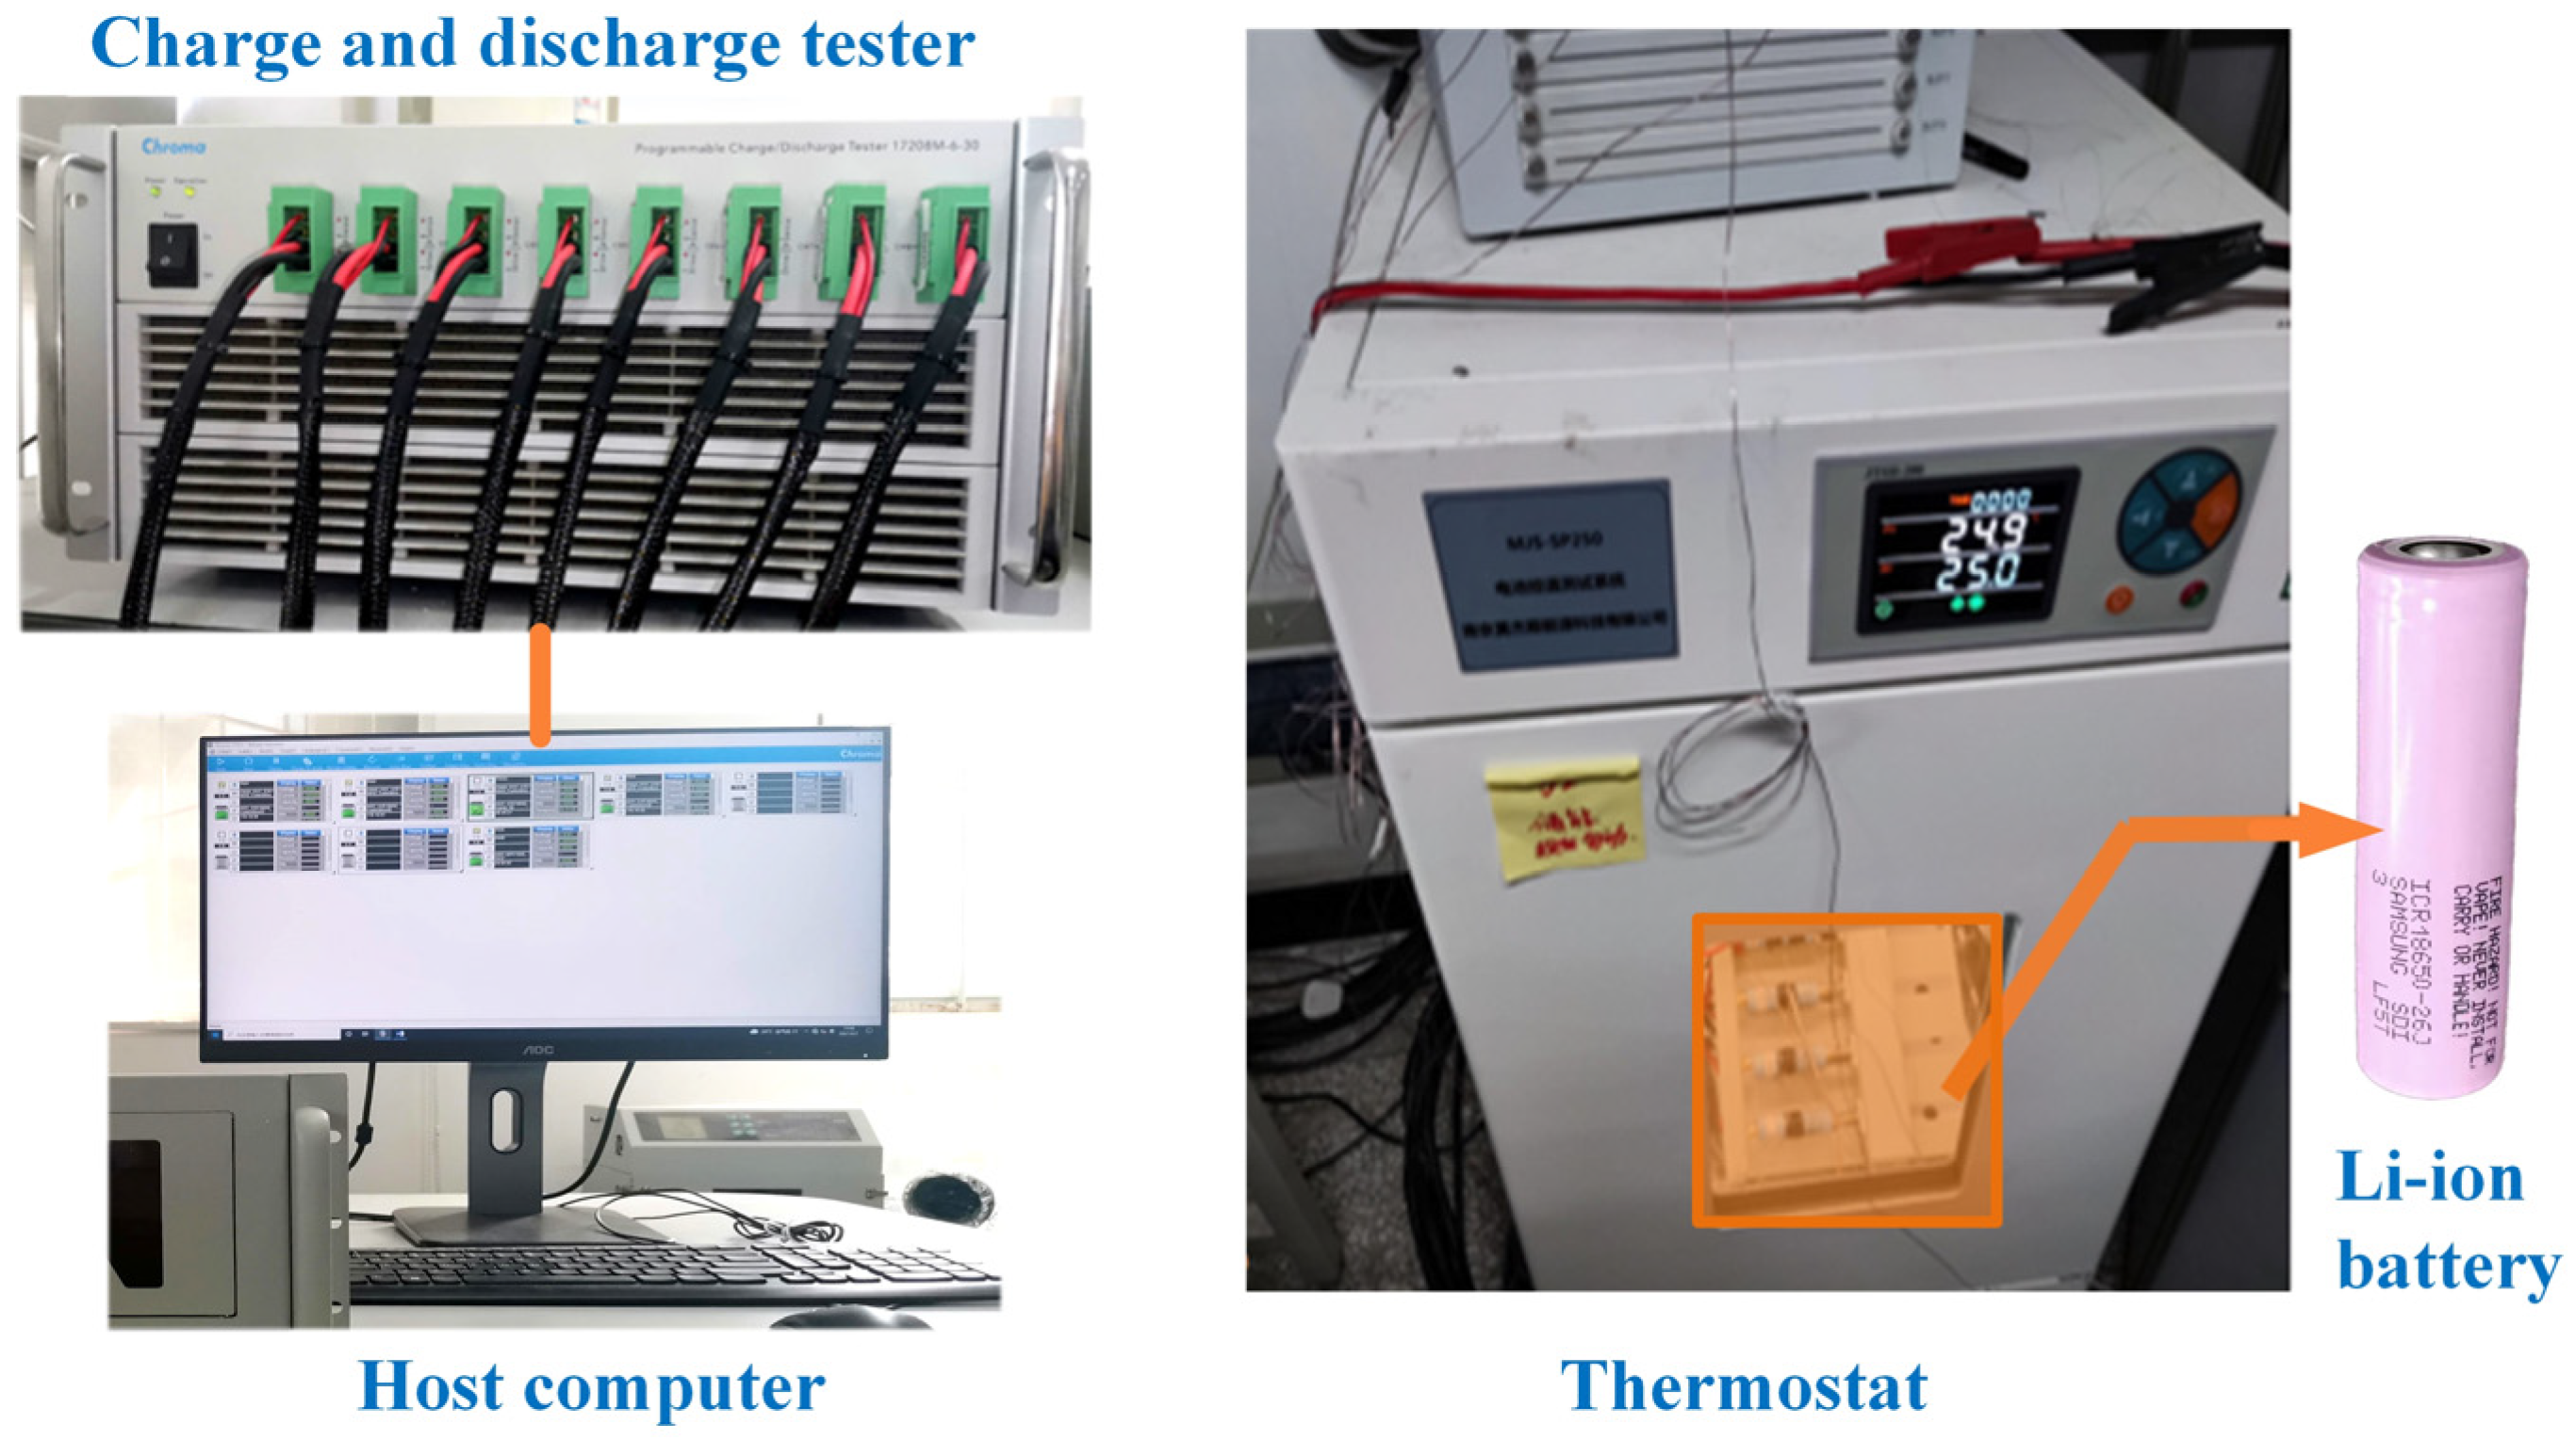
The proposed method is only experimentally validated on a regular lithium-ion batteries, namely the ICR18650-26J battery manufactured by SAMSUNG. With the development of batteries, solid-state and anode-free batteries are now widely used in BMS. With some adjustment to the model structure, the proposed method can be applied to these kinds of batteries. The adjustment of model structure also can be the future trend and our next research goal.

Author Contributions

Conceptualization, J.W. and J.M.; Data curation, J.W.; Methodology, J.W.; Validation, J.W.; Writing — original draft, J.W.; Supervision, J.M., Q.P. and T.L.; Writing — review & editing, J.M., Q.P., T.L., X.Z., G.C. and Y.L. All authors have read and agreed to the published version of the manuscript.

Funding

This work was supported by the Science and Technology Project of State Grid Corporation of China (No. 5108-202299262A-1-0-ZB).

Data Availability Statement

Not applicable.

Conflicts of Interest

The authors declare no conflict of interest.

Nomenclature

Nomenclature of Parameters in EM.
ε volume fraction of active materialaspecific surface area of the active particles
clithium-ions concentration R f resistivity of the SEI film
Dlithium-ions diffusion coefficientVterminal voltage of battery
t + 0 lithium-ions transfer numberLthickness of active material
FFaraday’s constantSarea of electrode
Iexternal current density c ¯ average lithium-ions concentration
d ln f c / a / d ln c e electrolyte activity coefficientEEelementary effect
zstate vectoryoutput vector
rcoordinate axis along the radius of the solid-phase particlexcoordinate axis along the battery
pparameter μ average value
Xposition of particleVvelocity of particle
unoice sequences of statesqnoice sequences of observations
Pposition of personal best particleGposition of global best particle
icurrent density of active material c f ¯ average concentration flux of lithium-ions
j n active particles molar flux of lithium-ions Subscripts
R s radius of solid particlesnnegative electrode
κ electrolyte ionic conductivityppositive electrode
ϕ electrical potentialaanode
Rmolar gas constantccathode
Tbattery temperaturessolid phase
σ solid phase conductivityeelectrolyte
i 0 exchange current densitysssurface of solid particles
α reaction transfer coefficientsffiller
η electrochemical reactions overpotential0%SOC = 0%
kelectrochemical reaction rate100%SOC = 100%
c s , max maximum solid phase lithium-ions concentrationSuperscripts
U O C V open circuit potentialeffeffective
sdeviation value · derivatioon
wweights+predicted value

References

  1. Ding, Y.; Cano, Z.P.; Yu, A.; Lu, J.; Chen, Z. Automotive Li-Ion Batteries: Current Status and Future Perspectives. Electrochem. Energy Rev. 2019, 2, 1–28. [Google Scholar] [CrossRef]
  2. Armand, M.; Tarascon, J.-M. Building better batteries. Nature 2008, 451, 652–657. [Google Scholar] [CrossRef] [PubMed]
  3. Chaturvedi, N.A.; Klein, R.; Christensen, J.; Ahmed, J.; Kojic, A. Algorithms for Advanced Battery-Management Systems: Modeling, estimation, and control challenges for lithium-ion batteries. IEEE Control Syst. 2010, 30, 49–68. [Google Scholar] [CrossRef]
  4. Lin, X.; Kim, Y.; Mohan, S.; Siegel, J.B.; Stefanopoulou, A.G. Modeling and Estimation for Advanced Battery Management. Annu. Rev. Control. Robot. Auton. Syst. 2019, 2, 393–426. [Google Scholar] [CrossRef]
  5. Liu, L.; Feng, X.; Rahe, C.; Li, W.; Lu, L.; He, X.; Sauer, D.U.; Ouyang, M. Internal short circuit evaluation and corresponding failure mode analysis for lithium-ion batteries. J. Energy Chem. 2021, 61, 269–280. [Google Scholar] [CrossRef]
  6. Shen, M.; Gao, Q. A review on battery management system from the modeling efforts to its multiapplication and integration. Int. J. Energy Res. 2019, 43, 5042–5075. [Google Scholar] [CrossRef]
  7. Ng, K.S.; Moo, C.-S.; Chen, Y.-P.; Hsieh, Y.-C. Enhanced coulomb counting method for estimating state-of-charge and state-of-health of lithium-ion batteries. Appl. Energy 2009, 86, 1506–1511. [Google Scholar] [CrossRef]
  8. Yang, N.; Zhang, X.; Li, G. State of charge estimation for pulse discharge of a LiFePO4 battery by a revised Ah counting. Electrochimica Acta 2015, 151, 63–71. [Google Scholar] [CrossRef]
  9. Chaoui, H.; Mandalapu, S. Comparative Study of Online Open Circuit Voltage Estimation Techniques for State of Charge Estimation of Lithium-Ion Batteries. Batteries 2017, 3, 12. [Google Scholar] [CrossRef] [Green Version]
  10. Xing, Y.; He, W.; Pecht, M.; Tsui, K.L. State of charge estimation of lithium-ion batteries using the open-circuit voltage at various ambient temperatures. Appl. Energy 2014, 113, 106–115. [Google Scholar] [CrossRef]
  11. Wei, Z.; Zhao, J.; Zou, C.; Lim, T.M.; Tseng, K.J. Comparative study of methods for integrated model identification and state of charge estimation of lithium-ion battery. J. Power Sources 2018, 402, 189–197. [Google Scholar] [CrossRef]
  12. Meng, J.; Luo, G.; Gao, F. Lithium Polymer Battery State-of-Charge Estimation Based on Adaptive Unscented Kalman Filter and Support Vector Machine. IEEE Trans. Power Electron. 2015, 31, 2226–2238. [Google Scholar] [CrossRef]
  13. Tulsyan, A.; Tsai, Y.; Gopaluni, R.B.; Braatz, R.D. State-of-charge estimation in lithium-ion batteries: A particle filter approach. J. Power Sources 2016, 331, 208–223. [Google Scholar] [CrossRef]
  14. Lotfi, N.; Landers, R.G.; Li, J.; Park, J. Reduced-Order Electrochemical Model-Based SOC Observer With Output Model Uncertainty Estimation. IEEE Trans. Control. Syst. Technol. 2016, 25, 1217–1230. [Google Scholar] [CrossRef]
  15. Allam, A.; Onori, S. An Interconnected Observer for Concurrent Estimation of Bulk and Surface Concentration in the Cathode and Anode of a Lithium-ion Battery. IEEE Trans. Ind. Electron. 2018, 65, 7311–7321. [Google Scholar] [CrossRef]
  16. Liu, Y.; Ma, R.; Pang, S.; Xu, L.; Zhao, D.; Wei, J.; Huangfu, Y.; Gao, F. A Nonlinear Observer SOC Estimation Method Based on Electrochemical Model for Lithium-Ion Battery. IEEE Trans. Ind. Appl. 2020, 57, 1094–1104. [Google Scholar] [CrossRef]
  17. Tran, M.-K.; DaCosta, A.; Mevawalla, A.; Panchal, S.; Fowler, M. Comparative Study of Equivalent Circuit Models Performance in Four Common Lithium-Ion Batteries: LFP, NMC, LMO, NCA. Batteries 2021, 7, 51. [Google Scholar] [CrossRef]
  18. Yang, J.; Cai, Y.; Pan, C.; Mi, C. A novel resistor-inductor network-based equivalent circuit model of lithium-ion batteries under constant-voltage charging condition. Appl. Energy 2019, 254, 113726. [Google Scholar] [CrossRef]
  19. Du, X.; Meng, J.; Zhang, Y.; Huang, X.; Wang, S.; Liu, P.; Liu, T. An Information Appraisal Procedure: Endows Reliable Online Parameter Identification to Lithium-Ion Battery Model. IEEE Trans. Ind. Electron. 2021, 69, 5889–5899. [Google Scholar] [CrossRef]
  20. Hentunen, A.; Lehmuspelto, T.; Suomela, J. Time-Domain Parameter Extraction Method for Thévenin-Equivalent Circuit Battery Models. IEEE Trans. Energy Convers. 2014, 29, 558–566. [Google Scholar] [CrossRef]
  21. Wei, Z.; Zou, C.; Leng, F.; Soong, B.H.; Tseng, K.-J. Online Model Identification and State-of-Charge Estimate for Lithium-Ion Battery with a Recursive Total Least Squares-Based Observer. IEEE Trans. Ind. Electron. 2018, 65, 1336–1346. [Google Scholar] [CrossRef]
  22. Zhang, C.; Wang, L.Y.; Li, X.; Chen, W.; Yin, G.G.; Jiang, J. Robust and Adaptive Estimation of State of Charge for Lithium-Ion Batteries. IEEE Trans. Ind. Electron. 2015, 62, 4948–4957. [Google Scholar] [CrossRef]
  23. Meng, J.; Luo, G.; Ricco, M.; Swierczynski, M.; Stroe, D.-I.; Teodorescu, R. Overview of Lithium-Ion Battery Modeling Methods for State-of-Charge Estimation in Electrical Vehicles. Appl. Sci. 2018, 8, 659. [Google Scholar] [CrossRef] [Green Version]
  24. Doyle, M.; Fuller, T.F.; Newman, J. Modeling of Galvanostatic Charge and Discharge of the Lithium/Polymer/Insertion Cell. J. Electrochem. Soc. 1993, 140, 1526–1533. [Google Scholar] [CrossRef]
  25. Fuller, T.F.; Doyle, M.; Newman, J. Simulation and Optimization of the Dual Lithium Ion Insertion Cell. J. Electrochem. Soc. 1994, 141, 1–10. [Google Scholar] [CrossRef] [Green Version]
  26. Zou, C.; Manzie, C.; Nesic, D. A Framework for Simplification of PDE-Based Lithium-Ion Battery Models. IEEE Trans. Control. Syst. Technol. 2015, 24, 1594–1609. [Google Scholar] [CrossRef]
  27. Kwon, K.H.; Shin, C.B.; Kang, T.H.; Kim, C.-S. A two-dimensional modeling of a lithium-polymer battery. J. Power Sources 2006, 163, 151–157. [Google Scholar] [CrossRef]
  28. Martínez-Rosas, E.; Vasquez-Medrano, R.; Flores-Tlacuahuac, A. Modeling and simulation of lithium-ion batteries. Comput. Chem. Eng. 2011, 35, 1937–1948. [Google Scholar] [CrossRef]
  29. Reimers, J.N. Algorithmic Improvements and PDE Decoupling, for the Simulation of Porous Electrode Cells. J. Electrochem. Soc. 2013, 160, A811–A818. [Google Scholar] [CrossRef]
  30. Torchio, M.; Magni, L.; Gopaluni, R.B.; Braatz, R.D.; Raimondo, D.M. LIONSIMBA: A Matlab Framework Based on a Finite Volume Model Suitable for Li-Ion Battery Design, Simulation, and Control. J. Electrochem. Soc. 2016, 163, A1192–A1205. [Google Scholar] [CrossRef]
  31. Marcicki, J.; Canova, M.; Conlisk, A.T.; Rizzoni, G. Design and parametrization analysis of a reduced-order electrochemical model of graphite/LiFePO4 cells for SOC/SOH estimation. J. Power Sources 2013, 237, 310–324. [Google Scholar] [CrossRef]
  32. Haran, B.S.; Popov, B.N.; White, R.E. Determination of the hydrogen diffusion coefficient in metal hydrides by impedance spectroscopy. J. Power Sources 1998, 75, 56–63. [Google Scholar] [CrossRef]
  33. Wang, Y.; Fang, H.; Sahinoglu, Z.; Wada, T.; Hara, S. Adaptive Estimation of the State of Charge for Lithium-Ion Batteries: Nonlinear Geometric Observer Approach. IEEE Trans. Control. Syst. Technol. 2014, 23, 948–962. [Google Scholar] [CrossRef] [Green Version]
  34. Di Domenico, D.; Stefanopoulou, A.; Fiengo, G. Lithium-Ion Battery State of Charge and Critical Surface Charge Estimation Using an Electrochemical Model-Based Extended Kalman Filter. J. Dyn. Syst. Meas. Control. 2010, 132, 061302. [Google Scholar] [CrossRef]
  35. Santhanagopalan, S.; White, R.E. Online estimation of the state of charge of a lithium ion cell. J. Power Sources 2006, 161, 1346–1355. [Google Scholar] [CrossRef]
  36. Lai, Q.; Ahn, H.J.; Kim, Y.; Na Kim, Y.; Lin, X. New data optimization framework for parameter estimation under uncertainties with application to lithium-ion battery. Appl. Energy 2021, 295, 117034. [Google Scholar] [CrossRef]
  37. Bonfitto, A.; Feraco, S.; Tonoli, A.; Amati, N.; Monti, F. Estimation Accuracy and Computational Cost Analysis of Artificial Neural Networks for State of Charge Estimation in Lithium Batteries. Batteries 2019, 5, 47. [Google Scholar] [CrossRef] [Green Version]
  38. Santhanagopalan, S.; Guo, Q.; White, R.E. Parameter Estimation and Model Discrimination for a Lithium-Ion Cell. J. Electrochem. Soc. 2007, 154, A198. [Google Scholar] [CrossRef] [Green Version]
  39. Thirugnanam, K.; Saini, H.; Kumar, P. Mathematical modeling of Li-ion battery for charge/discharge rate and capacity fading characteristics using genetic algorithm approach. In Proceedings of the 2012 IEEE Transportation Electrification Conference and Expo, ITEC, Dearborn, MI, USA, 18–20 June 2012. [Google Scholar] [CrossRef]
  40. Hu, Y.; Yurkovich, S.; Guezennec, Y.; Yurkovich, B. Electro-thermal battery model identification for automotive applications. J. Power Sources 2011, 196, 449–457. [Google Scholar] [CrossRef]
  41. Shekar, A.C.; Anwar, S. Real-Time State-of-Charge Estimation via Particle Swarm Optimization on a Lithium-Ion Electrochemical Cell Model. Batteries 2019, 5, 4. [Google Scholar] [CrossRef] [Green Version]
  42. Rahman, A.; Anwar, S.; Izadian, A. Electrochemical model parameter identification of a lithium-ion battery using particle swarm optimization method. J. Power Sources 2016, 307, 86–97. [Google Scholar] [CrossRef]
  43. Xiong, R.; Li, L.; Li, Z.; Yu, Q.; Mu, H. An electrochemical model based degradation state identification method of Lithium-ion battery for all-climate electric vehicles application. Appl. Energy 2018, 219, 264–275. [Google Scholar] [CrossRef]
  44. Moura, S.J.; Chaturvedi, N.A.; Krstić, M. Adaptive Partial Differential Equation Observer for Battery State-of-Charge/State-of-Health Estimation Via an Electrochemical Model. J. Dyn. Syst. Meas. Control. 2013, 136, 011015. [Google Scholar] [CrossRef]
  45. Moura, S.J.; Argomedo, F.B.; Klein, R.; Mirtabatabaei, A.; Krstic, M. Battery State Estimation for a Single Particle Model With Electrolyte Dynamics. IEEE Trans. Control. Syst. Technol. 2016, 25, 453–468. [Google Scholar] [CrossRef]
  46. Zeng, X.; Xu, L.; Deng, Z.; Feng, F.; Hu, X. Global Sensitivity Analysis of Battery Single Particle Model Parameters. In Proceedings of the 2019 IEEE Vehicle Power and Propulsion Conference (VPPC), Hanoi, Vietnam, 14–17 October 2019; pp. 1–6. [Google Scholar] [CrossRef]
  47. Meng, J.; Ricco, M.; Luo, G.; Swierczynski, M.; Stroe, D.-I.; Stroe, A.-I.; Teodorescu, R. An Overview and Comparison of Online Implementable SOC Estimation Methods for Lithium-Ion Battery. IEEE Trans. Ind. Appl. 2017, 54, 1583–1591. [Google Scholar] [CrossRef]
  48. Chen, D.; Meng, J.; Huang, H.; Wu, J.; Liu, P.; Lu, J.; Liu, T. An Empirical-Data Hybrid Driven Approach for Remaining Useful Life prediction of lithium-ion batteries considering capacity diving. Energy 2022, 245, 123222. [Google Scholar] [CrossRef]
  49. Meng, J.; Stroe, D.-I.; Ricco, M.; Luo, G.; Teodorescu, R. A Simplified Model-Based State-of-Charge Estimation Approach for Lithium-Ion Battery With Dynamic Linear Model. IEEE Trans. Ind. Electron. 2018, 66, 7717–7727. [Google Scholar] [CrossRef] [Green Version]
Figure 1. Schematics of (a) the P2D model and (b) the SPME.
Batteries 09 00180 g001
Figure 2. Flowchart of PSO.
Batteries 09 00180 g002
Figure 3. Flowchart of PF.
Batteries 09 00180 g003
Figure 4. The framework of the online SOC estimation based on electrochemical model using PF4.
Batteries 09 00180 g004
Figure 5. Battery experimental testing equipment.
Batteries 09 00180 g005
Figure 6. Elementary test result of 14 electrochemical parameters of ICR18650-26J battery under C-rates at (a) 0.5C and (b) 1C.
Batteries 09 00180 g006
Figure 7. Model simulation results of voltage, current and the voltage error under (a) NEDC conditions, (b) FTP conditions and (c) UDDS conditions.
Batteries 09 00180 g007
Figure 8. SOC estimation results using SPME+PF, SPME and ECM+EKF (a) NEDC conditions, (b) FTP conditions and (c) UDDS conditions.
Batteries 09 00180 g008aBatteries 09 00180 g008b
Figure 9. Errors comparison while the evaluation criteria are (a) MAE and (b) RMSE.
Batteries 09 00180 g009
Table 1. Mathematical equations and boundary conditions of the P2D model.
Governing EquationsBoundary Conditions
Electrolyte Diffusion Equation
ε e c e t ( x , t ) = x [ D e e f f c e c e x ( x , t ) + 1 t + 0 F i e ( x , t ) ] c e n x ( 0 , t ) = c e p x ( L n + L p + L s , t ) = 0 D e n e f f ( c e ( L n ) ) c e n x ( L n , t ) = D e s e f f ( c e ( L n + ) ) c e s x ( L n + , t ) D e s e f f [ c e ( ( L n + L s ) ) ] c e s x ( ( L n + L s ) , t ) = D e p e f f [ c e ( ( L n + L s ) + ) ] c e p x ( ( L n + L s ) + , t ) c e ( L n , t ) = c e ( L n + , t ) c e [ ( L n + L s ) , t ] = c e [ ( L n + L s ) + , t ]
Solid Phase Diffusion Equation
c s t ( x , r , t ) = 1 r 2 r [ D s r 2 c s r ( x , r , t ) ] c s r ( x , 0 , t ) = 0 c s r ( x , R s , t ) = 1 D s j n ( x , t )
Electrolyte Ohm Equation
κ e f f ϕ e x ( x , t ) = i e ( x , t ) + κ e f f 2 R T F ( 1 t + 0 ) × ( 1 + d ln f c / a d ln c e ( x , t ) ) l n c e x ( x , t ) ϕ e ( 0 , t ) = 0 ϕ e ( L n , t ) = ϕ e ( L n + , t ) ϕ e [ ( L n + L s ) , t ] = ϕ e [ ( L n + L s ) + , t ]
Solid Phase Ohm Equation
σ e f f ϕ S x ( x , t ) = i e ( x , t ) I ( t ) σ e f f ϕ s x | x = 0 = I σ e f f ϕ s x | x = L n = 0 σ e f f ϕ s x | x = L n + L s = 0 σ e f f ϕ s x | x = L n + L s + L p = I
Charge Conservation Equation
i s + i e = I i s = n F j n i e x = a F j n i e ( 0 , t ) = i e ( L n + L s + L p , t ) = 0
BV Kinetic Equation
j n ( x , t ) = 1 F i 0 ( x , t ) [ e α a F R T η ( x , t ) e α c F R T η ( x , t ) ] i 0 ( x , t ) = k [ c s s ( x , t ) ] α c × [ c e ( x , t ) ( c s , max c s s ( x , t ) ) ] α a η ( x , t ) = ϕ s ( x , t ) ϕ e ( x , t ) U O C V ( c s s ( x , t ) ) F R f j n ( x , t )
Table 2. Parameters classification of SPME.
Geometric ParametersUnit
S m 2
L m
R s m
ε s 1
ε e 1
Performance ParametersUnit
c s , max m o l / m 3
c s 0 m o l / m 3
c e 0 m o l / m 3
D s m 2 / s
D e m 2 / s
k m 2.5 / ( m o l 0.5 s )
R f Ω m 2
κ S / m
t + 0 1
Fixed ParametersUnit
F C / m o l
R J / ( m o l K )
α 1
Table 3. ICR18650-26J battery specifications.
CategorySpecification
Nominal capacity2.6 Ah
Nominal voltage3.6 V
Max. charging current2.6 A
Cut-off voltage4.2 V
Charging temperature0–45 °C
Discharging temperature−10–55 °C
Weight45 g
Table 4. Initial electrochemical model parameters of ICR18650-26J battery.
ParametersUnitNegativeSeparatorPositive
S m 2 0.0772 0.0747
L m 88 × 10 6 25 × 10 6 55.8 × 10 6
R s m 5 × 10 6 5 × 10 6
ε s 10.5 0.5
ε e 10.50.450.5
c s , max m o l / m 3 31,389 56,250
c s 0 m o l / m 3 29,505.68 14,126.37
c e 0 m o l / m 3 1200
D s m 2 / s 2.446 × 10 14 4.580 × 10 14
D e m 2 / s 7.5 × 10 10
k m 2.5 / ( m o l 0.5 s ) 7.703 × 10 11 6.962 × 10 11
R f Ω m 2 0.04211 0.03096
κ S / m 0.93
t + 0 10.363
F C / m o l 96,487
R J / ( m o l K ) 8.314
T K 298.15
Table 5. Parameter identification results.
ParametersUnitNegativePositive
R s m 5.094 × 10 6 5.17 × 10 6
c s , n 0 % ,   c s , p 100 % m o l / m 3 1.85 × 10 3 1.69 × 10 4
ε s 10.50520.55
ε e 10.43820.3
Disclaimer/Publisher’s Note: The statements, opinions and data contained in all publications are solely those of the individual author(s) and contributor(s) and not of MDPI and/or the editor(s). MDPI and/or the editor(s) disclaim responsibility for any injury to people or property resulting from any ideas, methods, instructions or products referred to in the content.

