
Accurate Prediction Approach of SOH for Lithium-Ion Batteries Based on LSTM Method


1
National Center for Materials Service Safety, University of Science and Technology Beijing, Beijing 100083, China
2
Innovation Group of Marine Engineering Materials and Corrosion Control, Southern Marine Science and Engineering Guangdong Laboratory (Zhuhai), Zhuhai 519080, China
3
Research Institute of Macro-Safety Science, University of Science and Technology Beijing, Beijing 100083, China
*
Author to whom correspondence should be addressed.
Batteries 2023, 9(3), 177; https://doi.org/10.3390/batteries9030177
Submission received: 11 January 2023
/
Revised: 4 March 2023
/
Accepted: 6 March 2023
/
Published: 18 March 2023
(This article belongs to the Special Issue Battery Safety: Recent Advances and Perspective)
Abstract
:The deterioration of the health state of lithium-ion batteries will lead to the degradation of the battery performance, the reduction of the maximum available capacity, the continuous shortening of the service life, the reduction of the driving range of electric vehicles, and even the occurrence of safety accidents in electric vehicles driving. To solve the problem that the traditional battery management system is difficult to accurately manage and predict its health condition, this paper proposes the mechanism and influencing factors of battery degradation. The battery capacity is selected as the characterization of the state of health (SOH), and the long short-term memory (LSTM) model of battery capacity is constructed. The intrinsic pattern of capacity degradation is detected and extracted from the perspective of time series. Experimental results from NASA and CALCE battery life datasets show that the prediction approach based on the LSTM model can accurately predict the available capacity and the remaining useful life (RUL) of the lithium-ion battery.
1. Introduction
Recently, due to their wide temperature range, high energy density, low self-discharge rate, and long cycle lifetime, lithium-ion batteries have been widely used in a variety of industrial sectors such as transportation, electronics, portable mobile devices, and aerospace [1,2,3,4]. Prognostics and health management (PHM) of batteries refers to the activity of applying PHM methods to the battery domain, including battery health and health maintenance. Accurately estimating the state of charge (SOC), state of health (SOH), and remaining useful life (RUL) of batteries is critical to maintaining the remaining charge, capacity, and life of the battery. Reliable and precise SOH prediction and management can improve the operational safety of electric vehicles and replace batteries in time to prevent further damage. At the same time, it allows users to plan battery maintenance strategies and manage repairs or replacements.
In general, SOH indicates the physical degradation status, and RUL estimation is used to forecast the future life of batteries [5,6,7,8,9,10]. Signals of current, voltage, impedance and capacity are commonly used in the battery system. Although data of voltage and current are readily available during operation, in most cases, they do not accurately indicate the SOH of the battery. Capacity degradation during charging-discharging has been widely used for prediction [11,12]. However, many factors affect the SOH of batteries, making it difficult to predict the SOH. Currently, there are two approaches (i.e., model-based approaches and data-driven approaches) for prediction [13].
Most model-dependent approaches use a priori information of the system degradation to build mathematical functions to describe the SOH. Xu et al. [14] developed a state-space-dependent model for predicting degradation of batteries, using the extended Kalman filter to evaluate the parameters and state. Yang et al. [15] proposed an approach, named the first-order compatibility method, to determine the values of these arguments and their periodic evolution. Wei et al. [16] used the particle filter and the support vector regression method for batteries. The use of particle filters can effectively reduce the measurement noise of currents and voltages. Model-based approaches are reliable when the degradation of complex systems is accurately modeled.
Condition monitoring data are used for predicting by data-driven approaches [17,18,19]. In addition to predictive abilities, features with physical meanings are extracted from discharge voltage curves, allowing online prediction for a single cell using only its historical data [20]. In principle, by reason of the powerful transferability of data processing technology, data-driven methods can be easily extended to different scenarios. However, the drawback of this approach is that building models usually requires sufficient historical data. Many data-driven algorithms, such as support vector machine (SVM), neural network (NN) [21], and relevance vector machine (RVM), have been proposed with good prediction results.
On the basis of traditional data regression, Yu [11] proposed a SOH prediction method using multiscale logistic regression and Gaussian process regression, which effectively captures the time-varying system degradation patterns and suppresses the effects of local regeneration phenomena. Wu et al. [22] estimated the battery SOH using grouped data processing based on the input of voltage characteristics. Ma et al. [23] proposed a novel SOH estimation approach based on improved long short-term memory (LSTM) and health indicators (HIs) extraction. Chang et al. [24] proposed a hybrid method for prediction of RUL. Some techniques are combined, including trace-free Kalman filtering, correlation vector machines, and integrated empirical pattern decomposition. Although confidence limits for SOH and RUL predictions cannot be obtained intuitively [25,26,27], neural network-based methods are promising for prediction problems.
Wu et al. [28] investigated the relationship between the RUL and charge profile using feedforward neural networks with importance sampling for network input selection. Sbarufatti et al. [29] combined a particle filter with a radial basis function neural network for battery prediction. Chemali et al. [30] proposed a recursive neural network (RNN) with LSTM as a variant of the traditional neural network to predict the SOC. Data-driven methods can effectively capture the data collected and the potential relationship between the actual state of battery and can summarize learned knowledge in different scenarios.
In addition, deep learning (i.e., deep neural networks) has been rapidly and successfully developed for an efficient pattern recognition tool recently. Deep neural network architectures with multiple stacked hidden layers significantly improve the learning capability of data-driven models [31,32], resulting in more efficient feature extraction [33]. In this paper, a novel data-driven approach for management and prediction of lithium-ion batteries is proposed to provide a specific description of the hazards of lithium-ion battery-related degradation mechanisms, along with related measures to mitigate or avoid battery health degradation. Based on recurrent neural network and LSTM architecture, a deep learning-based prediction method for lithium-ion batteries was developed. Two popular Li-ion battery datasets from NASA and CALCE validate the effectiveness and superiority of the proposed approach, providing a promising tool for the accurate determination of SOH.
2. Lithium-Ion Batteries Health Management
2.1. Factors Influencing SOH
The aging of batteries is a major cause of changes in battery health and life. Over time, the internal materials and electrochemistry of the battery gradually degrade, resulting in the degradation of the capacity and power for batteries. The main degradation mechanisms of batteries can be divided into three types: loss of lithium storage, loss of active material in the electrode, and increase of battery internal resistance.
Lithium storage losses are mainly associated with battery-side reactions such as solid electrolyte interface (SEI) film formation and electrolyte decomposition, which continuously deplete lithium ions from participating in subsequent charge and discharge processes. The main factor is the degradation of the electrode structure due to changes in the volume of the active material during cycling, which can cause mechanical stress to reduce the density of the lithium storage area and block lithium-ion transport; other factors include: dissolution reactions of transition metals in the electrolyte and SEI modification.
Factors affecting the SOH are the number of cycles, temperature, charge/discharge multiplier, depth of discharge (DOD), and charge cut-off voltage. The main influencing factors, associated degradation mechanisms, and degradation patterns of battery aging are shown in Table 1. In addition, the degradation mechanisms and hazards of lithium-ion batteries are specifically described, and related preventive measures are introduced to provide a reference for battery health management.
- (1)
- Lithium metal deposition.
Causes: In lithium-ion batteries, there is theoretically no lithium metal, only lithium in the form of lithium oxide, lithium carbon, or lithium ions. Due to high current charging, overcharging, insufficient cathode material, etc., the cathode cannot hold excess lithium ions and cannot diffuse to other areas in a short period of time, so lithium ions are deposited to form metallic lithium as they diffuse to the cathode surface, which can seriously lead to lithium channel blockage and loss of recyclable lithium.
Hazard: Not only does it shorten the cycle life, but in severe cases, it can also cause short circuits, leading to serious safety hazards.
Avoidance: Ensure that the ratio of positive and negative materials is accurate and reasonable, regulate the conditions of use of lithium-ion batteries, and avoid overcharging and high-current charging.
- (2)
- Decomposition of positive and negative electrode materials.
Causes: Although the lithium metal oxide has good stability, it also decomposes slowly during the long-term operation of batteries, especially under high temperature and overcharge, producing flammable gases and some inert substances, such as Mn2O3, which disturb the balance between the electrodes and cause loss of battery capacity.
Hazards: This condition usually occurs under relatively high temperature conditions, which not only reduces the battery capacity, but the release of gas during severe decomposition can cause the battery to bulge, leading to the risk of a runaway battery.
Avoidance: Strictly avoid overcharging and improve the stability of the positive electrode material.
- (3)
- Growth of SEI film.
Causes: When the lithium-ion battery is cycled for the first time, a solid interfacial film is formed on the surface of the negative electrode and the electrolyte, which is not easily decomposed in organic solvents and is valuable for protecting the structure of the negative electrode. The SEI film is not stable and will decompose during cycling, exposing a new graphite surface, which will then react with the electrolyte again, making the SEI film thicker and depleting the active material.
Hazards: The growth of the SEI film increases the internal resistance and reduces the energy density of the battery; it blocks some of the diffusion channels of the lithium ions, resulting in a reduction in the actual capacity of the battery.
Avoidance: Since excessive operating temperatures can cause the SEI film to degrade, the lithium-ion battery should be controlled within the appropriate operating temperature range.
- (4)
- Decomposition of electrolyte.
Cause: The electrolyte will be decomposed and volatilized in small amounts when the lithium-ion battery is working, so the total amount of electrolyte will become less after long-term use, and it will not be able to completely wet the positive and negative electrode materials. Part of the positive and negative electrode materials will lack electrolyte wetting, the channel of lithium will be missing, and the electrochemical reaction will be insufficient. The electrolyte contains a small amount of water and a small amount of LiFP6, both of which will react to produce LiF and HF. HF will destroy the SEI film and continuously consume the recyclable lithium ions. At the same time, the electrolyte contains hydrogen and metal ion impurities that are relatively active and can easily react to consume decomposition.
Hazards: It can lead to battery capacity degradation affecting life cycle and self-discharge affecting calendar life.
Avoidance: Improve electrolyte stability.
- (5)
- Diaphragm blockage or disruption.
Causes: With the increase in the number of lithium-ion batteries, the electrolyte of lithium-ion batteries is not enough for the wettability of the diaphragm, while the diaphragm itself also lacks sufficient stability and mechanical properties, and the diaphragm gradually failed to trigger the early performance of the battery decline.
Hazard: A diaphragm without sufficient wettability will block the lithium-ion channels, increasing the Ohmic internal resistance and resulting in an irreversible reduction in battery capacity.
Avoidance: Improve the electrochemical stability and mechanical properties of the diaphragm.
- (6)
- Dislodged positive and negative electrode materials.
Cause: The electrode material of batteries is fixed by the binder, and the effect of the binder gradually disappears after using for a long time, so the active material that is bonded to the substrate will fall off and enter the electrolyte, at which time the electrode material is no longer able to form an electrical path with the collector fluid or, due to mechanical vibration and thermal expansion of the electrode material, etc., will lead to electrode separation.
Hazard: It leads to the continuous reduction of the electrode active material, which increases the internal resistance and degrades the performance of batteries.
Avoidance: Improving the quality of the binder and the stability of the electrode material and the battery pack will slow down the degradation of the positive and negative battery materials.
2.2. Capacity Decay Simulation
Simulation of lithium-ion battery capacity decay not only allows the characteristics and mechanism of battery capacity decay to be studied in a simple and efficient way, but can also save time and the economic cost of battery aging experiments. The battery capacity decay data obtained from the simulation also provides basic data for predicting the battery health state based on LSTM. Lithium-ion battery aging modeling is based on a one-dimensional isothermal model with additional electrochemical side reactions defined by the porous electrode reaction of the negative electrode. Capacity degradation is simulated based on the loss of recyclable lithium. The parasitic side reactions occurring at the negative electrode during charging are mainly considered in the model, which also includes the potential loss effect caused by the thickening of the SEI film and the effect of electrolyte reduction on charge transfer. The process of SEI film formation at the solid electrolyte interface is represented by Equation (1),
where is the solvent (vinyl carbonate), and is the reaction product. The production of results in the loss of recyclable lithium in the cell and increases the resistance of the SEI film.
The general battery needs to undergo many cycles to show significant capacity decay, with a very small reduction in capacity between each cycle, and assuming that all the lithium in the SEI film is considered to come from the negative terminal after a full charge/discharge cycle, the model uses a time acceleration factor denoting the number of cycles to simulate one cycle to represent the actual number of cycles; the acceleration response to capacity loss is obtained as Equation (2),
Add Equation (2) to Equation (1),
Set the time acceleration factor as representing the actual 50 cycles, and the capacity of the simulation model is the theoretical capacity obtained by calculating the recyclable lithium, which indicates the capacity of the recyclable lithium in the unit area. The maximum embeddable lithium capacity of the cathode material is the theoretical capacity. During the processing of the battery, part of the capacity will reduce. Part of the non-recyclable capacity is reflected within the cathode. For the battery cathode, after the first charge and discharge, electrode material exists within part of the lithium ion concentration and is the minimum working concentration that the cathode can accommodate. The lithium ion concentrations should be subtracted for the real battery capacity.
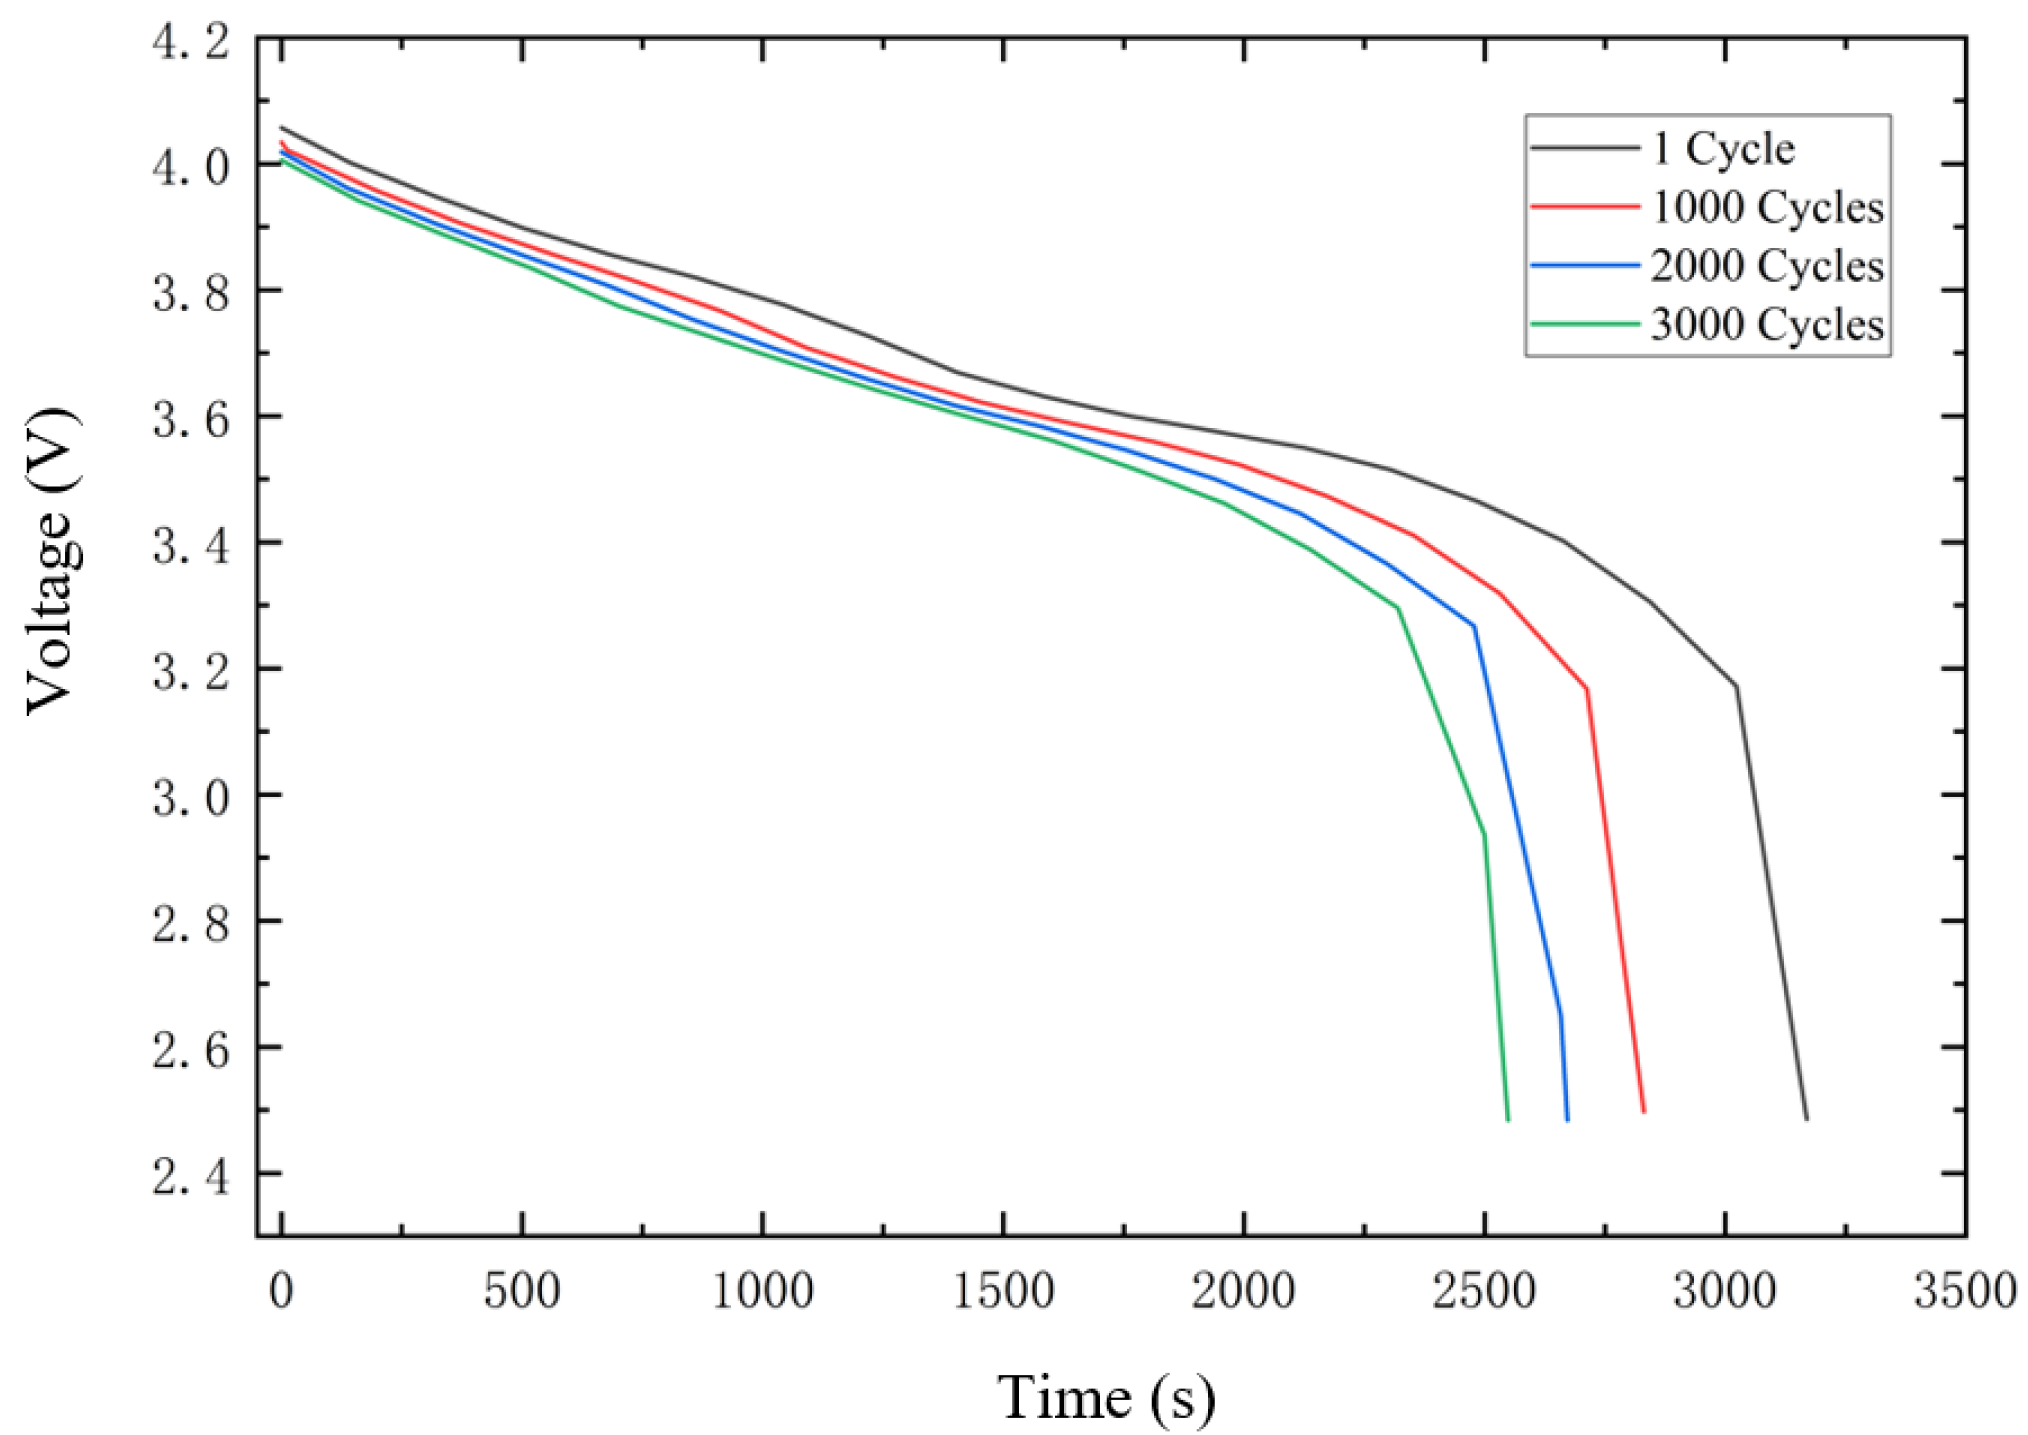
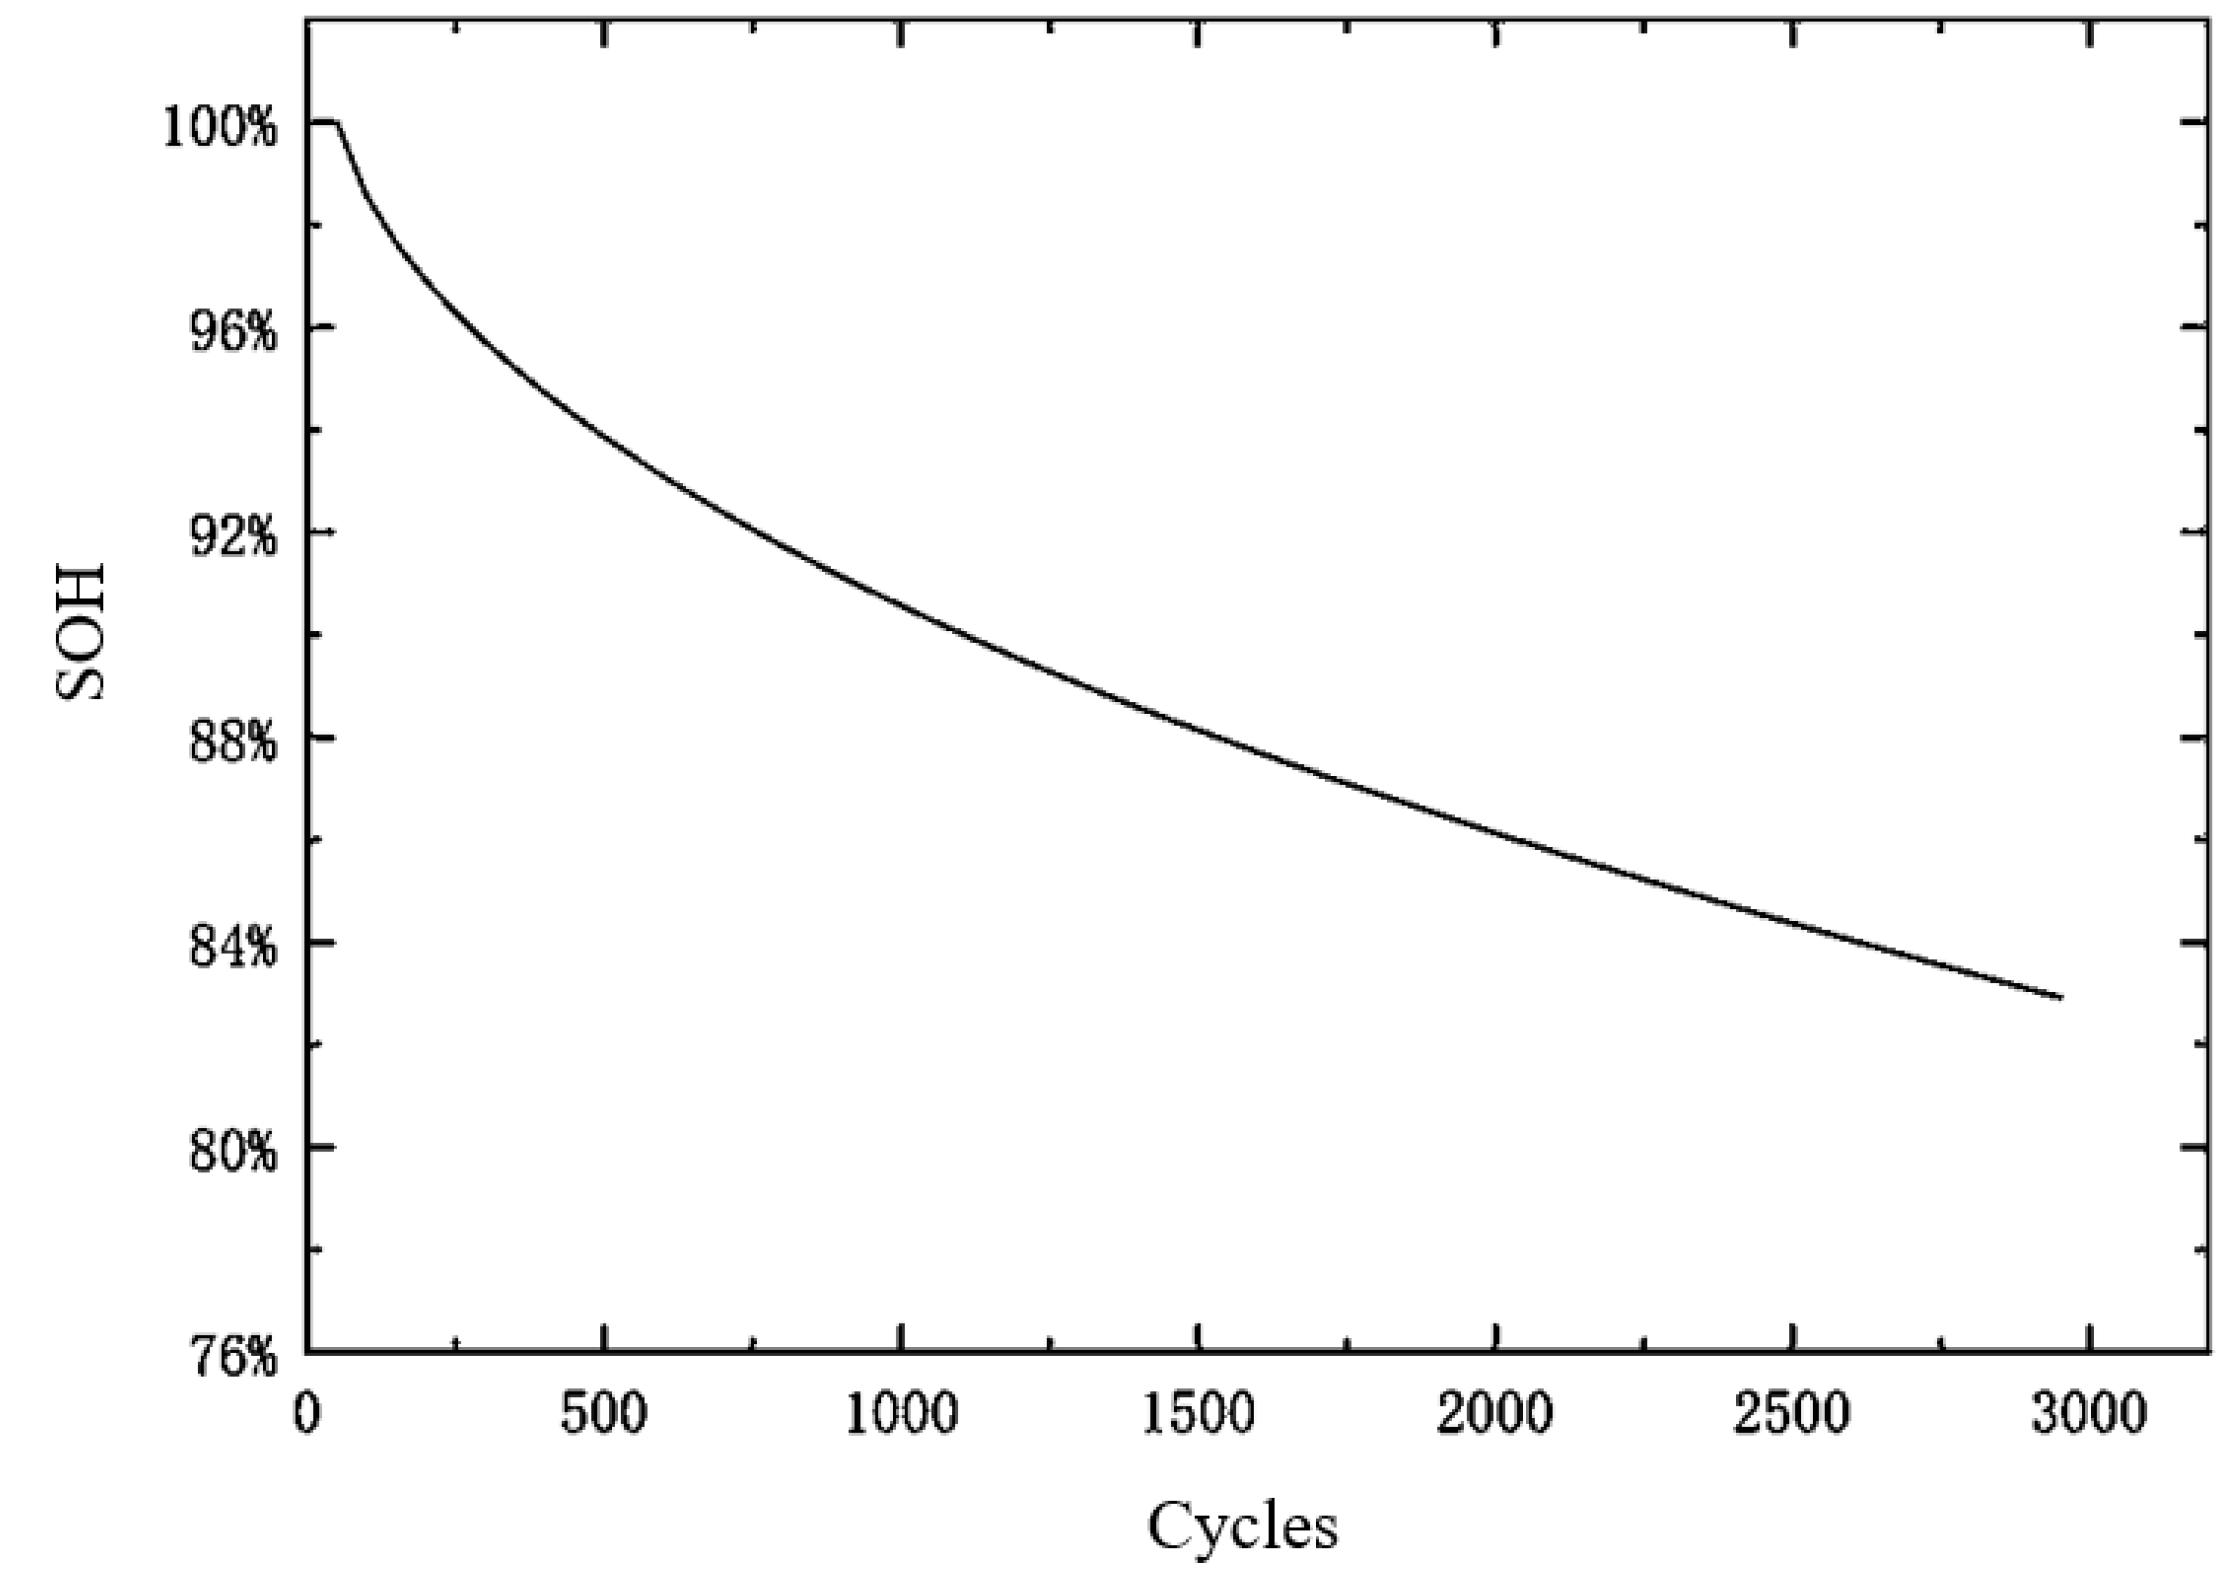
The simulation cycle conditions for capacity decay are set as follows: constant current and constant voltage charging, then constant current discharging, the charge and discharge cut-off voltage is 4.1 V~2.5 V, the cut-off current is 0.1 A, and the cycle multiplier is 1C. The simulation calculates the discharge voltage of the battery under different cycle times, as shown in Figure 1, and the changes of battery SOC with the cycle times are as shown in Figure 2.
Under the same working condition and the same discharge time, the more cycles, the lower the discharge voltage and the shorter the duration of discharge, which is why the range of electric vehicles becomes shorter and shorter. The theoretical capacity based on recyclable lithium decreases continuously as the number of cycles increases. From the changing trend of the battery health state curve, it can be seen that the theoretical capacity of the battery decreases relatively fast in the initial 0~500 cycles, the decrease of the theoretical capacity slows down and remains stable in the subsequent cycle stage, the theoretical capacity of the battery decays by about 20% after 3000 cycles of the battery, and the main factor of the capacity decay in this stage is the loss of lithium.
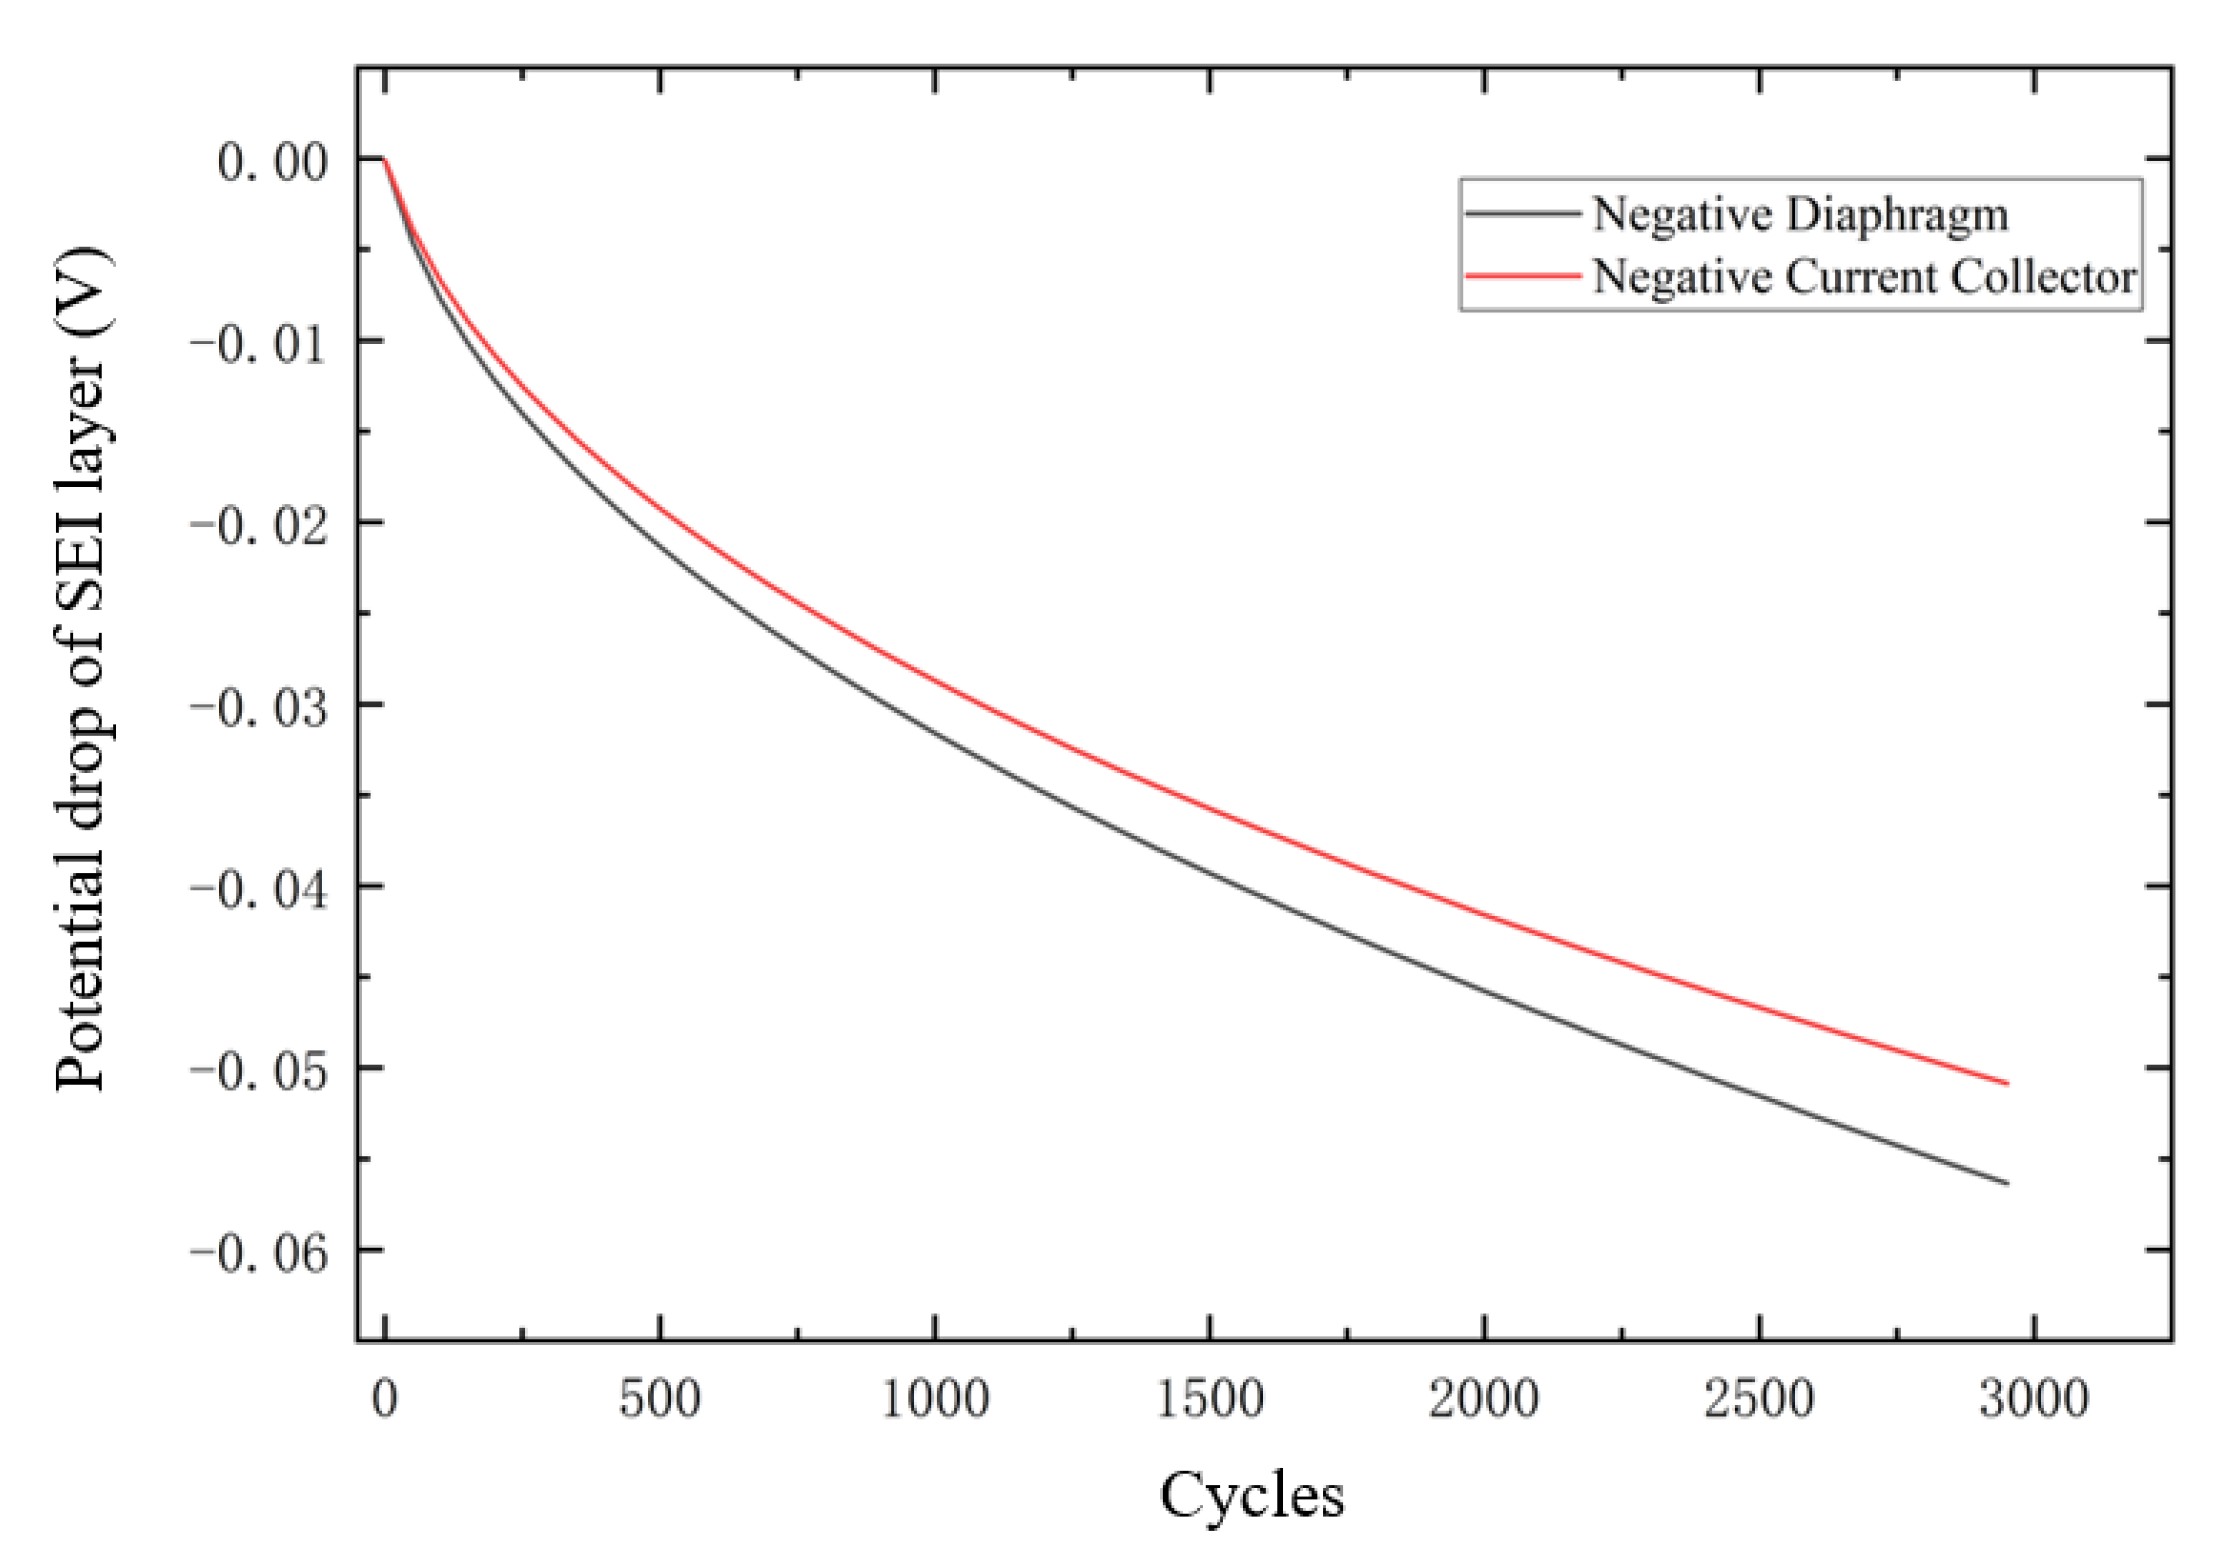
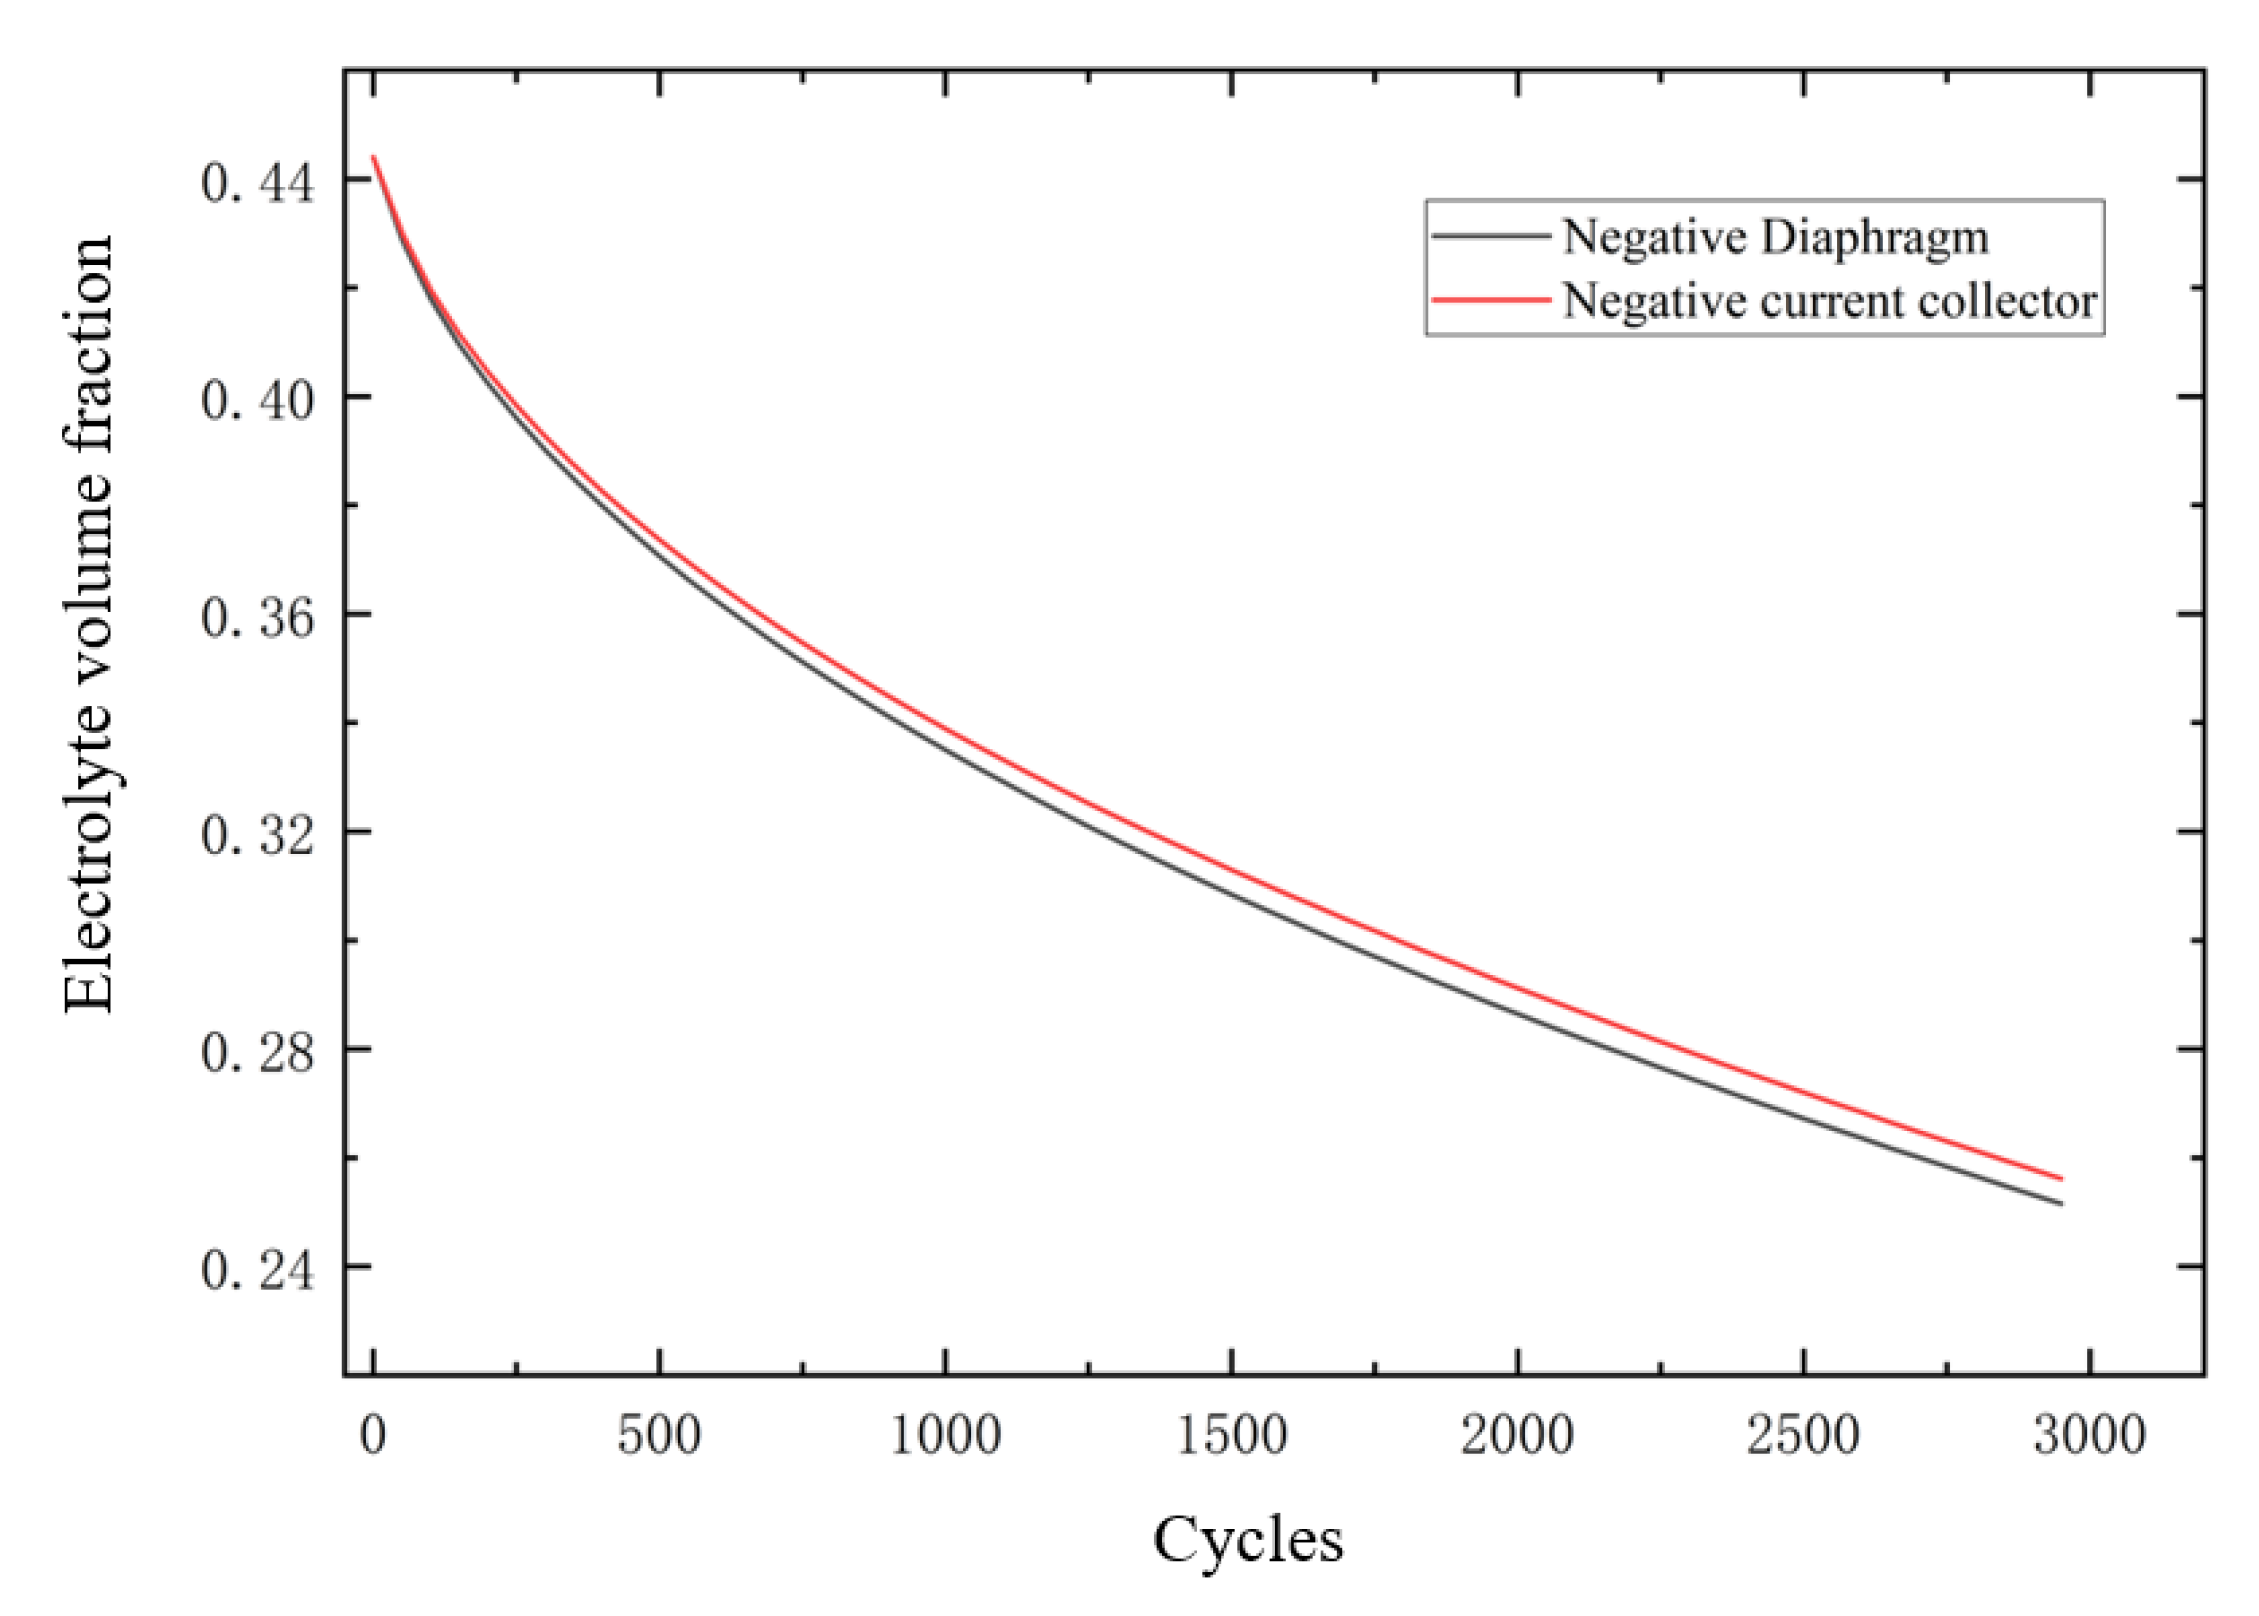
Figure 3 shows the variation of potential drop along the SEI layer at the negative diaphragm and collector. As the number of cycles increases, the amount of SEI layer formed also increases, and therefore, the potential drop also increases, so the internal resistance of the cell increases with the number of cycles. Because the SEI layer is thicker at the negative diaphragm, the potential drop at the negative diaphragm is greater than the negative collector. The volume fraction of electrolytes at different locations of the negative electrode and the variation with the increasing number of cycles are shown in Figure 4. The volume fraction of electrolyte decreases continuously with the increasing number of cycles, and after 3000 cycles, the volume fraction of electrolyte is less than 60% of the initial value. The volume fraction of electrolyte at the negative diaphragm is lower due to the faster rate of SEI film formation at this location, which consumes more electrolyte.
3. Data Description
3.1. Lifetime Experimental Data
3.1.1. NASA Lithium Battery Life Experiment Data
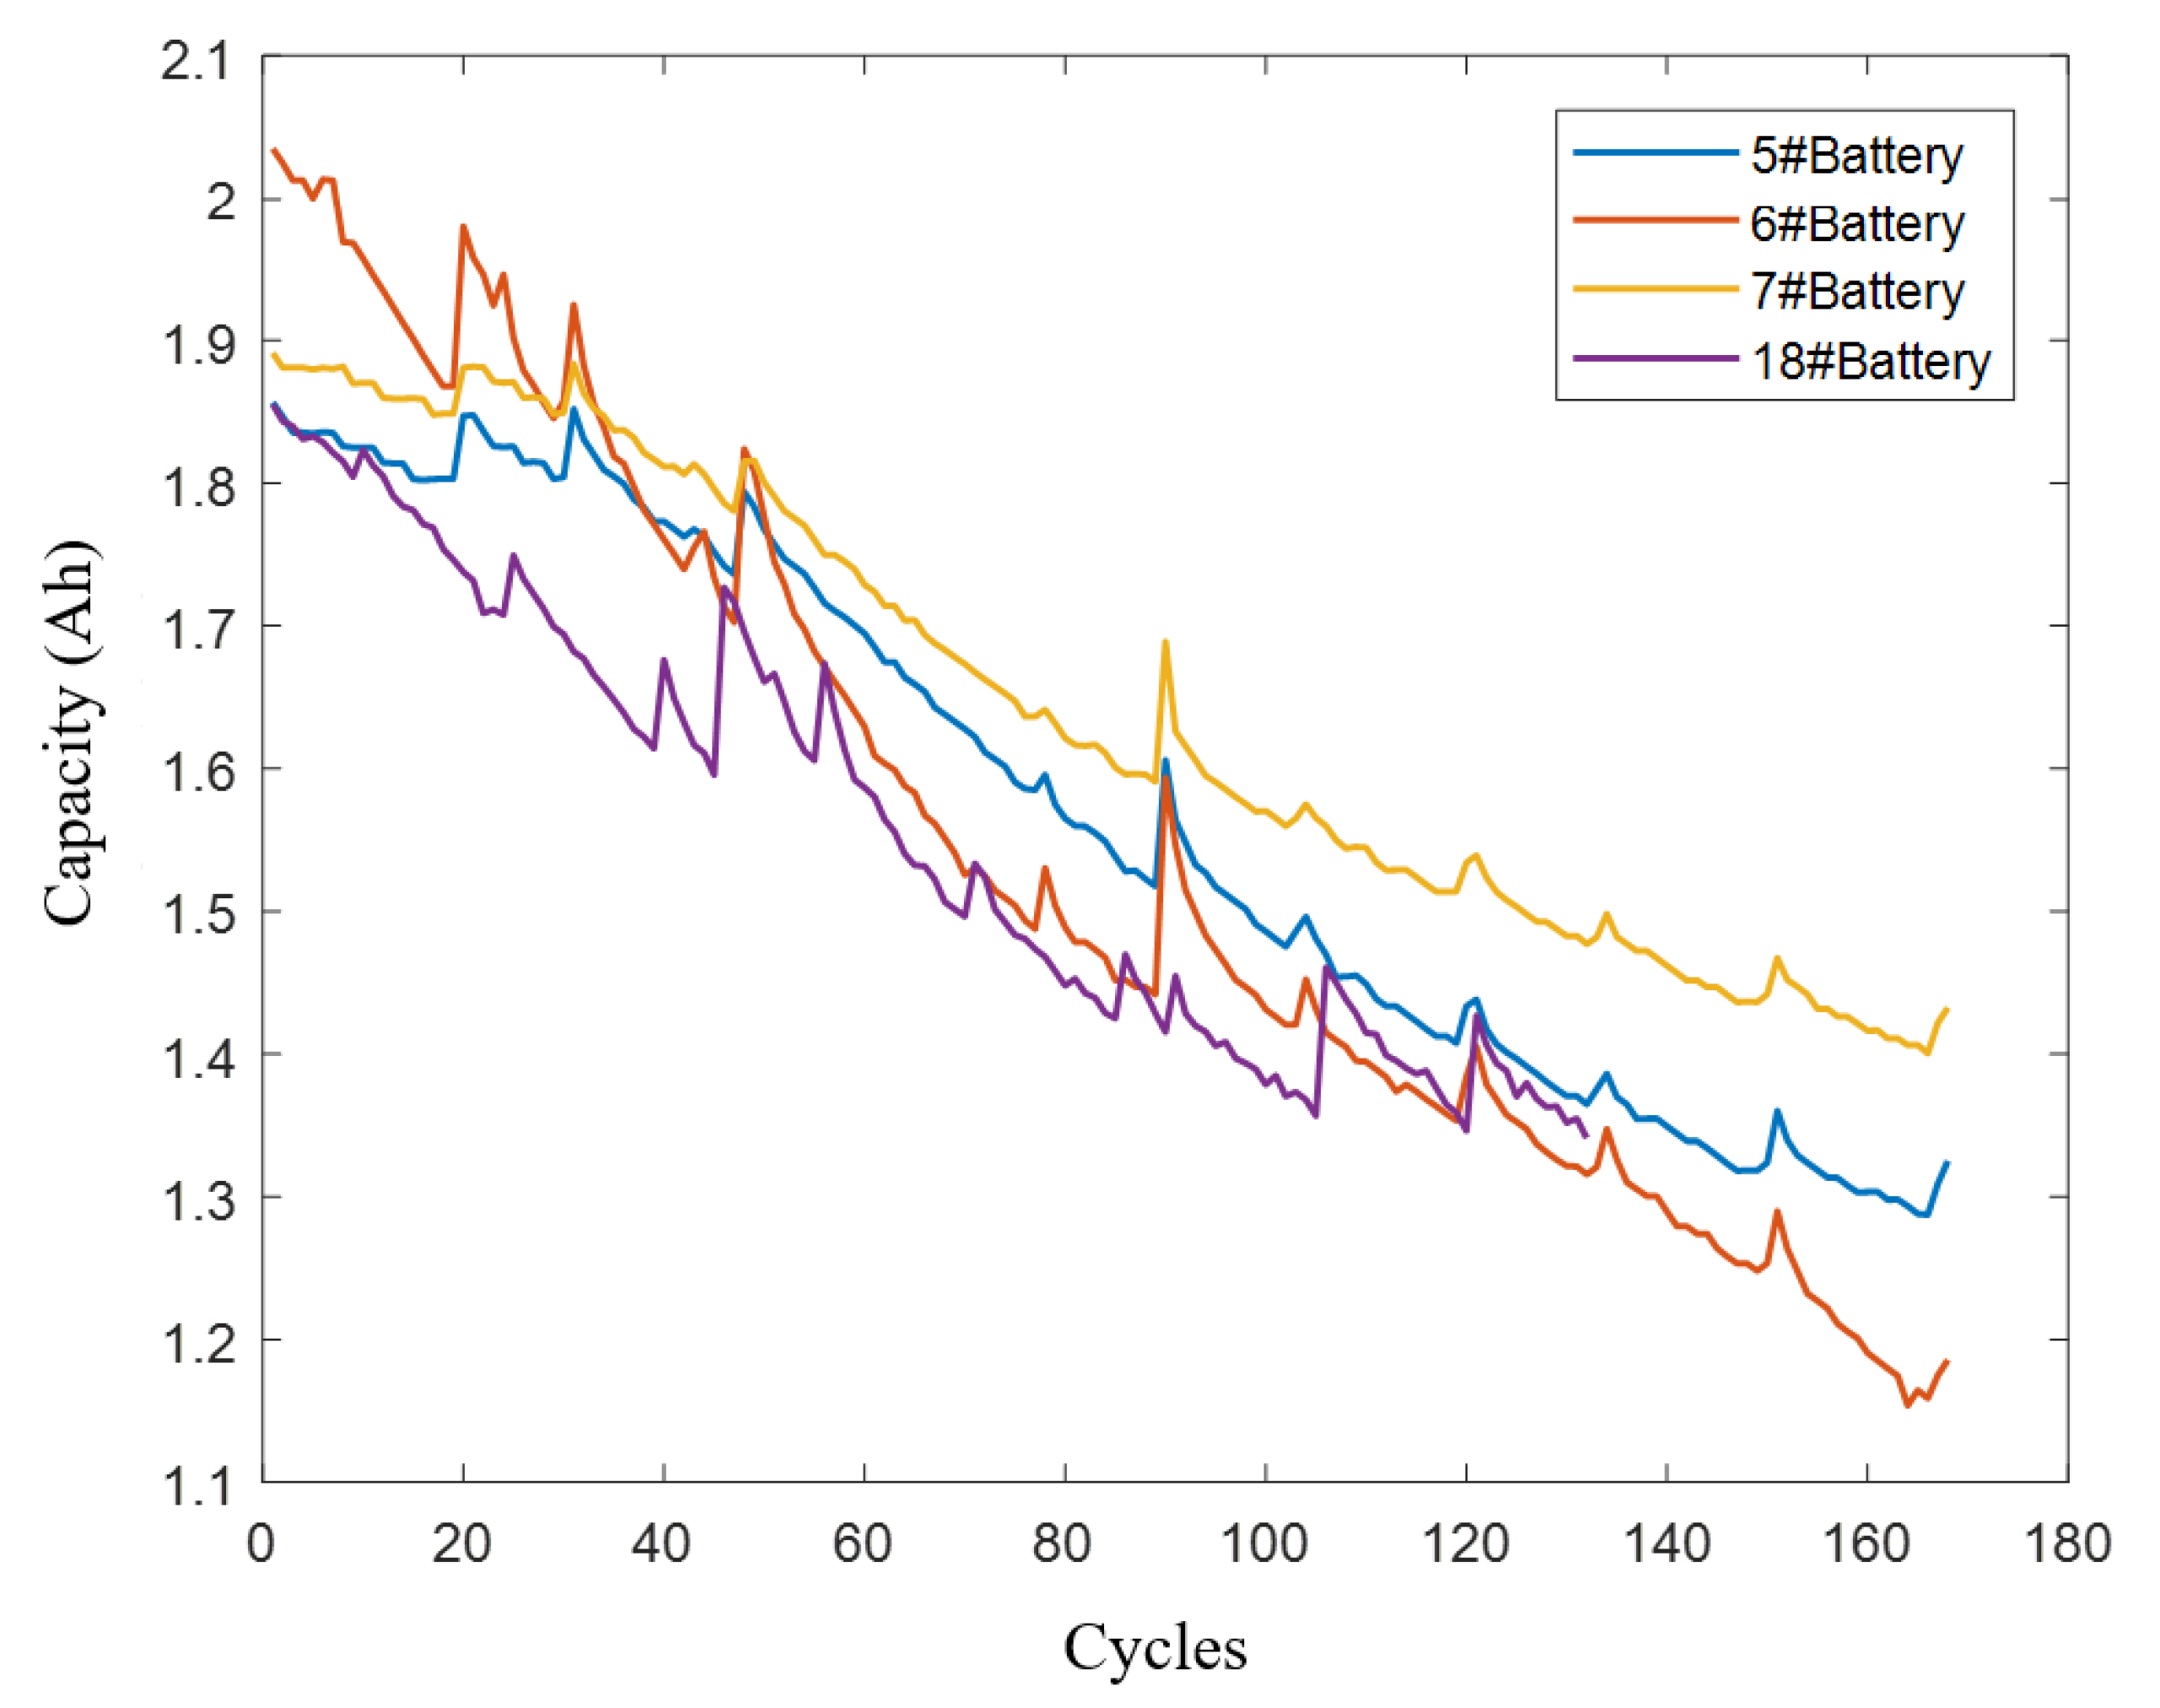
NASA life experiments were conducted on 18,650 lithium-ion batteries in nine sets of life cycle experiments at three temperature operating conditions, 4 °C, 24 °C, and 44 °C. We used cells of 5#, 6#, 7#, and 18# at 24 °C. The data were rated at 2 Ah capacity and were tested in a standard cycling manner. The cells were charged with 0.75C firstly, standing still for 3 h, and then each cell was discharged separately to its respective cutoff voltage using the constant current of 1C, and their respective impedances were measured via electrochemical impedance spectroscopy. Experiments consider 70% of the rated capacity (i.e., 1.4 Ah) as the end-of-life.
The NASA dataset contains information about the battery voltage, battery current, battery capacity, and battery internal resistance. Figure 5 is the capacity degradation of NASA batteries. Some of the sudden increase in capacity in Figure 5 produces a spike, which is due to the self-charging of the battery at rest resulting in a rebound in available capacity.
3.1.2. CALCE Lithium-Ion Battery Life Test Data
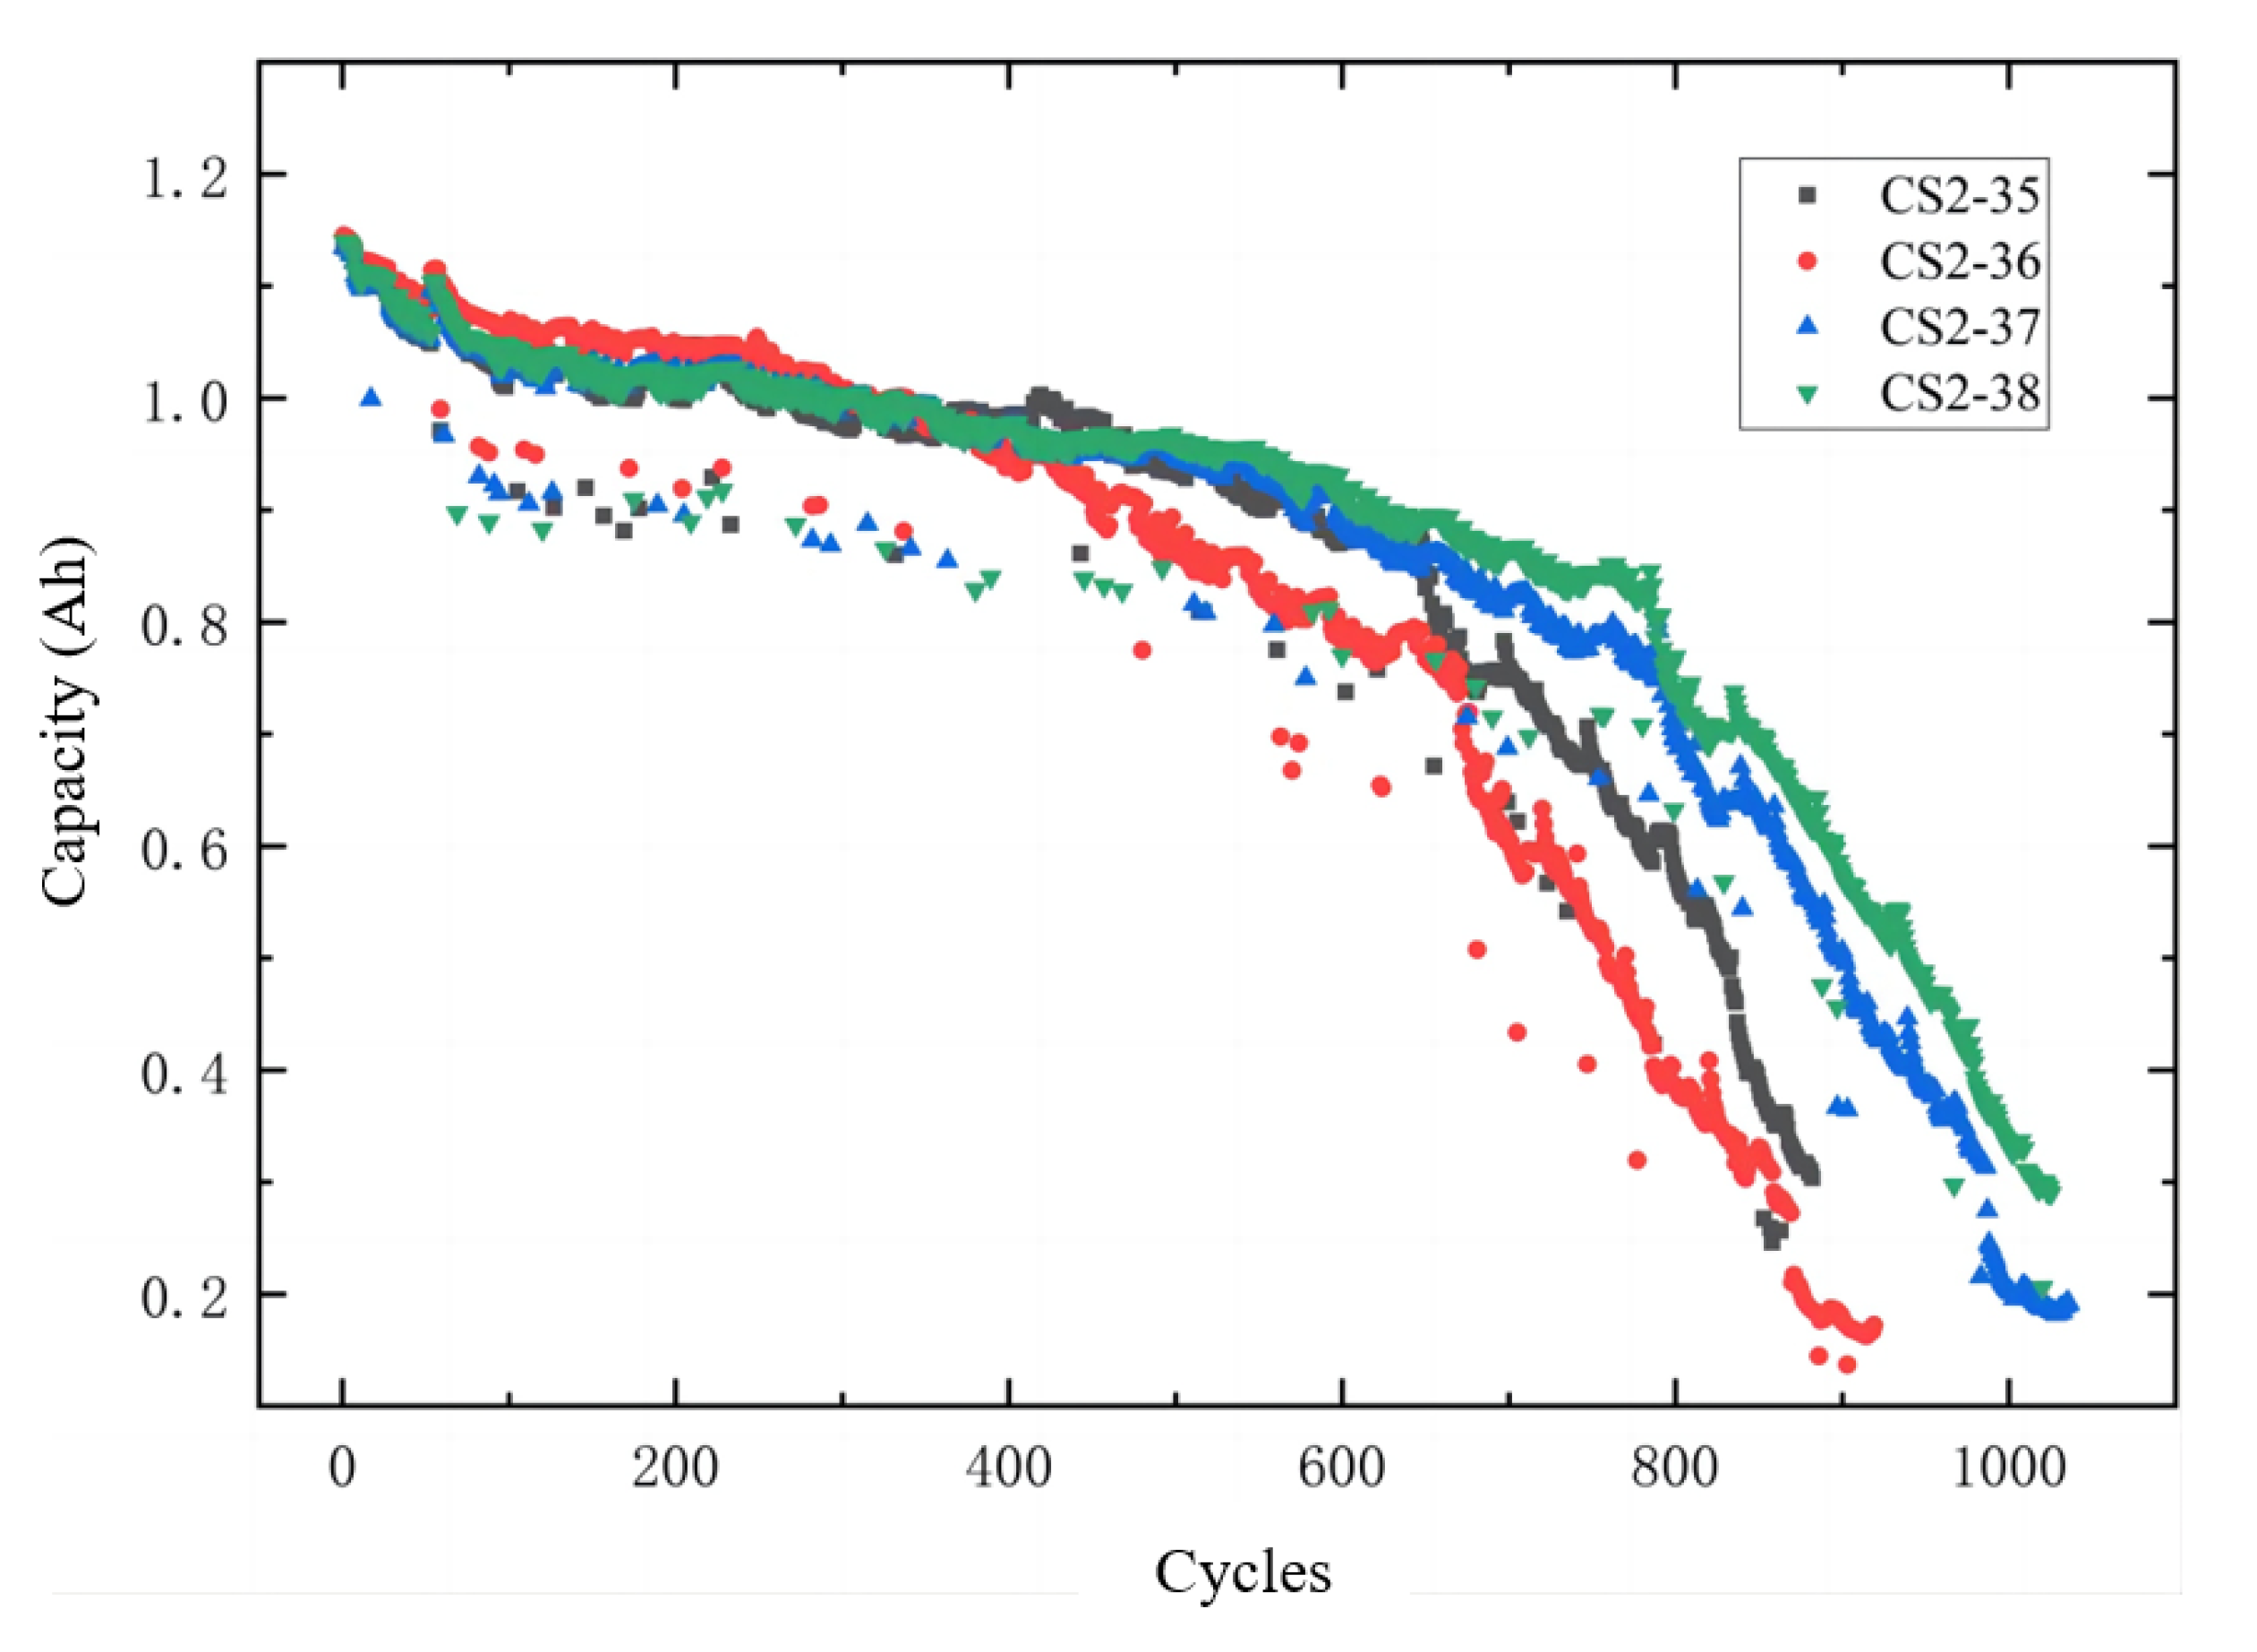
The CALCE battery research group uses advanced equipment for cell-to-cell cycle testing, cell building, and teardowning, abuse testing (overheating, overcharging, short circuiting), and material characterization to reliably and safely develop and operate battery components and systems in real-world applications. This paper uses data from the four series LiCoO2 batteries at 1.1 Ah. The batteries are tested at room temperature using an Arbin battery tester, using the standard constant current/constant voltage, a constant current of 0.5C, and then 4.2 V is maintained until the charging current drops to 0.05 A, under the cut off voltage (2.7 V) for 1C constant exile electric. The battery life ended within 80% of the rated capacity (0.88 Ah), after several cycles. This battery dataset contains more data outliers, which can be considered as noise in the dataset, and no noise reduction is subsequently applied to the dataset in this paper, to make the battery capacity data more consistent with the actual extracted battery capacity data, and a prediction algorithm with better generalization is needed. The capacity degradation is plotted in Figure 6. Each group of batteries had a similar degradation trend after 500 cycles. Further research could explore how to train the algorithm over the entire life of some cells to better apply the knowledge of steeper degradation at the end of life on the other cells.
3.2. Data Pre-Processing
We used data pre-processing before constructing the lithium-ion battery SOH prediction model. The time series model of power battery capacity is constructed as shown in Equation (4).
where is the battery capacity time series, and is the time series model, which means that the historical capacity data is used to apply a time series model to predict the capacity after the (p + 1) th cycle. Different numerical variables have different ranges of variation, and they need to be normalized. This can ensure that the time series model converges quickly in the loss function during learning. The battery capacity data are normalized to the maximum and minimum values as shown in Equation (5).
After data deflation, the battery capacity data are plotted between the range of [0,1] and backnormalized to the actual capacity value after prediction by the model. Taking NASA’s battery #7 as an example, the capacity data is of length 168, where six time steps are constructed as a set of sequences as input and one time step as the predicted output for learning, and the training sets X_train and Y_train are constructed.
The data after pre-processing is fed into the model for learning and training, and the finished model can predict the capacity by adjusting the size of the training set to set different prediction starting points.
4. Battery Health Status Prediction
4.1. Principle of RNN
There are various approaches to the problem of predicting the time series, among which neural network-based approaches have special nonlinear and adaptive fitting capabilities that offer unique advantages over other modeling approaches. Artificial neural networks mimic biological neural networks, using neurons and the mapping relationships between them to achieve an approximate estimation of functions. A typical neural network consists of three layered structures, and the learning process is completed by updating the weights of each layer through error correction of the training samples to create a model, and this learning process is usually done using a backpropagation algorithm.
To evaluate whether a neural network structure is good or bad is to see if it can better fit the training data. This evaluation criterion is known as the loss function, and the feedback optimizer is applied to optimize updated weights in the direction of minimum loss. Some of the common optimization methods are stochastic gradient descent (SGD), momentum, adaptive gradient (AdaGrad), adaptive moment estimation (Adam), etc.
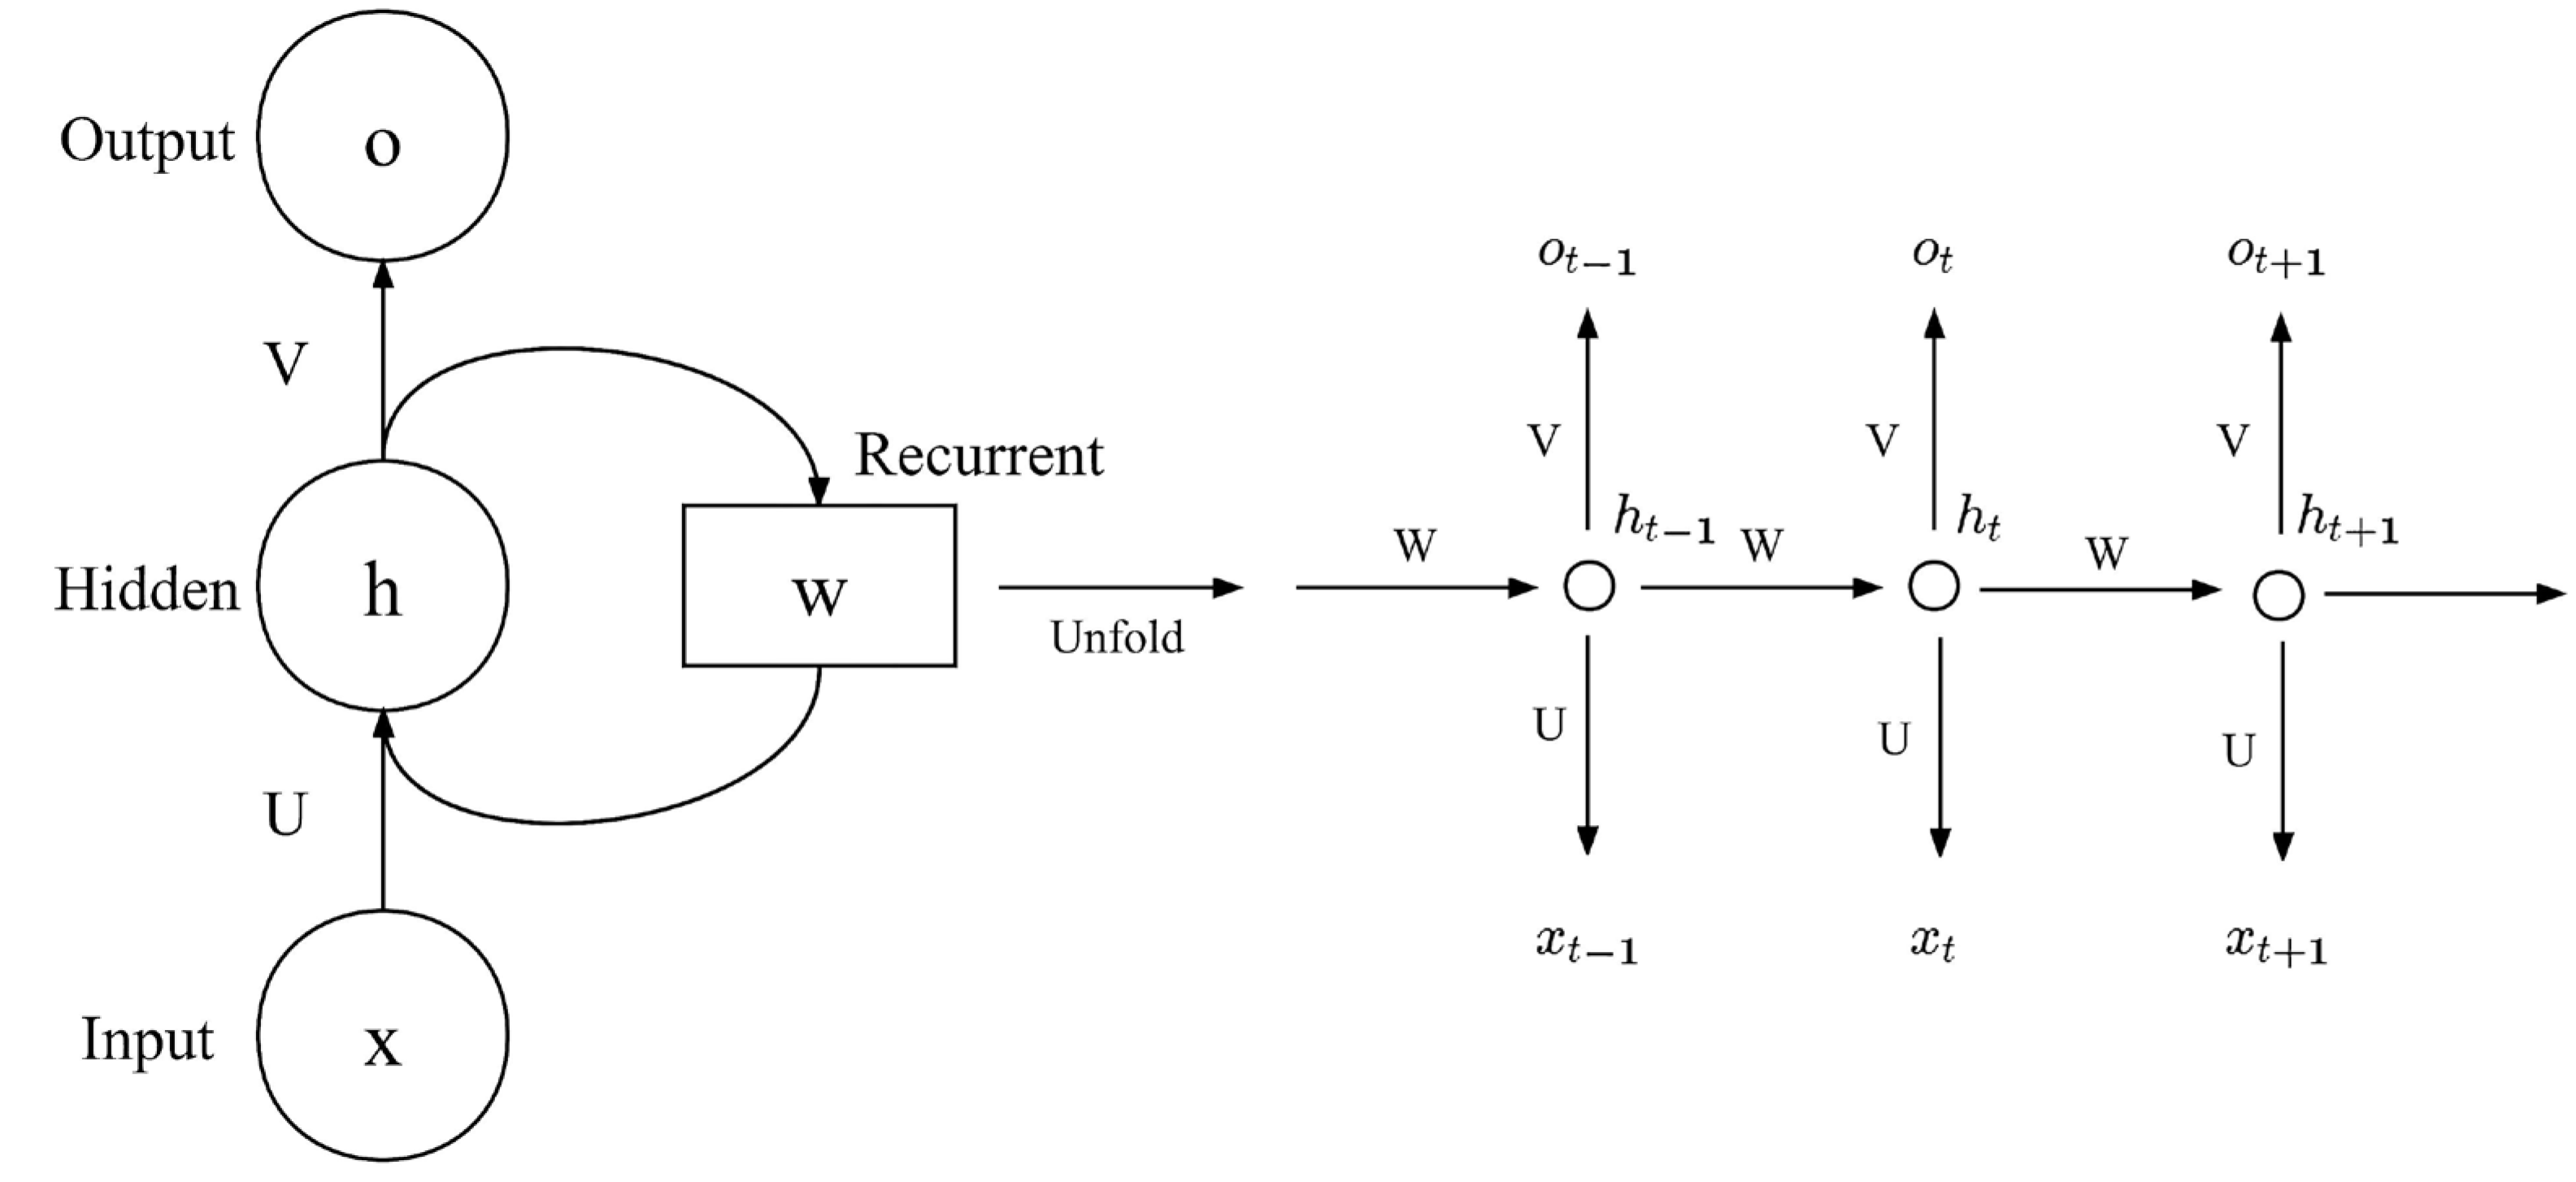
The RNN is similar to a typical neural network, but the hidden layer nodes of RNN are connected with information between them. Such a structure allows the RNN to take into account the backward and forward connections during training. The output of the current moment will be associated with the data of the historical moment, which is the reason why the RNN is memorable. Therefore, RNN is particularly suitable for modeling predictions for the time series. Figure 7 is a typical RNN structure.
The input to the RNN is a sequence of , and the output is a sequence of , where U, V, and W represent the weight matrices. is the input to the network, from U into the hidden layer . The output is obtained through V, and the hidden layer will retain part of the information for calculating the next moment . Thus, the output is related not only to , but also to the previous inputs of the sequence, where t represents the value taken by the sequence at a given time.
The computational process of the hidden layer and the output layer of the RNN can be described as Equation (7) and (8).
The above equations describe that the output of the RNN is influenced by the previous input, and the RNN has a particular advantage in dealing with time series problems. However, the RNN also has some disadvantages and is prone to gradient disappearance or explosion when the network layers are deep or the sequences are too long. The chain rule for derivation and concatenation is used, and if there are too many terms less than one, it will cause the gradient to be unavailable for training. Furthermore, the RNN network can only learn information that is close in time (i.e., the short-term memory), and it is difficult to store information from longer periods of time and apply to sequence data that needs to be relied on for a long time.
4.2. LSTM Network
To address these shortcomings of the simple recurrent neural network RNN, Sepp Hochreiter and Jurgen Schmidhuber proposed the LSTM recurrent neural network in 1997. This network model is very effective for long-range sequences and long-distance-dependent information and is widely used in speech, audio analysis, and time series prediction. The LSTM network model has been developed over the years for various domains with several improvements such as stacked LSTM, bidirectional LSTM, CNN-LSTM, and GRU. The LSTM model is based on the RNN by introducing a three logic gates structure to decide whether some information needs to be erased or some information needs to be protected to achieve memory of LSTM information.
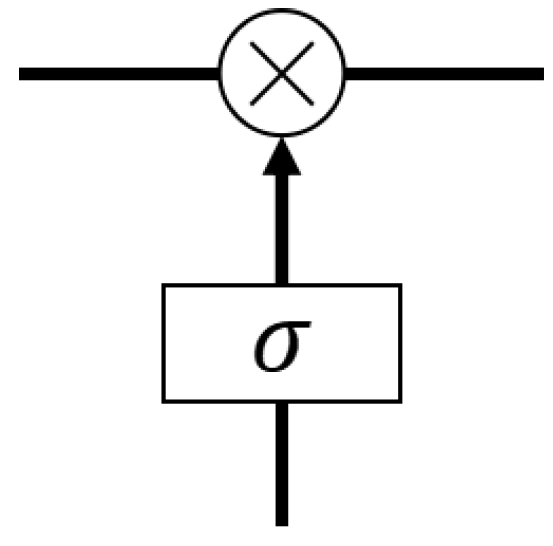
Figure 8 is the structure of the gating unit of LSTM. The structure of the gating unit consists of a Sigmoid layer and a dot product to select whether a message can pass or not. The Sigmoid layer has unique output vector values between 0 and 1 that indicate the pass rate of messages, where 0 means that messages are forbidden to pass (i.e., forgotten) and 1 means that all messages are allowed to pass (i.e., remembered).
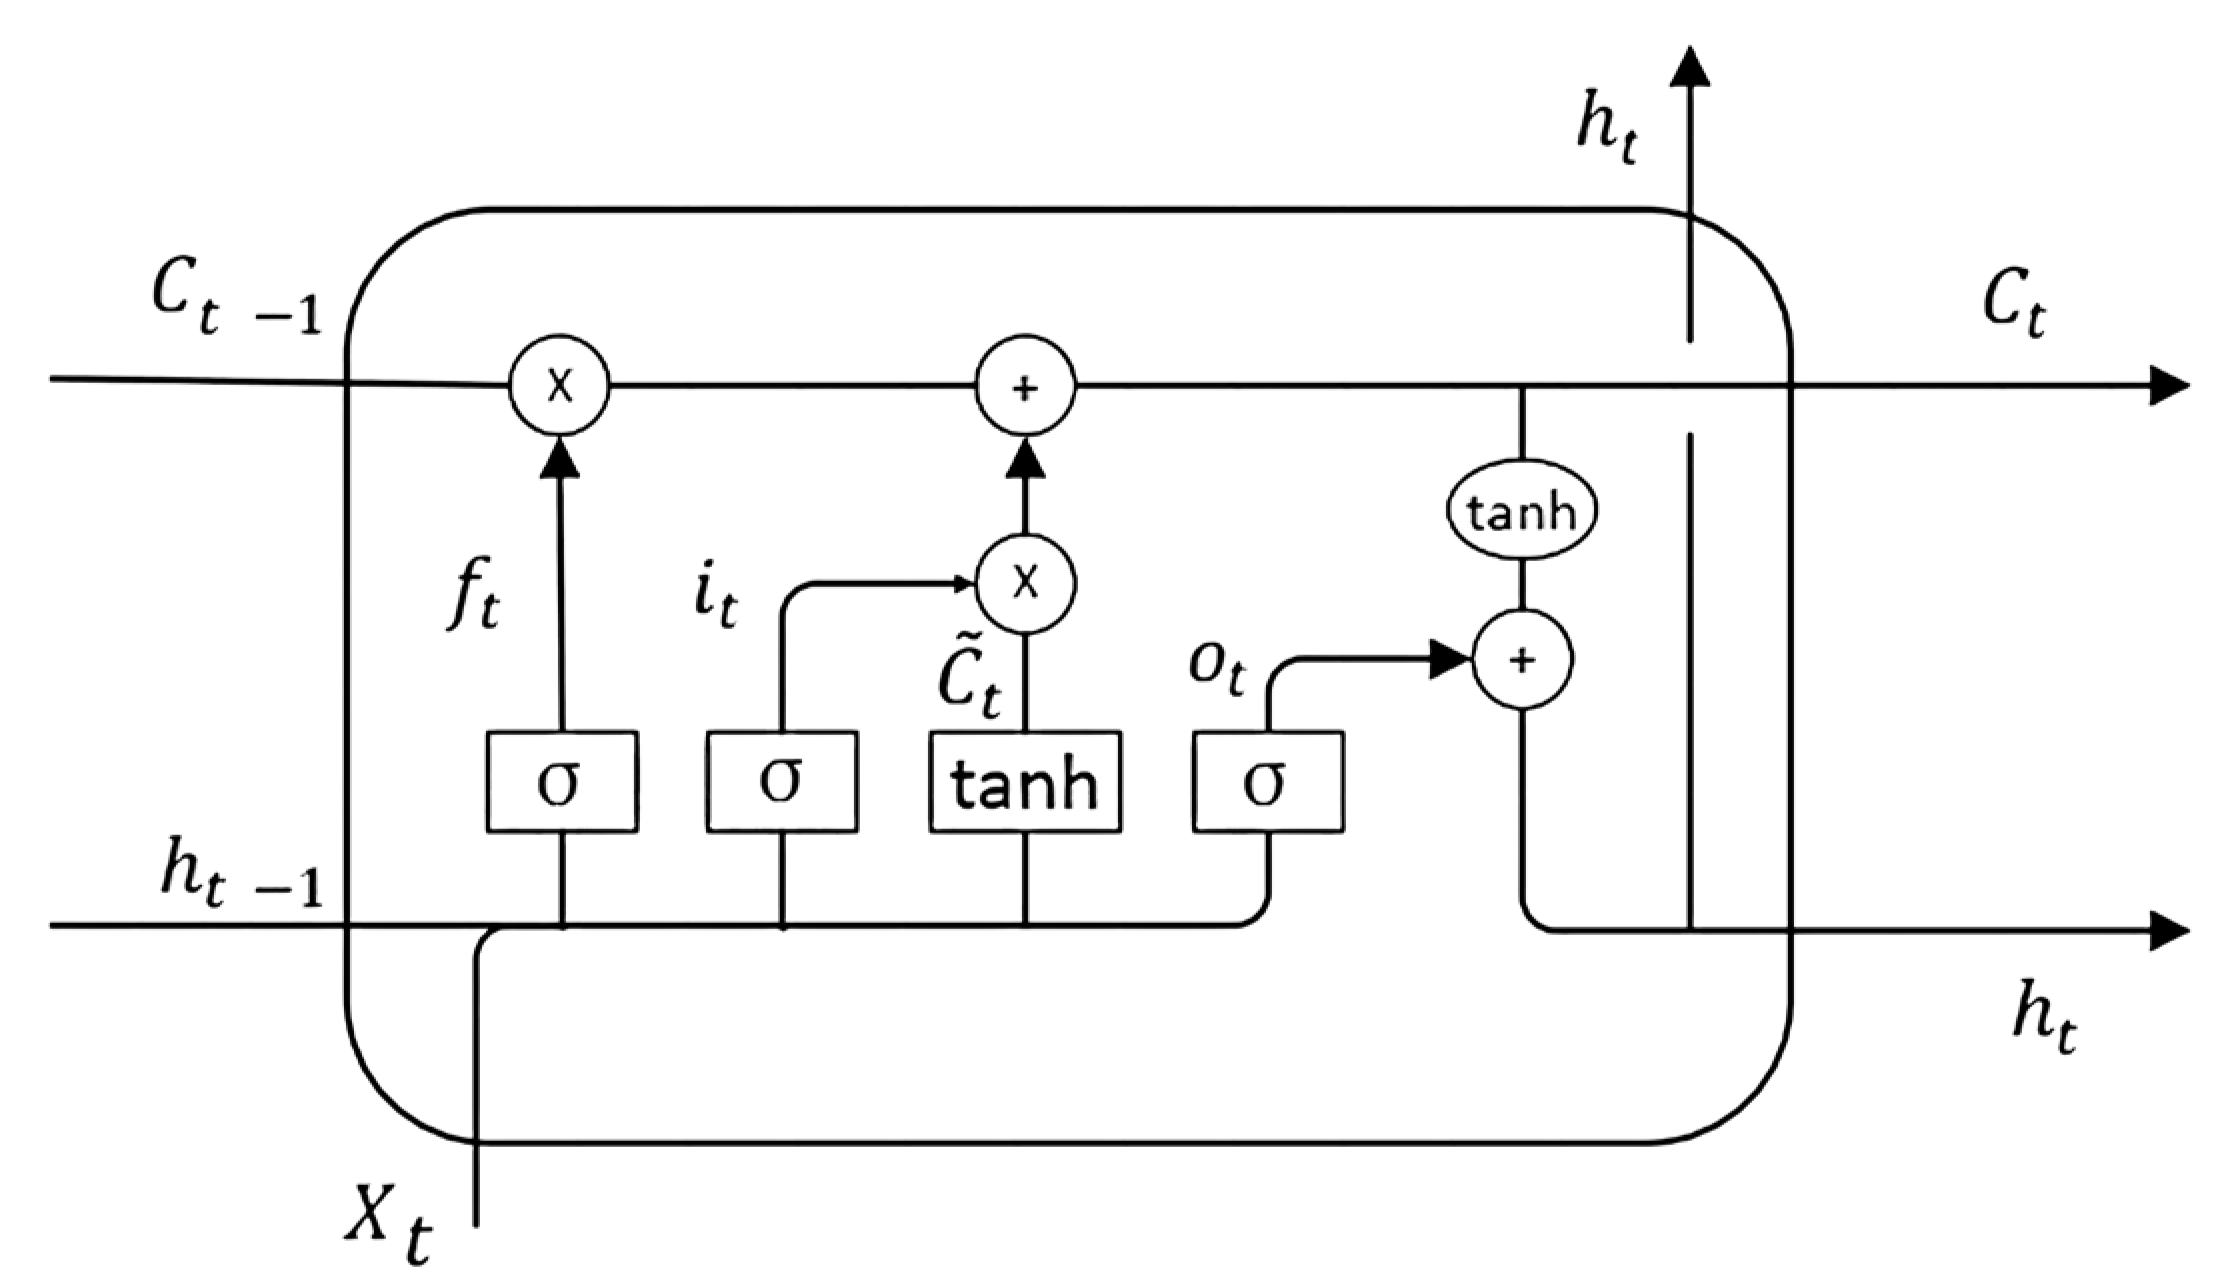
The LSTM consists of three logic gates, and the specific LSTM memory cells are shown in Figure 9 [34]. From left to right, they are the input gate, the output gate, the internal state update, and the forget gate.
Where means the input to the neuron at the moment t, represents the information of the hidden layer at the moment t, and represents the state of the neuron cell at the moment t.
- (1)
- Calculation of the forget gate.
The forget gate is used to discard the information from the cells of the neuron, which is the first step in the computation. The forget gate receives the output information from the neuron at the previous moment and the current input moment . A value between 0 and 1 is output through a Sigmoid function transformation, which directly determines the internal state information , as Equation (9),
where is the threshold of the forget gate, and is the output information of the forget gate. The forget gate helps to discard the noise in the power cell capacity data and improves the prediction accuracy.
- (2)
- Calculation of the input gate.
The input gate is calculated by how much new information will be added to the internal state. The input gate function is implemented via two steps: the information is updated by the Sigmoid function, and the update state is generated by the tanh function, which serves as the alternative update information. The specific mathematical expression is shown in Equations (10) and (11).
where represents the input gate information after the calculation of the Sigmoid function, and represents the input gate information after calculation of the tanh function.
- (3)
- Update of the internal state.
The internal state of the LSTM is updated according to the previous steps, by multiplying the old state of the previous cell by the output information of the forgetting gate and then adding the multiplication of the input gate information and , as shown in Equation (12).
- (4)
- Calculation of the output gate.
The output gate is calculated as follows: first, and are calculated via a Sigmoid function to obtain a value between 0 and 1 and decide which information of the neuron will be output; then, the current internal state of the cell is processed using a tanh function, ; finally, the processing result is multiplied by to obtain the output information of the hidden layer at time t. The mathematical expression of the above procedure is shown in Equations (13) and (14).
Based on the characteristics of these three logic gates, gradients can be well passed between neurons of the LSTM. The LSTM can control the information transfer between sequences by controlling the switching state of the valves, and the early information of long-time sequences can be selectively retained. This property allows the LSTM model to learn long-period time sequences.
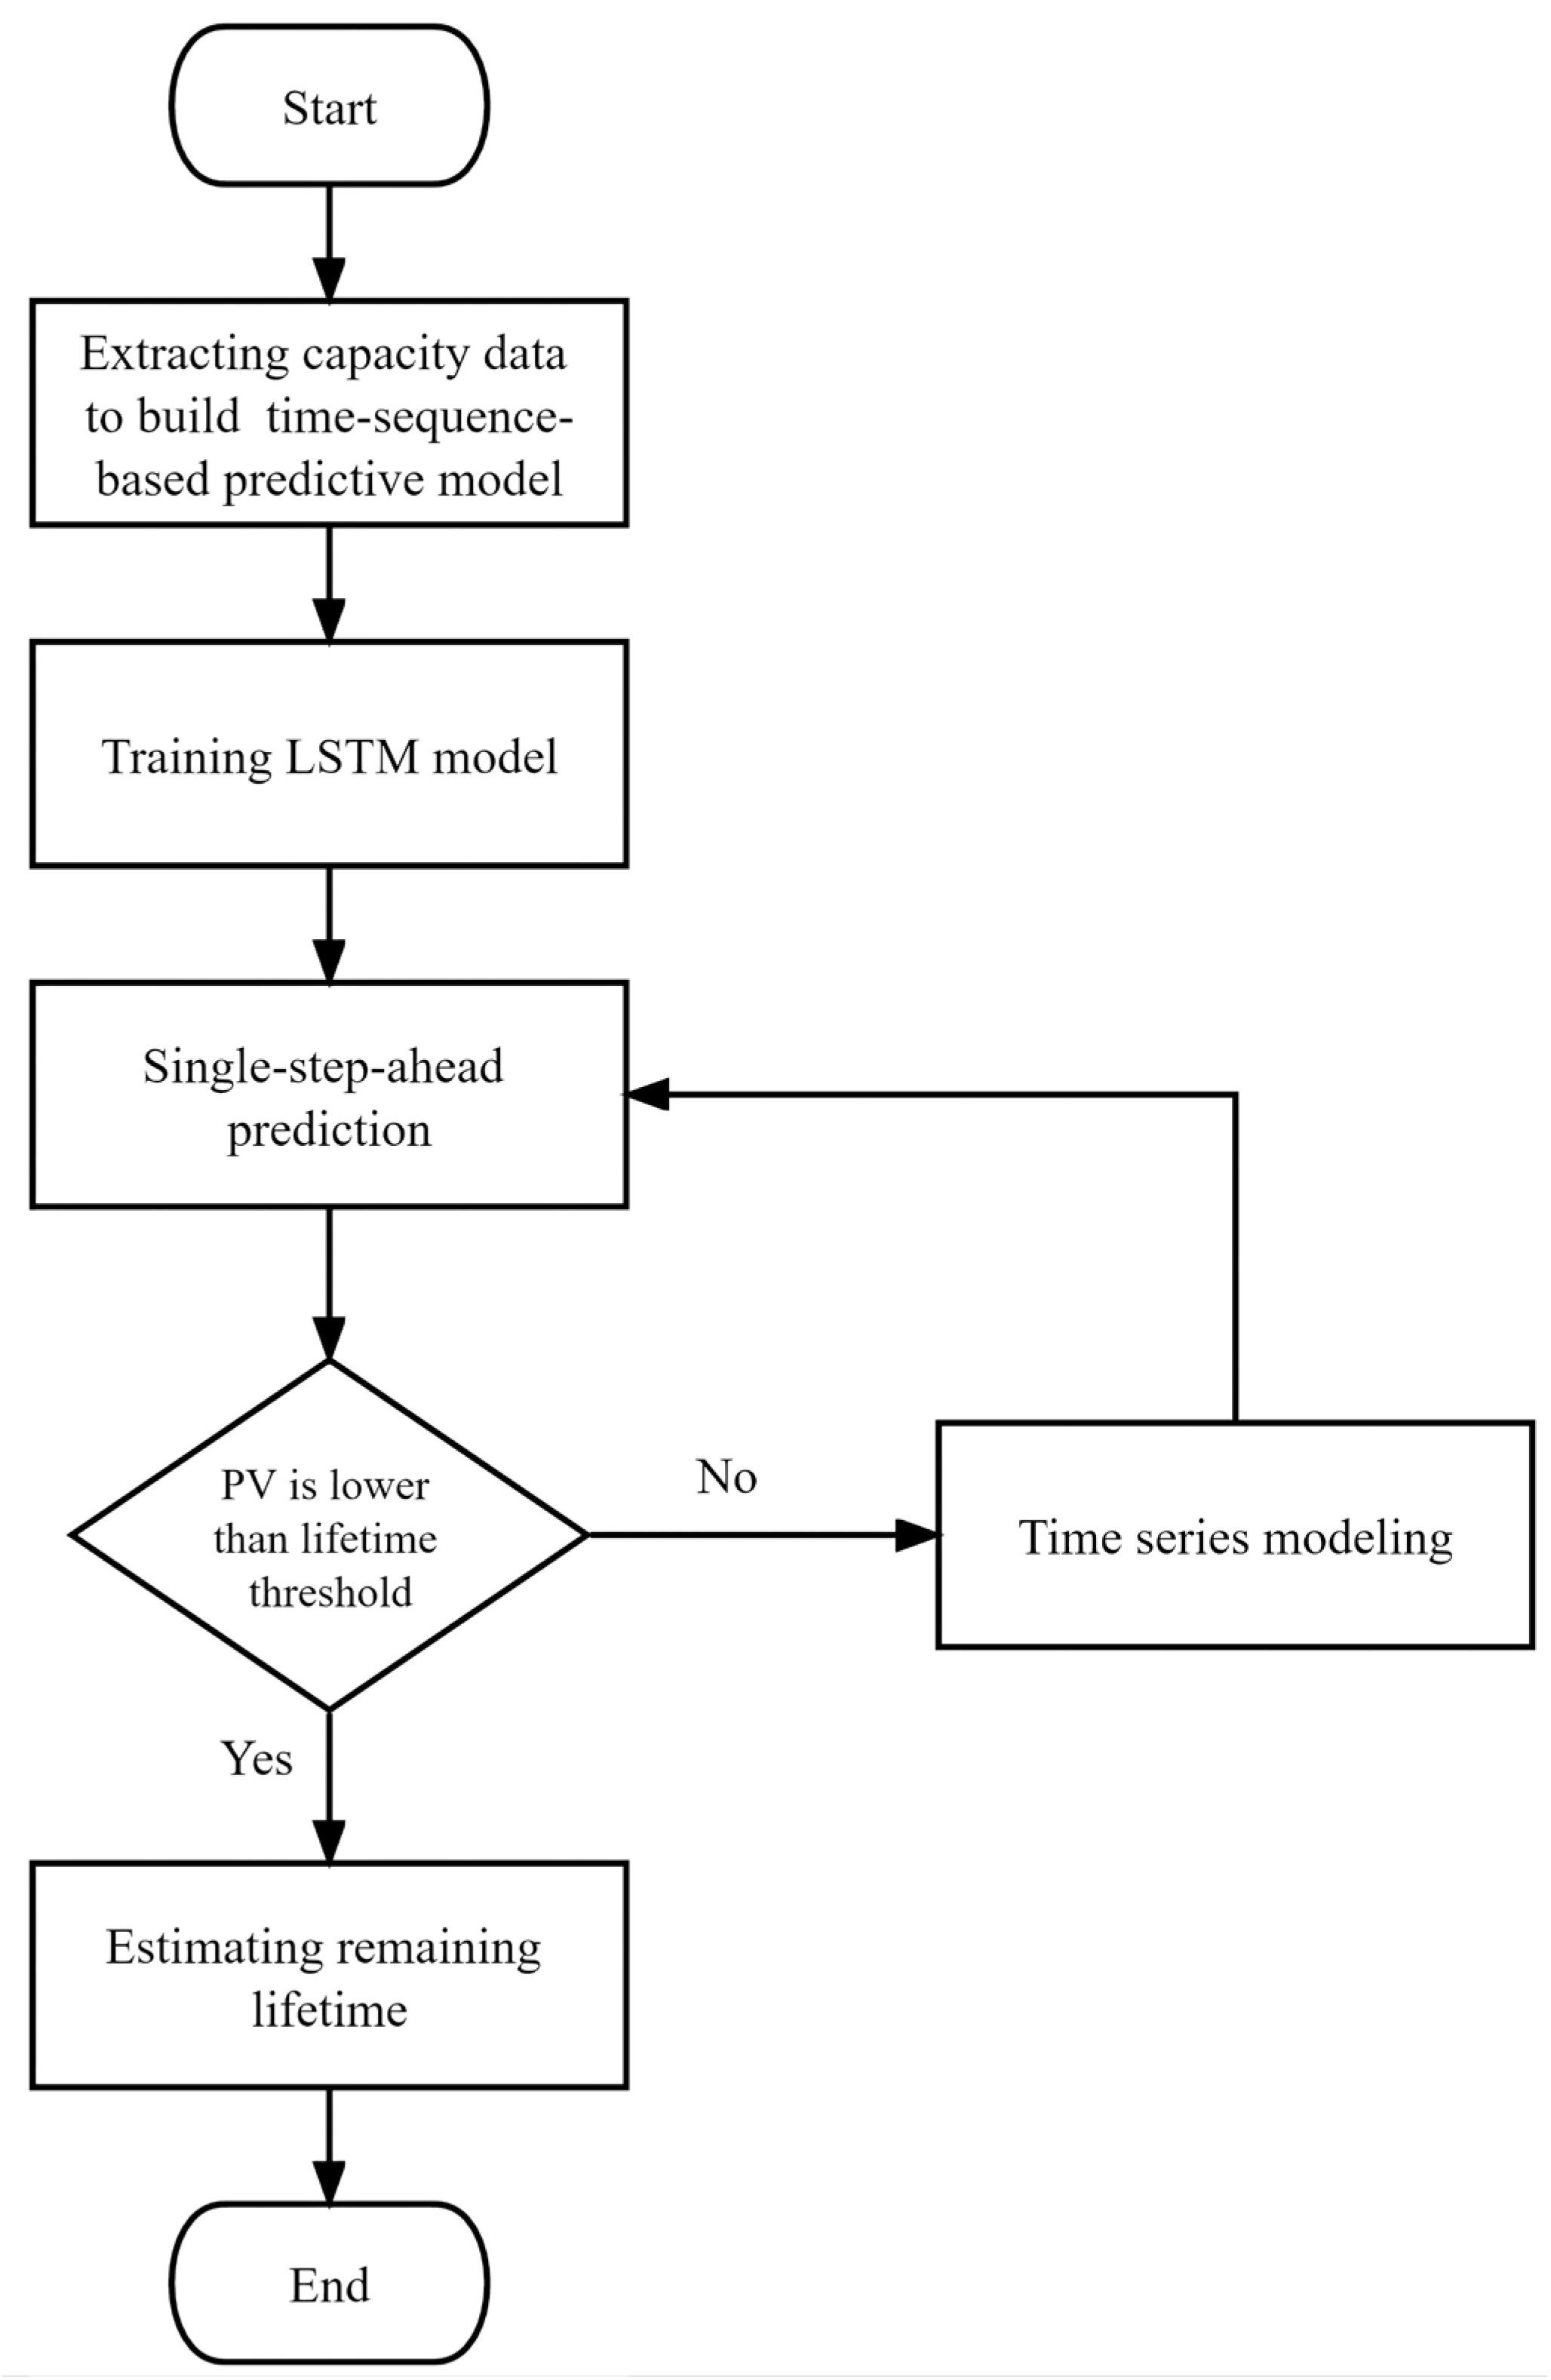
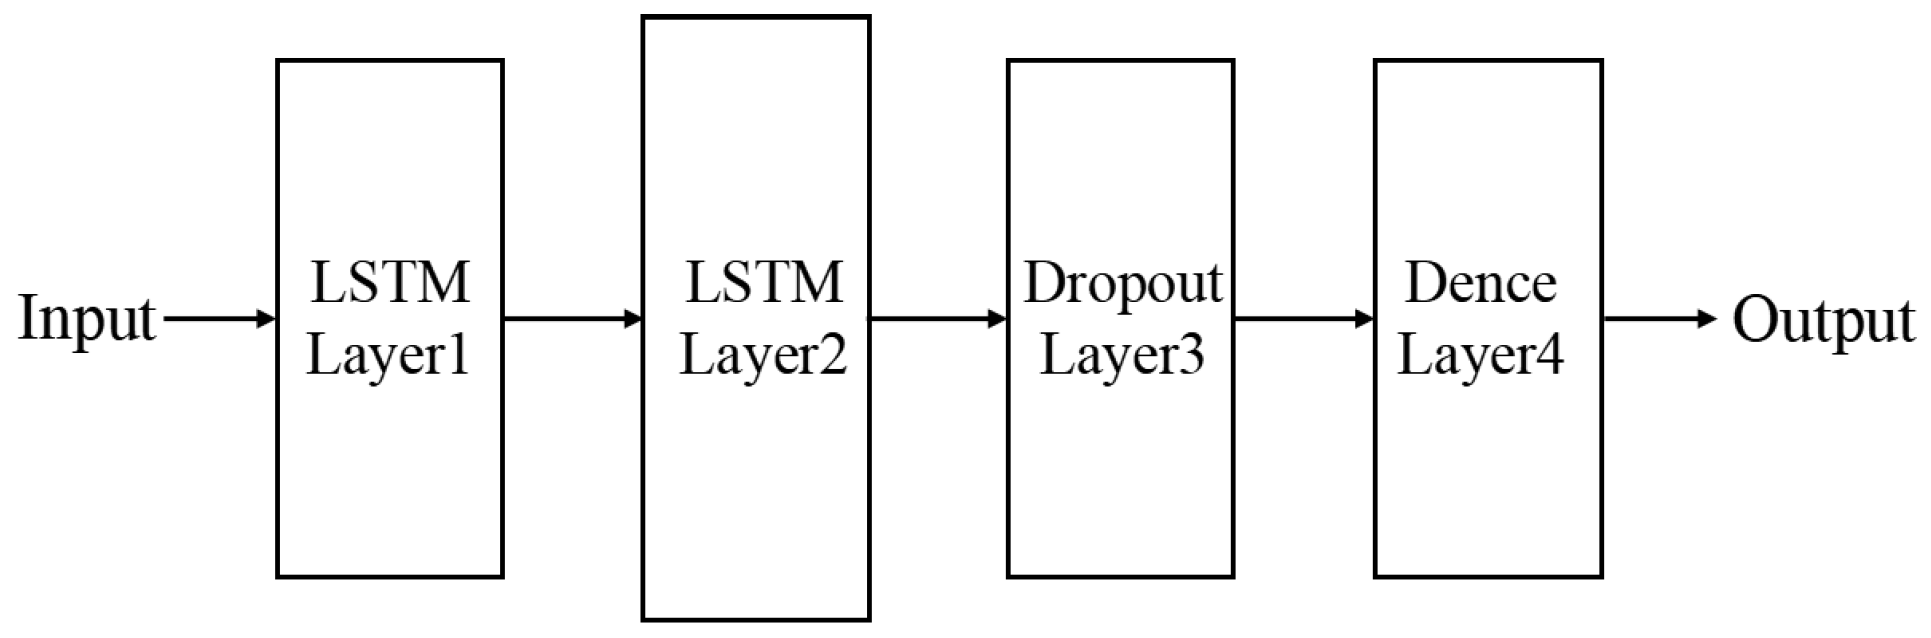
The capacity degradation takes a long cycle. Historical capacity data is trained based on LSTM, and the long-term dependency between capacity sequences is achieved to predict future capacity. The SOH is predicted according to the principle of the LSTM algorithm and the characteristics of batteries. Figure 10 is the flowchart of the LSTM-based SOH prediction algorithm. The historical capacity data of batteries are used as the input, and the output is the capacity of the predicted model, as the reference of the SOH. In addition to the input and output layers, a double LSTM layer, a dropout layer to avoid overfitting, and a fully connected layer are used in the hidden layer. The specific network model structure is shown in Figure 11.
The root mean square propagation (RMSprop) model is used to update the parameters of the LSTM model, which can dynamically adjust the learning rate according to the amplitude of gradient oscillation and improve the convergence speed compared with the traditional SGD learning method to ensure the computational efficiency. For the NASA dataset, the length of the time series input network is set to 6 due to the small data length, and the hidden layer of the network is set to 12 neurons using the parameter optimization method; for the CALCE dataset, the length of the time series input network is set to 12, the hidden layer of the network is set to 24 neurons, and the ReLu function is used as the activation function.
4.3. Discussion and Analysis of Results
After constructing the LSTM network model for training, the experimental environment based on Python 3.8 and Tensorflow’s Keras framework is established. Historical capacity data are fed into the network for prediction, and the predicted capacity obtained is a reference for the SOH. In addition, different starting prediction points are set for the battery capacity. The prediction results are evaluated via two metrics, root mean squared error (RMSE) and mean absolute percent error (MAPE), which are calculated using Equations (15) and (16).
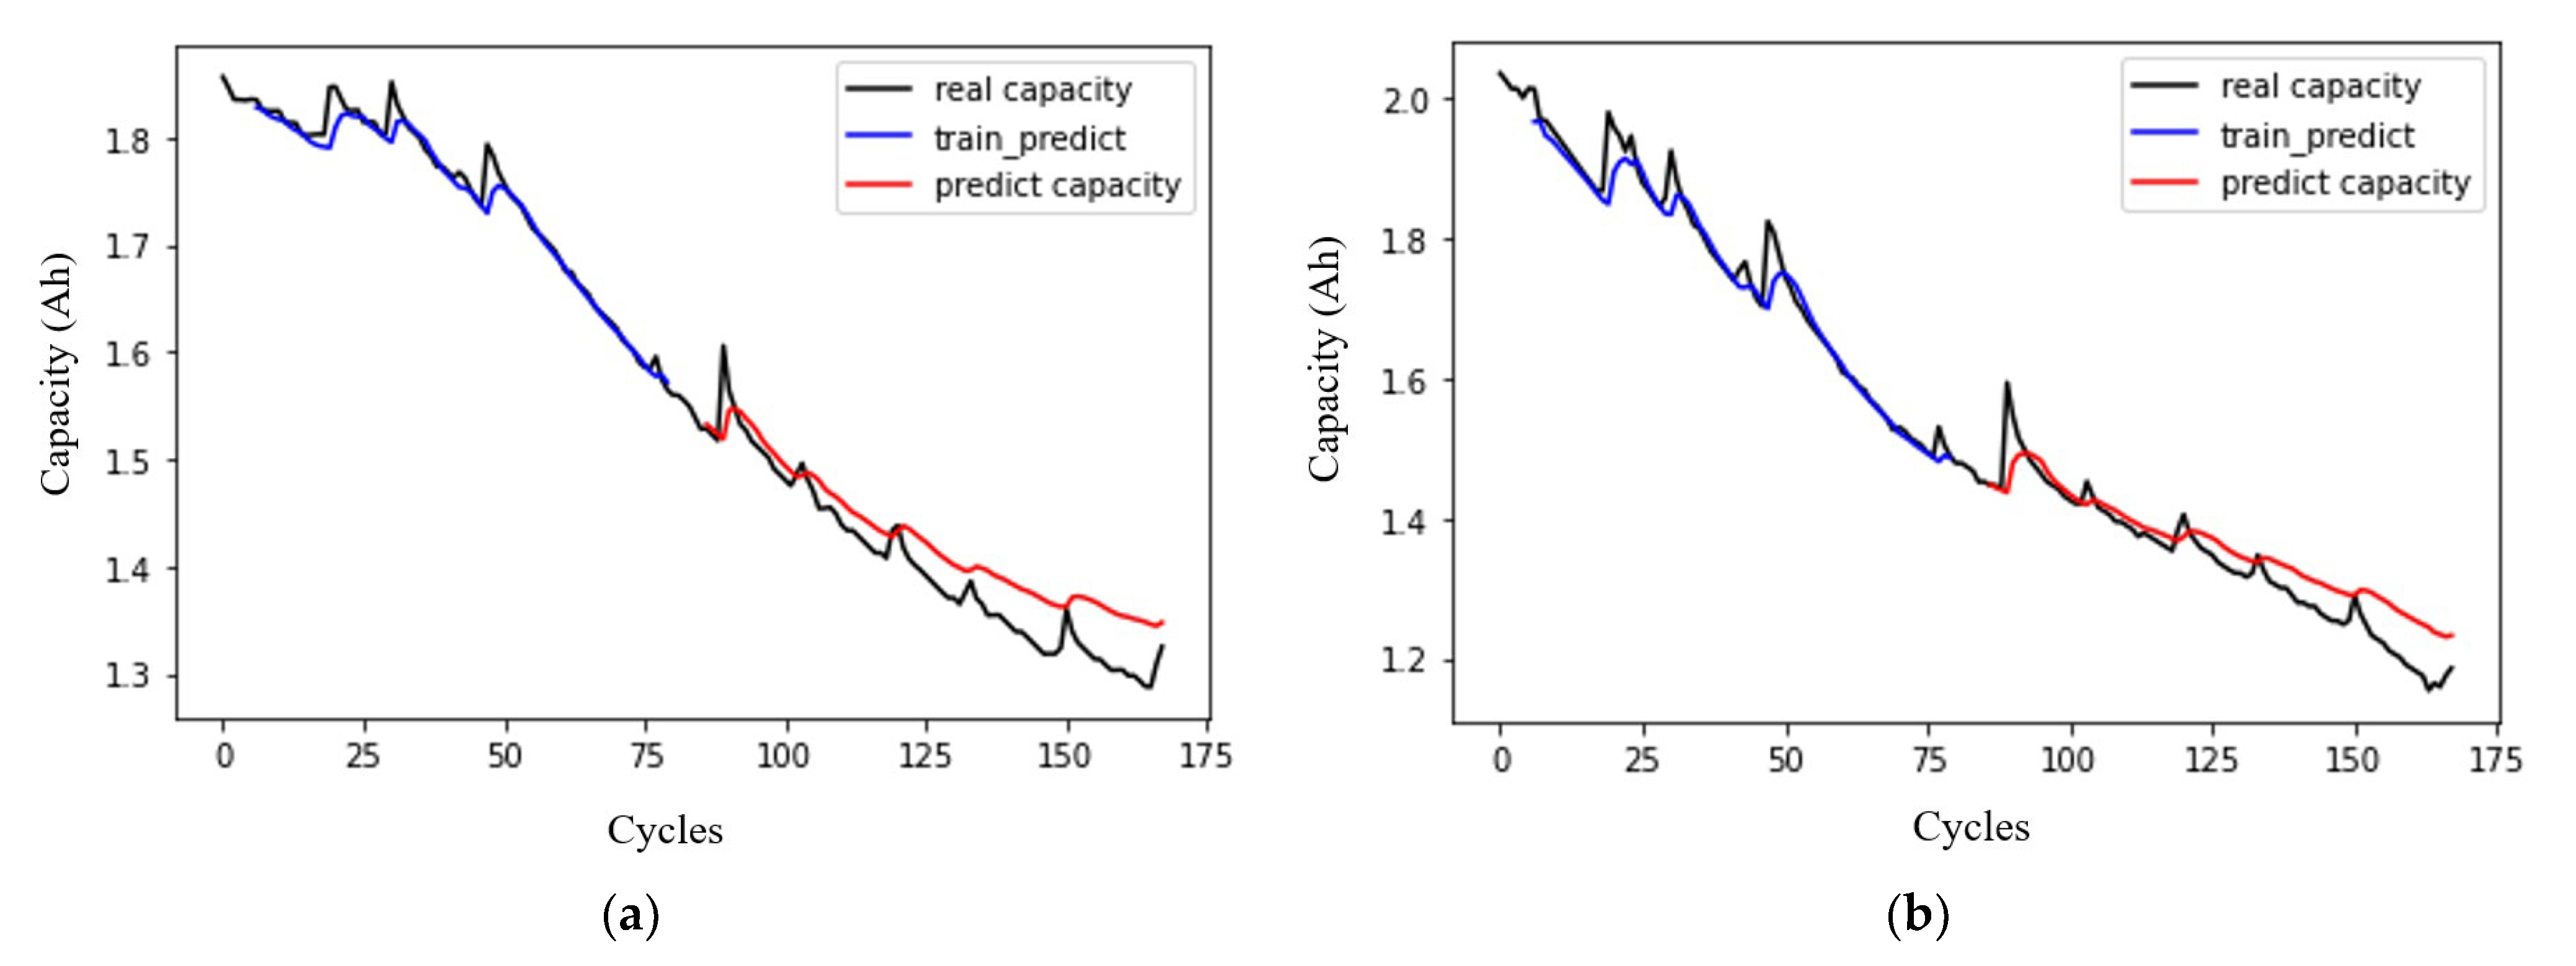
A cycle of 80 times is selected as the starting point for prediction on the NASA dataset of B5 and B6 cells, as shown in Figure 12. The RMSE of the prediction result for the B5 cell is 0.03423, and the MAPE is 2.10%; the RMSE of the prediction result for the B6 cell is 0.04113, and the MAPE is 2.39%. From the prediction results, the LSTM model performs better in predicting the health status of B5 and B6 cells, with larger prediction errors at the abrupt changes in battery capacity and at the end of the cycle, but is able to predict the future degradation capacity more accurately.
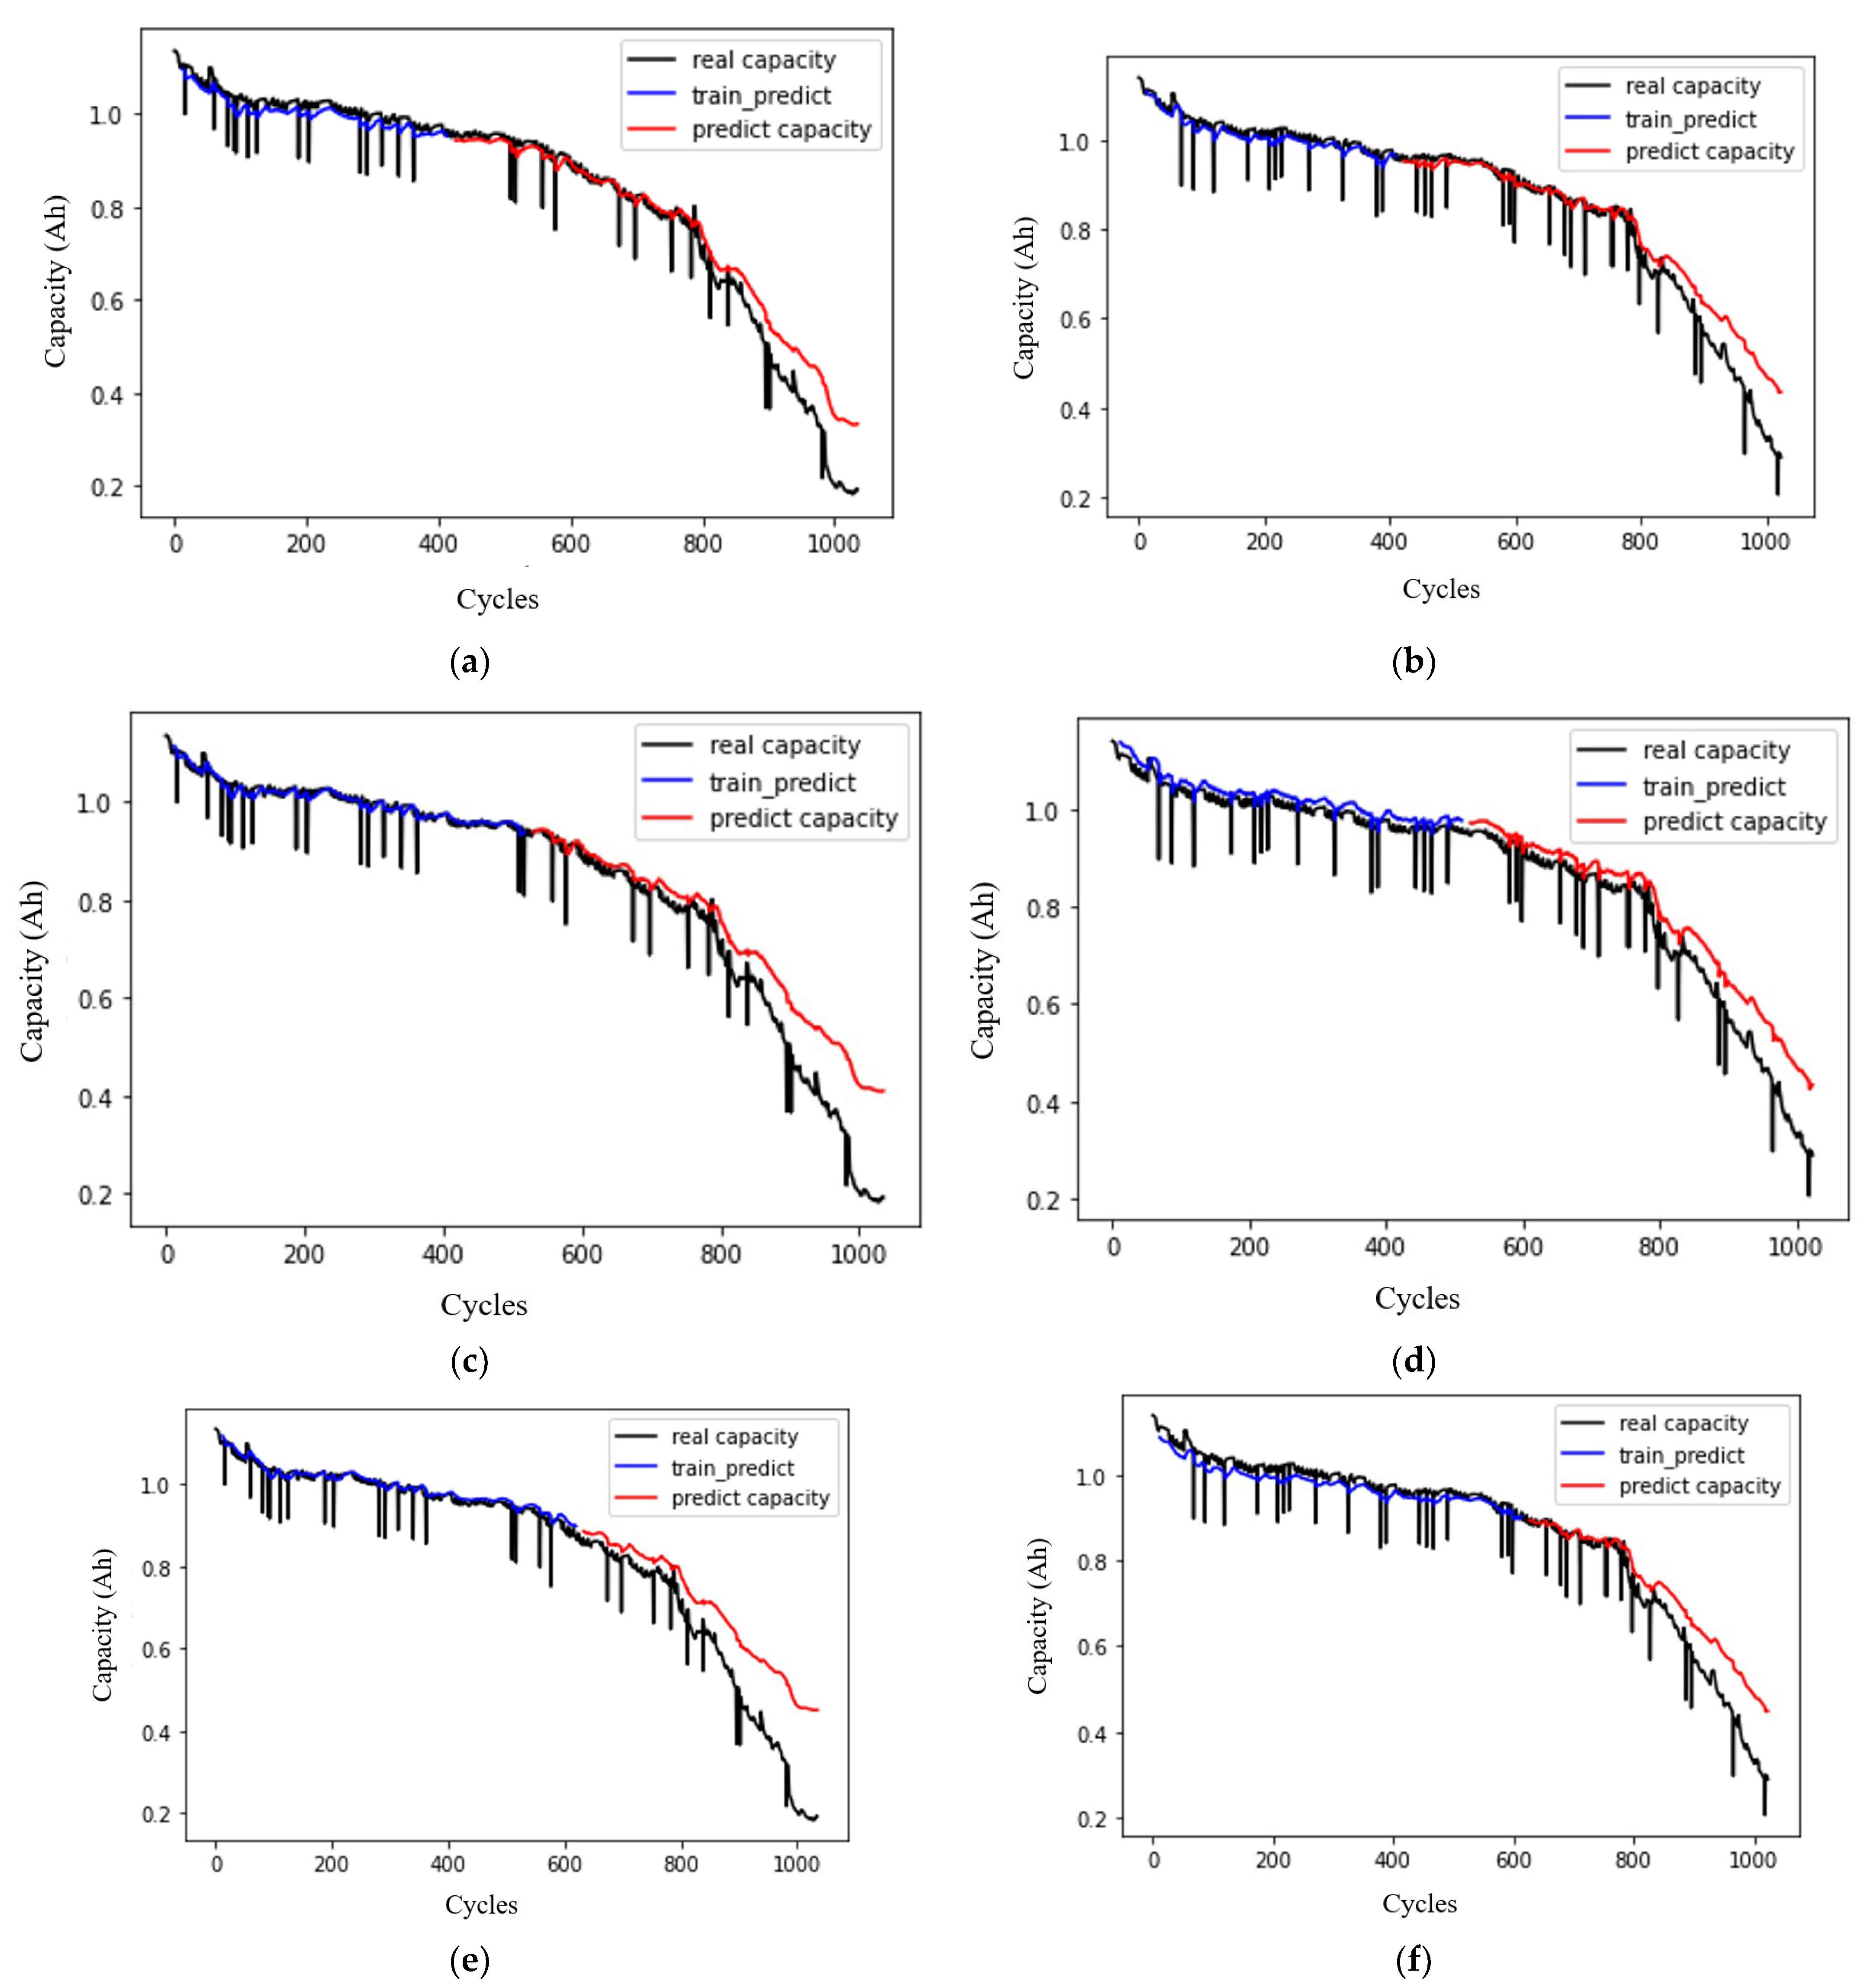
The CALCE dataset is used to further validate the predictive capability of the LSTM network model. The different prediction starting points (i.e., 40%, 50%, and 60% of the battery capacity) are used for the CS-37 and CS-38 cells, as shown in Figure 13. For the prediction based on 40% of the dataset length, the LSTM network model can accurately predict the battery capacity degradation before 800 cycles. After that, the prediction result of the LSTM network has a small deviation from the actual situation, but the deviation can be acceptable. As the prediction starting point moves backward, the starting point of the LSTM prediction result deviation also moves forward, reducing from the original 800 cycles to about 600 cycles.
From the capacity prediction results of the CALCE dataset, the LSTM model can predict the trajectory of battery capacity degradation relatively accurately at different prediction starting points, and the noisy data in the battery dataset does not have a large impact on the LSTM network model, but the prediction accuracy of the model decreases at locations where the battery capacity fluctuates. As with the prediction results for the NASA dataset, the LSTM network model has a larger prediction error at the end of the lithium-ion battery cycle, due to the faster rate of battery capacity degradation.
The prediction errors of battery capacity for different prediction starting points are shown in Table 2. The RMSE and MAPE metrics of battery capacity prediction using the LSTM model for different prediction starting points and overall prediction accuracy is high for different starting points. Among the batteries used in the experiment, CS-35 and CS-38 are in good condition, while CS-36 and CS-37 are in poor condition. The prediction accuracy of different battery cells with a 40% cycle as the prediction starting point is relatively better than 50% and 60%, because the battery capacity data decreases smoothly in the middle of the cycle and the prediction error is small and the capacity decreases rapidly and fluctuates more at the end of the cycle of the experiment, when the prediction error is larger, leading to the increase of the average error at the 60% starting point. From the above results, it can be seen that for the problem of direct prediction battery capacity, the model training using the LSTM network is more reliable in predicting the SOH. Thus, the SOH can be evaluated by comparing RMSE and MAPE.
4.4. Open Issues
There are some open issues in the proposed approach that need to be addressed in future research.
- The current research results of this paper can only make the LSTM curve predict the trend of battery health status. For the case of a high cycle number, it is probably impossible to accurately estimate the remaining capacity. In the following section, the mathematical fitting can be a method to find out the law of battery capacity decline in a high cycle number.
- In this paper, we used a NASA dataset and CALCE dataset. This can basically support the validation of the proposed method at present, but it may also have some limitations. We will further update the LSTM network model in this paper using other datasets from the literature in our continued studies.
- The LSTM model presented in this paper predicts the battery life, but it has not given an evaluation of the battery health status or distinguished whether the battery is suitable. Therefore, batteries in different health states will be classified and evaluated in future research.
5. Conclusions
In this paper, the degradation mechanism of the SOH of a lithium-ion battery is studied to provide a reference for health management. The capacity degradation simulation is performed based on a one-dimensional isothermal electrochemical model. The LSTM-based approach is applied to directly predict the SOH from a series perspective.
- The hazards of the degradation mechanisms associated with lithium-ion batteries are specifically described, and relevant measures to slow down or avoid degradation of the battery health state are presented. Parasitic side reactions occurring at the negative electrode during charging, which lead to a reduction of recyclable lithium, are mainly considered in the capacity degradation model. The cell discharge voltage and capacity changes are investigated for different cycle counts, with a larger potential drop along the SEI layer at the negative membrane compared to the collector and a faster reduction of electrolyte volume fraction at this location.
- The improved structure and implementation principle of LSTM is compared with RNN, which is more suitable for predicting of long-time sequences. The LSTM network model is constructed for the battery capacity sequence as a reference indicator of SOH and is experimentally validated using pre-processed battery life cycle datasets from NASA and CALCE datasets. The experimental results for different datasets show that the LSTM approach has high accuracy for the direct prediction of SOH. Although the ability to predict the temperature at the stage when the battery capacity fluctuates is reduced, the trend of the battery capacity degradation can be accurately predicted. The LSTM model shows good adaptive performance.
- In this paper, an accurate prediction approach of SOH for lithium-ion batteries based on the LSTM method has been proposed. It can solve the problem of accurately predicting the SOH of lithium-ion batteries, which is a crucial factor in determining the RUL of the batteries. The proposed approach can help users to better manage and maintain their batteries, avoid potential safety hazards, and optimize battery performance and efficiency. Future applications are expected to focus on users such as electric vehicle manufacturers, battery maintenance and repair service providers, and energy storage system operators.
Author Contributions
Conceptualization, L.Z. and G.L.; methodology, L.Z. and G.L.; software, T.J. and G.L.; validation L.Z., T.J. and G.L.; formal analysis, L.Z.; investigation, T.J. and G.L.; resources, L.Z.; data curation, L.Z.; writing—original draft preparation, L.Z., S.Y. and G.L.; writing—review and editing, L.Z., T.J. and S.Y; supervision, L.Z.; project administration, L.Z.; funding acquisition, L.Z. All authors have read and agreed to the published version of the manuscript.
Funding
This research was supported by the Innovation Group Project of Southern Marine Science and Engineering Guangdong Laboratory (Zhuhai) of China (No. 311021013), National Natural Science Foundation of China (No. 51775037), and Fundamental Research Funds for Central Universities of China (No. FRF-BD-18-001A).
Data Availability Statement
The data that support the findings of this study are openly available in: NASA dataset: Prognostics Center of Excellence Data Set Repository at https://www.nasa.gov/content/prognostics-center-of-excellence-data-set-repository (accessed on 10 January 2023), CALCE dataset: CALCE Battery Research Group at https://calce.umd.edu/battery-data (accessed on 10 January 2023).
Acknowledgments
The authors thank the National Center for Materials Service Safety of China for support with the simulation and data platform.
Conflicts of Interest
The authors declare no conflict of interest.
References
- Dai, Q.; Kelly, J.C.; Gaines, L.; Wang, M. Life Cycle Analysis of Lithium-Ion Batteries for Automotive Applications. Batteries 2019, 5, 48. [Google Scholar] [CrossRef] [Green Version]
- Chen, Z.; Xu, K.; Wei, J.; Dong, G. Voltage fault detection for lithium-ion battery pack using local outlier factor. Measurement 2019, 146, 544–556. [Google Scholar] [CrossRef]
- Rauf, H.; Khalid, M.; Arshad, N. Machine learning in state of health and remaining useful life estimation: Theoretical and technological development in battery degradation modelling. Renew. Sust. Energy Rev. 2022, 156, 111903. [Google Scholar] [CrossRef]
- Goh, H.H.; Lan, Z.; Zhang, D.; Dai, W.; Kurniawan, T.A.; Goh, K.C. Estimation of the state of health (SOH) of batteries using discrete curvature feature extraction. J. Energy Storage 2022, 50, 104646. [Google Scholar] [CrossRef]
- Chen, L.; Lu, Z.; Lin, W.; Li, J.; Pan, H. A new state-of-health estimation method for lithium-ion batteries through the intrinsic relationship between ohmic internal resistance and capacity. Measurement 2018, 116, 586–595. [Google Scholar] [CrossRef]
- Li, X.; Ding, Q.; Sun, J.-Q. Remaining useful life estimation in prognostics using deep convolution neural networks. Reliab. Eng. Syst. Saf. 2018, 172, 1–11. [Google Scholar] [CrossRef] [Green Version]
- Hu, C.; Ye, H.; Jain, G.; Schmidt, C. Remaining useful life assessment of lithium-ion batteries in implantable medical devices. J. Power. Sources 2018, 375, 118–130. [Google Scholar] [CrossRef]
- Wang, D.; Kong, J.-Z.; Zhao, Y.; Tsui, K.-L. Piecewise model based intelligent prognostics for state of health prediction of rechargeable batteries with capacity regeneration phenomena. Measurement 2019, 147, 106836. [Google Scholar] [CrossRef]
- Lin, H.; Kang, L.; Xie, D.; Linghu, J.; Li, J. Online state-of-health estimation of lithium-ion battery based on incremental capacity curve and BP neural network. Batteries 2022, 8, 29. [Google Scholar] [CrossRef]
- Yang, Y.; Chen, S.; Chen, T.; Huang, L. State of Health Assessment of Lithium-ion Batteries Based on Deep Gaussian Process Regression Considering Heterogeneous Features. J. Energy Storage 2023, 61, 106797. [Google Scholar] [CrossRef]
- Yu, J. State of health prediction of lithium-ion batteries: Multiscale logic regression and gaussian process regression ensemble. Reliab. Eng. Syst. Saf. 2018, 174, 82–95. [Google Scholar] [CrossRef]
- Zhang, W.; Li, X.; Li, X. Deep learning-based prognostic approach for lithium-ion batteries with adaptive time-series prediction and on-line validation. Measurement 2020, 164, 108052. [Google Scholar] [CrossRef]
- Richardson, R.R.; Osborne, M.A.; Howey, D.A. Gaussian process regression for forecasting battery state of health. J. Power Sources 2017, 357, 209–219. [Google Scholar] [CrossRef]
- Xu, X.; Chen, N. A state-space-based prognostics model for lithium-ion battery degradation. Reliab. Eng. Syst. Saf. 2017, 159, 47–57. [Google Scholar] [CrossRef]
- Yang, J.-H.; Chen, K.-C. Evaluation of Electrochemical Parameters for Cycle Aging LiCoO2 lithium-Ion Batteries by Quantifying the Incremental Capacity Curve. J. Electrochem. Soc. 2022, 169, 020517. [Google Scholar] [CrossRef]
- Wei, J.; Dong, G.; Chen, Z. Remaining useful life prediction and state of health diagnosis for lithium-ion batteries using particle filter and support vector regression. IEEE Trans. Industr. Electron. 2018, 65, 5634–5643. [Google Scholar] [CrossRef]
- Li, X.; Zhang, W.; Xu, N.-X.; Ding, Q. Deep learning-based machinery fault diagnostics with domain adaptation across sensors at different places. IEEE Trans. Industr. Electron. 2020, 67, 6785–6794. [Google Scholar] [CrossRef]
- Zhang, W.; Li, X.; Ding, Q. Deep residual learning-based fault diagnosis method for rotating machinery. ISA Trans. 2019, 95, 295–305. [Google Scholar] [CrossRef]
- Zhang, W.; Li, X.; Jia, X.-D.; Ma, H.; Luo, Z.; Li, X. Machinery fault diagnosis with imbalanced data using deep generative adversarial networks. Measurement 2020, 152, 107377. [Google Scholar] [CrossRef]
- Liu, X.; Zhang, X.-Q.; Chen, X.; Zhu, G.-L.; Yan, C.; Huang, J.-Q.; Peng, H.-J. A generalizable, data-driven online approach to forecast capacity degradation trajectory of lithium batteries. J. Energy Chem. 2022, 68, 548–555. [Google Scholar] [CrossRef]
- Li, X.; Zhang, W.; Ding, Q.; Li, X. Diagnosing rotating machines with weakly supervised data using deep transfer learning. IEEE Trans. Industr. Inf. 2019, 16, 1688–1697. [Google Scholar] [CrossRef]
- Wu, J.; Wang, Y.; Zhang, X.; Chen, Z. A novel state of health estimation method of li-ion battery using group method of data handling. J. Power Sources 2016, 327, 457–464. [Google Scholar] [CrossRef]
- Ma, Y.; Shan, C.; Gao, J.; Chen, H. A novel method for state of health estimation of lithium-ion batteries based on improved LSTM and health indicators extraction. Appl. Energy 2022, 251, 123973. [Google Scholar] [CrossRef]
- Chang, Y.; Fang, H.; Zhang, Y. A new hybrid method for the prediction of the remaining useful life of a lithium-ion battery. Appl. Energy 2017, 206, 1564–1578. [Google Scholar] [CrossRef]
- Li, X.; Zhang, W.; Ding, Q. Deep learning-based remaining useful life estimation of bearings using multi-scale feature extraction. Reliab. Eng. Syst. Saf. 2019, 182, 208–218. [Google Scholar] [CrossRef]
- Li, T.; Gao, Y.; Wang, K.; Guo, S.; Liu, H.; Kang, H. Diagnostic assessment of deep learning algorithms for diabetic retinopathy screening. Inf. Sci. 2019, 501, 511–522. [Google Scholar]
- Sikorska, J.Z.; Hodkiewicz, M.; Ma, L. Prognostic modelling options for remaining useful life estimation by industry. Mech. Syst. Signal Process. 2011, 25, 1803–1836. [Google Scholar] [CrossRef]
- Wu, J.; Zhang, C.; Chen, Z. An online method for lithium-ion battery remaining useful life estimation using importance sampling and neural networks. Appl. Energy 2016, 173, 134–140. [Google Scholar] [CrossRef]
- Sbarufatti, C.; Corbetta, M.; Giglio, M.; Cadini, F. Adaptive prognosis of lithium-ion batteries based on the combination of particle filters and radial basis function neural networks. J. Power Sources 2017, 344, 128–140. [Google Scholar] [CrossRef]
- Chemali, E.; Kollmeyer, P.J.; Preindl, M.; Ahmed, R.; Emadi, A. Long short-term memory networks for accurate state-of-charge estimation of li-ion batteries. IEEE Trans. Industr. Electron. 2018, 65, 6730–6739. [Google Scholar] [CrossRef]
- Li, X.; Zhang, W.; Ding, Q. Understanding and improving deep learning-based rolling bearing fault diagnosis with attention mechanism. Signal Process. 2019, 161, 136–154. [Google Scholar] [CrossRef]
- Li, X.; Zhang, W.; Ding, Q. Cross-domain fault diagnosis of rolling element bearings using deep generative neural networks. IEEE Trans. Industr. Electron. 2019, 66, 5525–5534. [Google Scholar] [CrossRef]
- Li, X.; Zhang, W.; Ding, Q.; Sun, J.-Q. Multi-layer domain adaptation method for rolling bearing fault diagnosis. Signal Process. 2019, 157, 180–197. [Google Scholar] [CrossRef] [Green Version]
- Bouktif, S.; Fiaz, A.; Ouni, A.; Serhani, M.A. Multi-Sequence LSTM-RNN Deep Learning and Metaheuristics for Electric Load Forecasting. Energies 2020, 13, 391. [Google Scholar] [CrossRef] [Green Version]
Figure 1.
Battery discharge voltage curves at different cycle times.

Figure 2.
Battery health status curve at different cycle times.

Figure 3.
Curve of potential drop of SEI layer with the number of cycles.

Figure 4.
Variation curve of electrolyte volume fraction with number of cycles.

Figure 5.
Capacity degradation of NASA batteries.

Figure 6.
Capacity degradation of lithium batteries tested by CALCE.

Figure 7.
Network structure of RNN.

Figure 8.
Gating unit structure of LSTM.

Figure 9.
Architecture of a LSTM cell.

Figure 10.
LSTM-based SOH prediction flowchart for power cells.

Figure 11.
Structural diagram of the LSTM network model.

Figure 12.
LSTM model prediction results: (a) B5 cell; (b) B6 cell.

Figure 13.
LSTM-based prediction results for CALCE battery capacity: (a) predicted results for CS-37 at T = 40%; (b) predicted results for CS-38 at T = 40%; (c) predicted results for CS-37 at T = 50%; (d) predicted results for CS-38 at T = 50%; (e) predicted results for CS-37 at T = 60%; (f) predicted results for CS-38 at T = 60%.


Table 1.
Battery aging influencing factors and associated degradation mechanisms.
| Aging Factors | Degradation Mechanisms | Degradation Model |
|---|---|---|
| Number of cycles | SEI membrane growth | Increased impedance and loss of lithium storage |
| Temperature | Electrolyte decomposition, SEI film growth, electroplating, lithium dendrite formation | Increased impedance, loss of lithium storage, loss of active material |
| Overcharge and overdischarge | SEI film growth, electrolyte decomposition, graphite shedding, electroplating, lithium dendrite formation, transition metal dissolution, collector corrosion | Increased impedance, loss of lithium storage, loss of active material |
| Charge and discharge rate | SEI film growth, graphite shedding, plating, lithium dendrite formation, electrode particle cracking | Increased impedance, loss of lithium storage, loss of active material |
| Mechanical stress | SEI film growth, electrode particle cracking | Increased impedance, loss of lithium storage, loss of active material |
Table 2.
Results of SOH prediction for different starting points.
| Prediction Starting Point | RMSE | MAPE | |
|---|---|---|---|
| CS-35 | 40% | 0.05783 | 5.75% |
| 50% | 0.06409 | 7.00% | |
| 60% | 0.08223 | 9.58% | |
| CS-36 | 40% | 0.07342 | 11.61% |
| 50% | 0.09677 | 14.71% | |
| 60% | 0.09911 | 17.79% | |
| CS-37 | 40% | 0.06182 | 8.27% |
| 50% | 0.09898 | 13.01% | |
| 60% | 0.10735 | 15.21% | |
| CS-38 | 40% | 0.06039 | 6.39% |
| 50% | 0.07191 | 8.84% | |
| 60% | 0.08088 | 9.98% |
Disclaimer/Publisher’s Note: The statements, opinions and data contained in all publications are solely those of the individual author(s) and contributor(s) and not of MDPI and/or the editor(s). MDPI and/or the editor(s) disclaim responsibility for any injury to people or property resulting from any ideas, methods, instructions or products referred to in the content. |
© 2023 by the authors. Licensee MDPI, Basel, Switzerland. This article is an open access article distributed under the terms and conditions of the Creative Commons Attribution (CC BY) license (https://creativecommons.org/licenses/by/4.0/).
Share and Cite
MDPI and ACS Style
Zhang, L.; Ji, T.; Yu, S.; Liu, G. Accurate Prediction Approach of SOH for Lithium-Ion Batteries Based on LSTM Method. Batteries 2023, 9, 177. https://doi.org/10.3390/batteries9030177
AMA Style
Zhang L, Ji T, Yu S, Liu G. Accurate Prediction Approach of SOH for Lithium-Ion Batteries Based on LSTM Method. Batteries. 2023; 9(3):177. https://doi.org/10.3390/batteries9030177
Chicago/Turabian StyleZhang, Lijun, Tuo Ji, Shihao Yu, and Guanchen Liu. 2023. "Accurate Prediction Approach of SOH for Lithium-Ion Batteries Based on LSTM Method" Batteries 9, no. 3: 177. https://doi.org/10.3390/batteries9030177
Note that from the first issue of 2016, this journal uses article numbers instead of page numbers. See further details here.