Aging Determination of Series-Connected Lithium-Ion Cells Independent of Module Design
by
 , , , and
Thiemo Hein
1,* ,
,
David Oeser
1,
Andreas Ziegler
1,
Daniel Montesinos-Miracle
2 and
Ansgar Ackva
1 1
Technology Transfer Centre for E-Mobility, Technical University of Applied Sciences Wuerzburg-Schweinfurt, Poststrasse 31, 97616 Bad Neustadt an der Saale, Germany
2
Centre d’Innovació Tecnològica en Convertidors Estàtics i Accionaments (CITEA-UPC), Departament d’Enginyeria Elèctrica, Universitat Politècnica de Catalunya, ETS d’Enginyeria Industrial de Barcelona, Av. Diagonal, 647, Pl. 2., 08028 Barcelona, Spain
*
Author to whom correspondence should be addressed.
Batteries 2023, 9(3), 172; https://doi.org/10.3390/batteries9030172
Submission received: 20 February 2023
/
Revised: 13 March 2023
/
Accepted: 16 March 2023
/
Published: 17 March 2023
(This article belongs to the Section Battery Performance, Ageing, Reliability and Safety)
Abstract
:In this work, a battery consisting of eight commercial NMC/graphite cells connected in series was cycled to 60% of its initial capacity. During the test, special care was taken to ensure that the results were not influenced by either the module assembly or the module design. For this purpose, the cells were virtually connected in a laboratory environment with the help of the test device as if they were operated together in a battery. Extrinsic influences that affect cell aging were thus reduced to a minimum. Differential Voltage Analysis (DVA), Electrochemical Impedance Spectrum (EIS), and relaxation measurements were performed to analyze the aging behavior of each cell. The results show that despite a theoretically perfect module design, Cell-to-Cell Variations (CtCV) occurred during aging. The shifting Depth of Discharge (DoD) values among the cells further amplify CtCV. Lithium plating was also observed in the faster aging cells after cyclic aging, suggesting that this aging effect contributes significantly to the development of CtCV. After the aging test, the battery was equipped with an active balancing system that maximizes capacity utilization. More important, the balancing charges which are calculated iteratively within the used balancing algorithm show a strong correlation to the pure capacity losses and thus provide a new way to determine the capacity values of each cell individually without disassembling the battery.
1. Introduction
Battery systems are becoming increasingly important due to climate change and the associated trend towards using renewable energies. With the aim of reducing fossil fuels and creating an environmentally friendly mobility sector, battery systems are already playing a major role in the electrification of vehicles. In this segment, lithium-ion batteries have gained acceptance in recent years due to their energy and power density. To meet the power requirements at tolerable currents, several lithium-ion cells are connected in series in a battery to achieve a higher system voltage. The first generation of vehicles with a terminal voltage of 800 is already in use today [1]. Here, almost 200 lithium-ion cells are connected in series. However, with a series connection of lithium-ion cells, the parameters of the individual cells may differ, with the weakest cell limiting the usable capacity of the entire battery [2]. Due to variations in manufacturing, CtCV can already be seen immediately after production [3]. By improving the production process and increasing the time-consuming quality control during cell selection, CtCV in a battery system can be minimized. However, with increasing operating time, lithium-ion cells show significant signs of aging, leading to a decrease in energy and performance [4]. The various aging mechanisms are highly dependent on external conditions [5,6,7]. Inhomogeneous conditions, e.g., temperature differences due to insufficient cooling, which is generally caused by the size of the battery system [8], can lead to an increase in CtCV during aging [9]. Furthermore, parameter variation of aged single cells can also be measured under identical external conditions [10,11]. Due to the CtCV within the battery, it is inevitable that the worst cell will negatively affect the capacity of the entire system, as only the worst cell can be fully discharged [12]. Compared to the literature on CtCV among new cells and aged single cells [3,10,13,14,15,16], only a few articles focus on CtCV in a battery. Some studies have investigated the impact of CtCV in a parallel connection of cells [17,18]. Other studies focus on aging behavior and CtCV in commercial or self-built battery modules. For example, Campestrini et al. [19] compared the aging of a self-built passively balanced module (8s14p) with the aging of single cells. In the work of Oeser et al. [20] the CtCV of cells in 20 different aged e-bike batteries was investigated. Due to the different module structures in each work, there are always different external conditions that have an influence on the aging and on the CtCV results. The presented study investigates the effects of CtCV within a series connection of cells independent of module design and assembly influences such as inhomogeneous temperature and contact resistances. Therefore, the results of the work are mainly driven by the intrinsic factors on the aging of individual cells and the influence of the cells on each other caused by the operation as a module.
In addition, this paper deals with the estimation of the capacity values of the individual cells in a module, an area that is also sparsely represented in the literature. Most papers dealing with the determination of capacity or the estimation of the State of Health (SoH) can be divided into two categories. On the one hand, studies have tried to estimate the SoH by comparing cell behavior with reference data collected offline. For example, Ansean et al. [21] compares the peak regions of an incremental capacity curve recorded online with data recorded offline to identify different aging mechanisms. Yang et al. [22] analyze the capacity and power degradation by comparing the voltage response during a current pulse with the voltage response from reference data. However, these approaches have the disadvantage that the analysis only gives meaningful results in the range of the reference data. On the other hand, capacity values are determined by an approach based on State of Charge (SoC) estimations. The capacity values are calculated based on two different SoC of each cell and the charge transferred between these two states [23,24]. However, an accurate cell model is required to estimate the SoC when the capacity of the cell is not known. This cell model has to be adjusted as the cell ages. With a large number of cells, this results in an enormous computational effort [25,26,27]. With accurate information about the individual cells and their aging, the performance of the whole battery can be optimized [28,29]. This work investigates whether an active balancing algorithm can be used to determine the capacity of individual cells.
This paper is organized as follows. First, the experimental setup is presented, the selection of the used cells is explained and the test sequence is described. Then, the aging processes of individual cells are evaluated and the aging effects are discussed using a reference measurement, Differential Voltage Analysis (DVA), Electrochemical Impedance Spectroscopy (EIS), and a relaxation measurement. Afterwards, the active balancing system used is described and its possibilities for optimizing the capacity utilization of the entire battery as well as for determining the individual capacity values are presented. Finally, the results are summarized and possible future work is explained.
2. Experimental Section
2.1. Experimental Setup and Cell Selection
The battery test system used in this work is a Cell Test System (CTS) from BaSyTec with a voltage range of 0–5 V with an accuracy of and a current range of with an accuracy of . All measurements in this study were performed in a climate chamber at a controlled ambient temperature of 25 . EIS was performed with a Gamry reference 3000 potentiostat in combination with a booster. Commercial NMC/graphite cells from Samsung SDI, labeled ICR 18650-26J [30], were used in this study.
For the experiment, eight cells were selected from a pool of 200 cells of the same batch. For this purpose, the 200 cells were first measured and the nominal capacity values were recorded using the standard test cycle described in the data sheet [30]. The standard test cycle consisted of a Constant Current (CC) and Constant Voltage (CV) charge with 0.5C to the end of charge voltage of and a termination current of 20 , followed by a discharge with C to the end of discharge voltage of . According to the data sheet, 1C corresponds to a current rate of [30]. The test cycle had been extended by a CV discharging phase in addition to the CC discharge with a termination current of . The CV phase at the end of the discharge compensates for the influence of the internal resistance and allows us to measure the entire capacity.
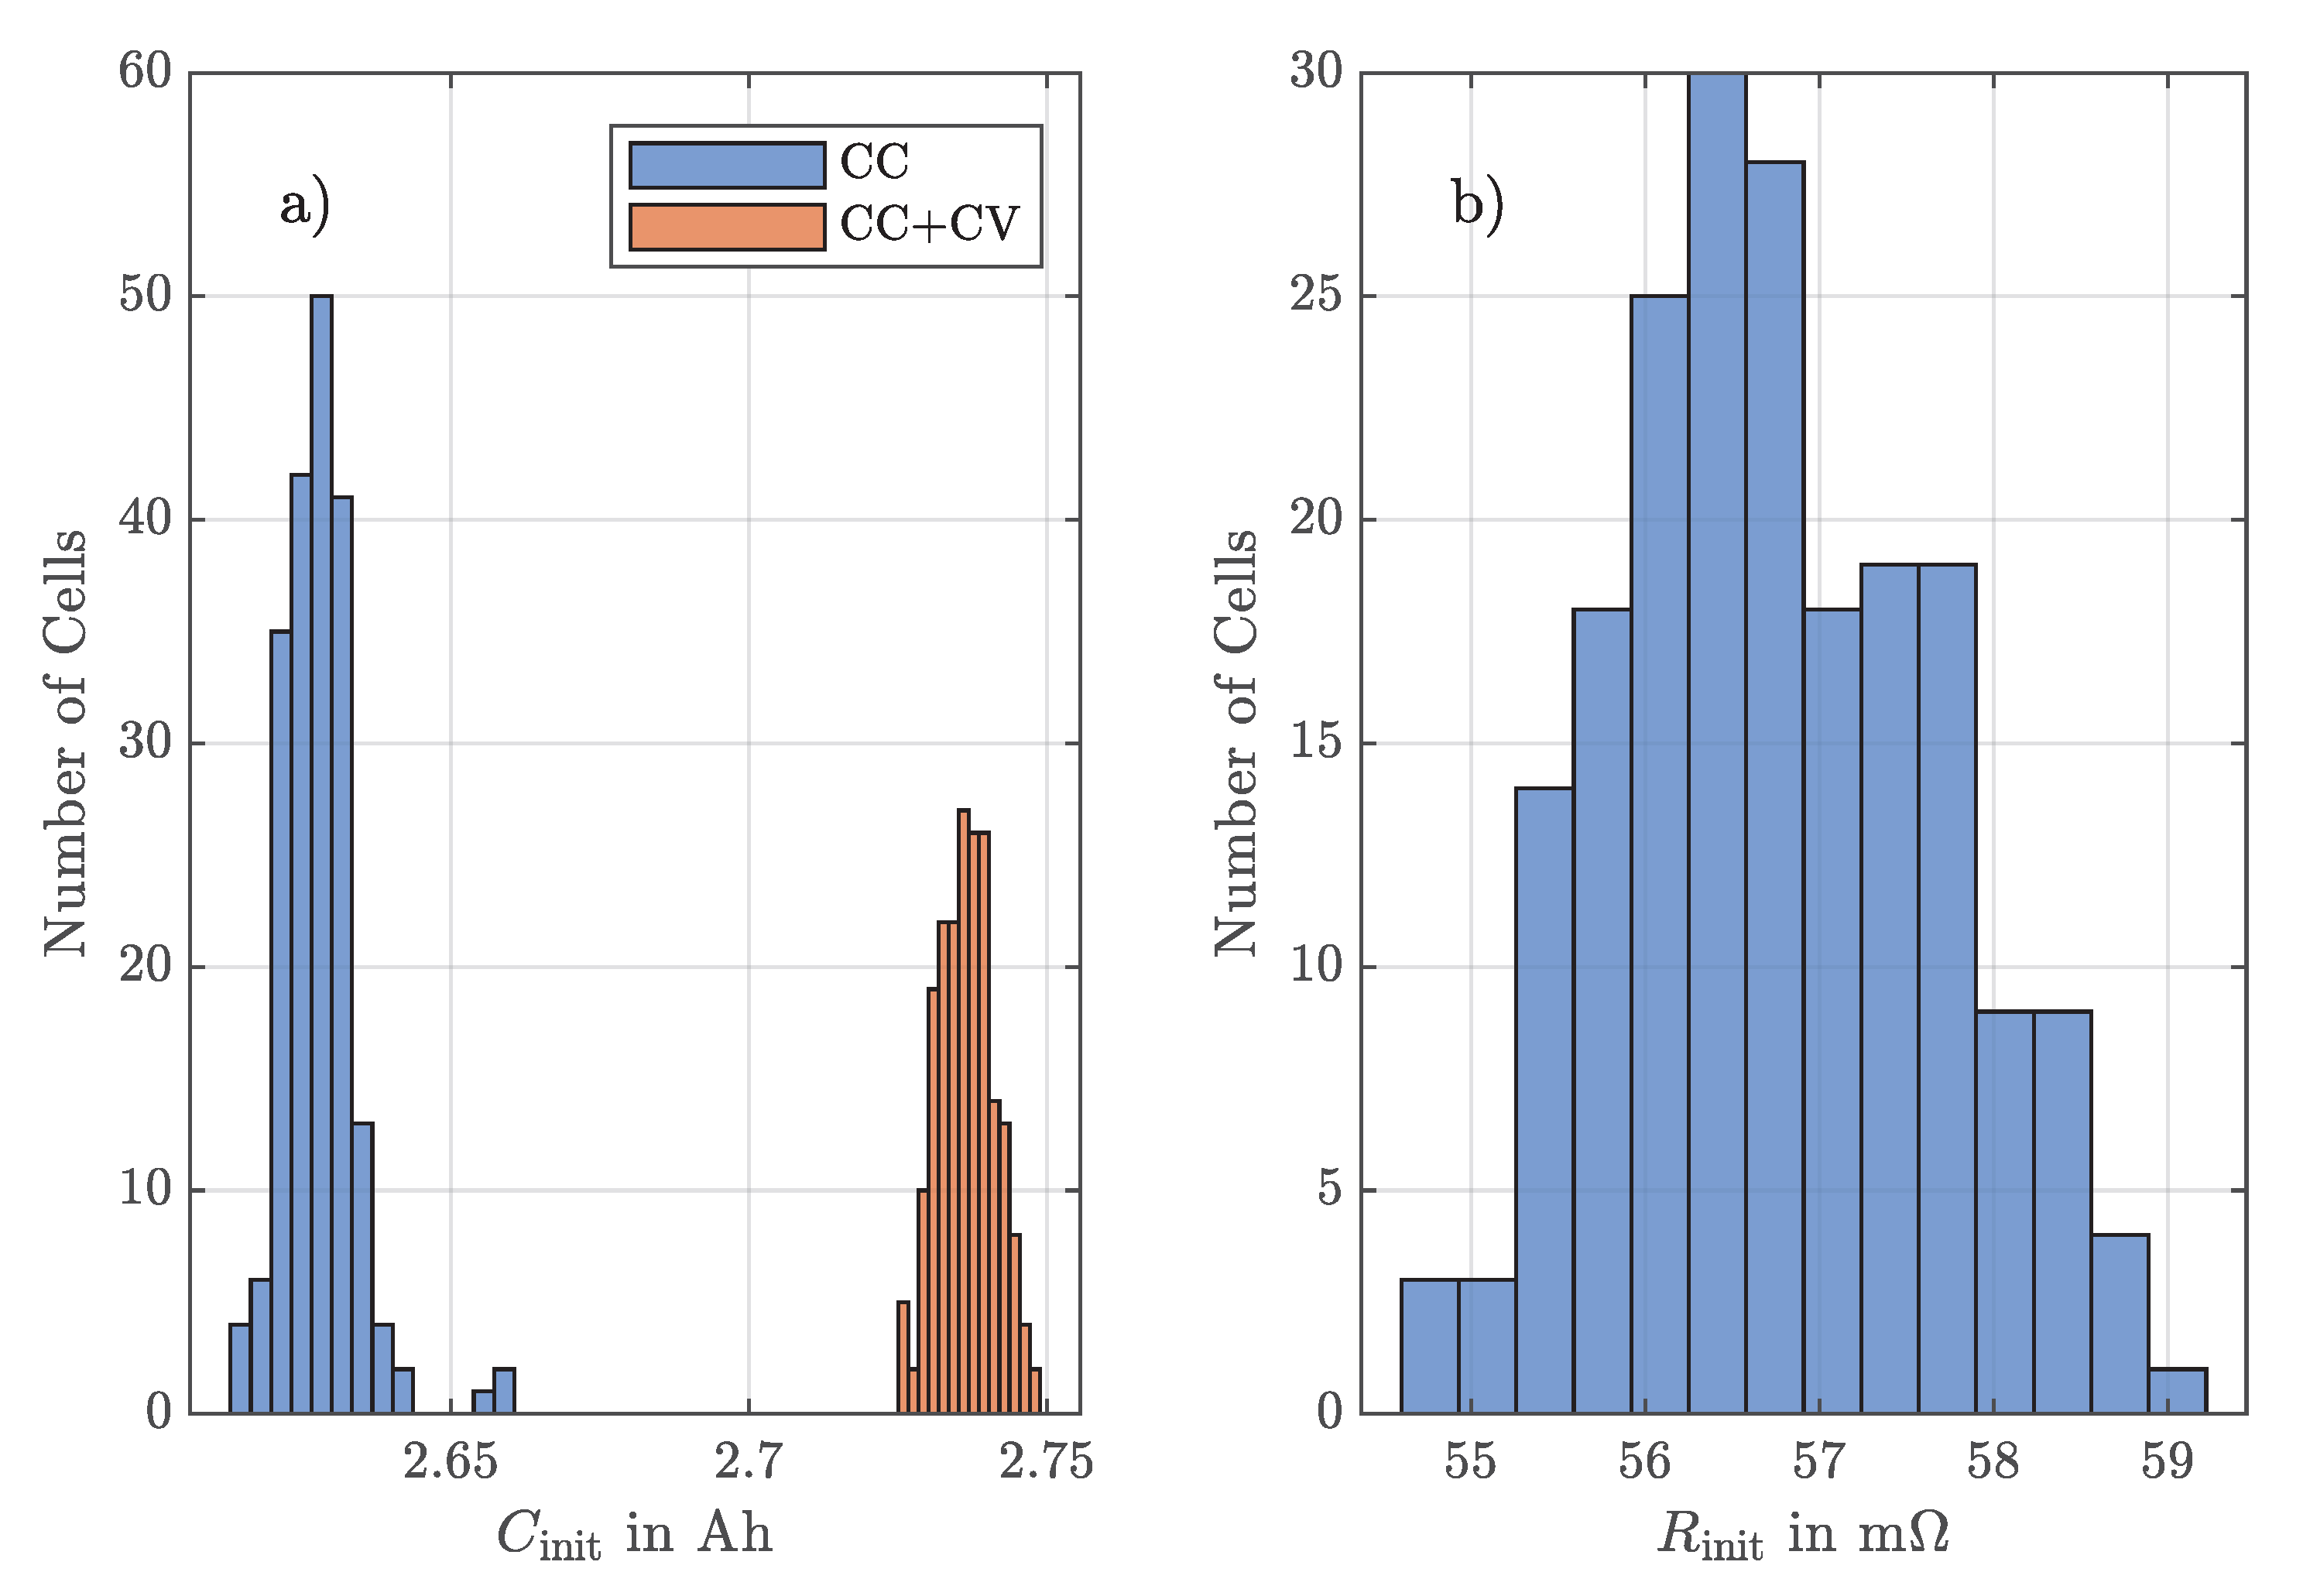
Figure 1a shows the distribution of capacity values with CC discharge and with CC+CV discharging phase. The distribution corresponds to a normal distribution for all data. The average value of the capacity values measured is with a standard deviation of . With the additional CV phase the average value of the capacity values is with a standard deviation of . As expected, the mean value is slightly higher and the standard deviation slightly lower due to the independence from the internal resistance. Figure 1b shows the distribution of the internal resistance of the cells. The internal resistances were determined by the current step response method. In the current step response measurement, a change in the cell voltage is caused by the application of a current pulse for a defined time. The internal resistance can then be calculated via the voltage change and the intensity of the current pulse [5,31]. The internal resistances were calculated at an SoC of 100% with a pulse discharge of 1C after 1 . The mean value is with a standard deviation of .
From this pool of 200 cells, 8 cells were selected that had similar data. Oeser [11] shows that significant results on CtCV can be obtained in single-cell tests with 8 cells. For the aging test, these cells were connected as an 8s1p module. In order to minimize the influences of an imperfect module assembly and imperfect module design, the cells were not welded together, but were connected individually to 8 channels of the CTS and placed spatially separated from each other in the climate chamber. In order to operate the cells as a module, they were virtually connected by the test plans, to run all cells simultaneously and synchronously. For this purpose, the test plans ensured that each cell has the same current load and thus the same current throughput over the entire test, and that the discharging phase is stopped for all cells as soon as one cell reached the specified end of discharge voltage. In addition, the test setup simulated a passive balancing method during charging. Here, each cell had its own CV phase at the end of the charging process, in which the cells could be fully charged. The charge was then stopped when all cells had reached the defined termination current. This setup offers a few advantages for the intended test. First of all, influences due to improper construction of the module and the housing or improper cooling were avoided. Thus, the results of the aging test can be fully related to the aging of the cells and the influence of the cells on each other caused by the operation as a module. Second, this setup provided the ability to perform individual capacity checkup tests of the cells during the aging test.
2.2. Test Sequence
In the following, the aging test sequence and the test sequences for characterization are described. All tests described were carried out at a constant ambient temperature of 25 . In the aging test, the cells were continuously stressed with a defined cycle until one cell reaches 60% of the capacity of the first cycle. Each cycle consists of a CC discharge and a CCCV charging phase both with a current load of 1C. After each charging and discharging phase there was a pause of 10 in which the cells rest. The discharging phase was stopped for all cells when one cell had reached . Charging was performed to a voltage of and a termination current rate of 0.02C. The cells had an independent CV charging phase which represents a passive balancing of the battery pack. The charging phase was completed when all cells reached their termination current rate. Since there are not many studies on this topic, the test conditions were chosen relatively simply to provide a good basis for further studies. After every 20 cycles, an independent capacity checkup test was performed. Here, the cells were independently stressed with the same cycle as described above. The difference is that the worst cell did not limit the discharging phase of the other cells and therefore the capacity of each cell could be measured. After the end of the test, an active balancing algorithm was applied to the module and the module was then again stressed with the same cycle. A detailed description of the active balancing algorithm is given in Section 3.6.
Characterization was performed before and after the aging test. The characterization of the cells consists of reference measurement, DVA, EIS, and relaxation measurement. The characterization was used to obtain a deeper insight into the aging mechanism of the cells. The test sequence for the reference measurement is identical to the initial test measurement of the 200 cells described in Section 2.1. For DVA, the open circuit voltages of the cells were recorded by discharging the 8 cells independently with a small current rate of 0.01C. DVA offers the possibility to identify different capacity loss mechanisms. In order to evaluate the aging of the internal resistance of the individual cells, EIS was performed. The EIS measurement allows analyzing the dynamic behavior of the cell in a wide frequency range. The loss processes of a lithium-ion cell can be separated by their characteristic frequency. The EIS measurement was performed at a SoC of 50% over a frequency range from 10 to 10 with a voltage amplitude of 10 . The measurement was performed galvanostatically; however, the amplitude of the input current was continuously adjusted to achieve the voltage amplitude of 10 . To analyze whether the cells had suffered lithium plating, a relaxation measurement was performed at the end of the aging test. Therefore, the cells were independently discharged with a CC of 1C to the end of discharge voltage of and then charged with a CC of 1C to . During the subsequent pause, the voltage relaxation was recorded.
3. Results and Discussion
3.1. Aging Test
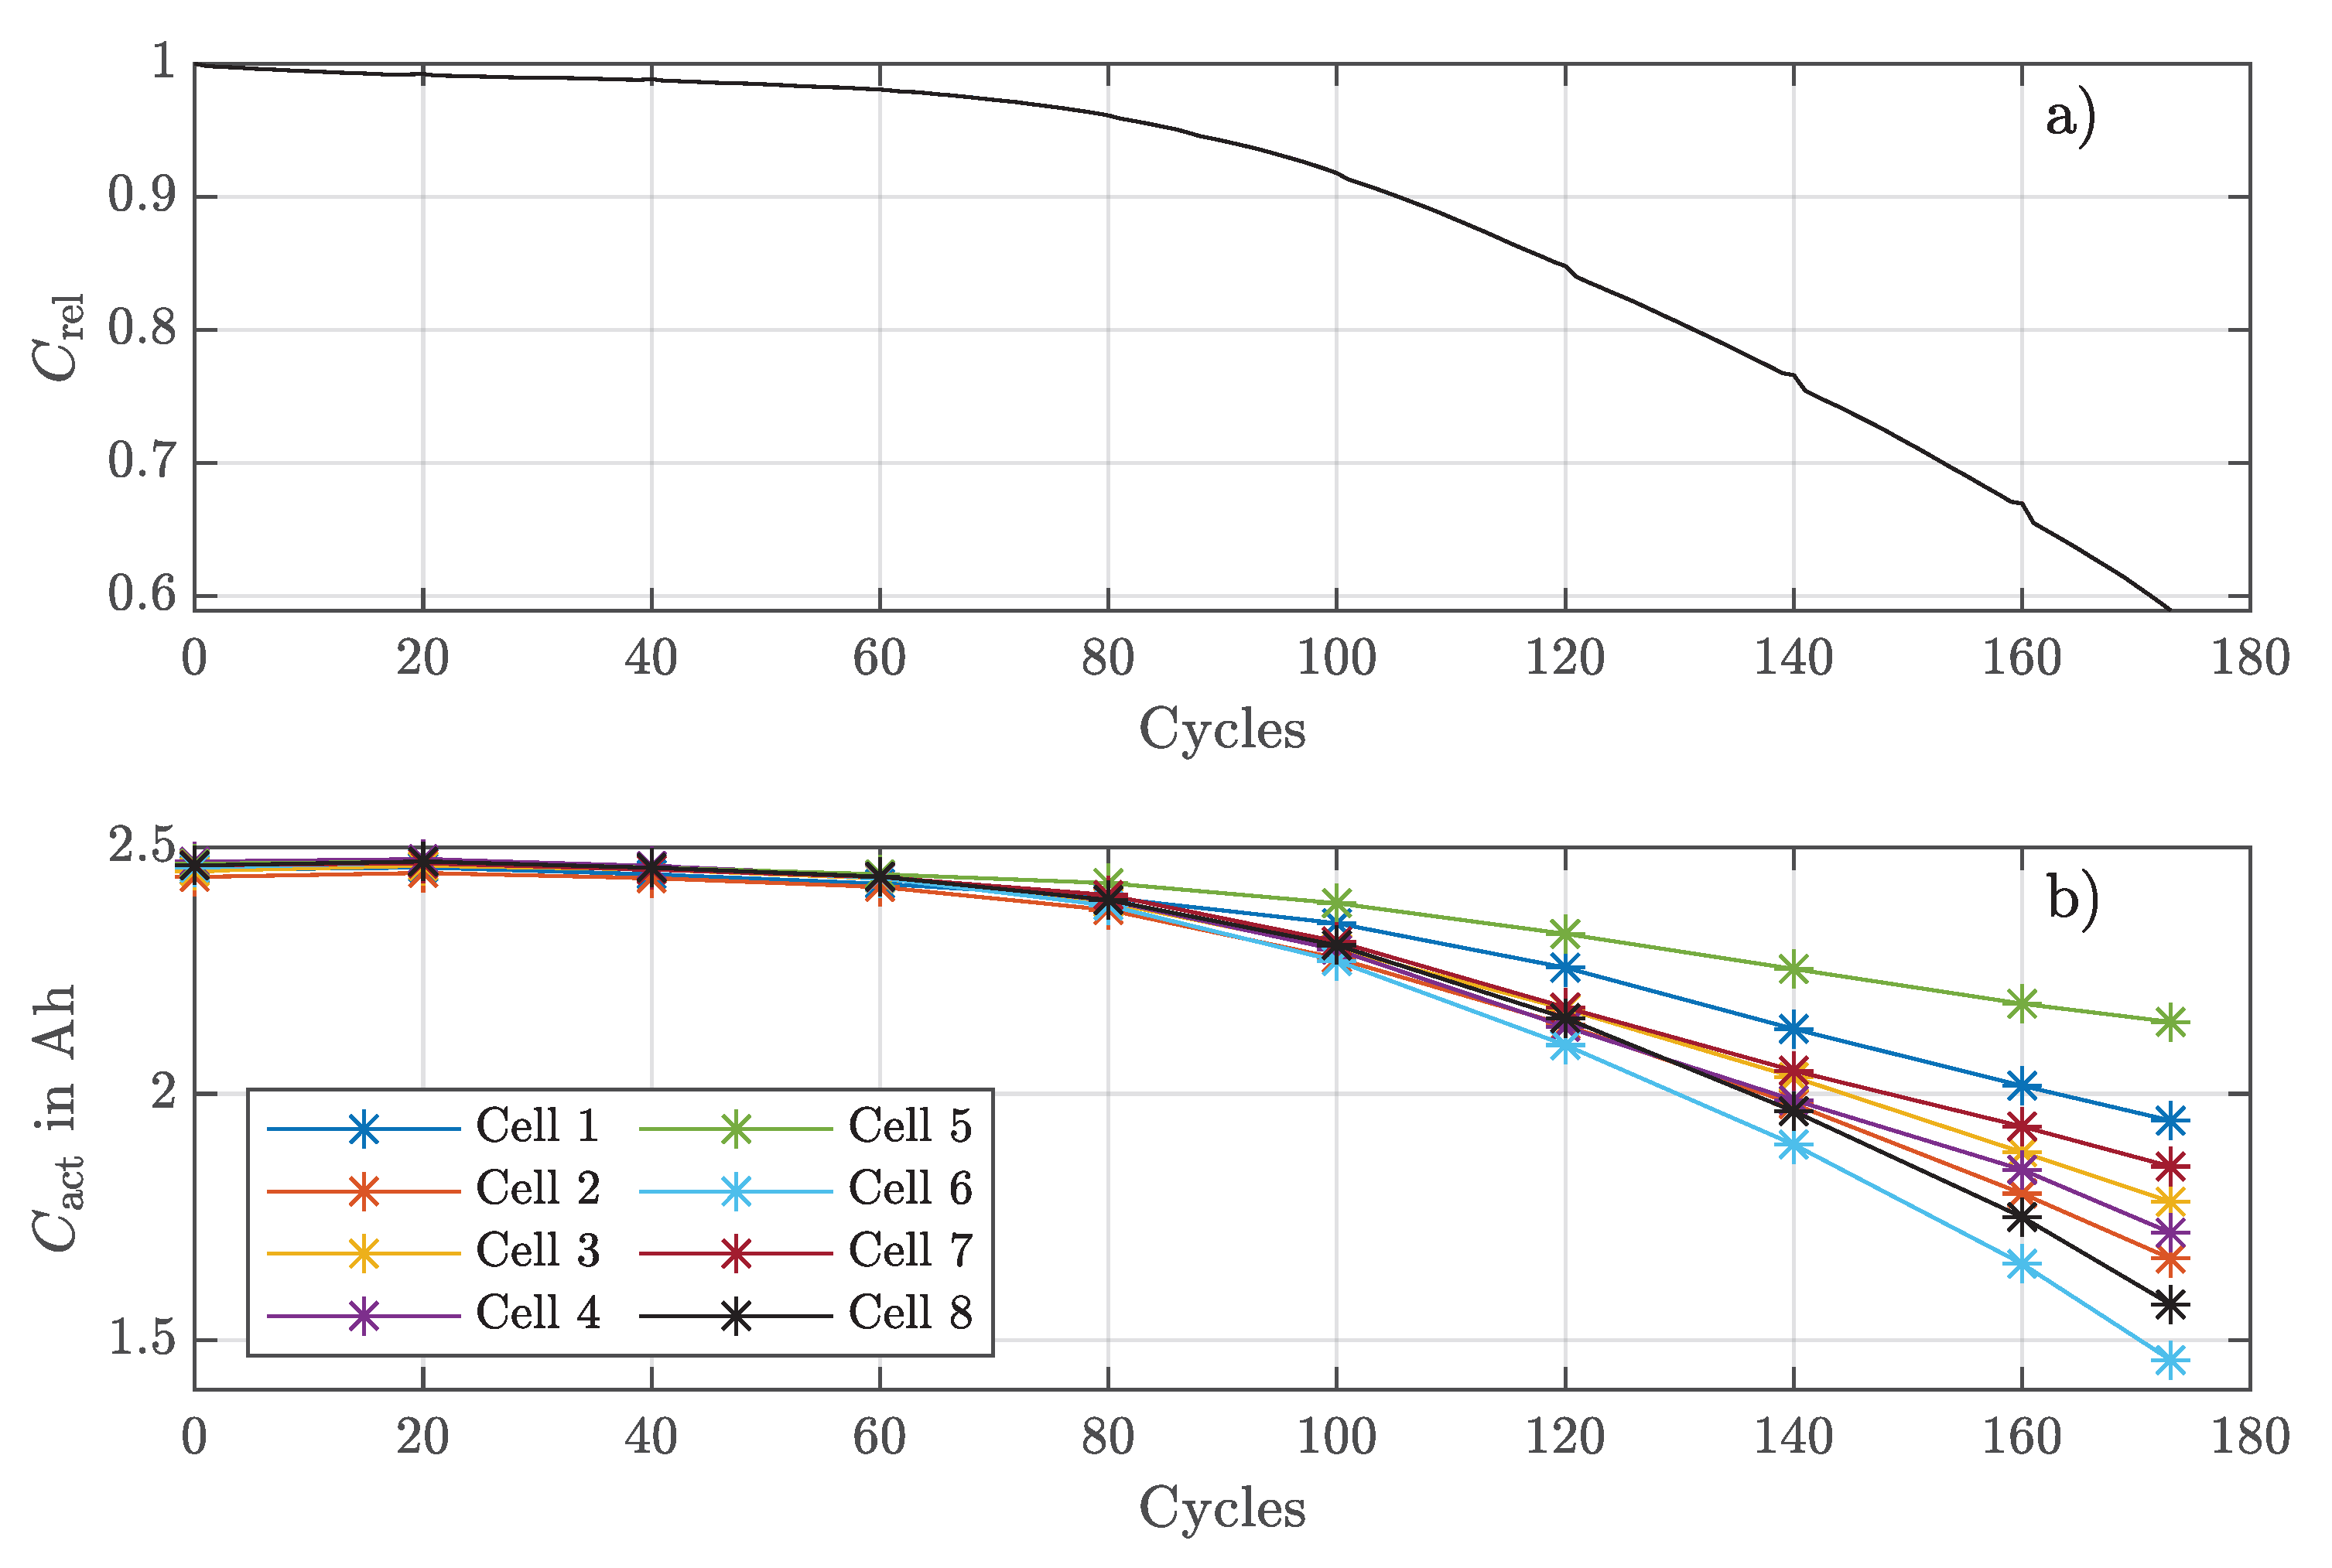
In the following, the results of the aging test are presented and discussed. The color coding of the eight cells is the same in each figure for simple visualization. Figure 2 shows the relative capacity of the 8s1p battery module as well as the absolute capacity values of the individual eight cells, which were recorded at the beginning and at the end as well as every 20 cycles by the independent capacity checkup measurement. The end of the test was reached after 174 cycles when the worst cell reached a residual capacity of 58.9%. The capacity of the battery pack logically corresponds to the capacity of the respective worst cell of the battery. Since the load in this test was higher than the load in the capacity measurement from Section 2.1, the initial capacity values are slightly lower. The course of the capacity reduction can be clearly divided into two sections. In the first approximately 60 cycles, the aging rates of all cells are quite linear and the capacity of each cell remains relatively constant. After 60 cycles, the capacity reduction in the module is only about 2%. The second section shows an exponential nonlinear capacity loss of some cells, which is reflected in the course of the module capacity due to the dependence on the worst cell. Capacity reduction in this section is 39% in 114 cycles. The nonlinear aging process is often described as a result of the occurrence of lithium plating [32,33]. In [34], other possible factors besides lithium plating, such as electrode saturation, resistance growth, and mechanical deformation, that can lead to nonlinear aging are listed. With the onset of nonlinear aging, the capacity curves show an increasing spread as the aging rate of each cell differs significantly, resulting in the worst cell having a capacity of (59%) and the best cell having a capacity of (87%) at the end of the aging test.
Not only are the increasing aging rates of the individual cells different, but the course of cell 5 (green curve) also shows a slightly decreasing aging rate during the last 14 cycles. This can be attributed to the fact that the cells with higher capacity exhibit progressively lower DoD. Figure 3 shows the voltages of the eight individual cells when reaching the end of discharge in each cycle. The end of the discharging phase is reached when one cell of the 8s1p battery module reaches the end of discharge voltage of . The voltage spread of the individual cells shown in Figure 3 at this point is due to the fact that the cells have different capacities and internal resistance values. Since the cells have the same starting point at at the beginning of the discharging phase and the same load current during the discharging phase, the cell that reaches the end of discharge voltage has the weakest combination of capacity and internal resistance. The stronger cells in the module still have residual capacity, and thus, higher voltages at end of the discharging phase. In the first cycles, the voltages converge a bit and have a minimum deviation of 150 after 50 cycles. The voltage spread then grows to 600 by the end of the aging test. The growth of the voltage spread indicates the increasing CtCV in terms of capacity and internal resistance. Especially with the onset of nonlinear aging, the voltage spread increases rapidly. Figure 3 also shows the decreasing DoD of the cells with higher capacity. In addition, the graph clearly shows a change of the limiting cell after 94 cycles. This indicates that the cell with the worst parameters at the beginning is not necessarily the worst cell throughout the entire lifetime. In [35], no correlation was found between the initial and final parameters of aged single cells. The results of this work show that even if the cells are connected in series and the initial worst cell is subjected to higher stress in the first 94 cycles due to the lower DoD, there is no correlation between the final values and the initial values.
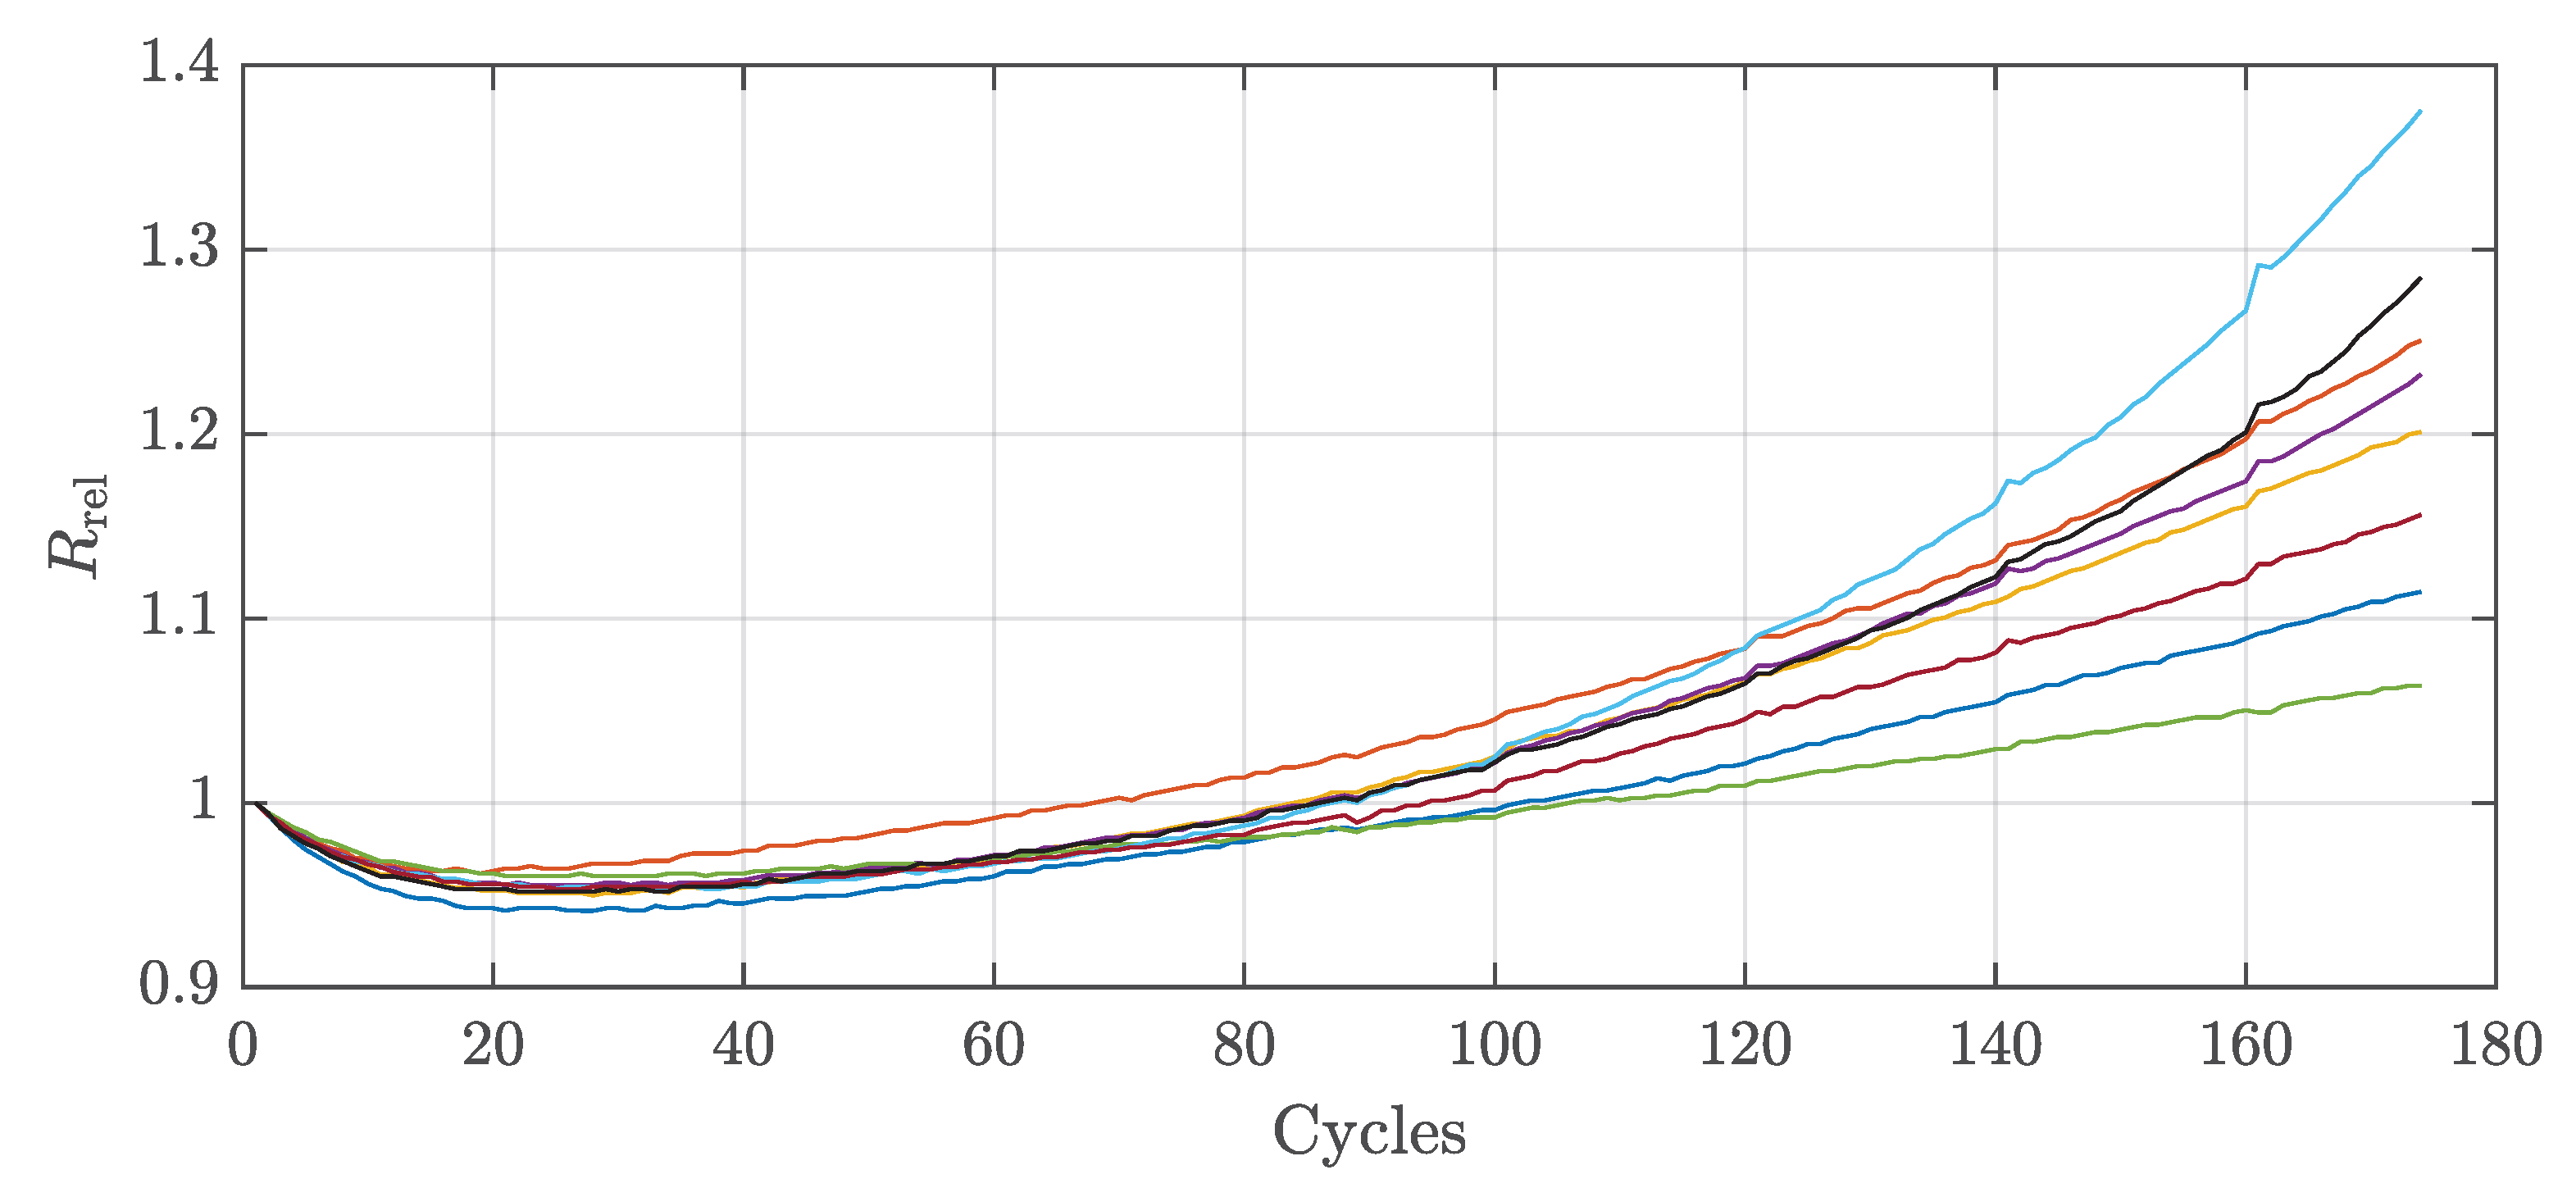
Figure 4 shows the relative internal resistance of each cell over the entire aging test. The resistance was calculated at 100% SoC and 1 after the load was applied. For the first approx. 30 cycles of each cell decreases to about 95%. The resistance then increases again and at the end of the test the worst cell has a value of 137% and the best cell has a value of 106%. A decrease in internal resistance was also observed in [31,36] and was associated with the impedance of the anode. At the end of aging, the order from the worst to the best cell is identical for both the internal resistances and the capacity values of the cells. However, in order to obtain information about the capacity of each cell during operation, the recording of the internal resistances is only suitable to a limited extent, since the order of the internal resistances and the capacity values do not correspond consistently. Both parameters show an increasing CtCV value with the onset of nonlinear aging.
3.2. Reference Test
Characterization before and after the aging test are compared below. Table 1 and Table 2 show the capacity and internal resistance values from the reference test as well as the mean values and standard deviations . The capacity values are measured here with an additional CV-phase at the end of the discharging phase as described in Section 2.2 to obtain the pure capacity values independent of the internal resistance. The internal resistances were calculated at an SoC of 100% with a pulse discharge of 1C after 1 .
As expected, the comparison of Table 1 and Table 2 clearly shows the reduction in capacity, the increasing internal resistance, and the increase in CtCV for both values after the aging test. For better comparison the Coefficient Of Variation (COV) is calculated. (Compare Equation (1)).
The values from Table 1 result in a COV of for the capacity and for the internal resistance. Similar values for new cells can be found in the literature [3,11,15,37,38,39]. The values from Table 2 result in a COV of for the capacity and for the internal resistance. The results show that the variation of the capacity increases more than that of the internal resistance. In contrast to the initial values from Table 1, which show no correlation, the final values from Table 2 show a strong correlation. The Pearson correlation factor between and is here at .
3.3. Electrochemical Impedance Spectroscopy
For a more detailed analysis of the growth of the internal resistance, EIS measurement was used. The test procedure is described in Section 2.2. Figure 5 shows the impedance spectra of the 8 cells at 50% SoC before and after the aging test.
The impedance spectrum can be divided into several frequency sections. At high frequencies the measurement shows an inductive behavior. This behavior is mainly caused by the inductive influences of the measurement setup as well as by the geometry of the cell, especially by the skin effect in round cells [40,41]. At low frequencies, there is a steeply rising branch caused by diffusion processes that cannot be fully detected by EIS [31]. Important for the observation of the aging processes are the capacitive range and the point with Im. The crossing point indicates the pure ohmic resistance part [40,42]. For the cell used in this work, this occurs very close to 1 . After the aging test, an increase in ohmic resistance is observed for all cells. It is worth noting that the cell with the highest capacity does not have the lowest ohmic resistance at this point. However, the increase in ohmic resistance was the lowest for this cell. In the capacitive region of the Nyquist plot only one semicircle is visible before the aging test and after the aging test another overlapping semicircle becomes visible. The semicircles are caused by the charge transfer resistance of the electrodes and the double-layer capacitances created by the interfaces between the surface film and the particles of the electrodes [43]. The newly visible semicircle in the aged state at a slightly higher frequency can be attributed to the increasing charge transfer losses due to the growth of the Solid Electrolyte Interphase (SEI) [5]. The increase in the other semicircle can be attributed to a deterioration of the charge transfer at the cathode [5,31]. The deterioration of the charge transfer is due to the formation of a surface film on the cathode or to a change in the structure of the cathode [44]. The increase in charge transfer resistance is favored by a lower DoD since a low SoC in particular leads to high mechanical stresses that can damage the layer structure of the electrodes [43]. The maximum of the predominant charge transfer semicircle occurs close to 38 for the new cells and shifts to lower frequencies with increasing age. For a quantified evaluation, the values and are used. results from the intersection of the curve with the imaginary axis and represents the purely ohmic behavior of the cell. is calculated from the distance from to the local minimum after the semicircles. The local minimum occurs close to when the cells are new and shows also a slight tendency to lower frequencies with increasing age. , therefore, represents the charge transfer resistance of the entire cell. These values are also often used for cell modeling [45]. and of the eight cells before and after aging are shown in Table 3 and Table 4.
The values from Table 3 result in a COV of for and for . The values from Table 4 result in a COV of and . The values show that the variation of the pure ohmic resistance increases only slightly, while the variation of the charge transfer resistance increases strongly.
Similar to the analysis in Section 3.2, the initial internal resistance values and show no correlation with the initial capacity values form Table 1. In contrast, both values and show a correlation with from Table 2. The correlation between and is about , while the correlation between and is at . In summary, despite the cells having the same charge throughput, there is a significant difference in their impedance, mainly due to the difference in charge transfer resistance, which shows a strong correlation to the final capacity values. This variation is favored by the different DoD resulting from the series connection of the cells.
3.4. Differential Voltage Analysis
The results of the DVA measurement are evaluated below to provide a deeper insight into the different capacity loss processes. The test procedure is described in Section 2.2. The decreasing capacity of a lithium-ion cell occurs either due to the degradation of the active material of electrodes or due to the loss of usable lithium transported between the electrodes [46]. Since the Open Circuit Voltage (OCV) curve is the superposition of the potential curves of the electrodes, the aging of the electrodes changes the OCV [47,48]. In the DVA, the derivative is calculated from a discharging phase with a small current and plotted over the SoC to better identify these changes. The step-shaped voltage curve of a graphite anode is particularly advantageous. The steps of the potential curve of the graphite anode caused by the stepwise intercalation of lithium show up as distinct peaks in the DVA curve [4,49]. Due to the homogeneous intercalation of lithium in the NMC cathode, no significant peaks of this electrode can be seen in the DVA, which makes its evaluation difficult [50]. Bloom et al. [51] concluded from the featureless curve of the NMC electrode that there is no first-order phase transition in this material. Therefore, for cells with NMC cathode and graphite anode, as in this work, the DVA is mainly used to determine the anode aging and the loss of usable lithium. From the literature, it can be assumed that the NMC cathode also suffers a capacity loss during operation; however, the literature shows that the NMC cathode is usually not a limiting factor of the capacity of the cell [31].
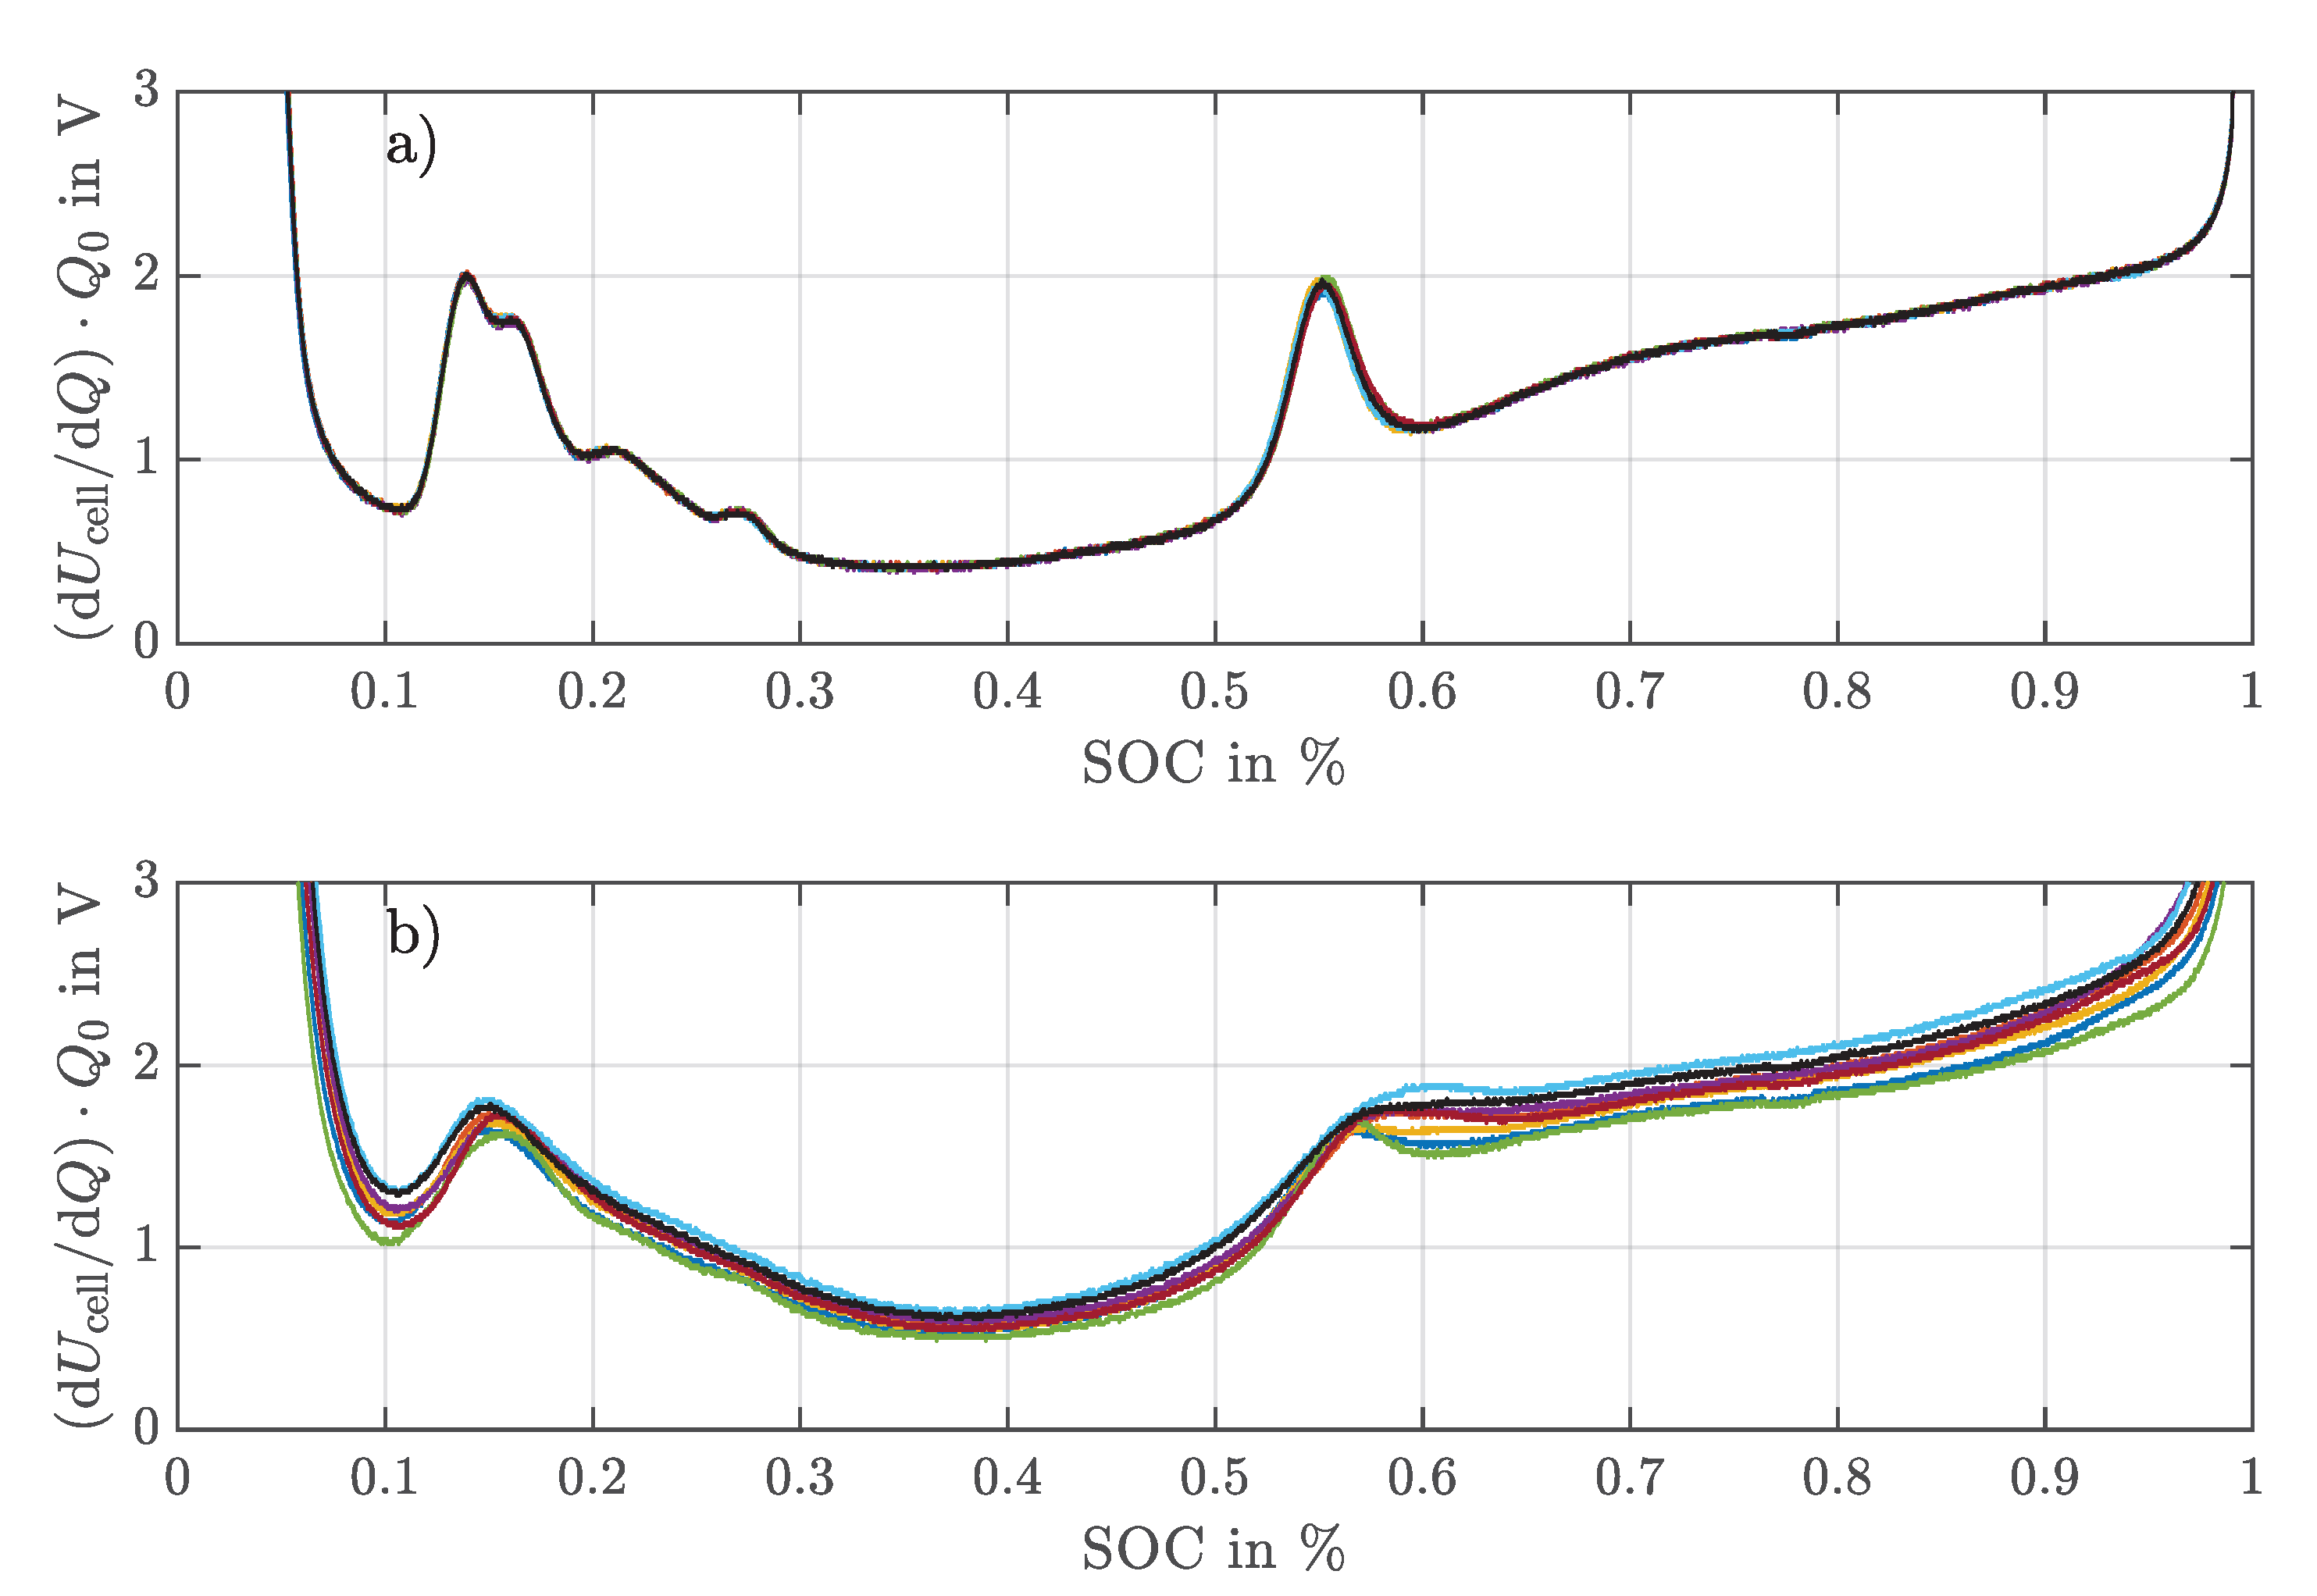
Figure 6 shows the DVA of all eight cells before and after the aging test. The plot shows a significant difference between the new state and the aged state. Most noticeably, the significant peaks of the graphite anode from the new condition are no longer clearly visible. The decrease in peaks was also observed in [5] and attributed to the unevenly aged anode. Due to the high load and the almost complete utilization of the cells, which leads to a high volumetric expansion, some anode areas are no longer accessible, and thus, the lithium is no longer homogeneously distributed. The inhomogeneous distribution leads to the fact that the characteristic potential curve of the entire anode no longer occurs [52]. The middle peak that occurs between 50% and 60% SoC for the new cells represents the phase transition from LiC12 to LiC6 of the anode and thus indicates when the graphite is 50% lithiated [53,54]. After the aging test, all cells still have a middle peak above 50% SoC. It can therefore be assumed that the amount of anode active material and thus the capacity of the anode is not the limiting factor for the capacity of the cells, either before or after aging. Assuming that the cathode is not limiting, it can be concluded that the limiting factor of the capacity is the loss of usable lithium. The loss of usable lithium is mainly due to the reaction of the lithium with the electrolyte that forms the passivization layers, or the electrical isolation of the lithium that can occur with heavy lithium plating. The change in the location of the peak can further be used to compare the rate of loss of usable lithium and loss of anode active material [31]. This peak is nearly unchanged for cells with higher capacity, indicating that both the usable lithium and the amount of active material of the anode have aged evenly in relation to each other. Cells with lower capacity show a slight shift of the middle peak towards higher SoC, which means that the loss of lithium is relatively higher than the loss of anode active material. A possible reason is that these cells suffer from lithium plating that causes a faster loss of usable lithium.
3.5. Relaxation Measurement
To support the assumption that both the nonlinear aging in Section 3.1 and the shift of the middle peak to a higher SoC in the DVA may be caused by the occurrence of lithium plating, the results of the relaxation measurement are described below. The relaxation measurement was performed after the aging test with all eight cells and compared with a measurement of one new cell from the same batch. Lithium plating is the deposition of metallic lithium on the anode surface. In this undesirable side reaction, lithium is not intercalated in the anode, but the lithium atom is deposited under the SEI on the anode surface [55]. The condition of the plating reaction is not fully understood in the literature and continues to be debated. The most common definition is that lithium plating occurs when the overvoltage at the electrode () exceeds the equilibrium potential of the anode () [56]. (Compare Equation (2)). Lithium plating therefore only occurs during the charging of the cell. Favorable conditions for lithium plating are low temperatures [57,58], high charging currents [59] as well as a low anode potential, which depends on the level of lithiation [60].
The deposited metallic lithium is initially completely reversible [61]. The deposited lithium can either intercalated into the active material after charging or can emit an electron again during a subsequent discharge and move to the cathode as a lithium-ion, which is called lithium stripping [60,62]. A condition for the reversible reaction is that there is electrical contact between the metallic lithium and the anode and that the metallic lithium is within the SEI. Reversible lithium plating does not result in a loss of usable lithium and therefore not in a decreasing cell capacity. However, increased deposition can cause the SEI to be punctured and the metallic lithium to come into contact with the electrolyte. The electrical contact leads to a reduction in the electrolyte and reformation of the SEI, which in turn leads to irreversible capacity reduction, a decrease in ionic conductivity, and a reduction in anode porosity [63]. In addition, with heavy deposition, lithium located directly on the graphite surface can be dissolved more rapidly than lithium located further inside the SEI. When the deposited lithium loses electrical contact with the anode, the lithium becomes electrically isolated and inactive, which is then referred to as dead lithium [64]. Deposition onto the graphite surface also results in higher volume expansion than intercalation into the active material, imposing additional mechanical stress on the components of the cell [65].
In relaxation measurement, lithium plating is indirectly determined by the voltage of the cell during the relaxation phase. The cell voltage shows a plateau at the beginning of the relaxation phase if lithium plating has occurred in the previous charging phase. This plateau is caused by a mixed potential of the anode potential and the potential of the deposited lithium. Due to the intercalation of the lithium in the anode, this plateau decreases during the resting phase. For better illustration, the derivative of the cell voltage is formed. The measurement method was verified by using neutron diffraction in [60].
Figure 7a shows the voltages of the aged cells and new cells (dashed line) in the resting phase after charging. Figure 7b shows better visualization of only the voltage derivative of the best cell, the worst cell, and the new cell. Despite the fact that the voltage curve of all aged cells is lower than that of the new cells in the resting phase, which can be explained by the increased internal resistance, some aged cells show a significantly different curve. In particular, the worst cell (blue line) shows a clearly flattened section that seems to merge into a plateau. This difference becomes especially clear in the derivation. In Figure 7b, the curve of the worst cell shows a clear plateau in contrast to the best cell and the new cell, which have almost exactly the same shape. The results indicate that lithium plating most likely occurred at the worst cell but not at the best cell, even though the cells had the same charge throughput and were operated at a controlled ambient temperature of 25 . The increased aging rate of the better cells, where no clear signs of lithium plating were detected, may be due to the measurement method reaching its limits, as it is based on the detection of reversible lithium plating. This could mean that despite the absence of reversible lithium plating, irreversible lithium plating may have occurred in small quantities. Other possible reasons such as increased internal resistance and mechanical deformation could also have been a factor for the nonlinear aging [34].
3.6. Active Balancing Algorithm
After the aging test, the battery is equipped with an active balancing system. The basic principle of an active balancing system is to charge or discharge individual cells and redistribute the charges to the other cells [66,67]. In the following test, no additional balancing hardware was used; instead, the balancing strategy was implemented directly in the test sequence of the cells with the help of the battery test system. This provides the opportunity to first evaluate the capabilities of an active balancing algorithm independent of any possible limiting hardware. In addition to providing the main load, the battery test system was used to simulate the balancing topology. The system simulated a balancing topology that could additionally charge and discharge all cells at any time while ensuring charge equality in one charging or discharging phase. This emulated topology is based on the multiple bidirectional flyback converter topology.
The implemented balancing algorithm is based on an iterative calculation of the balancing charges, which indicates the amount of charge that must be balanced at each cell to fully discharge the entire battery. The main goal of the developed capacity-based algorithm is to ensure that each cell reaches the end of discharge voltage in order to optimize the capacity utilization of the battery. The capacity optimization has already been shown in a previous work of the authors [68]. At the end of every discharging phase the balancing charges are calculated as follows:
Here, and are only an approximation of the real average SoC of all cells and the real SoC of the respective cell(i) at the end of discharge. This approximation is realized by a stored OCV curve and a voltage measurement of the cells at the end of the discharging phase. However, the deviation from the real SoC is compensated with the iterative factor , which indicates the balancing charges of the previous cycle. The capacity of the battery is calculated with the load current of the module over the duration of a complete discharging phase. After a few cycles of recalculation of the balancing charges by the iterative algorithm, the capacity of the battery reaches a maximum equal to the average capacity of the individual cells. Once the balancing charges are optimized, all cells reach the end of the discharge voltage.
Figure 8 shows the voltage curves of all eight cells with active balancing and optimized balancing charges. Here, all cells reach the end of discharge voltage, maximizing the usable capacity of the battery. Since the balancing charges are calculated in the previous cycle, the balancing starts at the beginning of the discharging phase. The steps in the voltage curves are therefore caused by the additional load due to active balancing. Figure 8 shows that the best cell was additionally discharged for the longest time and the worst cell was supported for the longest time in order to reach the end of discharge voltage. Considering [69], the balancing current was set to 2 , which allows us to fully balance the battery in the discharging phase.
The balancing charges can additionally be used to calculate the capacity of each cell when the balancing was successful and all cells have reached their end of discharge voltage. The balancing charge is basically the deviation of the capacity of cell(i) from the average capacity of all cells. The capacity of each cell can be calculated as follows:
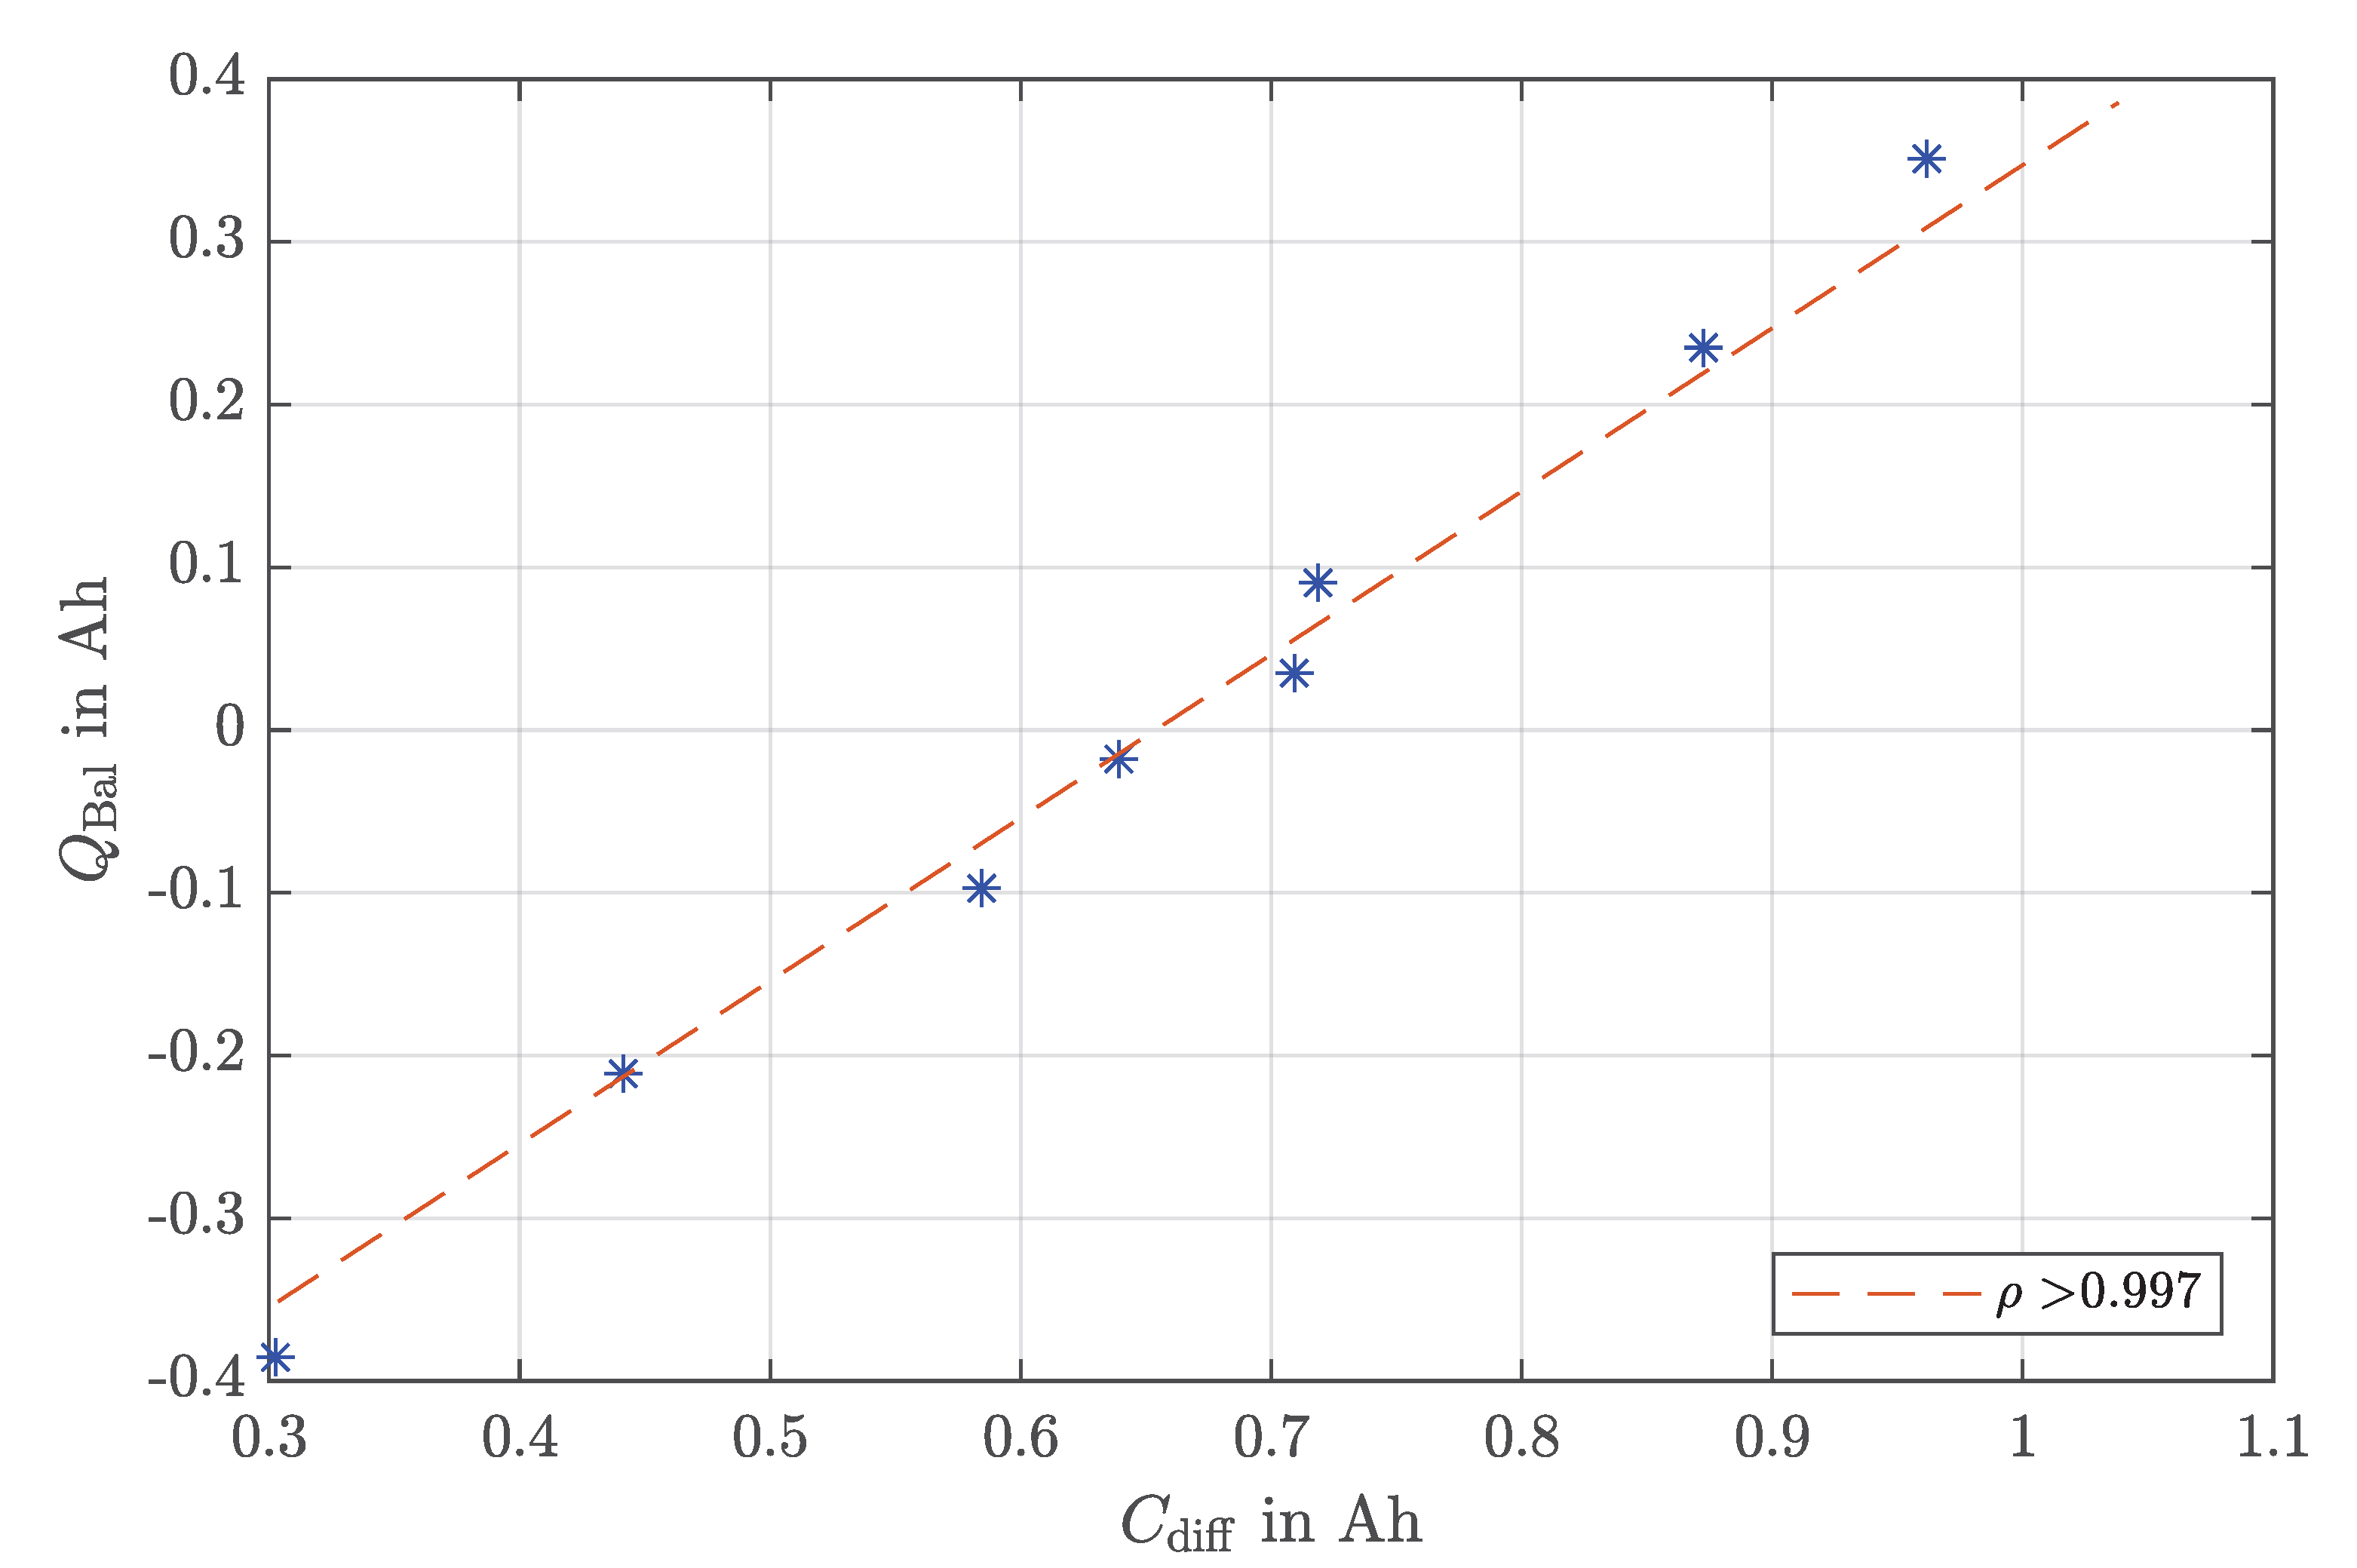
As seen in Section 3.1, the capacity of a lithium-ion cell depends on the conditions of the cycle, so the capacity values calculated by Equation (4) are valid for the conditions in which the iterative algorithm was used. However, the pure capacity losses of the cells obtained by subtracting the capacity values from Table 2 and Table 1 also show a strong correlation with the balancing charges. The Pearson correlation coefficient is here . Figure 9 shows the strong correlation between the balancing charges used and the pure capacity loss of each cell.
The strong correlation indicates that despite the different internal resistances or possible different self-discharge rates, the biggest influence on the balancing charges is the different capacity losses of the cells. It can be concluded that in the context of the presented experiment, the balancing charges of an active balancing system can be used to determine the aging process of the individual cells during operation. With knowledge of individual cell capacity values and their development, it may be possible to detect lithium plating on individual cells as it leads to exponential capacity degradation.
4. Summary and Conclusions
In this work, the aging behavior of an 8s1p module with a load of 1C/1C under controlled ambient temperature was investigated. A focus was on the setup to avoid influences such as imperfect cooling or different contact resistances which can occur in the production of modules. Thus, the results are mainly driven by the intrinsic factors on the aging of the cells and the influence of the cells on each other caused by the operation as a module. After aging, the battery was also tested with an active balancing strategy. Furthermore, a detailed aging analysis was performed. EIS, DVA, and relaxation measurements were used to reveal different aging mechanisms within the battery module.
The results of this work show that despite a theoretically perfect module design, cells exhibit CtCV due to intrinsic factors and these are further amplified by the altered DoD values. The results of the EIS measurement show that the variation of the internal resistance is mainly due to the charge transfer resistance. The DVA results show that the capacity is limited by the usable lithium both before and after aging. Furthermore, lithium plating was detected after the aging in some cells. This shows that lithium plating can occur even under the same temperature due to the different aging rates of the cells. The aging rate is further increased by the occurrence of lithium plating, which then leads to an even higher CtCV. The active balancing showed a possibility not only to improve the capacity of the aged module, which can be advantageous in second-life applications, but also that the balancing charges show a strong correlation to the pure capacity losses of the cells. This can be used especially for the online characterization of the cells. Characterization with active balancing offers the advantage of being more independent of using several battery models or reference data when determining the capacity of individual cells. However, an accurate voltage and current measurement as well as the values of the balancing current are required. In addition, the battery must be discharged fully so that the iterative algorithm can calculate and adjust the balancing charges. Future work will therefore include further investigations with real balancing hardware and different external conditions to further investigate module aging and further validate this approach for determining parameter variation with an active balancing system.
Author Contributions
Conceptualization, T.H. and D.O.; methodology, T.H. and A.Z.; software, T.H.; validation, A.A. and D.M.-M.; investigation, T.H., D.O. and A.Z.; writing—original draft preparation, T.H.; writing—review and editing, T.H., D.O. and A.Z.; visualization, T.H.; supervision, A.A. and D.M.-M.; project administration, A.A. All authors have read and agreed to the published version of the manuscript.
Funding
This research received no external funding.
Conflicts of Interest
The authors declare no conflict of interest.
References
- Aghabali, I.; Bauman, J.; Kollmeyer, P.J.; Wang, Y.; Bilgin, B.; Emadi, A. 800-V Electric Vehicle Powertrains: Review and Analysis of Benefits, Challenges, and Future Trends. IEEE Trans. Transp. Electrif. 2021, 7, 927–948. [Google Scholar] [CrossRef]
- Zhang, J.; Ci, S.; Sharif, H.; Alahmad, M. Modeling discharge behavior of multicell battery. IEEE Trans. Energy Convers. 2010, 25, 1133–1141. [Google Scholar] [CrossRef]
- Dubarry, M.; Vuillaume, N.; Liaw, B.Y. Origins and accommodation of cell variations in Li-ion battery pack modeling. Int. J. Energy Res. 2010, 34, 216–231. [Google Scholar] [CrossRef]
- Käbitz, S.R. Untersuchung der Alterung von Lithium-Ionen-Batterien mittels Elektroanalytik und elektrochemischer Impedanzspektroskopie. Ph.D. Thesis, Rheinisch-Westfälischen Technischen Hochschule Aachen, Aachen, Germany, 2016. [Google Scholar]
- Keil, P.; Jossen, A. Aging of Lithium-Ion Batteries in Electric Vehicles. Ph.D. Thesis, Technische Universität München, Munich, Germany, 2017. [Google Scholar] [CrossRef] [Green Version]
- Liu, S.; Liu, X.; Dou, R.; Zhou, W.; Wen, Z.; Liu, L. Experimental and simulation study on thermal characteristics of 18,650 lithium–iron–phosphate battery with and without spot–welding tabs. Appl. Therm. Eng. 2020, 166, 114648. [Google Scholar] [CrossRef]
- Liu, L.; Zhu, M. Modeling of SEI Layer Growth and Electrochemical Impedance Spectroscopy Response using a Thermal-Electrochemical Model of Li-ion Batteries. ECS Trans. 2014, 61, 43–61. [Google Scholar] [CrossRef]
- Tang, A.; Li, J.; Lou, L.; Shan, C.; Yuan, X. Optimization design and numerical study on water cooling structure for power lithium battery pack. Appl. Therm. Eng. 2019, 159, 113760. [Google Scholar] [CrossRef]
- Zilberman, I.; Ludwig, S.; Schiller, M.; Jossen, A. Online aging determination in lithium-ion battery module with forced temperature gradient. J. Energy Storage 2020, 28, 101170. [Google Scholar] [CrossRef]
- Baumhöfer, T.; Brühl, M.; Rothgang, S.; Sauer, D.U. Production caused variation in capacity aging trend and correlation to initial cell performance. J. Power Sources 2014, 247, 332–338. [Google Scholar] [CrossRef]
- Oeser, D. From the Production of the Single Cell to the End of Life of the Battery Module: The Development of Parameter Variation of Lithium-Ion Cells. Ph.D. Thesis, Universitat Politécnica de Catalunya, Barcelona, Spain, 2022. [Google Scholar]
- Wang, Y.; Zhang, C.; Chen, Z.; Xie, J.; Zhang, X. A novel active equalization method for lithium-ion batteries in electric vehicles. Appl. Energy 2015, 145, 36–42. [Google Scholar] [CrossRef]
- Dubarry, M.; Truchot, C.; Liaw, B.Y.; Gering, K.; Sazhin, S.; Jamison, D.; Michelbacher, C. Evaluation of commercial lithium-ion cells based on composite positive electrode for plug-in hybrid electric vehicle applications. Part II. Degradation mechanism under 2C cycle aging. J. Power Sources 2011, 196, 10336–10343. [Google Scholar] [CrossRef]
- Harris, S.J.; Harris, D.J.; Li, C. Failure statistics for commercial lithium ion batteries: A study of 24 pouch cells. J. Power Sources 2017, 342, 589–597. [Google Scholar] [CrossRef] [Green Version]
- Paul, S.; Diegelmann, C.; Kabza, H.; Tillmetz, W. Analysis of ageing inhomogeneities in lithium-ion battery systems. J. Power Sources 2013, 239, 642–650. [Google Scholar] [CrossRef]
- Rumpf, K.; Naumann, M.; Jossen, A. Experimental investigation of parametric cell-to-cell variation and correlation based on 1100 commercial lithium-ion cells. J. Energy Storage 2017, 14, 224–243. [Google Scholar] [CrossRef]
- Gogoana, R.; Pinson, M.B.; Bazant, M.Z.; Sarma, S.E. Internal resistance matching for parallel-connected lithium-ion cells and impacts on battery pack cycle life. J. Power Sources 2014, 252, 8–13. [Google Scholar] [CrossRef]
- Pastor-Fernández, C.; Bruen, T.; Widanage, W.D.; Gama-Valdez, M.A.; Marco, J. A Study of Cell-to-Cell Interactions and Degradation in Parallel Strings: Implications for the Battery Management System. J. Power Sources 2016, 329, 574–585. [Google Scholar] [CrossRef] [Green Version]
- Campestrini, C.; Keil, P.; Schuster, S.F.; Jossen, A. Ageing of lithium-ion battery modules with dissipative balancing compared with single-cell ageing. J. Energy Storage 2016, 6, 142–152. [Google Scholar] [CrossRef]
- Oeser, D.; Ziegler, A.; Ackva, A. Single cell analysis of lithium-ion e-bike batteries aged under various conditions. J. Power Sources 2018, 397, 25–31. [Google Scholar] [CrossRef]
- Ansean, D.; Garcia, V.M.; Gonzalez, M.; Blanco-Viejo, C.; Viera, J.C.; Pulido, Y.F.; Sanchez, L. Lithium-Ion Battery Degradation Indicators Via Incremental Capacity Analysis. IEEE Trans. Ind. Appl. 2019, 55, 2992–3002. [Google Scholar] [CrossRef]
- Yang, Z.; Patil, D.; Fahimi, B. Online Estimation of Capacity Fade and Power Fade of Lithium-Ion Batteries Based on Input-Output Response Technique. IEEE Trans. Transp. Electrif. 2017, 4, 147–156. [Google Scholar] [CrossRef]
- Einhorn, M.; Conte, F.V.; Kral, C.; Fleig, J. A method for online capacity estimation of lithium ion battery cells using the state of charge and the transferred charge. IEEE Trans. Ind. Appl. 2012, 48, 736–741. [Google Scholar] [CrossRef]
- Yang, C.; Wang, X.; Fang, Q.; Dai, H.; Cao, Y.; Wei, X. An online SOC and capacity estimation method for aged lithium-ion battery pack considering cell inconsistency. J. Energy Storage 2020, 29, 101250. [Google Scholar] [CrossRef]
- Kim, T.; Wang, Y.; Fang, H.; Sahinoglu, Z.; Wada, T.; Hara, S.; Qiao, W. Model-based condition monitoring for lithium-ion batteries. J. Power Sources 2015, 295, 16–27. [Google Scholar] [CrossRef] [Green Version]
- Hua, Y.; Cordoba-Arenas, A.; Warner, N.; Rizzoni, G. A multi time-scale state-of-charge and state-of-health estimation framework using nonlinear predictive filter for lithium-ion battery pack with passive balance control. J. Power Sources 2015, 280, 293–312. [Google Scholar] [CrossRef]
- Yu, H.; Li, J.; Ji, Y.; Pecht, M. Life-cycle parameter identification method of an electrochemical model for lithium-ion battery pack. J. Energy Storage 2022, 47, 103591. [Google Scholar] [CrossRef]
- Hein, T.; Ziegler, A.; Oeser, D.; Ackva, A. A capacity-based equalization method for aged lithium-ion batteries in electric vehicles. Electr. Power Syst. Res. 2021, 191, 106898. [Google Scholar] [CrossRef]
- Fantham, T.L.; Gladwin, D.T. In-situ Parameter Identification of Cells in Grid-Connected Batteries. In Proceedings of the IECON 2021—47th Annual Conference of the IEEE Industrial Electronics Society, Toronto, ON, Canada, 13–16 October 2021. [Google Scholar] [CrossRef]
- Samsung. Specification of Product ICR18650-26J. 2011. Available online: https://www.imrbatteries.com/content/samsung_26J.pdf (accessed on 16 March 2023).
- Gantenbein, S. Impedanzbasierte Modellierung von Lithium-Ionen Zellen und deren Degradationsverhalten. Ph.D. Thesis, Karlsruher Institut für Technologie, Karlsruhe, Germany, 2019. [Google Scholar] [CrossRef]
- Yang, X.G.; Leng, Y.; Zhang, G.; Ge, S.; Wang, C.Y. Modeling of lithium plating induced aging of lithium-ion batteries: Transition from linear to nonlinear aging. J. Power Sources 2017, 360, 28–40. [Google Scholar] [CrossRef]
- Yang, X.G.; Wang, C.Y. Understanding the trilemma of fast charging, energy density and cycle life of lithium-ion batteries. J. Power Sources 2018, 402, 489–498. [Google Scholar] [CrossRef]
- Attia, P.M.; Bills, A.; Brosa Planella, F.; Dechent, P.; dos Reis, G.; Dubarry, M.; Gasper, P.; Gilchrist, R.; Greenbank, S.; Howey, D.; et al. Review—“Knees” in Lithium-Ion Battery Aging Trajectories. J. Electrochem. Soc. 2022, 169, 060517. [Google Scholar] [CrossRef]
- Devie, A.; Baure, G.; Dubarry, M. Intrinsic variability in the degradation of a batch of commercial 18650 lithium-ion cells. Energies 2018, 11, 1031. [Google Scholar] [CrossRef] [Green Version]
- Stiaszny, B.; Ziegler, J.C.; Krauß, E.E.; Schmidt, J.P.; Ivers-Tiffée, E. Electrochemical characterization and post-mortem analysis of aged LiMn 2O4-Li(Ni0.5Mn0.3Co 0.2)O2/graphite lithium ion batteries. Part I: Cycle aging. J. Power Sources 2014, 251, 439–450. [Google Scholar] [CrossRef]
- Rothgang, S.; Baumhöfer, T.; Sauer, D.U. Diversion of aging of battery cells in automotive systems. In Proceedings of the 2014 IEEE Vehicle Power and Propulsion Conference (VPPC), Coimbra, Portugal, 27–30 October 2014; pp. 2–7. [Google Scholar] [CrossRef]
- Dubarry, M.; Truchot, C.; Cugnet, M.; Liaw, B.Y.; Gering, K.; Sazhin, S.; Jamison, D.; Michelbacher, C. Evaluation of commercial lithium-ion cells based on composite positive electrode for plug-in hybrid electric vehicle applications. Part I: Initial characterizations. J. Power Sources 2011, 196, 10328–10335. [Google Scholar] [CrossRef]
- Schuster, S.F.; Bach, T.; Fleder, E.; Müller, J.; Brand, M.; Sextl, G.; Jossen, A. Nonlinear aging characteristics of lithium-ion cells under different operational conditions. J. Energy Storage 2015, 1, 44–53. [Google Scholar] [CrossRef]
- Jossen, A. Fundamentals of battery dynamics. J. Power Sources 2006, 154, 530–538. [Google Scholar] [CrossRef]
- Andre, D.; Meiler, M.; Steiner, K.; Wimmer, C.; Soczka-Guth, T.; Sauer, D.U. Characterization of high-power lithium-ion batteries by electrochemical impedance spectroscopy. I. Experimental investigation. J. Power Sources 2011, 196, 5334–5341. [Google Scholar] [CrossRef]
- Weiss, M. Impedanzgestützte Lebensdaueranalyse von Lithium-Ionen Batterien. Ph.D. Thesis, Karlsruher Institut für Technologie, Karlsruhe, Germany, 2020. [Google Scholar]
- Vetter, J.; Novák, P.; Wagner, M.R.; Veit, C.; Möller, K.C.; Besenhard, J.O.; Winter, M.; Wohlfahrt-Mehrens, M.; Vogler, C.; Hammouche, A. Ageing mechanisms in lithium-ion batteries. J. Power Sources 2005, 147, 269–281. [Google Scholar] [CrossRef]
- Lin, C.; Tang, A.; Mu, H.; Wang, W.; Wang, C. Aging mechanisms of electrode materials in lithium-ion batteries for electric vehicles. J. Chem. 2015, 2015, 104673. [Google Scholar] [CrossRef] [Green Version]
- Waag, W.; Käbitz, S.; Sauer, D.U. Experimental investigation of the lithium-ion battery impedance characteristic at various conditions and aging states and its influence on the application. Appl. Energy 2013, 102, 885–897. [Google Scholar] [CrossRef]
- Schmidt, J.P.; Tran, H.Y.; Richter, J.; Ivers-Tiffée, E.; Wohlfahrt-Mehrens, M. Analysis and prediction of the open circuit potential of lithium-ion cells. J. Power Sources 2013, 239, 696–704. [Google Scholar] [CrossRef]
- Bauer, M. Elektrische und mechanische Verfahren zur Detektion von Alterungseffekten in Lithium-Ionen-Batterien. Ph.D. Thesis, Technische Universität München, Munich, Germany, 2017. [Google Scholar]
- Lewerenz, M.; Marongiu, A.; Warnecke, A.; Sauer, D.U. Differential voltage analysis as a tool for analyzing inhomogeneous aging: A case study for LiFePO4|Graphite cylindrical cells. J. Power Sources 2017, 368, 57–67. [Google Scholar] [CrossRef]
- Bloom, I.; Jansen, A.N.; Abraham, D.P.; Knuth, J.; Jones, S.A.; Battaglia, V.S.; Henriksen, G.L. Differential voltage analyses of high-power, lithium-ion cells 1. Technique and application. J. Power Sources 2005, 139, 295–303. [Google Scholar] [CrossRef]
- Klein, A. Untersuchungen zur Erhöhung der Strombelastbarkeit manganbasierter Kathodenmaterialien für Lithium-Ionen Batterien. Ph.D. Thesis, Universität Ulm, Ulm, Germany, 2016. [Google Scholar]
- Bloom, I.; Walker, L.K.; Basco, J.K.; Abraham, D.P.; Christophersen, J.P.; Ho, C.D. Differential voltage analyses of high-power lithium-ion cells. 4. Cells containing NMC. J. Power Sources 2010, 195, 877–882. [Google Scholar] [CrossRef]
- Fath, J.P.; Dragicevic, D.; Bittel, L.; Nuhic, A.; Sieg, J.; Hahn, S.; Alsheimer, L.; Spier, B.; Wetzel, T. Quantification of aging mechanisms and inhomogeneity in cycled lithium-ion cells by differential voltage analysis. J. Energy Storage 2019, 25, 100813. [Google Scholar] [CrossRef]
- Ohzuku, T.; Iwakoshi, Y.; Sawai, K. Formation of Lithium-Graphite Intercalation Compounds in Nonaqueous Electrolytes and Their Application as a Negative Electrode for a Lithium Ion (Shuttlecock) Cell. J. Electrochem. Soc. 1993, 140, 2490. [Google Scholar] [CrossRef]
- Illig, J. Physically Based Impedance Modelling of Lithium-Ion Cells. Ph.D. Thesis, Karlsruher Institut für Technologie, Karlsruhe, Germany, 2014. [Google Scholar] [CrossRef]
- Waldmann, T.; Hogg, B.I.; Wohlfahrt-Mehrens, M. Li plating as unwanted side reaction in commercial Li-ion cells—A review. J. Power Sources 2018, 384, 107–124. [Google Scholar] [CrossRef]
- Von Lüders, C. Experimentelle und Simulative Untersuchung von Lithium Plating und Lithium Stripping in Lithium Ionen Zellen. Ph.D. Thesis, Technische Universität München, Munich, Germany, 2019. [Google Scholar]
- Petzl, M.; Kasper, M.; Danzer, M.A. Lithium plating in a commercial lithium-ion battery—A low-temperature aging study. J. Power Sources 2015, 275, 799–807. [Google Scholar] [CrossRef]
- Liu, C.; Gao, Y.; Liu, L. Toward safe and rapid battery charging: Design optimal fast charging strategies thorough a physics-based model considering lithium plating. Int. J. Energy Res. 2021, 45, 2303–2320. [Google Scholar] [CrossRef]
- Legrand, N.; Knosp, B.; Desprez, P.; Lapicque, F.; Raël, S. Physical characterization of the charging process of a Li-ion battery and prediction of Li plating by electrochemical modelling. J. Power Sources 2014, 245, 208–216. [Google Scholar] [CrossRef]
- Von Lüders, C.; Zinth, V.; Erhard, S.V.; Osswald, P.J.; Hofmann, M.; Gilles, R.; Jossen, A. Lithium plating in lithium-ion batteries investigated by voltage relaxation and in situ neutron diffraction. J. Power Sources 2017, 342, 17–23. [Google Scholar] [CrossRef]
- Park, M.S.; Ma, S.B.; Lee, D.J.; Im, D.; Doo, S.G.; Yamamoto, O. A highly reversible lithium metal anode. Sci. Rep. 2014, 4, 3815. [Google Scholar] [CrossRef] [Green Version]
- Petzl, M.; Danzer, M.A. Nondestructive detection, characterization, and quantification of lithium plating in commercial lithium-ion batteries. J. Power Sources 2014, 254, 80–87. [Google Scholar] [CrossRef]
- Sieg, J.; Bandlow, J.; Mitsch, T.; Dragicevic, D.; Materna, T.; Spier, B.; Witzenhausen, H.; Ecker, M.; Sauer, D.U. Fast charging of an electric vehicle lithium-ion battery at the limit of the lithium deposition process. J. Power Sources 2019, 427, 260–270. [Google Scholar] [CrossRef]
- Fan, J.; Tan, S. Studies on Charging Lithium-Ion Cells at Low Temperatures. J. Electrochem. Soc. 2006, 153, A1081. [Google Scholar] [CrossRef]
- Jahn, L.; Katzer, F.; Danzer, M.A. Combined dilatometry and voltage analysis for a reliable detection of lithium deposition on graphitic anodes. J. Power Sources 2022, 520, 230870. [Google Scholar] [CrossRef]
- Ahmad, A.B.; Ooi, C.A.; Ishak, D.; Teh, J. Cell balancing topologies in battery energy storage systems: A review. In Proceedings of the 10th International Conference on Robotics, Vision, Signal Processing and Power Applications; Springer: Singapore, 2019; Volume 547, pp. 159–165. [Google Scholar] [CrossRef]
- Andrea, D. Battery Management Systems; Artech House: London, UK, 2010. [Google Scholar]
- Ziegler, A.; Oeser, D.; Hein, T.; Ackva, A. Development and Application of an Active Balancing System for Lithium-Ion Cells. In Proceedings of the 2019 IEEE Vehicle Power and Propulsion Conference (VPPC), Hanoi, Vietnam, 14–17 October 2019; pp. 1–6. [Google Scholar] [CrossRef]
- Ziegler, A.; Oeser, D.; Hein, T.; Montesinos-Miracle, D.; Ackva, A. Reducing Cell to Cell Variation of Lithium-Ion Battery Packs during Operation. IEEE Access 2021, 9, 24994–25001. [Google Scholar] [CrossRef]
Figure 1.
(a) Histograms of cell capacity and (b) histogram of internal resistances of 200 cells measured in an initial characterization test.
Figure 1.
(a) Histograms of cell capacity and (b) histogram of internal resistances of 200 cells measured in an initial characterization test.

Figure 2.
(a) Relative capacity of the module; (b) capacity values of all 8 cells obtained every 20 cycles.
Figure 2.
(a) Relative capacity of the module; (b) capacity values of all 8 cells obtained every 20 cycles.

Figure 3.
Voltages at the end of the discharging phase.

Figure 4.
Relative internal resistance of all 8 cells.

Figure 5.
Impedance spectra at 25 °C and 50% SoC of all 8 cells (a) before and (b) after 174 cycles shown in a Nyquist plot.
Figure 5.
Impedance spectra at 25 °C and 50% SoC of all 8 cells (a) before and (b) after 174 cycles shown in a Nyquist plot.

Figure 6.
Differential voltage analysis of all 8 cells (a) before and (b) after 174 cycles.

Figure 7.
Relaxation measurement of all 8 aged cells and one new cell: (a) Voltage during relaxation; (b) derivation of the voltage.
Figure 7.
Relaxation measurement of all 8 aged cells and one new cell: (a) Voltage during relaxation; (b) derivation of the voltage.

Figure 8.
Voltage curves of the 8 cells during discharge with active balancing.

Figure 9.
Correlation between balancing charges of the active balancing algorithm and the capacity losses of the 8 cells with the corresponding Pearson correlation coefficient.
Figure 9.
Correlation between balancing charges of the active balancing algorithm and the capacity losses of the 8 cells with the corresponding Pearson correlation coefficient.


Table 1.
Capacities and internal resistances of the 8 cells used in the experiment before aging.
| Parameter | 1 | 2 | 3 | 4 | 5 | 6 | 7 | 8 | ||
|---|---|---|---|---|---|---|---|---|---|---|
| [Ah] | 2.733 | 2.715 | 2.729 | 2.738 | 2.716 | 2.728 | 2.727 | 2.732 | 2.727 | 0.008 |
| [m] | 57.4 | 55.8 | 55.4 | 57.4 | 58.0 | 55.8 | 58.0 | 56.5 | 56.8 | 1 |
Table 2.
Capacities and internal resistances of the 8 cells used in the experiment after aging.
| Parameter | 1 | 2 | 3 | 4 | 5 | 6 | 7 | 8 | ||
|---|---|---|---|---|---|---|---|---|---|---|
| [Ah] | 2.303 | 2.037 | 2.118 | 2.053 | 2.411 | 1.858 | 2.158 | 1.956 | 2.112 | 0.17 |
| [m] | 63.1 | 68.8 | 64.6 | 70.8 | 60.3 | 75.0 | 65.0 | 70.2 | 67.2 | 4.5 |
Table 3.
and of the 8 cells before aging.
| Parameter | 1 | 2 | 3 | 4 | 5 | 6 | 7 | 8 | ||
|---|---|---|---|---|---|---|---|---|---|---|
| [m] | 41.4 | 40.0 | 39.3 | 40.7 | 42.1 | 39.9 | 41.3 | 40.0 | 40.6 | 0.9 |
| [m] | 21.2 | 20.4 | 20.5 | 21.0 | 20.9 | 20.9 | 21.2 | 21.2 | 20.9 | 0.3 |
Table 4.
and of the 8 cells after aging.
| Parameter | 1 | 2 | 3 | 4 | 5 | 6 | 7 | 8 | ||
|---|---|---|---|---|---|---|---|---|---|---|
| [m] | 44.3 | 45.8 | 43.9 | 46.3 | 44.5 | 48.6 | 45.7 | 47.1 | 45.8 | 1.5 |
| [m] | 21.8 | 27.1 | 24.5 | 25.8 | 18.7 | 30.3 | 22.4 | 26.3 | 24.6 | 3.4 |
Disclaimer/Publisher’s Note: The statements, opinions and data contained in all publications are solely those of the individual author(s) and contributor(s) and not of MDPI and/or the editor(s). MDPI and/or the editor(s) disclaim responsibility for any injury to people or property resulting from any ideas, methods, instructions or products referred to in the content. |
© 2023 by the authors. Licensee MDPI, Basel, Switzerland. This article is an open access article distributed under the terms and conditions of the Creative Commons Attribution (CC BY) license (https://creativecommons.org/licenses/by/4.0/).
Share and Cite
MDPI and ACS Style
Hein, T.; Oeser, D.; Ziegler, A.; Montesinos-Miracle, D.; Ackva, A. Aging Determination of Series-Connected Lithium-Ion Cells Independent of Module Design. Batteries 2023, 9, 172. https://doi.org/10.3390/batteries9030172
AMA Style
Hein T, Oeser D, Ziegler A, Montesinos-Miracle D, Ackva A. Aging Determination of Series-Connected Lithium-Ion Cells Independent of Module Design. Batteries. 2023; 9(3):172. https://doi.org/10.3390/batteries9030172
Chicago/Turabian StyleHein, Thiemo, David Oeser, Andreas Ziegler, Daniel Montesinos-Miracle, and Ansgar Ackva. 2023. "Aging Determination of Series-Connected Lithium-Ion Cells Independent of Module Design" Batteries 9, no. 3: 172. https://doi.org/10.3390/batteries9030172
Note that from the first issue of 2016, this journal uses article numbers instead of page numbers. See further details here.