
Solid Electrolytes in the N-Propyl-N-methyl-pyrrolidinium Tetrafluoroborate—Lithium Tetrafluoroborate System

1
Institute of Solid State Chemistry and Mechanochemistry SB RAS, Kutateladze Str., 18, Novosibirsk 630090, Russia
2
Department of Natural Scences, Novosibirsk State University, Pirogova 2, Novosibirsk 630090, Russia
*
Author to whom correspondence should be addressed.
Batteries 2023, 9(3), 167; https://doi.org/10.3390/batteries9030167
Submission received: 14 November 2022
/
Revised: 1 March 2023
/
Accepted: 8 March 2023
/
Published: 10 March 2023
(This article belongs to the Special Issue Solid-State Electrolytes for Safe Batteries)
Abstract
:Solid electrolytes prepared by the addition of LiBF4 to the plastic phase of [N13pyr]BF4 were prepared, and their physical and electrical properties were investigated. The electrolytes [N13pyr]BF4-LiBF4 containing 8–20 wt% LiBF4 are solid at temperatures below 80 °C and have a high ionic conductivity ~10−3–10−2 S cm−1 at 60 °C. Based on the results of DSC and conductivity studies, the phase diagram of the [N13pyr]BF4-LiBF4 binary system was plotted, and the formation of a new compound, 3[N13pyr]BF4·2LiBF4 was proposed. The existence of the new phase was supported by X-ray diffraction data. Electrochemical measurements of cells with lithium electrodes were carried out to test the applicability of these materials in lithium batteries. The electrochemical window was determined to be more than 5 V. In contrast to earlier data obtained for similar systems, the preconditioning effect was not observed. Nevertheless, the solid electrolyte [N13pyr]BF4-LiBF4 system has high ionic conductivity and may be used in solid-state lithium-ion batteries.

1. Introduction
Liquid electrolytes currently used in batteries are flammable and volatile, which limits their potential applications. In contrast to electrolytes based on polar organic solvents, ionic liquids and plastic phases of organic salts are characterized by much higher thermal stability, non-volatility, and low vapor pressure [1]. Therefore, they may be regarded as safe electrolytes for applications in power sources. Solid electrolytes, unlike ionic liquids, are mechanically stable and can be used in solid-state electrochemical devices or as an ion-selective membrane to prevent dendrite growth or undesirable electrochemical processes on battery electrodes [2,3]. Among solid electrolytes, high-temperature plastic phases of organic salts may be classified as a special class of materials termed “organic ionic plastic crystals” (OIPCs) and characterized by a high degree of structural disorder within the crystal lattice [4,5]. Such phases are usually formed by the crystallization of ionic liquids. Due to a strong orientational disorder and conformational motions of organic fragments, such phases can easily plastically flow under stress and are referred to as plastic crystals [6]. Compared to brittle solid electrolytes, the plasticity of such phases can provide better mechanical compatibility with electrodes during volume changes while preventing the leakage problems typical for liquid electrolytes.
Earlier relatively high ionic conductivity, above 10−5 S cm−1, were found in plastic phases of tetra-n-butyl-ammonium salts (C4H9)4NX (X = Br−, I−, BF4−) denoted further as [N4444]X [6,7,8,9], methyl-diethyl-butylphosphonium and methyl-tetrabutyl-phosphonium salts, [P1224]X and [P1444]X, respectively, where X = PF6−, BF4−, SCN− and bis(fluorosulfonyl)amide anion N(CN)2− [10]. The relatively high ionic conductivity was reported for diethyl-(methyl)-(isobutyl)-phosphonium thiocyanate, [P1224][SCN], and tetraethyl-phosphonium fluorohydrogenate salt, [P2222](FH)2F [11], as well as in cyclic sulfonyl amide salts with cyano-substituted quarternary ammonium cations [12].
N,N-alkyl-pyrrolidinium cations contain quaternary nitrogen atoms, and many pyrrolidinium-based salts with different anions are ionic liquids at room temperature due to their low melting temperatures [13,14,15]. Some of these salts have relatively high ionic conductivity in the crystalline plastic phase below melting temperature. For instance, high ionic conductivity ~10−3 S cm−1, was reported for high-temperature plastic phases of such tetrafluoroborates as N-propyl-N-methyl-pyrrolidinium tetrafluoroborate [N13pyr]BF4 [16] and N,N-dimethyl-pyrrolidinium tetrafluoroborate [N11pyr]BF4 [17]. Salt [N12pyr]BF4 was used in dye-sensitized solar cells [18], and N,N-dimethyl-pyrrolidinium fluorohydrogenate [N11pyr](FH)2F was reported to be used as an ionic plastic crystal electrolyte in solid-state electrochemical capacitors [19].
As a rule, the ionic conductivity of pure organic salts, even in the plastic phase, is not high and does not exceed 10−5 S cm−1 at melting temperature. Doping of plastic phases with lithium or sodium salts results in a considerable increase in conductivity, and the obtained electrolytes may be successfully used in lithium or sodium batteries [5,18,20,21,22,23]. As plastic solid-state matrices, pyrazoline imides [21], N-methyl-N-ethyl-pyrrolidinium bis(trifluoromethanesulfonyl)amide [22], [N12pyr]BF4 [23], succinonitrile [24], etc., were used.
Lithium tetrafluoroborate is a much less hygroscopic salt compared to lithium salts with such anions as PF6−, SCN−, N(CN)2−, and TFSI−. Tetrafluoroborate salts have high electrochemical stability and are promising for various electrochemical applications. The ionic conductivity of N,N-dimethylpyrrolidinium tetrafluoroborate, [N11pyr]BF4, doped with LiBF4, was reported earlier [25]. It was shown that the conductivity of the high-temperature phase of [N11pyr]BF4 increases by more than an order of magnitude due to the addition of 8 wt% LiBF4. It was found that in the sample containing 8 wt% LiBF4, an additional phase presents differently from pure LiBF4. However, it is not clear what role the crystalline phase plays in the observed conductivity. The [N12pyr]BF4 plastic crystal with a longer ethyl chain substituent on the cation than the [N11pyr]BF4 discussed above has also been successfully demonstrated as a lithium solid electrolyte [23,26]. The conductivity of the high-temperature phase of this material, when doped with 10 mol% LiBF4, reaches 10−3 S cm−1. The cycling of this material in a lithium-ion symmetrical cell at temperatures of 50–100 °C showed well-defined and reversible lithium deposition during 750 cycles. Moreover, the authors reported that a solid-state battery made of Li|solid electrolyte|LiFePO4 with LiBF4-doped [N12pyr]BF4 showed a capacity of nearly 140 mAh/g at 100 °C and a C/10 charge/discharge rate [23].
Interestingly, there has been little attention paid thus far to the properties of the lithium-doped N-methyl-N-propyl-pyrrolidinium salt [N13pyr]BF4, which is a chemical homolog of [N11pyr]BF4 and [N12pyr]BF4 salts. The plastic phase of [N13pyr]BF4 has high ionic conductivity and might be a suitable matrix to prepare lithium solid electrolytes in the binary system [N13pyr]BF4-LiBF4. However, the materials in this system have not been studied yet. In the present work, solid electrolytes were prepared by the addition of LiBF4 to the plastic phase of [N13pyr]BF4, and their physical and electrical properties were investigated. Electrochemical measurements of cells with lithium electrodes were carried out to test the applicability of these materials in lithium batteries.
2. Materials and Methods
N-Propyl-N-methyl-pyrrolidinium tetrafluoroborate [N13pyr]BF4 was prepared by the following reactions:

In the first stage, 81.94 g of N-methyl pyrrolidine (Aldrich, CAS: 120-94-5, M79204) and 98.24 g of 1-chloropropane (Aldrich, CAS: 540-54-5, C68555) were dissolved in 100 mL of acetonitrile and boiled for 20 h. The precipitate of propyl-methyl pyrrolidinium chloride [N13pyr]Cl was filtered, washed with acetonitrile and diethyl ether, and dried in a vacuum desiccator. Then 91.22 g of [N13pyr]Cl was dissolved in 116 g of a 48% water solution of HBF4 (98% pure, Sima-Aldrich, St. Louis, MO, USA, Product Number 207934), and the solution was evaporated. The residue was doubly recrystallized in ethanol and dried in a vacuum oven at 60 °C for 12 h. LiBF4 was synthesized by neutralization of tetrafluoroboric acid with LiOH (99.9% pure) and subsequent double crystallization from distilled water. In prior experiments, LiBF4 was dried in a vacuum oven at 150 °C for 24 h. For the preparation of binary systems, dried powders [N13pyr]BF4 and LiBF4 were mixed in given ratios and heated at 100 °C for 12 h.
The thermal properties of the samples were studied using a DSK-500 differential scanning calorimeter. Powder samples with a weight range of 5–8 mg were sealed in aluminum pans with aluminum caps in an argon glovebox. Heat effects were recorded on the first and second heating of the samples at a rate of 10 deg/min.
X-ray powder diffraction patterns were obtained on a Bruker D8 Advance X-ray Diffractometer using CuKa radiation. For experiments, the samples were put into the quartz pan and hermetically sealed with polyethylene film to prevent contact with air.
Conductivity measurements were carried out on a special cell containing two platinum wire electrodes, which were put into a molten sample heated at 150 °C for 1 h. Then impedance spectra of the sample were recorded during cooling, subsequent heating, and second cooling in a stepwise temperature mode in the temperature range from −10 to 150 °C. The temperature step was 10 degrees, and the impedance spectra were obtained using a Zive SP2 Electrochemical Workstation in the frequency range of 0.1 Hz–1 MHz. The bulk resistance values, Rb, of the samples were determined from Nyquist plots by fitting appropriate equivalent circuits to experimental data. The conductivity values were determined by a relation σ = A·Rb−1, where the geometric parameter A was estimated by calibration of the cell using NaCl water solution with known concentration.
For electrochemical studies, powdered samples were compacted into pellets measuring 0.5 mm in thickness and 7 mm in diameter. The pellets were sandwiched between either 0.45-mm-thick lithium foil (Shandong AME, 99.9% pure) and a steel disk (for investigation of electrochemical windows) or between two lithium foil electrodes (for galvanostatic testing). Then the samples were assembled in a hermetic steel cell. All the assembly processes were carried out in an argon glovebox. A Zive SP2 Electrochemical Workstation was used for all electrochemical measurements. The electrochemical window was determined using a potentiodynamic method at a potential scan rate of 1 mV/s in the two-terminal cell with metallic lithium and steel electrodes. Galvanostatic cycling was carried out on the symmetrical cell with two lithium electrodes at a current density of 0.01 mA/cm2. Before and after the galvanostatic cycling, the impedance spectra of the sample were recorded using the technique described above.
3. Results and Discussion
3.1. Thermal Properties, Conductivity and Crystal Structure
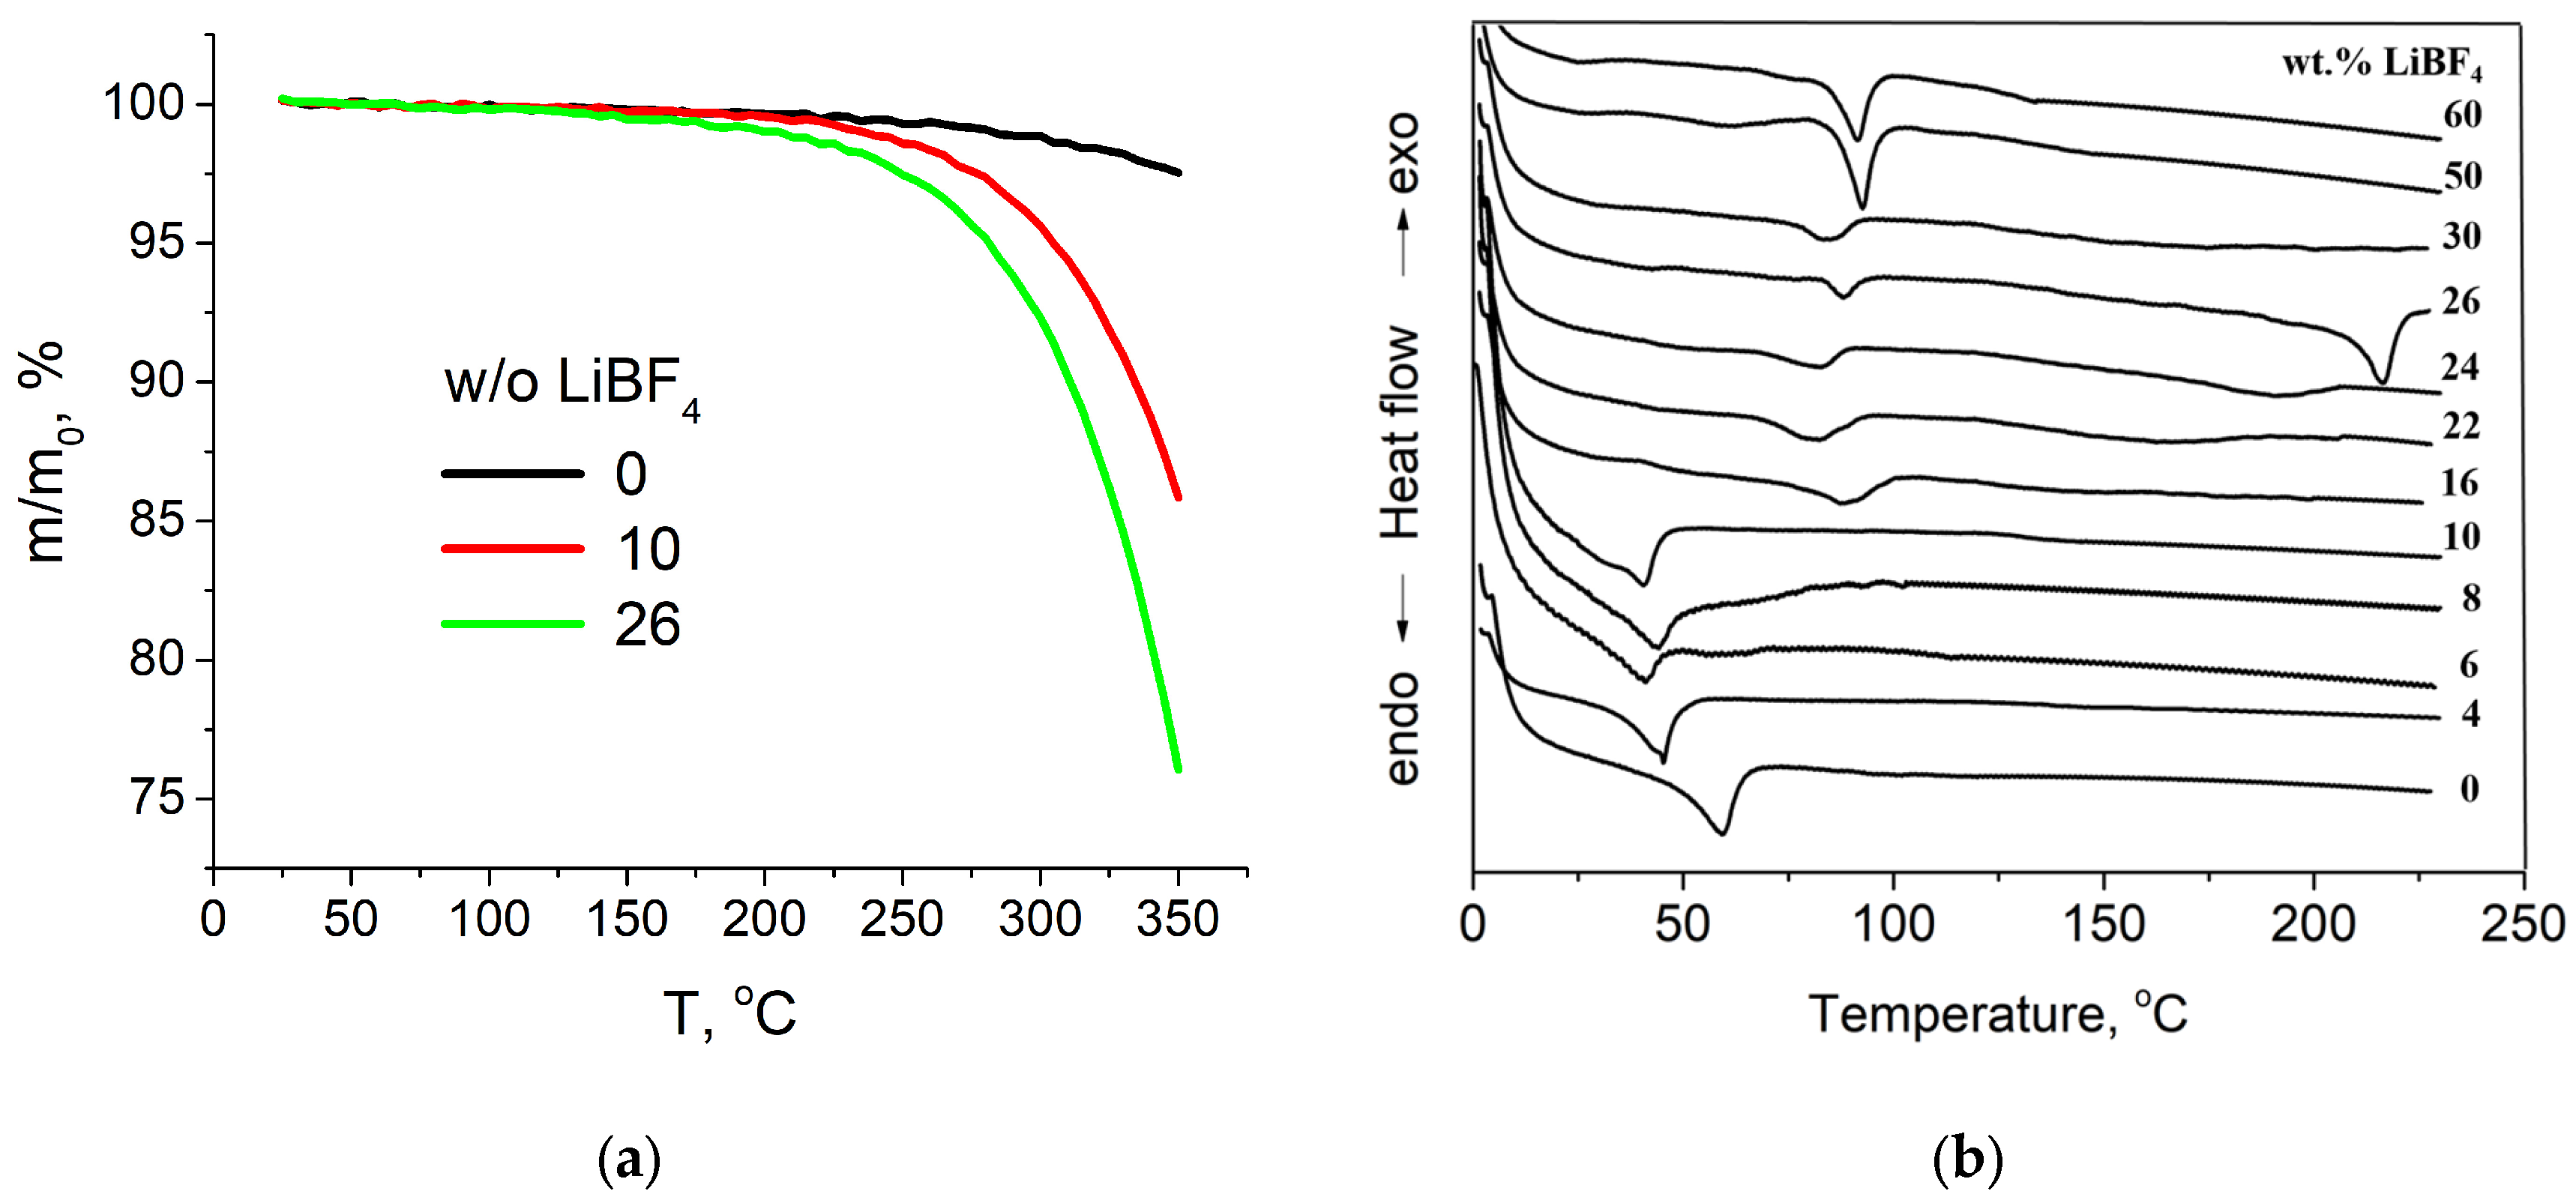
Investigation of the thermal properties of the samples was carried out using the differential scanning calorimetry (DSC) technique. Prior to DSC analysis, thermogravimetric (TG) curves for some samples were obtained to define the temperature stability range of the samples. As seen from Figure 1a, the decomposition of the samples starts above 250 °C, therefore all DSC experiments were carried out at temperatures below 250 °C. DSC studies were carried out in two stages. On first heating in an argon atmosphere from room temperature to 220 °C, the mixing, dehydration, and melting of the samples took place. Then the samples were slowly cooled to 0 °C, kept at this temperature for 30 min, and heated again at the rate of 10 deg/min. Experimental DSC curves obtained on the second heating run for the [N13pyr]BF4-LiBF4 samples are presented in Figure 1. Pure salt [N13pyr]BF4 melts at 58 °C, which is close to the data reported earlier [27]. The addition of 2–10 wt% LiBF4 (corresponding to the molar fraction range of 0 < x < 0.2) led to a decrease in the melting temperature up to 35 °C. At concentrations of LiBF4 above 16 wt% (0.28 < x < 0.78), a new peak appeared at a temperature around 80 °C. Moreover, in the samples containing 22–30 wt% LiBF4 (0.28 < x < 0.48), one more phase transition at 140–230 °C was detected, the temperature of which increases with LiBF4 concentration.
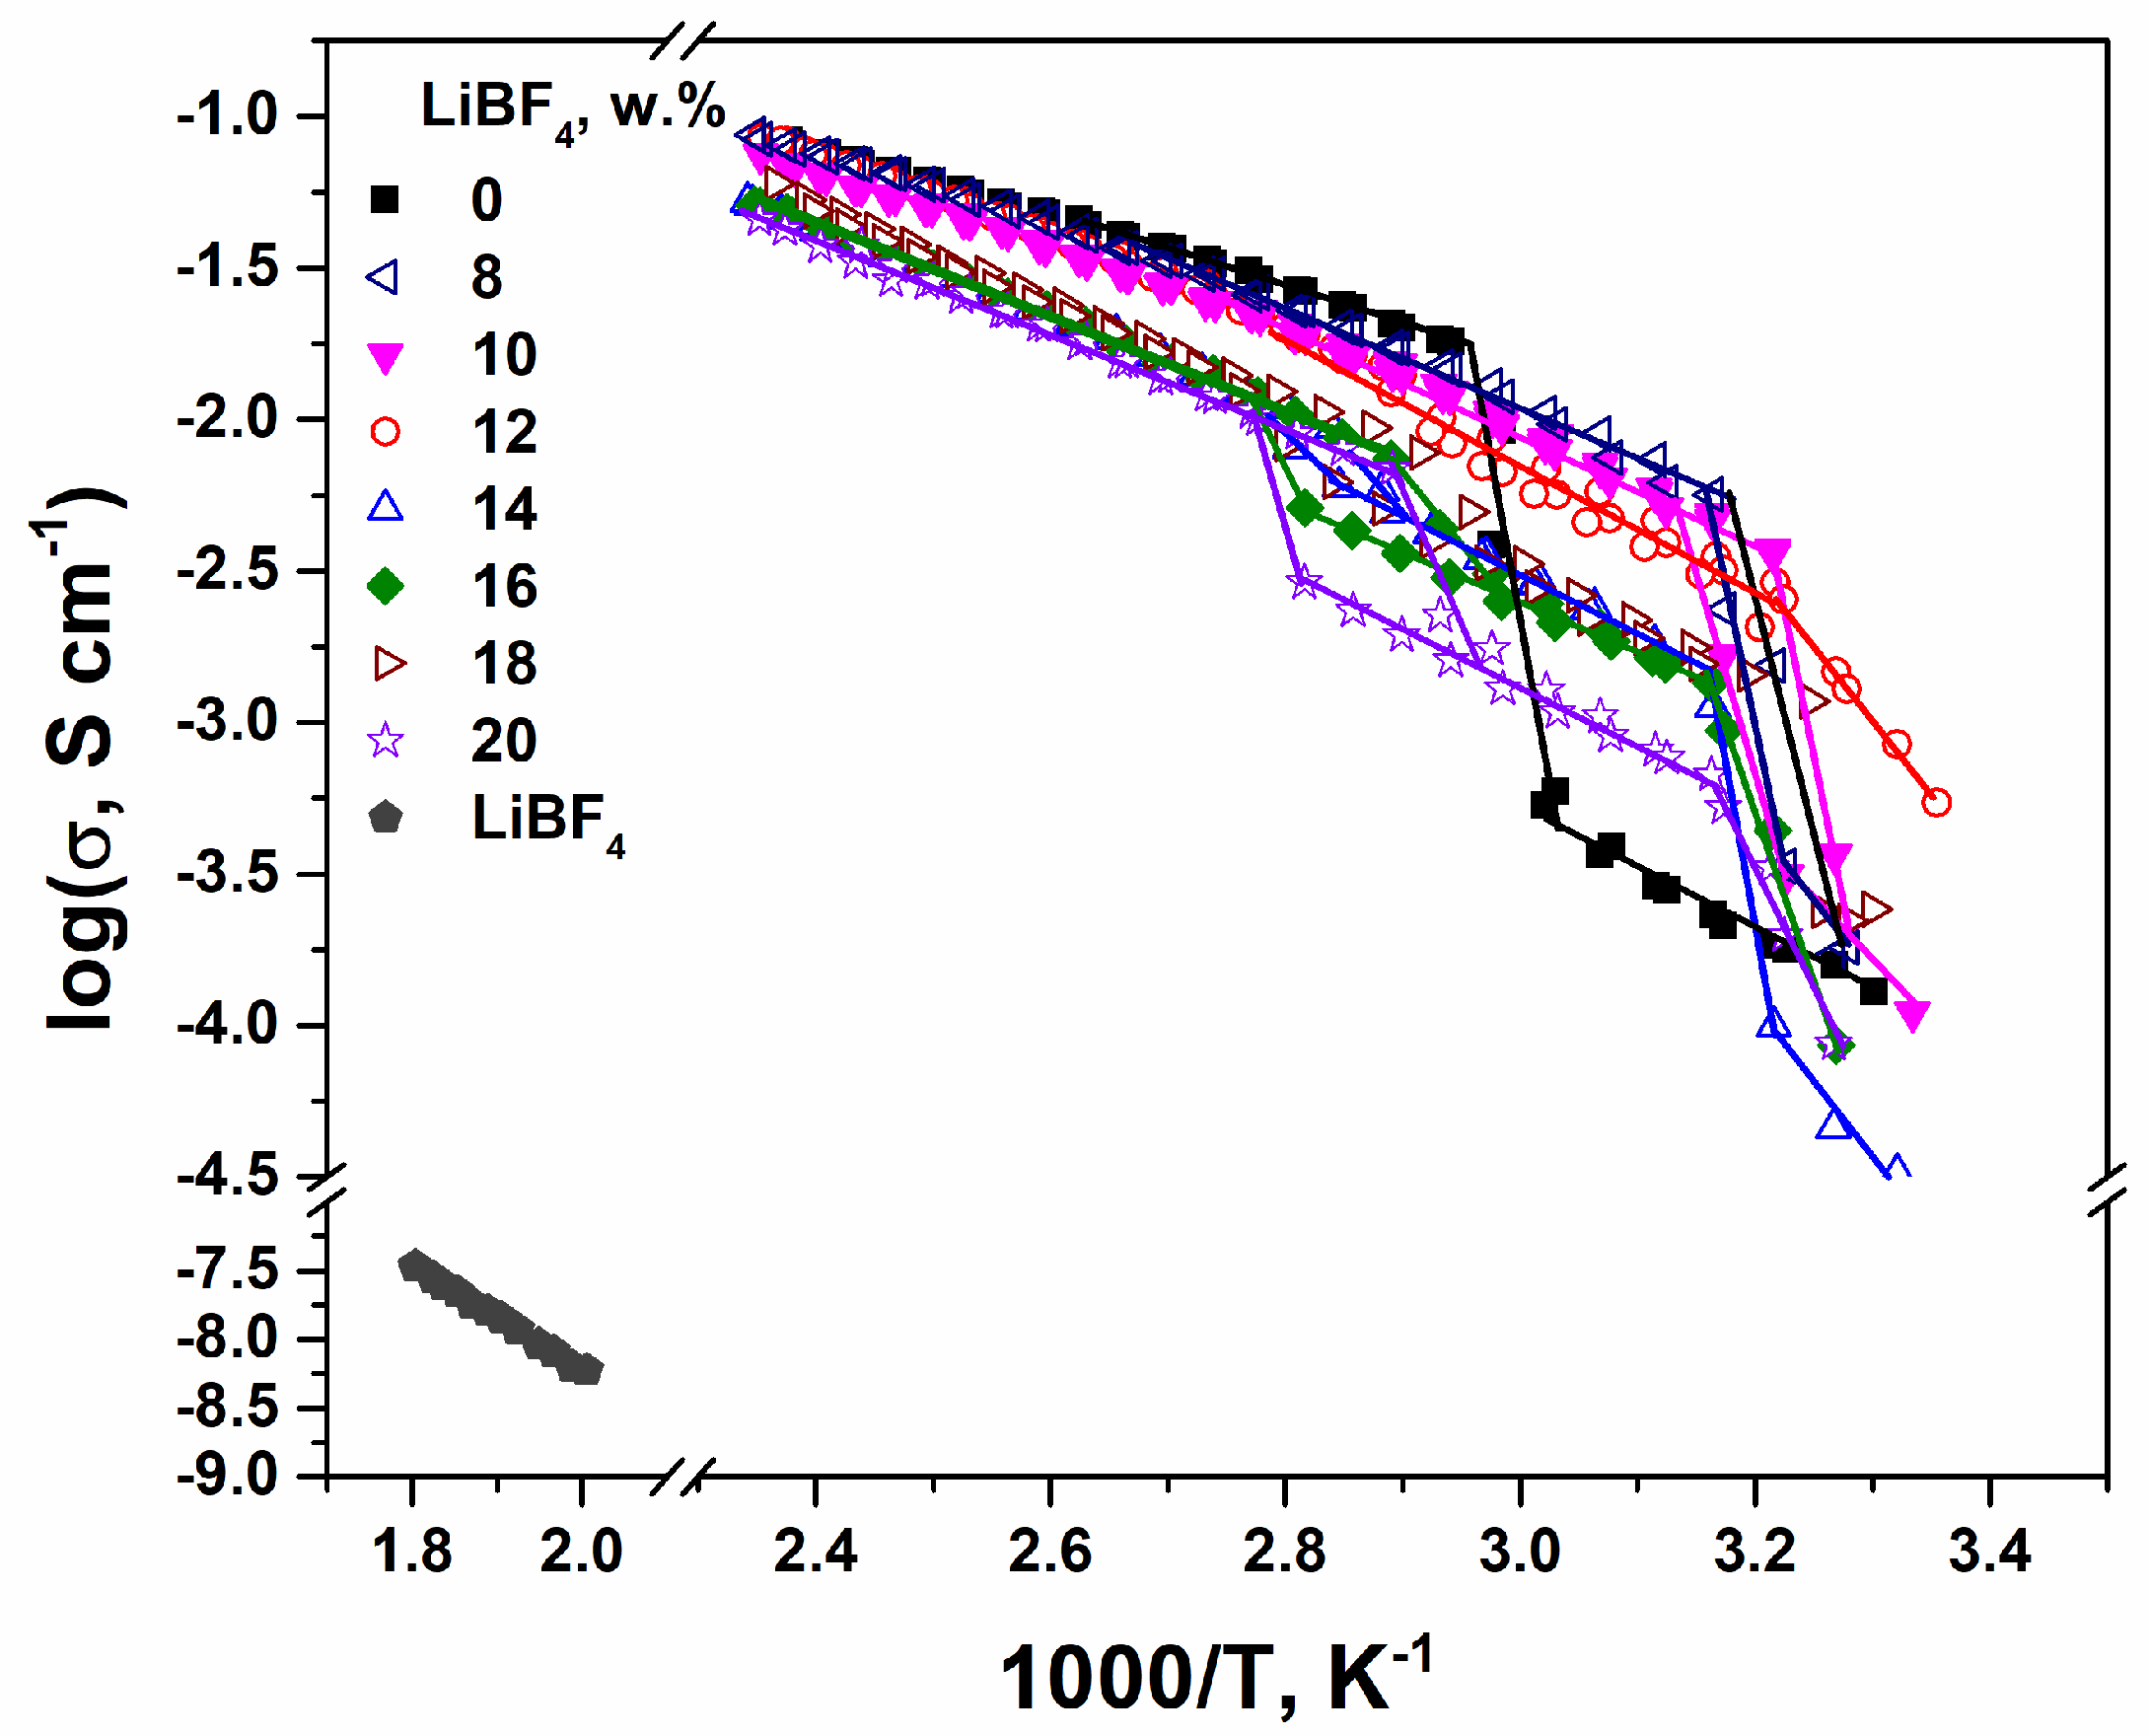
Temperature dependences of conductivity for the samples under study obtained on the second heating-cooling cycle are shown in Figure 2. The high-temperature conductivity region of pure salt [N13pyr]BF4 relates to a molten state where the salt is a typical ionic liquid with the conductivity of 4.0·10−2 S cm−1 at 100 °C. The melting of the salt occurs at 60 °C, in good agreement with the DSC data, and is accompanied by an abrupt change in the conductivity. It should be noted that the conductivity of the samples in a liquid state decreases with the LiBF4 content. A similar observation was reported earlier for ionic liquids [N14pyr]TFSI, [N15pyr]TFSI [28], and [N14pyr]TFSI, doped with lithium salt LiTFSI [15]. The effect was explained by the cross-linking of anions between lithium cations, forming aggregates and eventually networks of ions, resulting in a dramatic decrease in the ionic conductivity [28]. The addition of a small amount (2–4 wt%) of LiBF4 results in a diminishing melting temperature. In samples containing 12–20 wt% LiBF4, two conductivity jumps were observed: one at a temperature of nearly 40 °C and another at higher temperatures in the range of 80–90 °C.
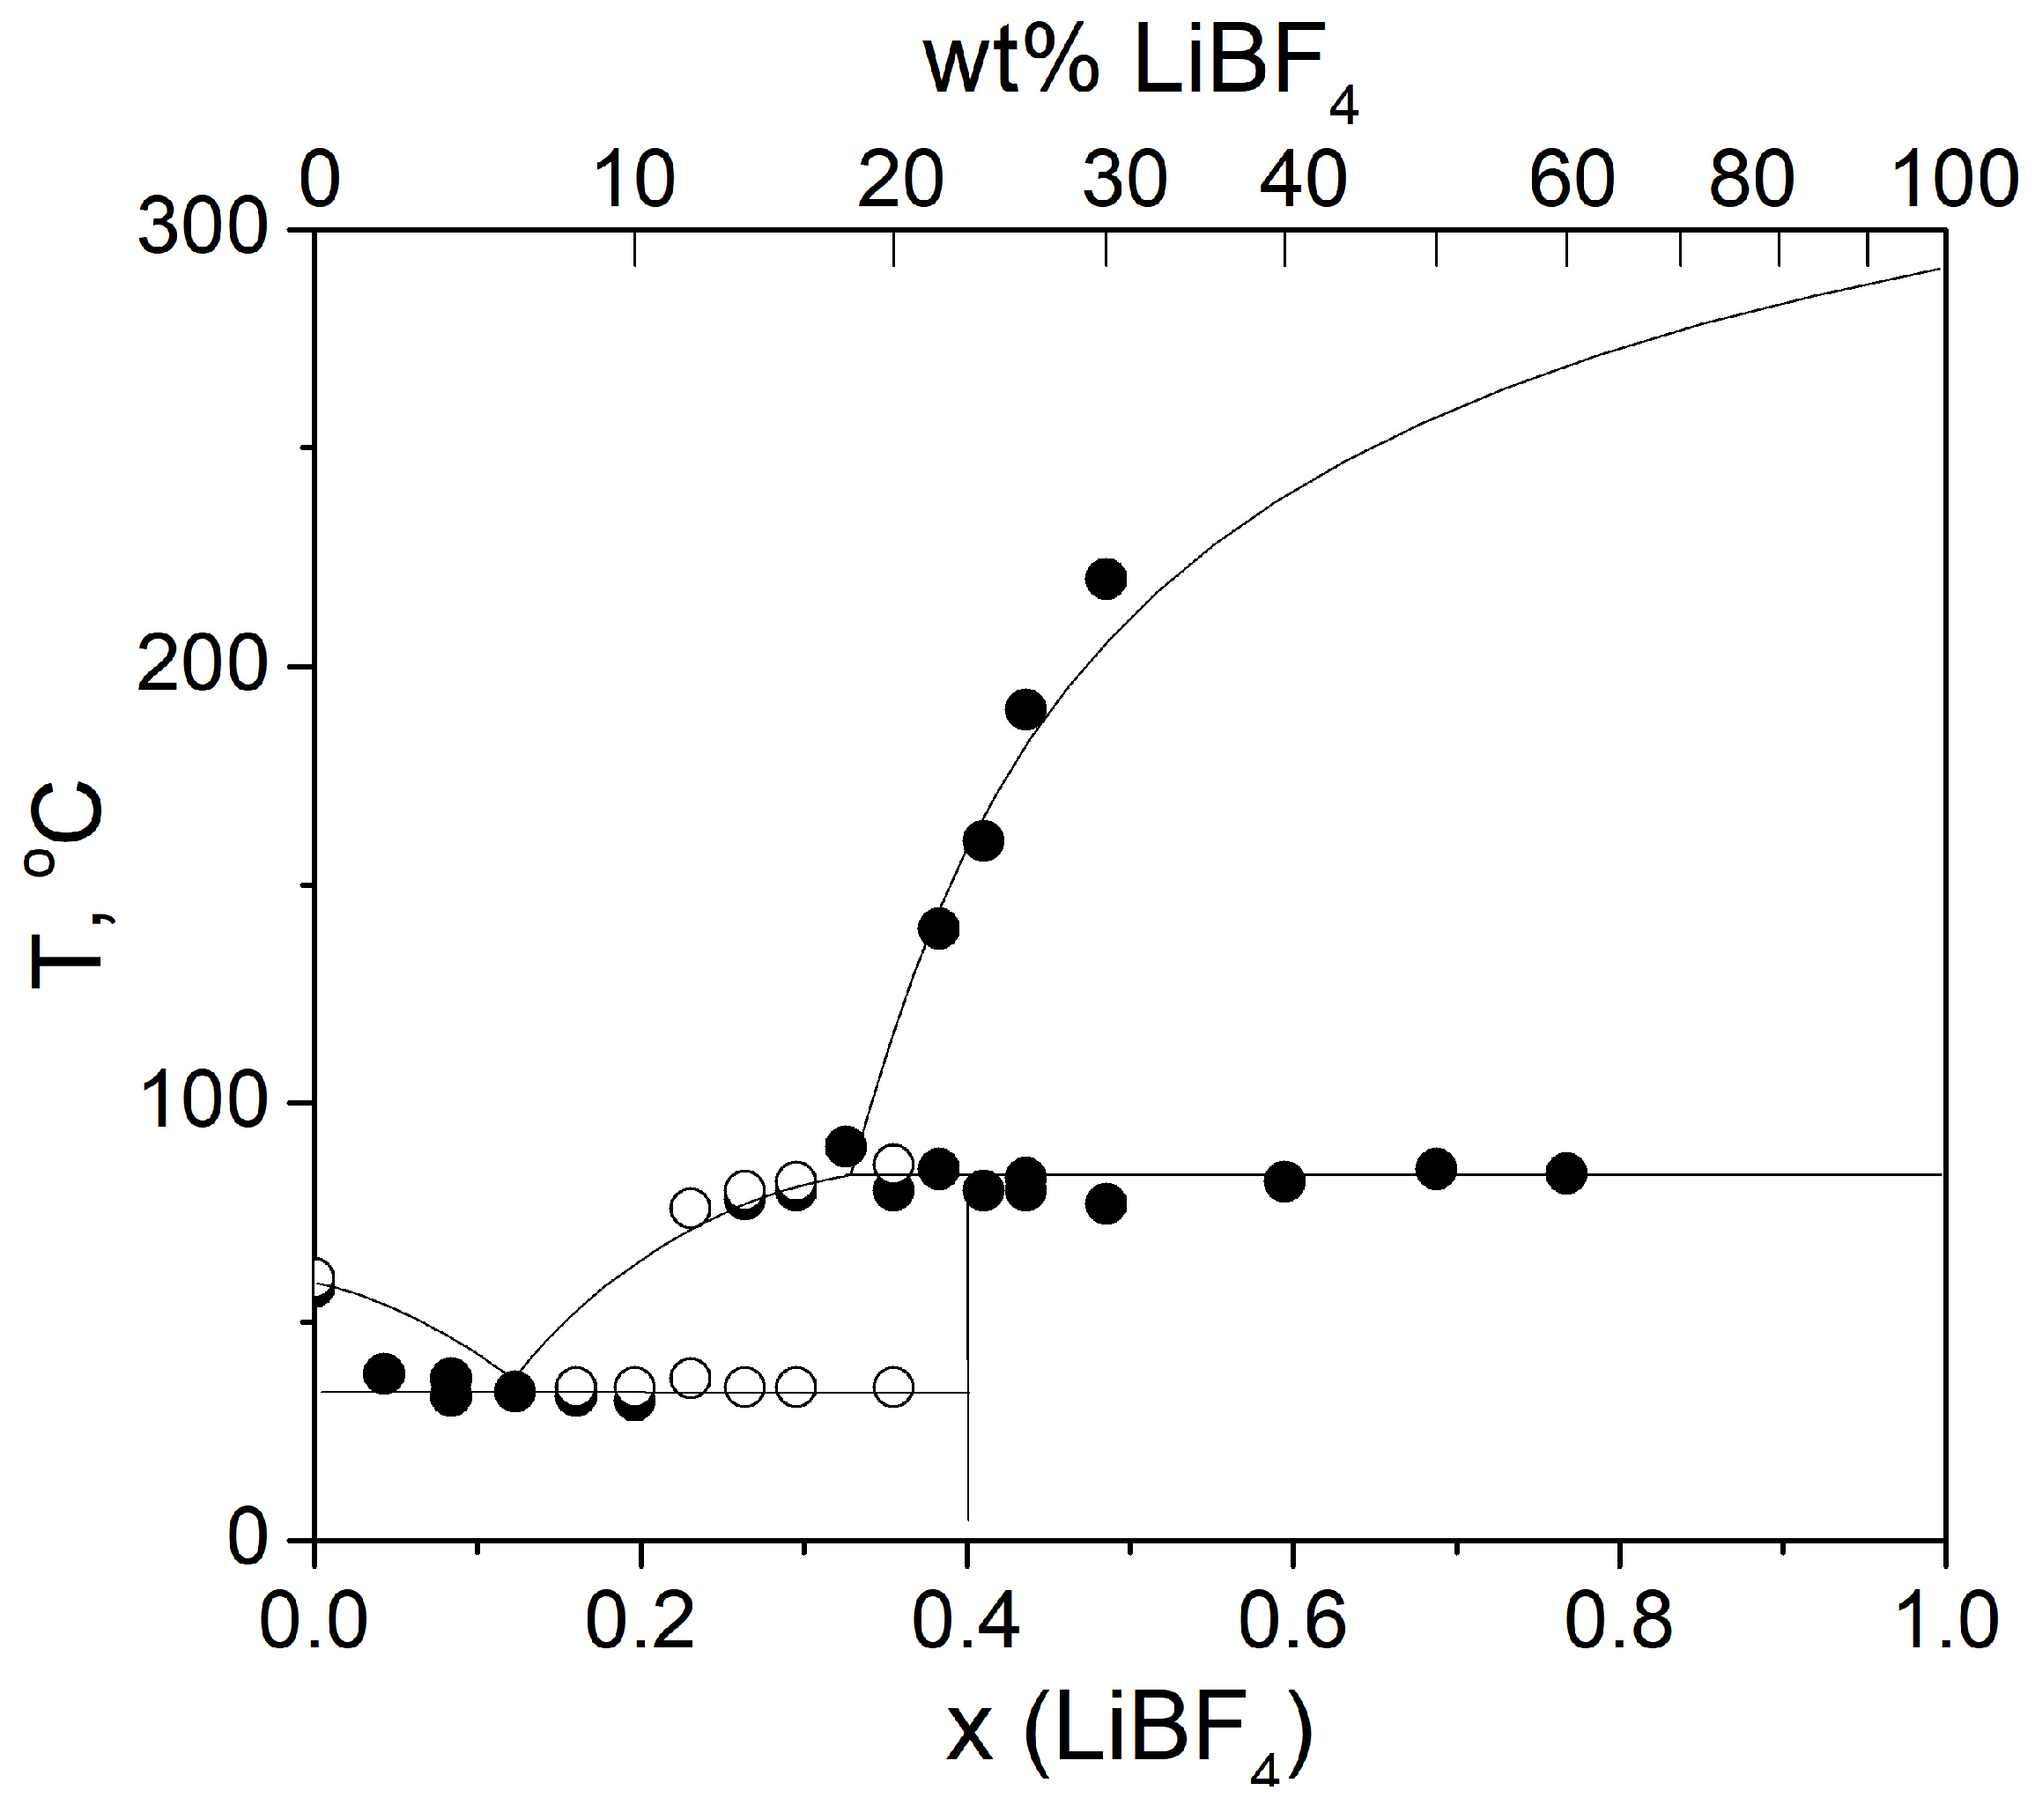
The observed series of phase transitions detected using DSC and conductivity studies may be interpreted in terms of the phase diagram of the (1-x)[N13pyr]BF4-xLiBF4 binary system (x is the molar fraction of LiBF4) shown in Figure 3. The melting temperature of pure LiBF4 was taken to be 296 °C.
The diagram includes two concentration regions:
- at 0 < x < 0.40, there are eutectics with an eutectic temperature of 35 °C and the eutectic point near x = 0.12. The eutectics are formed by [N13pyr]BF4 and a new compound corresponding to x = 0.40 or to the composition with the formula 3[N13pyr]BF4·2LiBF4.
- at 0.40 < x < 1, the diagram relates to the peritectic type, with a peritectic temperature of nearly 80 °C. Above the peritectic temperature, the compound 3[N13pyr]BF4·2LiBF4 incongruently melts with the formation of liquid-phase [N13pyr]BF4-LiBF4 and solid LiBF4.
As reported earlier, a new unknown phase was detected in the [N11pyr]BF4-LiBF4 binary system [25]. Mixed compounds [N14pyr]TFSI·2LiTFSI and [N14pyr]TFSI·2LiTFSI form in binary systems [N14pyr]TFSI-LiTFSI and [N15pyr]TFSI- LiTFSI [28]. Though the authors did not discuss details of binary phase diagrams, they successfully refined the crystal structures of these phases. A mixed compound was observed in the binary system [1-ethyl-3-methylimidazolium]TFSI-LiTSFI at a molar ratio of the organic salt to LiTSFI of 1:2, and its crystal structure was reported [29]. A phase diagram of the binary system N2222TFSI-LiTFSI was reported in the paper [30], and two mixed compounds, N2222TFSI·LiTFSI and N2222TFSI·2LiTFSI, were found. Therefore, the existence of mixed salt seems not to be surprising.
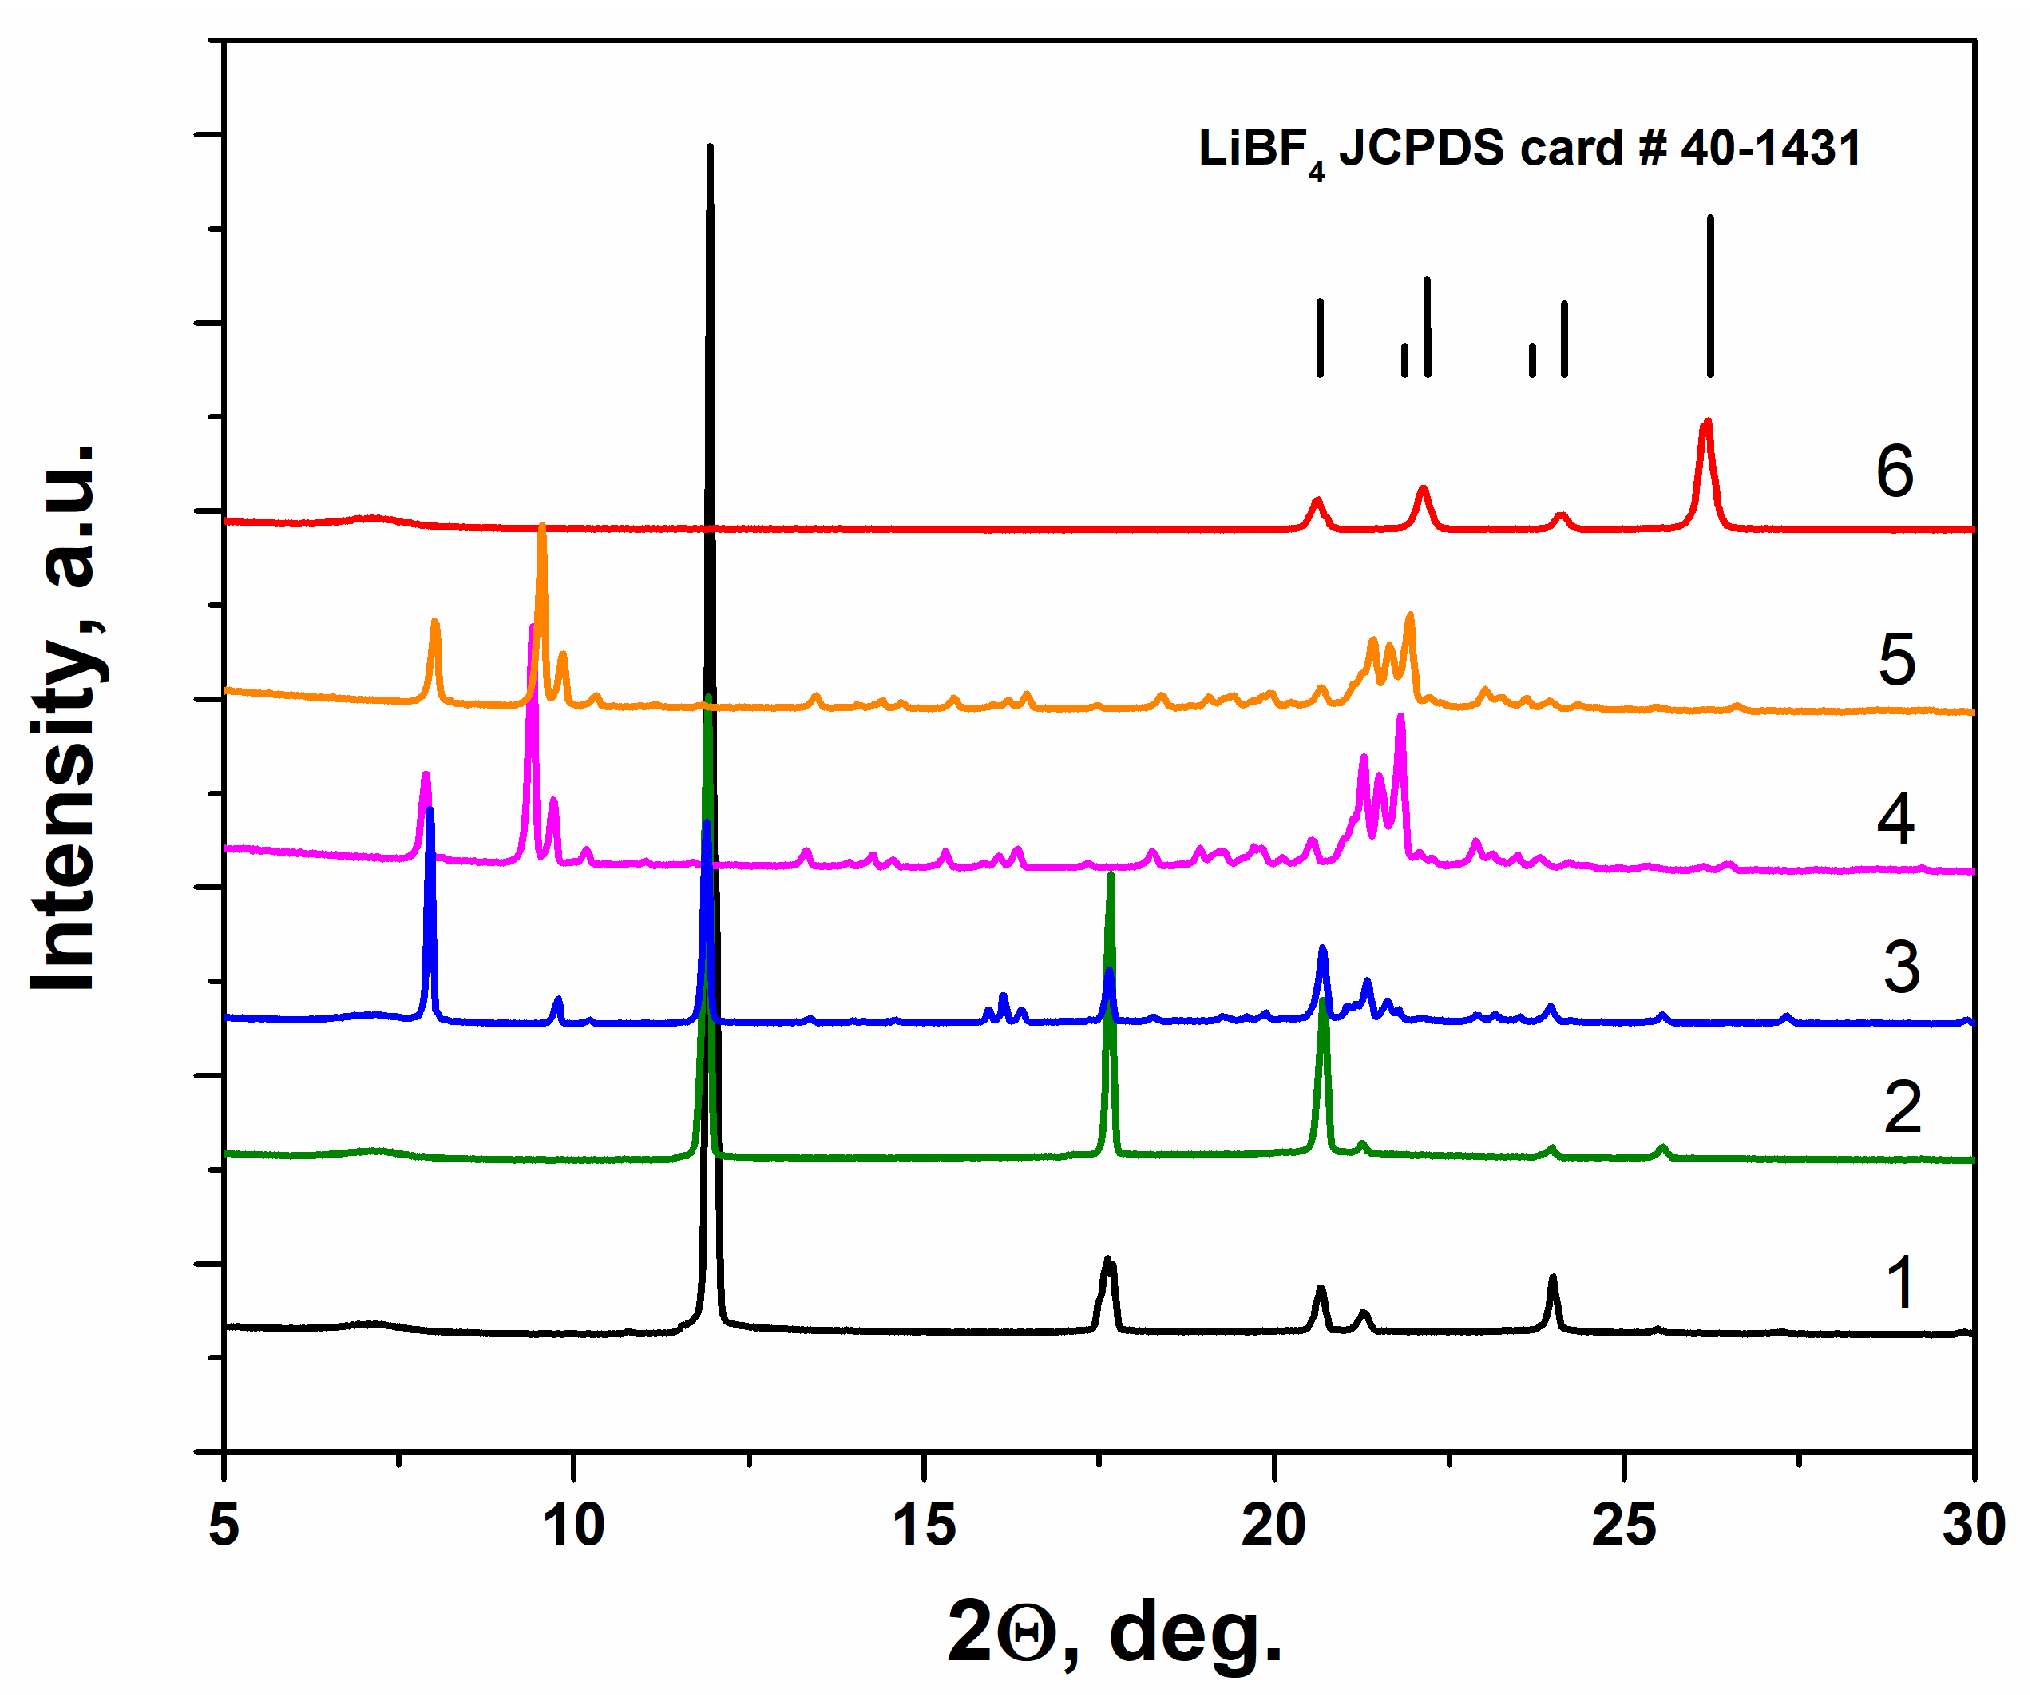
The existence of the new phase in the 3[N13pyr]BF4·2LiBF4 system was confirmed by X-ray diffraction data presented in Figure 4. One can see that on the X-ray diffraction patterns of the sample containing 12–40 wt% LiBF4, there are several reflections at 2Θ values of 7–10°, 13–15° and 18–22° that cannot be attributed to individual [N13pyr]BF4 or LiBF4 phases. The above-mentioned peaks belong to the 3[N13pyr]BF4·2LiBF4 phase. The sample containing 2 and 12 wt% LiBF4 (x < 0.40) comprises a mixture of [N13pyr][BF4] and this phase. In turn, in the X-ray diffraction pattern of the samples containing 26 and 40 wt% LiBF4, no reflections of the [N13pyr]BF4 phase can be seen, and only reflections of 3[N13pyr]BF4·2LiBF4 are present. Evidently, in the concentration region of 24–100 wt% LiBF4 (0.40 < x < 1), the sample contains two phases: 3[N13pyr]BF4·2LiBF4 and LiBF4. Thus, X-ray data are in qualitative agreement with the phase diagram proposed above.
3.2. Electrochemical Studies
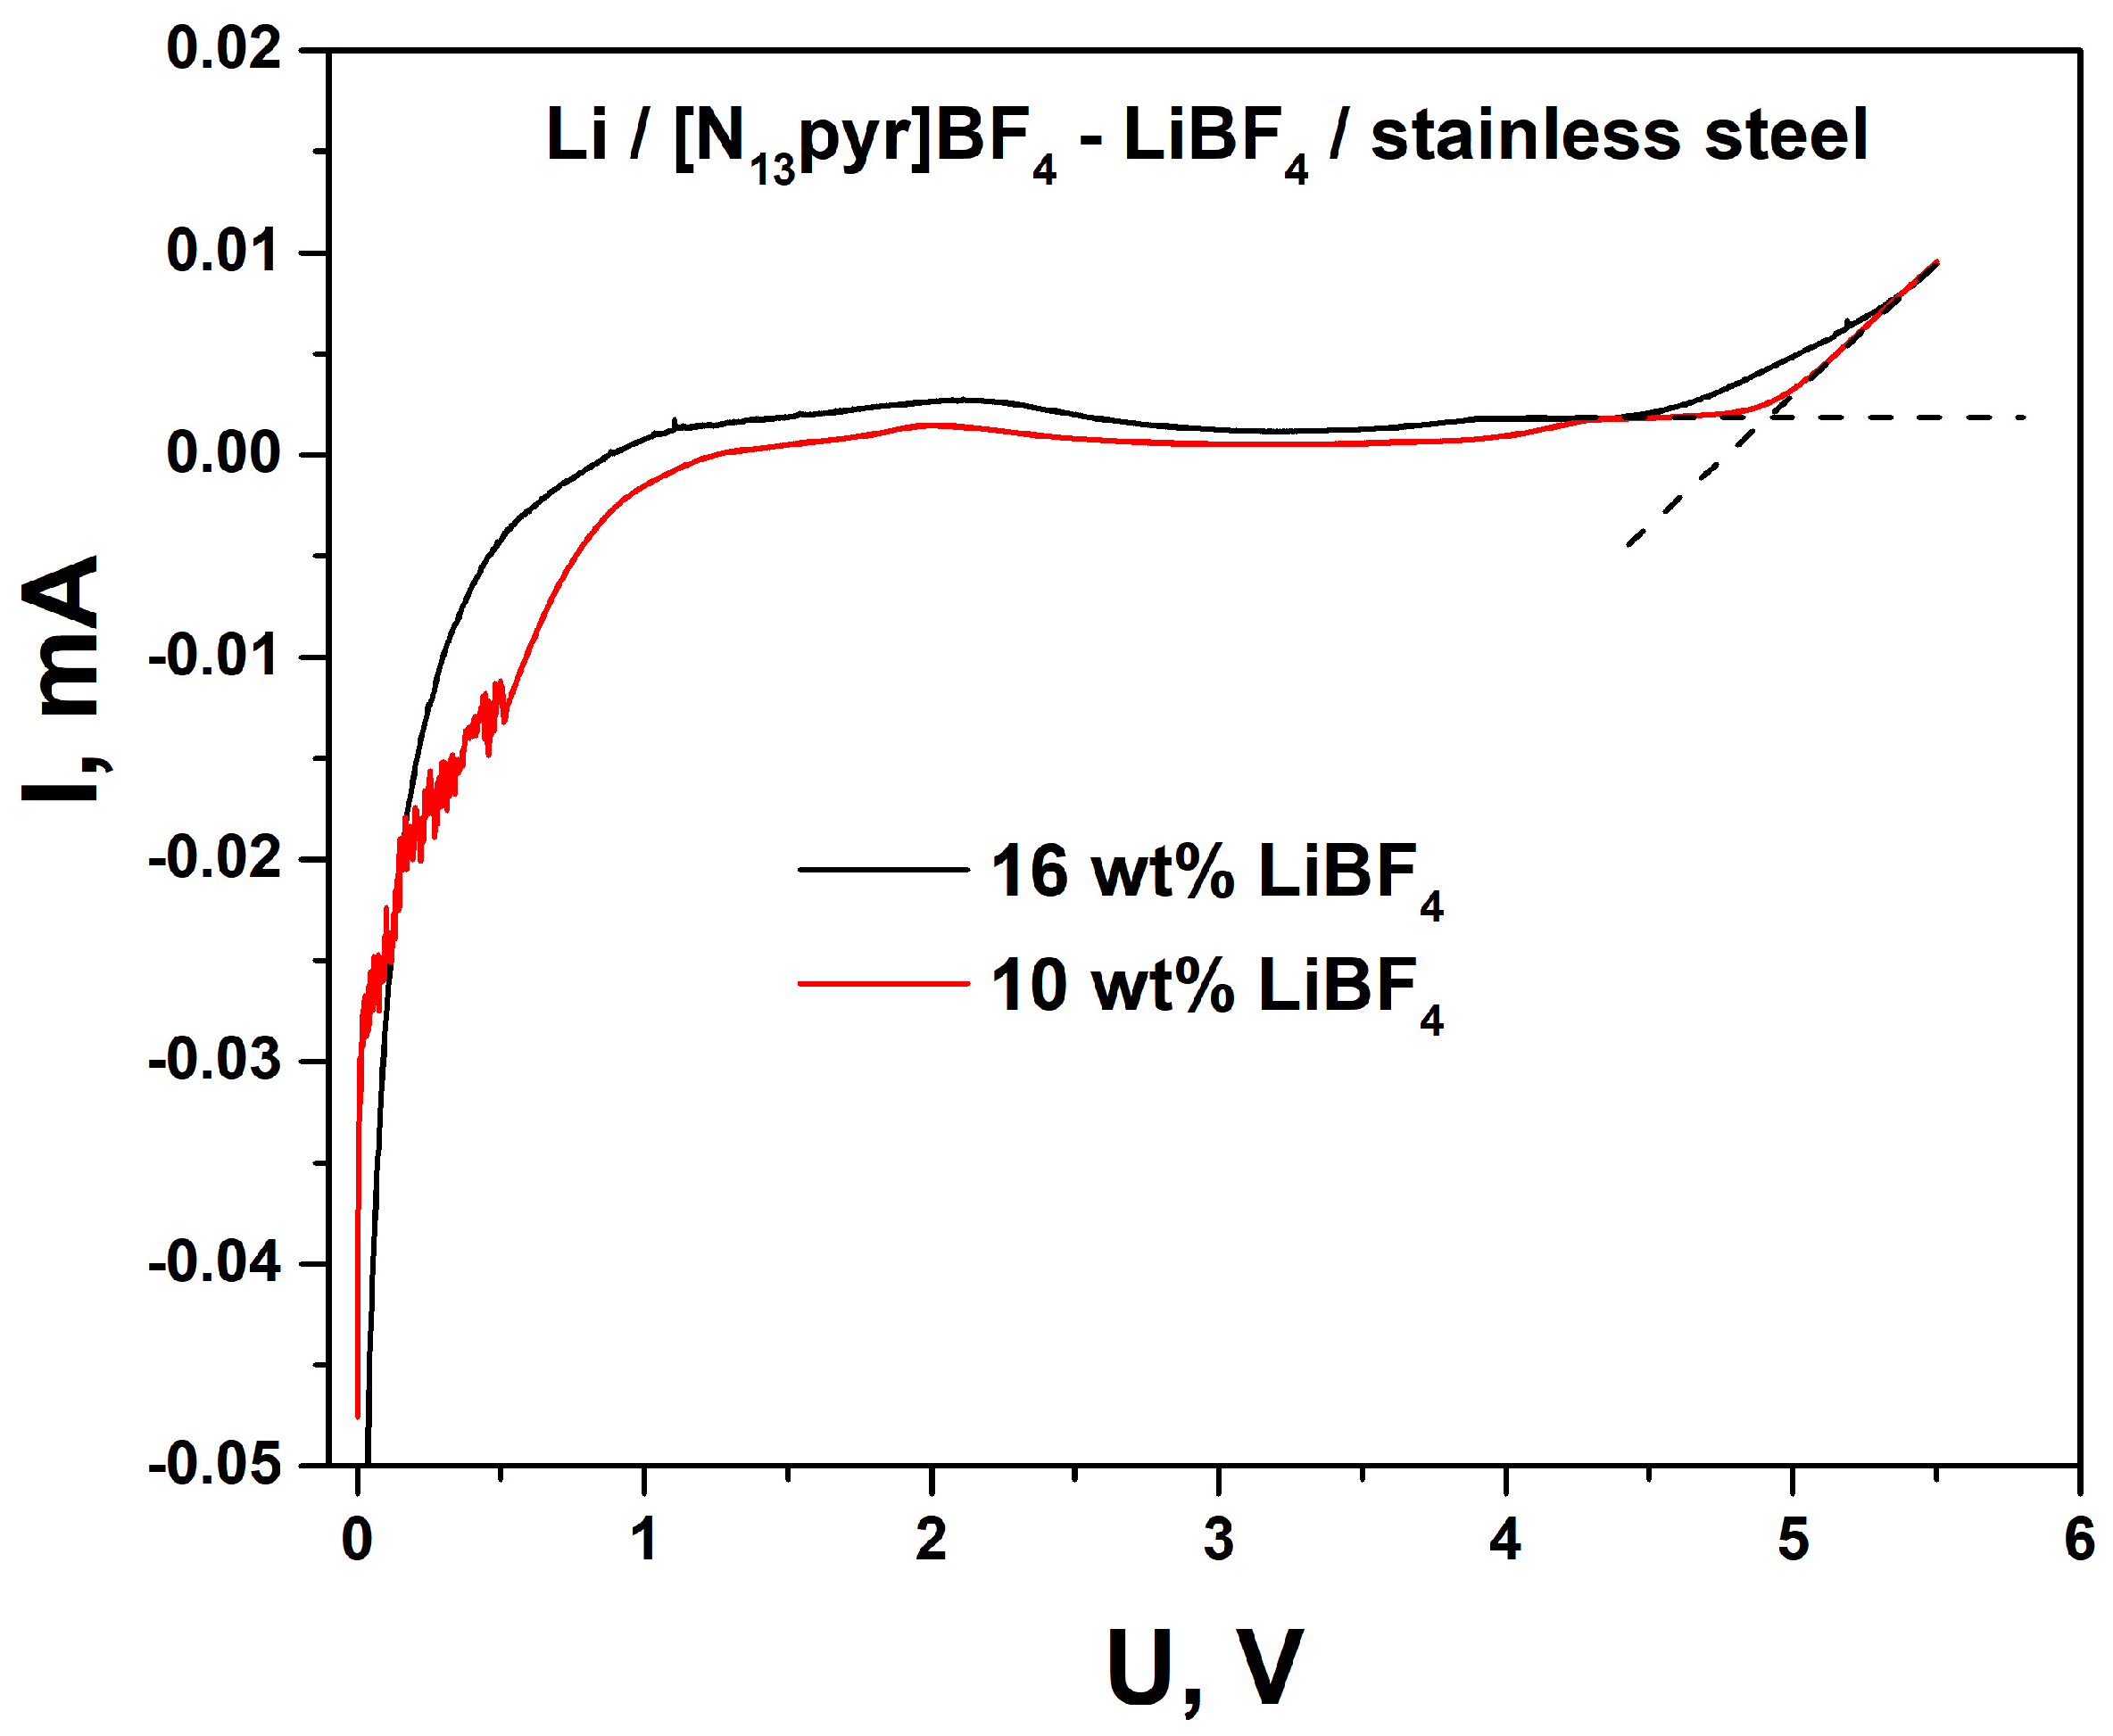
Electrochemical stability is an important property of the electrolyte, indicating its applicability in batteries or supercapacitors. Ionic liquids are promising electrolytes for lithium batteries due to their wide electrochemical window values, thermal stability, and high ionic conductivity. Typically, the electrochemical window value of 4–4.5 V is enough for the electrolytes used in lithium batteries. Ionic liquids containing such cations, such as quaternary ammonium and pyrrolidinium ions, meet this requirement [3]. Results of potentiodynamic studies of the samples containing 10 and 16 wt% LiBF4 are presented in Figure 5. From the volt-ampere curves, one can see that the electrolytes are electrochemically stable in the potential range from 0 to 5.5 V (vs. Li), with the electrochemical window around 5 V. Accordingly, solid electrolytes in the system [N13pyr]BF4-LiBF4 may be used in solid-state lithium batteries with a voltage less than 5 V. These data agree with the previous reports indicating the salt [N11pyr]BF4 has a sufficient electrochemical window for Li battery application [27].
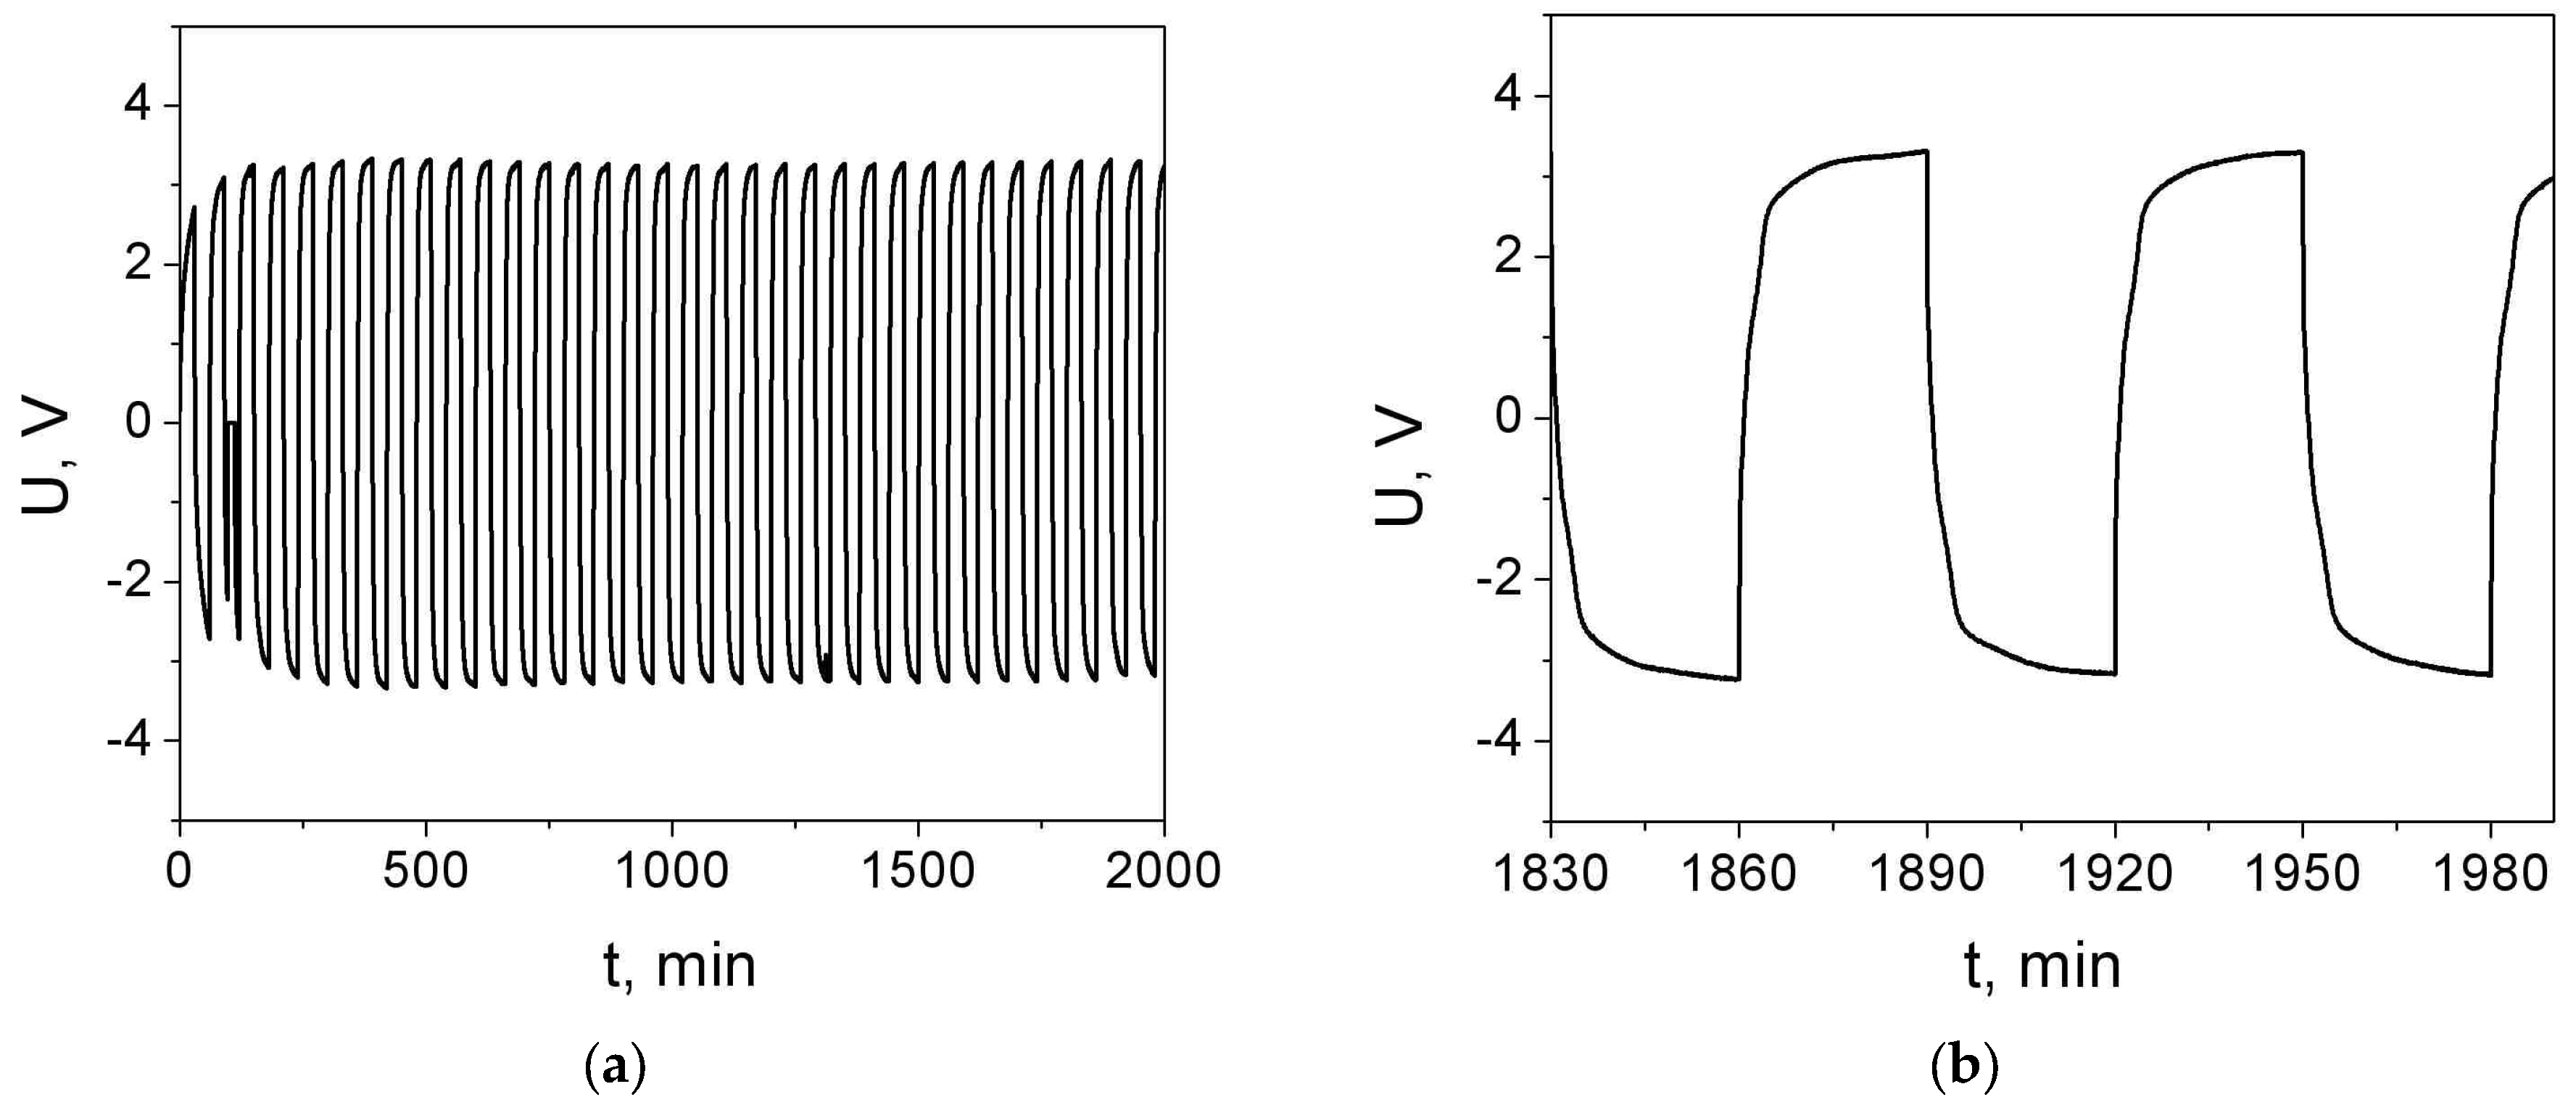
For galvanostatic testing, a sample of 10 wt% LiBF4 was chosen. The galvanostatic cycling results of the sample obtained at 40 °C are shown in Figure 6. In earlier studies, a preconditioning process that results in a significant reduction in the internal resistance of a symmetrical Li cell was observed in lithium-doped [N12pyr]NTf2 [31] and [N11pyr]BF4 [25] salts. When measured in galvanostatic mode at small currents, polarization effects dominate, clearly demonstrating the change in the polarization resistance of the lithium electrode during the charge/discharge processes. However, as seen in Figure 6a, the preconditioning effect, i.e., the decrease in the polarization voltage with cycling, was not observed. Instead, the polarization increased during the first 200–250 min, and then the intensity and shape of the U (t) peaks did not change. No noticeable asymmetry of the signal was observed, indicating the identical behavior of both electrodes.
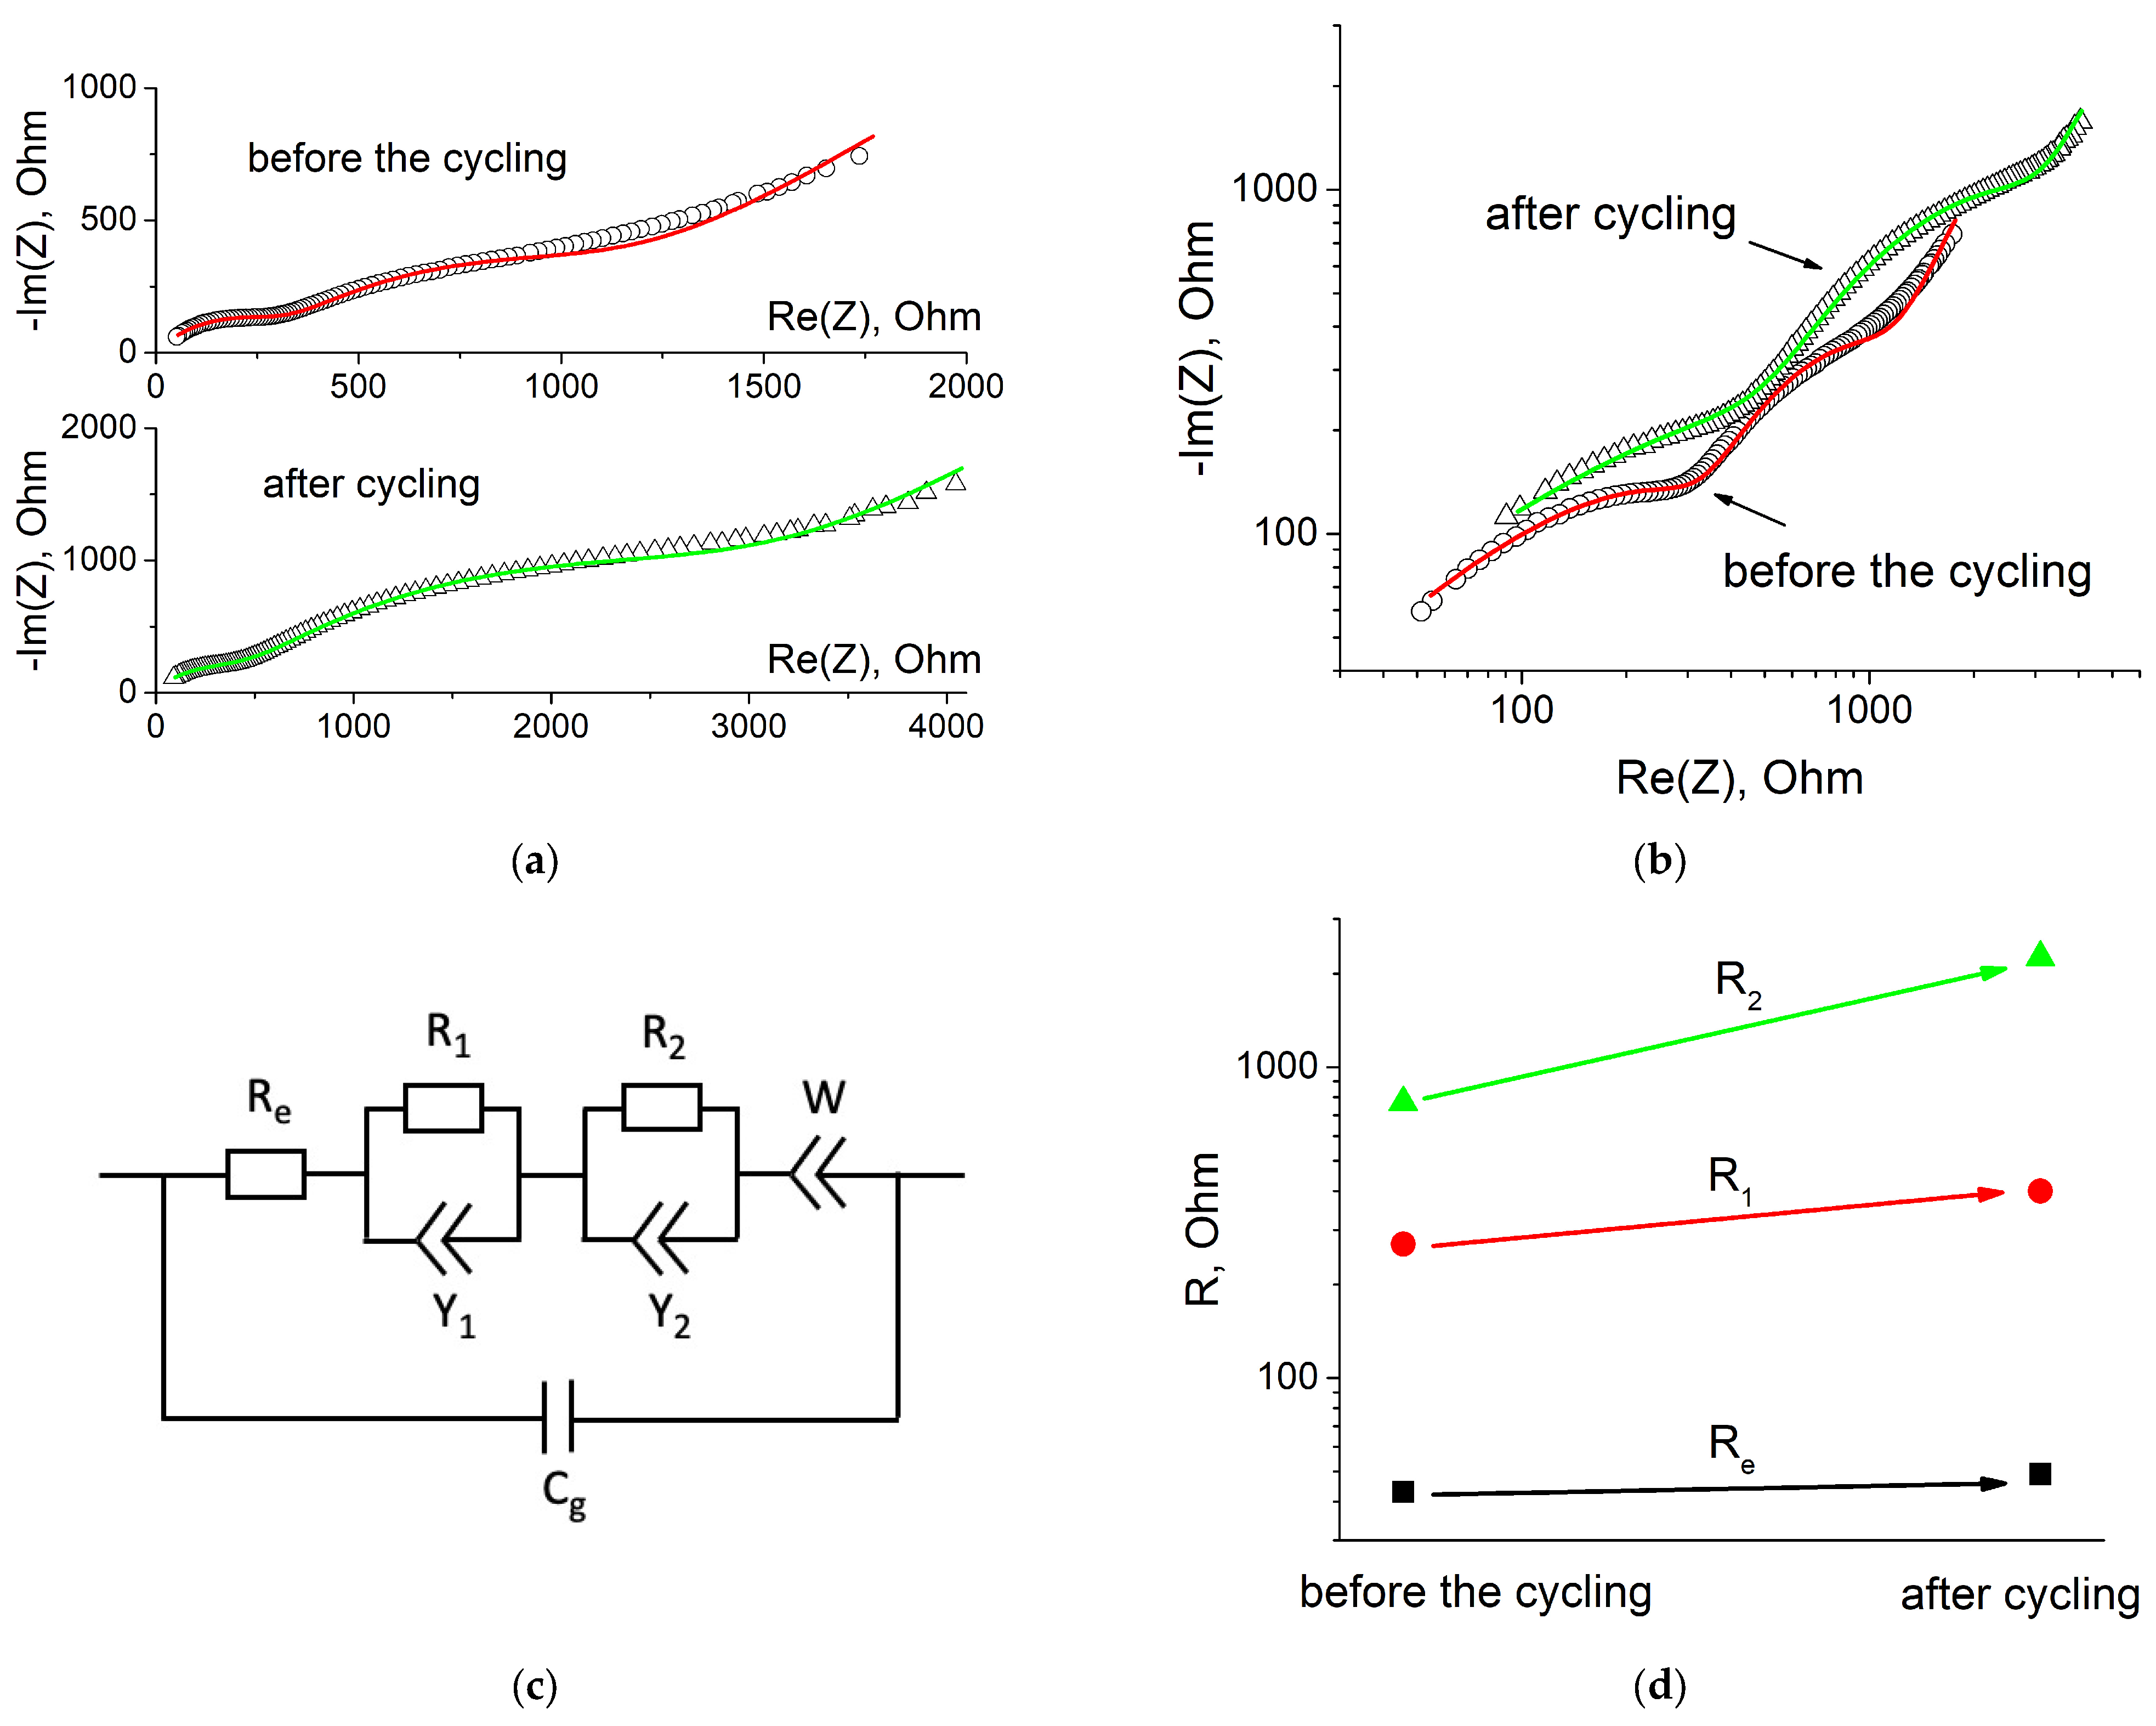
In addition to the galvanostatic cycling experiments, the impedance spectra were recorded at 40 °C for the same cell before and after the cycling. The results presented as Nyquist plots in conventional coordinates and in logarithmic scale are shown in Figure 7a,b, respectively. To interpret the impedance data, an equivalent circuit depicted in Figure 7c was used. The circuit includes the electrolyte resistance, Re, connected in series to three impedances, corresponding to the charge transfer impedance, Z1, the impedance of the solid electrolyte interphase (SEI), Z2, and the Warburg impedance, W, of the electrode:
The impedances (1) and (2) include the active resistances, R1 and R2, connected in parallel to the constant phase elements (CPE), Y1 and Y2, respectively. Each CPE is defined by the terms Y10 and Y20 and the exponents n1 and n2, respectively. The Warburg impedance was used in a simple form and characterized by the parameter W0. The geometric capacitance Cg is connected in parallel to the impedances above. The fitting of the theoretical dependence to the experimental data was carried out using the EIS Spectrum Analyzer program [32]. The fitting curves are shown in Figure 7a,b and the parameters of the equivalent circuit are listed in Table 1.
As seen from Table 1, before the cycling, the electrolyte resistance Re was nearly 43 Ohm, in agreement with the data obtained from the conductivity measurements for the pure electrolyte at 40 °C. The electrolyte resistance may be estimated by extrapolating the high-frequency part of the impedance curve to the Re(Z) axis. The first semicircle was attributed to the R1-Y1 circuit, and the charge transfer resistance value, R1 = 270 Ohm, exceeded the electrolyte resistance. The second semicircle on the impedance plot was attributed to the R2-Y2 circuit related to SEI. A relatively high value of the SEI resistance, R2 = 770 Ohm, seems to be caused by the presence of the SEI formed when the organic salt electrolyte came into contact with the fresh surface of the metallic lithium. The impedance curve’s low-frequency portion corresponds to the electrode impedance, which was assumed to be described by the Warburg diffusion impedance, Equation (3).
The cell’s total resistance increased after cycling. As seen from Figure 7d, the electrolyte resistance did not noticeably change, whereas R1 and R2 increased several times. Evidently, the growth of the SEI resistance R2 is caused by the increase in SEI thickness during cycling. In turn, this effect may be explained by lithium dissolution, deposition, and dendrite formation. It would be highly desirable to analyze cross-sections of the Li/electrolyte/Li cells after cycling by SEM to study the electrolyte/Li metal interface. However, this work requires the removal of the lithium electrode to the open air before SEM experiments and may result in the degradation of the lithium electrode. The increase in the charge transfer resistance, R1, is likely to be caused by the contamination of the contact surface Li/SEI by the insulating products of the electrochemical reactions taking place in the course of the SEI formation.
The absence of the precondition effect may be caused by the formation of a rather dense and insulating SEI on the lithium electrode due to the reaction of the [N13pyr]BF4 salt with lithium. Possibly, the purity of the initial lithium surface and the organic salt are key factors responsible for the cycling behavior of the Li/electrolyte/Li cells. Nevertheless, despite the fact that the precondition effect was not observed, the character of the galvanostatic cycling curves indicates the appreciable contribution of lithium-ion conductivity in the [N13pyr]BF4-LiBF4 samples, which suggests that these electrolytes may be used in solid-state lithium-ion batteries. The results obtained are preliminary; the galvanostatic cycling experiments are in progress to investigate in more detail the electrode effects observed in the binary system under study as a function of the LiBF4 concentration and temperature.
4. Conclusions
It was shown that the plastic phase of [N13pyr]BF4 is a suitable matrix to prepare lithium solid electrolytes in the binary system [N13pyr]BF4-LiBF4. In the present work, solid electrolytes were prepared by the addition of LiBF4 to the plastic phase of [N13pyr]BF4, and their physical and electrical properties were investigated. The electrolytes [N13pyr]BF4-LiBF4 containing 8–20 wt% LiBF4 are solid at temperatures below 80 °C and have a high ionic conductivity of ~10−3–10−2 S cm−1 at 60 °C. Based on the results of DSC and conductivity studies, the phase diagram of the [N13pyr]BF4-LiBF4 binary system was plotted. The diagram includes two concentration regions: the eutectic, formed by [N13pyr]BF4 and a new compound corresponding to x = 0.40 or with the formula 3[N13pyr]BF4·2LiBF4, and the peritectic, at a temperature of nearly 80 °C, where the compound 3[N13pyr]BF4·2LiBF4 incongruently melts with the formation of liquid phase [N13pyr]BF4-LiBF4 and solid LiBF4. The existence of the new phase was supported by X-ray diffraction data. Electrochemical measurements of cells with lithium electrodes were carried out to test the applicability of these materials in lithium batteries. The electrochemical window was determined to be more than 5 V. However, the preconditioning effect reported earlier for relative systems [25,31] was not observed for the [N13pyr]BF4-LiBF4 electrolyte containing 10 wt% LiBF4. According to the results of the impedance measurements, the charge transfer resistance and the SEI resistance values increase with the cycling, indicating an increase in the SEI thickness and the slow degradation of the electrode during the cycling.
Author Contributions
Conceptualization, N.U. and A.U.; methodology, A.U.; investigation, A.U. and D.N.; data curation, N.U.; writing—original draft preparation, N.U.; writing—review and editing, N.U. All authors have read and agreed to the published version of the manuscript.
Funding
This research was funded by the Russian Science Foundation, project no. 23-23-00556.
Data Availability Statement
Not applicable.
Acknowledgments
The authors thank Arina Ukhina for carrying out X-ray diffraction experiments.
Conflicts of Interest
The authors declare no conflict of interest.
References
- Zhang, S.; Lu, X.; Zhou, Q.; Li, X.; Zhang, X.; Li, S. Ionic Liquids. Physicochemical Properties, 1st ed.; Elsevier: Amsterdam, The Netherlands, 2009. [Google Scholar]
- Tiago, G.A.O.; Matias, I.A.S.; Ribeiro, A.P.C.; Martins, L.M.D.R.S. Application of Ionic Liquids in Electrochemistry—Recent Advances. Molecules 2020, 25, 5812. [Google Scholar] [CrossRef] [PubMed]
- Martins, V.L.; Torresi, R.M. Ionic liquids in electrochemical energy storage. Curr. Opin. Electrochem. 2018, 9, 26–32. [Google Scholar] [CrossRef]
- MacFarlane, D.R.; Forsyth, M. Plastic Crystal Electrolyte Materials: New Perspectives on Solid State Ionics. Adv. Mater. 2001, 13, 957–966. [Google Scholar] [CrossRef]
- Wang, X.; Kerr, R.; Chen, F.; Goujon, N.; Pringle, J.M.; Mecerreyes, D.; Forsyth, M.; Howlett, P.C. Toward High-Energy-Density Lithium Metal Batteries: Opportunities and Challenges for Solid Organic Electrolytes. Adv. Mater. 2020, 32, e1905219. [Google Scholar] [CrossRef] [PubMed]
- Timmermans, J. Plastic crystals: A historical review. J. Phys. Chem. Solids 1961, 18, 1–8. [Google Scholar] [CrossRef]
- Uvarov, N.F.; Iskakova, A.A.; Bulina, N.V.; Gerasimov, K.B.; Slobodyuk, A.B.; Kavun, V.Y. Ion conductivity of the plastic phase of the organic salt [(C4H9)4N]BF4. Russ. J. Electrochem. 2015, 51, 491–494. [Google Scholar] [CrossRef]
- Iskakova, A.A.; Ulikhin, A.S.; Uvarov, N.; Gerasimov, K.B.; Mateishina, Y.G. Comparative study of the ion conductivities of substituted tetrabutylammonium salts (C4H9)4N]BF4 and [(C4H9)4N]Br. Russ. J. Electrochem. 2017, 53, 880–883. [Google Scholar] [CrossRef]
- Uvarov, N.F.; Asanbaeva, N.B.; Ulihin, A.S.; Mateyshina, Y.G.; Gerasimov, K.B. Thermal Properties and Ionic Conductivity of Tetra-n-Butylammonium Perchlorate. Crystals 2022, 12, 515. [Google Scholar] [CrossRef]
- Armel, V.; Velayutham, D.; Sun, J.; Howlett, P.C.; Forsyth, M.; MacFarlane, D.R.; Pringle, J.M. Ionic liquids and organic ionic plastic crystals utilizing small phosphonium cations. J. Mater. Chem. 2011, 21, 7640–7650. [Google Scholar] [CrossRef] [Green Version]
- Enomoto, T.; Kanematsu, S.; Tsunashima, K.; Matsumoto, K.; Hagiwara, R. Physicochemical properties and plastic crystal structures of phosphonium fluorohydrogenate salts. Phys. Chem. Chem. Phys. 2011, 13, 12536–12544. [Google Scholar] [CrossRef] [Green Version]
- Moriya, M.; Watanabe, T.; Nabeno, S.; Sakamoto, W.; Yogo, T. Crystal structure and solid-state ionic conductivity of cyclic sulfonylamide salts with cyano-substituted quaternary ammonium cations. Chem. Letts. 2014, 43, 108–110. [Google Scholar] [CrossRef]
- Matsumoto, H.; Yanagida, M.; Tanimoto, K.; Nomura, M.; Kitagawa, Y.; Miyazaki, Y. Highly Conductive Room Temperature Molten Salts Based on Small Trimethylalkylammonium Cations and Bis(trifluoromethylsulfonyl)imide. Chem. Lett. 2000, 29, 922–923. [Google Scholar] [CrossRef]
- Howlett, P.; MacFarlane, D.; Hollenkamp, A.F. High Lithium Metal Cycling Efficiency in a Room-Temperature Ionic Liquid. Electrochem. Solid-State Lett. 2004, 7, A97–A101. [Google Scholar] [CrossRef]
- McCallum, R.; Barghamadi, M.; Forsyth, C.; Hollenkamp, A.F.; Oldham, G.; Mahon, P.J.; Rüther, T. Comparing the Physicochemical, Electrochemical, and Structural Properties of Boronium versus Pyrrolidinium Cation-Based Ionic Liquids and Their Performance as Li-Ion Battery Electrolytes. J. Phys. Chem. C 2021, 125, 8055–8067. [Google Scholar] [CrossRef]
- Efthimiadis, J.; Pas, S.J.; Forsyth, M.; MacFarlane, D.R. Structure and transport properties in an N,N-substituted pyrrolidinium tetrafluoroborate plastic crystal system. Solid State Ionics 2002, 154–155, 279–284. [Google Scholar] [CrossRef]
- Pringle, J.M.; Adebahr, J.; MacFarlane, D.R.; Forsyth, M. Unusual phase behaviour of the organic ionic plastic crystal N,N-dimethylpyrrolidinium tetrafluoroborate. Phys. Chem. Chem. Phys. 2010, 12, 7234–7240. [Google Scholar] [CrossRef]
- Pringle, J.M. Recent progress in the development and use of organic ionic plastic crystal electrolytes. Phys. Chem. Chem. Phys. 2013, 15, 1339–1351. [Google Scholar] [CrossRef]
- Taniki, R.; Matsumoto, K.; Nohira, T.; Hagiwara, R. All solid-state electrochemical capacitors using N,N-dimethylpyrrolidinium fluorohydrogenate as ionic plastic crystal electrolyte. J. Power Sources 2014, 245, 758–763. [Google Scholar] [CrossRef] [Green Version]
- Howlett, P.C.; Sunarso, J.; Shekibi, Y.; Wasser, E.; Jin, L.; MacFarlane, D.; Forsyth, M. On the use of organic ionic plastic crystals in all solid-state lithium metal batteries. Solid State Ionics 2011, 204-205, 73–79. [Google Scholar] [CrossRef]
- Alarco, P.-J.; Abu-Lebdeh, Y.; Ravet, N.; Armand, M. Lithium conducting pyrazolium imides plastic crystals: A new solid state electrolyte matrix. Solid State Ionics 2004, 172, 53–56. [Google Scholar] [CrossRef]
- Forsyth, M.; Huang, J.; MacFarlane, D.R. Lithium doped N-methyl-N-ethylpyrrolidinium bis(trifluoromethanesulfonyl)amide fast-ion conducting plastic crystals. J. Mater. Chem. 2000, 10, 2259–2265. [Google Scholar] [CrossRef]
- Shekibi, Y.; Rüther, T.; Huang, J.; Hollenkamp, A.F. Realisation of an all solid state lithium battery using solid high temperature plastic crystal electrolytes exhibiting liquid like conductivity (c2mpyrBF4-LiBF4). Phys. Chem. Chem. Phys. 2012, 14, 4597–4604. [Google Scholar] [CrossRef] [PubMed]
- Long, S.M.D.R.; Macfarlane, D.R.; Forsyth, M. Fast ion conduction in molecular plastic crystals. Solid State Ionics 2003, 161, 105–112. [Google Scholar] [CrossRef]
- Jin, L.; Howlett, P.; Efthimiadis, J.; Kar, M.; Macfarlane, D.; Forsyth, M. Lithium doped N,N-dimethyl pyrrolidinium tetrafluoroborate organic ionic plastic crystal electrolytes for solid state lithium batteries. J. Mater. Chem. 2011, 21, 10171–10178. [Google Scholar] [CrossRef] [Green Version]
- Iranipour, N.; Gunzelmann, D.J.; Seeber, A.; Vongsvivut, J.; Doherty, C.; Ponzio, F.; O’Dell, L.A.; Hollenkamp, A.F.; Forsyth, M.; Howlett, P.C. Ionic transport through a composite structure of N-ethyl-N-methylpyrrolidinium tetrafluoroborate organic ionic plastic crystals reinforced with polymer nanofibres. J. Mater. Chem. A 2015, 3, 6038–6052. [Google Scholar] [CrossRef]
- Forsyth, S.; Golding, J.; MacFarlane, D.; Forsyth, M. N-methyl-N-alkylpyrrolidinium tetrafluoroborate salts: Ionic solvents and solid electrolytes. Electrochimica Acta 2001, 46, 1753–1757. [Google Scholar] [CrossRef]
- Zhou, Q.; Boyle, P.D.; Malpezzi, L.; Mele, A.; Shin, J.-H.; Passerini, S.; Henderson, W.A. Phase Behavior of Ionic Liquid–LiX Mixtures: Pyrrolidinium Cations and TFSI− Anions–Linking Structure to Transport Properties. Chem. Mater. 2011, 23, 4331–4337. [Google Scholar] [CrossRef]
- Matsumoto, K.; Hagiwara, R.; Tamada, O. Coordination environment around the lithium cation in solid Li2(EMIm)(N(SO2CF3)2)3 (EMIm=1-ethyl-3-methylimidazolium): Structural clue of ionic liquid electrolytes for lithium batteries. Solid State Sci. 2006, 8, 1103–1107. [Google Scholar] [CrossRef]
- Henderson, W.A.; Seo, D.M.; Zhou, Q.; Boyle, P.D.; Shin, J.-H.; De Long, H.C.; Trulove, P.C.; Passerini, S. An Alternative Ionic Conductivity Mechanism for Plastic Crystalline Salt-Lithium Salt Electrolyte Mixtures. Adv. Energy Mater. 2012, 2, 1343–1350. [Google Scholar] [CrossRef]
- Howlett, P.C.; Shekibi, Y.; Macfarlane, D.R.; Forsyth, M. Li-Metal Symmetrical Cell Studies Using Ionic Organic Plastic Crystal Electrolyte. Adv. Eng. Mater. 2009, 11, 1044–1048. [Google Scholar] [CrossRef]
- Bondarenko, A.S.; Ragoisha, G.A. Inverse problem in potentiodynamic electrochemical impedance. In Progress in Chemometrics Research; Pomerantsev, A.L., Ed.; Nova Science Publishers: New York, NY, USA, 2005; pp. 89–102. [Google Scholar]
Figure 1.
TG (a) and DSC (b) curves obtained for the [N13pyr]BF4-LiBF4 samples containing different amounts of the LiBF4 additive.
Figure 1.
TG (a) and DSC (b) curves obtained for the [N13pyr]BF4-LiBF4 samples containing different amounts of the LiBF4 additive.

Figure 2.
Temperature dependences of the conductivity of [N13pyr]BF4-LiBF4 samples containing different amounts of the LiBF4 additive.
Figure 2.
Temperature dependences of the conductivity of [N13pyr]BF4-LiBF4 samples containing different amounts of the LiBF4 additive.

Figure 3.
Phase diagram of the [N13pyr]BF4-LiBF4 binary system proposed in the work and based on the DSC (black points) and conductivity (empty symbols) data.
Figure 3.
Phase diagram of the [N13pyr]BF4-LiBF4 binary system proposed in the work and based on the DSC (black points) and conductivity (empty symbols) data.

Figure 4.
X-ray diffraction patterns of pure [N13pyr]BF4 (1), pure LiBF4 (6), and [N13pyr]BF4-LiBF4 samples containing 2, 12, 26 and 40 wt% LiBF4, with curves 2, 3, 4 and 5, respectively.
Figure 4.
X-ray diffraction patterns of pure [N13pyr]BF4 (1), pure LiBF4 (6), and [N13pyr]BF4-LiBF4 samples containing 2, 12, 26 and 40 wt% LiBF4, with curves 2, 3, 4 and 5, respectively.

Figure 5.
The volt-ampere dependences obtained for [N13pyr]BF4-LiBF4 samples containing 10 and 16 wt% LiBF4 were obtained using a potentiodynamic method in the cell with metallic lithium and steel electrodes.
Figure 5.
The volt-ampere dependences obtained for [N13pyr]BF4-LiBF4 samples containing 10 and 16 wt% LiBF4 were obtained using a potentiodynamic method in the cell with metallic lithium and steel electrodes.

Figure 6.
Galvanostatic cycling curve obtained for Li/electrolyte/Li cells with the [N13pyr]BF4-LiBF4 electrolyte containing 10 wt% LiBF4 at a current density of 0.01 mA/cm2 (a) and some cycles represented for a short time interval (b). The artefact observed in the time interval from 100 to 120 min was caused by a temporary power outage.

Figure 7.
Nyquist curves obtained at 40 °C for Li/electrolyte/Li cells with the [N13pyr]BF4-LiBF4 electrolyte containing 10 wt% LiBF4 before and after galvanostatic cycling in linear (a) and logarithmic (b) scales. The symbols are experimental data, and the lines are the fitting curves. The equivalent circuit used for the data fitting (c) and the change in the electrolyte resistance (Re), the charge transfer resistance (R1), and the SEI resistance (R2) as a result of the galvanostatic cycling (d).


Table 1.
Parameters of the equivalent circuit, Re, R1, Y10, n1, R2, Y20, n2, W0 and Cg, determined by fitting the impedance data obtained for the Li/electrolyte/Li cell at 40 °C before and after galvanostatic cycling.
Table 1.
Parameters of the equivalent circuit, Re, R1, Y10, n1, R2, Y20, n2, W0 and Cg, determined by fitting the impedance data obtained for the Li/electrolyte/Li cell at 40 °C before and after galvanostatic cycling.
| Parameter | Before Cycling | After Cycling |
|---|---|---|
| Re, Ohm | 43 ± 2 | 49 ± 4 |
| R1, Ohm | 270 ± 10 | 400 ± 20 |
| Y10, S1−n1 | 4.5·10−7 ± 0.3·10−7 | 4.5·10−7 ± 0.4·10−7 |
| n1 | 0.645 ± 0.013 | 0.607 ± 0.011 |
| R2, kOhm | 0.77 ± 0.02 | 2.26 ± 0.05 |
| Y20, S1−n2 | 3.6·10−6 ± 0.4·10−6 | 1.9·10−6 ± 0.3·10−6 |
| n2 | 0.669 ± 0.008 | 0.649 ± 0.011 |
| W0, Ohm0.5 | 1.35·104 ± 0.9·104 | 2.67·104 ± 1.6·104 |
| Cg, pF | 79 ± 12 | 37 ± 23 |
Disclaimer/Publisher’s Note: The statements, opinions and data contained in all publications are solely those of the individual author(s) and contributor(s) and not of MDPI and/or the editor(s). MDPI and/or the editor(s) disclaim responsibility for any injury to people or property resulting from any ideas, methods, instructions or products referred to in the content. |
© 2023 by the authors. Licensee MDPI, Basel, Switzerland. This article is an open access article distributed under the terms and conditions of the Creative Commons Attribution (CC BY) license (https://creativecommons.org/licenses/by/4.0/).
Share and Cite
MDPI and ACS Style
Ulihin, A.; Novozhilov, D.; Uvarov, N. Solid Electrolytes in the N-Propyl-N-methyl-pyrrolidinium Tetrafluoroborate—Lithium Tetrafluoroborate System. Batteries 2023, 9, 167. https://doi.org/10.3390/batteries9030167
AMA Style
Ulihin A, Novozhilov D, Uvarov N. Solid Electrolytes in the N-Propyl-N-methyl-pyrrolidinium Tetrafluoroborate—Lithium Tetrafluoroborate System. Batteries. 2023; 9(3):167. https://doi.org/10.3390/batteries9030167
Chicago/Turabian StyleUlihin, Artem, Dmitry Novozhilov, and Nikolai Uvarov. 2023. "Solid Electrolytes in the N-Propyl-N-methyl-pyrrolidinium Tetrafluoroborate—Lithium Tetrafluoroborate System" Batteries 9, no. 3: 167. https://doi.org/10.3390/batteries9030167
Note that from the first issue of 2016, this journal uses article numbers instead of page numbers. See further details here.