Article

Prediction of the Heat Generation Rate of Lithium-Ion Batteries Based on Three Machine Learning Algorithms

School of Aeronautic Science and Engineering, Beihang University, Beijing 100191, China
*
Author to whom correspondence should be addressed.
Batteries 2023, 9(3), 165; https://doi.org/10.3390/batteries9030165
Submission received: 26 January 2023 / Revised: 25 February 2023 / Accepted: 6 March 2023 / Published: 9 March 2023

Abstract

:
The heat generation rate (HGR) of lithium-ion batteries is crucial for the design of a battery thermal management system. Machine learning algorithms can effectively solve nonlinear problems and have been implemented in the state estimation and life prediction of batteries; however, limited research has been conducted on determining the battery HGR through machine learning. In this study, we employ three common machine learning algorithms, i.e., artificial neural network (ANN), support vector machine (SVM), and Gaussian process regression (GPR), to predict the battery HGR based on our experimental data, along with cases of interpolation and extrapolation. The results indicated the following: (1) the prediction accuracies for the interpolation cases were better than those of extrapolation, and the R2 values of interpolation were greater than 0.96; (2) after the discharge voltage was added as an input parameter, the prediction of the ANN was barely affected, whereas the performance of the SVM and GPR were improved; and (3) the ANN exhibited the best performance among the three algorithms. Accurate results can be obtained by using a single hidden layer and no more than 15 neurons without the additional input, where the R2 values were in the range of 0.89–1.00. Therefore, the ANN is preferable for predicting the HGR of lithium-ion batteries.

1. Introduction

Extensive research has been conducted on clean energy and energy storage systems due to the limited reserves of fossil fuels and owing to the environmental problems, such as global warming, that are caused by these resources. Over the past few decades, lithium-ion batteries have been widely implemented in various applications such as portable electronic devices, electric vehicles, aerospace vehicles, and so on due to their high energy density, low self-discharge rate, stable performance, and long cycle life [1,2]. However, these batteries generate a large amount of heat during operation, which can trigger thermal runaways and cause fire accidents if the heat is not appropriately controlled [3,4,5,6,7]. Determining the heat generation rate (HGR) is crucial for the thermal management of batteries and can help in the development of operation strategies of a thermal management system (TMS).
The existing research models developed for the HGR of lithium-ion batteries primarily include electrochemical-thermal, electric-thermal, and thermal models. The electrochemical-thermal models simulate the thermal behavior of a battery by modeling mesoscopic-scale electrochemical processes. However, various parameters, such as the composition, concentration of ions, diffusion coefficient, reaction rate, and porosity, are required [8,9,10,11], which complicates the modeling; furthermore, the modeling is affected by the accuracy of these parameters. Electric-thermal models are mainly used to determine irreversible and reversible heat by measuring the internal resistance and entropy changes of a battery [12,13,14,15]. Thermal models directly measure the HGR of a battery based on the three types of heat transfer: conduction, convection, and radiation [16,17,18,19]. Electric-thermal models and thermal models are relatively simple but require extensive experimental analysis. The heat generation characteristics of a battery are significantly affected by factors such as the state of charge (SOC), ambient temperature, current, and aging [20,21,22]. Therefore, it takes a long time to measure the HGRs in various environments or under different operating conditions. For example, it takes 4–20 days to perform a single entropy change measurement when applying the electric-thermal model [23]. In recent years, the rapid development of machine learning has provided a simpler and faster alternative to building a model to measure the HGR. The variation in the HGR of the battery affected by various factors is typically nonlinear. Machine learning methods can effectively solve nonlinear problems with multiple inputs and large sample sizes, and do not require insight into the mechanical characteristics of the battery. They train historical data to identify patterns and make decisions or predictions [24] and are applicable to various fields. Additionally, compared with traditional regression analysis, machine learning enormously reduces the risk of model misspecification [25].
The previous studies conducted on lithium-ion batteries using machine learning primarily focused on the SOC and state of health (SOH) estimation and the remaining useful life (RUL) prediction. Chandran et al. [26] estimated the battery SOC by using six machine learning algorithms: artificial neural network (ANN), support vector machine (SVM), Gaussian process regression (GPR), linear regression, ensemble bagging, and ensemble boosting. The results demonstrated that ANN and GPR presented the best performance. Zhang et al. [27] proposed a hybrid parallel residual convolutional neural network model for online RUL prediction. The model achieved reliable and accurate results based on sparse data that correspond to only 20% of the charging capacity. Wang et al. [28] proposed a SOH prediction method based on a multi-kernel relevance vector machine and a whale optimization algorithm and verified its performance for long-term and short-term predictions using two different data sets. Wang et al. [29] established an accurate SOH prediction model based on multi-output GPR by using the cycle data of a single cell and the initial cycle data of a battery pack. Wang et al. [30] integrated a long short-term memory (LSTM) network with differential thermal voltammetry to predict the battery’s SOH and RUL, which can be also used for offline battery degradation tracking in the cloud. The aforementioned studies conducted on state estimation typically considered voltage, temperature, internal resistance, and other parameters as the inputs. However, the environment in practical applications may vary from that of the historical data used for training. These parameters are significantly affected by the operating conditions, which affects the accuracy and applicability of machine learning in online estimation. Therefore, it is crucial to estimate the battery characteristics beforehand under various operating conditions.
Some studies have employed machine learning algorithms to estimate the battery temperature and TMS parameters. Afzal et al. [31] implemented four activation functions to train optimized neural network (NN) models and predicted the average Nusselt number of batteries in the TMS from six operating parameters of the TMS. They reported that the performance of the deep NN model was better than that of the single-layered NN model for all activation functions. Liu et al. [32] proposed a data-driven method that combines the optimized radial basis function neural network with an extended Kalman filter to estimate the internal temperature of lithium-ion batteries from the battery current, terminal voltage, and surface temperature. This method outperformed the linear neural network model under four conditions. Hasan et al. [33] proposed an ANN-based nonlinear autoregressive exogenous (NARX) approach to estimate the battery temperature in a battery energy storage system with inputs of the charge/discharge current and ambient temperature. Furthermore, they derived a more accurate seasonal NARX model than the universal model, based on the different temperatures and weather characteristics in each season. Zhu et al. [34] employed the LSTM model to predict the change in battery temperature during a long cycle-aging process. The temperature data of the first 80 cycles were trained to predict the temperature data of 81–100 cycles. This model requires a larger proportion of training data to obtain a better prediction. The research on battery temperature estimation has strong practicability. However, the increase in the battery temperature is only a manifestation of the battery heat generation, and it changes based on variations in the heat transfer environment. Additionally, the HGR also changes based on various factors; therefore, the historical data used for training may not be effective for other environments, which increases the difficulty of applying these algorithms. The battery temperature under different conditions can be more accurately estimated by predicting the HGR rather than the battery temperature under a specific condition directly.
However, very few studies have been conducted on the application of machine learning for the prediction of the battery HGR. Arora et al. [35] optimized a one-hidden-layered feedforward ANN with six neurons and estimated the battery HGR by using the nominal capacity, ambient temperature, discharge rate, and depth of discharge (DOD) as inputs. Their data set of the 8 Ah, 15 Ah, and 20 Ah LiFePO4 pouch cells covered the operating range of the discharge rate and ambient temperature specified by the cell manufacturer. The data of the 15 Ah battery cell were used for the independent assessment of the trained model. The results concurred with the measured data, presenting a correlation coefficient of 0.98627. However, some details of the HGR curve have not been predicted accurately, and only one ANN model with a specific architecture was used in this study.
Based on the above literature review, we can observe that machine learning in the lithium-ion battery field was mainly used to predict battery characteristics during the long cycle-aging process. However, limited research has been conducted on the prediction of battery characteristics under different conditions. Additionally, few studies have compared the effectiveness of different machine learning algorithms in the prediction of the battery HGR.
Therefore, this study presents a detailed analysis and comparison of the performance of three common machine learning algorithms—ANN, SVM, and GPR—in the prediction of the HGR of lithium-ion batteries based on the experimental data measured by our research group. Furthermore, we analyze the impact of different input parameters on prediction accuracy. The predicted operating conditions include three discharge currents and three ambient temperatures, which can be divided into two types: interpolation and extrapolation. We evaluated the advantages and disadvantages of the three machine learning algorithms in predicting the battery HGR and provided specific operational suggestions. The findings of this study can help in reducing the time required for the research and development of the battery and TMS.

2. Data and Methods

2.1. Data Collection and Preprocessing

The training and testing data were measured by our research group and published in [36]. We used Panasonic NCR18650 batteries with a rated capacity of 2900 mAh. The active materials of NCR18650A are lithium nickel cobalt aluminum oxide (NCA) and graphite. The calorimetry tests were conducted for discharging with 0.5 C, 0.75 C, 1 C, 1.25 C, and 1.5 C at the ambient temperature of 25 °C and with 1 C at ambient temperatures of 20, 25, 30, 35, 40, and 45 °C. The ambient temperatures for the tests were selected within the normal operating ambient temperature range of the battery. The battery was charged in constant current–constant voltage mode by 0.5 C with the cut-off voltage and current set to 4.2 V and 59 mA. During the tests, a battery testing system was used to control and monitor basic parameters such as voltage, current, and capacity. A thermostatic chamber was used to provide the calorimetric environment and maintain the specific ambient temperature required for testing. The experimental data and the modeling in this paper were limited to new battery cells, with negligible capacity fade.
The Figure. 5b in [36] demonstrates that the HGR increased with an increase in the discharge current. The correlation between the HGR and discharge current is observed to be nonlinear based on the most commonly used thermal model [37] in Equation (1). The temperature and internal resistance are also related to the discharge current. The Figure. 7b in [36] demonstrates that the HGR decreased with an increase in the ambient temperature, and its variation rate was also nonlinear.
q = I 2 R I T U O C V T
where q is the HGR, I is the current, R is the internal resistance, T is the cell temperature, U O C V is the open-circuit voltage, and U O C V T denotes the entropic coefficient.
To standardize the training and testing data, the HGR curves and discharge voltage curves were fitted and extracted as samples with an interval of 0.001 DOD. The DOD used in this study is defined as follows: The HGR curves were fitted with nine-degree polynomials, and the voltage curves were fitted by the smoothing splines. All the data were normalized before training to avoid focusing more on features with larger values during the training phase.
DOD = C d C r a t e d
where Cd is the discharged capacity by a certain moment (Ah), and Crated is the rated capacity of the battery (Ah).

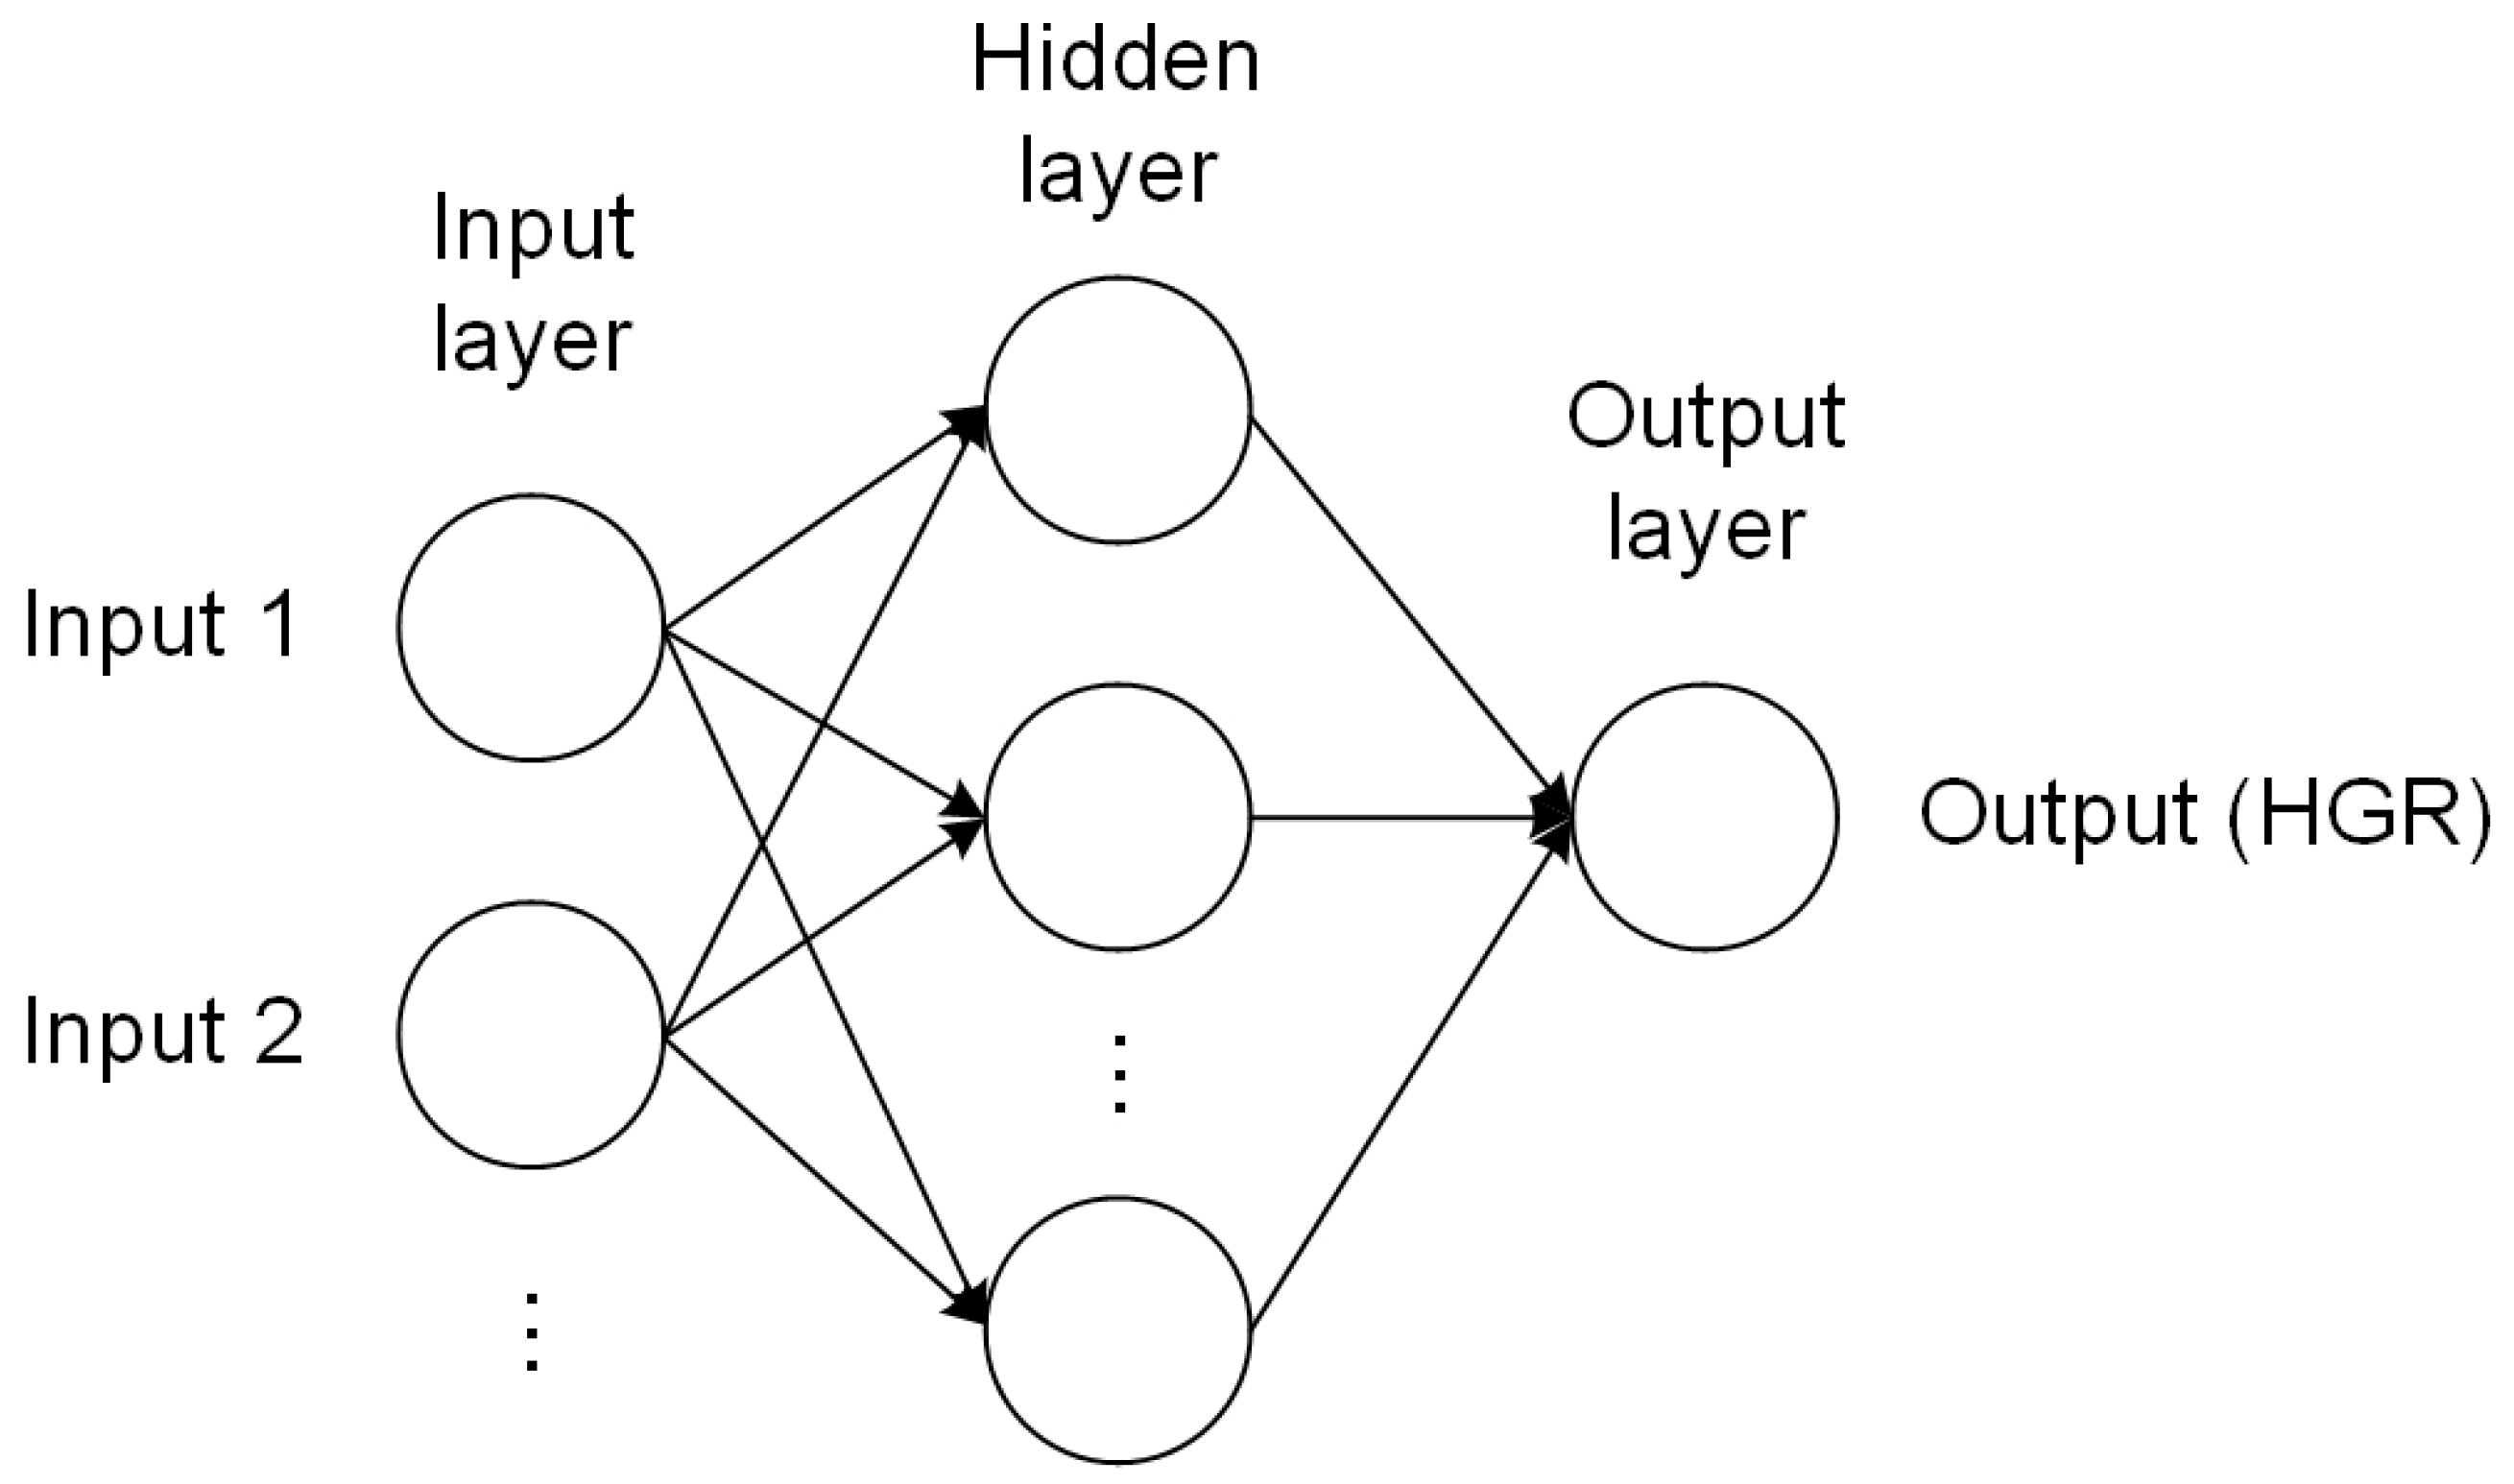
2.2. Machine Learning Modeling

The DOD and discharge current I were selected as the inputs for the HGR prediction of different discharge currents. The DOD and ambient temperature Ta were the inputs for the HGR prediction of different ambient temperatures. Additionally, the discharge voltage U was added to the inputs and the results were compared with those obtained without considering discharge voltage as an input. Therefore, four types of modeling were conducted, as expressed by Equations (3)–(6). Table 1 lists the operating conditions to be predicted and the data used; 12 cases were predicted. The cases equivalent to interpolation and extrapolation were analyzed for different discharge currents and different ambient temperatures, respectively. The interpolation in Table 1 indicates that the operating conditions to be predicted were within the range of those of the training data, whereas the opposite was true for extrapolation.
q = f 1 ( D O D , I ; T a )
q = f 2 ( D O D , I , U ; T a )
q = f 3 ( D O D , T a ; I )
q = f 4 ( D O D , T a , U ; I )
The previous studies demonstrated that the ANN, SVM, and GPR algorithms perform well for small-sample problems [24,38]. Therefore, we selected these three algorithms for training and prediction due to the small number of samples in this study and compared their performance. For each case in Table 1, one ANN model, one SVM model, and one GPR model were trained, respectively.
An ANN model is a multi-layered network comprising multiple neurons with one input layer, one or more hidden layers, and one output layer, as shown in Figure 1. The BP neural network exhibits a strong nonlinear mapping ability as a feedforward ANN. Therefore, we used the BP neural network for training and testing and selected the sigmoid as the activation function. The Levenberg–Marquardt algorithm was used as the learning algorithm due to its fast convergence. The learning rate was set to 0.01. There are no universal rules for selecting the number of hidden layers and neurons [39]. We employed the trial-and-error method to determine the architecture of the ANN model by creating and training networks with different architectures and implementing independent tests. The first choice for the number of hidden layers was one, and that for the number of neurons was in the range of 1–20. Lastly, we selected the architecture with a smaller test root mean square error (RMSE) and fewer hidden layers and neurons for each case.
The SVM is a generalized classification algorithm. Its core concept involves finding the widest separation band for separating the different types of data and solving the hyperplane, which is the classification plane in the middle of the band. When the SVM is implemented for regression analysis, an insensitive loss function is added to find an optimal hyperplane that minimizes the distance between the sample and the plane. The kernel function is defined as the function that transforms a low-dimensional space into a high-dimensional space to attain linear separability. The Gaussian kernel or the radial basis function (RBF) kernel exhibits a strong learning ability and can be effectively adapted for low-dimensional and small-sample problems [40]. Therefore, we used the Gaussian kernel function to train the SVM model. The box constraint was set to 1 and Bayesian optimization was used to optimize the kernel scale parameter for each case.
The GPR model is a nonparametric kernel-based model which uses the Gaussian process for regression. It solves the mean function followed by the mean vector elements and the covariance function followed by the covariance matrix elements. The solution is based on the Bayesian inference and follows the maximum likelihood estimation. We selected the constant as the mean function when using the GPR. The sigma parameter and kernel scale were kept to the default values first. The trial-and-error method was used to create and train models with different covariance functions and independent tests were conducted. After selecting the covariance function with the best test performance, the Bayesian optimization of the hyperparameters was performed to obtain the model with the best test performance.
k-fold cross-validation was used for model training due to the small number of input parameters and samples used in this study. According to [41], both k = 5 and k = 10 exhibit good performance. We selected the five-fold cross-validation to further reduce the training time. All the data preprocessing and machine learning operations in this study were performed using the MATLAB platform.

2.3. Evaluation of the Methods

The RMSE, R-squared (R2), and relative error of the average HGR, δ, were used to evaluate the prediction performance of these models. The RMSE is generally used to measure the deviation between the estimated and actual values, as defined in Equation (7). In this study, the actual value was the experimentally measured value. The closer the value of RMSE is to 0, the higher the prediction accuracy of the model.
RMSE = i = 1 n ( q e s t q a c t ) 2 n
where qest and qact are the estimated and actual values of the battery HGR for sample i, respectively, and n is the number of samples.
R2, or the coefficient of determination, was used to evaluate the goodness of fit of a regression model, which is defined in Equation (8). The closer the value is to 1, the better the regression performance.
R 2 = 1 i = 1 n ( q e s t q a c t ) 2 i = 1 n ( q e s t q a c t ¯ ) 2
where q a c t ¯ denotes the average of all the samples of the actual HGR.
Additionally, we calculated the relative error of the average HGR, which is defined in Equation (9).
δ = q e s t ¯ q a c t ¯ q a c t ¯ × 100 %
where q e s t ¯ denotes the average of all the samples of the estimated HGR.

3. Results

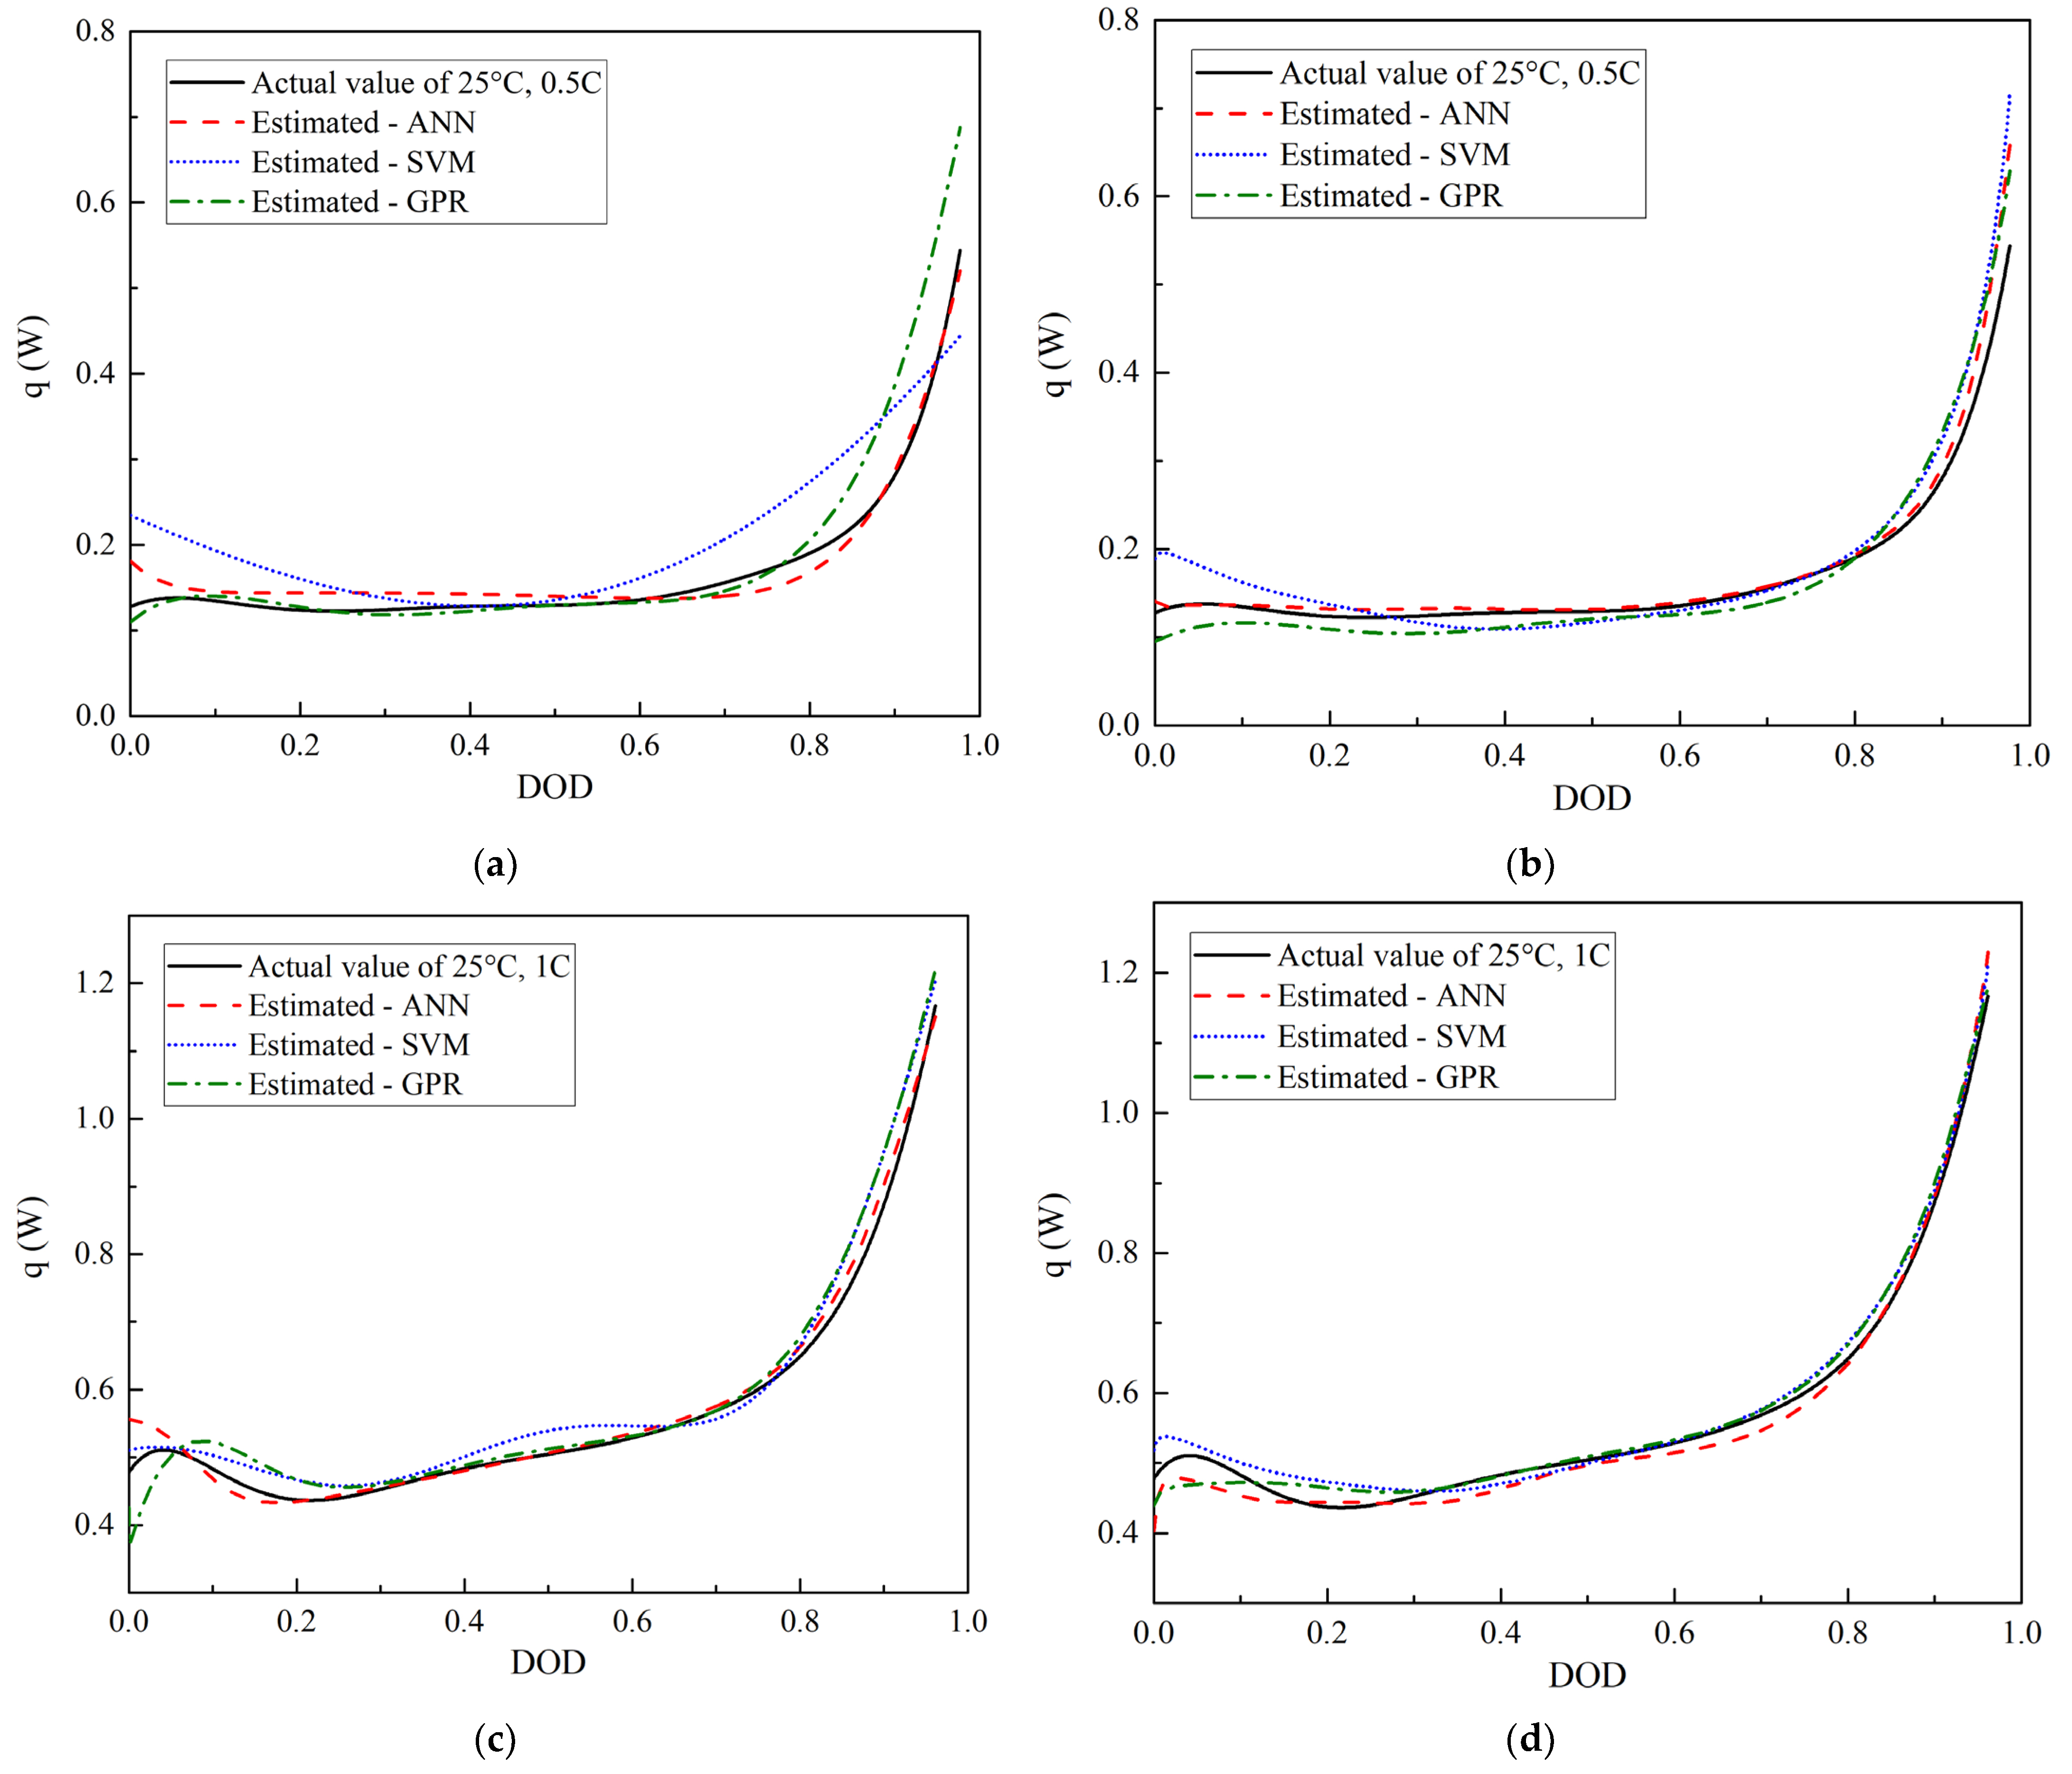
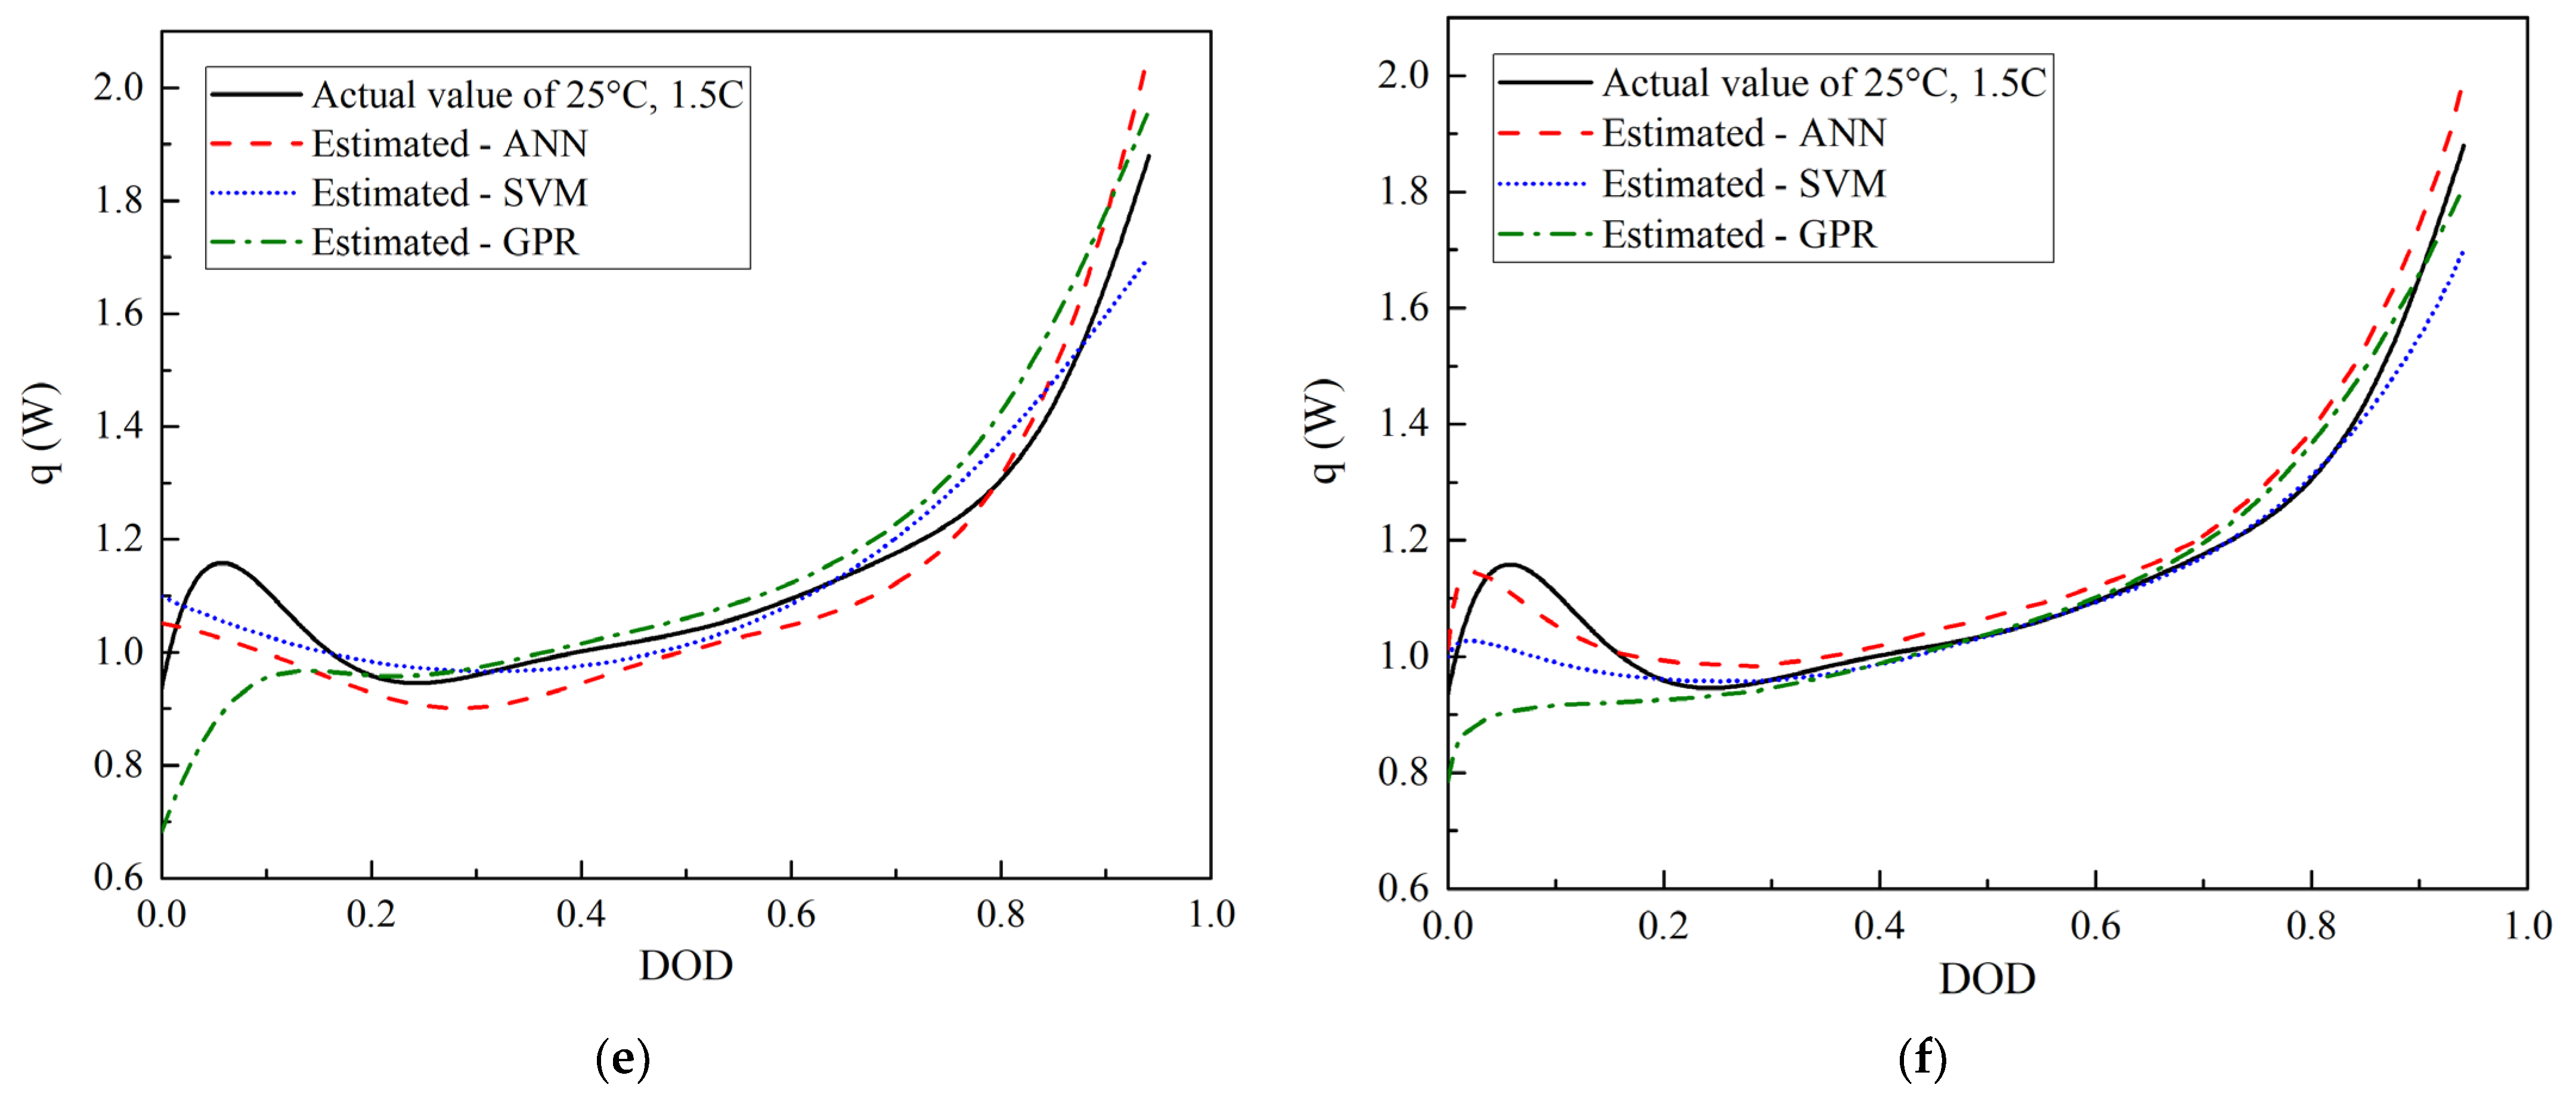
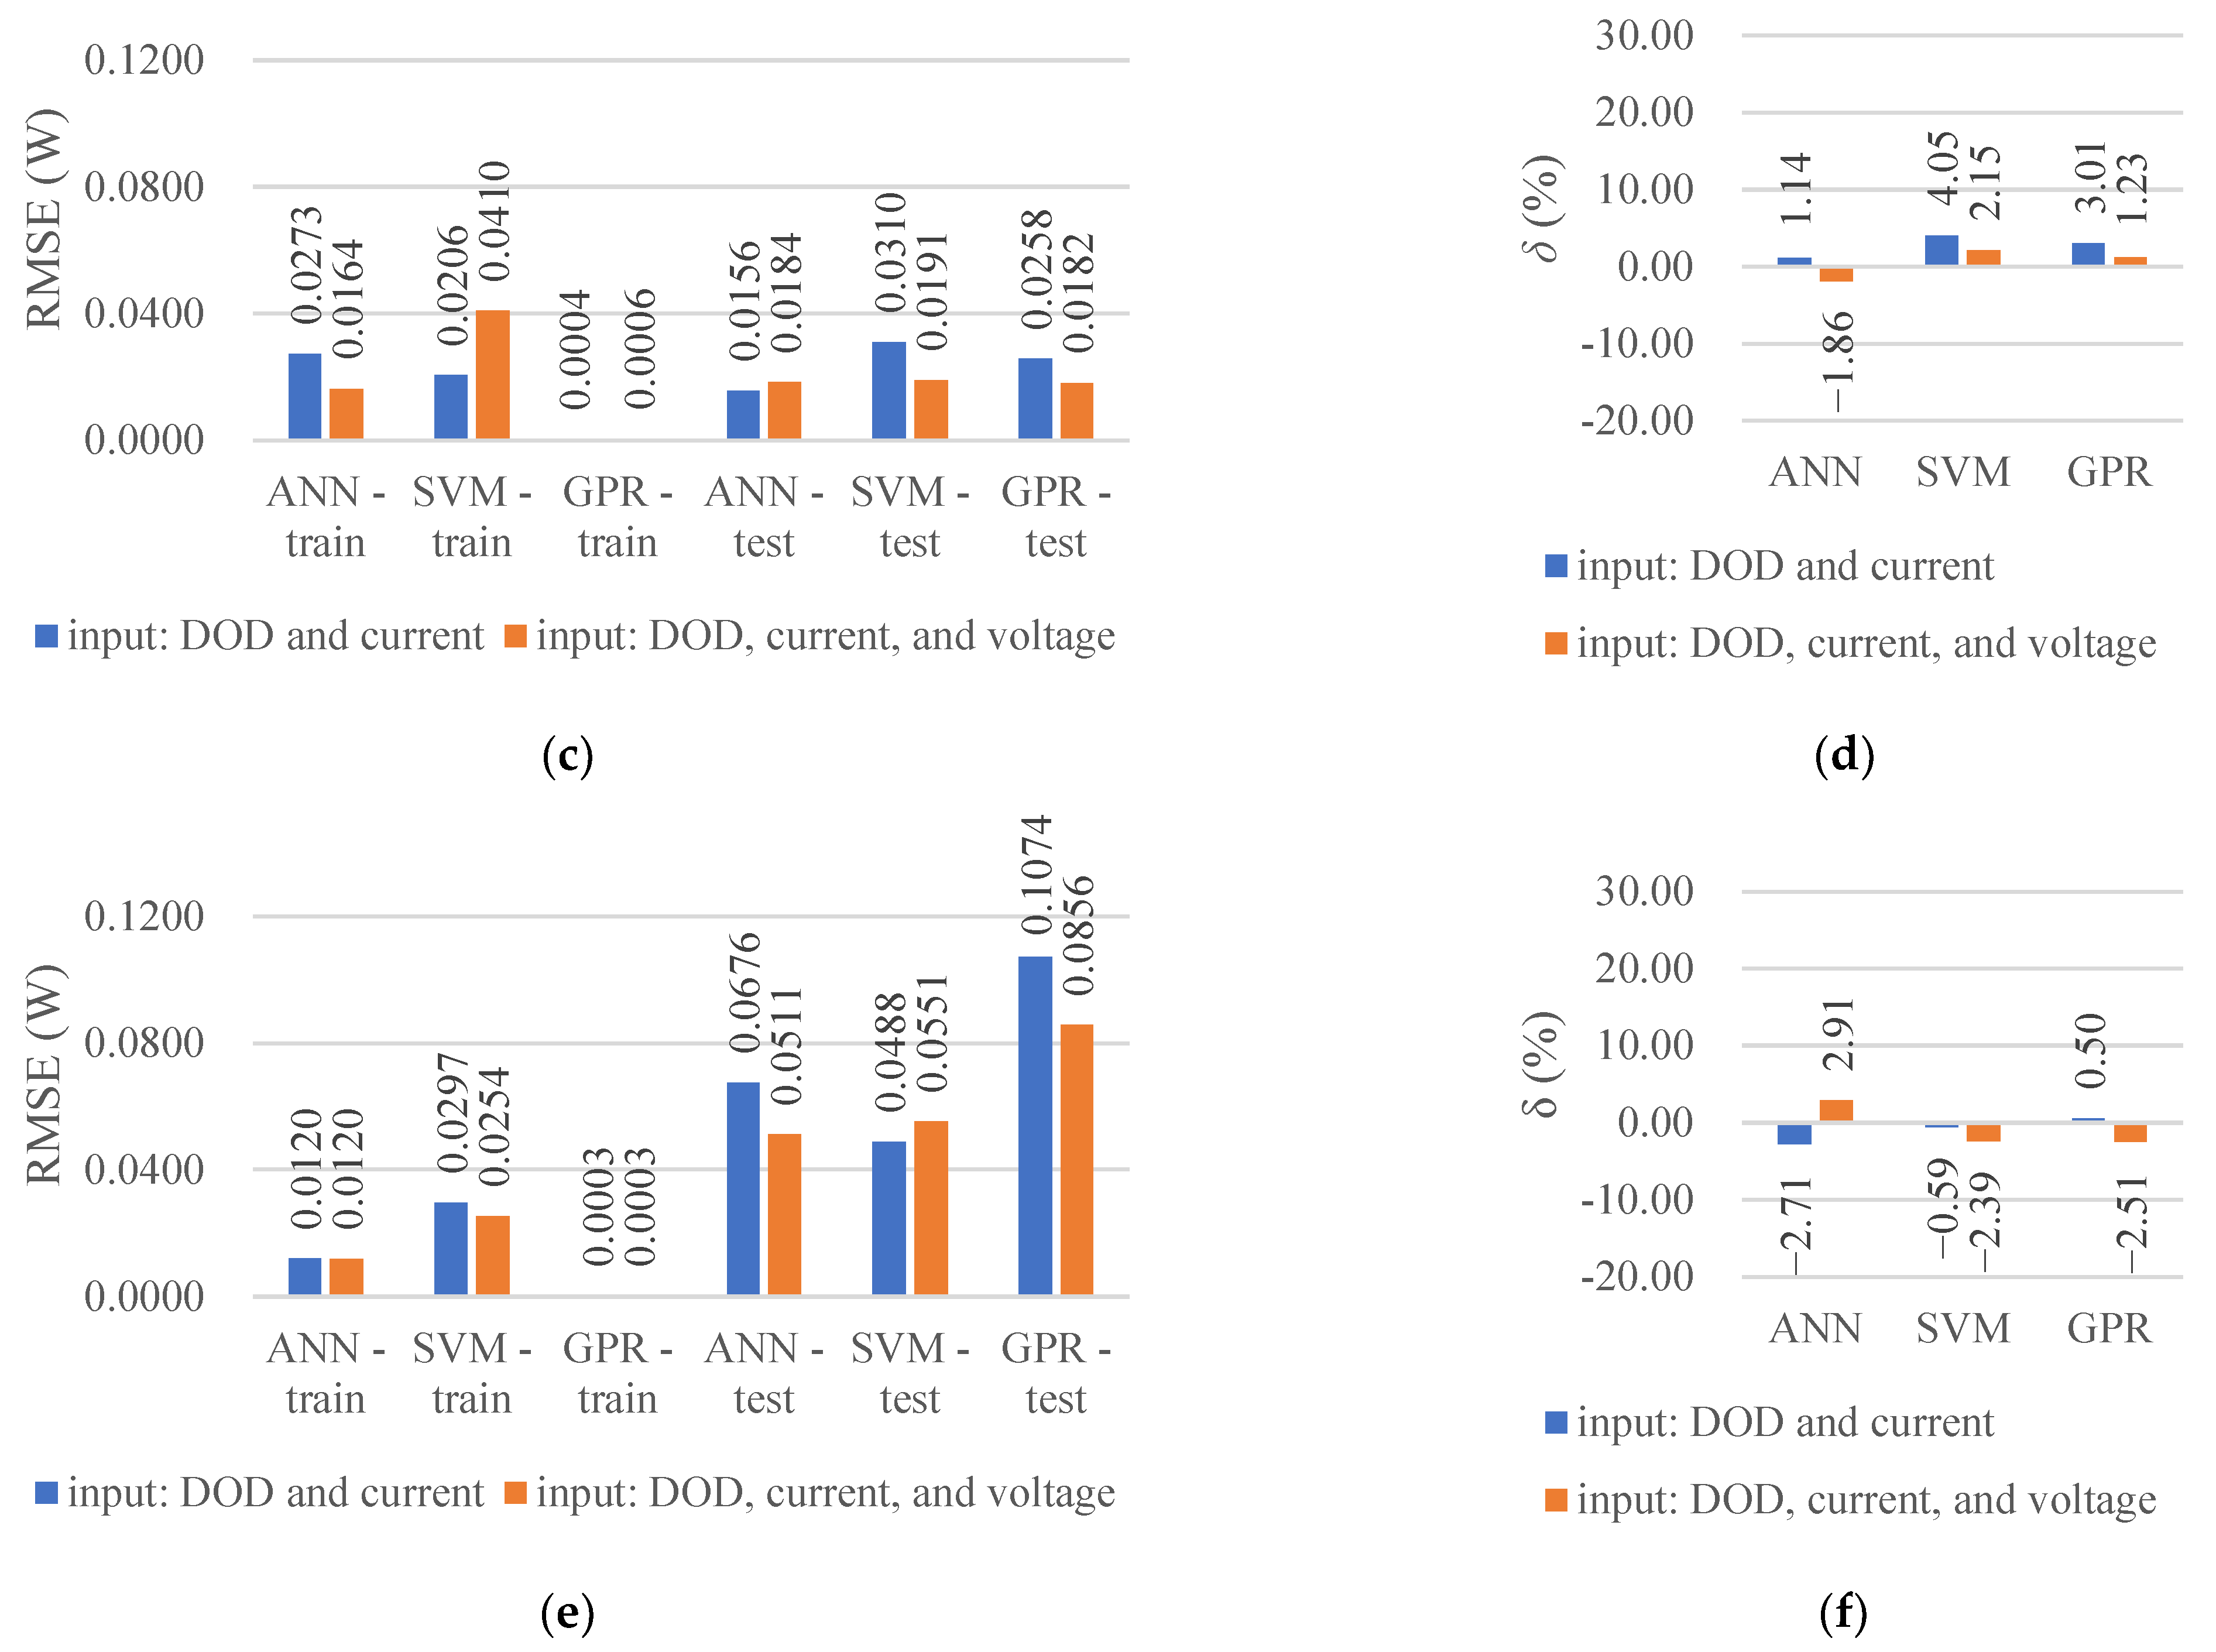
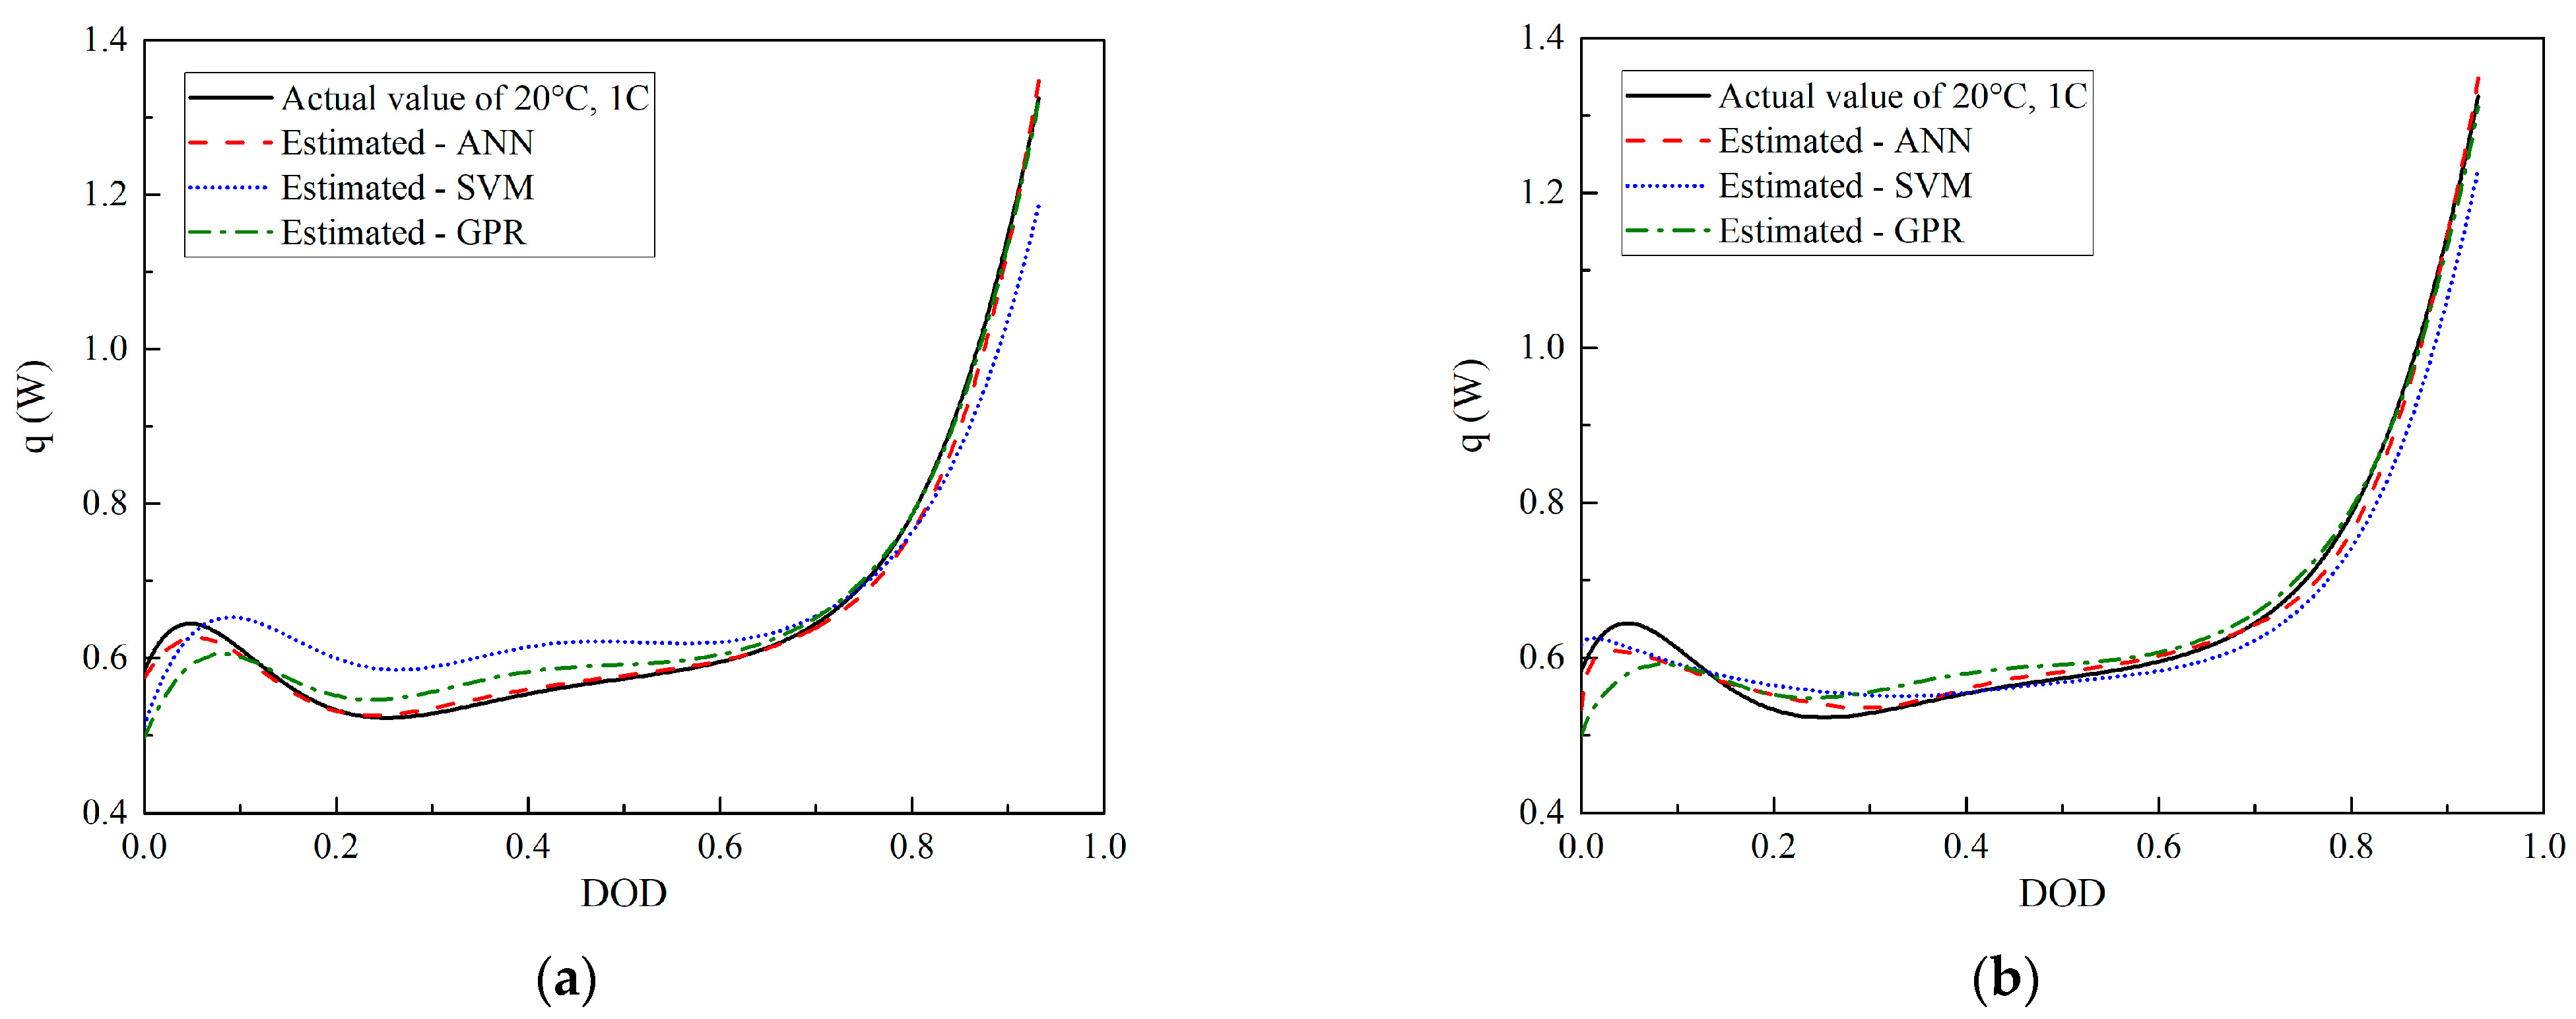
3.1. HGR Prediction at Different Discharge Currents

When the inputs were selected as the DOD and discharge current, the predicted HGRs discharged at 0.5 C, 1 C, and 1.5 C at 25 °C obtained by the ANN, SVM, and GPR were compared with the actual values, as shown in Figure 2a,c,e. Figure 2b,d,f depict the estimated and actual HGRs at 0.5 C, 1 C, and 1.5 C, respectively, after the discharge voltage was added to the inputs. Table 2 lists the ANN architectures and covariance functions of the GPR that were used and the R2 values of the regressions. Figure 3 presents the training and testing RMSE values and the relative error of the average HGR, δ.

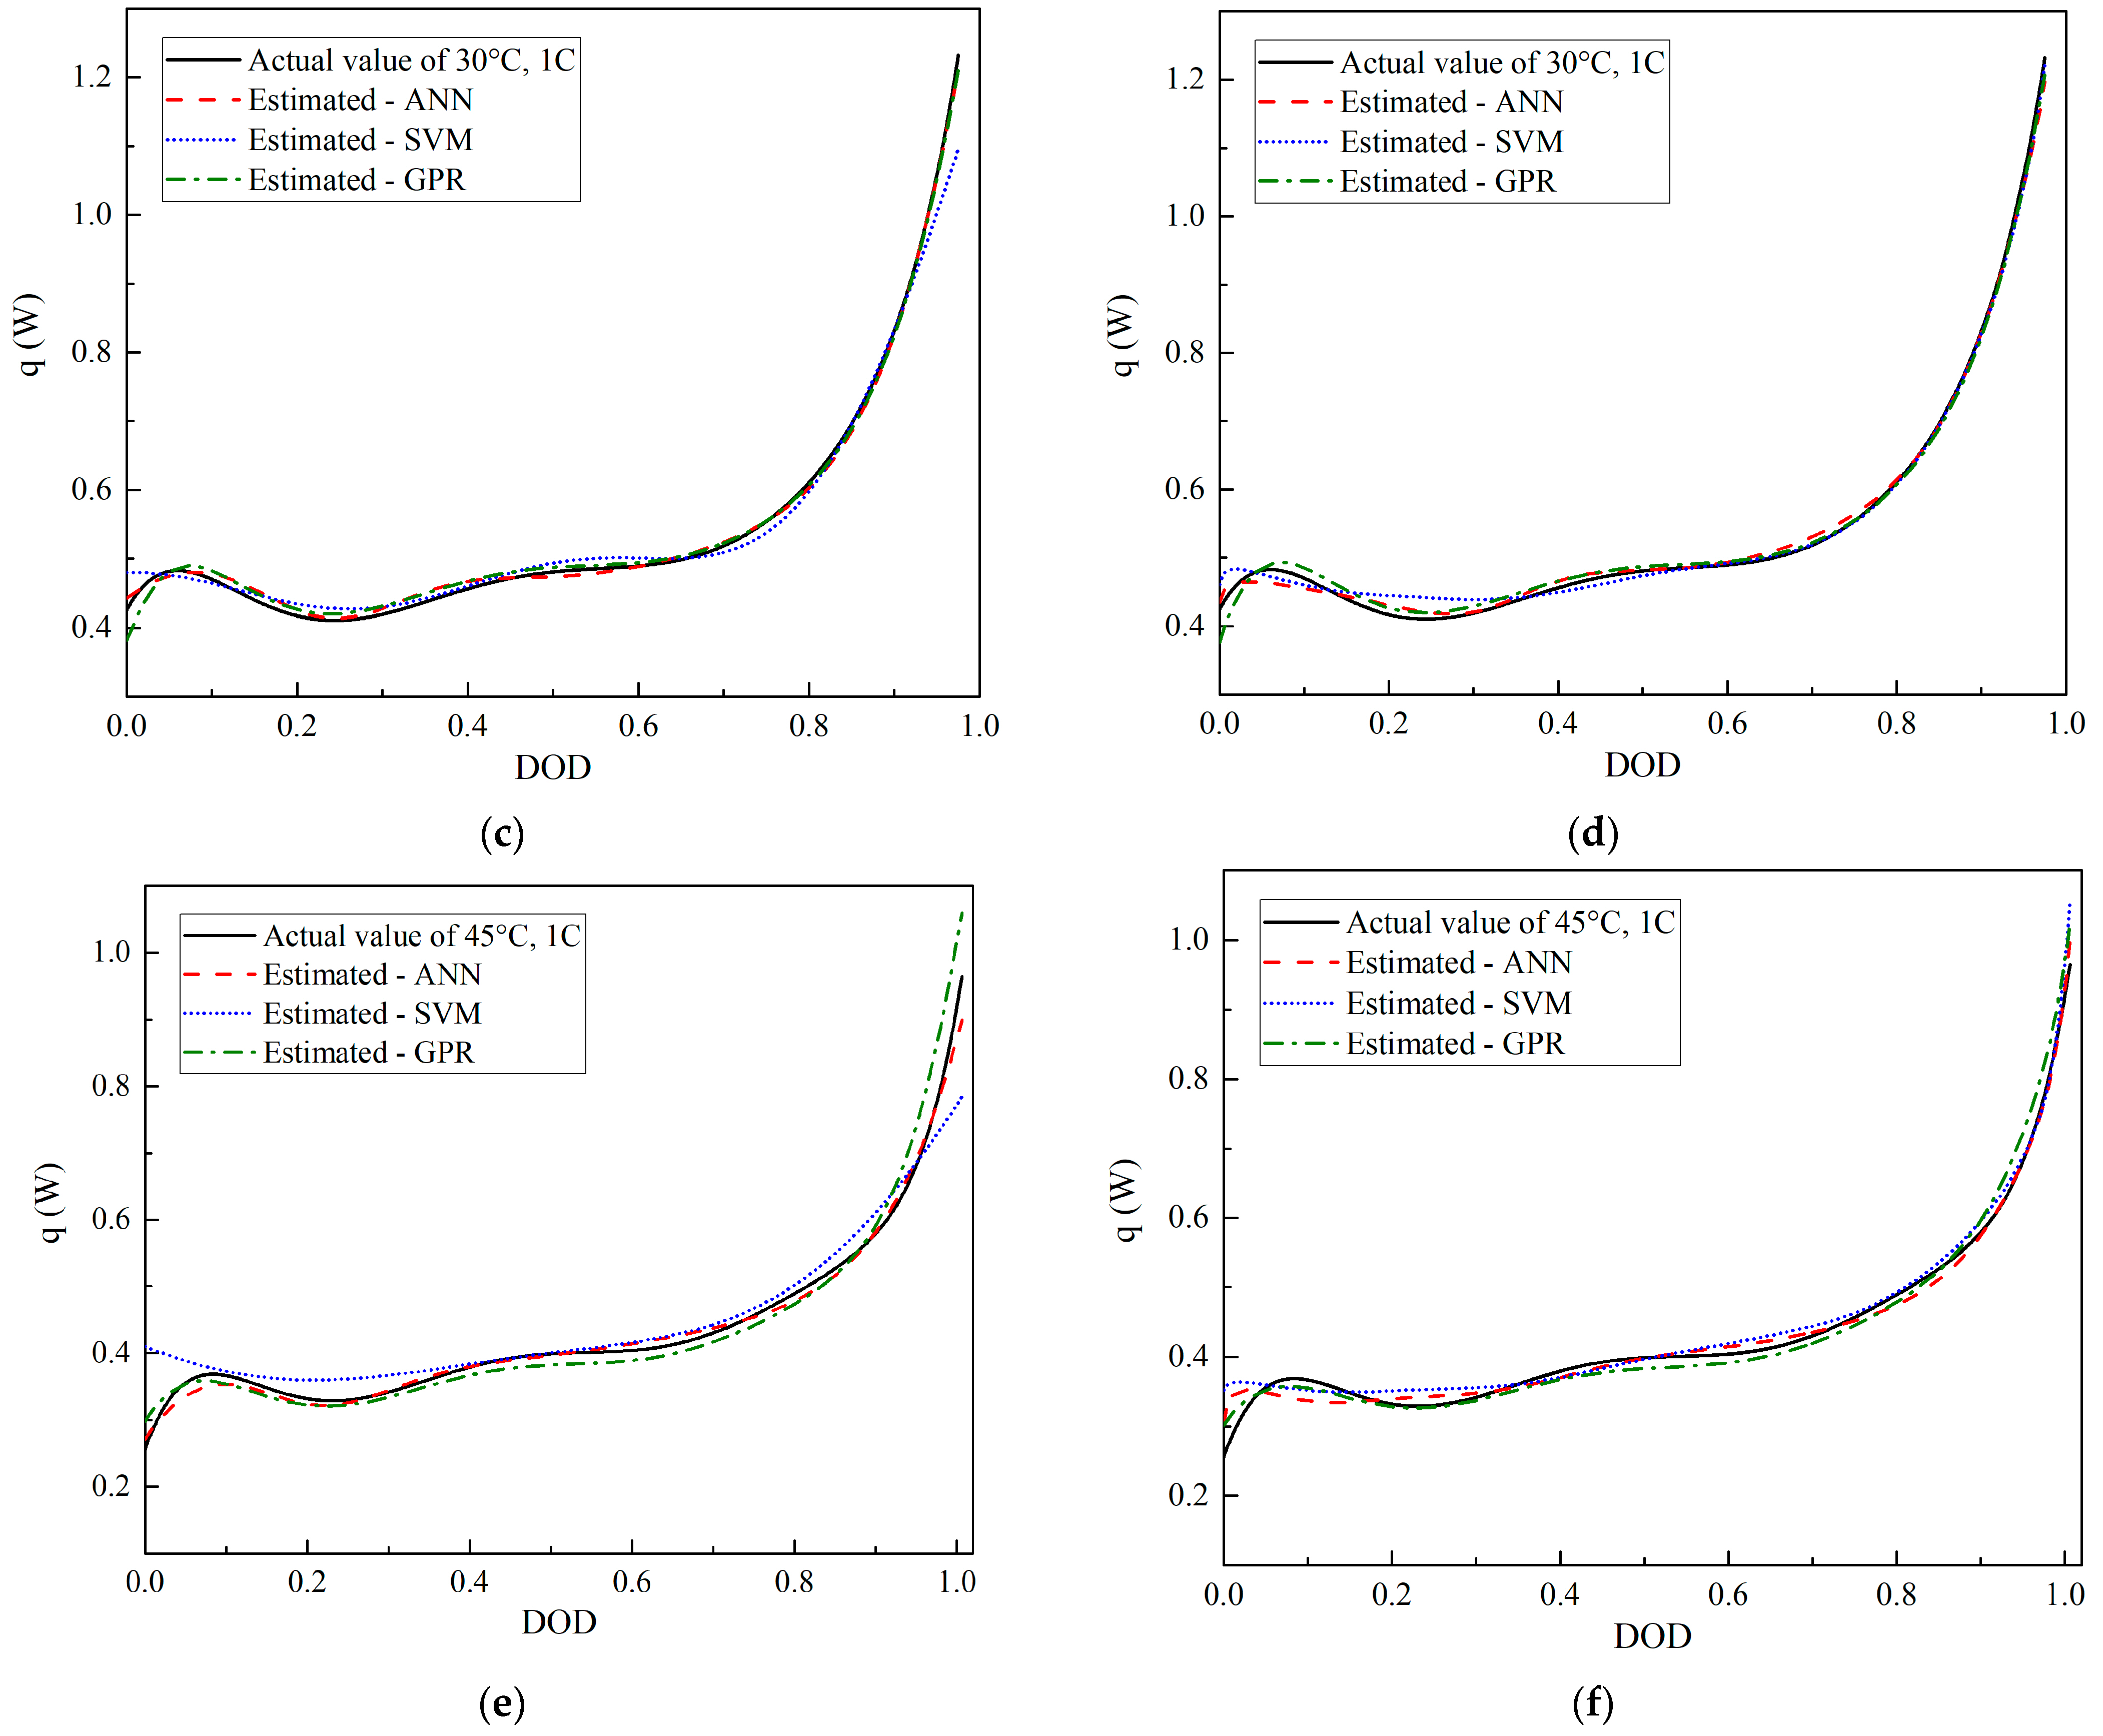
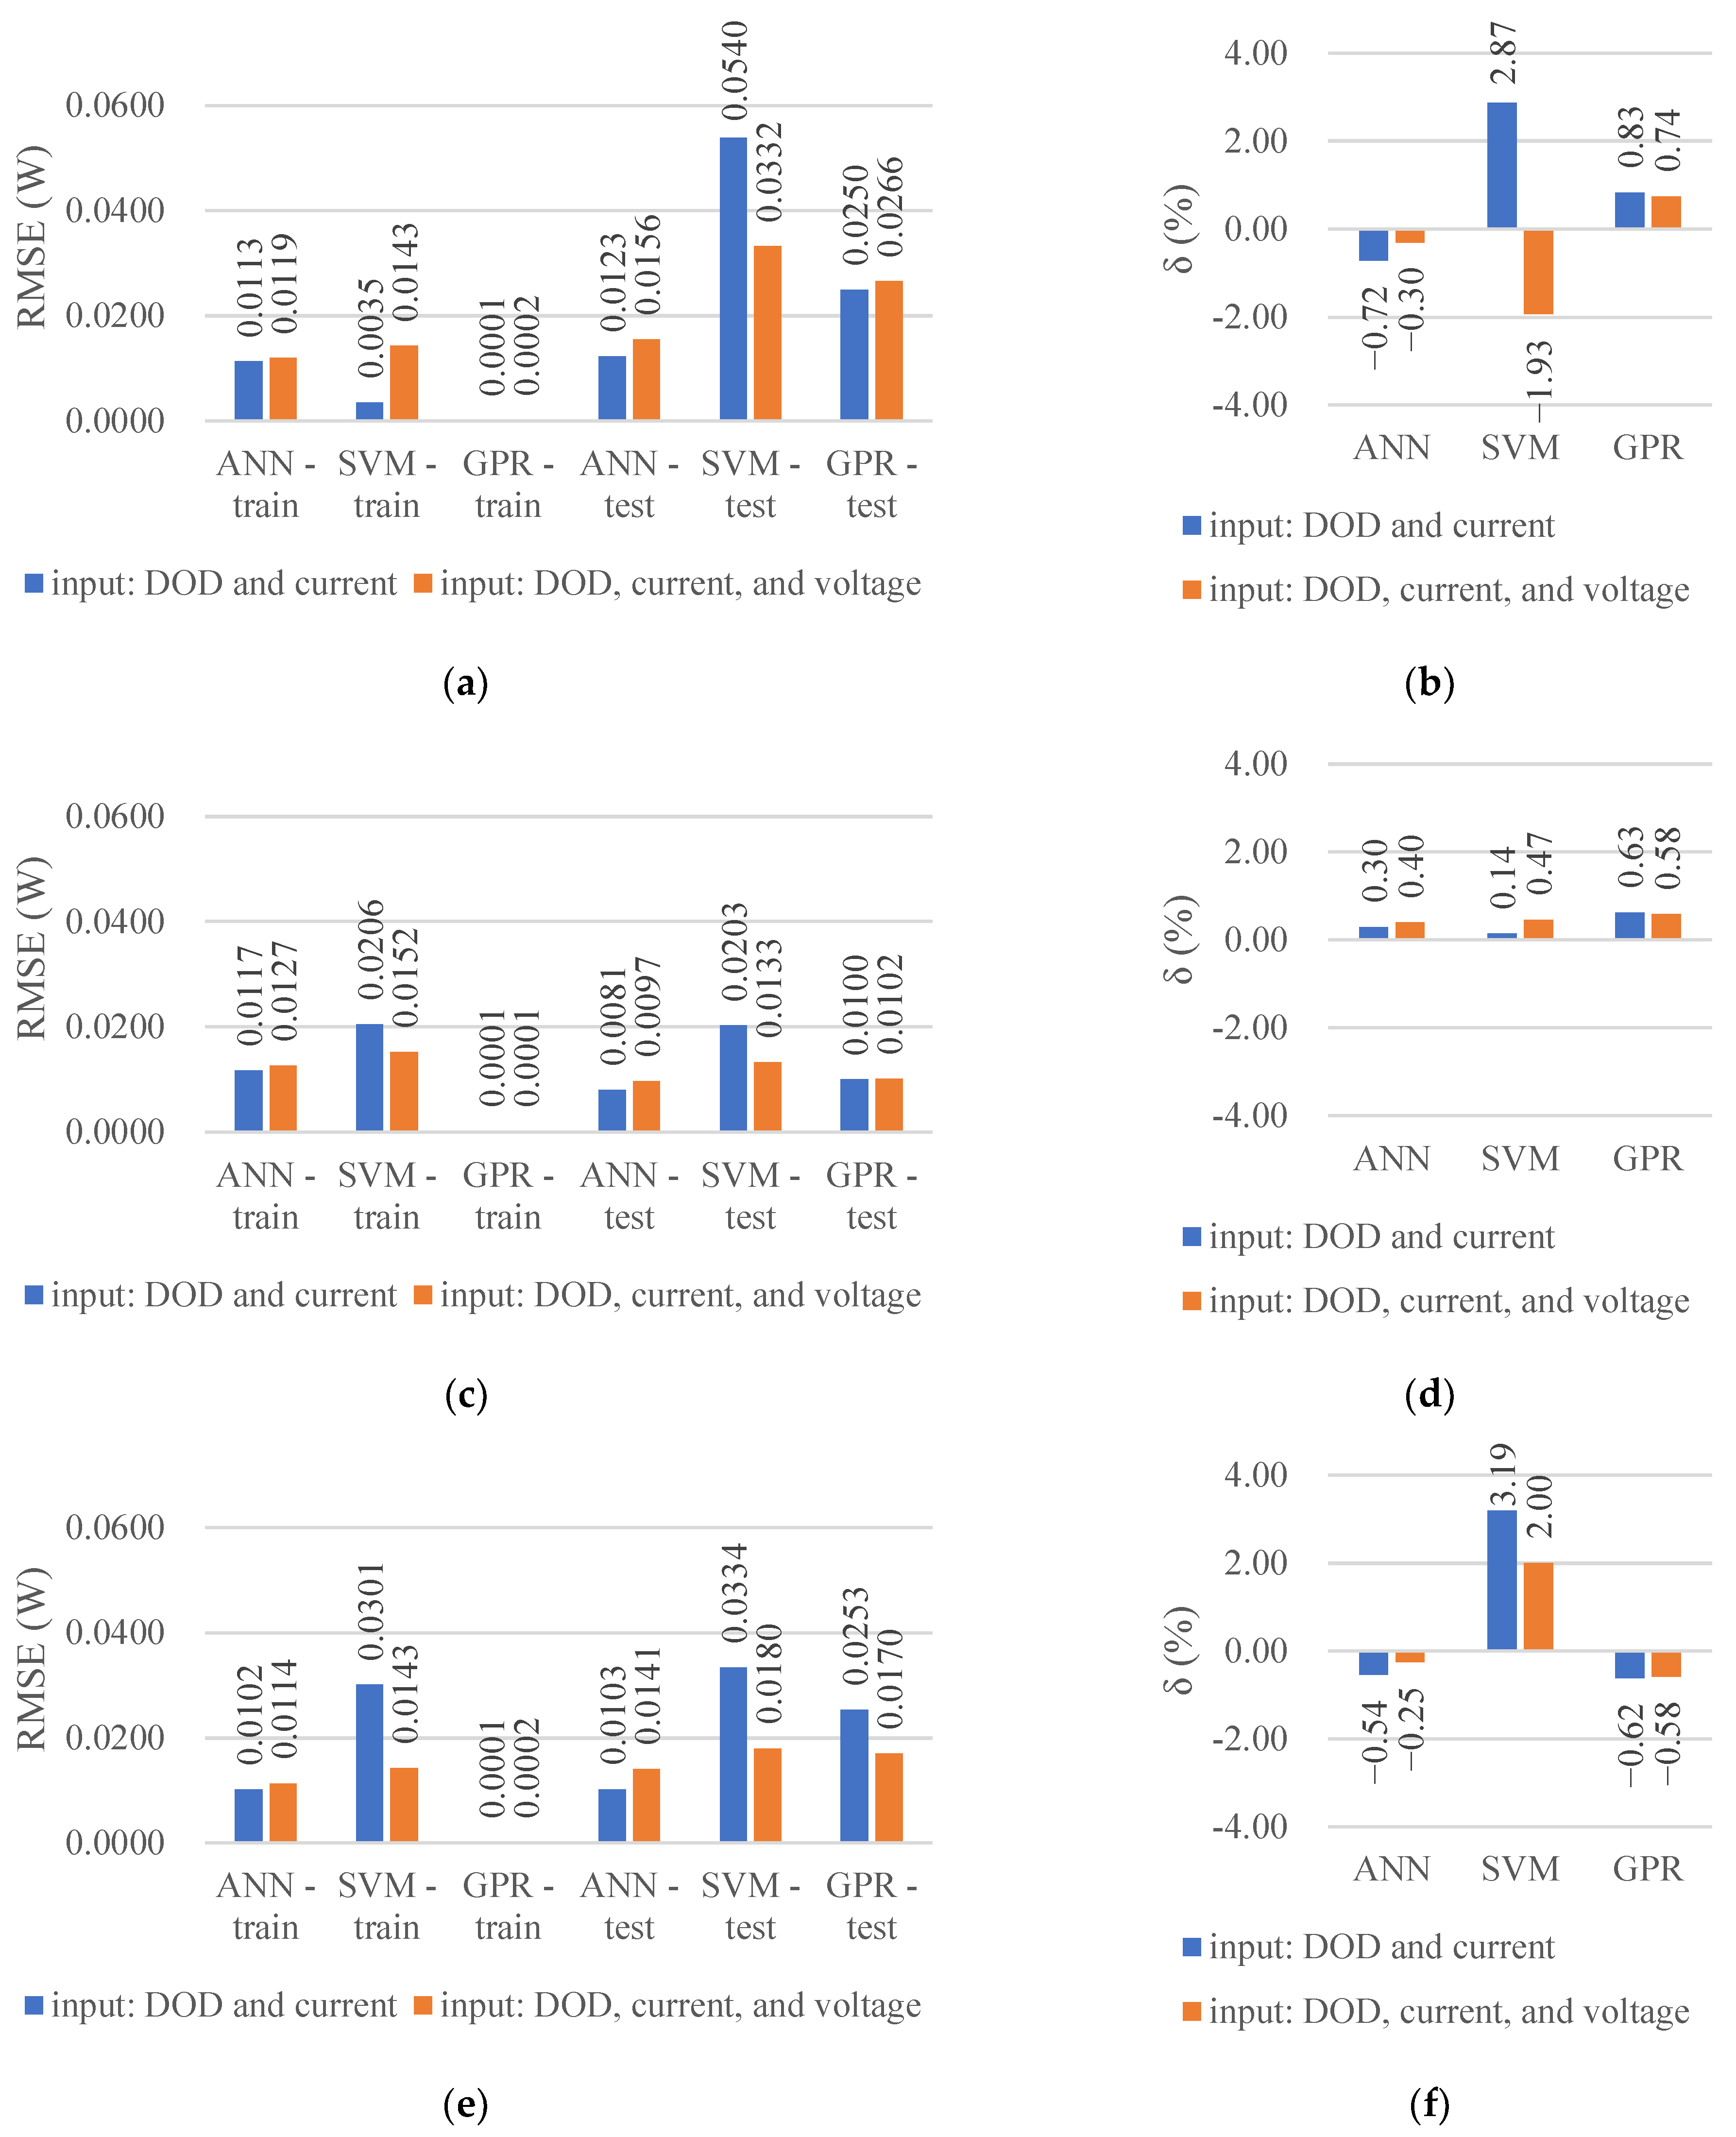
3.2. HGR Prediction at Different Ambient Temperatures

When the inputs were the DOD and ambient temperature, the predicted HGRs discharged at 20, 30, and 45 °C that we obtained by the ANN, SVM, and GPR were compared with the actual values, as shown in Figure 4a,c,e. After the discharge voltage was added to the inputs, the estimated and actual HGRs at 20, 30, and 45 °C are shown in Figure 4b,d,f, respectively. Table 3 lists the ANN architectures and covariance functions of the GPR that were used and the R2 values of the regressions. Figure 5 depicts the training and testing RMSE values and the relative error of the average HGR, δ.

4. Discussion

Figure 2 and the R2 values in Table 2 demonstrate that all three methods achieved good predictions for 1 C discharge (cases No. three and four) that are equivalent to the interpolation, where R2 is greater than 0.96, regardless of whether the inputs contained the discharge voltage. However, the predictions of the extrapolated conditions of 0.5 C (cases No. one and two) and 1.5 C (cases No. five and six) are not as good as those of 1 C. The R2 of the GPR on the 1.5 C discharge prediction was only 0.82 after the discharge voltage was added to the input parameters (Table 2). Figure 3 also demonstrates that the predicted RMSE values of the 1 C discharge were typically the lowest, and the δ values were also low, especially when the discharge voltage was selected as one of the input parameters. Similar results were observed in the predictions at different ambient temperatures. Figure 4 and Figure 5, and the R2 values in Table 3 demonstrate that the three methods achieved good results in the 30 °C predictions (cases No. 9 and 10) that are equivalent to the interpolation, where the R2 values were greater than 0.98. The prediction performances of the extrapolated conditions at 20 °C (cases No. seven and eight) and 45 °C (cases No. 11 and 12) were good, but not as good as those at 30 °C. The three algorithms performed well in the interpolation cases of the HGR prediction, whereas extrapolation may require more input parameters and may not achieve ideal results. Therefore, the boundary of the test conditions must be broadened as much as possible and extrapolation should be avoided in the regression.
The RMSE of the ANN for the 1.5 C discharge prediction decreased (Figure 3e) and R2 increased (Table 2) after adding the discharge voltage to the input parameters, indicating that the prediction performance improved, whereas the performance of the ANN for 0.5 C and 1 C discharge decreased slightly. The performance of the SVM in predicting the discharge at 0.5 C and 1 C was improved after adding the discharge voltage to the input parameters (Figure 3a,c), wherein the minimum R2 values increased from 0.53 to 0.82 (Table 2), and the maximum value reached 0.98 (Table 2). The RMSE of the SVM for 1.5 C discharge prediction slightly increased (Figure 3e) and R2 slightly decreased (Table 2). However, the comparison between Figure 2e,f demonstrated that the accuracy of the prediction in 0.2–0.8 DOD increased after adding the input. The GPR performance significantly improved for all cases of discharge currents (Figure 3), wherein the minimum R2 increased from 0.67 to 0.82 (Table 2) and the maximum value reached 0.98 (Table 2). In the prediction of the cases of different ambient temperatures, the RMSE of the ANN increased slightly after adding the discharge voltage to the inputs (Figure 5), and R2 changed slightly (Table 3), demonstrating slight decreases in the prediction performance. The performance of the SVM and GPR both improved (Figure 5a), wherein the minimum R2 values increased from 0.90 to 0.96 (Table 3) and the maximum value reached 0.99 (Table 3). In summary, the accuracy of the ANN was less affected by the added input parameters, and the number of neurons used exhibited no evident change pattern (Table 2 and Table 3). The SVM and GPR have a high probability of obtaining better predictions with more input parameters. Adding the discharge voltage to the inputs can slightly increase the accuracy of the prediction. However, additional tests must be conducted to obtain the discharge voltage data of the predicted conditions, which increases the test time. Therefore, the prediction accuracy and time consumption must be weighed when selecting the input parameters.
Notably, the average HGR may not accurately reflect the prediction precision. For example, Figure 2e,f, RMSE (Figure 3e), and R2 values (Table 2) all demonstrate that the performance of the GPR for the 1.5 C discharge was improved after adding the discharge voltage as an input, whereas the absolute value of δ in Figure 3f did not decrease. However, δ can still supplement the RMSE, reflecting the relative error magnitude of the prediction. For the predictions of different discharge rates, the maximum absolute value of δ was 7.17% (Figure 3b), except for the prediction of the 0.5 C discharge by the SVM and GPR without discharge voltage being used as an input (Figure 3b). The maximum absolute value of δ was 3.19% (Figure 5f) for the predictions of different ambient temperatures. These results demonstrate that the three algorithms can be effectively applied to predict the battery HGR.
From the comparison of the three algorithms, the ANN performed well in the prediction of interpolation and extrapolation, especially when there was no added input; the minimum R2 was 0.89 and the maximum was 1.00 (Table 2 and Table 3). Additionally, in the predictions for different discharge rates by the ANN, the peaks of the HGR at the initial stages of 1 C and 1.5 C discharge were simulated after adding the discharge voltage as an input, as shown in Figure 2d,f. This detail was also effectively simulated in the prediction for different ambient temperatures by the ANN (Figure 4). Conversely, the SVM and GPR could effectively predict the HGR of 0.5 C and 1.5 C discharge only after the discharge voltage was added to the inputs (Table 2). The performances of the SVM and GPR in the predictions for different ambient temperatures were also inferior to those of the ANN (Table 3). The GPR performed better than the SVM in the predictions except for the 1.5 C discharge (Table 2). Moreover, it better simulated the peak at the initial stage of discharge in the predictions for different ambient temperatures. The SVM exhibited the worst detail-simulation performance among the three algorithms. Figure 3 and Figure 5 also demonstrate that the training RMSE values of the SVM were typically higher than those of the ANN and GPR, and both the training and testing performance were not ideal, which indicates that the SVM models may be underfitting. Conversely, the training RMSE values of the GPR were far lower than those of the ANN and SVM, and also far lower than their testing RMSE (Figure 3 and Figure 5), indicating that the generalization ability of the GPR models was poor and that there was overfitting. The training and testing RMSE values of the ANN were relatively close and small (Figure 3 and Figure 5), indicating that both the learning and generalization abilities of the ANN models were satisfactory. The total training time cannot be directly compared since the search for the optimal architecture or kernel function and optimization of the hyperparameters were all performed when applying the three algorithms; however, a single training time can be considered as a reference. In this study, the single training times of the ANN, SVM, and GPR were within the ranges of 8–25 s, 1–13 s, and 69–383 s, respectively. Essentially, among the three algorithms, the computation cost of the GPR was the highest, whereas that of the SVM was the lowest, and that of the ANN was relatively low.
Overall, the ANN exhibited the best performance. It accurately predicted the interpolation and extrapolation cases using simple architectures (single hidden layer with the number of neurons limited to 15) and only two input parameters. Consequently, the computational cost was low and no additional tests were required. Therefore, the ANN was confirmed to be the most suitable algorithm for predicting the HGR. The prediction accuracies of the GPR were typically better than those of the SVM, but the computational cost was the highest. The prediction performance of the SVM was the worst, but it achieved fast computation.

5. Conclusions

In this study, we used three machine learning algorithms—ANN, SVM, and GPR—to predict the HGR of a lithium-ion battery that was discharged by 0.5 C, 1 C, and 1.5 C at 25 °C and by 1 C at 20, 30, and 45 °C, respectively; this included the cases of interpolation and extrapolation. The prediction performances of the cases where the discharge voltage was included in the input parameters were compared with the cases where the discharge voltage was excluded. The main conclusions of this study are as follows:
  • The prediction performances of the three algorithms for the extrapolation cases were not as good as those for the interpolation cases. Particularly, ideal results may not be obtained for the predictions of the 0.5 C and 1.5 C discharge even after the discharge voltage was added to the inputs. For example, the R2 values of the interpolation cases were greater than 0.96, whereas that of the GPR for the 1.5 C discharge after adding the discharge voltage as an input was only 0.82 (Table 2). Therefore, in practical applications, the boundary of the test conditions must be broadened and extrapolation regression must be avoided as much as possible.
  • The prediction accuracy of the SVM and GPR can be improved by adding the discharge voltage to the input parameters of the DOD and discharge current/ambient temperature. For example, in the prediction of different discharge currents, the minimum R2 value increased from 0.53 to 0.82, and the maximum reached 0.98 (Table 2). The effect of adding the input parameter on the accuracy of the ANN was minimal. However, more tests are required to obtain the discharge voltage data under the conditions to be predicted when the input is added, which increases the time consumption.
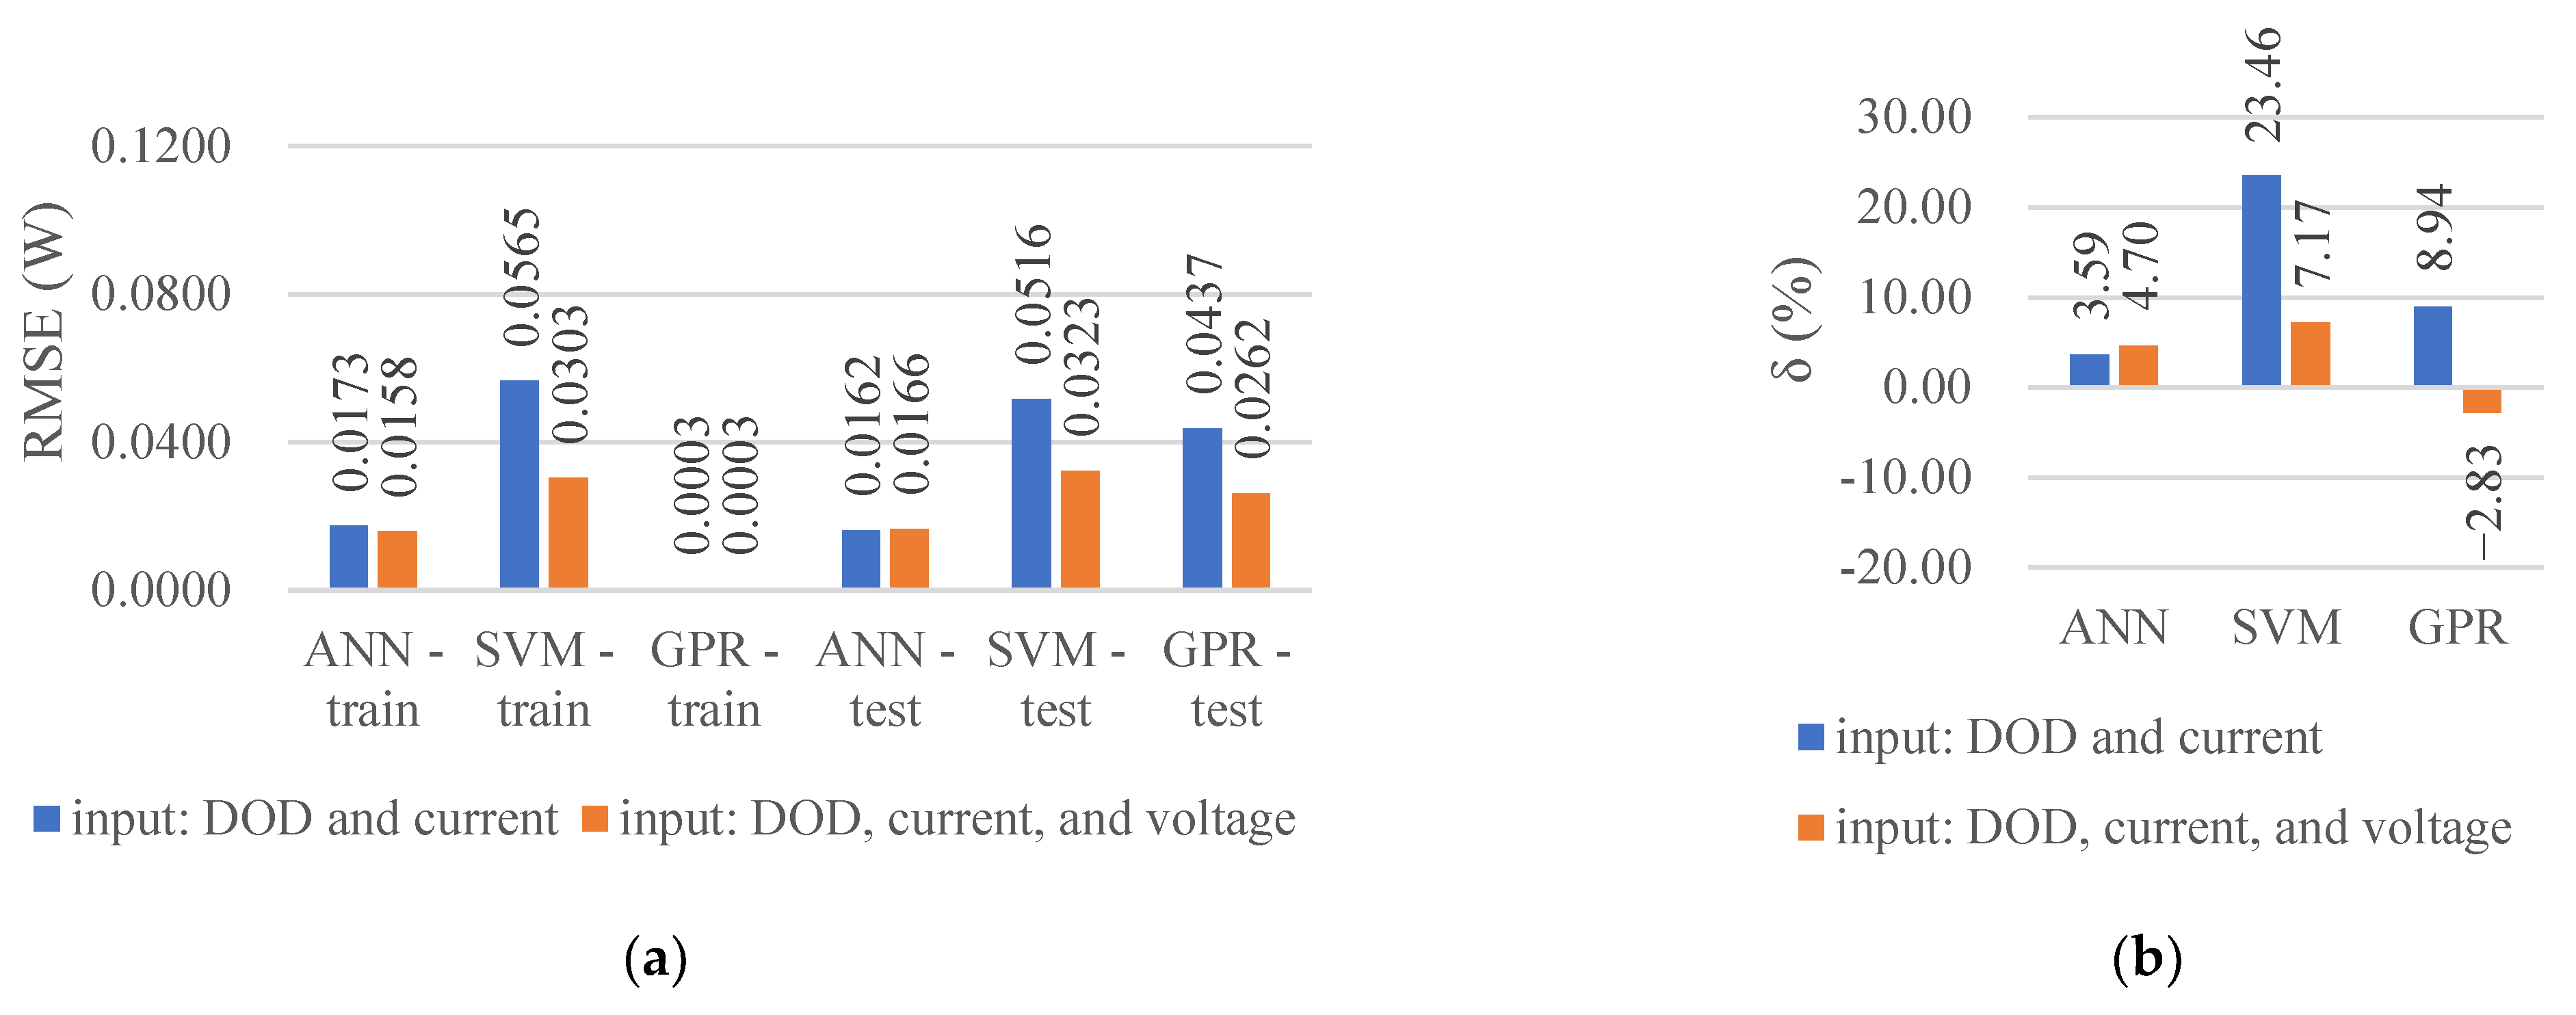
  • The absolute values of the relative error of the average HGRs predicted by the three algorithms were mostly within 5%, indicating that all three algorithms can be applied to predict the battery HGR. The ANN exhibited the best performance among the three algorithms and accurately predicted the interpolation and extrapolation cases without additional input parameters. The R2 values were within the range of 0.89–1.00 (Table 2 and Table 3), the architectures used were simple, and the computation cost was relatively small. Therefore, the ANN is the most preferred among the three machine learning algorithms for similar battery HGR prediction problems.
This study verified the feasibility of ANN, SVM, and GPR for predicting the HGR of lithium-ion batteries and compared their performances. The drawback faced by this study is that the predicted operating conditions are a single factor of the discharge current or ambient temperature. In the future, the HGRs of the combined factors of the discharge current, ambient temperature, and aging can be predicted by collecting more experimental data.

Author Contributions

Conceptualization, R.C., X.Z. and H.Y.; methodology, R.C., X.Z. and H.Y.; software, R.C.; validation, R.C. and H.Y.; formal analysis, R.C. and H.Y.; investigation, R.C.; resources, X.Z.; data curation, R.C.; writing—original draft preparation, R.C.; writing—review and editing, R.C., X.Z. and H.Y.; visualization, R.C.; supervision, X.Z. and H.Y.; project administration, X.Z. and H.Y. All authors have read and agreed to the published version of the manuscript.

Funding

This research received no external funding.

Institutional Review Board Statement

Not applicable.

Informed Consent Statement

Not applicable.

Data Availability Statement

Not applicable.

Conflicts of Interest

The authors declare no conflict of interest.

Abbreviations

The following abbreviations are used in this manuscript:
ANNArtificial neural network;
DODDepth of discharge;
GPRGaussian process regression;
HGRHeat generation rate;
LSTMLong short-term memory;
NARXNon-linear autoregressive exogenous;
NNNeural network;
R2R-squared, or the coefficient of determination;
RBFRadial basis function;
RMSERoot mean square error;
RULRemaining useful life;
SOCState of charge;
SOHState of health;
SVMSupport vector machine;
TMSThermal management system.

References

  1. Dunn, B.; Kamath, H.; Tarascon, J.-M. Electrical Energy Storage for the Grid: A Battery of Choices. Science 2011, 334, 928–935. [Google Scholar] [CrossRef] [PubMed] [Green Version]
  2. Diouf, B.; Pode, R. Potential of Lithium-Ion Batteries in Renewable Energy. Renew. Energy 2015, 76, 375–380. [Google Scholar] [CrossRef]
  3. Beauregard, G.P.; Phoenix, A.Z. Report of Investigation: Hybrids plus Plug in Hybrid Electric Vehicle; Electric Transportation Engineering Corporation (eTec): Idaho Falls, ID, USA, 2008. [Google Scholar]
  4. Smith, B. Chevrolet Volt Battery Incident Summary Report; National Highway Traffic Safety Administration: Washington, DC, USA, 2012.
  5. Hart, C.A.; Sumwalt, R.L.; Rosekind, M.R.; Weener, E.F. Aircraft Incident Report: Auxiliary Power Unit Battery Fire, Japan Airlines Boeing 787-8, JA829J, Boston, Massachusetts, 7 January 2013; National Transportation Safety Board: Washington, DC, USA, 2014.
  6. Goto, N.; Endo, S.; Ishikawa, T.; Tamura, S.; Shuto, Y.; Tanaka, K. Aircraft Serious Incident Investigation Report: All Nippon Airways Co. Ltd., JA804A; Japan Transport Safety Board: Tokyo, Japan, 2014. [Google Scholar]
  7. Feng, X.; Ouyang, M.; Liu, X.; Lu, L.; Xia, Y.; He, X. Thermal Runaway Mechanism of Lithium Ion Battery for Electric Vehicles: A Review. Energy Storage Mater. 2018, 10, 246–267. [Google Scholar] [CrossRef]
  8. Newman, J.; Tiedemann, W. Porous-Electrode Theory with Battery Applications. AIChE J. 1975, 21, 25–41. [Google Scholar] [CrossRef] [Green Version]
  9. Doyle, M.; Fuller, T.F.; Newman, J. Modeling of Galvanostatic Charge and Discharge of the Lithium/Polymer/Insertion Cell. J. Electrochem. Soc. 1993, 140, 1526. [Google Scholar] [CrossRef]
  10. Evans, T.I.; Nguyen, T.V.; White, R.E. A Mathematical Model of a Lithium/Thionyl Chloride Primary Cell. J. Electrochem. Soc. 1989, 136, 328–339. [Google Scholar] [CrossRef]
  11. Guo, M.; White, R.E. Mathematical Model for a Spirally-Wound Lithium-Ion Cell. J. Power Sources 2014, 250, 220–235. [Google Scholar] [CrossRef]
  12. Bernardi, D.; Pawlikowski, E.; Newman, J. A General Energy Balance for Battery Systems. J. Electrochem. Soc. 1985, 132, 5–12. [Google Scholar] [CrossRef] [Green Version]
  13. Mevawalla, A.; Shabeer, Y.; Tran, M.K.; Panchal, S.; Fowler, M.; Fraser, R. Thermal Modelling Utilizing Multiple Experimentally Measurable Parameters. Batteries 2022, 8, 147. [Google Scholar] [CrossRef]
  14. Jindal, P.; Katiyar, R.; Bhattacharya, J. Evaluation of Accuracy for Bernardi Equation in Estimating Heat Generation Rate for Continuous and Pulse-Discharge Protocols in LFP and NMC Based Li-Ion Batteries. Appl. Therm. Eng. 2022, 201, 117794. [Google Scholar] [CrossRef]
  15. Wang, S.; Wu, T.; Xie, H.; Li, C.; Zhang, J.; Jiang, L.; Wang, Q. Effects of Current and Ambient Temperature on Thermal Response of Lithium Ion Battery. Batteries 2022, 8, 203. [Google Scholar] [CrossRef]
  16. Vaidyanathan, H.; Kelly, W.H.; Rao, G. Heat Dissipation in a Lithium Ion Cell. J. Power Sources 2001, 93, 112–122. [Google Scholar] [CrossRef]
  17. Yu, G.; Zhang, X.; Wang, C.; Zhang, W.; Yang, C. Convective Dimensionless Method for Measurement of Heat Generation in a Lithium Thionyl Chloride Battery. J. Electrochem. Soc. 2013, 160, A2027–A2032. [Google Scholar] [CrossRef]
  18. Bazinski, S.J.; Wang, X. Predicting Heat Generation in a Lithium-Ion Pouch Cell through Thermography and the Lumped Capacitance Model. J. Power Sources 2016, 305, 97–105. [Google Scholar] [CrossRef]
  19. Sheng, L.; Zhang, Z.; Su, L.; Zhang, H.; Zhang, H.; Li, K.; Fang, Y.; Ye, W. A Calibration Calorimetry Method to Investigate the Thermal Characteristics of a Cylindrical Lithium-Ion Battery. Int. J. Therm. Sci. 2021, 165, 106891. [Google Scholar] [CrossRef]
  20. Chen, K.; Unsworth, G.; Li, X. Measurements of Heat Generation in Prismatic Li-Ion Batteries. J. Power Sources 2014, 261, 28–37. [Google Scholar] [CrossRef]
  21. Drake, S.J.; Martin, M.; Wetz, D.A.; Ostanek, J.K.; Miller, S.P.; Heinzel, J.M.; Jain, A. Heat Generation Rate Measurement in a Li-Ion Cell at Large C-Rates through Temperature and Heat Flux Measurements. J. Power Sources 2015, 285, 266–273. [Google Scholar] [CrossRef]
  22. Liu, G.; Ouyang, M.; Lu, L.; Li, J.; Han, X. Analysis of the Heat Generation of Lithium-Ion Battery during Charging and Discharging Considering Different Influencing Factors. J. Therm. Anal. Calorim. 2014, 116, 1001–1010. [Google Scholar] [CrossRef]
  23. Osswald, P.J.; del Rosario, M.; Garche, J.; Jossen, A.; Hoster, H.E. Fast and Accurate Measurement of Entropy Profiles of Commercial Lithium-Ion Cells. Electrochim. Acta 2015, 177, 270–276. [Google Scholar] [CrossRef]
  24. Li, Y.; Liu, K.; Foley, A.M.; Zülke, A.; Berecibar, M.; Nanini-Maury, E.; Van Mierlo, J.; Hoster, H.E. Data-Driven Health Estimation and Lifetime Prediction of Lithium-Ion Batteries: A Review. Renew. Sustain. Energy Rev. 2019, 113, 109254. [Google Scholar] [CrossRef]
  25. Boulesteix, A.-L.; Schmid, M. Machine Learning versus Statistical Modeling. Biom. J. 2014, 56, 588–593. [Google Scholar] [CrossRef] [PubMed]
  26. Chandran, V.; Patil, C.K.; Karthick, A.; Ganeshaperumal, D.; Rahim, R.; Ghosh, A. State of Charge Estimation of Lithium-Ion Battery for Electric Vehicles Using Machine Learning Algorithms. World Electr. Veh. J. 2021, 12, 38. [Google Scholar] [CrossRef]
  27. Zhang, Q.; Yang, L.; Guo, W.; Qiang, J.; Peng, C.; Li, Q.; Deng, Z. A Deep Learning Method for Lithium-Ion Battery Remaining Useful Life Prediction Based on Sparse Segment Data via Cloud Computing System. Energy 2022, 241, 122716. [Google Scholar] [CrossRef]
  28. Wang, S.; Zhang, X.; Chen, W.; Han, W.; Zhou, S.; Pecht, M. State of Health Prediction Based on Multi-Kernel Relevance Vector Machine and Whale Optimization Algorithm for Lithium-Ion Battery. Trans. Inst. Meas. Control. 2021, 01423312211042009. [Google Scholar] [CrossRef]
  29. Wang, J.; Deng, Z.; Li, J.; Peng, K.; Xu, L.; Guan, G.; Abudula, A. State of Health Trajectory Prediction Based on Multi-Output Gaussian Process Regression for Lithium-Ion Battery. Batteries 2022, 8, 134. [Google Scholar] [CrossRef]
  30. Wang, W.; Zhang, L.; Yu, H.; Yang, X.; Zhang, T.; Chen, S.; Liang, F.; Wang, H.; Lu, X.; Yang, S.; et al. Early Prediction of the Health Conditions for Battery Cathodes Assisted by the Fusion of Feature Signal Analysis and Deep-Learning Techniques. Batteries 2022, 8, 151. [Google Scholar] [CrossRef]
  31. Afzal, A.; Bhutto, J.K.; Alrobaian, A.; Razak Kaladgi, A.; Khan, S.A. Modelling and Computational Experiment to Obtain Optimized Neural Network for Battery Thermal Management Data. Energies 2021, 14, 7370. [Google Scholar] [CrossRef]
  32. Liu, K.; Li, K.; Peng, Q.; Guo, Y.; Zhang, L. Data-Driven Hybrid Internal Temperature Estimation Approach for Battery Thermal Management. Complexity 2018, 2018, e9642892. [Google Scholar] [CrossRef] [Green Version]
  33. Hasan, M.M.; Ali Pourmousavi, S.; Jahanbani Ardakani, A.; Saha, T.K. A Data-Driven Approach to Estimate Battery Cell Temperature Using a Nonlinear Autoregressive Exogenous Neural Network Model. J. Energy Storage 2020, 32, 101879. [Google Scholar] [CrossRef]
  34. Zhu, S.; He, C.; Zhao, N.; Sha, J. Data-Driven Analysis on Thermal Effects and Temperature Changes of Lithium-Ion Battery. J. Power Sources 2021, 482, 228983. [Google Scholar] [CrossRef]
  35. Arora, S.; Shen, W.; Kapoor, A. Neural Network Based Computational Model for Estimation of Heat Generation in LiFePO4 Pouch Cells of Different Nominal Capacities. Comput. Chem. Eng. 2017, 101, 81–94. [Google Scholar] [CrossRef]
  36. Cao, R.; Zhang, X.; Yang, H.; Wang, C. Experimental Study on Heat Generation Characteristics of Lithium-Ion Batteries Using a Forced Convection Calorimetry Method. Appl. Therm. Eng. 2023, 219, 119559. [Google Scholar] [CrossRef]
  37. Zhang, J.; Huang, J.; Li, Z.; Wu, B.; Nie, Z.; Sun, Y.; An, F.; Wu, N. Comparison and Validation of Methods for Estimating Heat Generation Rate of Large-Format Lithium-Ion Batteries. J. Therm. Anal. Calorim. 2014, 117, 447–461. [Google Scholar] [CrossRef]
  38. Ge, M.-F.; Liu, Y.; Jiang, X.; Liu, J. A Review on State of Health Estimations and Remaining Useful Life Prognostics of Lithium-Ion Batteries. Measurement 2021, 174, 109057. [Google Scholar] [CrossRef]
  39. Zhang, G.; Eddy Patuwo, B.; Hu, M.Y. Forecasting with Artificial Neural Networks: The State of the Art. Int. J. Forecast. 1998, 14, 35–62. [Google Scholar] [CrossRef]
  40. An-na, W.; Yue, Z.; Yun-tao, H.; Yun-lu, L.I. A Novel Construction of SVM Compound Kernel Function. In Proceedings of the 2010 International Conference on Logistics Systems and Intelligent Management (ICLSIM), Harbin, China, 9–10 January 2010; Volume 3, pp. 1462–1465. [Google Scholar]
  41. Rodriguez, J.D.; Perez, A.; Lozano, J.A. Sensitivity Analysis of K-Fold Cross Validation in Prediction Error Estimation. IEEE Trans. Pattern Anal. Mach. Intell. 2010, 32, 569–575. [Google Scholar] [CrossRef]
Figure 1. Architecture of the ANN model.
Batteries 09 00165 g001
Figure 2. Comparison of the estimated and actual HGRs: (a) 0.5 C discharge without discharge voltage as an input; (b) 0.5 C discharge with discharge voltage as an input; (c) 1 C discharge without discharge voltage as an input; (d) 1 C discharge with discharge voltage as an input; (e) 1.5 C discharge without discharge voltage as an input; (f) 1.5 C discharge with discharge voltage as an input.
Batteries 09 00165 g002aBatteries 09 00165 g002b
Figure 3. RMSE of training and testing, and the relative error of the average HGR, δ: (a) RMSE values of 0.5 C discharge; (b) δ of 0.5 C discharge; (c) RMSE values of 1 C discharge; (d) δ of 1 C discharge; (e) RMSE values of 1.5 C discharge; (f) δ of 1.5 C discharge.
Batteries 09 00165 g003aBatteries 09 00165 g003b
Figure 4. Comparison of the estimated and actual HGRs during discharge: (a) at 20 °C without discharge voltage as an input; (b) at 20 °C with discharge voltage as an input; (c) at 30 °C without discharge voltage as an input; (d) at 30 °C with discharge voltage as an input; (e) at 45 °C without discharge voltage as an input; (f) at 45 °C with discharge voltage as an input.
Batteries 09 00165 g004aBatteries 09 00165 g004b
Figure 5. RMSE of training and testing, and the relative error of the average HGR, δ: (a) RMSE values of discharge at 20 °C; (b) δ of discharge at 20 °C; (c) RMSE values of discharge at 30 °C; (d) δ of discharge at 30 °C; (e) RMSE values of discharge at 45 °C; (f) δ of discharge at 45 °C.
Batteries 09 00165 g005
Table 1. Operating conditions to be predicted and the data used.
No.Operation ConditionsDo the Inputs Contain Discharge Voltage?Training DataNumber of Training SamplesNumber of Testing SamplesInterpolation/Extrapolation
10.5 CNo0.75 C, 1 C, 1.25 C, and 1.5 C3820978extrapolation
2Yes
31 CNo0.5 C, 0.75 C, 1.25 C, and 1.5 C3836962interpolation
4Yes
51.5 CNo0.5 C, 0.75 C, 1 C, and 1.25 C3856942extrapolation
6Yes
720 °CNo25, 30, 35, 40, and 45 °C4930933extrapolation
8Yes
930 °CNo20, 25, 35, 40, and 45 °C4887976interpolation
10Yes
1140 °CNo20, 25, 30, 35, and 40 °C48561007extrapolation
12Yes
Table 2. ANN architectures and covariance functions of GPR that were used, and R2 of the regressions.
No.Operation ConditionsDo the Inputs Contain Discharge Voltage?ANN ArchitectureCovariance Function of GPRR2
ANNSVMGPR
10.5 CNo1 hidden layer–5 neuronsMatern 3/20.950.530.67
2Yes1 hidden layer–8 neuronsMatern 3/20.950.820.88
31 CNo1 hidden layer–3 neuronsMatern 5/20.990.960.97
4Yes1 hidden layer–5 neuronsExponential0.980.980.98
51.5 CNo1 hidden layer–10 neuronsMatern 3/20.890.940.72
6Yes1 hidden layer–4 neuronsMatern 3/20.940.930.82
Table 3. ANN architectures and covariance functions of GPR that were used, and R2 of the regressions.
No.Operation ConditionsDo the Inputs Contain Discharge Voltage?ANN ArchitectureCovariance Function of GPRR2
ANNSVMGPR
720 °CNo1 hidden layer–15 neuronsMatern 3/20.990.900.98
8Yes1 hidden layer–5 neuronsMatern 3/20.990.960.97
930 °CNo1 hidden layer–9 neuronsMatern 3/21.000.981.00
10Yes1 hidden layer–5 neuronsRational quadratic1.000.991.00
1145 °CNo1 hidden layer–6 neuronsMatern 3/20.990.920.96
12Yes1 hidden layer–7 neuronsMatern 3/20.990.980.98
Disclaimer/Publisher’s Note: The statements, opinions and data contained in all publications are solely those of the individual author(s) and contributor(s) and not of MDPI and/or the editor(s). MDPI and/or the editor(s) disclaim responsibility for any injury to people or property resulting from any ideas, methods, instructions or products referred to in the content.

