

Research on the Surfactant-Assisted Synthesis of MnZn Ferrite Precursor Powders
1
School of Traffic & Transportation Engineering, Central South University, Changsha 410075, China
2
Farsoon Technologies Company Limited, Changsha 410006, China
3
State Key Laboratory of Powder Metallurgy, Central South University, Changsha 410083, China
*
Author to whom correspondence should be addressed.
Magnetochemistry 2023, 9(6), 146; https://doi.org/10.3390/magnetochemistry9060146
Submission received: 6 April 2023
/
Revised: 25 May 2023
/
Accepted: 26 May 2023
/
Published: 30 May 2023
(This article belongs to the Special Issue Advances in Soft Magnetic Materials)
Abstract
:MnZn ferrite precursor powders were prepared by the nano in situ composite method. Three surfactants, which include polyethylene glycol 400 (PEG-400), cetyltrimethyl ammonium bromide (CTAB), and sodium dodecyl sulfate (SDS), were usedM and the impact of the surfactants on the precursor sol solutions and precursor powders was studied. X-ray diffraction (XRD), Fourier transform infrared (FTIR) spectroscopy, Raman spectroscopy, a field emission scanning electron microscope (FE-SEM), a transmission electron microscope (TEM), a Zeta potential meter, a BET surface analyzer, and a vibrational sample magnetometer (VSM) were used to characterize the precursor sol solutions and the precursor powders. The results showed that these surfactants can improve the dispersion state and Zeta potentials of sol particles and increase the specific surface areas of the precursor powders. Moreover, the precursor powders were composed of MnZn ferrite, and some were amorphous. CTAB was the optimum surfactant and the zeta potential of the sol particles and the specific surface area of the precursor powders named P-0.1CTAB are 10.7 mV and 129.07 m2/g, respectively. In addition, the nano-particles that were made up of the P-0.1CTAB precursor powders had smaller sizes and more uniform particle distributions than the others. The magnetic properties’ improvement was attributed to the addition of surfactants, and CTAB is the optimal type. In addition, the novel nano in situ composite method will inspire fresh thinking and investigation into the research of ferrite.
1. Introduction
MnZn ferrite (MZF) is one of the typical spinel materials, which are also technologically important materials because of their high magnetic permeability, high saturation magnetization, high resistivity, and low core losses [1,2,3]. The conventional ceramic process is the most popular method to prepare MZF. However, the scope of application of these traditional products is limited due to large and non-uniform particle size and inducing impurities [4]. To a certain extent, the properties of this magnetic material depend on the purity, size and morphology of the powders, and the optimization of powder characteristics will be a useful strategy in the material manufacturing process [5]. Ultrafine/nano MZF powders possess the characteristics of small particle size and large specific surface area, which are a strong guarantee for high quality materials. However, it is easy for coarsening and agglomeration to happen during the powder preparation process, ascribed to the thermodynamic instability. In previous studies, various surfactants have been utilized in the different synthesis processes of ferrite nanoparticles to improve this poor phenomenon [5,6,7,8,9,10,11,12]. When these surfactants are adopted to chemically modify the surfaces of those particles, the repulsive energy between the particles increases, these particles are in a thermodynamic stable state, and most of the particle sizes exhibited are much smaller. These studies showed great results. However, a gap in real engineering applications still exists as these routes always possess relatively complex and rigorous preparative processes. Therefore, a facile and rapid method should be employed, while optimizing the powders’ characteristics by adopting surfactants. Recently, the nano in situ composite method has been successfully applied to fabricated MZF [13,14]. What is more, these methods are also applied in producing tungsten matrix composites, and the results are perfect [15,16,17]. In this way, the nano in situ composite method have great prospects for industrial product MZF or MZF powders due to their low operating temperature, easy operation, short process, and high degree of uniformity. According to previous studies [13,14,18], the preparation of high-quality MZF precursor powders is a prerequisite step, and the target products can only be obtained after subsequent necessary calcination, sintering, and other processes. What is more, the optimization of the characteristics of precursor powders through surfactants is an effective means to obtain high-quality MZF precursor powders. However, there are no specific reports about optimizing the process of preparing MZF precursor powders in this new method. Based on the above descriptions, in this manuscript, the authors used the nano in situ composite method to prepare MZF precursor powders, discussed the results by adding various surfactants, and optimized the selected type of surfactant, and it will be an interesting theme.
2. Experimental Procedure
2.1. Material Preparation
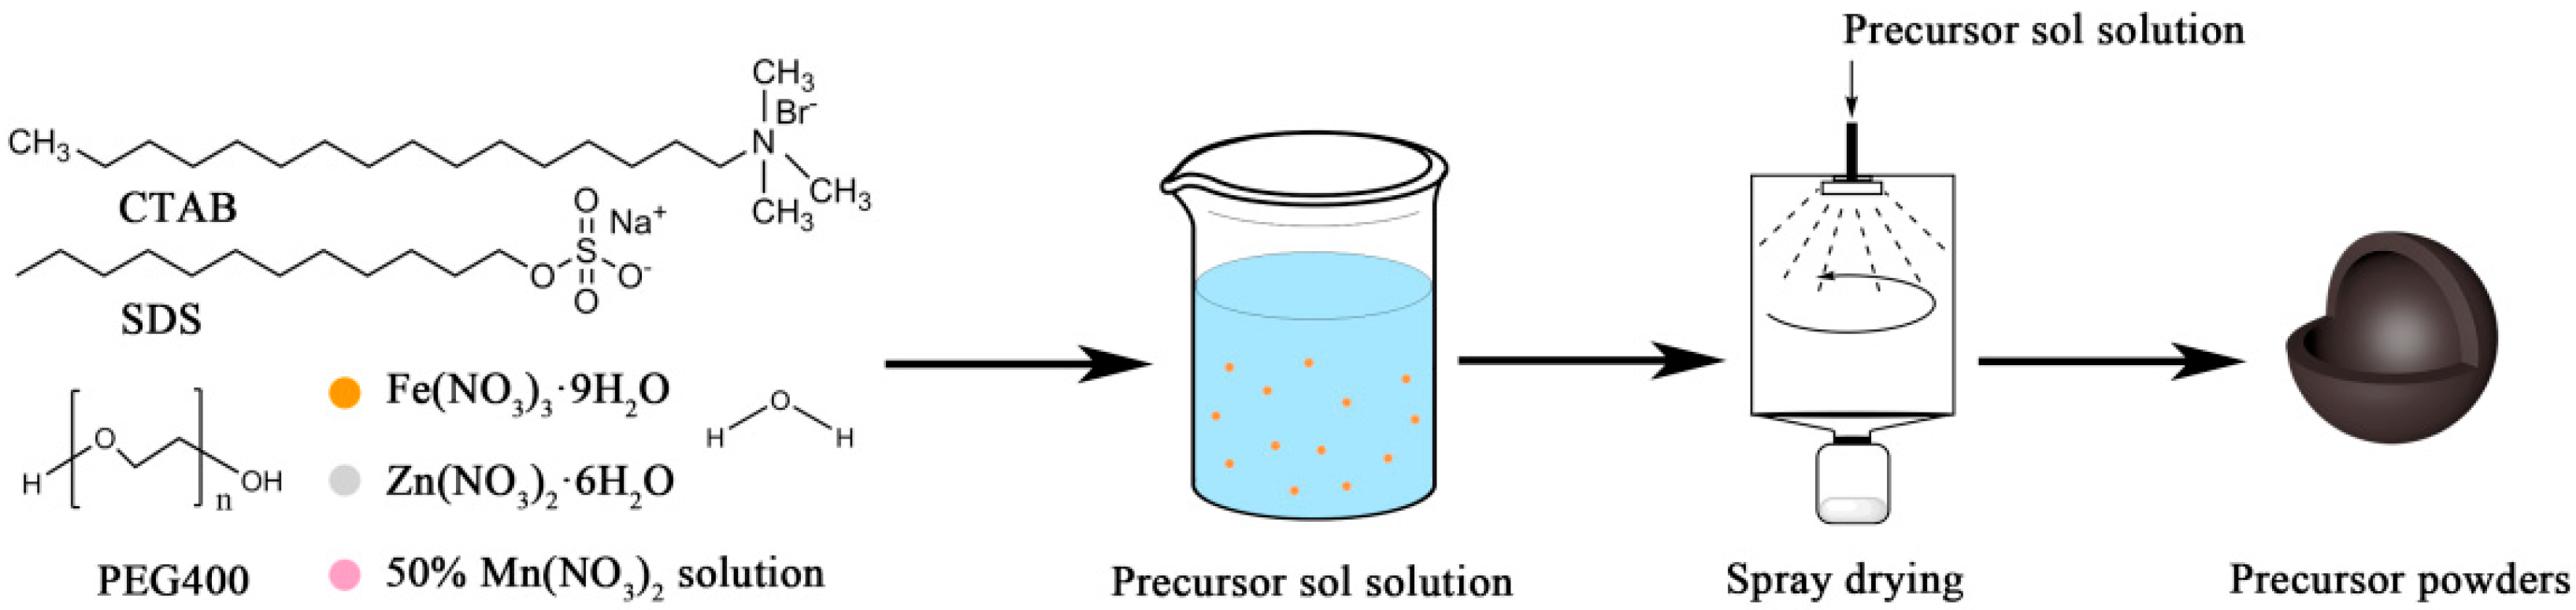
The raw materials used in the experiments were Fe(NO3)3·9H2O, Zn(NO3)2·6H2O, and 50 wt.% Mn(NO3)2 solution (industrial-grade). PEG400, CTAB, and SDS were the surfactants and deionized water was used throughout the experiments. All chemical reagents were used without any further purification. The nano in situ composite method with different surfactants was adopted to prepare MnZn ferrite precursor powders and the preparation process is explained in Figure 1. Firstly, Fe(NO3)3·9H2O, Zn(NO3)2·6H2O, and 50 wt.% Mn(NO3)2 solution dissolved into deionized water according to the desired components (Mn0.5Zn0.5Fe2O4) and different kinds of surfactants of 0.1 wt.% amount were added into the above saline mixture solution to avoid agglomeration during the preparation process, and the sol solution was stirred for half an hour to keep it uniform. After that, the precursor solution was pumped into a rotary atomizer, where it was transformed into a spray of small droplets. These droplets were then brought into contact with a stream of hot air, which resulted in rapid evaporation of the moisture while the droplets were suspended in the drying air. Then, precursor powders with uniform distribution of different elements were yielded. The inlet temperature of spray drying was 250 °C, the solution feed rate was 30 mL/min, and the atomizer rotating speed was 28,000 rev/min. Moreover, there were different kinds of precursor powders, named P-None, P-0.1CTAB, P-0.1SDS, and P-0.1PEG. The P-None without surfactant served as the control.
2.2. Characterization
2.2.1. Zeta Potential Analysis Method
A Malvern Zetasizer Nano ZS analyzer (Malvern, UK) was applied to evaluate the Zeta potentials of the stable precursor solutions. The samples should be clean and free of impurities.
2.2.2. BET Analysis Method
The surface areas of the precursor powders were characterized by the Brunauer–Emmett Teller (BET) method of adsorption of nitrogen gas. The automatic specific surface analyzer (Quadrasorb Monosorb, Quantachrome Instruments, Boynton Beach, FL, USA) was applied in this characterization.
2.2.3. XRD Analysis Method
Phase analysis was carried out by powder the X-ray diffraction method (Advance D8, Bruker, Fällanden, Switzerland) using Cu Kα radiation (λ = 0.15406 nm) in the 2θ range from 5–80° at room temperature. The linear step size was 0.02°.
2.2.4. FTIR Spectroscopy Analysis Method
The FTIR spectrums of the samples were recorded in range (4000–400 cm−1) by a Nicolet-6700 infrared Fourier spectrometer (ThermoFisher, Waltham, MA, USA). The KBr disk method was adopted for this purpose.
2.2.5. Raman Spectroscopy Analysis Method
The Raman spectrums of the samples were recorded in the range of 100–2000 cm−1 on the excitation wavelength of 632.8 nm by a LabRAM HR800 Raman spectrometer (Horiba Jobin Yvon, Palaiseau, France).
2.2.6. SEM Analysis Method
The morphologies and elemental distribution of the precursor powders were investigated by a scanning electron microscope (SEM, Nova NanoSEM 230, FEI, Brno, Czech Republic). All of the samples were gold sputtered before being used in the SEM analysis.
2.2.7. TEM Analysis Method
The bright field images and high-resolution morphologies (HRTEM) of the precursor powders were observed using a transmission electron microscope (TEM). Micrographs of the stable precursor solutions were also obtained by TEM. The devices models are Tecnai G2 20S-Twin (FEI, Brno, Czech Republic) and JEOL 2100F (JEOL, Tokyo, Japan). The acceleration voltage was tested at 200 kV.
2.2.8. VSM Analysis Method
Magnetization measurements at the maximum magnetic field of 30,000 Oe were carried out using an MPMS XL-7 vibrational sample magnetometer (VSM, Quantum Design, San Diego, CA, USA) at room temperature.
3. Results and Discussion
3.1. Analysis of Precursor Sol Solutions
3.1.1. Zeta Potential Analysis
When reagents are dispersed in water, due to the surface charge of the sol particles, they tend to attract the ions of opposite charges in the water which leads to the formation of an electrical double layer (EDL) [19]. P-None, P-0.1CTAB, and P-0.1PEG showed positive Zeta potentials (Table 1). The Zeta potential will increase with the increase in the EDL when the cationic surfactant CTAB is added. PEG 400 is a non-ionic surfactant, and it will be adsorbed on the surface of sol particles via a hydrogen bond to increase the EDL. Thus, the Zeta potential increased because of the addition of PEG 400. However, the molecular weight is small, so the increase is not obvious. Conversely, the Zeta potential of P-0.1SDS was negative, and this may owe to the nature of the anionic surfactant of SDS.
3.1.2. TEM Analysis
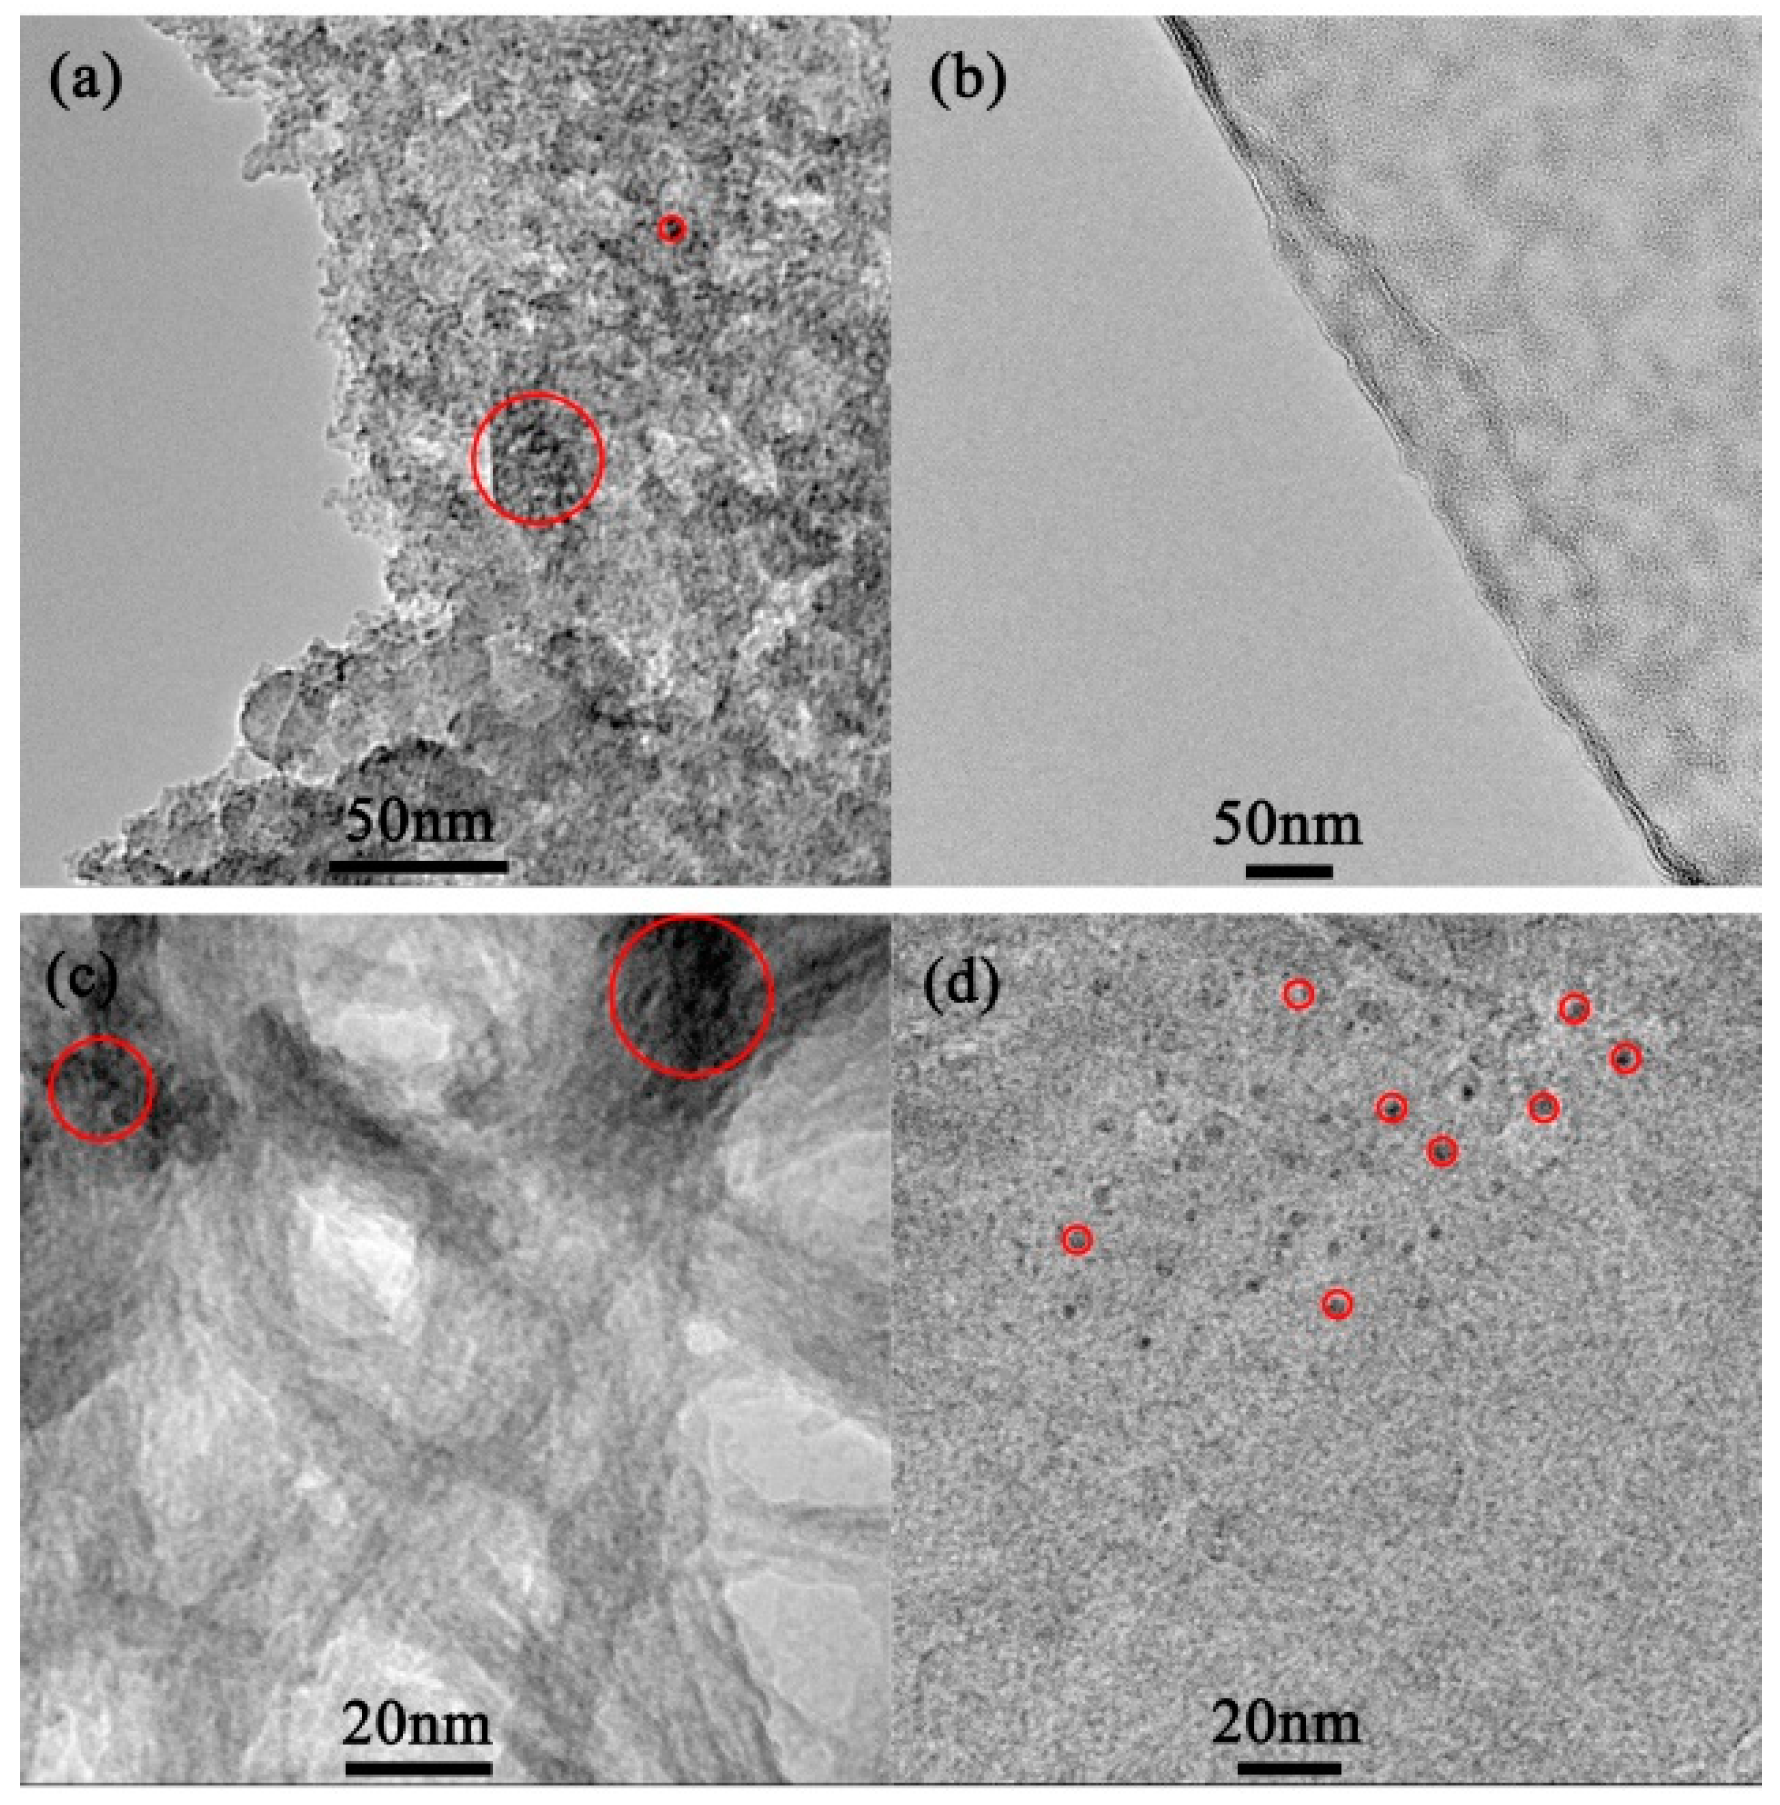
The sol particles were spherical shaped, and they were several nanometers in length which matched with the size of the common sol particles (Figure 2). Obviously, the P-0.1CTAB (Figure 2b) exhibited uniform distribution of particles, while the other samples showed various degrees of aggregation. The phenomenon was underlined by the red circle areas. Moreover, the phenomenon also showed the varying trend of Zeta potential of the precursor sol solutions.
3.2. Analysis of Precursor Powders
3.2.1. XRD and BET Analysis
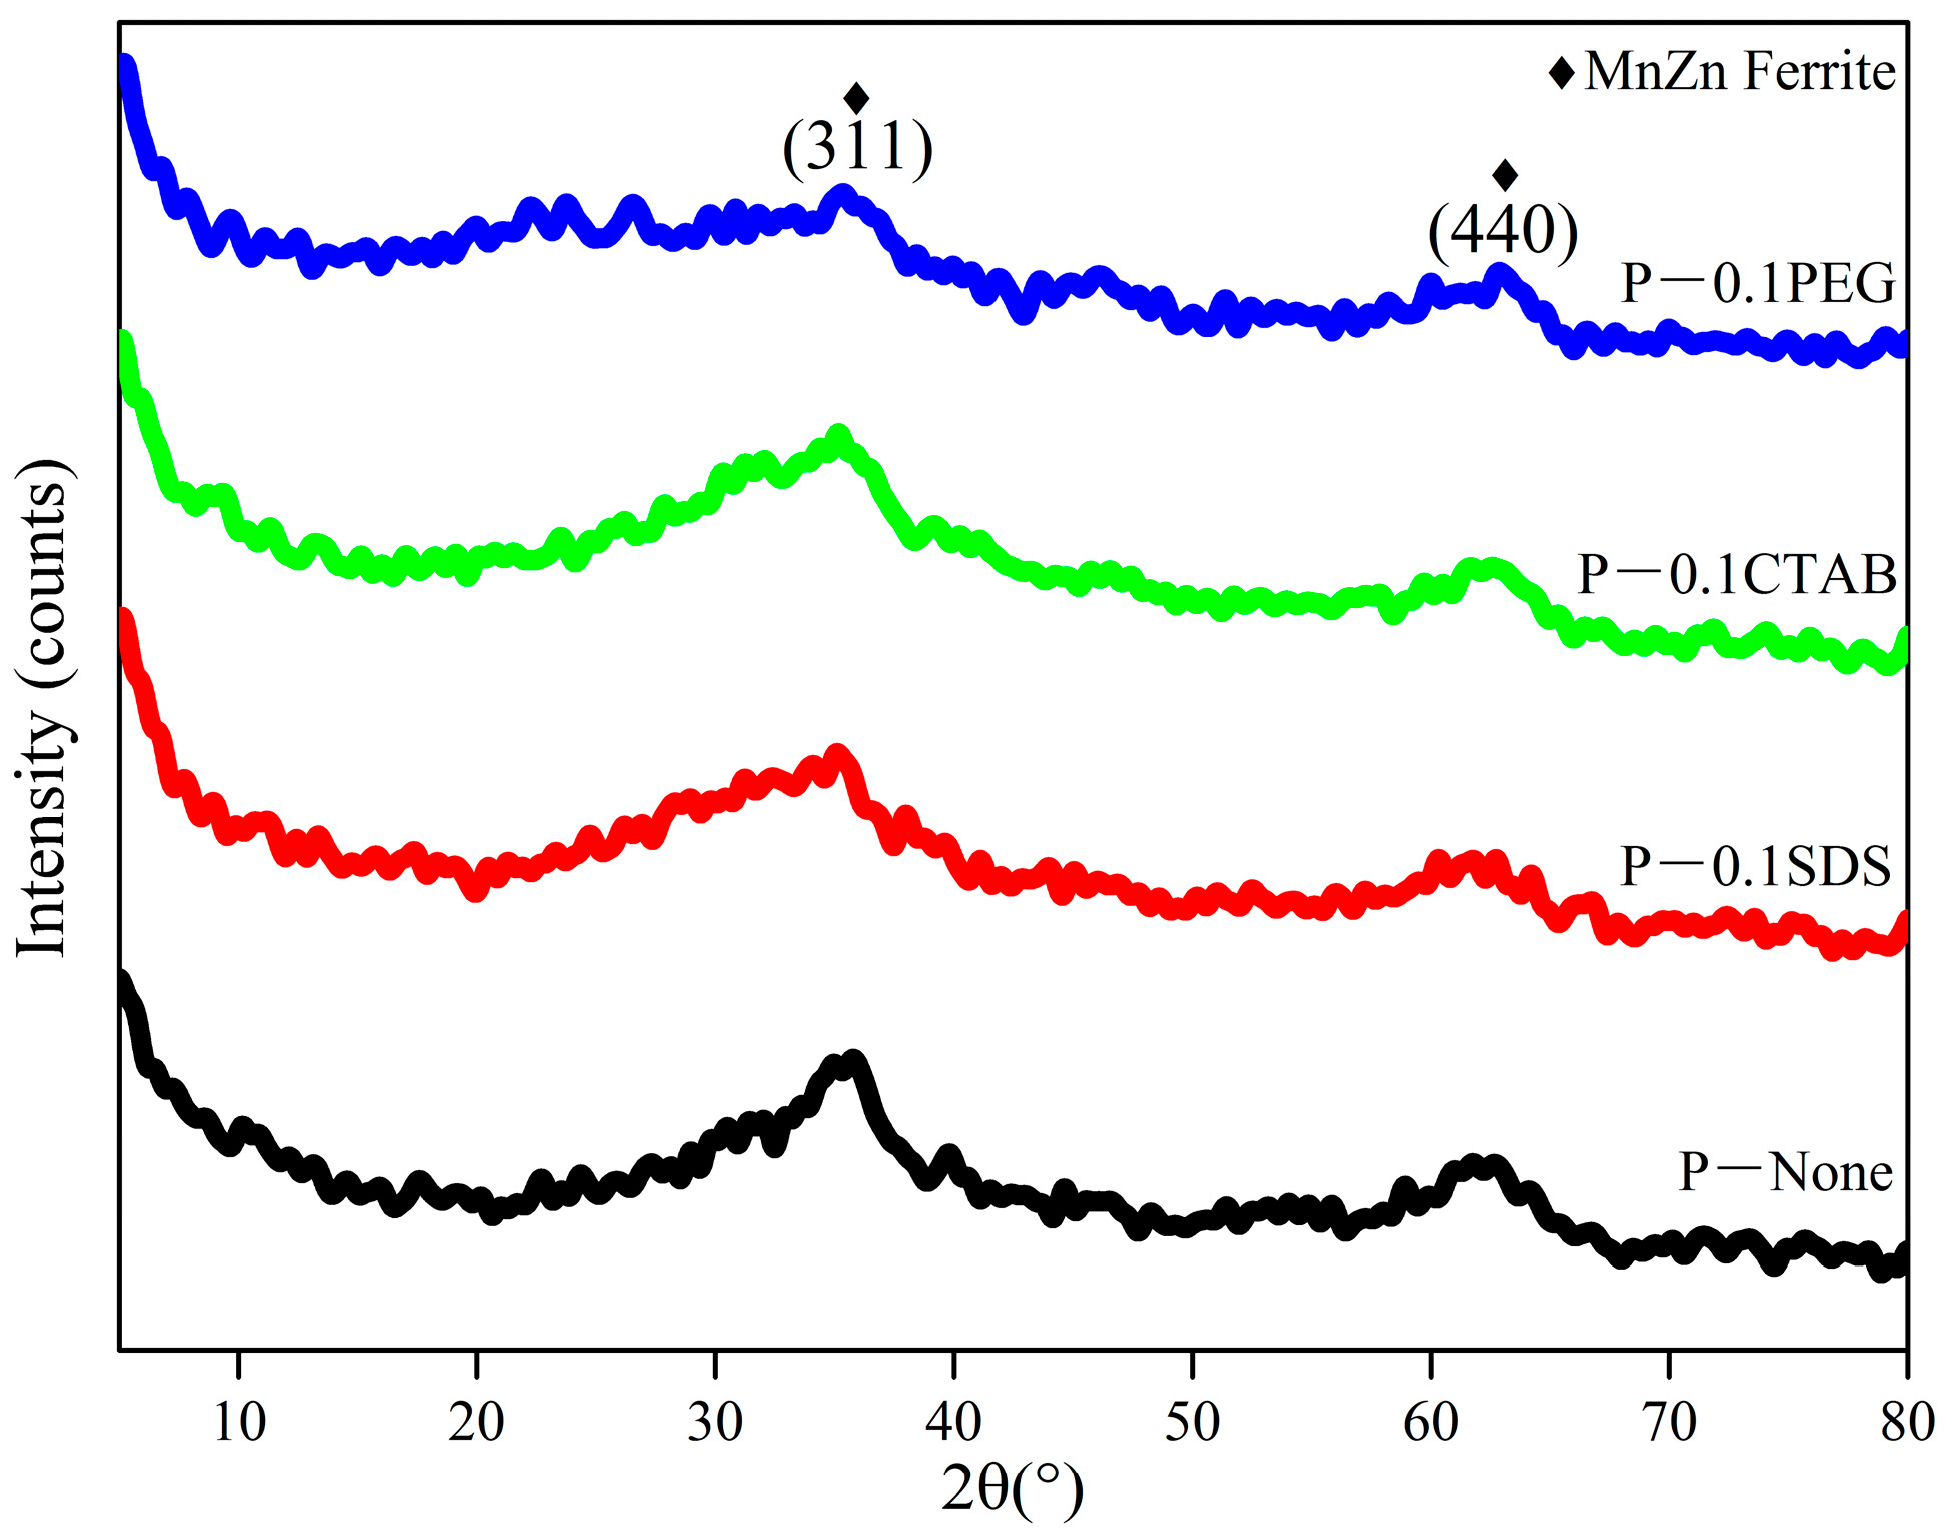
There were two low intensity peaks in all samples, which index to the (311) and (440) plane of MnZn ferrite (Figure 3). In addition, they can also be treated as hill-like broad peaks. This means that the materials are microcrystal or semi-crystalline [20]. Note that during the preparation of precursor sol solutions and at the earlier stage of spray drying, the formation of mixed polymerized precursors may occur owing to the polycondensation of nitrate aquacomplexes via OH-bridges [21]. Their decomposition and reaction enables the preparation of highly homogeneous products. However, the preparation process is especially rapid, and the products will be microcrystal or semi-crystalline. Moreover, it was easy to see that the composition was not affected by adding the surfactants. The BET specific surface areas show that the sample P-0.1CTAB has the highest specific surface (Table 2). Generally, the smaller the particle size, the larger the specific surface area of the particles. The smaller the diameter of the particles, the larger the number of particles per unit volume and the larger the total surface area. Thus, the specific surface areas obtained for the samples reveal that P-0.1CTAB has the smallest particle size. This is also the result of the large Zeta potential of P-0.1CTAB. The high activity of the smaller particles will promote the densification of the bulk material when small particle size powders are used as the raw material. In addition, when the fine powders are directly used as a product, their high adsorption characteristics can be utilized to promote their purification ability, etc.
3.2.2. FTIR Spectroscopy Analysis
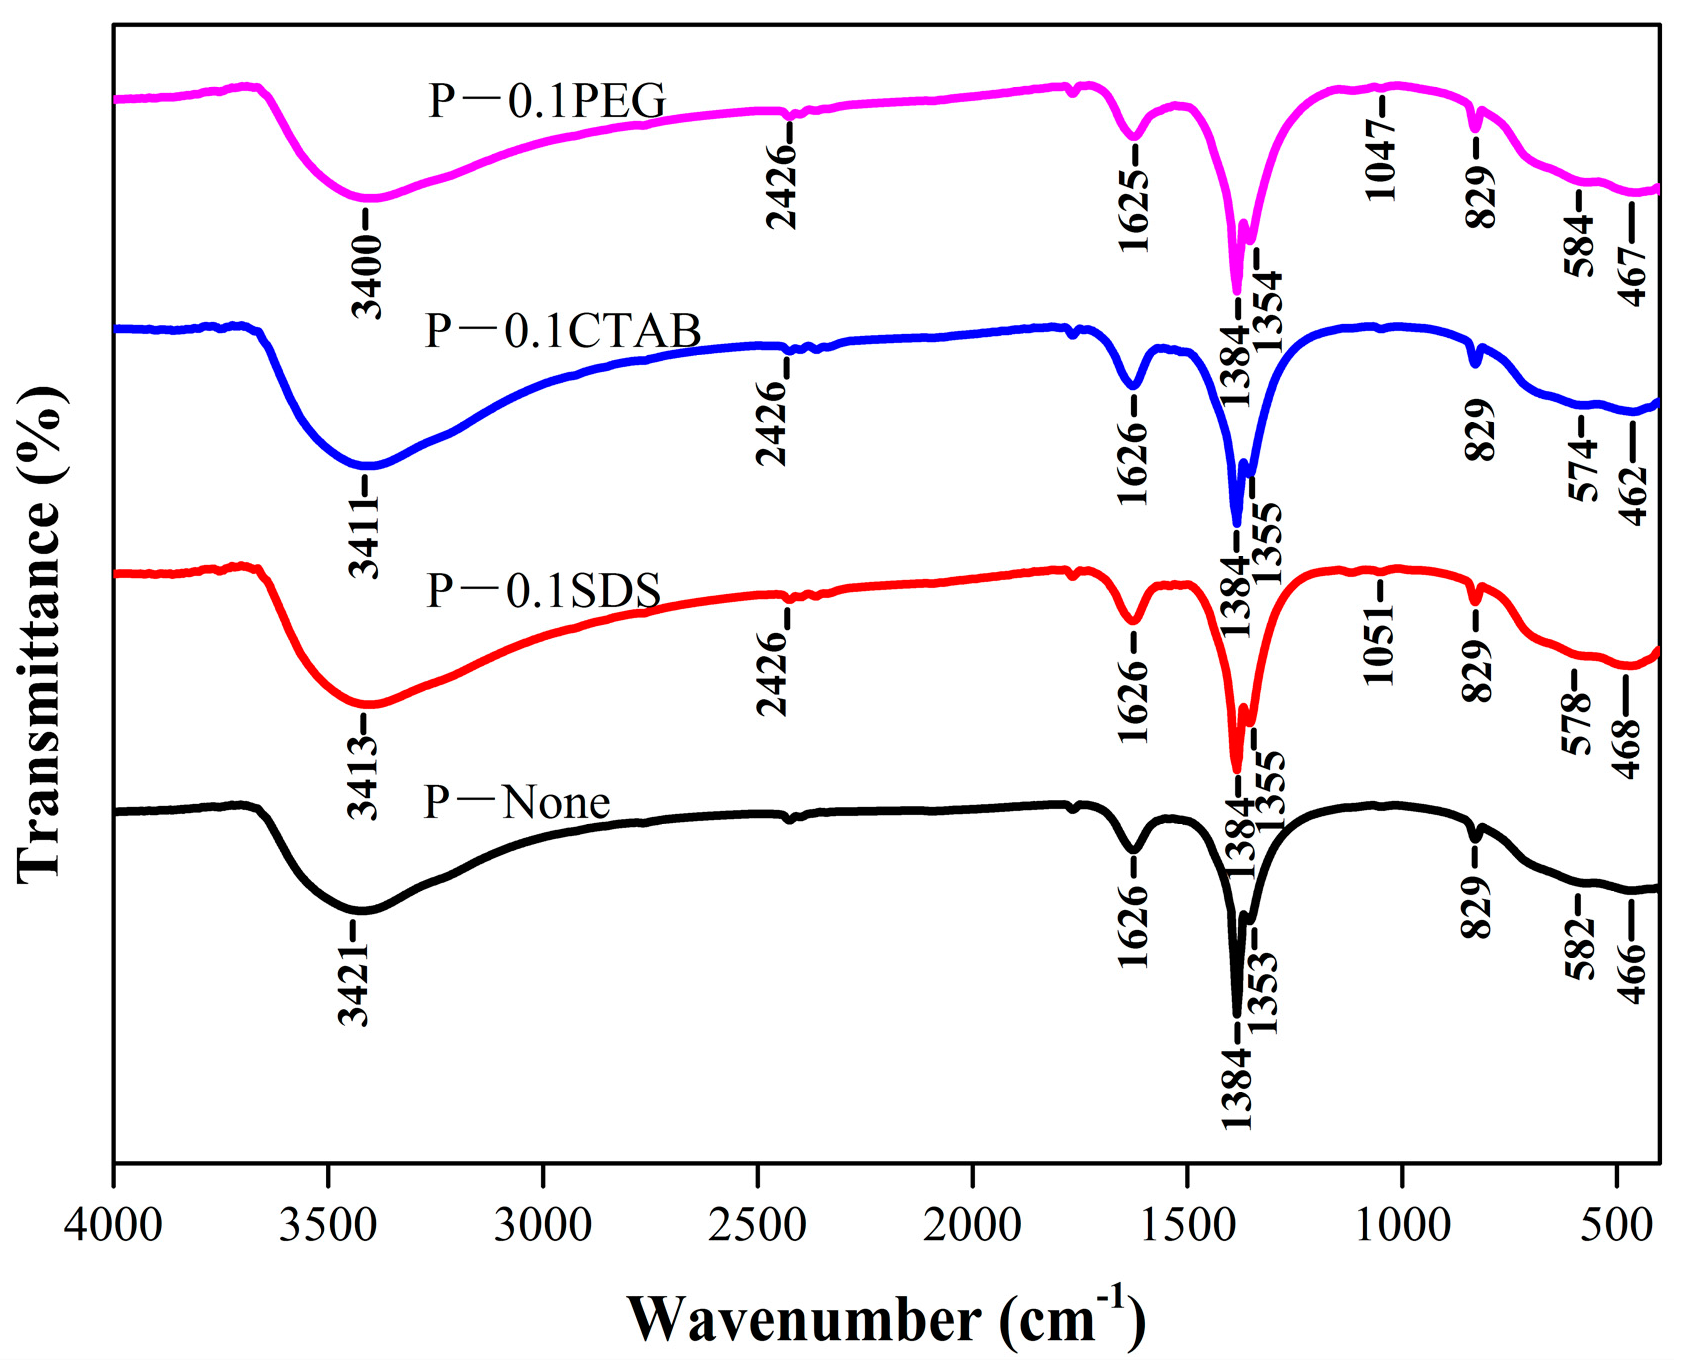
The FTIR spectra of the precursor powders were recorded at room temperature and are shown in Figure 4. There were two main peaks presented in all samples at 582 cm−1, 578 cm−1, 574 cm−1, 584 cm−1 and 466 cm−1, 468 cm−1, 462 cm−1, 467 cm−1 for P-None, P-0.1SDS, P-0.1CTAB, and P-0.1PEG, respectively. The high frequency (ν1) band corresponds to the inherent stretching vibration of the metal ion–oxygen ion bond on the A-sites of the MnZn ferrite, while the low frequency (ν2) band corresponds to the bending vibration of the metal ion–oxygen ion bond on the B-sites. The differences in the ν1 and ν2 bands’ position are expected because of the difference in (Fe3+-O2−) for the B sites and A sites [22]. These band positions for the FTIR spectra of the samples, which are consistent with the characteristics of the absorption band of MnZn ferrite crystals, show that MnZn ferrites exist in the samples. Furthermore, a slight variation is observed in the ν1 and ν2 bands’ positions with different surfactants which is due to the variation in the size of the particles. A similar result in CoFe2O4 magnetic nanoparticles synthesized via the co-precipitation method by M. Vadivel et al. is reported [9]. All the samples exhibited a broad peak in the range of 3400–3421 cm−1 which corresponds to the hydroxide group of the moisture present in the samples [23]. The bands at 1626 cm−1 and 1625 cm−1 correspond to the H-O-H scissoring from free or absorbed water in all samples [24]. A peak at 1384 cm−1 is assigned to the C-N bond [25] and corresponds to the remaining CTAB. More than that, the 1384 cm−1, 1355 cm−1, and 829 cm−1 peaks can be attributed to the NO3− in the FTIR spectra [26,27]. A peak at 2426 cm−1 is attributed to symmetric stretching of the (-CH2-) group [25]. The band that appeared in the range 1047–1051 cm−1 in the spectra corresponds to the C-O single bond in PEG and SDS [28]; this also indicates the truth of the residual PEG400 and SDS.
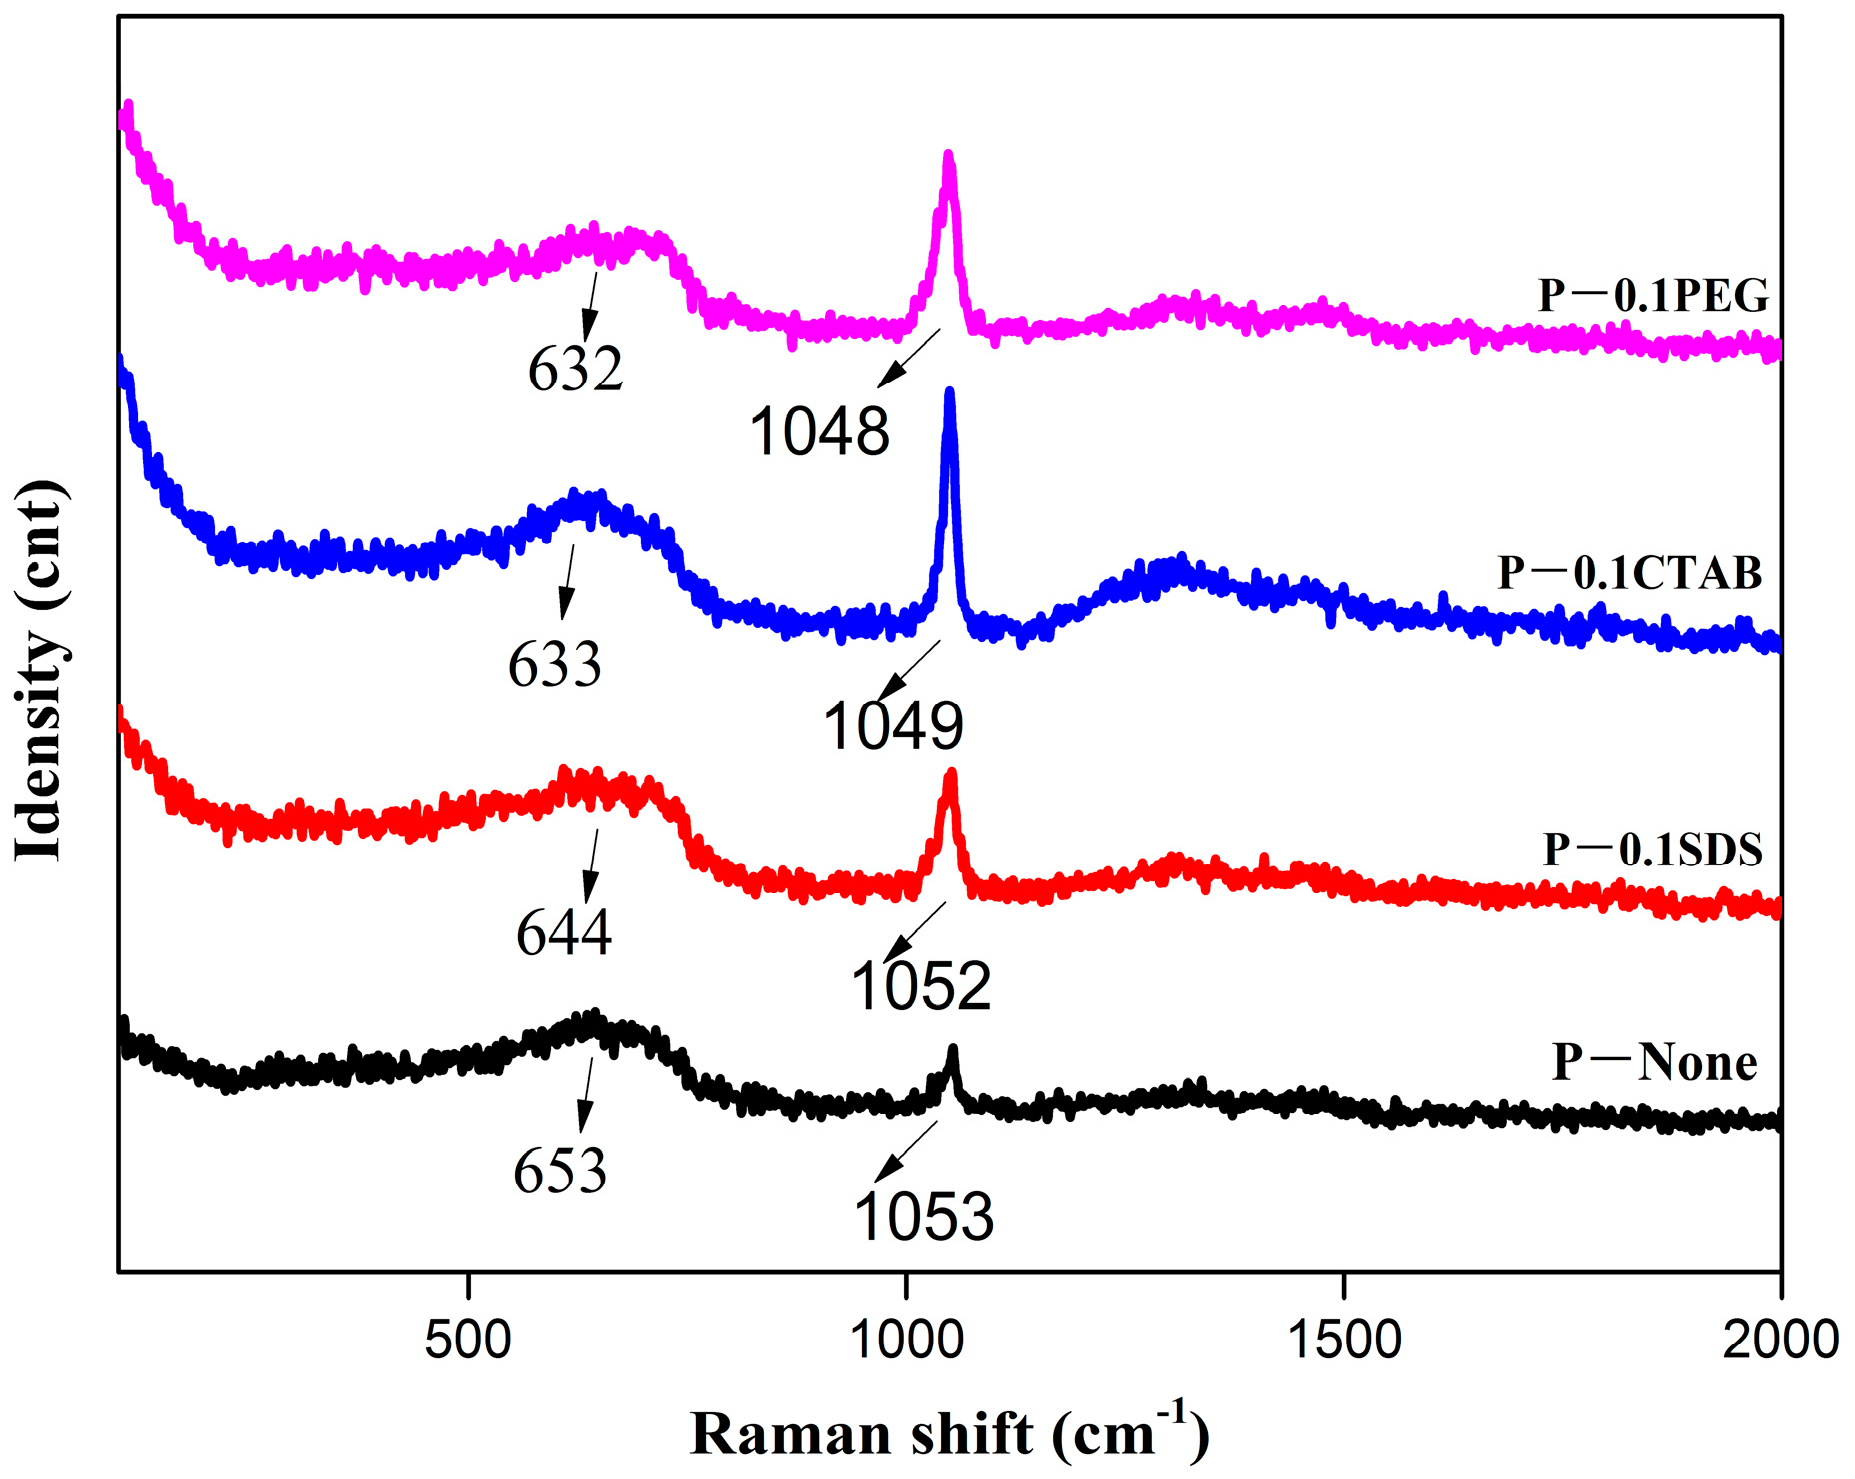
3.2.3. Raman Spectroscopy Analysis
Figure 5 shows the Raman spectra of the different samples. There were peaks at 653 cm−1, 644 cm−1, 633 cm−1, and 632 cm−1 for P-None, P-0.1SDS, P-0.1CTAB, and P-0.1PEG, respectively. According to the group theory, there will be five Raman active (A1g + Eg + 3T2g) modes for ferrites which belong to the cubic spine structure with the Fd-3m space group [29]. Thus, the A1g modes are presented in these samples, and the mode is due to symmetric stretch of the M-O bond in the MO4 groups (M = Fe, Mn, Zn) of the MnZn ferrites [30]. Nitrates were the main raw materials, and there will be a little bit of nitrate residue after the corresponding process, and the peaks at 1048–1053 cm−1 are effective proof [31]. Moreover, the shift in the Raman peak positions of the MnZn ferrite to a lower or higher wavenumber is related to changes in the chemical bonds and the crystal symmetry. In other words, a vibrational frequency (raman shift) is dependent on both the bond strength and the reduced mass of the vibrating species. The bond strength is influenced by the degree of covalence and the bond length. Since the two types of cations are randomly distributed in the spinel lying between the normal and inverse, only a change in the frequency is induced [30].
3.2.4. SEM Analysis
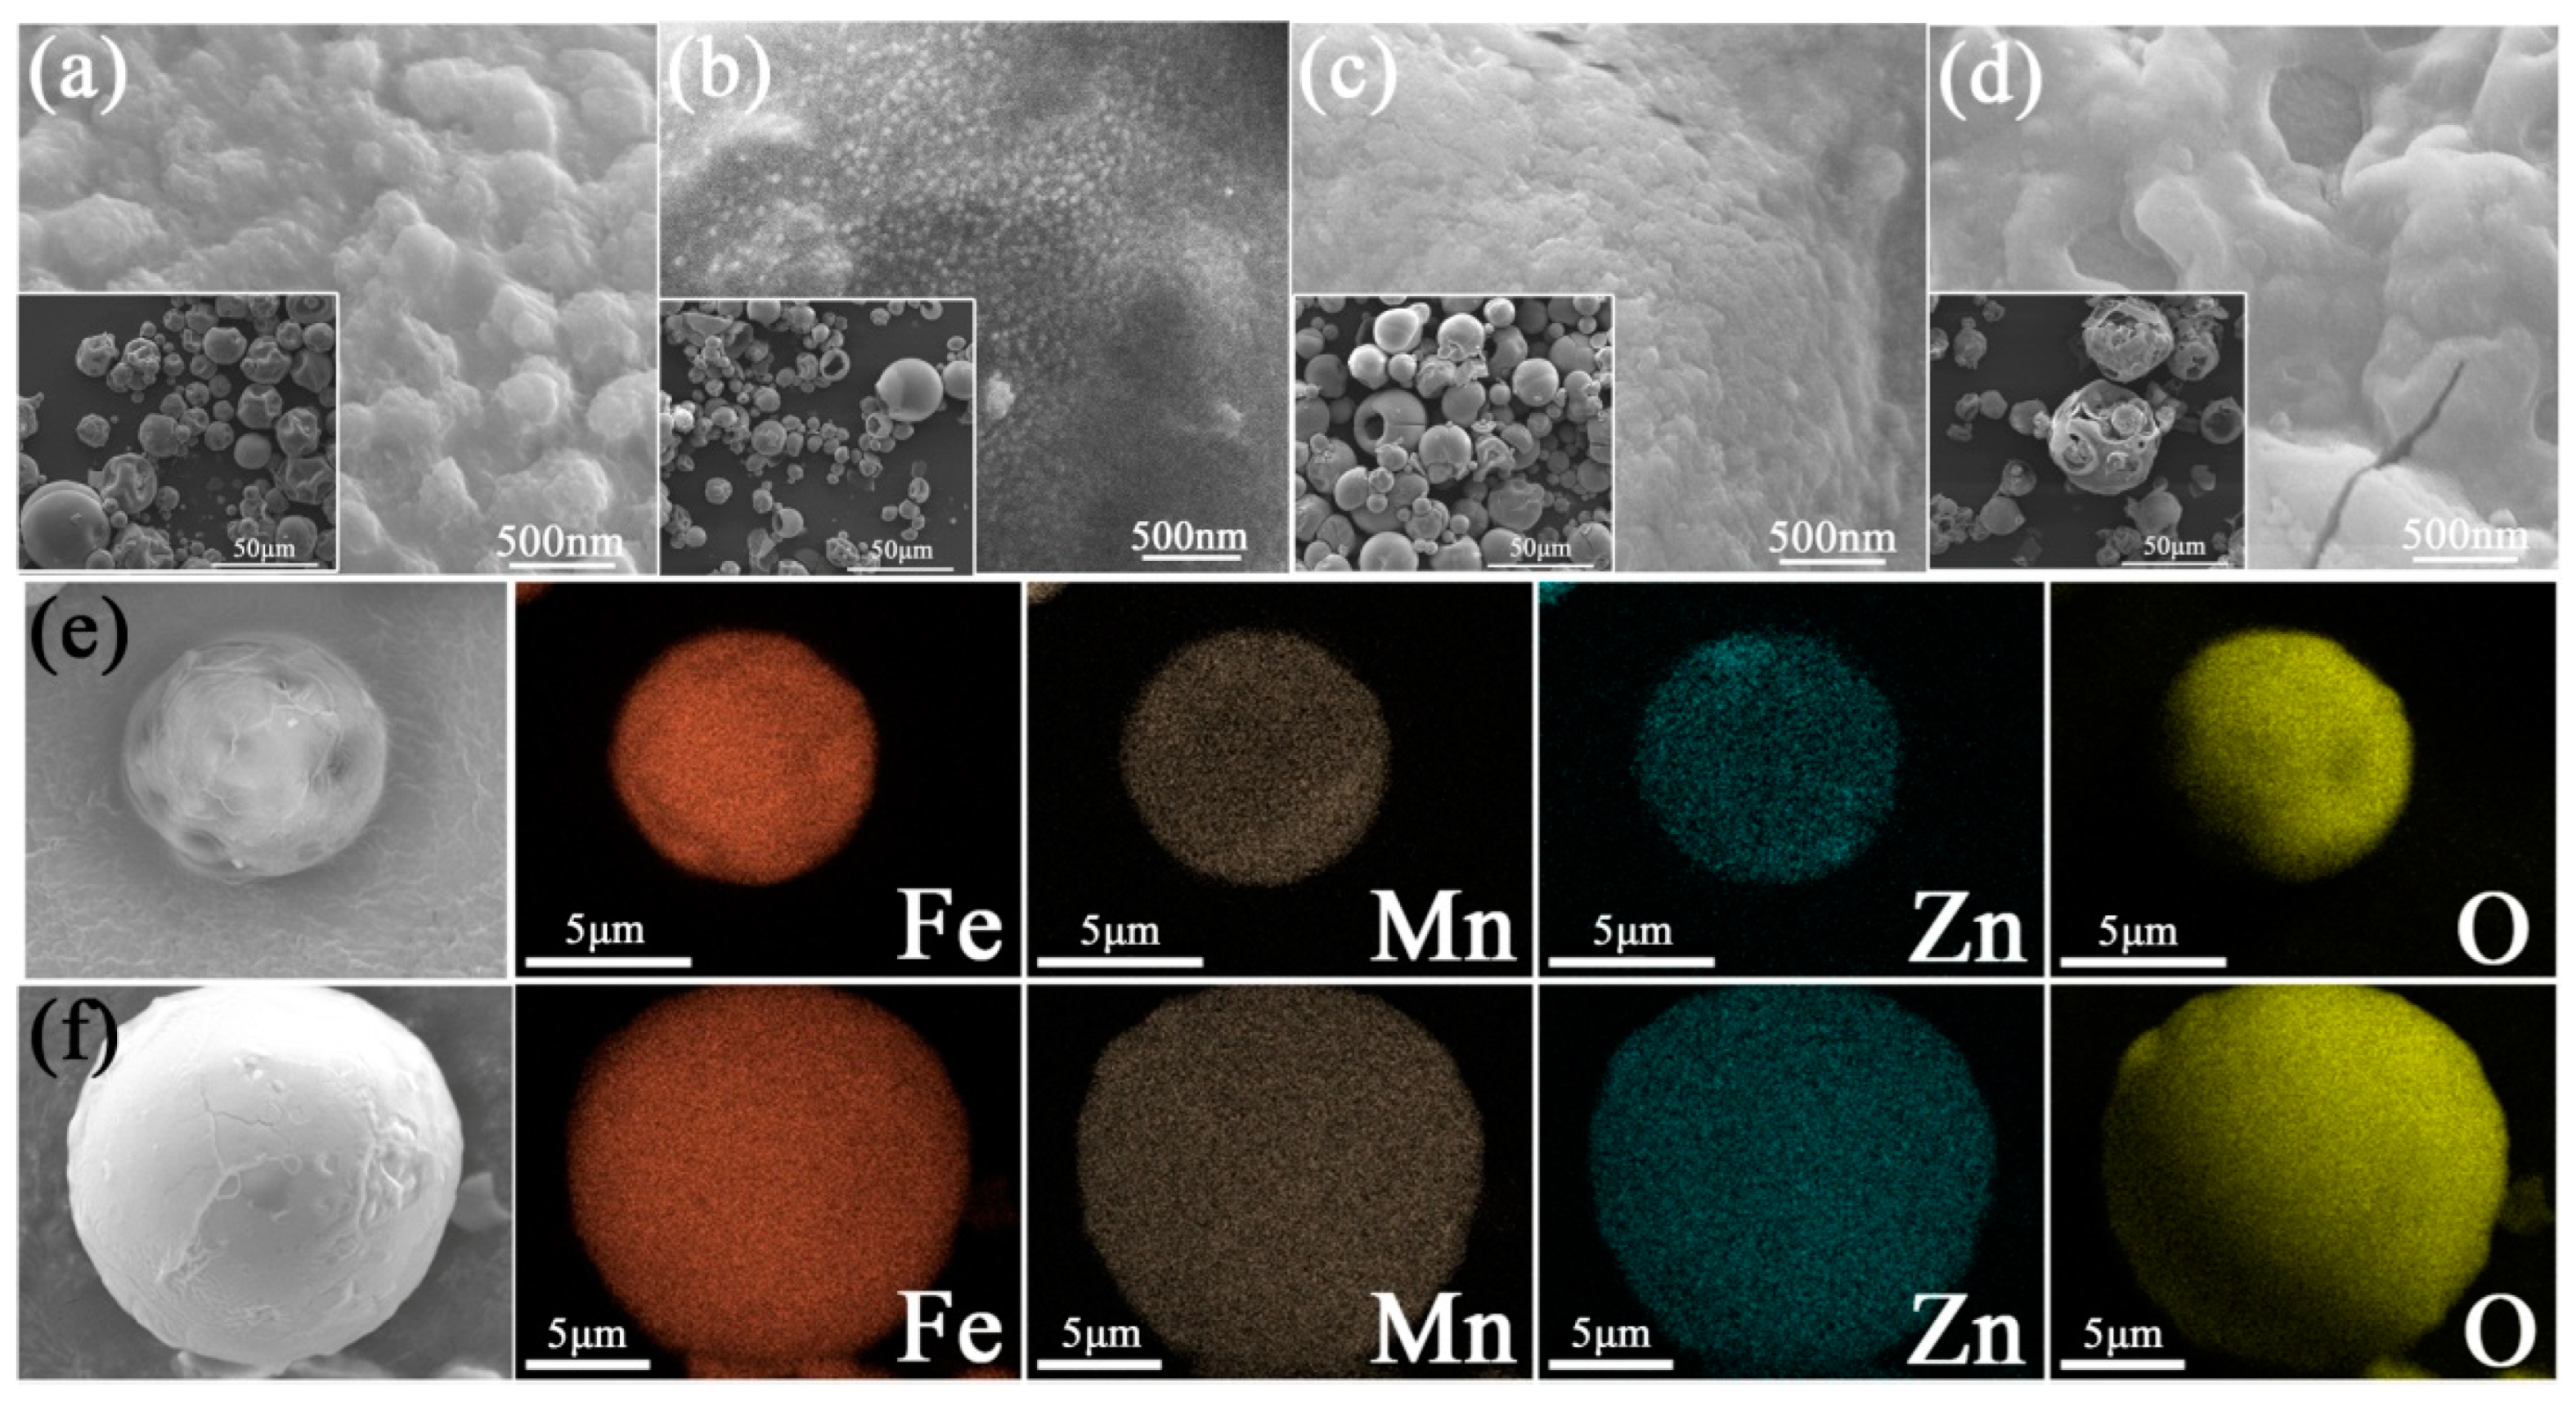
The morphologies of the precursor powders are shown in Figure 6. Some particles showed nearly hollow sphere shapes with seemingly smooth surfaces, while some particles displayed distorted hollow spheres shell features. These distorted hollow sphere shapes may be caused by the concentration gradient within the droplets during the fast preparation process. A similar kind of surface topography in ZnFe2O4 powders via a simple spray drying process was also reported [32]. However, the difference is that the precursor powders prepared in this work do not have cores. As shown in Figure 6, the sphere shell of P-0.1SDS possessed many holes, the P-0.1PEG displayed thick sphere shells, while P-0.1CTAB showed small-sized sphere powders. After careful observation, it was discovered that the surfaces of all spheres are composed of many nano-particles. In addition, these larger images can reveal the fact. The elemental mapping images of the P-None and P-0.1CTAB (Figure 6e,f) exhibits the uniform distribution of Fe, Mn, Zn, and O components all over the powders, and this is convenient to form small-sized MnZn ferrite particles with well-distributed element compositions.
3.2.5. TEM Analysis
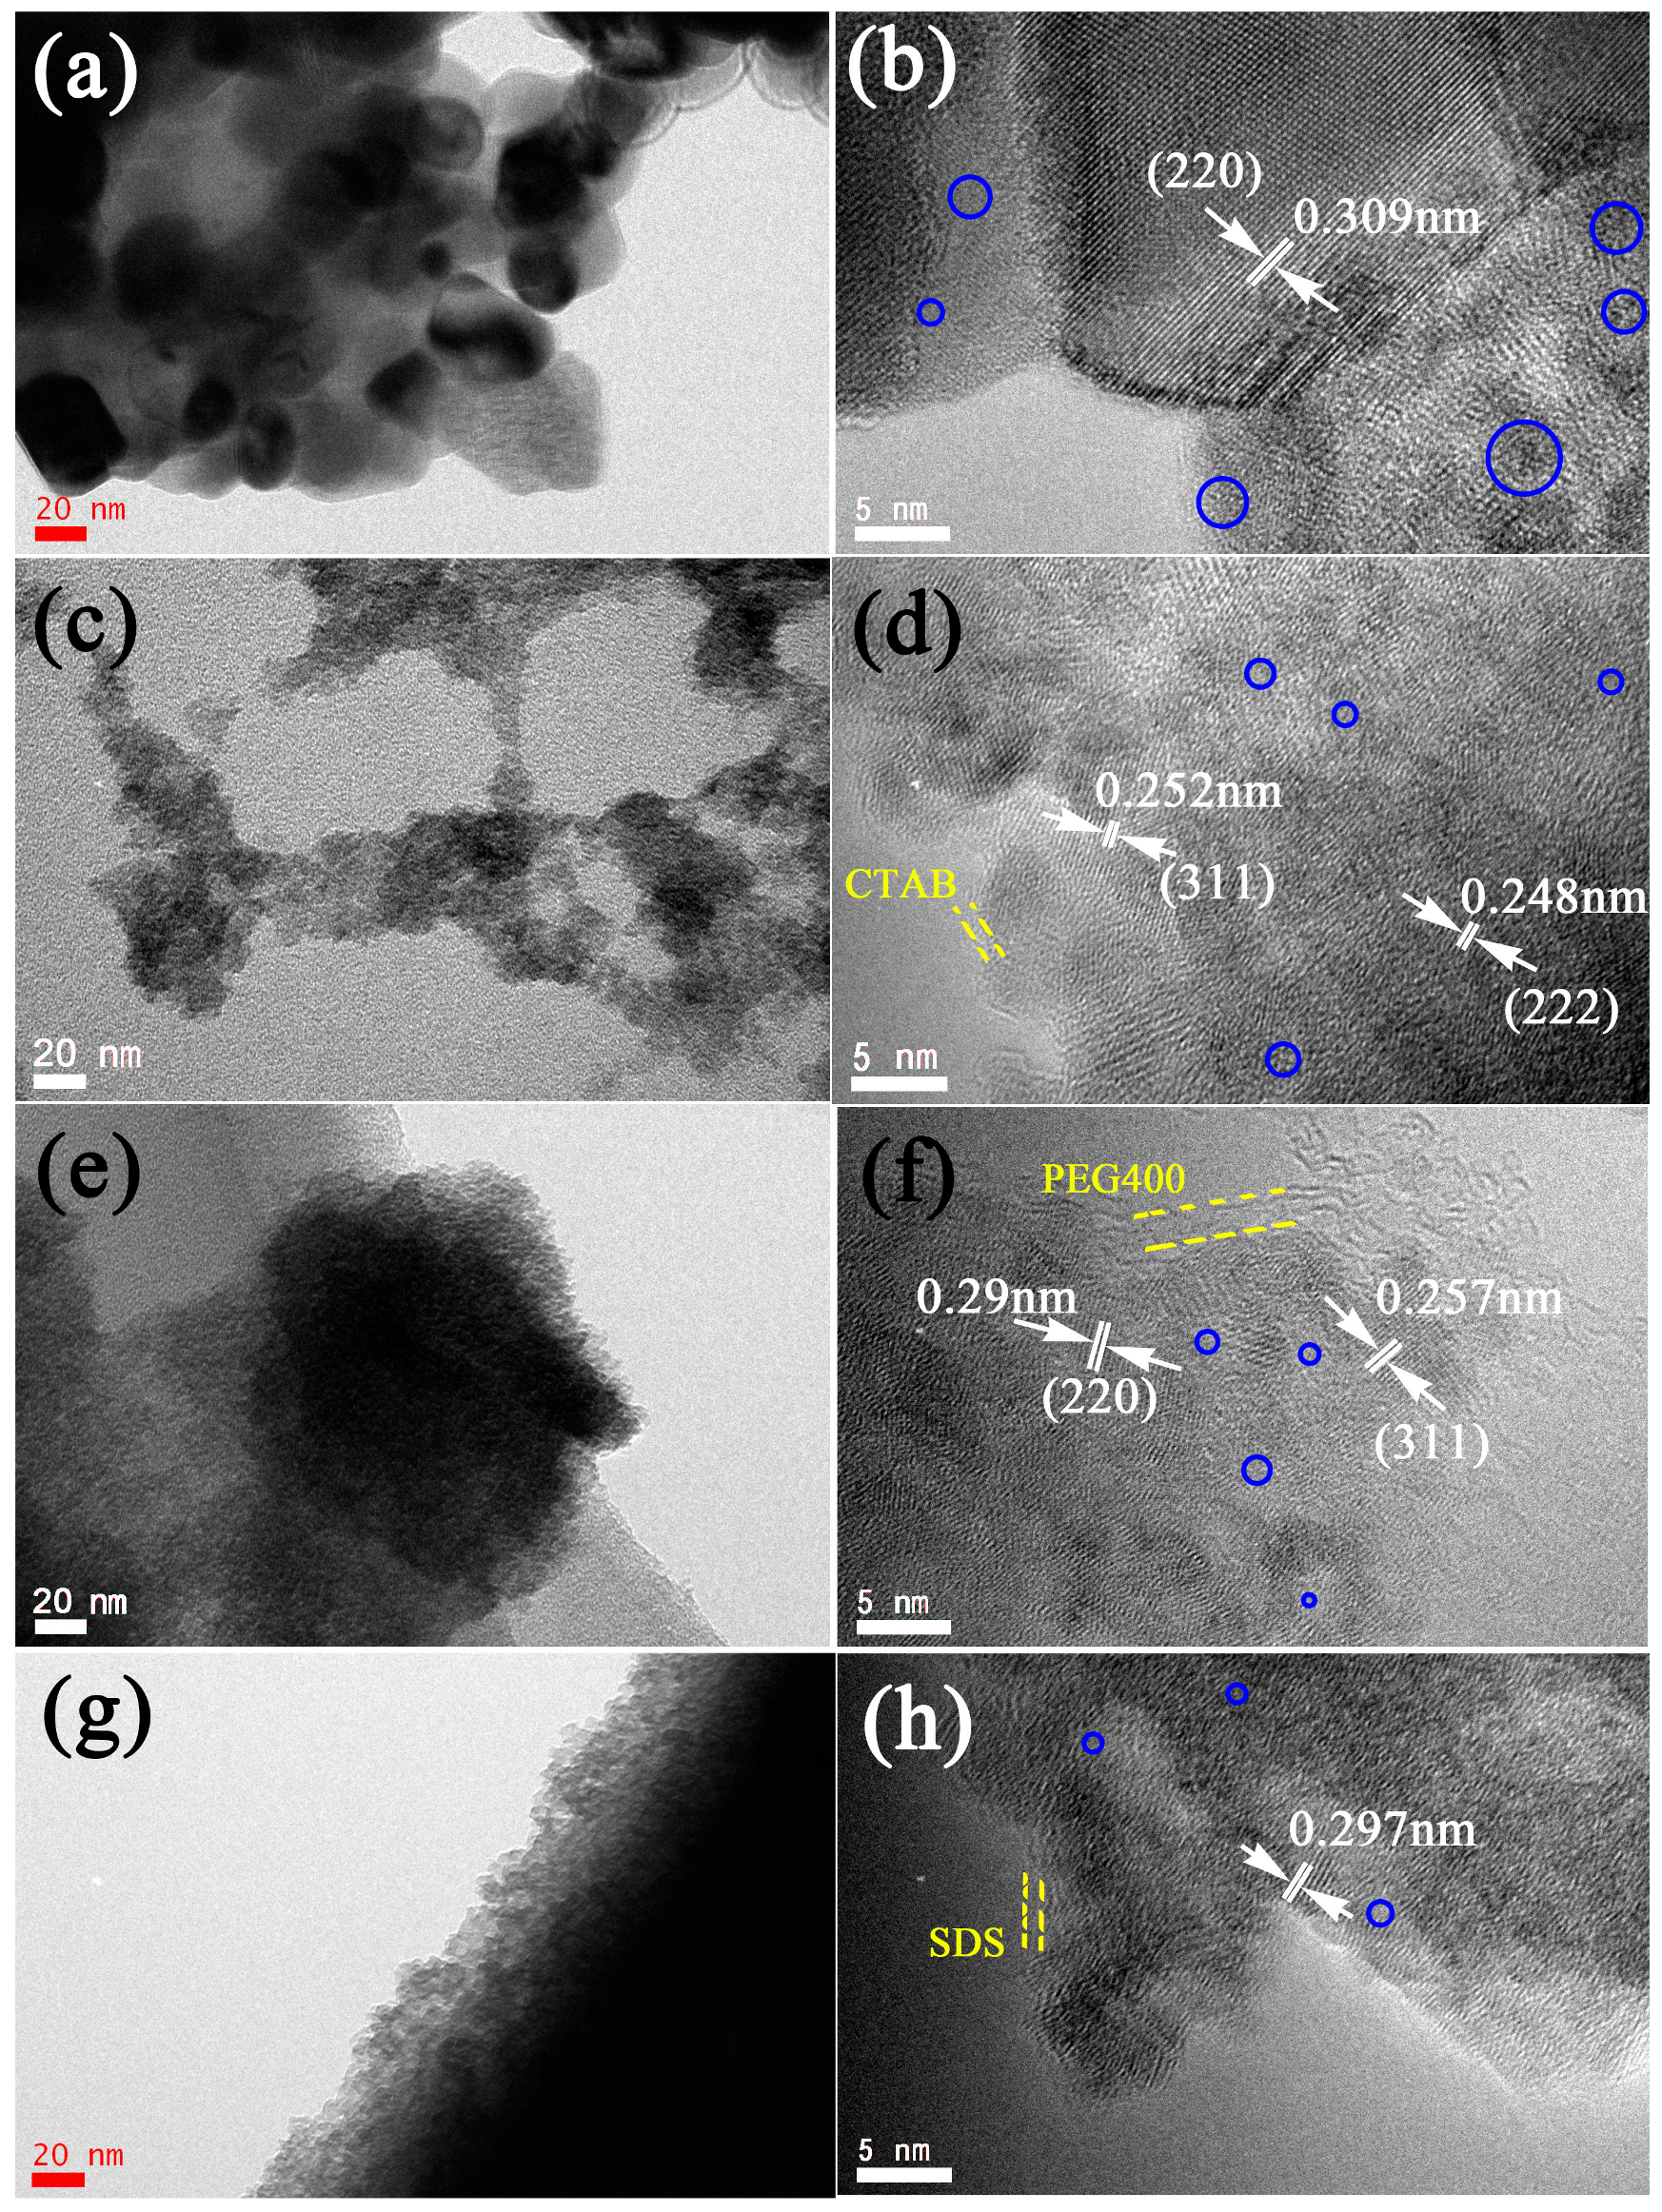
TEM technology was adopted to reveal the features of the precursor powders and the analysis results are shown in Figure 7. As shown in the pictures, the spherical shell fragments of all samples were composed of many nano-particles. The P-None showed a non-uniform particle size distribution due to the nucleation and growth of aggregation particles. Comparatively, P-0.1CTAB showed uniform particle distribution and exhibited the best characteristics among the samples. The lattice fringes correspond to a group of atomic planes within the nano-particles. The distance between the two adjacent planes was ~0.309 nm for P-None and it was indexed to the (220) plane of MnZn ferrites. Similarly, the interplanar spacing was ~0.252 nm, ~0.248 nm, ~0.29 nm, ~0.257 nm, and ~0.297 nm for P-0.1CTAB, P-0.1PEG, and P-0.1SDS, and they were indexed to the (311), (222), and (220) planes of the spinel ferrites, respectively. The yellow dotted line areas in Figure 7d,f,h present the residual surfactants and they may be due to the lower fabrication temperature. In addition, a similar result showed that some surfactants remained/coated on the manganese ferrite nanoparticles surface in the surfactant-assisted co-precipitation method, reported by Kornkanok Rotjanasuworapong [33]. These phenomena also coincide with the FTIR results in this work. Moreover, there were some amorphous regions which were marked as blue circles. Thus, these samples are all microcrystal or semi-crystalline, which is consistant with the XRD results.
3.2.6. Magnetic Properties Analysis
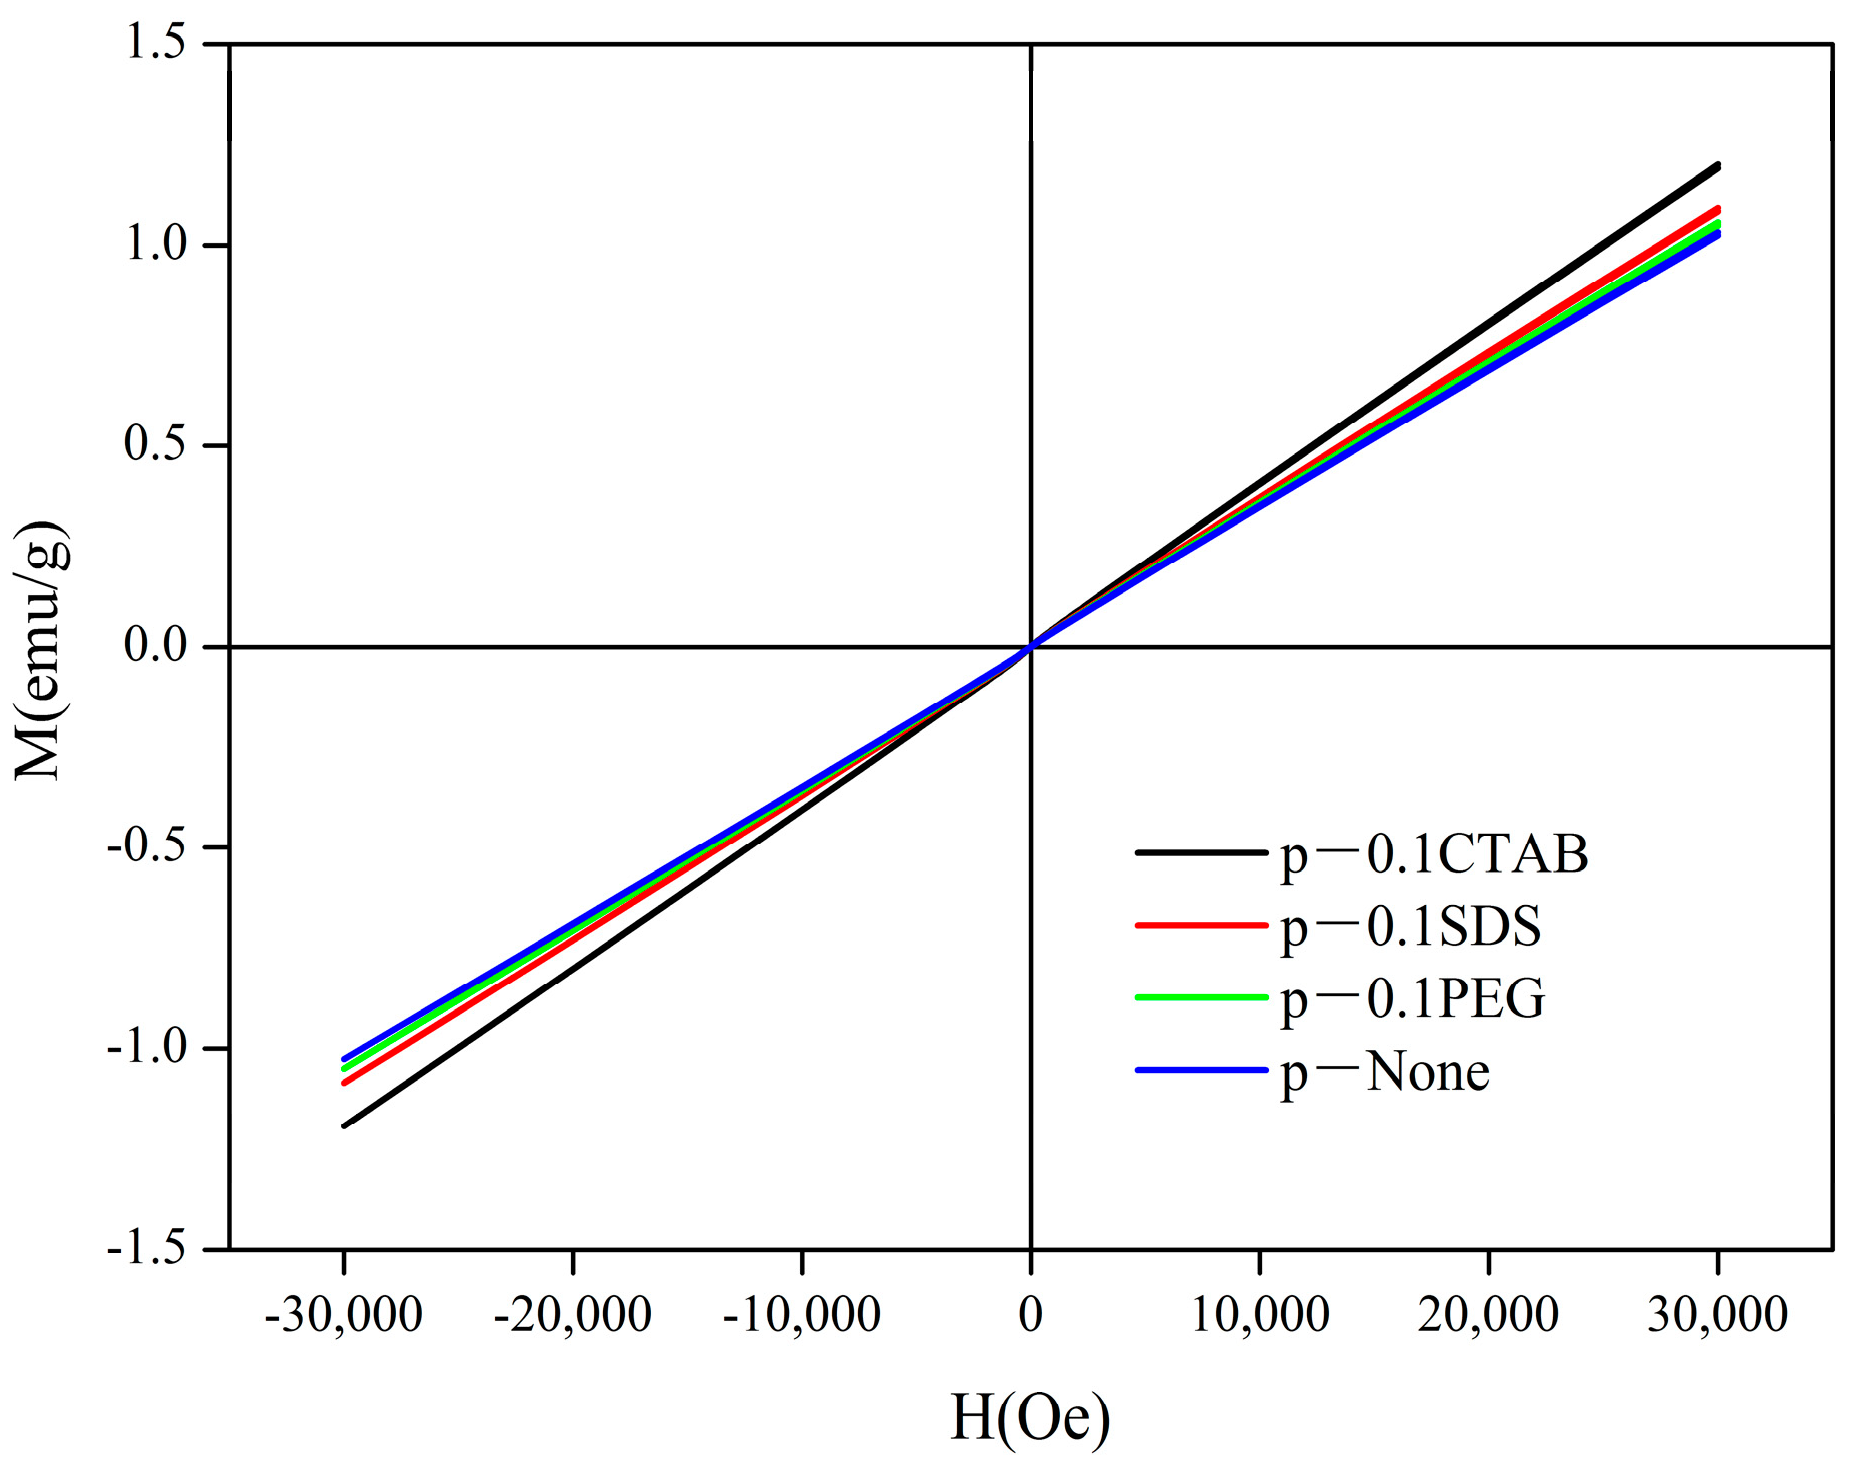
The hysteresis loops of the precursor powders are shown in Figure 8. The hysteresis loops did not show any magnetic saturation up to the maximum applied magnetic field of 30,000 Oe. The maximum magnetizations were 1.02–1.19 emu/g for the different samples. According to the above results, the precursor powders are microcrystal or semi-crystalline and composed of very few MnZn ferrites, and some are amorphous. Thus, the phenomenon that all samples had non prominent magnetic properties is reasonable. After carefully analysis, the magnetic properties were improved due to the addition of surfactants. The best result was generated by adding CTAB.
4. Conclusions
MnZn ferrite precursor powders were prepared by a novel nano in situ composite method. These powders had hollow spherical shapes and were composed of many nano-particles. The precursor powders are microcrystal or semi-crystalline and composed of MnZn ferrite, and some are amorphous. When the surfactants were added, the composition of the precursor powders was not affected, and the size and distribution of the nano-particles became better. The P-0.1CTAB precursor powders showed thinner spherical shells and a larger specific surface area than others, and the uniformly distributed nano-particles are also obvious. In addition, the magnetic properties’ improvement was attributed to the addition of surfactants. CTAB is the optimal surfactant to modify the features of MnZn ferrite precursor powder after comprehensive consideration. Moreover, the existing fine particle characteristics and high activity can be maintained after subsequent suitable processes. This will provide effective support for obtaining excellent MnZn ferrite materials in the long-term.
Author Contributions
Conceptualization, Z.X. and J.F.; formal analysis, Z.X. and W.Z.; funding acquisition, J.L. and J.F.; investigation, Z.X.; methodology, Z.X. and J.F.; project administration, J.F.; resources, J.F.; writing—original draft, Z.X.; writing—review and editing, Z.X., W.Z., J.L. and J.F. All authors have read and agreed to the published version of the manuscript.
Funding
This research was funded by the National Natural Science Foundation of China [grant number 51534009] and the China Postdoctoral Science Foundation [grant number 2022M713515].
Institutional Review Board Statement
Not applicable.
Informed Consent Statement
Not applicable.
Data Availability Statement
Derived data supporting the findings of this study are available from the corresponding author upon reasonable request.
Acknowledgments
This work was supported by the National Natural Science Foundation of China and the China Postdoctoral Science Foundation.
Conflicts of Interest
The authors declare that there are no conflict of interest regarding this paper.
References
- Tsakaloudi, V.; Zaspalis, V. Synthesis of a low loss Mn–Zn ferrite for power applications. J. Magn. Magn. Mater. 2016, 400, 307–310. [Google Scholar] [CrossRef]
- Wang, S.-F.; Chiang, Y.-J.; Hsu, Y.-F.; Chen, C.-H. Effects of additives on the loss characteristics of Mn–Zn ferrite. J. Magn. Magn. Mater. 2014, 365, 119–125. [Google Scholar] [CrossRef]
- Zapata, A.; Herrera, G. Effect of zinc concentration on the microstructure and relaxation frequency of Mn–Zn ferrites synthesized by solid state reaction. Ceram. Int. 2013, 39, 7853–7860. [Google Scholar] [CrossRef]
- Kadu, A.V.; Jagtap, S.V.; Chaudhari, G.N. Studies on the preparation and ethanol gas sensing properties of spinel Zn0.6Mn0.4Fe2O4 nanomaterials. Curr. Appl. Phys. 2009, 9, 1246–1251. [Google Scholar] [CrossRef]
- Lu, H.; Hong, R.; Li, H. Influence of surfactants on co-precipitation synthesis of strontium ferrite. J. Alloys Compd. 2011, 509, 10127–10131. [Google Scholar] [CrossRef]
- Du, Y.; Gao, H.; Liu, X.; Wang, J.; Xu, P.; Han, X. Solvent-free synthesis of hexagonal barium ferrite (BaFe12O19) particles. J. Mater. Sci. 2010, 45, 2442–2448. [Google Scholar] [CrossRef]
- Alamolhoda, S.; Mirkazemi, S.; Shahjooyi, T.; Benvidi, N. Effect of Cetyl trimethylammonium bromide (CTAB) amount on phase constituents and magnetic properties of nano-sized NiFe2O4 powders synthesized by sol–gel auto-combustion method. J. Alloys Compd. 2015, 638, 121–126. [Google Scholar] [CrossRef]
- Baykal, A.; Kasapoğlu, N.; Köseoğlu, Y.; Toprak, M.S.; Bayrakdar, H. CTAB-assisted hydrothermal synthesis of NiFe2O4 and its magnetic characterization. J. Alloys Compd. 2008, 464, 514–518. [Google Scholar] [CrossRef]
- Vadivel, M.; Babu, R.R.; Ramamurthi, K.; Arivanandhan, M. CTAB cationic surfactant assisted synthesis of CoFe2O4 magnetic nanoparticles. Ceram. Int. 2016, 42, 19320–19328. [Google Scholar] [CrossRef]
- Zhang, H.; Fei, H.; Zhang, X.; Suo, Q.; Peng, H.; Wang, X. Effect of PEG6000 on magnetic properties of the Mn-Zn ferrite nanoparticles. J. Magn. Magn. Mater. 2017, 439, 245–250. [Google Scholar] [CrossRef]
- Liu, F.; Yu, X.; Duan, J.; Hua, H.; Yu, C.; Gao, Y.; Yan, H.; Pan, J.; Yun, L. Synthesis carbon-encapsulated NiZn ferrite nanocomposites by in-situ starch coating route combined with hydrogen thermal reduction. Mater. Chem. Phys. 2015, 158, 121–126. [Google Scholar] [CrossRef]
- Rahimi, M.; Kameli, P.; Ranjbar, M.; Salamati, H. The effect of polyvinyl alcohol (PVA) coating on structural, magnetic properties and spin dynamics of Ni0.3Zn0.7Fe2O4 ferrite nanoparticles. J. Magn. Magn. Mater. 2013, 347, 139–145. [Google Scholar] [CrossRef]
- Xu, Z.; Fan, J.; Han, Y.; Liu, T.; Zhang, H.; Song, K.; Zhang, C. Preparation and characterization of Mn–Zn ferrites via nano-in-situ composite method. Solid State Sci. 2019, 98, 106006. [Google Scholar] [CrossRef]
- Xu, Z.; Fan, J.; Zhao, S.; Zhang, H.; Yin, F.; Han, Y.; Liu, T. Microstructure and magnetic properties of MnZn ferrite powders prepared by nano-in-situ composite method. J. Alloys Compd. 2020, 835, 155285. [Google Scholar] [CrossRef]
- Fan, J. Research progress of nano-in-situ composite high-performance fine-grained tungsten matrix composites. In Proceedings of the National Conference on Powder Metallurgy and Cross-Strait Seminar on Powder Metallurgy Technology, Wuhan, China, 9–12 September 2015; pp. 328–334. [Google Scholar]
- Han, Y.; Fan, J.; Liu, T.; Cheng, H.; Tian, J. The effects of ball-milling treatment on the densification behavior of ultra-fine tungsten powder. Int. J. Refract. Met. Hard Mater. 2011, 29, 743–750. [Google Scholar] [CrossRef]
- Lv, Y.; Fan, J.; Han, Y.; Liu, T.; Li, P.; Yan, H. The influence of modification route on the properties of W-0.3 wt% Y2O3 powder and alloy prepared by nano-in-situ composite method. J. Alloys Compd. 2019, 774, 1140–1150. [Google Scholar] [CrossRef]
- Xu, Z.; Fan, J.; Liu, T.; Han, Y.; Zhang, H. Calcination induced phase transformation in MnZn ferrite powders. J. Alloys Compd. 2020, 814, 152307. [Google Scholar] [CrossRef]
- Anu, K.; Hemalatha, J. Magnetic and electrical conductivity studies of zinc doped cobalt ferrite nanofluids. J. Mol. Liq. 2019, 284, 445–453. [Google Scholar] [CrossRef]
- Zhou, Q.; Li, X.; Li, Y.-G.; Tian, B.-Z.; Zhao, D.-Y.; Jiang, Z.-Y. Synthesis and electrochemical properties of semicrystalline gyroidal mesoporous MnO2. Chin. J. Chem. 2006, 24, 835–839. [Google Scholar] [CrossRef]
- Kotsikau, D.; Ivanovskaya, M.; Pankov, V.; Fedotova, Y. Structure and magnetic properties of manganese–zinc-ferrites prepared by spray pyrolysis method. Solid State Sci. 2015, 39, 69–73. [Google Scholar] [CrossRef]
- Mohamed, R.; Rashad, M.; Haraz, F.; Sigmund, W. Structure and magnetic properties of nanocrystalline cobalt ferrite powders synthesized using organic acid precursor method. J. Magn. Magn. Mater. 2010, 322, 2058–2064. [Google Scholar] [CrossRef]
- Ayyappan, S.; Panneerselvam, G.; Antony, M.; Philip, J. High temperature stability of surfactant capped CoFe2O4 nanoparticles. Mater. Chem. Phys. 2011, 130, 1300–1306. [Google Scholar] [CrossRef]
- Wu, N.; Fu, L.; Su, M.; Aslam, M.; Wong, K.C.; Dravid, V.P. Interaction of fatty acid monolayers with cobalt nanoparticles. Nano Lett. 2004, 4, 383–386. [Google Scholar] [CrossRef]
- Chandekar, K.V.; Kant, K.M. Relaxation phenomenon and relaxivity of cetrimonium bromide (CTAB) coated CoFe2O4 nanoplatelets. Phys. B Condens. Matter 2018, 545, 536–548. [Google Scholar] [CrossRef]
- He, S. Study effects of metal cations on oxygen acid structure with fourier tranform infrared—Raman spectroscopy. China Meas. Test 2014, 40, 40–42. [Google Scholar]
- Shanghai Institute of Organic Chemistry of CAS. Chemistry Database[DB/OL]. [1978–2019]. Available online: https://organchem.csdb.cn (accessed on 25 May 2023).
- Zhang, L.; He, R.; Gu, H.-C. Oleic acid coating on the monodisperse magnetite nanoparticles. Appl. Surf. Sci. 2006, 253, 2611–2617. [Google Scholar] [CrossRef]
- Mallesh, S.; Sunny, A.; Vasundhara, M.; Srinivas, V. Structure and magnetic properties of ZnO coated MnZn ferrite nanoparticles. J. Magn. Magn. Mater. 2016, 418, 112–117. [Google Scholar] [CrossRef]
- Thota, S.; Kashyap, S.C.; Sharma, S.K.; Reddy, V. Micro Raman, Mossbauer and magnetic studies of manganese substituted zinc ferrite nanoparticles: Role of Mn. J. Phys. Chem. Solids 2016, 91, 136–144. [Google Scholar] [CrossRef]
- Albayrak, C.; Soylu, A.M.; Dag, O.M. Lyotropic Liquid-Crystalline Mesophases of [Zn(H2O)6](NO3)2-C12EO10-CTAB-H2O and [Zn(H2O)6](NO3)2-C12EO10-SDS-H2O systems. Langmuir 2008, 24, 10592–10595. [Google Scholar] [CrossRef]
- Won, J.M.; Choi, S.H.; Hong, Y.J.; Ko, Y.N.; Kang, Y.C. Electrochemical properties of yolk-shell structured ZnFe2O4 powders prepared by a simple spray drying process as anode material for lithium-ion battery. Sci. Rep. 2014, 4, 5857. [Google Scholar] [CrossRef]
- Rotjanasuworapong, K.; Lerdwijitjarud, W.; Sirivat, A. Synthesis and Characterization of Fe0.8Mn0.2Fe2O4 Ferrite Nanoparticle with High Saturation Magnetization via the Surfactant Assisted Co-Precipitation. Nanomaterials 2021, 11, 876. [Google Scholar] [CrossRef] [PubMed]
Figure 1.
Schematic illustration for the synthesis of the precursor powders by the nano in situ composite method with various surfactants.
Figure 1.
Schematic illustration for the synthesis of the precursor powders by the nano in situ composite method with various surfactants.

Figure 2.
TEM micrographs of the precursor sol solutions: (a) P-None, (b) P-0.1CTAB, (c) P-0.1SDS and (d) P-0.1PEG.
Figure 2.
TEM micrographs of the precursor sol solutions: (a) P-None, (b) P-0.1CTAB, (c) P-0.1SDS and (d) P-0.1PEG.

Figure 3.
XRD patterns of the precursor powders.

Figure 4.
FTIR spectra of the precursor powders.

Figure 5.
Raman spectra of the precursor powders.

Figure 6.
SEM and elemental mapping images of the precursor powders: (a) P-None, (b) P-0.1CTAB, (c) P-0.1PEG, and (d) P-0.1SDS; (e) elemental mapping images of P-None; and (f) elemental mapping images of P-0.1CTAB.
Figure 6.
SEM and elemental mapping images of the precursor powders: (a) P-None, (b) P-0.1CTAB, (c) P-0.1PEG, and (d) P-0.1SDS; (e) elemental mapping images of P-None; and (f) elemental mapping images of P-0.1CTAB.

Figure 7.
TEM micrographs and HRTEM micrographs of precursor powders: (a,b) P-None, (c,d) P-0.1CTAB, (e,f) P-0.1PEG, and (g,h) P-0.1SDS.
Figure 7.
TEM micrographs and HRTEM micrographs of precursor powders: (a,b) P-None, (c,d) P-0.1CTAB, (e,f) P-0.1PEG, and (g,h) P-0.1SDS.

Figure 8.
Hysteresis loops of the precursor powders.


Table 1.
Zeta potentials of the precursor sol solution samples.
| Samples | P-None | P-0.1SDS | P-0.1CTAB | P-0.1PEG |
|---|---|---|---|---|
| Zeta potential (mV) | 5.24 | −9.57 | 10.7 | 5.89 |
Table 2.
Specific surface areas of the precursor powders.
| Samples | P-None | P-0.1SDS | P-0.1CTAB | P-0.1PEG |
|---|---|---|---|---|
| Specific surface area (m2/g) | 28.22 | 96.32 | 129.07 | 91.37 |
Disclaimer/Publisher’s Note: The statements, opinions and data contained in all publications are solely those of the individual author(s) and contributor(s) and not of MDPI and/or the editor(s). MDPI and/or the editor(s) disclaim responsibility for any injury to people or property resulting from any ideas, methods, instructions or products referred to in the content. |
© 2023 by the authors. Licensee MDPI, Basel, Switzerland. This article is an open access article distributed under the terms and conditions of the Creative Commons Attribution (CC BY) license (https://creativecommons.org/licenses/by/4.0/).
Share and Cite
MDPI and ACS Style
Xu, Z.; Zhao, W.; Liu, J.; Fan, J. Research on the Surfactant-Assisted Synthesis of MnZn Ferrite Precursor Powders. Magnetochemistry 2023, 9, 146. https://doi.org/10.3390/magnetochemistry9060146
AMA Style
Xu Z, Zhao W, Liu J, Fan J. Research on the Surfactant-Assisted Synthesis of MnZn Ferrite Precursor Powders. Magnetochemistry. 2023; 9(6):146. https://doi.org/10.3390/magnetochemistry9060146
Chicago/Turabian StyleXu, Zhanyuan, Wei Zhao, Jiefu Liu, and Jinglian Fan. 2023. "Research on the Surfactant-Assisted Synthesis of MnZn Ferrite Precursor Powders" Magnetochemistry 9, no. 6: 146. https://doi.org/10.3390/magnetochemistry9060146
Note that from the first issue of 2016, this journal uses article numbers instead of page numbers. See further details here.