Article

Slow Magnetic Relaxation and Luminescence Properties in Tetra β-Diketonate Lanthanide(III) Complexes

1
Departament de Química Inorgànica i Orgànica, Universitat de Barcelona, Martí i Franquès 1-11, E-08028 Barcelona, Spain
2
Departament de Mineralogia, Cristal·lografia i Dipòsits Minerals and Unitat de Difracció de R-X, Centre Científic i Tecnològic de la Universitat de Barcelona (CCiTUB), Universitat de Barcelona, Solé i Sabarís 1-3, E-08028 Barcelona, Spain
*
Author to whom correspondence should be addressed.
Magnetochemistry 2023, 9(5), 131; https://doi.org/10.3390/magnetochemistry9050131
Submission received: 19 April 2023 / Revised: 8 May 2023 / Accepted: 12 May 2023 / Published: 16 May 2023
(This article belongs to the Special Issue Magnetic Relaxation in Metal Complexes)

Abstract

:
The reaction of [Ln(btfa)3(H2O)2] (btfa = 4,4,4-trifluoro-1-phenyl-1,3-butanedionate) with additional 4,4,4-trifluoro-1-phenyl-1,3-butanedione (Hbtfa) and acridine (Acr) in ethanol allows the isolation of the mononuclear compounds HAcr[Nd(btfa)4]·EtOH, (1) and HAcr[Ln(btfa)4], Ln = Dy (2) and Yb (3); HAcr+ = acridinium cation. Magnetic measurements indicate that complexes 13 show field-induced single-ion magnet behavior with anisotropy energy barriers and preexponential factors of Ueff = 20.7 cm−1, τ0 = 24.5 × 10⁻⁸ s; Ueff = 40.5 cm−1, τ0 = 8.6 × 10⁻¹⁰ s and Ueff = 22.7 cm−1, τ0 = 8.4 × 10⁻⁸ s, for 13 respectively. The solid-state luminescence emission in the NIR region shows efficient energy transfer from the 4,4,4-trifluoro-1-phenyl-1,3-butanedionate ligands to the central Ln3+ ion in the case of compounds 1 and 3.

1. Introduction

Lanthanide(III) compounds show interesting magnetic and luminescent properties derived from their partially filled 4f valence shell. In the case of the magnetic properties, since the discovery of the first mononuclear lanthanide complexes of formula [Pc2Ln]·TBA+ (Ln = Tb, Dy; Pc2− = phthalocyanine dianion; TBA+ = tetrabutylammonium) showing slow relaxation of the magnetization and acting as single-molecule magnets (SMMs) [1], a plethora of mono- and polynuclear SMM complexes derived from lanthanide ions with large orbital momentum and strong magnetic anisotropy have been reported [2,3,4,5,6]. In the field of molecular magnetism, the SMM compound [Dy(Cpttt)2][B(C6F5)4] (Cpttt = 1,2,4-tri-tert-butylcyclopentadienyl), exhibits a magnetic blocking temperature, TB, of up to 60 K and an anisotropy barrier, Ueff, of 1837 cm−1 [7,8]. Another remarkable compound is the dysprosium metallocene cation [(CpiPr5)Dy(Cp*)]+ (CpiPr5 = penta-iso-propylcyclo-pentadienyl; Cp* = pentamethylcyclopentadienyl): TB = 80 K and Ueff = 1541 cm−1, pushing the blocking temperature higher than that of liquid nitrogen [9].
In addition to the above-mentioned magnetic properties, the lanthanide(III) ions also show intrinsic photoluminescent properties due to 4f-4f electronic transitions, which result in long-lived emissions and narrow bandwidths. The lanthanide(III) ions have an incompletely filled 4f subshell, which is shielded by the coordinated atoms due to the filled 5s2 and 5p6 orbitals, and hence, the emission transitions yield sharp lines characteristics of each element. However, the electronic 4f–4f transitions are Laporte forbidden due to the parity selection rule, leading to low molar extinction coefficients (ε < 10 M−1cm−1) for the direct photoexcitation of Ln(III) ions. To address this problem, it is necessary to use organic chromophores that absorb energy and subsequently transfer it to the Ln(III) ion. This sensitization mechanism is commonly known as the “antenna effect” [10,11,12].
Thus, because of the characteristic narrow emission bands and long emission lifetimes of lanthanide(III) coordination compounds over a wide wavelength range (vis/near-IR) [13,14,15,16,17,18,19,20,21,22,23,24], these compounds show useful potential applications in telecommunications and biological imaging [25,26,27,28,29,30], and special attention has been directed towards Ln(III) compounds of Nd3+, Er3+, and Yb3+ as they exhibit near-infrared (NIR) emission [11,12,13,14,15,16,19,20,21,22,23,24].
In this regard, β-diketonates are among the most important “antenna ligands” owing to the following merits: (1) They show intense absorption from their conjugated π–π* transitions within a large wavelength range, (2) they have suitable triplet state energy levels (T1) to sensitize the emission of Ln(III) ions, (3) they can form stable adducts with Ln(III) ions through O,O bidentate chelating modes [31,32,33,34,35,36].
The interest in multifunctional materials showing SMM and luminescence properties is increasing [13,14,37]. We have previously published a series of multifunctional Nd(III) coordination complexes [38] derived from the β-diketonate ligand 4,4,4-trifluoro-1-(2-naphthyl)butane-1,3-dionato (ntfa) of formula [Ln(ntfa)3(ANCL)], (ANCL = ancillary ligand). We present now a new series of multifunctional materials showing SMM and luminescence properties derived from the 4,4,4-trifluoro-1-phenyl-1,3-butanedionate anion (btfa) with formula HAcr[Ln(btfa)4], where HAcr+ = acridinium cation and Ln = Nd(III), Dy(III), and Yb(III) with the aim of studying the photophysical and magnetic behavior of the resulting compounds. By using as ligands four β-diketonate anions, the resulting [Ln(btfa)4] coordination compound has a high coordination number that excludes solvent molecules from the coordination sphere of the lanthanide(III) ions minimizing the deactivation by non-radiative processes. As far as we know, the acridinium cation has never been used as a countercation in the reported compounds of formula Cation[Ln(β-diketonate)4] [39,40,41,42,43,44,45,46].

2. Experimental

2.1. Materials and Physical Measurements

4,4,4-trifluoro-1-phenyl-1,3-butanedione and acridine were purchased from Sigma-Aldrich. Lanthanide chloride hexahydrates and lanthanide(III) nitrate hexahydrates were obtained from Strem Chemicals. Infrared spectra (4000–400 cm−1) were recorded from KBr pellets on a Perkin-Elmer 380-B spectrophotometer. The elemental analyses of the compounds were performed at the Serveis Científics i Tecnològics of the Universitat de Barcelona.
Powder X-ray diffraction, PXRD, measurements were used to check bulk phase purity. X-ray powder diffraction data were recorded at the Serveis Científics i Tecnològics of the Universitat de Barcelona with PANalytical X’Pert PRO MPD θ/θ powder diffractometer of 240 millimeters of radius in a configuration of a convergent beam with a focalizing mirror and a transmission geometry with flat samples sandwiched between low absorbing films Cu Kα radiation (λ = 1.5418 Å). Work power: 45 kV–40 mA. Incident beam slits defining a beam height of 0.4 mm. Incident and diffracted beam 0.02 radians Soller slits PIXcel detector: Active length = 3.347°. 2θ/θ scans from 2 to 70°2θ with a step size of 0.026°2θ and a measuring time of 298 s per step.

2.2. X-ray Crystal Structure Analysis

Crystallographic data for the structures were collected at 100(2) K on a Bruker D8 Venture diffractometer by use of Mo-Kα radiation. Crystallographic data of the three title complexes are summarized in Table 1. Following data reduction, Lp, and absorption corrections (programs APEX and SADABS) [47,48] and solution by direct methods, the structures were refined against F2 with full-matrix least-squares using the program SHELX-2014 [49]. Anisotropic displacement parameters were employed for the non-hydrogen atoms. Hydrogen atoms were added at calculated positions and refined by use of a riding model with isotropic displacement parameters based on those of the parent atom. Additional software: Mercury [50] and PLATON [51]. The full crystallographic data for the structures of complexes 13 have been deposited at the Cambridge Structural Database(CSD).

2.3. Magnetic Measurements

Magnetic measurements were performed on solid polycrystalline samples in a Quantum Design MPMS-XL SQUID magnetometer at the Magnetic Measurements Unit of the Universitat de Barcelona. Pascal’s constants were used to estimate the diamagnetic corrections, which were subtracted from the experimental susceptibilities to give the corrected molar magnetic susceptibilities.

2.4. Luminescence Measurements

Solid-state fluorescence spectra were recorded on a Horiva Jobin Yvon SPEX Nanolog fluorescence spectrophotometer equipped with a three-slit double-grating excitation and emission monochromator with dispersions of 2.1 nm/mm (1200 grooves/mm) at room temperature. The steady-state luminescence was excited by unpolarized light from a 450 W xenon CW lamp and detected at an angle of 90° for solid-state measurement by a red-sensitive Hamamatsu R928 photomultiplier tube. Spectra were reference corrected for both the excitation source light intensity variation (lamp and grating) and the emission spectral response (detector and grating). Near infra-red spectra were recorded at an angle of 90° using a liquid nitrogen-cooled, solid indium/gallium/arsenic detector (850–1600 nm).

2.5. Syntheses of the Complexes

2.5.1. [Ln(btfa)3(H2O)2]

To synthesize the precursor compounds of formula [Ln(btfa)3(H2O)2] we have used the next procedure:
Thirty milliliters of a methanolic solution of LnCl3·6H2O (1 mmol) were added to 40 mL of another methanolic solution of 4,4,4-trifluoro-1-phenyl-1,3-butanedione (Hbtfa) (648 mg, 3 mmol) and sodium hydroxide (NaOH) (120 mg, 3 mmol). After 1 h stirring, 130 mL of deionized water were added, and the mixture was stirred overnight and then filtered and dried under vacuum.

2.5.2. HAcr[Nd(btfa)4]·EtOH (1)

Ten milliliters of an ethanolic solution of [Nd(btfa)3(H2O)2] (206 mg, 0.25 mmol) were added to 10 mL of an ethanolic solution of Hbtfa (54 mg, 0.25 mmol) and acridine (Acr) (45 mg, 0.25 mmol). The mixture was stirred for 30 min, and then it was filtered, obtaining a yellow-green solution. The solution was left to stand undisturbed to form single crystals suitable for X-ray diffraction after 12 days. Yield: 76%. Anal.Calc. (%) for C55H40F12NdNO9 1 C, 53.70; H, 3.25; N, 1.14. Exp.: C, 52.8; H, 2.8; N, 1.2. Infra-Red spectra (cm−1): 1610 (s), 1580 (s), 1530 (m), 1490 (m), 1460 (m), 1320 (m), 1290 (s), 1240 (m), 1180 (s), 1130 (s), 1070 (m), 1020 (w), 941 (w), 752 (split, m), 701 (s), 630 (s), 599 (m), 579 (s).

2.5.3. HAcr[Dy(btfa)4] (2)

An ethanolic solution (10 mL) containing [Dy(btfa)3(H2O)2] (114 mg, 0.25 mmol) was added to another ethanolic solution (10 mL) of 4,4,4-trifluoro-1-phenyl-1,3-butanedione (Hbtfa) (54 mg, 0.25 mmol) and acridine (45 mg, 0.25 mmol). The mixture was stirred for 30 min, and then it was filtered. The mixture was left to stand undisturbed to form yellow single crystals suitable for X-ray analysis after two weeks. Yield: 45%. Anal.Calc. (%) for C53H34DyF12NO8 2 C, 52.90; H, 2.85; N, 1.16. Found: C, 51.3; H, 2.8; N, 1.3. Infra-Red spectra (cm−1): 1610 (s), 1570 (s), 1540 (m), 1490 (m), 1460 (m), 1320 (m), 1290 (s), 1240 (m), 1180 (s), 1130 (s), 1080 (m), 1020 (w), 943 (w), 750 (split, m), 701 (s), 631 (s), 580 (m), 519 (s).

2.5.4. HAcr[Yb(btfa)4] (3)

An ethanolic solution (10 mL) containing [Yb(btfa)3(H2O)2] (mg, 0.25 mmol) was added to another ethanolic solution (10 mL) of 4,4,4-trifluoro-1-phenyl-1,3-butanedione (Hbtfa) (54 mg, 0.25 mmol) and acridine (45 mg, 0.25 mmol). The mixture was stirred for 30 min and then it was filtered. The mixture was left to stand undisturbed to form single yellow crystals suitable for X-ray diffraction after two weeks. Yield: 36%. Anal.Calc. (%) for C53H34YbF12NO8 3 C, 52.44; H, 2.82; N, 1.15. Found: C, 52.6; H, 3.0; N, 1.2. Infra-Red spectra (cm−1): 1610 (s), 1580 (s), 1530 (m), 1490 (m), 1470 (m), 1320 (m), 1290 (s), 1240 (m), 1180 (s), 1130 (s), 1080 (m), 1020 (w), 941 (w), 750 (split, m), 699 (s), 632 (s), 580 (m), 572 (s).
The isolated complexes 13 were structurally characterized by single-crystal X-ray crystallography as well as by elemental microanalyses and by IR spectroscopy. Moreover, their purity was checked by Powder X-ray Diffraction (PXRD, Figure S1 in the Supplementary Section).
As expected, the IR spectra of complexes 13 display a general characteristic feature. The strong vibrational band observed over the frequency range 1605–1615 cm−1 is typically assigned to the coordinated carbonyl stretching frequency, ν(C=O).

3. Results and Discussion

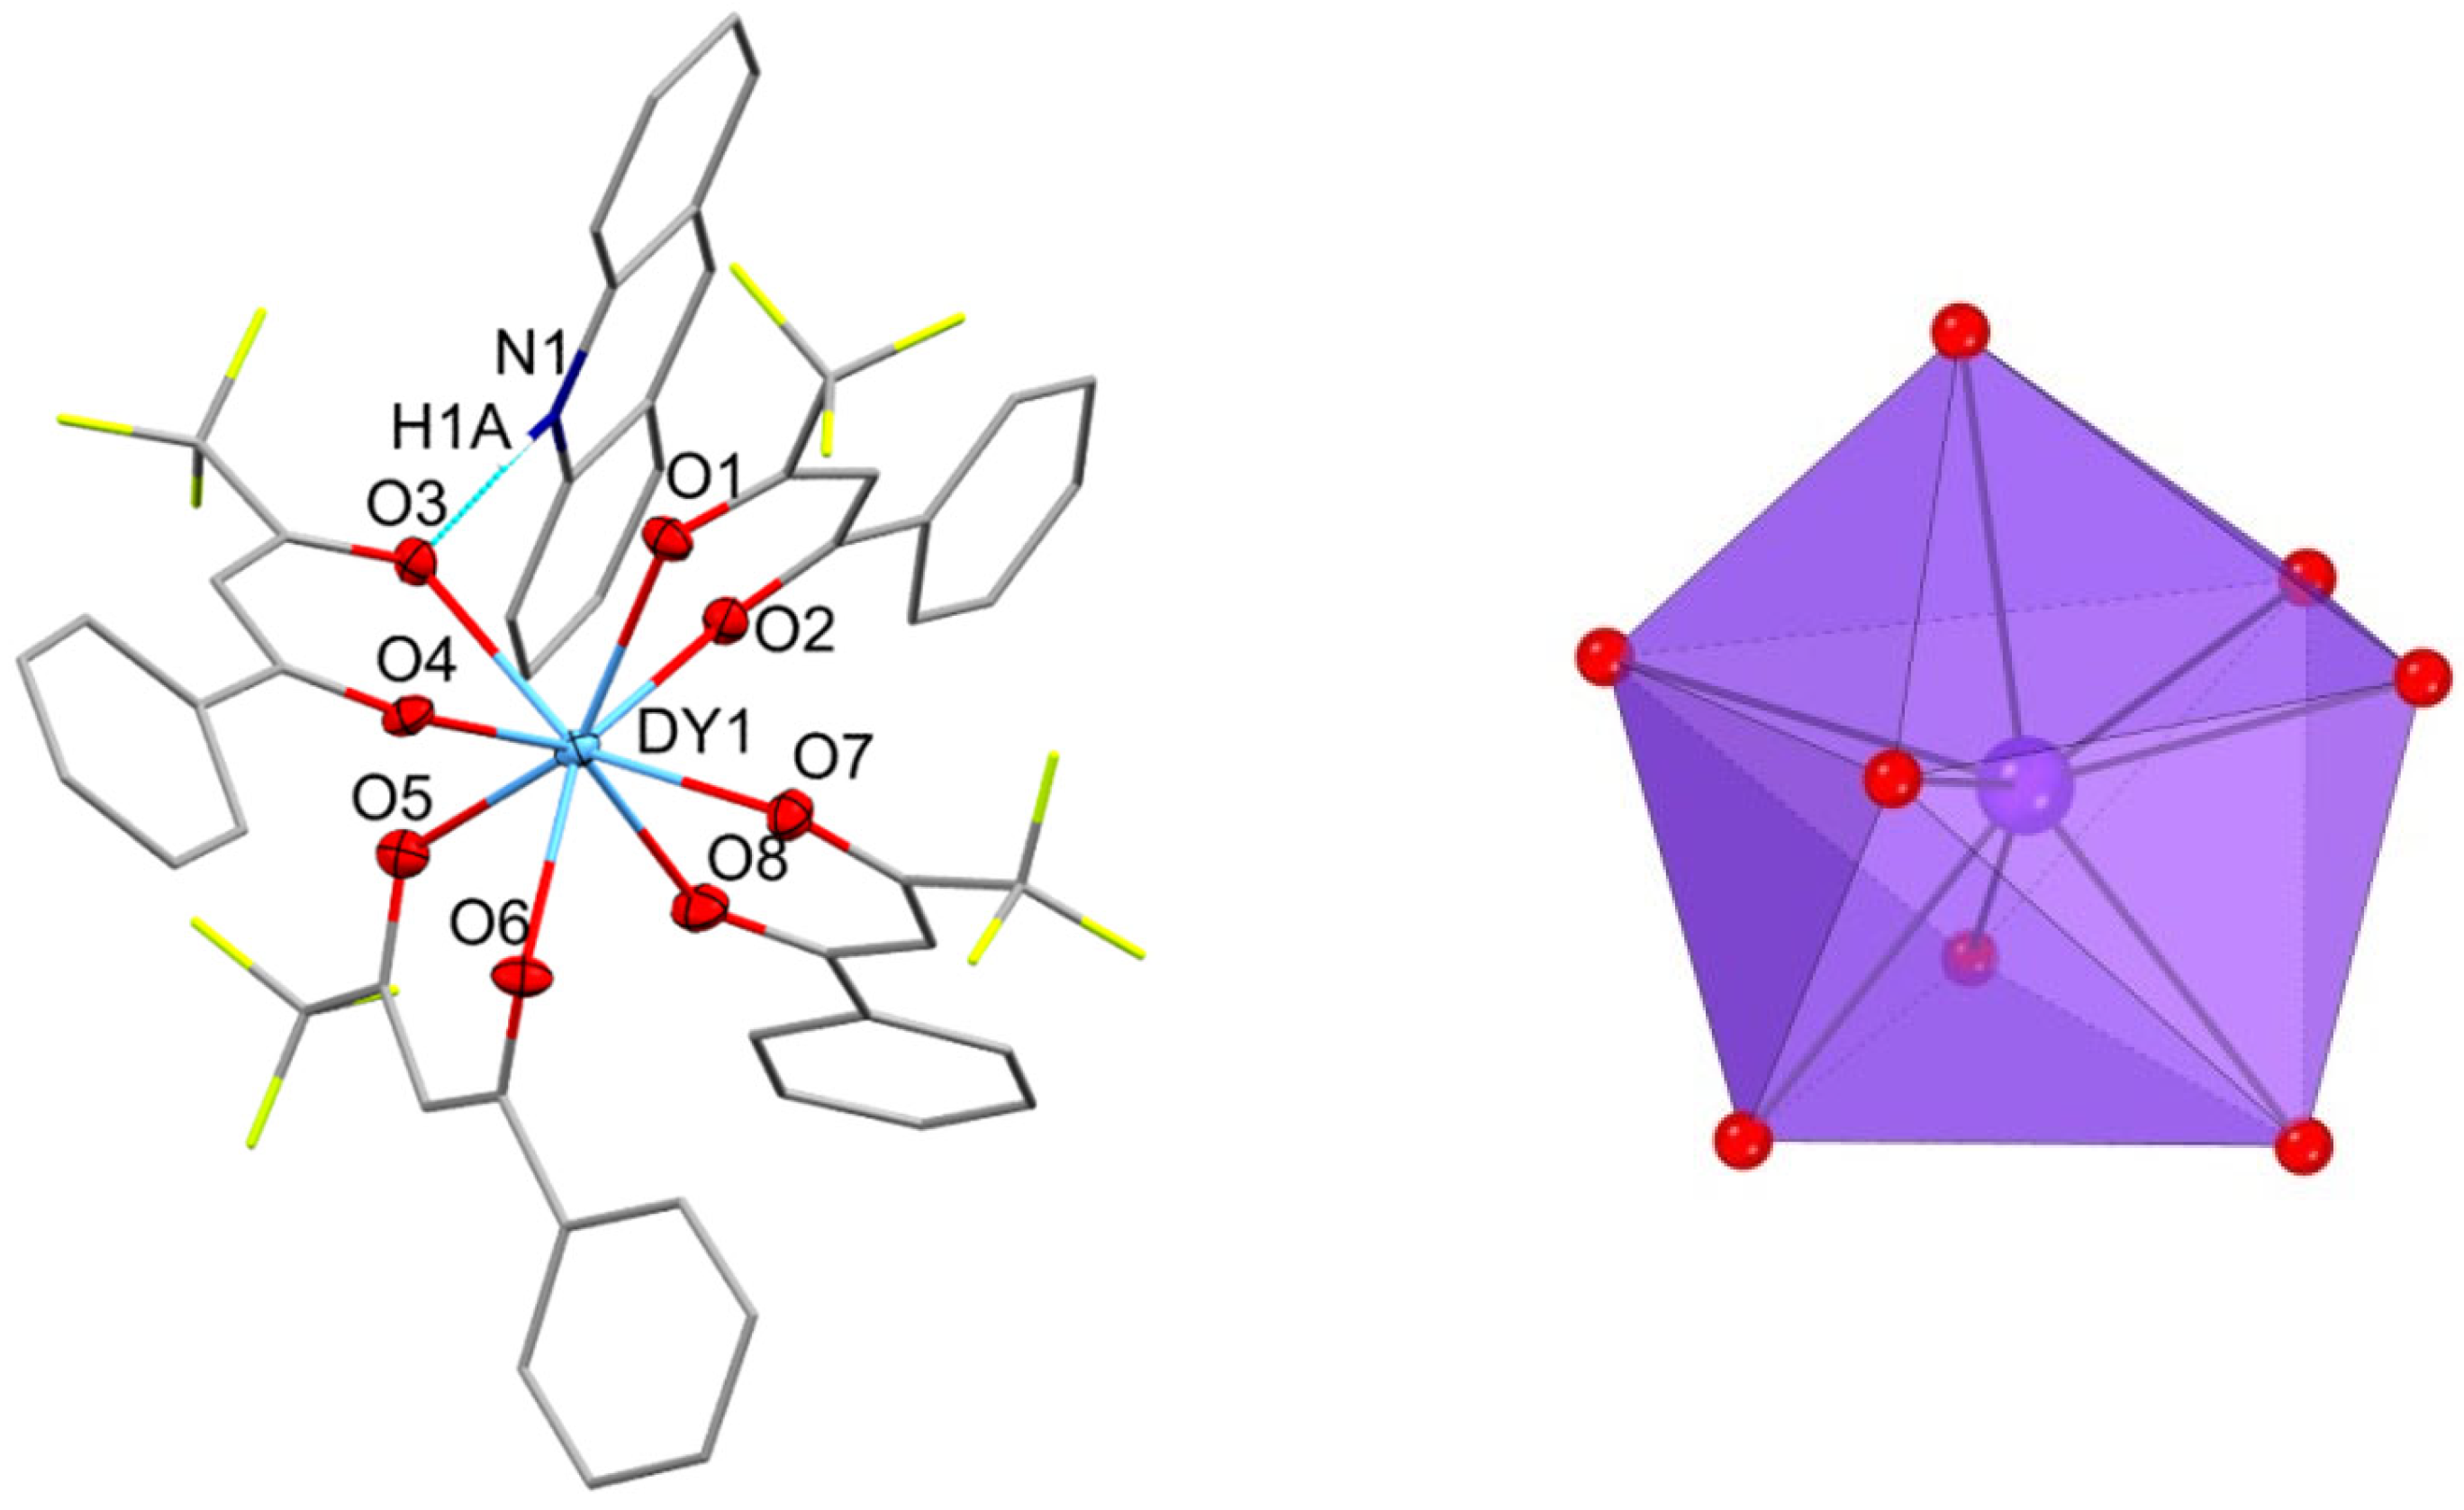
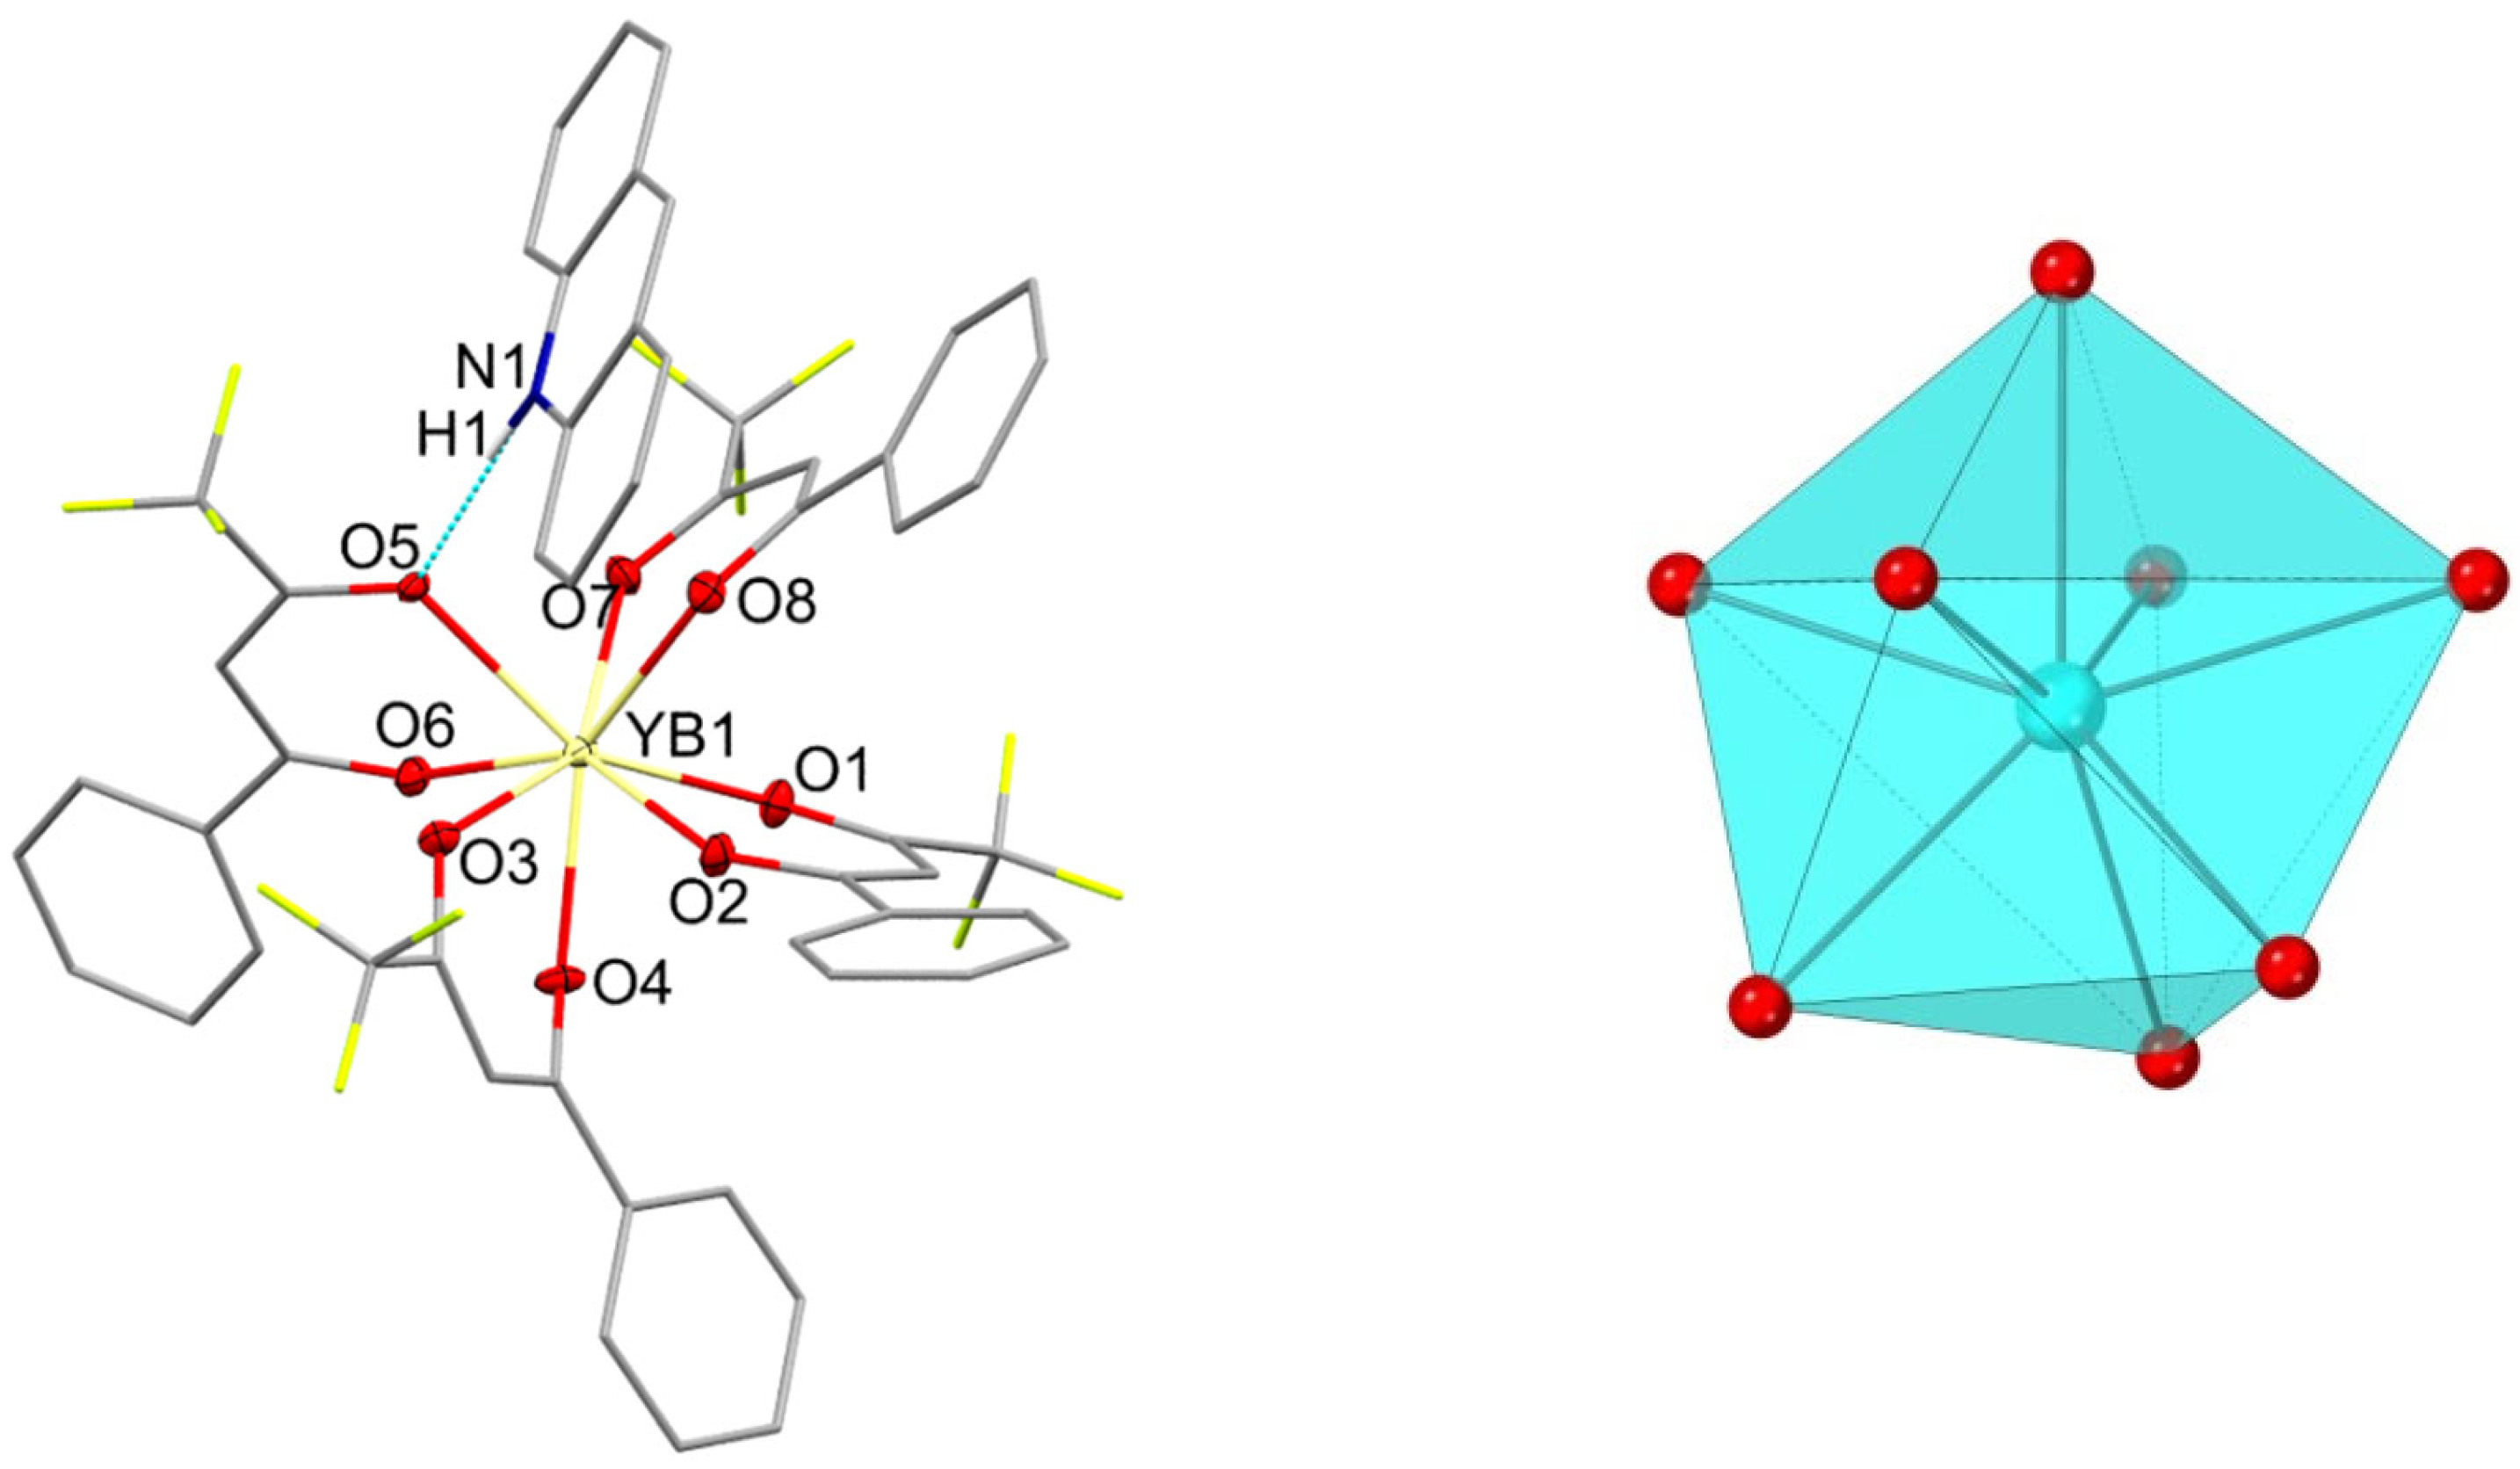
3.1. Description of the Crystal Structures

Complex HAcr[Nd(btfa)4]·EtOH, 1 crystallizes in the triclinic space group P-1 (n°2). A partially labeled plot of the structure of compound 1 is shown in Figure 1. Selected bond distances and angles are listed in Table 2. The structure consists of [Nd(btfa)4] anions, HAcr+ cations, and an ethanol molecule. In the anion of 1, the central Nd(III) ion is coordinated to four bidentate 4,4,4-trifluoro-1-phenyl-1,3-butanedionate (btfa) ligands. The Nd-O distances are in the range 2.434–2.460 Å. The acridinium cation and ethanol molecule are connected to the complex ion through a hydrogen bond each (N1—H22···O3 and O5—H5···O1, respectively). The structure of 1 presents symmetry disorder both in the ethanol molecule and in the acridinium cation.
Complex HAcr[Dy(btfa)4] 2 crystallizes in the triclinic space group P-1 (n°2). A partially labeled plot of the structure of compound 2 is shown in Figure 2. Selected bond distances and angles are listed in Table 2. The structure consists of [Dy(btfa)4] anions and HAcr+ cations. In the anion of 2, the central Dy(III) ion is coordinated to four bidentate 4,4,4-trifluoro-1-phenyl-1,3-butanedionate (btfa) ligands. The Dy-O distances are in the range 2.316–2.394 Å. The acridinium cation is connected to the complex ion through a hydrogen bond (N1—H1A…O3).
Complex HAcr[Yb(btfa)4] 3 crystallizes in the triclinic space group P-1 (n°2). A partially labelled plot of the structure of compound 3 is shown in Figure 3. Selected bond distances and angles are listed in Table 2. The structure consists of [Yb(btfa)4] anions and HAcr+ cations. In the anion of 3, the central Yb(III) ion is coordinated to four bidentate 4,4,4-trifluoro-1-phenyl-1,3-butanedionate (btfa) ligands. The Yb-O distances are in the range 2.278–2.366 Å. The acridinium cation is connected to the complex ion through a hydrogen bond (N1—H1···O5).
This family of [Ln(btfa)4] complexes provides an opportunity to study the influence of lanthanide contraction over the structural arrangement [52]. When the atomic number of the metal increases, the radius of the Ln(III) cations decreases, and the Ln-O bond lengths decrease due to the increase of the lanthanide contraction along the period (Table 2).
The SHAPE software [53,54] was used to determine the degree of distortion of the LnO8 coordination polyhedra in complexes 13. The lowest continuous shape measurements (CShM’s) value for 1 (0.026) corresponds to a cubic geometry, CU-8 (Oh). However, the lowest continuous shape measurements (CShM’s) values for 2 and 3 correspond to a triangular dodecahedron, TDD-8 (D2d), with values of 0.360 and 0.422 for 2 and 3, respectively. CShM’s values for 13 are listed in Table S1 (Supplementary Section). The metal coordination geometry for 13 is shown in Figure 1, Figure 2 and Figure 3 (right), respectively. The three complexes under investigation reveal the existence of two types of metal coordination geometries for LnO8: cube, CU-8 (Oh) for the Nd(III) compound 1 and triangular dodecahedron, TDD-8 (D2d) for the Dy(III) and Yb(III) compounds 2 and 3, respectively. The cube geometry for NdO8 compared with the triangular dodecahedron for DyO8 and YbO8 is probably due to the slightly larger radius of the Nd(III) ion. As structural precedents, in the previously published compound of formula (Hex4N)[Nd(DBM)4], Hex4N = tetrahexylammonium, HDBM = dibenzoylmethane, the metal coordination geometry for NdO8 is SAPR-8, (D4d), square antiprism with a CShM value of 0.488. The Dy(III) analogous (Hex4N)[Nd(DBM)4] also has a metal coordination geometry closest to a square antiprism with a CShM value of 0.287 [39]. In the Cation[Ln(β-diketonate)4] compounds, the metal coordination geometries for LnO8 are difficult to be predicted: By changing the β-diketonate ligand and the cation, we have clear structural changes in the central atom coordination geometry.

3.2. Magnetic Properties

3.2.1. DC Magnetic Susceptibility Studies

Direct current (dc) magnetic susceptibility (χM) data on polycrystalline powder samples of complexes 13 were collected under applied fields of 0.3 T over the temperature range 300–2 K.
The data for compounds 13 are plotted as χMT vs. T in Figure 4 (left). The room temperature χMT values are 1.57, 14.23, and 6.62 cm3·K·mol−1, which are in agreement with the calculated values (χMT = NμB2gJ2 J(J + 1)/3kB where N: Avogadro constant; kB: Bohr magneton; kB: Boltzmann constant) of 1.64, 14.17, and 7.15 cm3·K·mol−1 for one isolated Ln(III) ion [55].
Upon cooling, the χMT values of 1 and 3 gradually decrease, which should be mainly attributed to the thermal depopulation of the crystal field sublevels. At 2.0 K, the corresponding χMT values are 0.63 and 4.89 cm3·K·mol−1.
On the other hand, for 2 the χMT values upon cooling remain almost constant down to ca. 8 K and then decrease rapidly down to 8.79 cm3·K·mol−1 at 2.0 K.
Isothermal field-dependent magnetization measurements were performed on all complexes, 13, at 2 K and are depicted in Figure 4 (right). The magnetization of compounds 13 rises fast under low fields and then slowly under high fields before reaching values of 5.46, 6.29, and 1.61μB, respectively. None of the presented compounds reach saturation of the magnetization values at the highest applied magnetic fields. The saturations of magnetization values for mononuclear Nd3+, Dy3+, and Yb3+ compounds would be (gJ × J): 3.27, 10, and 30.45 μB, respectively.

3.2.2. Ac Magnetic Susceptibility Studies

To study if the complexes under investigation may show SMM behavior, dynamic magnetic studies were performed on compounds 13. The measurements reveal that at zero static external magnetic field none of the complexes show out-of-phase (χM″) signals of the ac susceptibility at frequencies up to 1488 Hz. This fact may indicate a low magnetic anisotropy or that at zero dc field, the Quantum tunneling of magnetization, QTM, process dominates the magnetization relaxation time (τ), but this process can be suppressed or partially suppressed at low temperatures when a static magnetic field is applied [56].
For 13 frequency dependence of χM″ reveals temperature-dependent peaks when a dc field of 0.10 T is applied under a 4 × 10⁻⁴ T ac field oscillating at frequencies between 1 and 1488 Hz in the temperature range of 1.84–5.00 K for 1 (Figure 5a), 1.80–5.60 K for 2 (Figure 5d), and 1.88–5.00 K for 3 (Figure 5g).
AC susceptibility frequency dependences of both χM′ and χM″ were analyzed for 13 using the generalized Debye model, Equation (S1) [57]. The representation of the corresponding Cole–Cole plots (Figure 5b,e,h) estimated α values close to zero (see Tables S2–S4 for compounds 13, respectively), revealing a single relaxation process for these compounds [58]. Only the χM″ vs. frequency curves showing maximum values were analyzed using the Generalized Debye model.
The temperature dependence of the relaxation times (τ) (Figure 5c,f,i) shows that at temperatures above 2.2, 3.1, and 2.3 K for 13, respectively, the rate of τ follows the Arrhenius law [τ−1 = τ0−1exp(−Ueff/kBT)], leading to effective energy barriers (Ueff) and pre-exponential factors (τ0) of 20.7 cm−1 and 4.5·10−8 s−1 (1), 40.5 cm−1 and 8.6·10−10 s−1 (2), and 22.7 cm−1 and 8.4·10−8 s−1 (3).
Nevertheless, the thermal dependences of τ at low temperatures deviate from the linearity of the thermal Orbach process in the three compounds. Therefore, these data were first fitted accounting for Orbach, direct, and Raman relaxation processes by using the expression:
τ−1 = τ0−1 exp(−Ueff/kBT) + AT+ CTn
However, we found that the relaxation rate at low temperatures of compounds 1 and 3 could be very well simulated by using the equation for a Raman-only relaxation process τ−1 = CTn and compound 2 without the direct process using the equation τ−1 = τ0 exp(−Ueff/kBT) + CTn. The best fit parameters resulted in C = 2.6(3) s−1·Kn and n = 8.3(1) for 1, C = 1.23(8) s−1·Kn and n = 7.73(5) for 3, and τ0 = 3.4·10−11 s−1, Ueff = 53.0(5) cm−1, C = 0.38(9) s−1·K−n, and n = 7.1(2) for 2.

3.3. Luminescence Properties

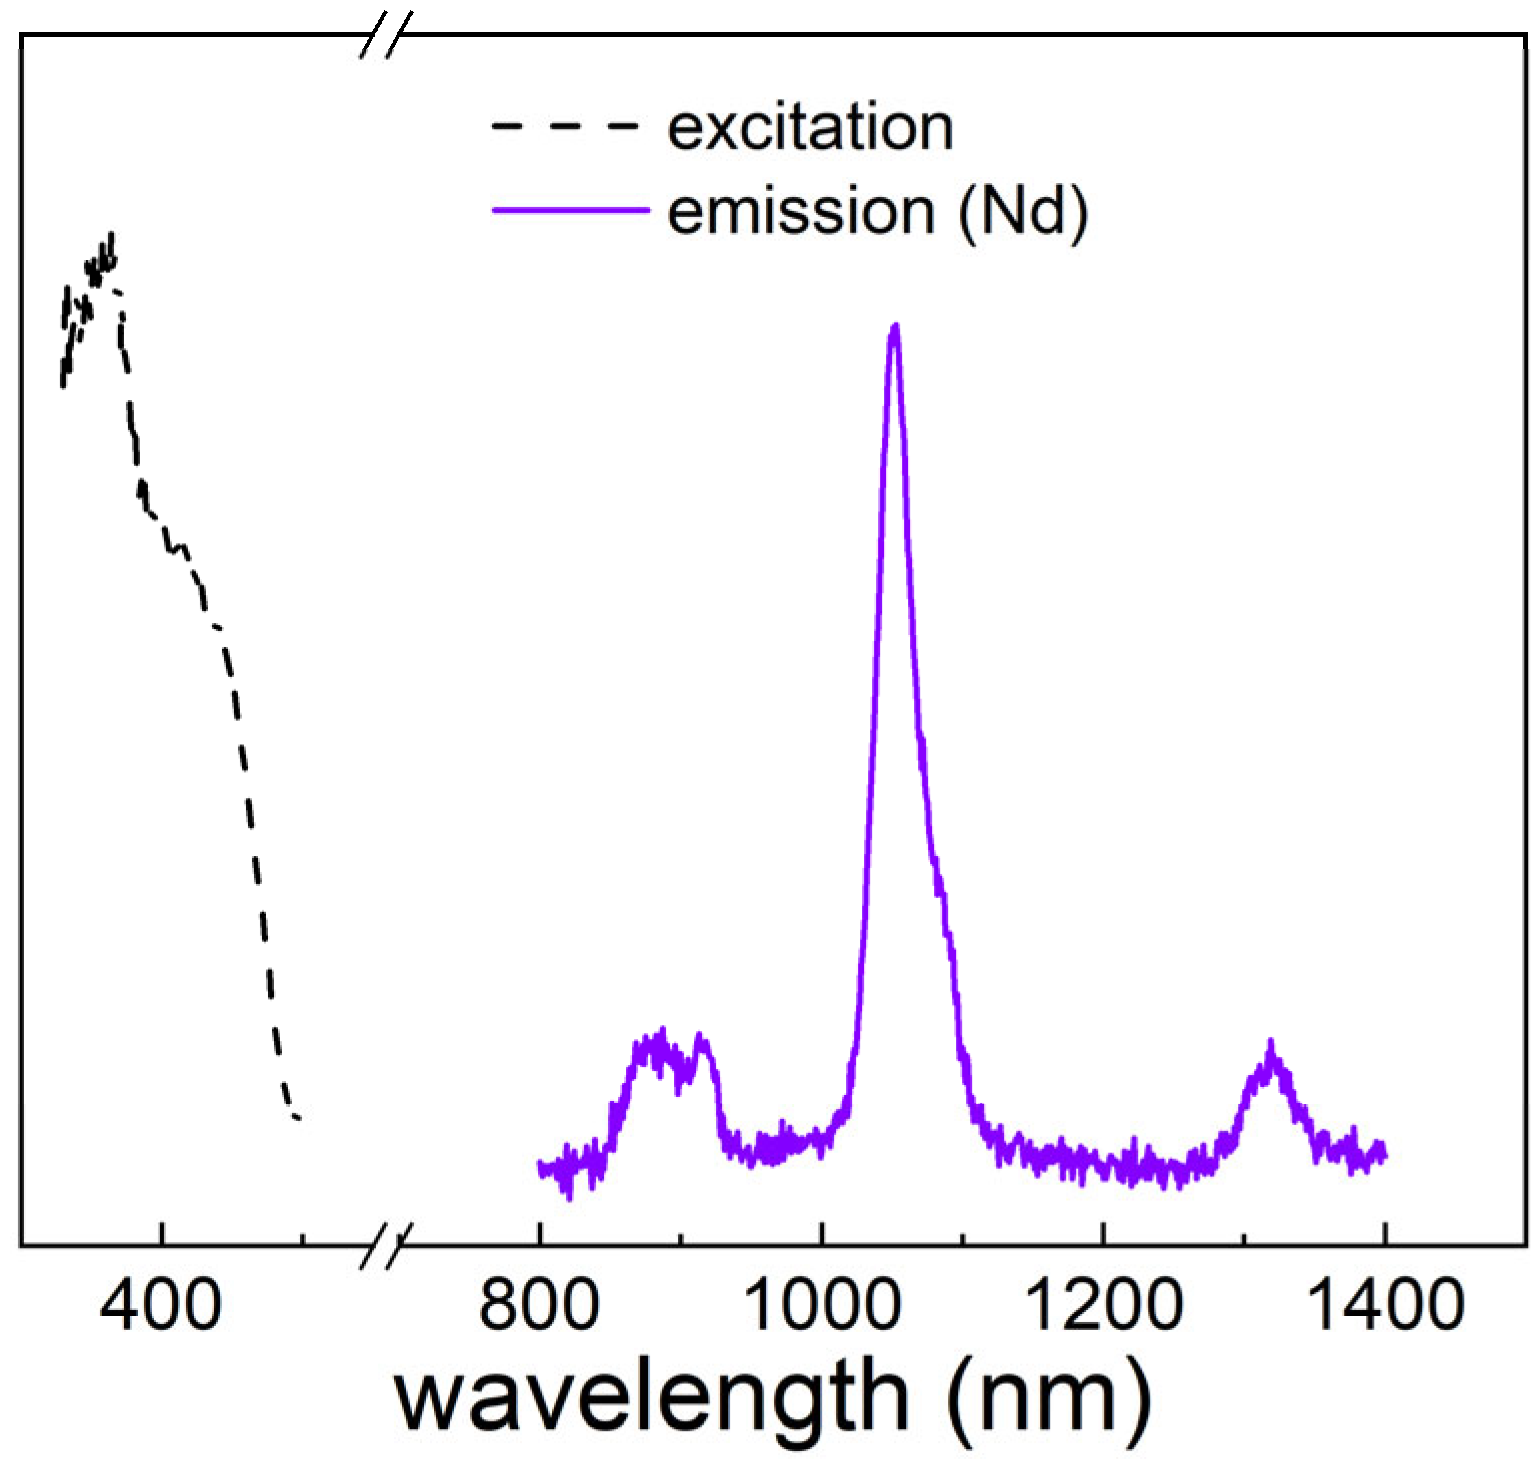
3.3.1. HAcr[Nd(btfa)4]·EtOH 1

For compound 1 the excitation spectrum recorded at λem = 1021 nm shows the π→π* transition of the ligand. The emission spectrum recorded at λex = 364 nm in the UV-visible range shows a broad band between 430 and 672 nm, which corresponds to the emission of the counterion HAcr+ [59,60,61]. The emission spectrum (λexc = 364 nm) of compound 1 in the NIR range shows the emission bands at 883, 1052, and 1323 nm that correspond to the transitions 4IJ4F3/2 with J: 9/2, 11/2, and 13/2, respectively [55]. The excitation and emissions (both in the visible and the NIR range) spectra are depicted in Figure 6.

3.3.2. HAcr[Dy(btfa)4] 2

The emission and excitation spectra of compound 2 were recorded at λex = 361 nm and λem = 560 nm and are shown in Figure 7. For this compound, we can only observe the excitation and emission bands that correspond to the HAcr+ cation, which are two broad bands between 300 and 469 nm and 435 and 676 nm, respectively. No bands are observed in the NIR range. Dysprosium ions show two characteristic emission bands in the visible range around 470 and 570 nm, corresponding to the 4F9/26HJ where J = 15/2 and 13/2 [55]. In the case of compound 2 these bands are masked by the absorption of the HAcr+ molecule, which is a high-absorbing chromophore [59,60,61].

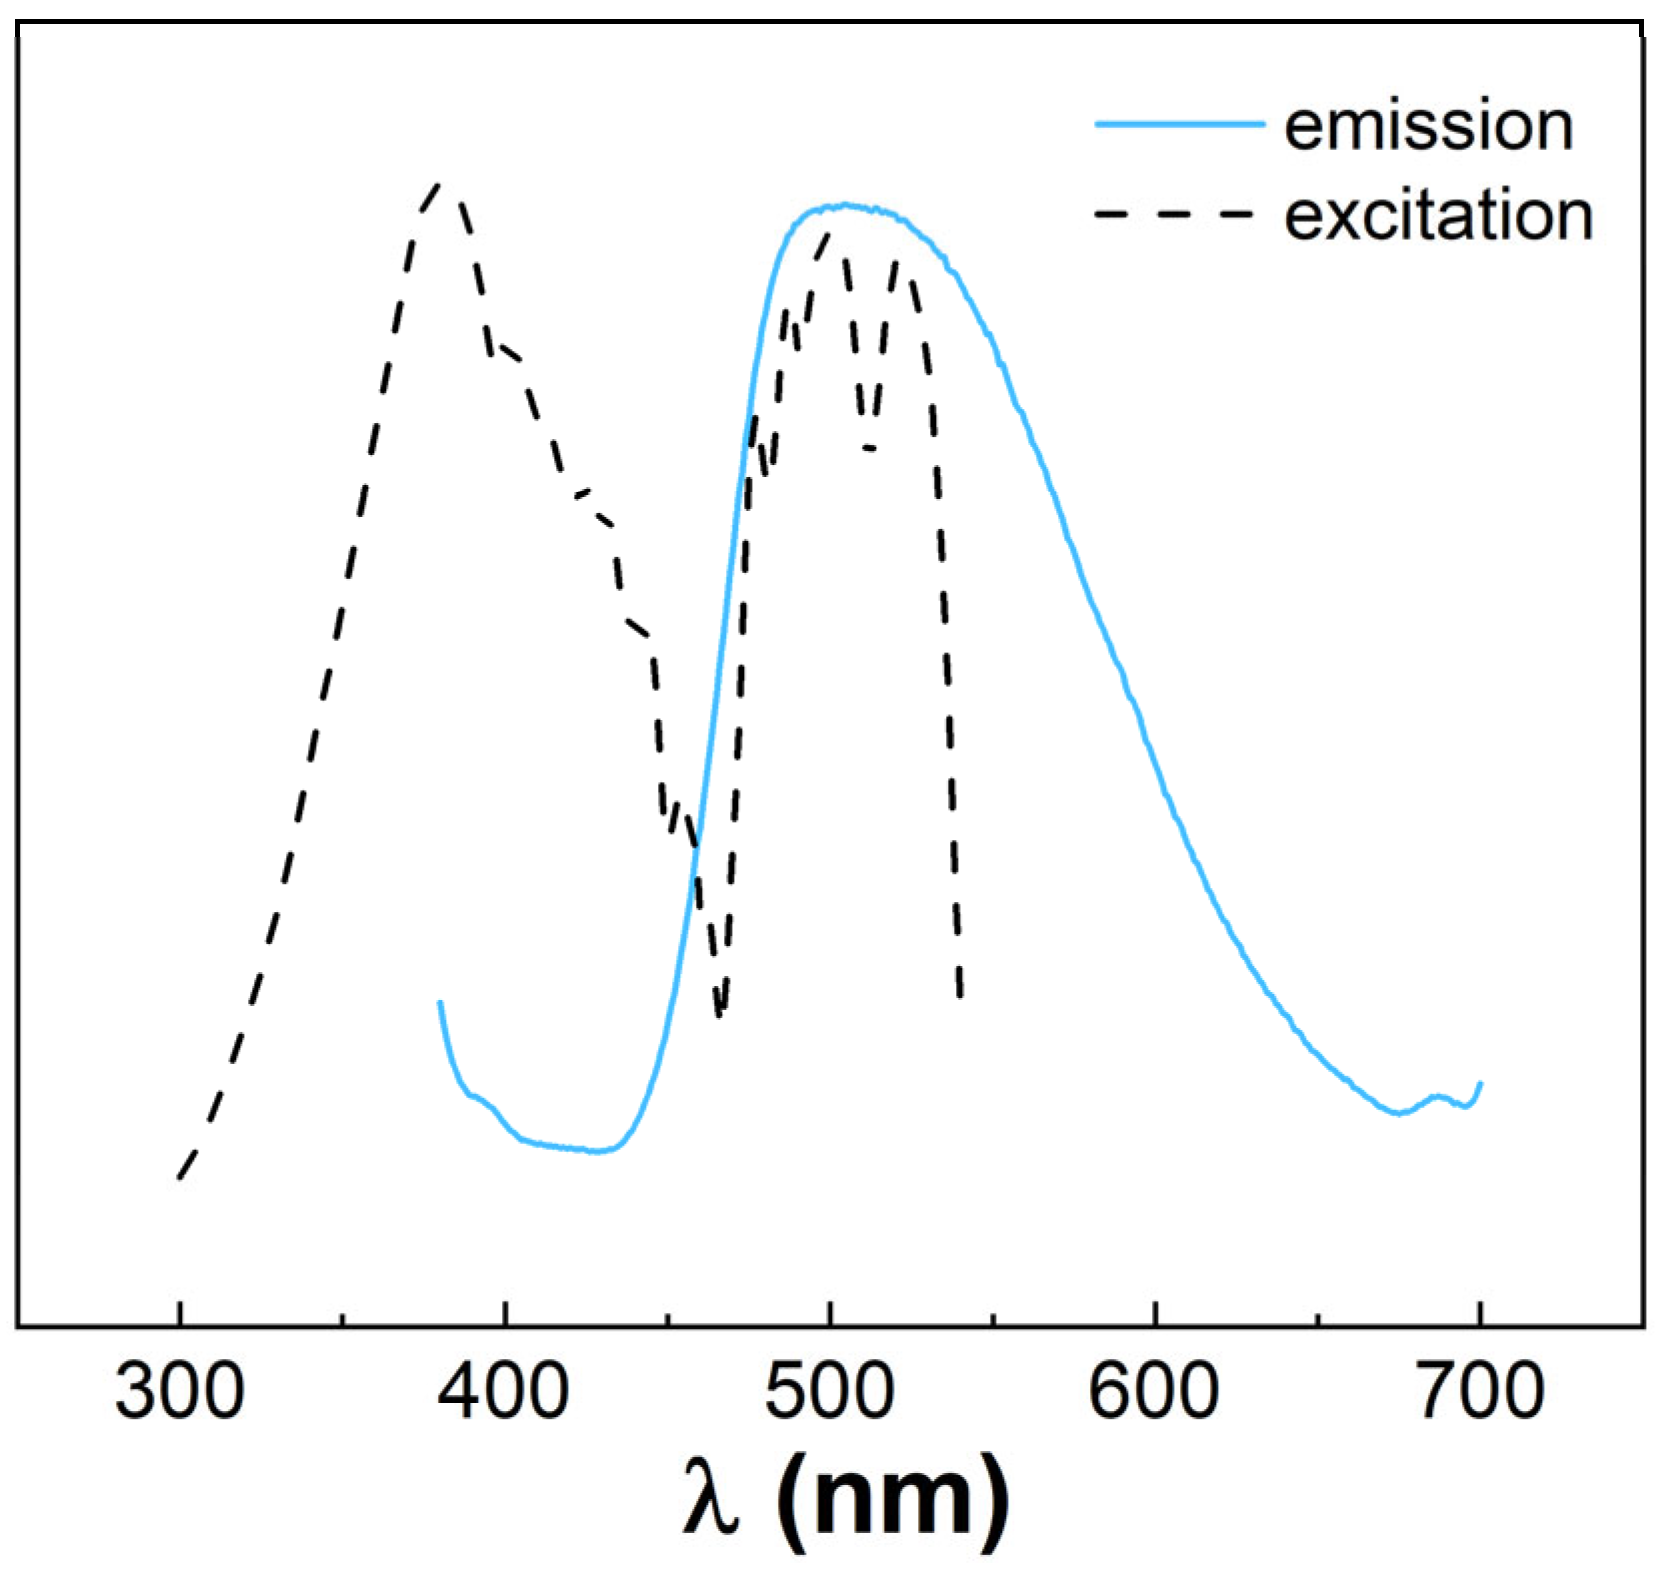
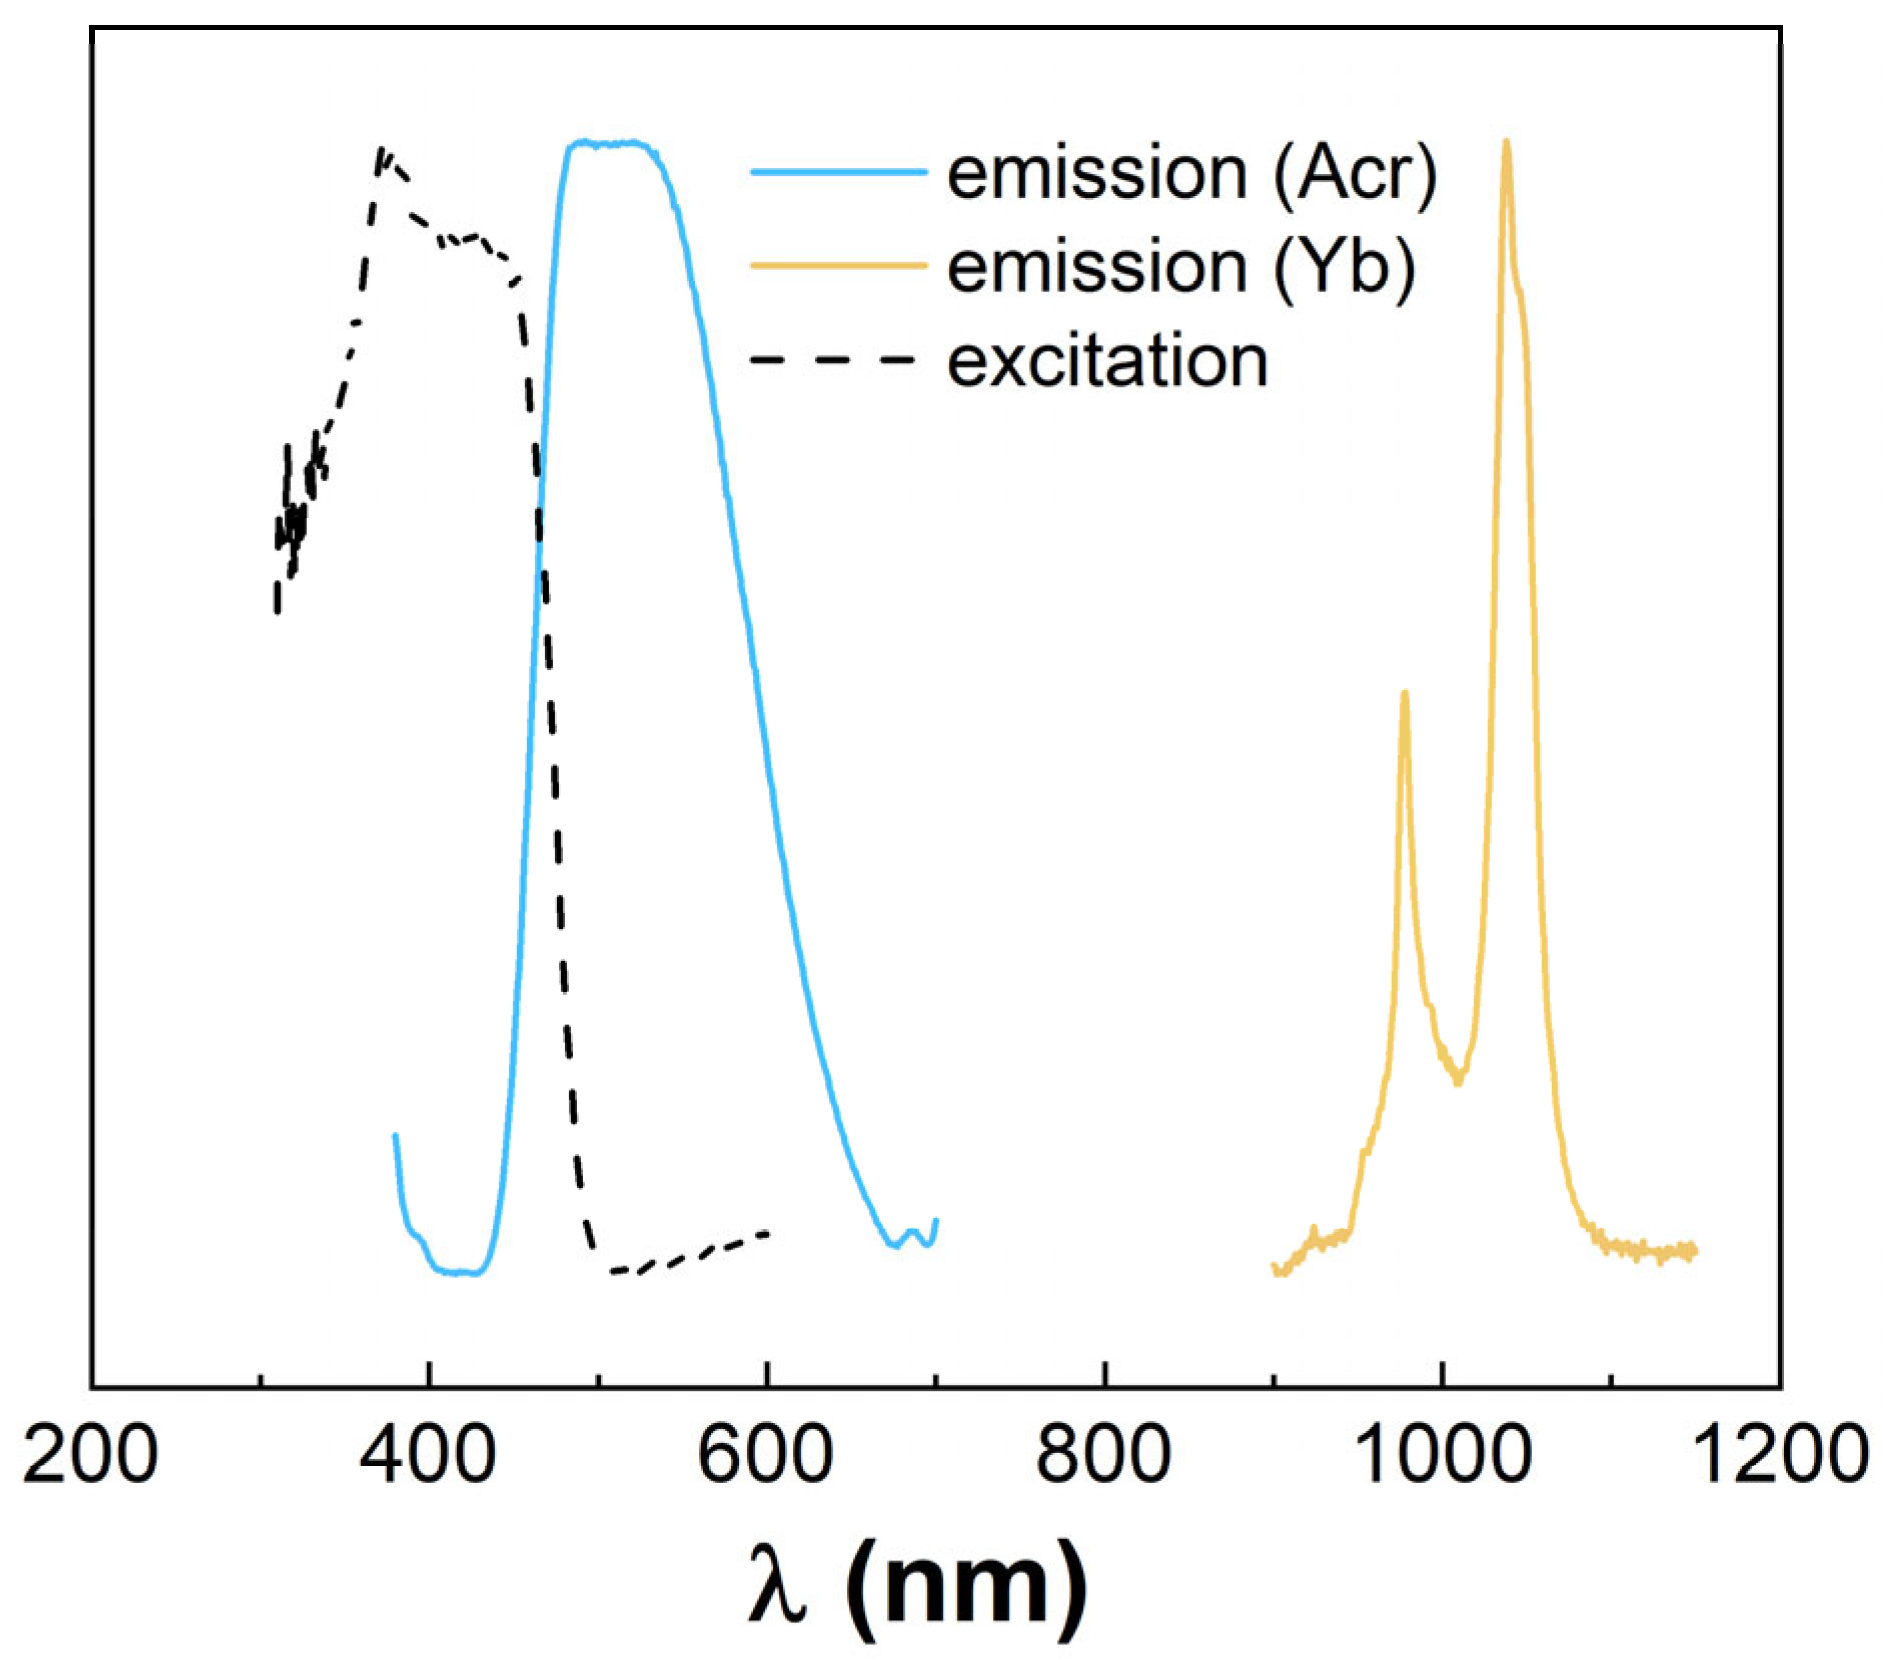
3.3.3. HAcr[Yb(btfa)4] 3

For compound 3 the excitation spectrum recorded at λem = 1021 nm shows the π→π* transition of the ligand. The emission spectrum recorded at λex = 361 nm in the UV-visible range shows a broad band between 430 and 672 nm which corresponds to the emission of the counterion HAcr+ [59,60,61]. In the NIR range, it shows an intense band centered at 1021 nm that corresponds to the 2F5/22F7/2 transition [55]. The excitation and emission spectra (both in the visible and the NIR range) are depicted in Figure 8.

4. Conclusions

In this study, we report the synthesis and crystal structure of three eight-coordinated Ln(III) compounds of formula HAcr[Nd(btfa)4]·EtOH, Nd (1) and HAcr[Ln(btfa)4], Ln = Dy (2) and Yb (3); HAcr+ = acridinium cation. btfa- = 4,4,4-trifluoro-1-phenyl-1,3-butanedionate (btfa). As far as we know, the acridinium cation has never been used as a countercation in the reported series of formula Cation[Ln(β-diketonate)4]. Complexes 13 display the emission band that corresponds to the HAcr+ cation in the visible range, which is a broad band between 430 and 672 nm, and 1 and 3 the f-f emissions in the NIR region of the corresponding lanthanide ion. Additionally, the dynamic magnetic measurements performed below 10 K revealed field-induced SMM behavior for compounds 13. Thus, compounds 1 and 3 can be considered to serve as bifunctional complexes, as they reveal both field-induced SMM and luminescent properties.

Supplementary Materials

The following supporting information can be downloaded at: https://www.mdpi.com/article/10.3390/magnetochemistry9050131/s1. Nd(1); CCDC 2249593, Dy(2) and CCDC 2249595, Yb(3) contain the crystallographic data in CIF format for 13, respectively. More Supplementary Materials corresponding to PXRD patterns and Infra-red spectra of compounds 13 are presented as Supplementary Figures S1 and S2 respectively. Table S1 shows the Continuous shape measures (CShM’s) values for 13. Tables S2–S4 show the relaxation parameters values for the best fit of χM″ and χM′ in front of frequency using the one component generalized Debye model for compounds 13 respectively.

Author Contributions

Conceptualization, R.V. and S.S.; methodology, R.V., À.T. and S.S.; software, S.S., À.T., R.V. and M.F.-B.; validation, R.V.; investigation, E.C., À.T. and S.S.; resources, R.V.; data curation, S.S., À.T., R.V. and M.F.-B.; writing and editing manuscript, S.S., À.T. and R.V.; visualization, À.T., E.C., R.V. and S.S.; administration of project and supervision, R.V.; funding management, R.V. The authors agree with the manuscript version presented. All authors have read and agreed to the published version of the manuscript.

Funding

R.V., À.T. and S.S. are thankful to Ministerio de Ciencia, Innovación y Universidades (Spain), Project PGC2018-094031-B-100.

Institutional Review Board Statement

Not applicable.

Informed Consent Statement

Not applicable.

Data Availability Statement

Data is contained within the article or Supplementary Materials.

Acknowledgments

R.V., S.S. and À.T. acknowledge the financial support from the Ministerio de Ciencia, Innovación y Universidades (Spain) under Project PGC2018-094031-B-100.

Conflicts of Interest

The authors declare no conflict of interest.

References

  1. Ishikawa, N.; Sugita, M.; Ishikawa, T.; Koshihara, S.Y.; Kaizu, Y. Lanthanide Double-Decker Complexes Functioning as Magnets at the Single-Molecular Level. J. Am. Chem. Soc. 2003, 125, 8694–8695. [Google Scholar] [CrossRef] [PubMed]
  2. Tang, J.; Zhang, P. Lanthanide Single Molecule Magnets; Springer: Berlin/Heidelberg, Germany, 2015. [Google Scholar]
  3. Feltham, H.L.C.; Brooker, S. Review of purely 4f and mixed-metal nd-4f single-molecule magnets containing only one lanthanide ion. Coord. Chem. Rev. 2014, 276, 1–33. [Google Scholar] [CrossRef]
  4. Woodruff, D.N.; Winpenny, R.E.P.; Layfield, R.A. Lanthanide Single-Molecule Magnets. Chem. Rev. 2013, 113, 5110–5148. [Google Scholar] [CrossRef]
  5. Zabala-Lekuona, A.; Seco, J.M.; Colacio, E. Single-Molecule Magnets: From Mn12-ac to dysprosium metallocenes, a travel in time. Coord. Chem. Rev. 2021, 441, 213984. [Google Scholar] [CrossRef]
  6. Borah, A.; Murugavel, R. Magnetic relaxation in single-ion magnets formed by less-studied lanthanide ions Ce(III), Nd(III), Gd(III), Ho(III), Tm(II/III) and Yb(III). Coord. Chem. Rev. 2022, 453, 214288. [Google Scholar] [CrossRef]
  7. Guo, F.-S.; Day, B.M.; Chen, Y.-C.; Tong, M.-L.; Mansikkamäki, A.; Layfield, R.A. A Dysprosium Metallocene Single-Molecule Magnet Functioning at the Axial Limit. Angew. Chem. Int. Ed. 2017, 56, 11445–11449. [Google Scholar] [CrossRef] [PubMed]
  8. Goodwin, C.A.P.; Ortu, F.; Reta, D.; Chilton, N.F.; Mills, D.P. Molecular magnetic hysteresis at 60 kelvin in dysprosocenium. Nature 2017, 548, 439–442. [Google Scholar] [CrossRef]
  9. Guo, F.-S.; Day, B.; Chen, Y.-C.; Tong, M.L.; Mansikkamäki, A.; Layfield, R.A. Magnetic hysteresis up to 80 kelvin in a dysprosium metallocene single-molecule magnet. Science 2018, 362, 1400–1403. [Google Scholar] [CrossRef]
  10. Hasegawa, Y.; Kitagawa, Y.; Nakanish, T. Effective photosensitized, electrosensitized, and mechanosensitized luminescence of lanthanide complexes. NPG Asia Mater. 2018, 10, 52–70. [Google Scholar] [CrossRef]
  11. Bünzli, J.-C.G. On the design of highly luminescent lanthanide complexes. Coord. Chem. Rev. 2015, 293–294, 19–47. [Google Scholar] [CrossRef]
  12. De Sá, G.F.; Malta, O.L.; de Mello Donegá, C.; Simas, A.M.; Longo, R.L.; Santa-Cruz, P.A. Spectroscopic Properties and Design of Highly Luminescent Lanthanide Coordination Complexes. Coord. Chem. Rev. 2000, 196, 165–195. [Google Scholar] [CrossRef]
  13. Huang, G.; Calvez, G.; Suffren, Y.; Daiguebonne, C.; Freslon, S.; Guillou, O.; Bernot, K. Closing the Circle of the Lanthanide-Murexide Series: Single-Molecule Magnet Behavior and Near-Infrared Emission of the NdIII Derivative. Magnetochemistry 2018, 4, 44. [Google Scholar] [CrossRef]
  14. Casanovas, B.; Font-Bardía, M.; Speed, S.; El Fallah, M.S.; Vicente, R. Field Induced SMM and Visible/NIR-luminescence behaviour for dinuclear Ln(III) complexes with 2-fluorobenzoate. Eur. J. Inorg. Chem. 2018, 2018, 1928–1937. [Google Scholar] [CrossRef]
  15. Chen, H.-Y.; Wang, W.-M.; Gao, H.-L.; Cui, J.-Z. Near-infrared luminescence and SMM behaviors of a family of dinuclear lanthanide 8-quinolinolate complexes. RSC Adv. 2016, 6, 34165–34174. [Google Scholar]
  16. Bala, S.; Bishwas, M.S.; Pramanik, B.; Khanra, S.; Fromm, K.M.; Poddar, P.; Mondal, R. Construction of Polynuclear Lanthanide (Ln = DyIII, TbIII, and NdIII) Cage Complexes Using Pyridine−Pyrazole-Based Ligands: Versatile Molecular Topologies and SMM Behavior. Inorg. Chem. 2015, 54, 8197–8206. [Google Scholar] [CrossRef]
  17. Galán, L.A.; Wada, S.; Cameron, L.; Sobolev, A.N.; Hasegawa, Y.; Zysman-Colman, E.; Ogden, M.I.; Massi, M. Photophysical investigation of near infrared emitting lanthanoid complexes incorporating tris(2-naphthoyl)methane as a new antenna ligand. Dalton Trans. 2019, 48, 3768–3776. [Google Scholar] [CrossRef]
  18. Yang, C.; Fu, L.M.; Wang, Y.; Zhang, J.P.; Wong, W.T.; Ai, X.-C.; Qiao, F.Y.; Zou, B.S.; Gui, L.-L. A Highly Luminescent Europium Complex Showing Visible-Light-Sensitized Red Emission: Direct Observation of the Singlet Pathway. Angew. Chem. Int. Ed. 2004, 116, 5120–5123. [Google Scholar] [CrossRef]
  19. Imbert, D.; Cantuel, M.; Bunzli, J.-C.G.; Bernardinelli, G.; Piguet, C. Extending Lifetimes of Lanthanide-Based Near-Infrared Emitters (Nd, Yb) in the Millisecond Range through Cr(III) Sensitization in Discrete Bimetallic Edifices. J. Am. Chem. Soc. 2003, 125, 15698–15699. [Google Scholar] [CrossRef]
  20. Beeby, A.; Burton-Pye, B.P.; Faulkner, S.; Motson, G.R.; Jeffery, J.C.; McCleverty, J.A.; Ward, M.D. Synthesis and near-IR luminescence properties of neodymium(iii) and ytterbium(iii) complexes with poly(pyrazolyl)borate ligands. J. Chem. Soc. Dalton Trans. 2002, 9, 1923–1928. [Google Scholar] [CrossRef]
  21. Li, W.; Li, J.; Li, H.; Yan, P.; Hou, G.; Li, G. NIR luminescence of 2-(2,2,2-trifluoroethyl)-1-indone (TFI) neodymium and ytterbium complexes. J. Lumin. 2014, 146, 205–210. [Google Scholar] [CrossRef]
  22. Wang, X.; Wang, L.; Luo, Y.; Wu, W.; Tian, X.; Zhang, Q.; Chen, B. NIR luminescence of a visible-light-sensitized neodymium complex with large experimental fluorescence branching ratio for 4F3/2→4I11/2 in PMMA. J. Mater. Res. 2011, 26, 1517–1523. [Google Scholar] [CrossRef]
  23. Bennett, S.D.; Pope, S.J.A.; Ward, B.D. Near-IR luminescent neodymium complexes: Spectroscopic probes for hydroamination catalysis. Chem. Commun. 2013, 49, 6072–6074. [Google Scholar] [CrossRef]
  24. Shavaleev, N.M.; Scopelliti, R.; Gumy, F.; Bünzli, J.-C.G. Near-Infrared Luminescence of Nine-Coordinate Neodymium Complexes with Benzimidazole-Substituted 8-Hydroxyquinolines. Inorg. Chem. 2008, 47, 9055–9068. [Google Scholar] [CrossRef]
  25. Comby, S.; Bünzli, J.-C.G. Lanthanide near-infrared luminescence in molecular probes and devices. In Handbook on the Physics and Chemistry of Rare Earths; Elsevier: Amsterdam, The Netherlands, 2007; Volume 37, pp. 217–470. [Google Scholar]
  26. Hasegawa, Y.; Nakanishi, T. Luminescent lanthanide coordination polymers for photonic applications. RSC Adv. 2015, 5, 338–353. [Google Scholar] [CrossRef]
  27. Hasegawa, Y. Photofunctional Lanthanoid Complexes, Coordination Polymers, and Nanocrystals for Future Photonic Applications. Bull. Chem. Soc. Jpn. 2014, 87, 1029–1057. [Google Scholar] [CrossRef]
  28. Liu, J.-L.; Chen, Y.-C.; Tong, M.-L. Symmetry strategies for high performance lanthanide-based single-molecule magnets. Chem. Soc. Rev. 2018, 47, 2431–2453. [Google Scholar] [CrossRef] [PubMed]
  29. Eliseeva, S.V.; Bünzli, J.-C.G. Lanthanide luminescence for functional materials and bio-sciences. Chem. Soc. Rev. 2010, 39, 189–227. [Google Scholar] [CrossRef]
  30. Bünzli, J.-C.G. Luminescence bioimaging with lanthanide complexes. In Luminescence of Lanthanide Ions in Coordination Compounds and Nanomaterials; De Bettencourt-Dias, A., Ed.; John Wiley & Sons: Chichester, UK, 2014; Chapter 4; pp. 125–196. [Google Scholar]
  31. Ding, Y.; Wang, Y.; Li, H.; Duan, Z.; Zhang, H.; Zheng, Y. Photostable and efficient red-emitters based on zeolite L crystals. J. Mater. Chem. 2011, 21, 14755–14759. [Google Scholar] [CrossRef]
  32. Ilmi, R.; Kanslz, S.; Dege, N.; Khan, M.S. Synthesis, structure, Hirshfeld surface analysis and photophysical studies of red emitting europium acetylacetonate complex incorporating a phenanthroline derivative. J. Photochem. Photobiol. A 2019, 377, 268–281. [Google Scholar] [CrossRef]
  33. Da Rosa, P.P.F.; Kitagawa, Y.; Hasegawa, Y. Luminescent lanthanide complex with seven-coordination geometry. Coord. Chem. Rev. 2020, 406, 213153. [Google Scholar] [CrossRef]
  34. Ahmed, Z.; Iftikhar, K. Red, orange-red and near-infrared light emitting ternary lanthanide tris β-diketonate complexes with distorted C4v geometrical structures. Dalton Trans. 2019, 48, 4973–4986. [Google Scholar] [CrossRef]
  35. Li, J.; Li, H.; Yan, P.; Chen, P.; Hou, G.; Li, G. Synthesis, Crystal Structure, and Luminescent Properties of 2-(2,2,2-Trifluoroethyl)-1-indone Lanthanide Complexes. Inorg. Chem. 2012, 51, 5050–5057. [Google Scholar] [CrossRef]
  36. Ilmi, R.; Khan, M.S.; Li, Z.; Zhou, L.; Wong, W.-Y.; Marken, F.; Raithby, P.R. Utilization of Ternary Europium Complex for Organic Electroluminescent Devices and as a Sensitizer to Improve Electroluminescence of Red-Emitting Iridium Complex. Inorg. Chem. 2019, 58, 8316–8331. [Google Scholar] [CrossRef]
  37. Long, J.; Guari, Y.; Ferreira, R.A.S.; Carlos, L.D.; Larionova, J. Recent advances in luminescent lanthanide based Single-Molecule Magnets. Coord. Chem. Rev. 2018, 363, 57–70. [Google Scholar] [CrossRef]
  38. Vicente, R.; Tubau, À.; Speed, S.; Mautner, F.A.; Bierbaumer, F.; Fischer, R.C.; Massoud, S.S. Slow magnetic relaxation and luminescence properties in neodymium(III) 4,4,4-trifluoro-1-(2-naphthyl)butane-1,3-dionato complexes incorporating bipyridyl ligands. New J. Chem. 2021, 45, 14713–14723. [Google Scholar] [CrossRef]
  39. Wu, Z.; Tian, Y.-M.; Chen, P.; Sun, W.-B.; Wang, B.-W.; Gao, S. A series of counter cation-dependent tetra β-diketonate mononuclear lanthanide(iii) single-molecule magnets and immobilization on pre-functionalised GaN substrates by anion exchange reaction. J. Mater. Chem. C 2021, 9, 6911–6922. [Google Scholar]
  40. Visconti, M.; Maggini, S.; Ciani, G.; Mercandelli, P.; Del Secco, B.; Prodi, L.; Sgarzi, M.; Zaccheroni, N.; Carlucci, L. New Lanthanide Metalloligands and Their Use for the Assembly of Ln–Ag Bimetallic Coordination Frameworks: Stepwise Modular Synthesis, Structural Characterization, and Optical Properties. Cryst. Growth Des. 2019, 19, 5376–5389. [Google Scholar] [CrossRef]
  41. Akerboom, S.; Meijer, M.S.; Siegler, M.A.; Fu, W.T.; Bouwman, E. Structure, photo- and triboluminescence of the lanthanoid dibenzoylmethanates: HNEt3[Ln(dbm)4]. J. Lumin. 2014, 145, 278–282. [Google Scholar] [CrossRef]
  42. Pointillart, F.; Maury, O.; Le Gal, Y.; Golhen, S.; Cador, O.; Ouahab, L. 4-(2-Tetrathiafulvalenyl-ethenyl)pyridine (TTF−CH═CH−Py) Radical Cation Salts Containing Poly(β-diketonate) Rare Earth Complexes: Synthesis, Crystal Structure, Photoluminescent and Magnetic Properties. Inorg. Chem. 2009, 48, 7421–7429. [Google Scholar] [CrossRef]
  43. Navarro, Y.; Guedes, G.P.; Cano, J.; Oon, P.; Iglesias, M.J.; Lloret, F.; Lopez-Ortiz, F. Synthesis, structural characterization and electrochemical and magnetic studies of M(hfac)2 (M = CuII, CoII) and Nd(hfac)3 complexes of 4-amino-TEMPO. Dalton Trans. 2020, 49, 6280–6294. [Google Scholar] [CrossRef]
  44. Speed, S.; Pointillart, F.; Mulatier, J.-C.; Guy, L.; Golhen, S.; Cador, O.; le Guennic, B.; Riobe, F.; Maury, O.; Ouahab, L. Photophysical and Magnetic Properties in Complexes Containing 3d/4f Elements and Chiral Phenanthroline-Based Helicate-Like Ligands. Eur. J. Inorg. Chem. 2017, 2017, 2100–2111. [Google Scholar] [CrossRef]
  45. Cary, S.K.; Livshits, M.; Cross, J.N.; Ferrier, M.G.; Mocko, V.; Stein, B.W.; Korimor, S.A.; Scott, B.L.; Rack, J.J. Advancing Understanding of the +4 Metal Extractant Thenoyltrifluoroacetonate (TTA); Synthesis and Structure of MIVTTA4 (MIV = Zr, Hf, Ce, Th, U, Np, Pu) and MIII(TTA)4 (MIII = Ce, Nd, Sm, Yb). Inorg. Chem. 2018, 57, 3782–3797. [Google Scholar] [CrossRef]
  46. Li, X.; Hu, M.; Yin, Z.; Zhu, C.; Liu, C.-M.; Xiao, H.-P.; Feng, S. Enhanced single-ion magnetic and ferroelectric properties of mononuclear Dy(iii) enantiomeric pairs through the coordination role of chiral ligands. Chem. Commun. 2017, 53, 3998–4001. [Google Scholar] [CrossRef] [PubMed]
  47. Bruker APEX. SAINT, version 8.37A; Bruker AXS Inc.: Madison, WI, USA, 2015. [Google Scholar]
  48. Sheldrick, G.M. SADABS, Version 2; University of Goettingen: Goettingen, Germany, 2001.
  49. Sheldrick, G.M. Crystal structure refinement with SHELXL. Acta Crystallogr. C Struct. Chem. 2015, 71, 3–8. [Google Scholar] [CrossRef]
  50. Macrae, C.F.; Edington, P.R.; McCabe, P.; Pidcock, E.; Shields, G.P.; Taylor, R.; Towler, T.; van de Streek, J.J. Mercury: Visualization and analysis of crystal structures. Appl. Cryst. 2006, 39, 453–457. [Google Scholar] [CrossRef]
  51. Spek, A.L. PLATON, a Multipurpose Crystallographic Tool; Utrecht University: Utrecht, The Netherlands, 1999. [Google Scholar]
  52. Jordan, R.B. Lanthanide Contraction: What is Normal? Inorg. Chem. 2023, 62, 3715–3721. [Google Scholar] [CrossRef] [PubMed]
  53. Llunell, M.; Casanova, D.; Cirera, J.; Alemany, P.; Alvarez, S. Shape Program, Version 2; Universitat de Barcelona: Barcelona, Spain, 2010.
  54. Alemany, P.; Casanova, D.; Alvarez, S.; Dryzun, C.; Avnir, D. Continuous Symmetry Measures: A New Tool in Quantum Chemistry. Rev. Comput. Chem. 2017, 30, 289–352. [Google Scholar] [CrossRef]
  55. Atwood, D.A. (Ed.) The Rare Earth Elements: Fundamentals and Applications, 2nd ed.; John Wiley & Sons Ltd.: Singapore, Singapore, 2012. [Google Scholar]
  56. Zhu, W.-H.; Xiong, X.; Gao, S.; Li, S.; Zhang, Y.; Wang, J.; Zhang, C.; Powell, A.K.; Gao, S. A family of one-dimensional lanthanide complexes bridged by two distinct carboxylate ligands with the Dy analogue displaying magnetic relaxation behavior. Dalton Trans. 2017, 46, 14114–14121. [Google Scholar] [CrossRef]
  57. Aubin, S.M.J.; Sun, Z.; Pardi, L.; Krzystek, J.; Folting, K.; Brunel, L.-C.; Rheingold, A.L.; Christou, G.; Hendrickson, D.N. Reduced Anionic Mn12 Molecules with Half-Integer Ground States as Single-Molecule Magnets. Inorg. Chem. 1999, 38, 5329–5340. [Google Scholar] [CrossRef]
  58. Guo, Y.-N.; Xu, G.-F.; Guo, Y.; Tang, J. Relaxation dynamics of dysprosium(III) single molecule magnets. Dalton Trans. 2011, 40, 9953–9963. [Google Scholar] [CrossRef]
  59. Kuruvilla, E.; Joseph, J.; Ramaiah, D. Novel bifunctional acridine-acridinium conjugates: Synthesis and study of their chromophore-selective electron-transfer and DNA-binding properties. J. Phys. Chem. B 2005, 109, 21997–22002. [Google Scholar] [CrossRef] [PubMed]
  60. Yang, X.-G.; Zhai, Z.-M.; Lu, X.-M.; Ma, L.-F.; Yan, D. Fast Crystallization-Deposition of Orderly Molecule Level Heterojunction Thin Films Showing Tunable Up-Conversion and Ultrahigh Photoelectric Response. ACS Cent. Sci. 2020, 6, 1169–1178. [Google Scholar] [CrossRef] [PubMed]
  61. Yang, X.; Ma, L.-F.; Yan, D. Facile synthesis of 1D organic–inorganic perovskite micro-belts with high water stability for sensing and photonic applications. Chem. Sci. 2019, 10, 4567–4572. [Google Scholar] [CrossRef] [PubMed]
Figure 1. Perspective view (left) and coordination figure (right) of 1. Hydrogen atoms have been omitted for clarity. Color code, pink: Neodymium, red: Oxygen, dark blue: Nitrogen, grey: Carbon, green: Fluorine.
Magnetochemistry 09 00131 g001
Figure 2. Perspective view (left) and coordination figure (right) of 2. The hydrogen atoms are omitted for better clarification. Color code, light blue: Dysprosium, red: Oxygen, dark blue: Nitrogen, grey: Carbon, green: Fluorine.
Magnetochemistry 09 00131 g002
Figure 3. Perspective view (left) and coordination figure (right) of 3. Hydrogen atoms have been omitted for clarity. Color code, yellow: Ytterbium, red: Oxygen, dark blue: Nitrogen, grey: Carbon, green: Fluorine.
Magnetochemistry 09 00131 g003
Figure 4. χMT vs. T plots for compounds 13 (left) and magnetization plots measured at T = 2 K (field dependence of 13) (right).
Magnetochemistry 09 00131 g004
Figure 5. Top: Frequency dependence of the χM″ component for 1 (a), for 2 (d), and for 3 (g). The dots represent the experimental points obtained in the measurement, and the continuous line are guide for the eyes. Middle: Cole–Cole plot of compounds 1 (b), 2 (e), and 3 (h). The dots represent the χM′ and χM″ values obtained in the measurements, and the solid lines represent the fitting using generalized Debye models. Bottom: Magnetization relaxation time [ln(τ)] vs. T−1 for 1 (c), for 2 (f), and for 3 (i). Solid lines represent the best theoretical fittings (see text).
Magnetochemistry 09 00131 g005
Figure 6. Excitation (dashed line) and emission (solid line) spectra of 1.
Magnetochemistry 09 00131 g006
Figure 7. Excitation (dashed line) and emission (solid line) spectra of 2.
Magnetochemistry 09 00131 g007
Figure 8. Excitation (dashed line) and emission (solid lines) spectra of 3.
Magnetochemistry 09 00131 g008
Table 1. Crystallographic data and processing parameters for 13.
123
Empirical formulaC55H39F12NdNO9C53H34DyF12NO8C53H34YbF12NO8
Formula Weight1230.111203.311213.85
Crystal SystemTriclinictriclinictriclinic
Space groupP-1 (No. 2)P-1 (No. 2)P-1 (No. 2)
a (Å)10.1909 (3)11.3753 (11)11.3331 (5)
b (Å)11.8183 (4)13.2649 (14)13.2428 (6)
c (Å)11.9800 (4)17.7231 (18)17.7774 (9)
α (°)110.310 (1)91.029 (5)90.509 (3)
β (°)98.786 (1)93.792 (5)94.668 (3)
γ (°)107.258 (1)113.259 (5)112.730 (2)
V (Å3)1238.44 (7)2448.7 (4)2450.3 (2)
Z222
T (K)100100100
μ (mm−1)1.1541.6282.010
θ max (°)30.727.526.4
Data collected68,48647,71043,442
Unique refl./Rint7617/0.04311,242/0.17110,031/0.154
Parameters/Restraints357/3649/2676/0
S1.111.031.03
R1/wR2 (all data)0.0204/0.05250.0637/0.12930.0518/0.0912
Table 2. Selected bond distances (Å) and angles (º) for 1–3.
1 23
Nd1-O12.4335 (11)Ln1-O12.379 (4)2.278 (4)
Nd1-O22.4600 (11)Ln1-O22.330 (4)2.302 (4)
Nd1-O32.4501 (11)Ln1-O32.394 (4)2.297 (4)
Nd1-O42.4405 (11)Ln1-O42.326 (4)2.291 (4)
Nd1-O1_$12.4335 (11)Ln1-O52.348 (4)2.366 (4)
Nd1-O2_$12.4600 (11)Ln1-O62.322 (4)2.279 (4)
Nd1-O3_$12.4501 (11)Ln1-O72.316 (4)2.341 (4)
Nd1-O4_$12.4405 (11)Ln1-O82.332 (4)2.283 (4)
O1-Nd1-O269.46 (4)O1-Ln1-O271.69 (15)75.08 (14)
O1-Nd1-O371.05 (3)O1-Ln1-O377.34 (13)140.44 (13)
O1-Nd1-O4110.28 (4)O1-Ln1-O477.53 (13)76.22 (13)
O1-Nd1-O1_$1180.00O1-Ln1-O5148.85 (13)148.13 (13)
O1-Nd1-O2_$1110.54 (4)O1-Ln1-O6129.30 (16)104.65 (15)
O1-Nd1-O3_$1108.96 (3)O1-Ln1-O772.57 (13)72.47 (13)
O1-Nd1-O4_$169.72 (4)O1-Ln1-O8128.83 (14)86.02 (14)
O2-Nd1-O3108.05 (4)O2-Ln1-O378.75 (14)72.86 (13)
O2-Nd1-O471.88 (3)O2-Ln1-O4142.25 (13)75.82 (13)
O1_$1-Nd1-O2110.54 (4)O2-Ln1-O5103.14 (15)122.90 (13)
O2-Nd1-O2_$1180.00O2-Ln1-O6144.99 (13)147.44 (13)
O2-Nd1-O3_$171.95 (4)O2-Ln1-O786.18 (15)131.50 (13)
O2-Nd1-O4_$1108.12 (3)O2-Ln1-O869.31 (14)69.70 (13)
O3-Nd1-O469.12 (4)O3-Ln1-O473.57 (15)73.96 (14)
O1_$1-Nd1-O3108.96 (3)O3-Ln1-O571.55 (13)70.85 (13)
O2_$1-Nd1-O371.95 (4)O3-Ln1-O6128.82 (13)90.64 (14)
O3-Nd1-O3_$1180.00O3-Ln1-O7149.32 (12)147.10 (13)
O3-Nd1-O4_$1110.88 (4)O3-Ln1-O8124.29 (16)103.72 (15)
O1_$1-Nd1-O469.72 (4)O4-Ln1-O591.99 (14)130.85 (13)
O2_$1-Nd1-O4108.12 (3)O4-Ln1-O672.48 (14)72.65 (13)
O3_$1-Nd1-O4110.88 (4)O4-Ln1-O7105.08 (15)127.94 (15)
O4-Nd1-O4_$1180.00O4-Ln1-O8148.35 (14)144.28 (13)
O1_$1-Nd1-O2_$169.46 (4)O5-Ln1-O672.57 (15)74.56 (13)
O1_$1-Nd1-O3_$171.05 (3)O5-Ln1-O7138.52 (13)76.54 (13)
O1_$1-Nd1-O4_$1110.28 (4)O5-Ln1-O872.92 (15)77.95 (13)
O2_$1-Nd1-O4_$1108.05 (4)O6-Ln1-O777.00 (14)76.39 (14)
O2_$1-Nd1-O4_$171.88 (3)O6-Ln1-O876.44 (15)142.66 (13)
O3_$1-Nd1-O4_$169.12 (4)O7-Ln1-O873.04 (16)72.98 (14)
Symmetry code $1: 1−x, 1−y, 1−z.
Disclaimer/Publisher’s Note: The statements, opinions and data contained in all publications are solely those of the individual author(s) and contributor(s) and not of MDPI and/or the editor(s). MDPI and/or the editor(s) disclaim responsibility for any injury to people or property resulting from any ideas, methods, instructions or products referred to in the content.

