Article

Artifacts’ Detection for MRI Non-Metallic Needles: Comparative Analysis for Artifact Evaluation Using K-Means and Manual Quantification

1
Faculty of Electrical Engineering and Information Technology, Institute for Medical Technology, Chair of Medical Systems Technology, Otto von Guericke University, 39106 Magdeburg, Germany
2
Data and Knowledge Engineering Group, Faculty of Computer Science, Institute of Technical and Operational Information Systems, Otto von Guericke University, 39106 Magdeburg, Germany
*
Author to whom correspondence should be addressed.
Magnetochemistry 2023, 9(3), 79; https://doi.org/10.3390/magnetochemistry9030079
Submission received: 26 December 2022 / Revised: 28 February 2023 / Accepted: 1 March 2023 / Published: 7 March 2023
(This article belongs to the Special Issue NMR Spectroscopy and Imaging in Biological Chemistry and Medicine)

Abstract

:
Interventional biopsy needles need to be accurately localized to the target tissue during magnetic resonance imaging (MRI) interventions. In this context, severe susceptibility artifacts affect the visibility of structures in the MR images depending on the needle’s material composition. In particular, standard needles for the spinal cord made of nickel-titanium alloys (NiTi) generate massive susceptibility artifacts during MRI. Consequently, this does not allow the precise placement of the needle to the target. The aim was to prove that using a non-metallic material for the needle can significantly reduce the appearance of artifacts. Hence, this work used a new combination of non-metallic materials based on an enforced fiber bundle as an inner core with different outer hollow sheets to fabricate seven prototypes of interventional spinal needles to optimize their visualization in MRI scans. Susceptibility artifacts for the non-metallic needles were evaluated in MRI images by an automatic quantification based on a K-means algorithm and compared with manual quantification. The width and length of the artifacts were measured for each needle. The non-metallic needles showed significantly lower artifacts in comparison to the standard needle. K-means provided the capability for detecting needle artifacts in MRI images, facilitating qualitative and quantitative assessment of MRI artifacts.

Graphical Abstract

1. Introduction

Magnetic resonance imaging (MRI) is an imaging modality widely used in medical diagnostics and therapy. The use of MRI guidance has several advantages compared to other image modalities such as computed tomography (CT) and ultrasound (US) guidance [1,2] MRI provides detailed anatomical and physiological images of the body. The images have superior soft tissue contrast, without exposing the patient to ionizing radiation. In addition, this imaging technique has the ability to detect malignant tumors, as well as to provide anatomical and functional diagnostics of the heart and brain activity. Besides diagnostic imaging, MRI is also used to guide minimally invasive interventions, i.e., for monitoring and guiding therapeutic procedures [3,4]. Exemplary applications for an MRI-guided minimally invasive intervention are liver biopsies [5], pain therapy for spinal cord application [6], drainage placements, radiofrequency ablation, and drug delivery [7].
Image-guided procedures combine MRI with needle biopsy to provide physicians with quick access to abnormal areas that may not be visible through the skin during the procedure. The physician will ensure the needle reaches the desired location using real-time images. Recent advancements in interventional MR systems and MRI-compatible needles have enabled precise tracking and an open configuration, facilitating near-real-time localization strategies for interventional procedures. Other benefits include improved contrast in soft tissues, multi-planar imaging, and non-ionizing radiation for the patient or the medical staff [8,9].
However, performing image-guided procedures in an MRI environment can be challenging due to the presence of a strong magnetic field. Interventional needles used in MRI-guided procedures must meet the essential requirements of electromagnetic compatibility and the avoidance of mechanical forces due to magnetic attraction [7,10]. In this context, most standard needles for interventions are limited for use in the MRI environment due to safety concerns related to a magnetic attraction. Despite the benefits of using MRI-compatible needles, it is still challenging due to severe susceptibility artifacts appearing during the MRI scan because of the material’s interactions with the magnetic field. As a consequence, it does not allow the precise placement of the needle within the MRI scan [11]. An MRI-guided biopsy is performed using either an open- or closed-bore MRI system. The recent commercial availability of open MR systems has become the preferred type for MRI-guided procedures because it provides direct access to the patient. There have been continuous efforts, which have concentrated on developing strategies for MR-guided biopsies. They have focused on the safety, performance success, and visualization of the needles relative to surrounding tissues. In addition, the visualization of the needles in the MR environment is connected directly to the principal phenomena, called susceptibility artifacts, caused by needle-induced field inhomogeneities in the MR image [12,13].
The phenomena of the MRI susceptibility artifact effects depend on many factors, mainly on the materials used for the biopsy, then the field strength, the MRI sequence parameters, and the orientation of the biopsy needle to the main magnetic field. Understanding these dependencies is essential to evaluate the positioning accuracy obtainable under MRI guidance. Several groups have experimentally examined the appearance of needles in MR images [14,15].
The development of a high-quality interventional needle for use in the MRI environment requires careful consideration of its visibility in the image while minimizing any resulting massive artifacts, i.e., the size of the visible needle should be close to the geometric size of the needle. On the one hand, it is crucial to provide precise measurement techniques that can accurately quantify artifacts during the developmental stage of MRI biopsy needles [16]. On the other hand, the mechanical performance of the developed needle has to fulfill the same functional requirements as a standard biopsy needle according to its designated use [17]. Several groups have conducted experimental studies on the appearance of needles in MR images [18,19]. For example, standard interventional needles made from stainless steel and nickel-titanium (NiTi) provide the required mechanical properties, but they are known to produce significant artifacts in MR images because of their material composition [20]. Ceramic needles could produce less or no artifacts. However, a needle made from ceramics has the potential risk of being brittle, which limits its usage in medical applications. Alternatively, an approach that utilizes fiber-bundle-reinforced composites is being explored for needle production. Such needles produce artifacts that are distinctly smaller in size than standard NiTi needles [11,21]. Before being made commercially available, these needles undergo clinical studies to optimize their mechanical performance.
Currently, the majority of the research has been conducted aiming to design interventional biopsy needles for MRI-guided procedures with minimum artifacts. Since the artifacts mainly depend on the materials used to build these biopsy needles, the current trend is to develop new MRI-compatible materials or devices producing minimum artifacts in an MR image, but at the same time, keeping their mechanical properties at an acceptable level [22]. Many research groups and medical manufacturers are working on interventional devices for MRI-guided interventions.
Due to the demanding MRI environment, the users use and adapt materials such as nylon, polytetrafluoroethylene (PTFE), polyether ether ketone (PEEK), wood, copper, alumina ceramics, acetal co-polymers, nylon, aramid, polyester, and fibers. These materials can be a solution for the construction of biopsy needles that have the required mechanical properties and many other materials that come under the MRI-compatible category and present almost negligible artifacts. Other materials that have produced higher susceptibility artifacts, such as aluminum, titanium, nitinol, and magnesium, will present noticeable artifacts, but they may still be acceptably used due to their mechanical properties in medical applications [23].
In current clinical practice, clinicians evaluate the artifacts of biopsy needles in MRI images manually, according to the standard of the American Society for Testing and Materials (ASTM): F2119 for the evaluation of the artifacts directly from MR images [24]. However, it is a time-consuming procedure for medical staff with limited reproducibility [25]. Therefore, recent studies have proposed various assessment methods for measuring artifacts in MR images, such as automatic and machine learning detection approaches [17,26]. These approaches apply to specific algorithms such as the density-based clustering algorithm (DBS), which have been developed to address the limitations of traditional clustering techniques. Traditional clustering methods may not perform well on sparse datasets or data points with varying densities, which can lead to inaccurate or noisy clustering results. In addition, we cannot control the K value (number of clusters) such as in K-means. DBS requires the radius and number of cluster member parameters to be pre-determined, which may be challenging to identify accurately in this case. A hierarchical algorithm (HDA) clustering needs a set of nested clusters that are arranged as a tree. HDA generates overlapping, nested clusters [27]. Our aim was to generate non-overlapping clusters using K-means to distinguish between cluster members clearly. To this end, each pixel was assigned to only one cluster and was not included in multiple or overlapping clusters. However, these algorithms are often limited to specific medical applications, such as those related to the brain and breast [28,29,30]. Furthermore, automatic detection of biopsy needles has been restricted to specific imaging modalities such as photoacoustic, computed tomography (CT), and MRI [25,31,32]. Regarding MRI applications, Mehrtash et al. developed a detection approach specifically for visualizing a prostate biopsy needle [25]. There is a lack of applying a simple machine learning approach for detecting the artifacts for MRI spinal biopsy needle applications [16,31]. Therefore, To address this gap, our work proposes an unsupervised machine learning approach based on K-means clustering that is simple to implement and computationally efficient. The method utilizes only one hyperparameter, which is the number of clusters (K) [32,33]. Moreover, K-means clustering is unaffected by varying densities of data points since it uses pixel intensity values for clustering. Clustering involves dividing the set of data objects into non-overlapping subsets (clusters) such that each data object is part of only one subset. Additionally, unsupervised machine learning saves time on annotation for generating the ground truth, which is required for performing supervised machine learning tasks [34].
The main contribution of our work is to explore the feasibility of using an automatic workflow based on K-means clustering as a fast and reliable approach to quantify susceptibility artifacts caused by biopsy needles in MRI. We applied the proposed algorithm to quantify the susceptibility artifacts of eight needles for spinal cord applications, including one standard NiTi needle and seven fabricated non-metallic needles, and compared the results with manual quantification. We also compared the automatically and manually determined needle dimensions from the MR images with their actual geometric dimensions.

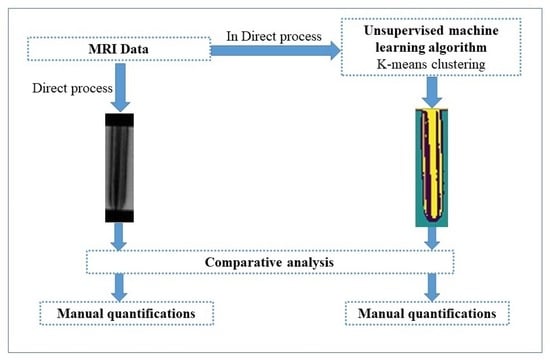
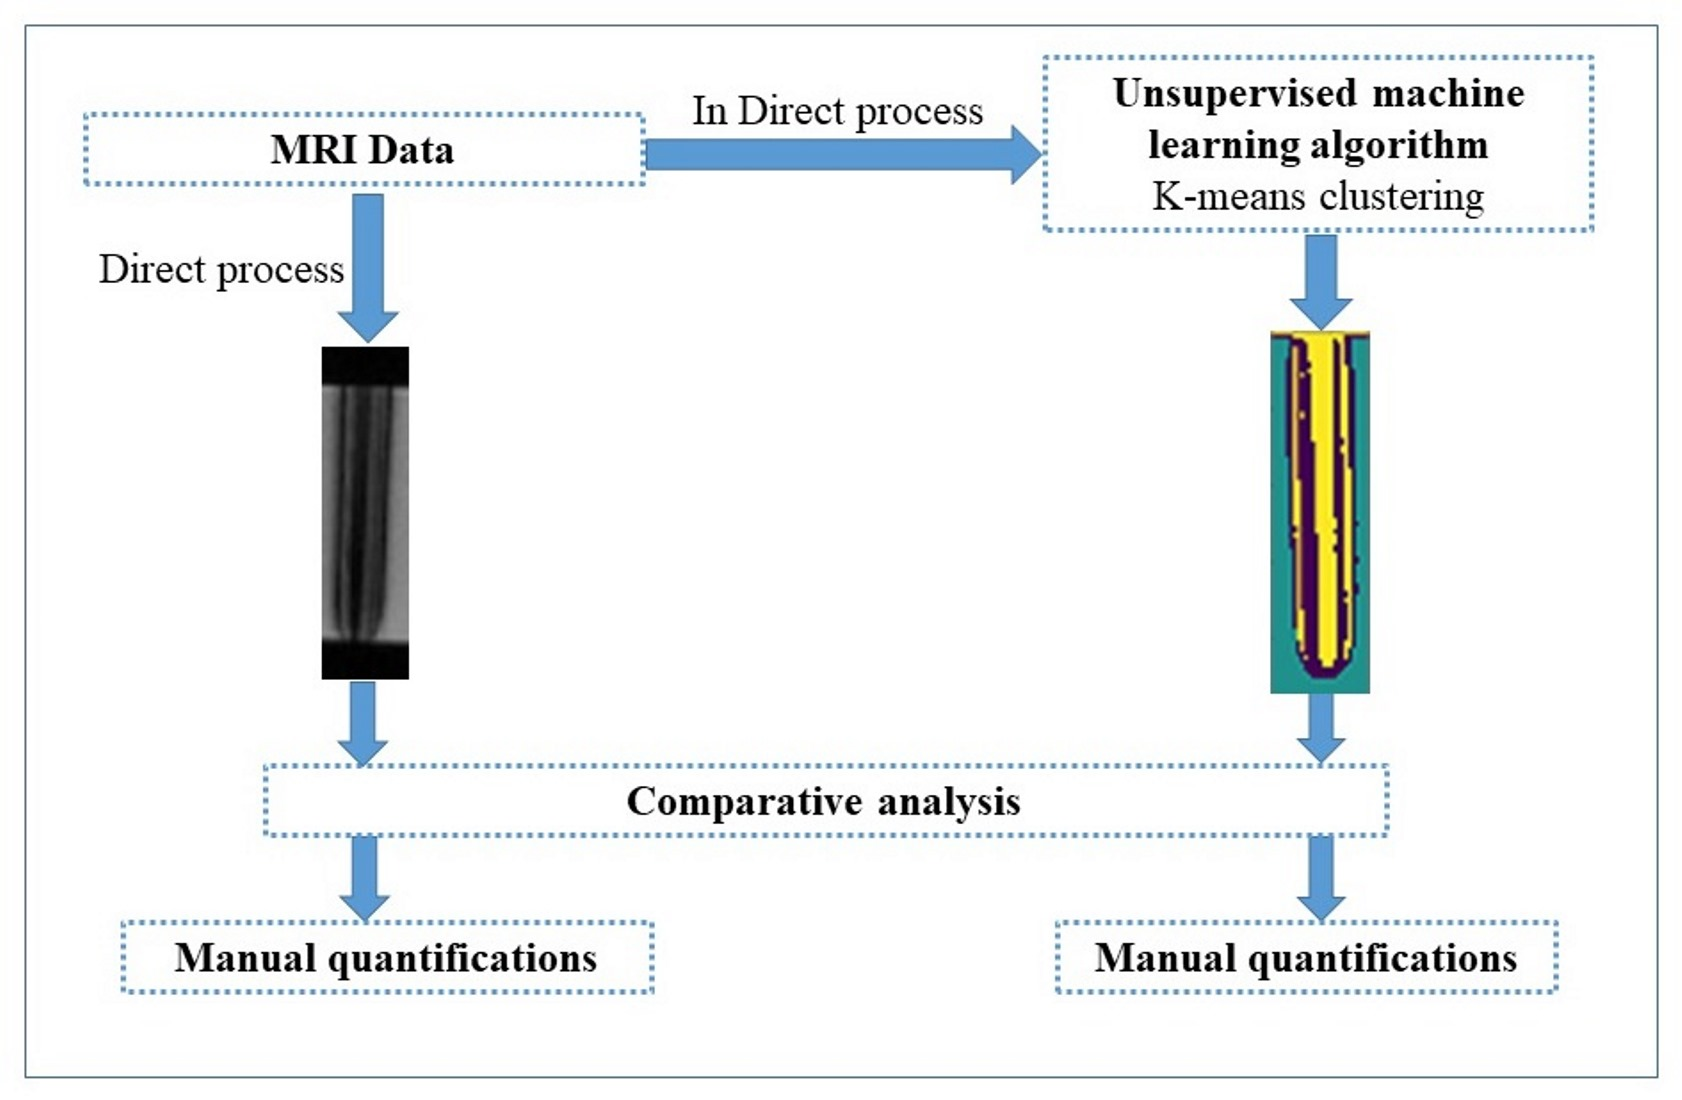
2. Materials and Methods

Figure 1 is a schematic representation of our proposed workflow for detecting and quantifying needle artifacts in MR images using two approaches: automatic quantification using K-means clustering and manual quantification. We began by fixing one NiTi needle and seven fabricated non-metallic needles in an acrylic glass filled with gelatin for MRI data acquisition. We fabricated seven needles based on fiber-bundle-reinforced composites made from different materials for the outer sheet and widths, as shown in Table 1. The needle fabrication concept was based on a multi-layer design to enhance the biopsy needle’s strength and stability and by taking into account the ISO standard requirements for spinal needle design (ISO7864:2016), which is in the range of 21–22 Gauge [35,36]. The fabrication process for the proposed needles was mentioned in detail in a previous publication [11]. However, Figure 2 shows the difference between the standard needles and the proposed needle from the structural perspective. The structure of the proposed needle was composed of an inner core, consisting of fiberglass (FG), a matrix glue, a shrinking tube, and a hard tip made of glass or NiTi. 3 × FG with an average diameter of 0.245 mm were inserted inside the Polyester shrinking tube. Then, a heated fan shrank the tube to create a single FB. After that, a 3 mm tip was made out of a glass rod (GR) with a diameter of 0.6 mm for the 6 needles, and the seventh one was made from 3 mm of NiTi with a diameter of 0.5 mm glued into the inner rod. Two needle tips were sharpened using an angled abrasive paper to achieve a simple Chiba cut. A group of polymeric outer sheet tubes was chosen considering MRI compatibility with two types of wall thicknesses (0.15 mm light wall LW, 0.25 mm thin wall TW) based on the American Wire Gauge (AWG). The dimensions of the outer sheets are listed in Table 1. The objective of selecting different outer sheet tubes was to explore their mechanical performance for these polymeric materials. The outer sheets were combined with the proposed inner cores, resulting in seven primary prototypes with a length of 10 cm labeled as L1, L2, L3, L5, L6, L7, and L8.

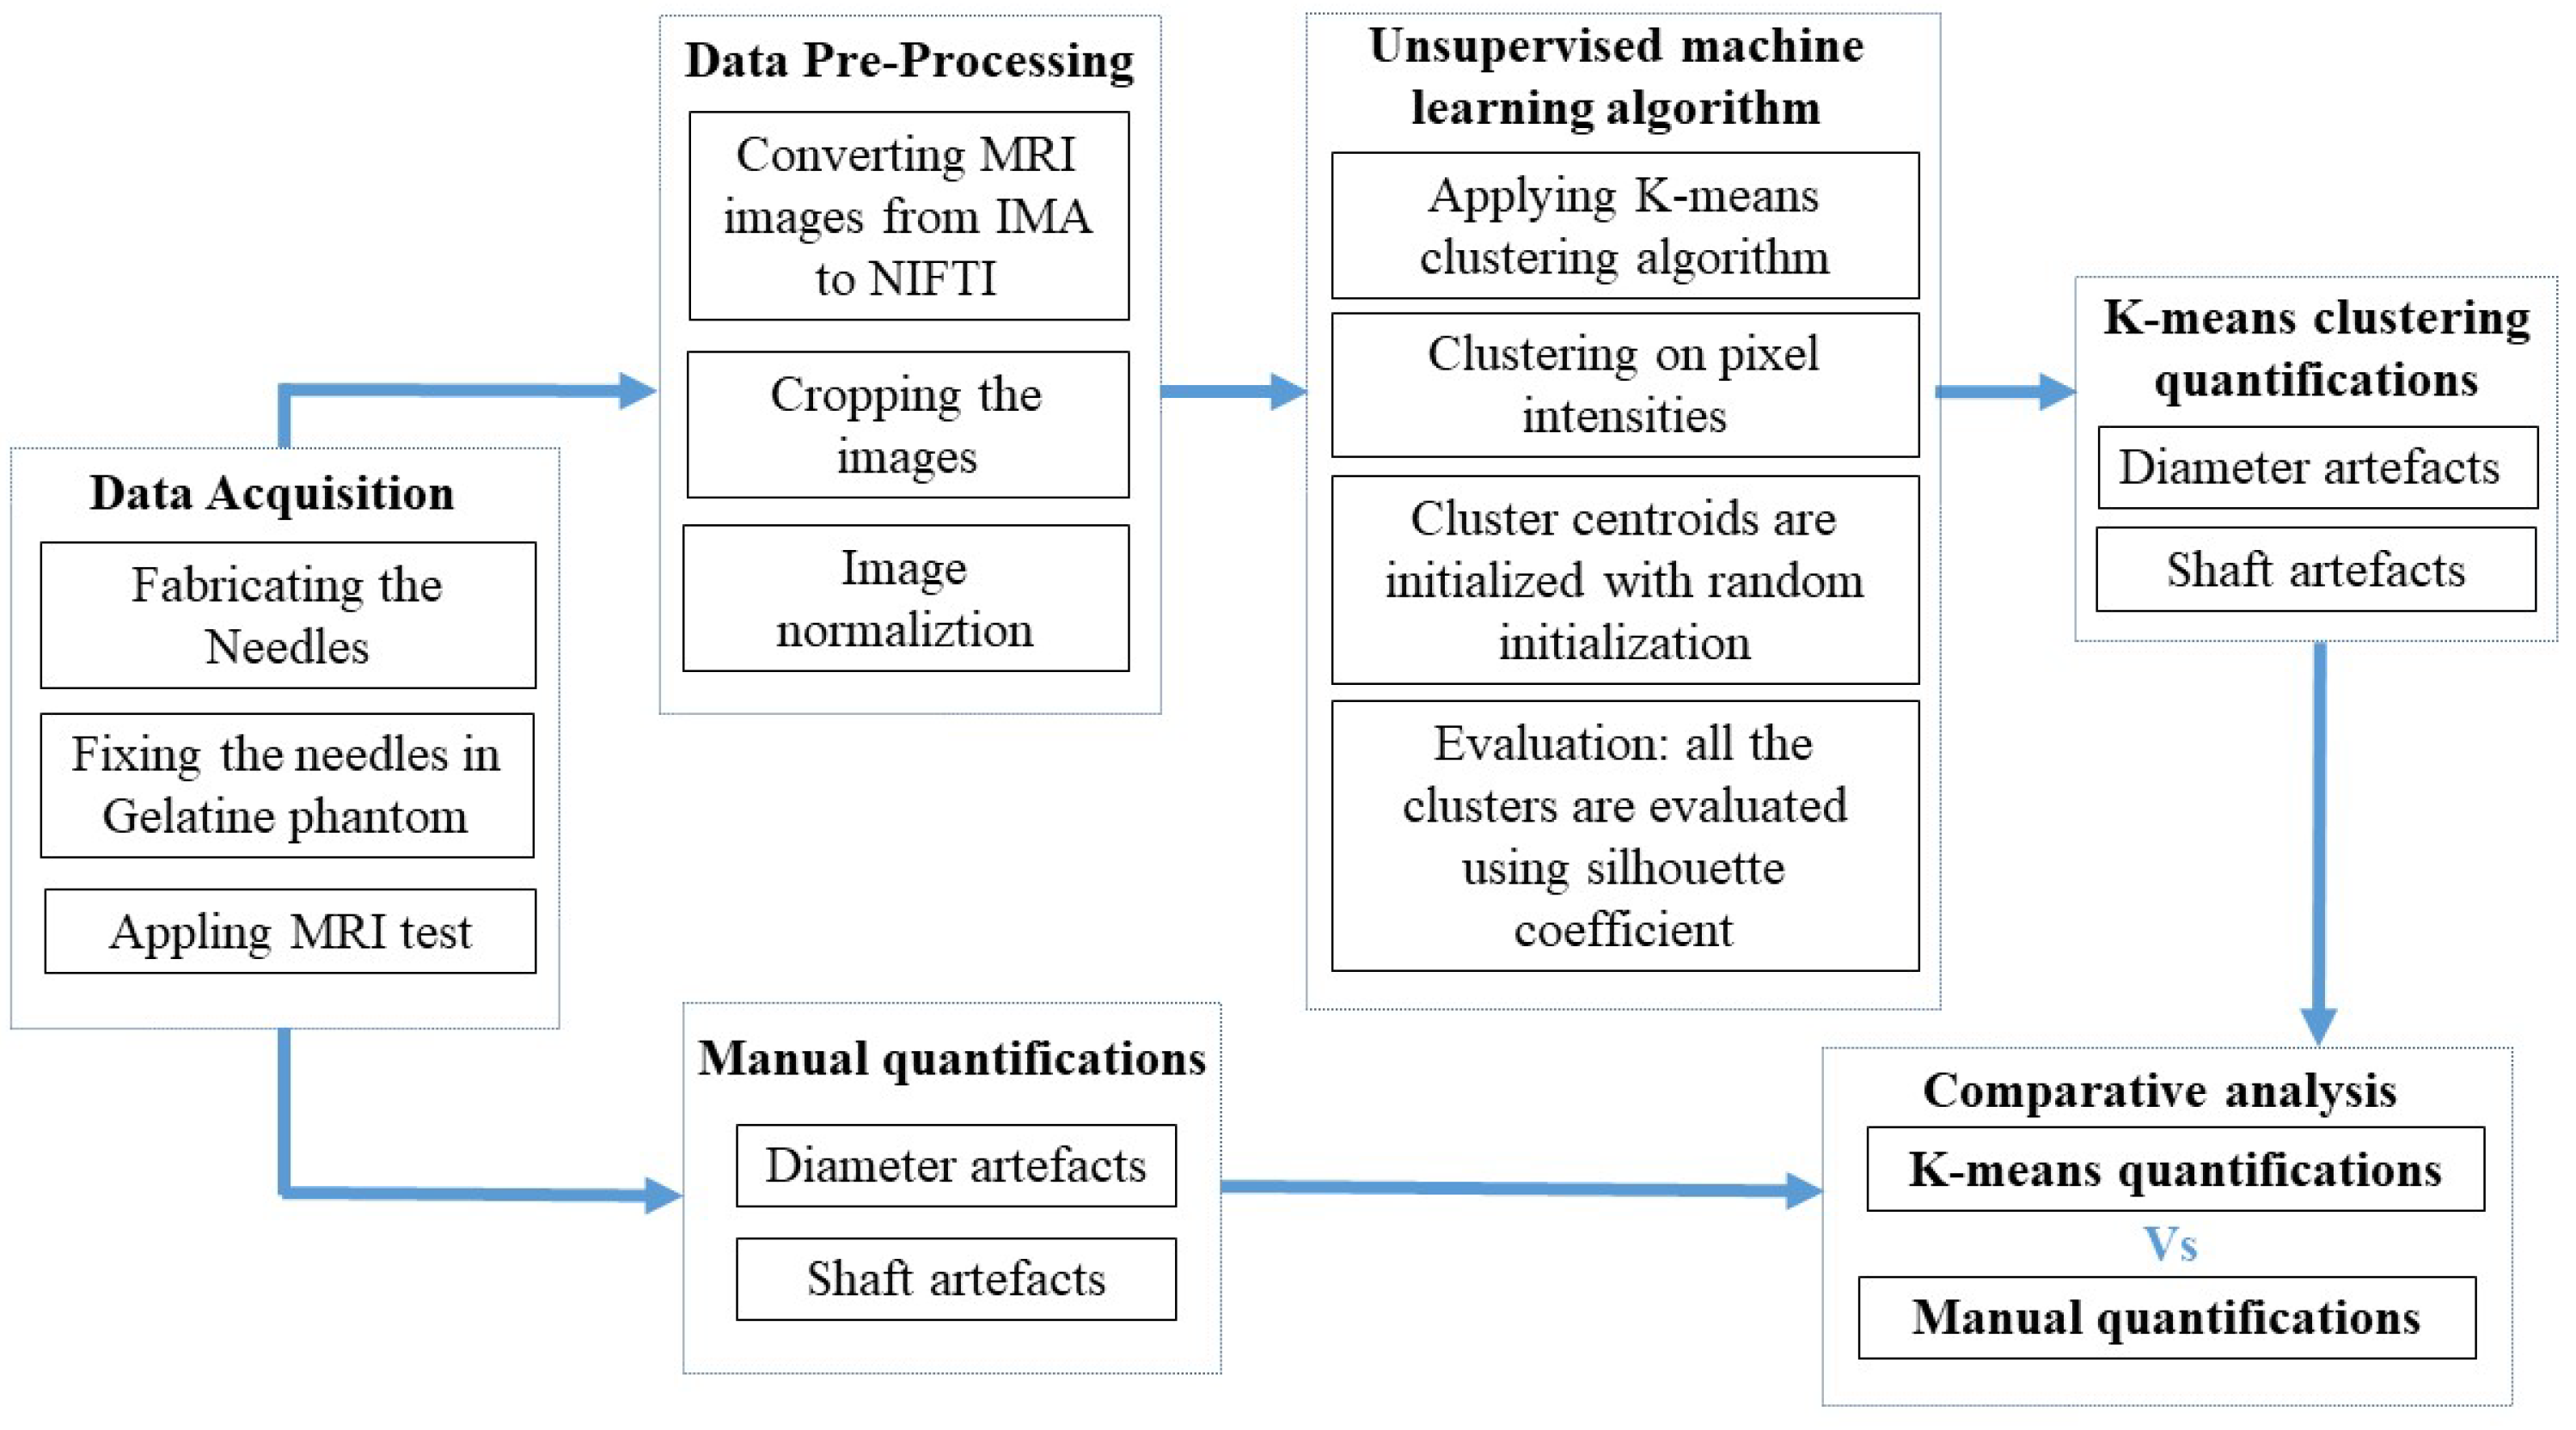
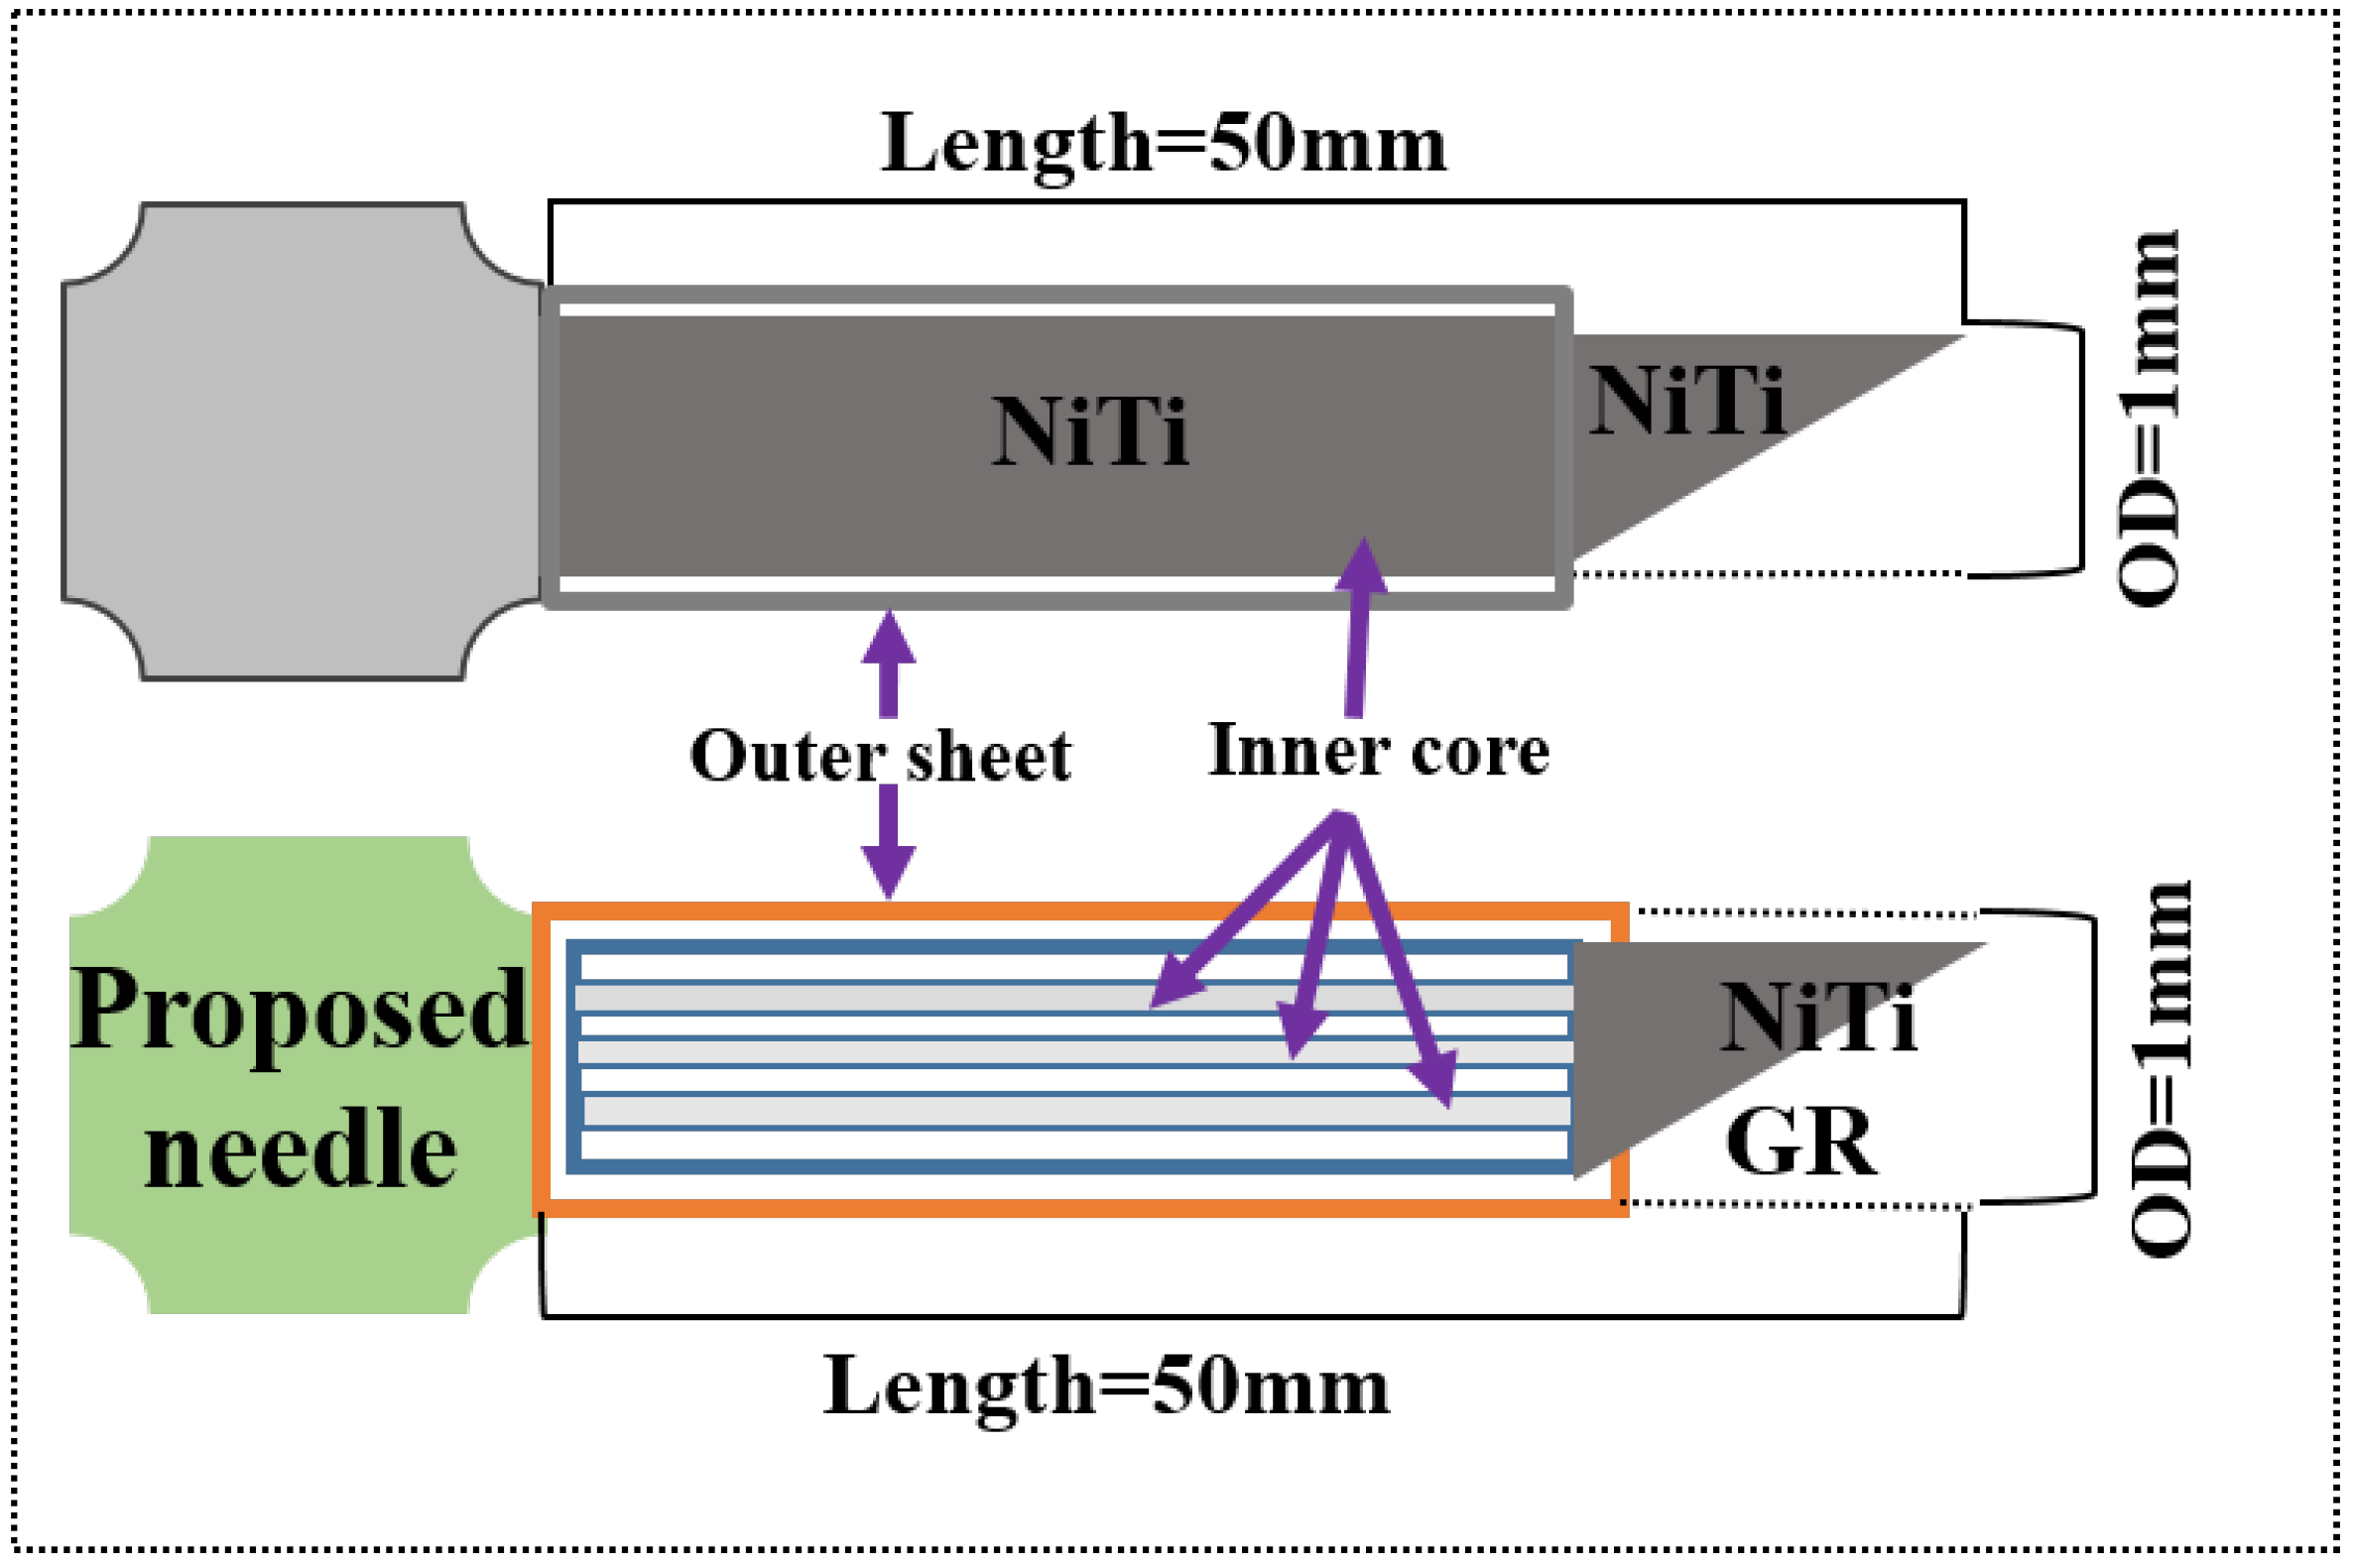
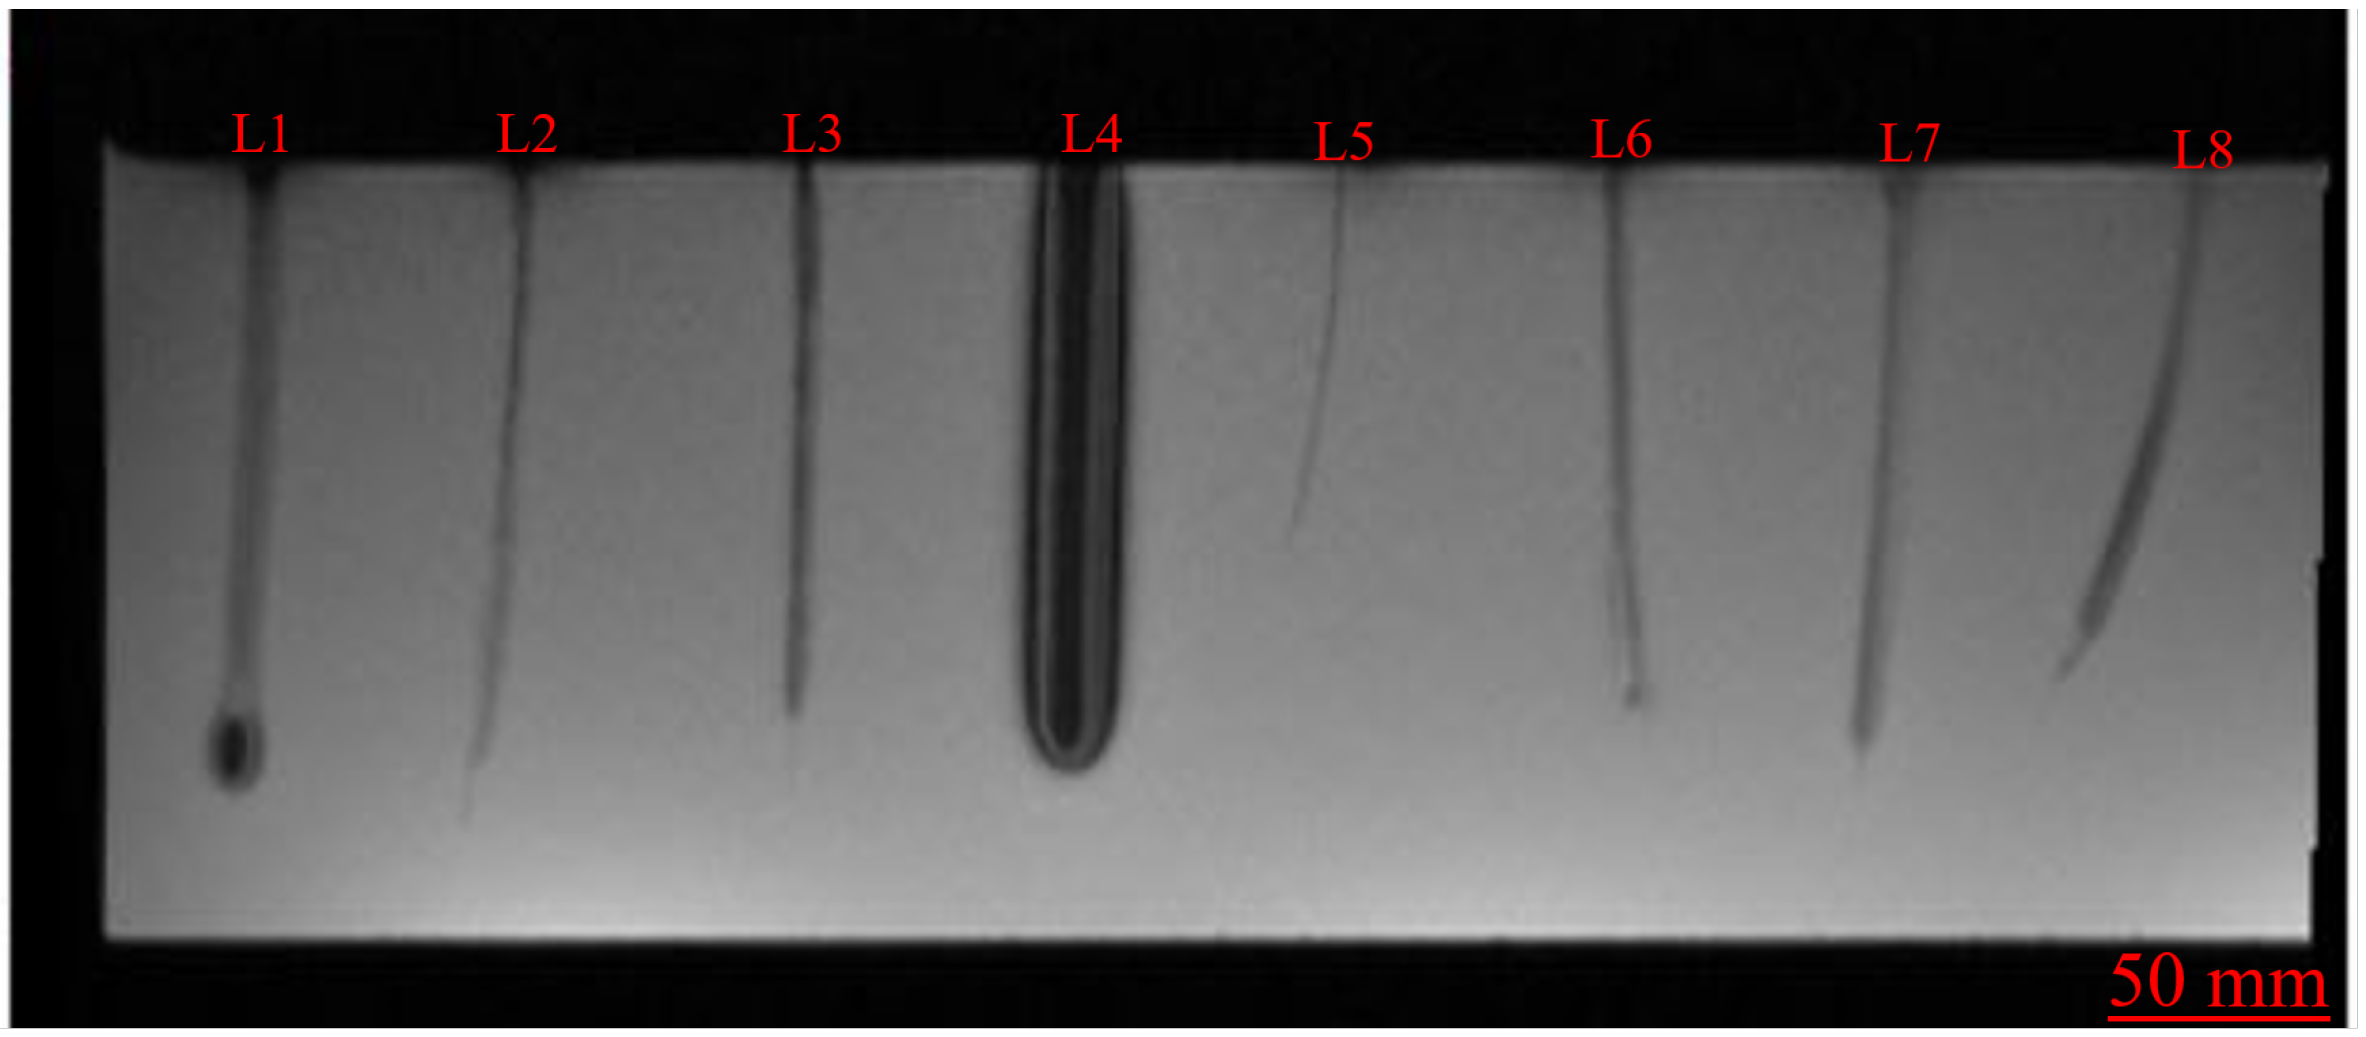
2.1. Data Acquisition

Before the data acquisition step, the needles should be fixed in the gelatin phantom. The use of the gelatin phantom allowed the researchers to simulate human tissue, standardize their experiments, reduce costs, and eliminate the need for animal or human testing [37,38]. In this work, a custom-made MRI phantom was made from gelatin powder called Paltin, reinst, 240 Bloom from Carl Roth GmbH (Germany) [38]. The phantom was prepared by mixing 300 g of gelatin in 1800 L hot water at a temperature of 70 °C. Hence, the mixture was left over the night, then the next day, the eight needles were fixated in an acrylic glass phantom filled with gelatin and subjected to a 3T MRI scan model (Skyra, Siemens, Germany). In the data acquisition step for the biopsy needles, several MRI parameters can contribute to the formation of artifacts in the resulting images. To minimize the appearance of these artifacts, the parameters were optimized in this study. Specifically, the MRI scan parameters were selected based on their ability to reduce the appearance of needle artifacts, resulting in optimal images. In this context, the optimal MRI scan parameters were found at a T1-weighted MRI sequence, which was selected to perform the scan due to better contrast, brightness, the well-distinguished needle border, and the distinct pixel values of the needles in the image. It was possible to obtain well-differentiated cluster regions (good-quality clusters) for the K-means algorithm since the clustering was performed based on pixel values. The image acquisition parameters used in this work to mimic an MRI intervention for the T1-weighted sequence were: a gradient-echo flash sequence, slice resolution = 1 mm, slice thickness = 7 mm, repetition time = 7 ms, echo time = 4.76 ms, magnetic field strength = 3, pixel bandwidth = 230, and field of view (FOV) = 244 × 244 mm. The needles in the resulting MR image were labeled from left to right as L1 to L8 to facilitate the quantification process of the artifacts. The proposed needles are L1–L3 and L5–L8, while the standard needle is stated as L4 in the middle of the MR image, which is shown in Figure 3. Moreover, all the proposed needles have a glass rod tip, except needle L1, which has a NiTi tip, as shown in Figure 3 as a small circular artifact.

2.2. Manual Quantification

In this step, the quantification of the artifacts was performed by importing the MR images into a DICOM viewer (RadiAnt DICOM, 2020.2.3). The manual evaluation was achieved by measuring the artifact width and length for each needle. The measurements and the uncertainty assessment for the eight needles were based on the mean ( X ¯ ) of three repetitive measurements of the data and the standard deviation (SD) [39].
The second quantification approach used in this study was based on unsupervised image processing using K-means clustering. Before applying the K-means clustering, the MR images were subjected to a preprocessing step, where the needle images were converted to the type of file format in neuroimaging called neuroimaging informatics technology initiative (NIFTI) format and then clustered based on pixel intensity [40]. Finally, a cropping step was applied to each needle, before the K-means clustering was applied. The clustering was computed by using the opencv and scikit-learn libraries in Python. For the dataset, random cluster centroid initialization was used, wherein the centroids are further refined over several iterations to obtain optimal clusters. Additionally, the K-means clustering includes a parameter to validate the quality of the cluster, which is called the silhouette coefficient [34], and based on the literature [35,36], the silhouette score can be utilized to measure the goodness of clustering for a different number of clusters (K) ranging from 3 to 7 in this study. Similar to the manual quantification approach described in this section, the width and shaft measurements were repeated for the clustered images to quantify the artifact appearance of the automatic approach.

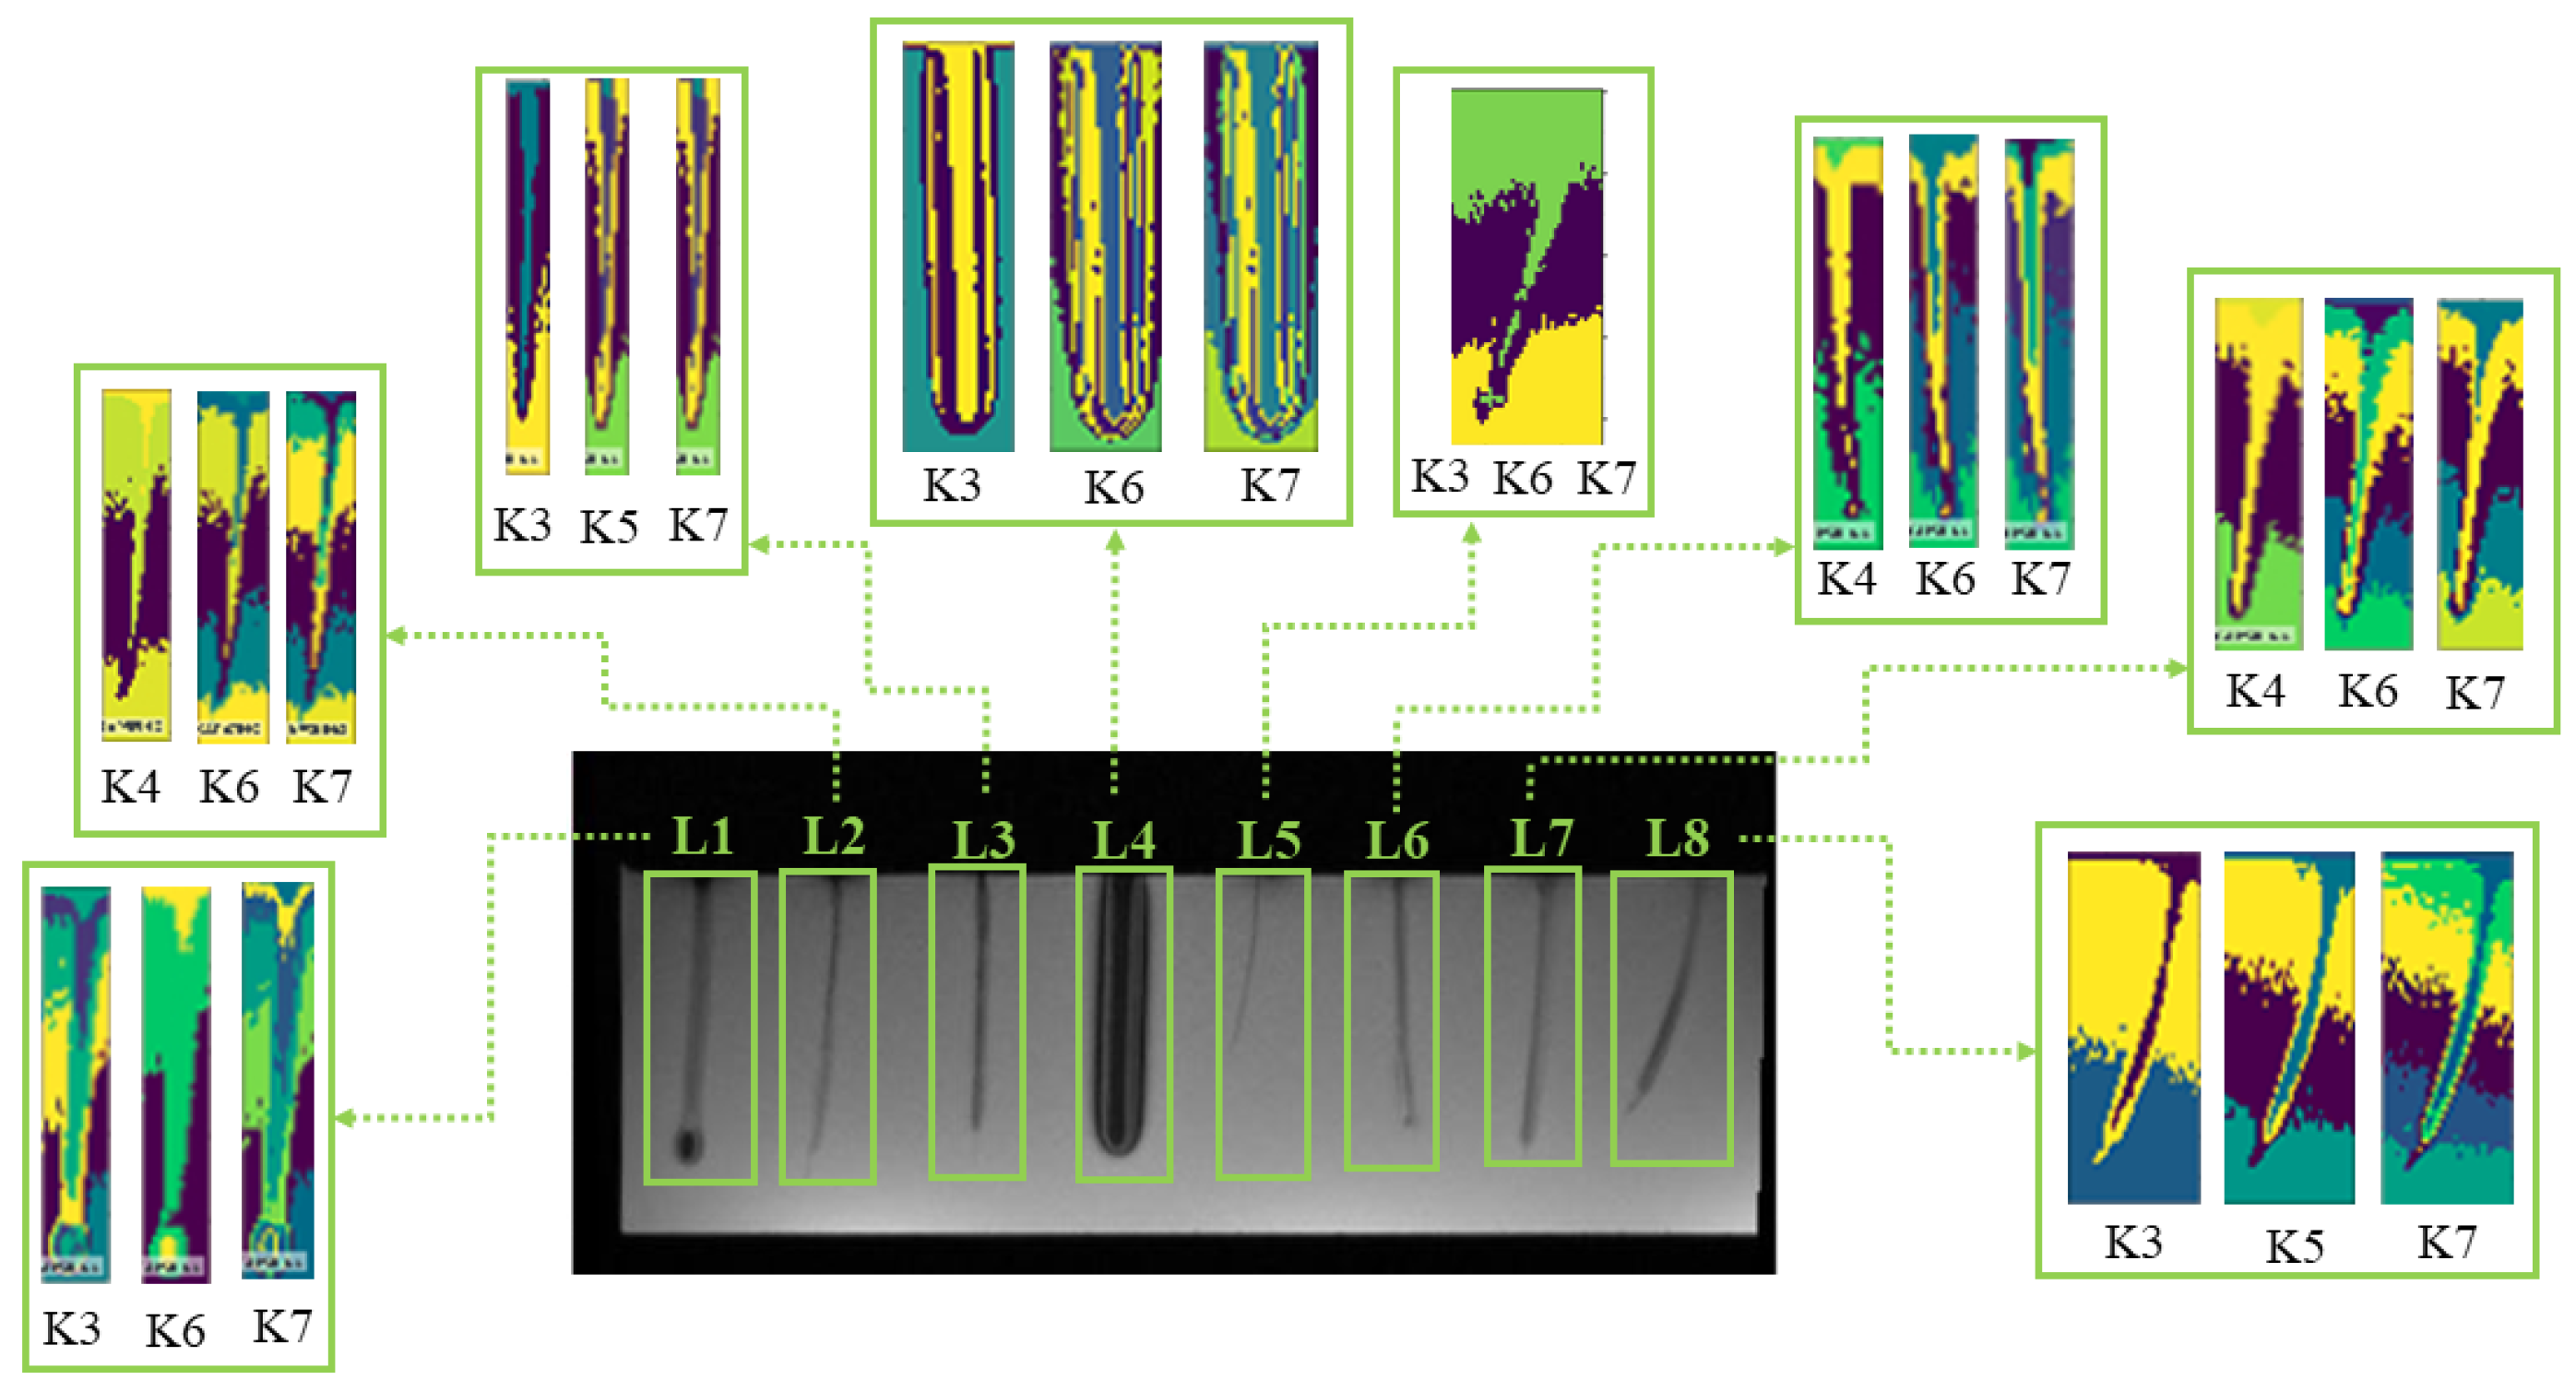
2.3. K-Means Quantification

The second quantification approach used in this study was based on unsupervised image processing using K-means clustering. Before applying the K-means clustering, the MR images were subjected to a preprocessing step, where the needle images were converted to the type of file format in neuroimaging called neuroimaging informatics technology initiative (NIFTI) format and then clustered based on pixel intensity [40]. Finally, a cropping step was applied to each needle, before the K-means clustering was applied. The clustering was computed by using the opencv and scikit-learn libraries in Python. For the dataset, random cluster centroid initialization was used, wherein the centroids were further refined over several iterations to obtain optimal clusters. Additionally, in this work, we compared the K-means results (width and shaft) for each needle with the original dimensions for each needle as a ground truth. Moreover, the K-means clustering includes a parameter to validate the quality of the cluster, which is called the silhouette coefficient [34,41]. Even without using the ground truth, and based on the literature [35,36,42], the silhouette score can be utilized to measure the goodness of clustering for a different number of clusters (K) ranging from 3 to 7 in this study. Similar to the manual quantification approach described in Section 2.2, the width and shaft measurements were repeated for the clustered images to quantify the artifact appearance in the automatic approach.

3. Results and Discussion

Generally, in this work, needle artifacts that appeared in the MRI image depended on the material composition and the alignment of each needle inside the gelatin phantom. In particular, from the qualitative perspective, the proposed non-metallic needles (L1, L2, L3, L5, L6, L7, L8) in Figure 3 showed remarkable improvement in reducing susceptibility artifacts compared to the standard NiTi needle L4, which generated massive artifacts. From a quantitative perspective, the artifacts were quantified after applying the K-means algorithm to the needles in the MRI image. The clustered images output are shown in Figure 4. The proposed non-metallic needles were labeled as L1, L2, L3, L5, L6, L7, and L8. while the NiTi needle was labeled as L4. Three cluster numbers were employed for each needle in the MRI image. The results’ assessment for each needle’s width and shaft is presented in the following section.

3.1. Artifacts Quantification: Needles’ Widths

The width quantification results for manual and K-means clusters that were applied to the eight needles are shown in Figure 5. The results included the uncertainty quantification for the artifact width of the eight needles. Therefore, Figure 5 has eight subfigures corresponding to each needle. Each subfigure shows a comparison of two quantifications in the form of the mean ( X ¯ ) of the data and the standard deviation (SD) for each needle measured in mm.
The manual measurements were made directly on the MR images presented in Figure 3 using the RadiAnt Dicom viewer, and the results are plotted as gray bars for each needle from L1 to L8 in Figure 5, while the width measurements for K-means clustered images are shown as light blue bars for each needle after applying different cluster numbers (K). Moreover, a red dotted reference line for each subfigure in Figure 5 was used as the ground truth to indicate the geometric needle width in mm. The K-means images were selected based on how the specified cluster number could detect the complete body of the proposed non-metallic needles and the standard needle. Additionally, the clustered image width dimensions achieved values close to the reference line for different numbers of clusters. For needle L2, the highest degree of similarity between the reference line and the width dimension obtained in the MRI was observed for the highest number of clusters with K = 7, whereas for needle L3, the closest match was observed for the lowest investigated cluster number K = 3. This indicates that no unique K-value achieved optimal performance in all of the investigated needles. It is essential to mention that the new proposed needle L1 recorded high susceptibility artifacts due to the NiTi structure attached as a tip to the needle shaft. However, as expected, the needle L4, which represents the standard NiTi needle, showed the highest artifacts in the width direction in both quantification approaches compared to the proposed non-metallic needles.

3.2. Artifacts’ Quantification: Needles’ Shafts

This section presents the results concerning the artifact shaft quantification for the same eight needles by applying the same approaches for artifact detection. Therefore, the results for quantifying the shafts of the artifact for MRI needles from L1 to L8 are shown in Figure 6. It includes uncertainty values of the eight needles based on the mean and standard deviation. The K-means approach achieved promising results close to the reference line in these measurements, as shown in Figure 6. The clustered image for the needle shafts obtained values close to the reference line for different numbers of clusters. The results showed that the highest cluster K = 7 reached close to the reference line in needles numbered L2, L5, L6, and L7. Besides, it was observed that the quantification results for the needle labeled as L8 were lower than the ground truth for the cluster numbers K = 5 and K = 7. This was due to the alignment and bending status of the needle in the gelatin phantom.

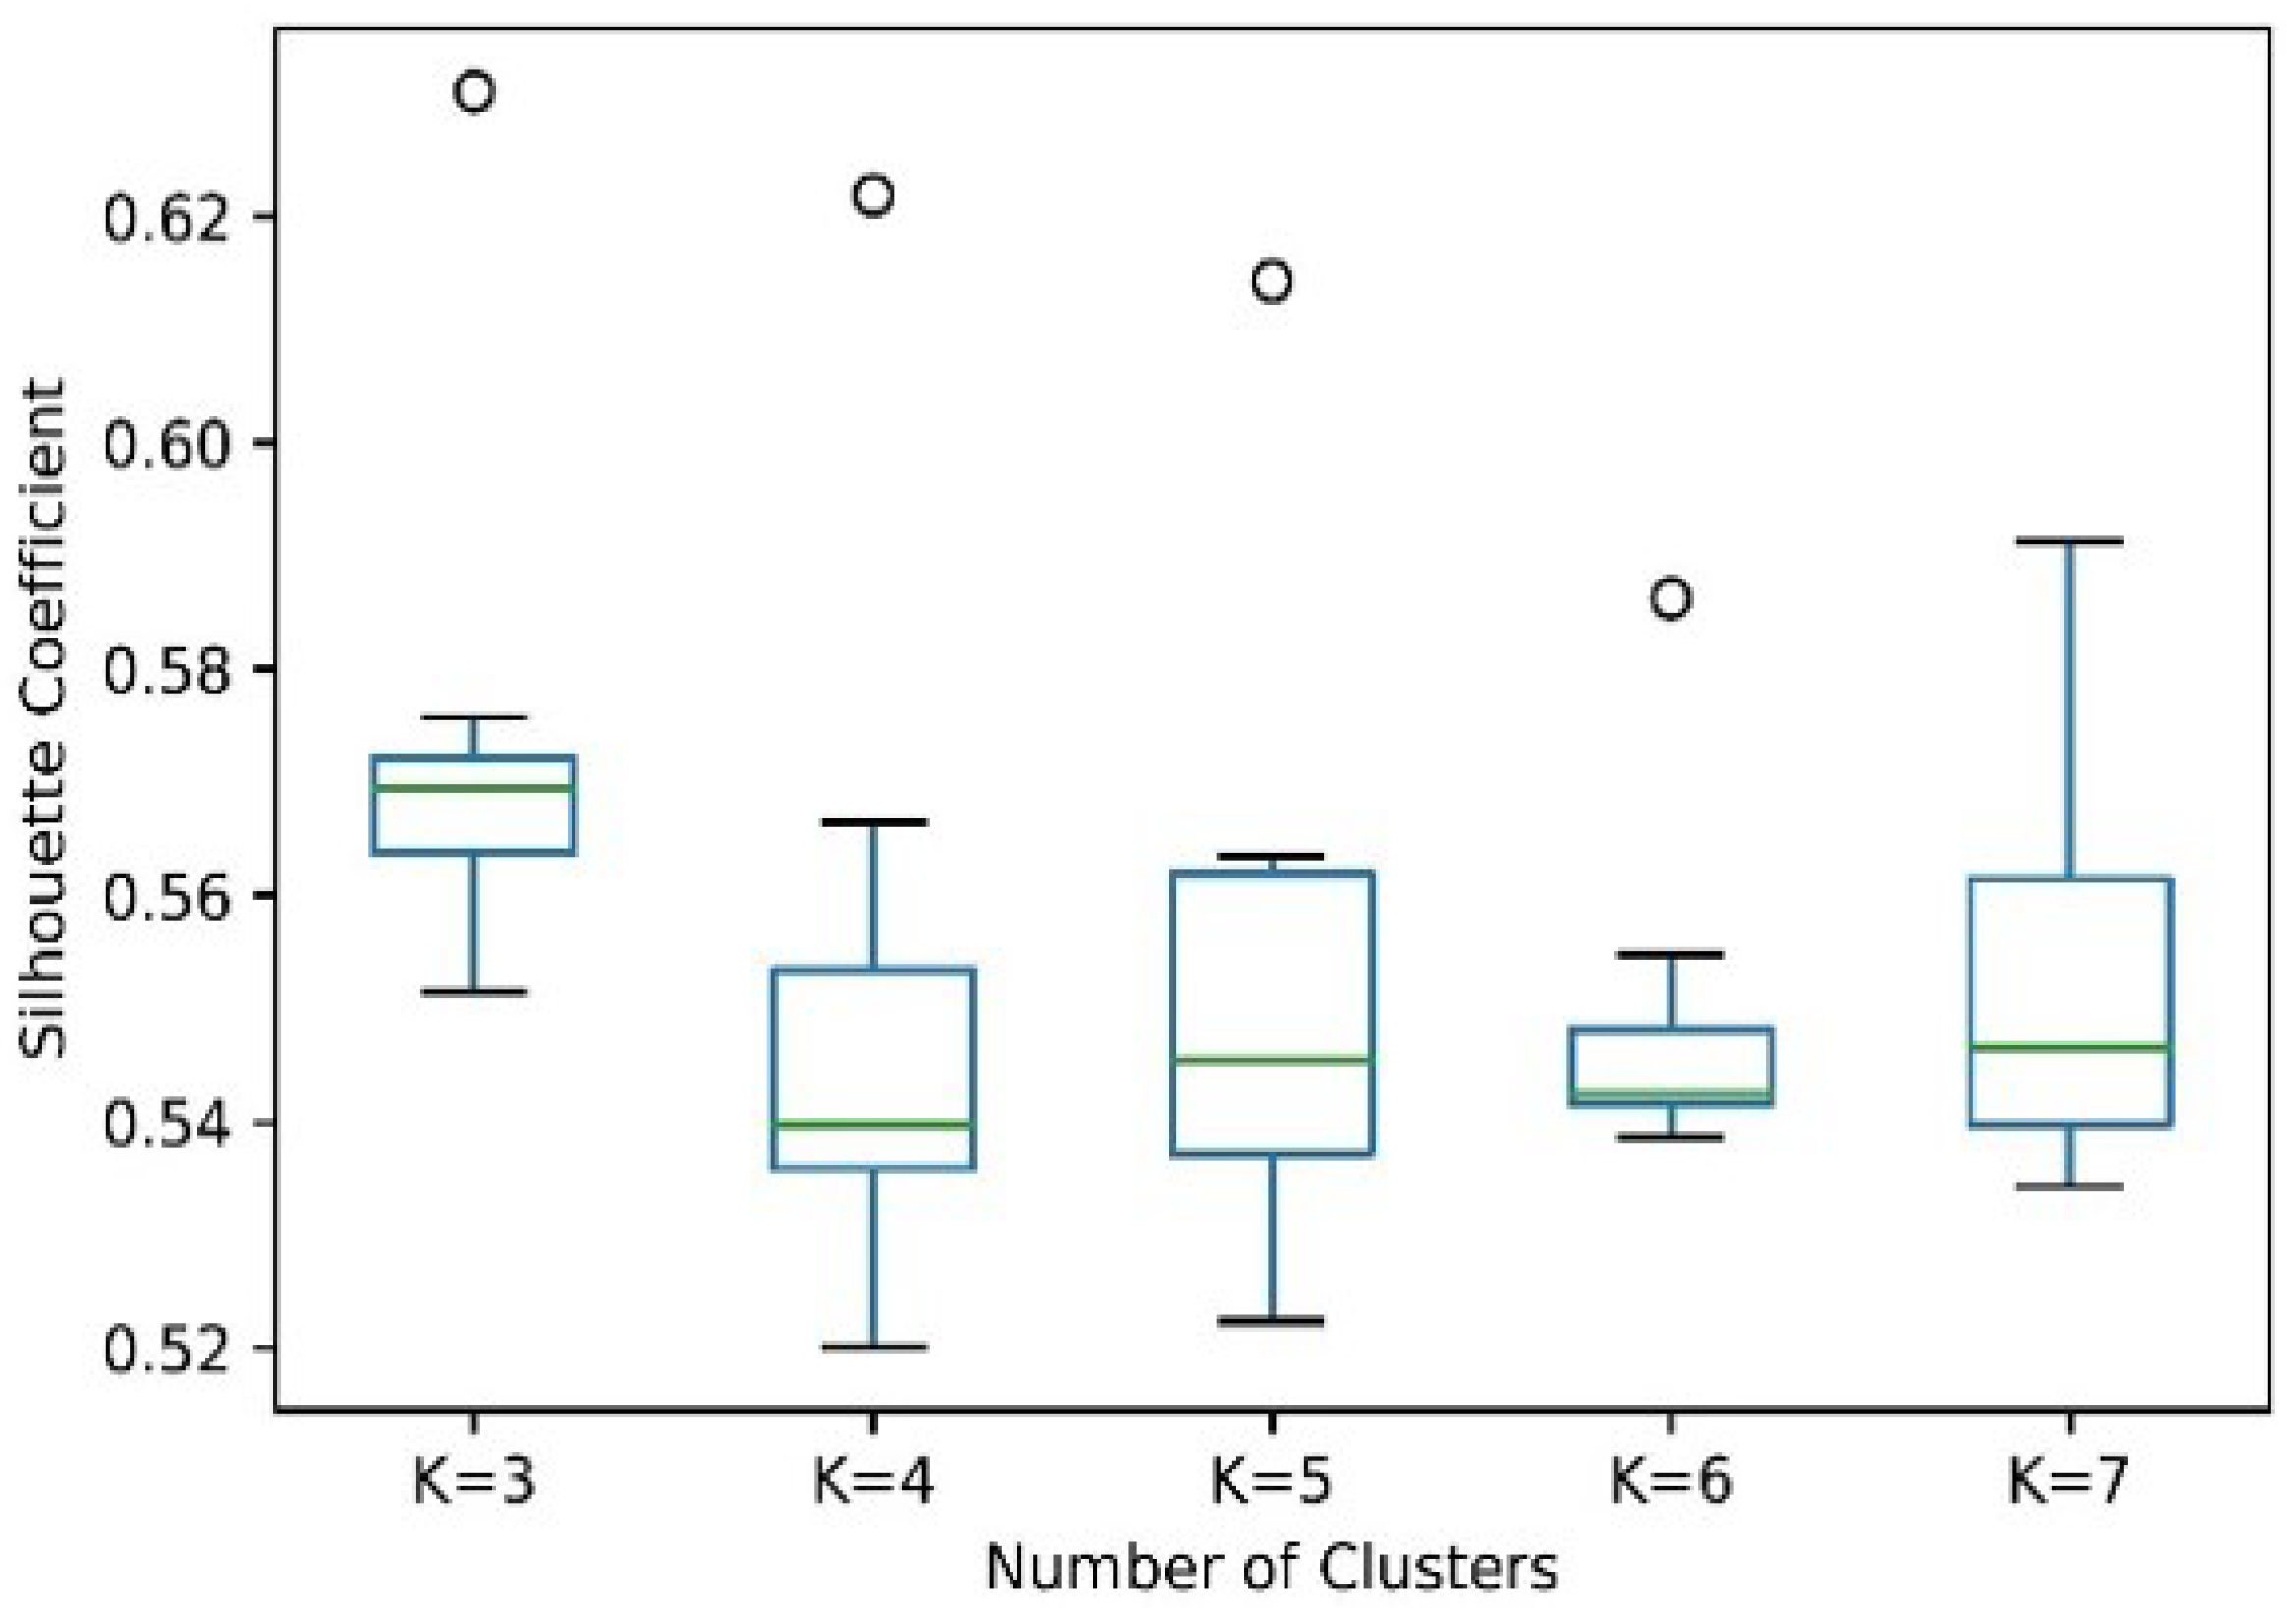
3.3. Cluster Validation: Silhouette Coefficient

From the quantification results and comparing with the reference line, the K-means cluster performed well in needle numbers L2 at K7, L3 at K3, and L5 at K6, while the K-means cluster for the needle shaft was at needle L2 at K7, L3 at K3, L5 at K7, and L7 at K6. In this work, the silhouette coefficient was used to calculate the accuracy of the K-means clustering approach [43,44]. The Silhouette coefficient is a metric utilized to detect the performance of a cluster measurement. It can point out which cluster number was able to detect the needle inside the group for the silhouette score and which cluster was considered as an outlier. In this work, the silhouette score function from the scikit-learn library was used to calculate the average silhouette score for each clustered image across all of its clusters. A silhouette coefficient close to 1 indicates a high cluster quality, whereas scores close to −1 indicate that the pixels have been assigned to the wrong clusters. The silhouette coefficient for each cluster number was measured and represented in the y-axis. In contrast, the x-axis represents the number of clusters from K = 3 to K = 7 applied across all non-metallic and standard needles. In our dataset, it was observed that most of the silhouette scores lied in the range of 0.52 to 0.72, which indicates the good quality of clusters, as illustrated in the boxplot in Figure 7. At K = 3, an outlier was observed at 0.63, and it was attributed to needle number L4, which was the standard NiTi needle. In addition, the outlier observed in K = 4, K = 5, and K = 6 also corresponded to the standard NiTi needle L4. In this work, according to the silhouette score criteria, a score closer to one is considered a more optimal cluster [45]. Following the boxplot in Figure 7, the highest median value was observed for the number of clusters K = 3. The silhouette coefficient for the standard NiTi needle appeared as an outlier for several investigated cluster numbers. Moreover, to validate the significance of our silhouette results, we compared them with already published literature of related studies that used the K-means clustering algorithm for images. Our silhouette scores were in the range of 0.52 to 0.72. The interpretation for this is that if the mean silhouette record is from (0.71–1.00), this indicates an excellent split for the cluster applied to the image. If the silhouette is from (0.51–0.70), this means a reasonable split for a cluster that is used in the image [45,46,47,48]. This demonstrates that the clustering algorithm was successful and able to detect the needles’ boundaries from the MRI images.

4. Conclusions

This study proposed a non-metallic concept for the fabrication and evaluation of biopsy needles for spinal cord applications that showed promising results in reducing susceptibility artifacts during MRI-guided interventions. Accordingly, the needles were evaluated based on their artifact performance in MR images using K-means clustering and compared with the manual approach using the geometric needle size as a reference line. Among the tested needles, L2 and L5 exhibited the lowest levels of artifact production even when subjected to bending (in the case of L5). The composition of needle L2 was the inner core from three fiber bundles and the outer sheet was from polytetrafluoroethylene (PTFE AWG 22) with an outer diameter of 1.00 mm and a thin wall thickness of 0.15 mm. Needle L5 was composed of three fiber bundles used as the inner core, and the outer sheet was polytetrafluoroethylene (PTFE AWG 22) with an outer diameter of 1.00 mm and a wall thickness of 0.25 mm. It is important to note that the K-means algorithm showed remarkable results for detecting the width and shaft of the eight needles in one group of MRI images, especially for the proposed non-metallic needles. This indicates that it is possible to use it as an efficient qualitative and quantitative assessment method for MRI artifacts. In addition, it provides comprehensive clustering capabilities with non-overlapping image features. The silhouette coefficient can indicate the efficiency of the used K-means cluster. Future work will apply the algorithm to medical MRI images in 3D mode, providing a manually selected sentry feature for the K-means and applying more cluster numbers to the MRI images. In addition, K-means will be implemented when the needle is captured inan individual scan of an MRI image. Moreover, based on our research, we recommend that other practitioners use clustering based on the MRI image pixel intensity of the needle instead of measuring the needle with a manual approach. In addition, the parameters of the K-means algorithm can be fine-tune to select the correct number of clusters that provide the most-accurate measurements.

Author Contributions

Conceptualization, M.A.-M. and M.F.; methodology, M.A.-M., M.F. and R.R.; software, M.F. and R.R.; validation, R.R.; formal analysis and investigation, M.A.-M. and M.F.; artifact, R.R.; writing—original draft preparation, M.A.-M.; writing—review and editing, M.A.-M., M.F. and C.H.; supervision, M.F. and C.H. All authors have read and agreed to the published version of the manuscript.

Funding

This study was not funded by any external sources.

Data Availability Statement

No datasets available.

Acknowledgments

The authors would like to express their gratitude to Cindy Lubeck and Janis Seibt from the Department of Biomedical Magnetic Resonance (BMMR), Otto-von-Guericke University Magdeburg, for their invaluable technical assistance in conducting the MRI scanning experiments in their lab. The authors also extend their thanks to Thomas Gerlach from Research Campus STIMULATE, Otto-von-Guericke University Magdeburg, for his support in this regard. Furthermore, the authors acknowledge the support provided by the INKA-Application Driven Research Institute, Faculty of Medicine, Otto-von-Guericke University Magdeburg, in providing the raw materials necessary for the fabrication process. Their contribution is greatly appreciated.

Conflicts of Interest

The authors declare no conflict of interest.

References

  1. Adam, G.; Bücker, A.; Nolte-Ernsting, C.; Tacke, J.; Günther, R.W. Interventional MR imaging: Percutaneous abdominal and skeletal biopsies and drainages of the abdomen. Eur. Radiol. 1999, 9, 1471–1478. [Google Scholar] [CrossRef] [PubMed]
  2. Kariniemi, J.; Blanco Sequeiros, R.; Ojala, R.; Tervonen, O. MRI-guided abdominal biopsy in a 0.23-T open-configuration MRI system. Eur. Radiol. 2005, 15, 1256–1262. [Google Scholar] [CrossRef] [PubMed]
  3. Bücker, A.; Adam, G.; Neuerburg, J.M.; Glowinski, A.; Tacke, J.; Günther, R.W. Interventional Magnetic Resonance Imaging—Non-Invasive Imaging for Interventions. Rofo Fortschr. Auf Dem Geb. Der Rontgenstrahlen Und Der Nukl. 2000, 172, 105–114. [Google Scholar] [CrossRef] [PubMed]
  4. Frahm, C.; Gehl, H.-B.; Melchert, U.H.; Weiss, H.-D. Visualization of magnetic resonance-compatible needles at 1.5 and 0.2 Tesla. Cardiovasc. Interv. Radiol. 1996, 19, 335–340. [Google Scholar] [CrossRef]
  5. Zangos, S.; Kiefl, D.; Eichler, K.; Engelmann, K.; Heller, M.; Herzog, C.; Mack, M.G.; Jacobi, V.; Vogl, T.J. MR-guided biopsies of undetermined liver lesions: Technique and results. Rofo Fortschr. Auf Dem Geb. Der Rontgenstrahlen Und Der Nukl. 2003, 175, 688–694. [Google Scholar] [CrossRef]
  6. Fritz, J.; Thomas, C.; Clasen, S.; Claussen, C.D.; Lewin, J.S.; Pereira, P.L. Freehand real-time MRI-guided lumbar spinal injection procedures at 1.5 T: Feasibility, accuracy, and safety. Am. J. Roentgenol. 2009, 192, W161–W167. [Google Scholar] [CrossRef]
  7. Quick, H.H. Mr-compatible instruments for interventional mri. In Interventional Magnetic Resonance Imaging; Springer: Berlin/Heidelberg, Germany, 2011; pp. 35–51. [Google Scholar]
  8. Genant, J.W.; Vandevenne, J.E.; Bergman, A.G.; Beaulieu, C.F.; Kee, S.T.; Norbash, A.M.; Lang, P. Interventional Musculoskeletal Procedures Performed by Using MR Imaging Guidance with a Vertically Open MR Unit: Assessment of Techniques and Applicability. Radiology 2002, 223, 127–136. [Google Scholar] [CrossRef] [PubMed]
  9. Tehranzadeh, J.; Tao, C.; Browning, C.A. Percutaneous needle biopsy of the spine. Acta Radiol. 2007, 48, 860–868. [Google Scholar] [CrossRef] [PubMed]
  10. Kaiser, M.; Detert, M.; Rube, M.A.; El-Tahir, A.; Elle, O.J.; Melzer, A.; Schmidt, B.; Rose, G.H. Resonant marker design and fabrication techniques for device visualization during interventional magnetic resonance imaging. Biomed. Eng./Biomed. Tech. 2015, 60, 89–103. [Google Scholar] [CrossRef]
  11. Al-Maatoq, M.; Boese, A.; Henke, H.W.; Friebe, M. Primary Design Concept for Non-metallic Needle for MRI Guided Spinal Applications. In Proceedings of the 2019 41st Annual International Conference of the IEEE Engineering in Medicine and Biology Society (EMBC), Berlin, Germany, 23–27 July 2019; pp. 1994–1997. [Google Scholar]
  12. Matsui, Y.; Sakurai, J.; Hiraki, T.; Okamoto, S.; Iguchi, T.; Tomita, K.; Uka, M.; Gobara, H.; Kanazawa, S. MRI-guided percutaneous needle biopsy with 1.2 T open MRI: Study protocol for a prospective feasibility study (SCIRO-1701). Nagoya J. Med Sci. 2019, 81, 463. [Google Scholar]
  13. Garnon, J.; Ramamurthy, N.; Caudrelier, J.J.; Erceg, G.; Breton, E.; Tsoumakidou, G.; Rao, P.; Gangi, A. MRI-Guided Percutaneous Biopsy of Mediastinal Masses Using a Large Bore Magnet: Technical Feasibility. Cardiovasc. Interv. Radiol. 2015, 39, 761–767. [Google Scholar] [CrossRef] [PubMed]
  14. Gehl, H.B.; Frahm, C.; Melchert, U.H.; Weiss, H.D. Suitability of different MR-compatible needle and magnet designs for MR-guided punctures. In Proceedings of the SMR 3rd Annual Meeting, Nice, France, 19–25 August 1995; Volume 1156. [Google Scholar]
  15. Lenz, G.; Dewey, C. Study of new Titanium alloy needles for interventional MRI procedures. In Proceedings of the SMR 3rd Annual Meeting, Paris, France, 18–22 August 1995; Volume 1159. [Google Scholar]
  16. Al-Maatoq, M.; Krug, J.W.; Friebe, M.H. The tip is the key-rfa needle modification using peek for reduced susceptibility artifact in mri. In Proceedings of the Conference of the International Society for Medical Innovation and Technology, (SMIT), Delft, The Netherlands, 5–8 October 2016. [Google Scholar]
  17. Fantini, I.; Rittner, L.; Yasuda, C.; Lotufo, R. Automatic detection of motion artifacts on MRI using Deep CNN. In Proceedings of the 2018 International Workshop on Pattern Recognition in Neuroimaging (PRNI), Singapore, 2–14 June 2018; pp. 1–4. [Google Scholar]
  18. Ladd, M.E.; Erhart, P.; Debatin, J.F.; Romanowski, B.J.; Boesiger, P.; McKinnon, G.C. Biopsy needle susceptibility artifacts. Magn. Reson. Med. 1996, 36, 646–651. [Google Scholar] [CrossRef]
  19. Lewin, J.S.; Duerk, J.L.; Haaga, J.R. Needle localization in MR guided therapy: Effect of field strength, sequence design, and magnetic field orientation. In Proceedings of the SMR 3rd Annual Meeting, Nice, France, 19–25 August 1995; Volume 1155. [Google Scholar]
  20. Penzkofer, T.; Peykan, N.; Schmidt, K.; Krombach, G.; Kuhl, C.K. How MRI compatible is “MRI compatible”? A systematic comparison of artifacts caused by biopsy needles at 3.0 and 1.5 T. Cardiovasc. Interv. Radiol. 2013, 36, 1646–1657. [Google Scholar] [CrossRef] [PubMed]
  21. Holton, A.; Walsh, E.; Anayiotos, A.; Pohost, G.; Venugopalan, R. Comparative mri compatibility of 316l stainless steel alloy and nickel–titanium alloy stents: Original article technical. J. Cardiovasc. Magn. Reson. 2002, 4, 423–430. [Google Scholar] [CrossRef] [PubMed]
  22. Laurent, A. Materials and biomaterials for interventional radiology. Biomed. Pharmacother. 1998, 52, 76–88. [Google Scholar] [CrossRef] [PubMed]
  23. Song, S.-E.; Cho, N.B.; Iordachita, I.I.; Guion, P.; Fichtinger, G.; Whitcomb, L.L. A study of needle image artifact localization in confirmation imaging of MRI-guided robotic prostate biopsy. In Proceedings of the 2011 IEEE International Conference on Robotics and Automation, Shanghai, China, 9–13 May 2011. [Google Scholar] [CrossRef] [Green Version]
  24. Alamooti, H.Y.; Ganji, Y.; Farimani, F.S.; Rostami, M. Primary design of MRI compatible needle for the purpose of soft tissue insertion. In Proceedings of the 2010 17th Iranian Conference of Biomedical Engineering (ICBME), Isfahan, Iran, 3–4 November 2010; pp. 1–4. [Google Scholar] [CrossRef]
  25. Mehrtash, A.; Ghafoorian, M.; Pernelle, G.; Ziaei, A.; Heslinga, F.G.; Tuncali, K.; Fedorov, A.; Kikinis, R.; Tempany, C.M.; Wells, W.M.; et al. Automatic Needle Segmentation and Localization in MRI With 3-D Convolutional Neural Networks: Application to MRI-Targeted Prostate Biopsy. IEEE Trans. Med Imaging 2018, 38, 1026–1036. [Google Scholar] [CrossRef]
  26. Liao, W.; Deserno, T.M.; Spitzer, K. Evaluation of free non-diagnostic DICOM software tools. Medical Imaging 2008: PACS and Imaging Informatics. Proc. SPIE 2008, 6919, 11–22. [Google Scholar] [CrossRef]
  27. Illanes, A.; Krug, J.W.; Friebe, M. Assessing MRI susceptibility artefact through an indicator of image distortion. Curr. Dir. Biomed. Eng. 2016, 2, 427–431. [Google Scholar] [CrossRef] [Green Version]
  28. Dhankhar, S.; Tyagi, S.; Prasad, T. Brain MRI segmentation using K-means algorithm. In Proceedings of the National Conference on Advances in Knowledge Management, Kerala, India, 21–22 December 2010; pp. 1–5. [Google Scholar]
  29. Chen, Z.; Yu, H.; Chen, H. Research on K-means clustering segmentation method for MRI brain image based on selecting multi-peaks in gray histogram. J. Biomed. Eng. 2013, 30, 1164–1170. [Google Scholar]
  30. Lee, S.H.; Kim, J.H.; Kim, K.G.; Park, S.J.; Moon, W.K. K-means clustering approach for kinetic pattern analysis of dynamic contrast enhancement breast MRI. APAMI 2006, 2006, 336. [Google Scholar]
  31. Allman, D.; Reiter, A.; Bell, M.A.L. A machine learning method to identify and remove reflection artifacts in photoacoustic channel data. In Proceedings of the 2017 IEEE International Ultrasonics Symposium (IUS), Washington, DC, USA, 6–9 September 2017; pp. 1–4. [Google Scholar]
  32. Pourtaherian, A. Robust Needle Detection and Visualization for 3D Ultrasound Image-Guided Interventions; Technische Universiteit Eindhoven: Eindhoven, The Netherlands, 2018. [Google Scholar]
  33. Song, S.-E.; Cho, N.B.; Iordachita, I.I.; Guion, P.; Fichtinger, G.; Kaushal, A.; Camphausen, K.; Whitcomb, L.L. Biopsy Needle Artifact Localization in MRI-Guided Robotic Transrectal Prostate Intervention. IEEE Trans. Biomed. Eng. 2012, 59, 1902–1911. [Google Scholar] [CrossRef] [PubMed] [Green Version]
  34. Understanding K-Means Clustering in Machine Learning. Available online: https://towardsdatascience.com/understanding-k-means-clustering-in-machine-learning-6a6e67336aa1 (accessed on 23 December 2022).
  35. Calthorpe, N. The history of spinal needles: Getting to the point. Anaesthesia 2004, 59, 1231–1241. [Google Scholar] [CrossRef] [PubMed]
  36. Ahn, W.-S.; Bahk, J.-H.; Lim, Y.-J.; Kim, Y.-C. The effect of introducer gauge, design and bevel direction on the deflection of spinal needles. Anaesthesia 2002, 57, 1007–1011. [Google Scholar] [CrossRef] [PubMed]
  37. Damianou, C. The role of phantoms in magnetic resonance imaging-guided focused ultrasound surgery. Digit. Med. 2019, 5, 52. [Google Scholar] [CrossRef]
  38. Farrer, A.I.; Odéen, H.; de Bever, J.; Coats, B.; Parker, D.L.; Payne, A.; Christensen, D.A. Characterization and evaluation of tissue-mimicking gelatin phantoms for use with MRgFUS. J. Ther. Ultrasound 2015, 3, 9. [Google Scholar] [CrossRef] [Green Version]
  39. Küçükkülahli, E.; Erdoğmuş, P.; Polat, K. Brain MRI segmentation based on different clustering algorithms. Int. J. Comput. Appl. 2016, 155, 37–40. [Google Scholar] [CrossRef]
  40. Dubey, S.R.; Dixit, P.; Singh, N.; Gupta, J.P. Infected Fruit Part Detection using K-Means Clustering Segmentation Technique. Int. J. Interact. Multimed. Artif. Intell. 2013, 2, 65. [Google Scholar] [CrossRef] [Green Version]
  41. Wang, F.; Franco-Penya, H.-H.; Kelleher, J.D.; Pugh, J.; Ross, R. An analysis of the application of simplified silhouette to the evaluation of k-means clustering validity. In Machine Learning and Data Mining in Pattern Recognition, MLDM 2017; Springer: Cham, Switzerland, 2017; pp. 291–305. [Google Scholar]
  42. Dhanachandra, N.; Manglem, K.; Chanu, Y.J. Image Segmentation Using K -means Clustering Algorithm and Subtractive Clustering Algorithm. Procedia Comput. Sci. 2015, 54, 764–771. [Google Scholar] [CrossRef] [Green Version]
  43. Mamat, A.R.; Mohamed, F.S.; Mohamed, M.A.; Rawi, N.M.; Awang, M.K. Silhouette index for determining optimal k-means clustering on images in different color models. Int. J. Eng. Technol. 2018, 7, 105–109. [Google Scholar] [CrossRef] [Green Version]
  44. Dinh, D.-T.; Fujinami, T.; Huynh, V.-N. Estimating the optimal number of clusters in categorical data clustering by silhouette coefficient. In Knowledge and Systems Sciences, KSS 2019; Springer: Singapore, 2019; pp. 1–17. [Google Scholar]
  45. Burney, S.M.A.; Tariq, H. K-means cluster analysis for image segmentation. Int. J. Comput. Appl. 2014, 96, 1–8. [Google Scholar] [CrossRef]
  46. Ahmed, M.; Seraj, R.; Islam, S.M.S. The k-means Algorithm: A Comprehensive Survey and Performance Evaluation. Electronics 2020, 9, 1295. [Google Scholar] [CrossRef]
  47. Arbelaitz, O.; Gurrutxaga, I.; Muguerza, J.; Pérez, J.M.; Perona, I. An extensive comparative study of cluster validity indices. Pattern Recognit. 2013, 46, 243–256. [Google Scholar] [CrossRef]
  48. Naveen, A.; Velmurugan, T. Identification of Calcification in MRI Brain Images by k-Means Algorithm. Indian J. Sci. Technol. 2015, 8, 1–7. [Google Scholar] [CrossRef]
Figure 1. Proposed workflow for detecting and quantifying the needle artifacts from the MR images using two approaches: automatic quantification using K-means clustering and manual quantification.
Magnetochemistry 09 00079 g001
Figure 2. Present longitudinal section for the needle structures used in this work, standard needle and proposed needle.
Magnetochemistry 09 00079 g002
Figure 3. MRI scan for the needles inside the gelatin phantom labeled from L1 to L8 with a magnification scale of 50 mm.
Magnetochemistry 09 00079 g003
Figure 4. Clustered images for the 8 needles from the MR image; non-metallic needles labeled as L1, L2, L3, L5, L6, L7, and L8, while the NiTi needle labeled as L4 using cluster range from (K3 to K7).
Magnetochemistry 09 00079 g004
Figure 5. Results of the comparison of the width of the artifact in mm between manual quantification and K-means quantification; the manual quantification is represented by the gray color bars from L1 to L8, while K-means cluster quantification is represented by the light blue bars. The x-axis represents the manual and the K-means clusters that have been applied to the needles. Meanwhile, the y-axis corresponds to the values of the artifacts for the width measurements in mm. The reference line mapped to standard needle width used as the ground truth corresponds to 1 mm.
Magnetochemistry 09 00079 g005
Figure 6. Results of the comparison of the artifacts’ shafts in mm between manual quantification and K-means cluster quantification; the manual quantification is represented in the gray color bars from L1 to L8, while K-means cluster quantification is represented by the light blue bars. The x-axis represents the manual and K-means clusters that were applied to the needles. Meanwhile, the y-axis corresponds to the values of artifacts for the shaft measurements in mm. The reference line mapped to the standard needle shaft used as the ground truth corresponds to 50 mm.
Magnetochemistry 09 00079 g006
Figure 7. Boxplot showing the silhouette coefficient according to the K-means clusters that were applied to the needles in the MRI image. The green line represents the median of the data, and the circles are the outliers.
Magnetochemistry 09 00079 g007
Table 1. Materials specifications used to fabricate the needles from L1 to L8, polyimide (Pl), fiber bundle (FB), polytetrafluoroethylene (PTFE), polyether ether ketone (PEEK), fluorinated pethylene propylene (FEP), nickel-titanium (NiTi), glass rod (GR), outer diameter (OD), thin wall (TW), lightweight wall (LW), and fiber bundle (FB).
Labeled NeedlesMaterials Used for Needles’ FabricationSpecifications
L1Inner core (3FB) + outer sheet (PTFE AWG 21)OD: 1.00 mm, TW: 0.15 mm
L2Inner core (3FB) + outer sheet (PTFE AWG 22)OD: 1.00 mm, TW: 0.15 mm
L3Inner core (3FB) + outer sheet (PTFE AWG 20)OD: 1.00 mm, LW: 0.15 mm
L4ITP Standard needle (inner core + outer sheet) = NiTiOD: 1.00 mm. LW: 0.15 mm
L5Inner core (3FB) + outer sheet (PTFE AWG 22)OD: 1.00 mm, TW: 0.25 mm
L6Inner core (3FB) + outer sheet (PTFE AWG 21)OD: 1.00 mm, LW: 0.15 mm
L7Inner core (3FB) + outer sheet (PEEK)OD: 0.78 mm, TW: 0.25 mm
L8Inner core (3FB) + outer sheet (FEP AWG 22)OD: 1.00 mm, TW: 0.25 mm
Disclaimer/Publisher’s Note: The statements, opinions and data contained in all publications are solely those of the individual author(s) and contributor(s) and not of MDPI and/or the editor(s). MDPI and/or the editor(s) disclaim responsibility for any injury to people or property resulting from any ideas, methods, instructions or products referred to in the content.

