
Differences in the Quality, Yield, and Soil Microecology of Ginseng in Different Planting Environments

College of Traditional Chinese Medicine, Jilin Agricultural University, Changchun 130000, China
*
Authors to whom correspondence should be addressed.
Horticulturae 2023, 9(4), 520; https://doi.org/10.3390/horticulturae9040520
Submission received: 13 March 2023
/
Revised: 15 April 2023
/
Accepted: 20 April 2023
/
Published: 21 April 2023
(This article belongs to the Section Medicinals, Herbs, and Specialty Crops)
Abstract
:The quality and yield of ginseng are significantly affected by ecological factors, especially soil, which is a complex environment. This study compared the quality, yield, and soil differences of ginseng in a Mongolian oak forest (MOFG), birch forest (BFG), mixed wood forest (MWFG), poplar forest (PFG), farmland (FlG), and a felling forest (DfG). Based on these differences, the relationship between the three was explored, as was the most suitable forest type for developing understory ginseng cultivation. The soil bacteria diversity of DfG was similar to that of understory ginseng, and its ginsenoside content was at the same level as that of understory ginseng. The soil pH of FlG was significantly lower than that of the other five cultivation methods, and the soil bacteria were also different from them, especially those related to the nitrogen cycle. Ginsenoside Rg2 has a significant correlation with many soil factors and is sensitive to soil environmental differences. In conclusion, there were significant differences in the quality, yield, and soil environments between the different planting methods. MOFG was the most suitable for planting with excellent quality and high yield, while BFG was the worst; as such, planting in BFG should be avoided.
1. Introduction
Ginseng, one of the most famous Chinese medicines, is a perennial herb; it has good effects in terms of anti-aging, anti-inflammation, and anti-fatigue, as well as in many other aspects [1,2,3]. Ginseng has been extensively cultivated in China due to its high medicinal value [4]. At present, there are three main cultivation modes of ginseng, namely understory cultivation, farmland cultivation, and deforestation cultivation. Forest planting of ginseng refers to the artificial cultivation of ginseng by artificially sowing ginseng seeds in the forest to simulate the growing environment of wild ginseng. Due to the high product quality and economic benefits, the concept of ecological planting is becoming increasingly respected. As such, this model has developed rapidly in recent years. Ginseng planting in farmland refers to a planting mode in which ginseng is planted in a large field and is then artificially shaded, weeded, and fertilized [5]. Due to the existence of serious plant diseases and insect pests, a significant number of pesticides are frequently associated with its production [6]. It is necessary to cut down forests and to arrange the ground before ginseng planting. As this causes serious damage to the ecological environment, this type of planting has been almost completely banned.
Ginsenosides are one of the main active ingredients of ginseng. Studies have shown that different ginsenosides have various effects. For example, ginsenoside Rg1 regulates and improves Alzheimer’s disease through multi-target and multi-pathway means [7]. Ginsenoside Rh2 helps kill tumor cells and has good anticancer activity [8]. The content of ginsenoside determines its efficacy, price, and even its identification as medicine. Therefore, any production mode must be based on the premise of ensuring the quality of ginseng in terms of improving its yield and increasing its economic benefits.
There are many environmental factors affecting ginsenoside content, such as light, temperature, water, soil, etc. [9], among which soil, as the environmental basis for ginseng survival, has an important impact on the quality of ginseng. Soil is a complex micro-ecosystem, in which nutrients, enzymes, and microorganisms all affect the growth and development of ginseng [10,11,12]. In addition, there is a close correlation between soil nutrients, enzyme activity, and microorganisms. More and more evidence shows that rhizosphere microorganisms play a crucial role in nutrient cycling, organic matter decomposition, and soil fertility maintenance [13].
Due to the different nutrient requirements of different tree species, and the differences in the soil environment required for their growth [14], the chemical properties of soil in different forest types vary. In addition, the differences in the fall of different tree species and root exudates will lead to certain differences in soil microecology, such as soil enzymes and soil flora [15,16], which will eventually affect soil chemistry [17]. The cultivation of understory ginseng also has the same problem. At present, there are a wide variety of forests where understory ginseng grows, and the difference in forest type will lead to the difference in its growth environment. Studies have shown that there are significant differences in the ginsenoside and amino acid content of ginseng growing under different forest types [18]. As such, it is particularly important to select the forest type that is most suitable for the growth of understory ginseng.
In this study, 16S rRNA technology and Biolog-ECO plates were used to compare the differences in soil chemistry, enzyme activities, and the microorganisms of four types of forest-planted, logging-planted, and farmland-planted ginseng. Furthermore, an exploration into the relationship between these soil factors and ginsenosides to determine the main soil factors affecting the quality of ginseng was also conducted.
2. Materials and Methods
2.1. Overview of the Study Area
The sample collection area is in the cultivation base of ginseng in a forest in Liuhe County, Tonghua City, Jilin Province, China (125°25′07″ E, 42°03′01″ N). There was a continental monsoon climate with an average annual temperature of 5 °C, average precipitation of 750 mm, average sunshine hours of 2551 h, and a frost-free period of 126~138 days.
2.2. Quadrat Setup and Sample Collection
All four types of forests studied are natural forests. The shrubs and herbaceous plants on the ground should be removed before ginseng planting, while only woody plants should be retained. Before planting DfG, all vegetation on the ground should be removed, and FlG should be planted in ordinary farmland. Ginseng seeds were evenly spread in the mountain area of the base in September 2014. In September 2019, four forest types (Mongolian oak forest, birch forest, poplar forest, and mixed wood forest) were selected in the base, and five representative quadrats (quadrat size 2 m × 2 m) were set for each forest type. All the ginseng from each sample was harvested, and the rhizosphere soil of each ginseng, while excavating, was collected. Then, this was mixed as a soil sample for the specific forest from which it was obtained. The ginseng was rinsed with clean water and dried at 50 °C, then passed through a 100-mesh sieve and stored. All kinds of soil were thoroughly mixed and placed into a zip lock bag in an ice box, then immediately sent to the laboratory. The soil was stored in three parts: one part was dried at room temperature for physicochemical and enzyme activity analysis, one part was stored in the refrigerator at 4 °C for Biolog-ECO, and the other part was stored at −80 °C for microbial analysis. At the same time, a sample of 5-year-old farmland was collected in the base for use in forest ginseng cutting. The collection method for this step was conducted in the same manner as above.
2.3. Determination of Understory Ginseng Yield
The weight per plant of all understory ginseng roots in the quadrat was added as the total yield of the quadrat, and the yield per square meter of the quadrat was calculated by dividing by the aspect product.
2.4. Determination of Ginsenoside Content of Understory Ginseng
Preparation of the test product was conducted as follows: 0.400 g powder was accurately weighed; methanol was added at the solid–liquid ratio of 1:30; ultrasonic extraction was carried out at 30 °C for 30 min; filtration was performed; repeated extraction was performed three times; the filtrate was concentrated; methanol was used in a constant volume of 5 mL; and 0.22 μm of filter membrane was used to reserve the sample.
Reference preparation: Precision weighing control products of the ginsenoside were Rg2, Rc, Rb1 20.0 mg powder, Rg1, Re, Rb2, Rd 10.0 mg powder, and Rf, Rb3 5.0 mg powder mixed into a 10 mL volume bottle; a 7 mL methanol shake was added to fully dissolve the sample at a constant volume; after absorbing, 1 mL of the mixed solution was added and then held to 10 mL; and ginseng monomer saponins were obtained at concentrations of 0.2 mg·mL−1, 0.1 mg·mL−1, and 0.05 mg·mL−1, which were filtered through 0.22 μm for use.
Chromatographic conditions: The determination was performed on an Agilent ZORBAX SB-C18 (4.6 mm × 250 mm, 5 μm) column with a mobile phase that consisted of water (A) and acetonitrile (B) at a flow rate of 0.95 mL·min−1; the column temperature was at 25 °C; the sample size was 10 μL; and the detection wavelength was 203 nm. The gradient elution conditions are shown in Table S1.
Drawing of the standard curve: 2, 5, 7, 10, 12, 15, 18, and 20 μL of the above ginsenoside mixed solution were injected into the samples according to the chromatographic conditions; and the standard curve was drawn with the peak area (Y) as the ordinate and the solution mass concentration (X) as the horizontal coordinate. The results are shown in Table S2.
2.5. Soil Chemical Analysis
The soil pH value and electrical conductivity (EC) were determined using an international standard 1:5 soil-water ratio while using an ion meter; the soil organic matter (OM) content was determined by a dilution heat method with potassium dichromate [19]; the soil alkali-hydrolyzed nitrogen (AHN) content was determined by an alkali-hydrolyzed diffusion method [20]; the soil available phosphorus (AP) content was determined by a sodium bicarbonate extraction and molybdenum-antimony resistance colorimetric method; the soil available potassium (AK) content was determined by ammonium acetate extraction, specifically atomic absorption spectrophotometry [21]; and the soil available calcium and magnesium (Ca, Mg) content was determined by ammonium acetate extraction and atomic absorption spectrophotometry. The available iron, manganese, copper, and zinc (Fe, Mn, Cu, Zn) in the soil were determined via DTPA extraction and atomic absorption spectrophotometry [22].
Soil urease (S-UE) was determined by indophenol colorimetry [23], and the urease activity was expressed by the number of mg of NH3-N released per gram of soil after 24 h; the soil sucrase (S-SC) was determined via a 3, 5-dinitrosalicylic acid colorimetric method [24], and its activity was expressed by the number of milligrams of glucose per gram of soil after 24 h; the soil acid phosphatase (S-ACP) was measured by the phenylene disodium phosphate method [25], and the activity of acid phosphatase was expressed by the number of milligrams of phenol per gram of soil after 24 h; and the soil catalase (S-CAT) was determined via potassium permanganate titration [26], and the catalase activity was represented by the mg of H2O2 that was decomposed per gram of soil after 20 min.
2.6. The Biolog-ECO Plate Inoculation and Analyses
2.6.1. Preparation of Soil Bacterial Suspension
The soil was stored at 4 °C and was then taken out, whereby a fresh soil equivalent of 5.0 g of dry soil was accurately weighed into a triangular bottle. Next, 45 mL of bacteria-free water was added and then shaken for 3 min to fully break up the soil sample. Immediately after the oscillation, 10 mL of sludge was absorbed into a 50 mL centrifuge tube, and centrifuged for 20 min at 10,000 r·min−1, the supernatant was discarded, 10 mL of sterilized normal saline was added, and then the mixture was shaken for 3 min. Next, the centrifuge was performed at 10,000 r·min−1 for 20 min to wash the carbon source. The supernatant was discarded, and 10 mL of normal saline was added, which was then shaken and mixed for 3 min. Following this, the sample was then separated from the center at 2000 r·min−1 for 1 min, where 1 mL of supernatant was absorbed and added into the test tube containing 9 mL of sterile normal saline. Its A590 was then maintained at (0.13 ± 0.02) [27].
2.6.2. Methods for the Determination of Functional Metabolism of Soil Microbial Communities
A Biolog-ECO plate containing 31 carbon sources was selected to measure the metabolic function of the soil microorganisms. First, the Biolog-ECO plate was taken out and preheated to 25 °C, the bacterial suspension was prepared in 2.6.1, then added to the plate. Next, 150 μL was added into each well and then put into a 25 °C incubator for the continuous dark culture. The samples’ absorbance of 590 nm and 750 nm was read by the Biolog instrument every 24 h.
2.6.3. Result Calculation and Data Analysis
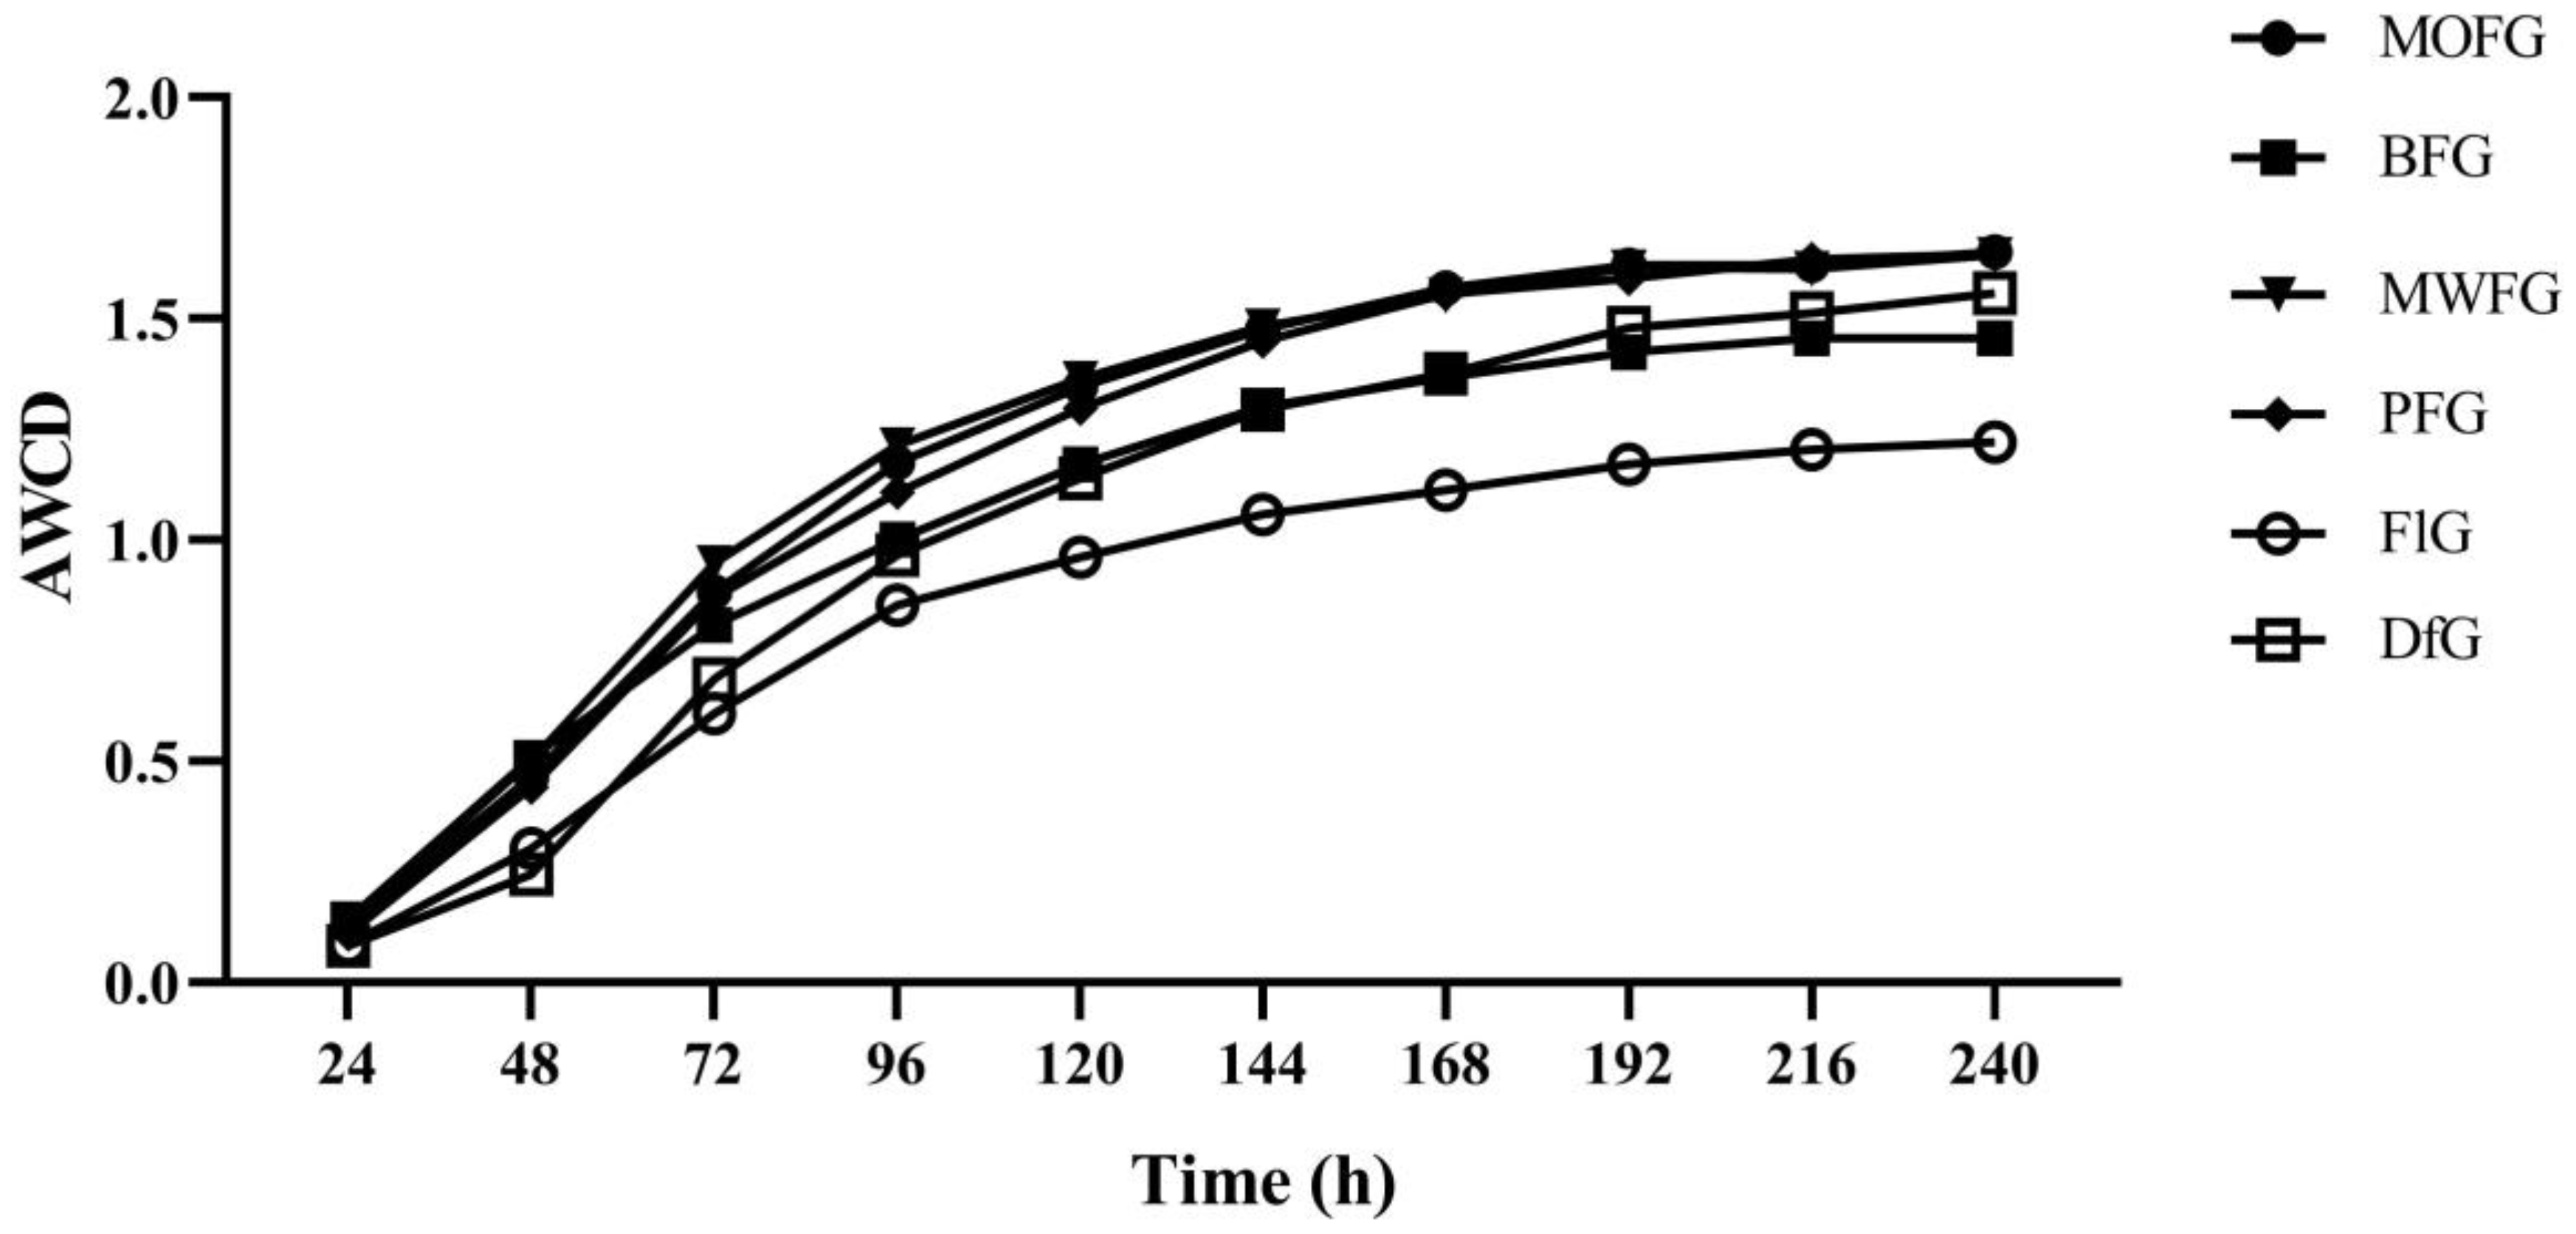
Average absorbance change per hole (AWCD) was used to represent the overall capacity of the microbial community to use the 31 carbon sources at a certain time point, reflecting the average activity difference between the different microbial communities:
where Ci is the light absorption value of each hole and R is the light absorption value of the control hole.
2.7. Soil DNA Extraction and High-Throughput Sequencing
DNA from the different samples was extracted with the E. Z. N. A. ®Soil DNA Kit (D4015, Omega, Inc., Norwalk, CT, USA), and used according to the manufacturer’s instructions. The reagent that was designed to uncover the DNA from the trace amounts of the samples has been shown to be effective for the preparation of the DNA of most bacteria. Nuclear-free water was used for the blank. The total DNA was eluted in 50 μL of elution buffer and stored at −80 °C until measurement in the PCR by LC-Bio Technology Co., Ltd., Hang Zhou, China. The primers were 341F(5′CCTACGGGNGGCWGCAG-3′) and 805R(5′-GACTACHVGGGTATCTAATCC-3′). The 5′ ends of the primers were tagged with specific barcodes per sample and with sequencing universal primers. The PCR amplification was performed in a total volume of a 25 μL reaction mixture containing 25 ng of template DNA, 12.5 μL PCR Premix, 2.5 μL of each primer, and PCR-grade water to adjust the volume. The PCR conditions to amplify the prokaryotic 16S fragments consisted of an initial denaturation at 98 °C for 30 s, 32 cycles of denaturation at 98 °C for 10 s, annealing at 54 °C for 30 s, and an extension at 72 °C for 45 s. Then, the final extension was at 72 °C for 10 min. The PCR products were confirmed with 2% agarose gel electrophoresis. Throughout the DNA extraction process, ultrapure water, instead of a sample solution, was used to exclude the possibility of false-positive PCR results as a negative control. The PCR products were purified by AMPure XT beads (Beckman Coulter Genomics, Danvers, MA, USA) and quantified by Qubit (Invitrogen, Waltham, MA, USA). The amplicon pools were prepared for sequencing, and the size and quantity of the amplicon library were assessed on an Agilent 2100 Bioanalyzer (Agilent, Santa Clara, CA, USA) and the Library Quantification Kit for Illumina (Kapa Biosciences, Woburn, MA, USA), respectively. The libraries were sequenced on a NovaSeq PE250 platform.
2.8. Statistical Analysis
The samples were sequenced on an Illumina NovaSeq platform, provided by LC-Bio, according to the manufacturer’s recommendations. The paired-end reads were assigned to samples based on their unique barcode. They were then truncated by cutting off the barcode and the primer sequence. The paired-end reads were merged using FLASH. Quality filtering on the raw reads was performed under specific filtering conditions to obtain high-quality clean tags according to the fqtrim (v0.94). Chimeric sequences were filtered using Vsearch software (v2.3.4). After dereplication using DADA2, we obtained the feature table and feature sequence. Beta diversities were calculated by QIIME2, the graphs were drawn by the R package. Blast was used for sequence alignment, and the feature sequences were annotated with the SILVA database for each representative sequence. Other diagrams were implemented using the R package (v3.5.2). The functional groups of bacteria were predicted according to the FAPROTAX database [28]. Pearson’s correlation analyses and ANOVA were performed using SPSS 24.0. Drawing using GraphPad Prism 8.0. RDA and PCoA was performed using the OmicStudio tools at https://www.omicstudio.cn/tool (accessed on 17 July 2022).
3. Results
3.1. Differences in Quality and Growth of Ginseng
In all samples, nine monomers of ginsenosides were detected, and their contents varied in various regions. The total saponin content FlG of ginseng was significantly lower than that of undergrowth ginseng, and DfG had no significant difference with other forest types, except MOFG. (Table 1) The content of the nine monomer saponins of MOFG was the highest in the samples tested. As such, the total ginsenoside content of MOFG was also the highest, which was 36.3% higher than the second BFG.
As the planting methods adopted by DfG and FlG are quite different from those for ginseng produced under the forest, they were not compared in terms of their yield and growth status (Table 2). The yield of the MOFG was the highest, reaching 31.25 g·m−2, which is 2.14 times the lowest BFG. It can be seen that there is a great difference in the yield of undergrowth ginseng between the different forest types, which seriously affects the economic benefits of undergrowth ginseng. BFG was low in both aboveground stems and underground roots, which may be due to its poor growth and small size, thus resulting in a low yield. In addition, the yield of PFG was also relatively low, but its weight per plant was not significantly different from that of MOFG and MWFG. In addition, its aboveground parts grow best, which may be due to its low quantity, thus leading to a poor yield.
3.2. Differences in Soil Chemical Properties and Enzyme Activities
The soil chemical properties of the four understory ginseng, as well as of FlG and DfG, were significantly different (Table S3). The soil pH MOFG of the understory ginseng was the highest (5.38), while the lowest was PFG (4.86). Compared with the three cultivation methods, the pH of FlG was significantly lower than that of understory ginseng and DfG (4.48), while the difference between DfG and understory ginseng was small. The EC values of FlG and DfG were significantly higher than those of understory ginseng (291.45 μS·cm−1 and 261.72 μS·cm−1), and there was no significant difference between the four understory ginseng species.
The S-SC and S-ACP contents of FlG were lower than those of other plots, and the S-UE contents of FlG and DfG were significantly higher than those of undergrowth ginseng (Table S4). The S-SC and S-UE contents of MWFG were significantly higher than those of the other three types, which were 12.91 mg·g−1·d−1 and 437.86 μg·g−1·d−1, respectively.
3.3. Analysis of the Soil Bacterial Carbon Source Use
To understand the microbial metabolic reaction, a Biolog-ECO plate analysis was carried out. This can characterize the metabolic fingerprints of microbial communities on carbon sources [29]. The average well-color development (AWCD) indicates the overall microbial activity in using carbon sources. As shown in Figure 1, the FlG soil showed lower AWCD values throughout the incubation, which indicates that the microbial metabolism is slow. The difference in AWCD values between the DfG and understory ginseng of the four different forest types was small, indicating that their use of carbon sources is similar. The lower AWCD value of the BFG of the four understory ginseng species indicates that it is weak in using carbon sources.
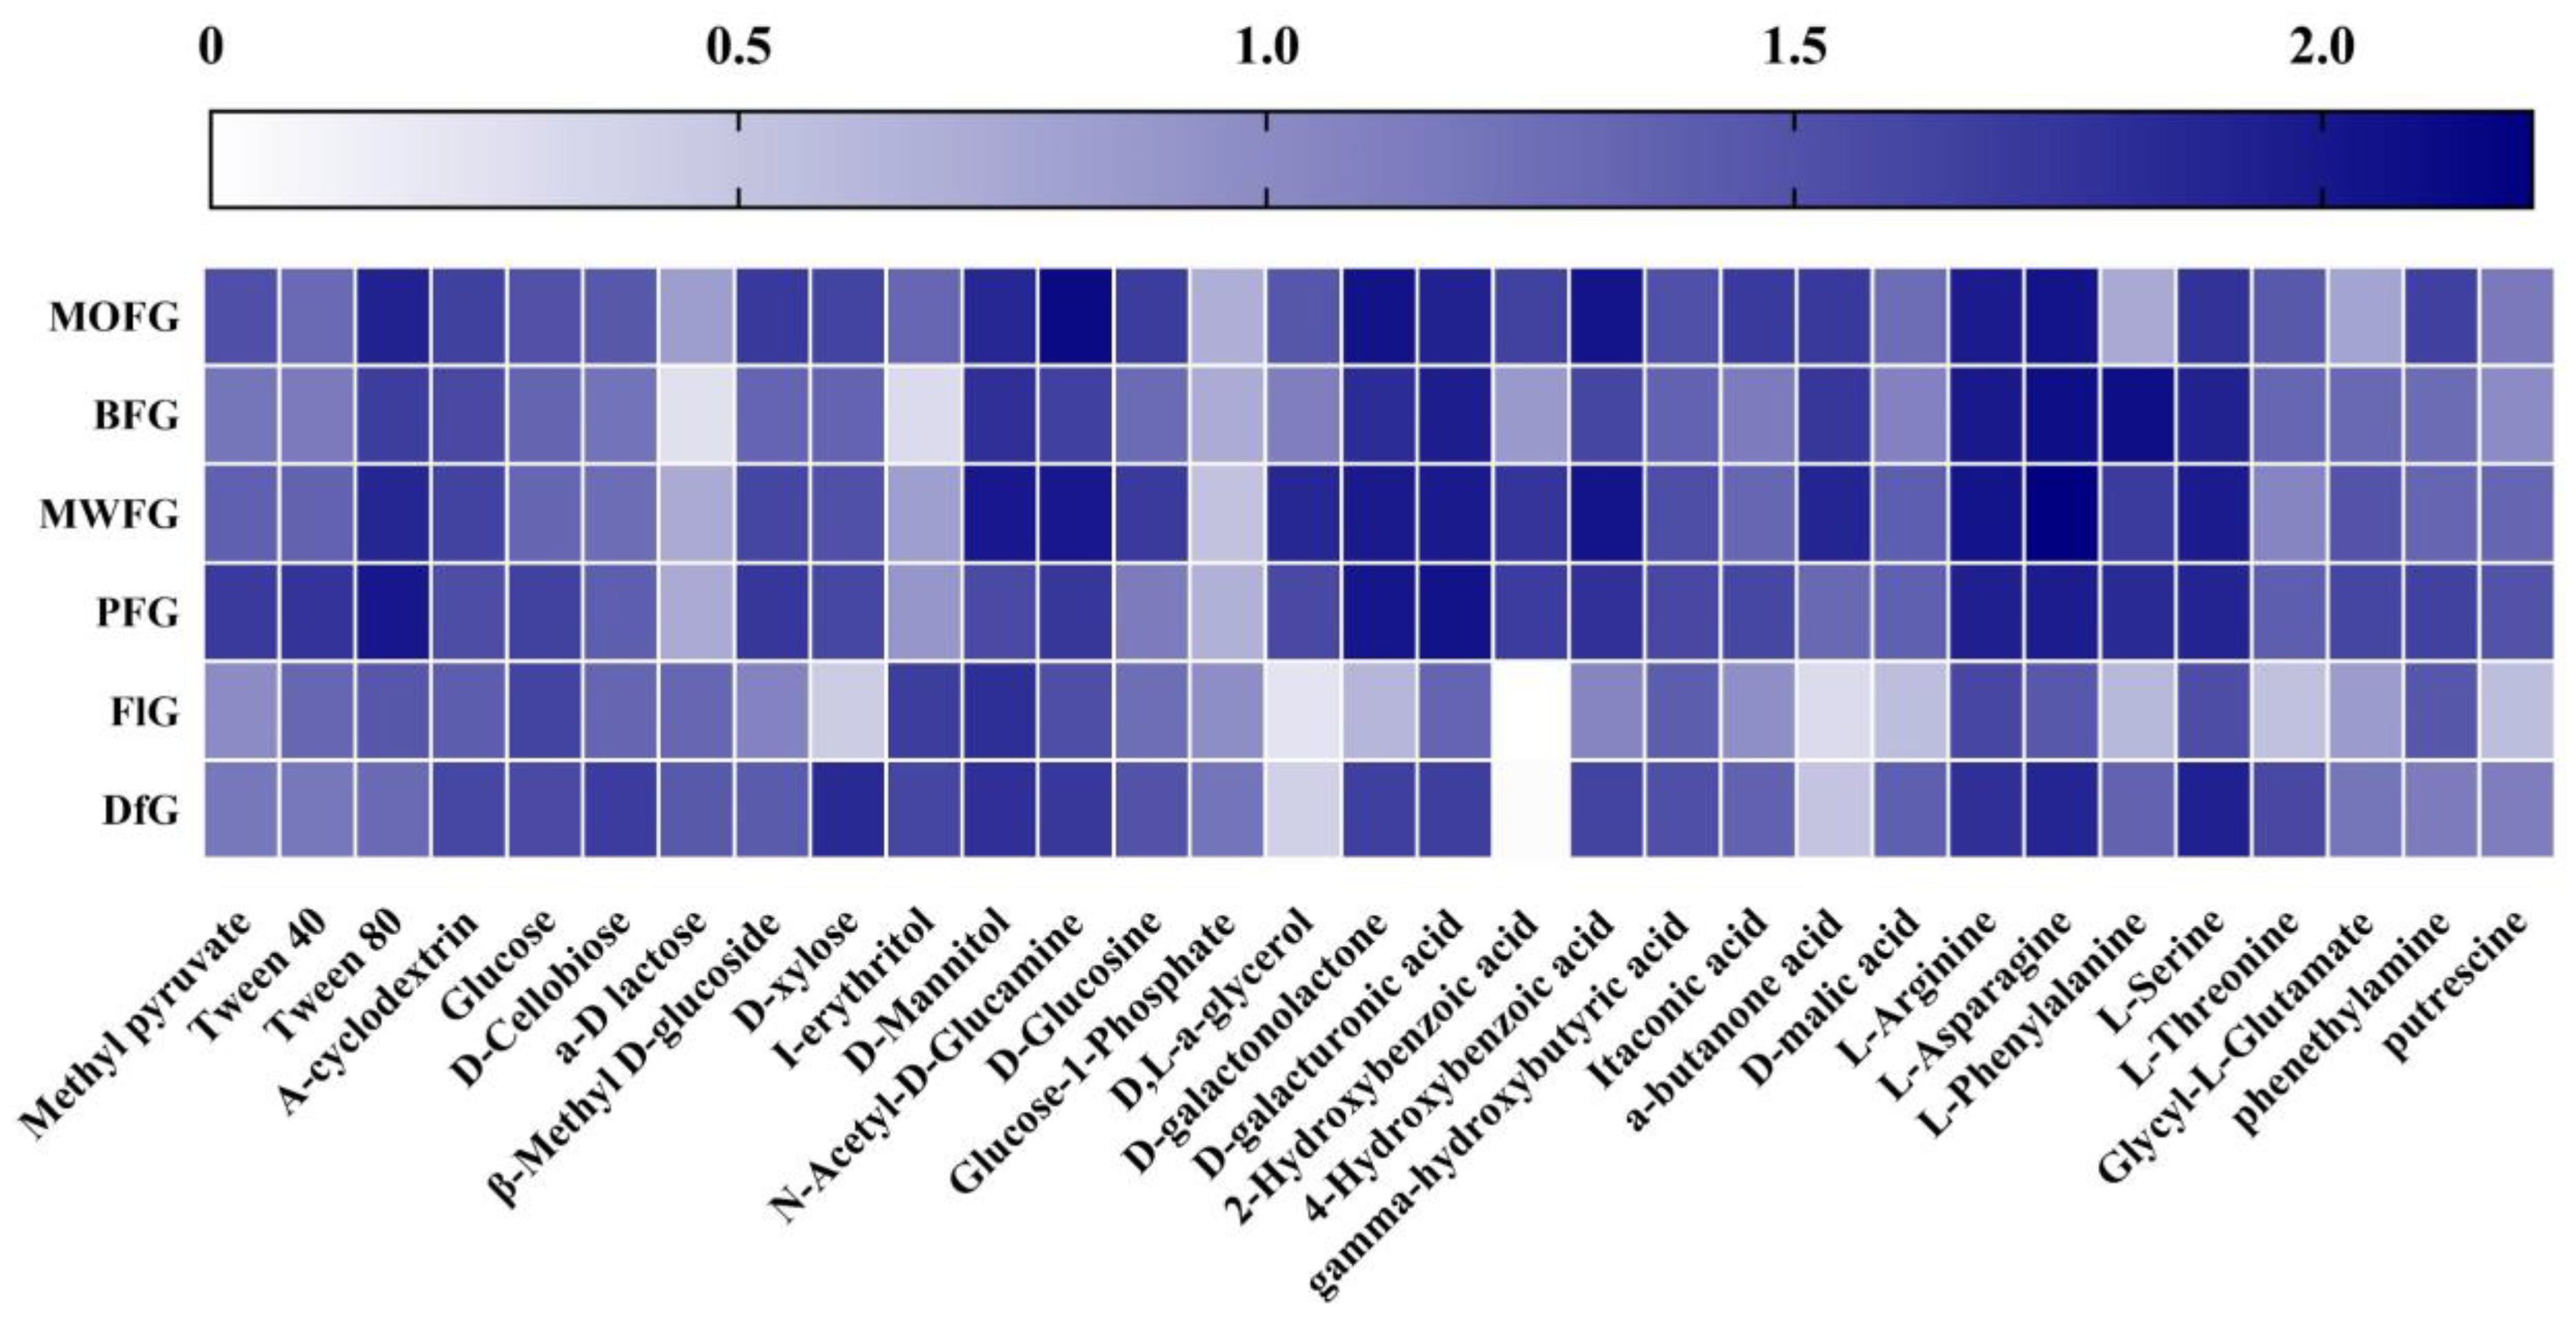
To further explore how different forest types alter the metabolic patterns of soil microorganisms, when the Biolog plate reacted for 168 h, the OD590 of each well in the Biolog plate minus the OD750 value was calculated as the use intensity of 31 single carbon sources, as shown in Figure 2. FlG and DfG had significant differences with the rhizosphere soil microbial metabolism of understory ginseng, which is mainly reflected in the lower use of D,L-a-glycerol, 2-Hydroxybenzoic acid, a-butanone acid by the former two. The use of BFG in a-D lactose and I-erythritol was lower than that of the other three understory ginseng soils; in addition, the use of MOFG in L-Phenylalanine was also lower. It was also used less by FlG than DfG in D-xylose, D-malic acid, L-Phenylalanine, and L-Threonine.
3.4. Analysis of Soil Bacterial Diversity
As shown in Figure S1, from high to low, the number of unique OTGs for each process is FlG (4966) > MWFG (4063) > PFG (3651) > MOFG (3636) > DfG (3450) > BFG (3311). In addition, 560 OTGs are jointly owned by them. The results showed that the number of OTU in FlG soil was higher than that in other soils, indicating that the microbial abundance in farmland-cultivated ginseng soil was higher than that found in fusing forest-cultivated ginseng and under forest-cultivated ginseng.
To explain the difference in the microbial community composition between the different samples, the bacterial composition (Figure S2) was analyzed by principal coordinate analysis (PCoA) at the OTU level. The results showed that the ovals of BFG, MOFG, MWFG, and PFG had overlapping regions, while they had no overlapping regions with DfG and FlG. These results indicated that the four species of understory ginseng soil bacterial communities had certain similarities, and there were significant differences between them and DfG and FlG.
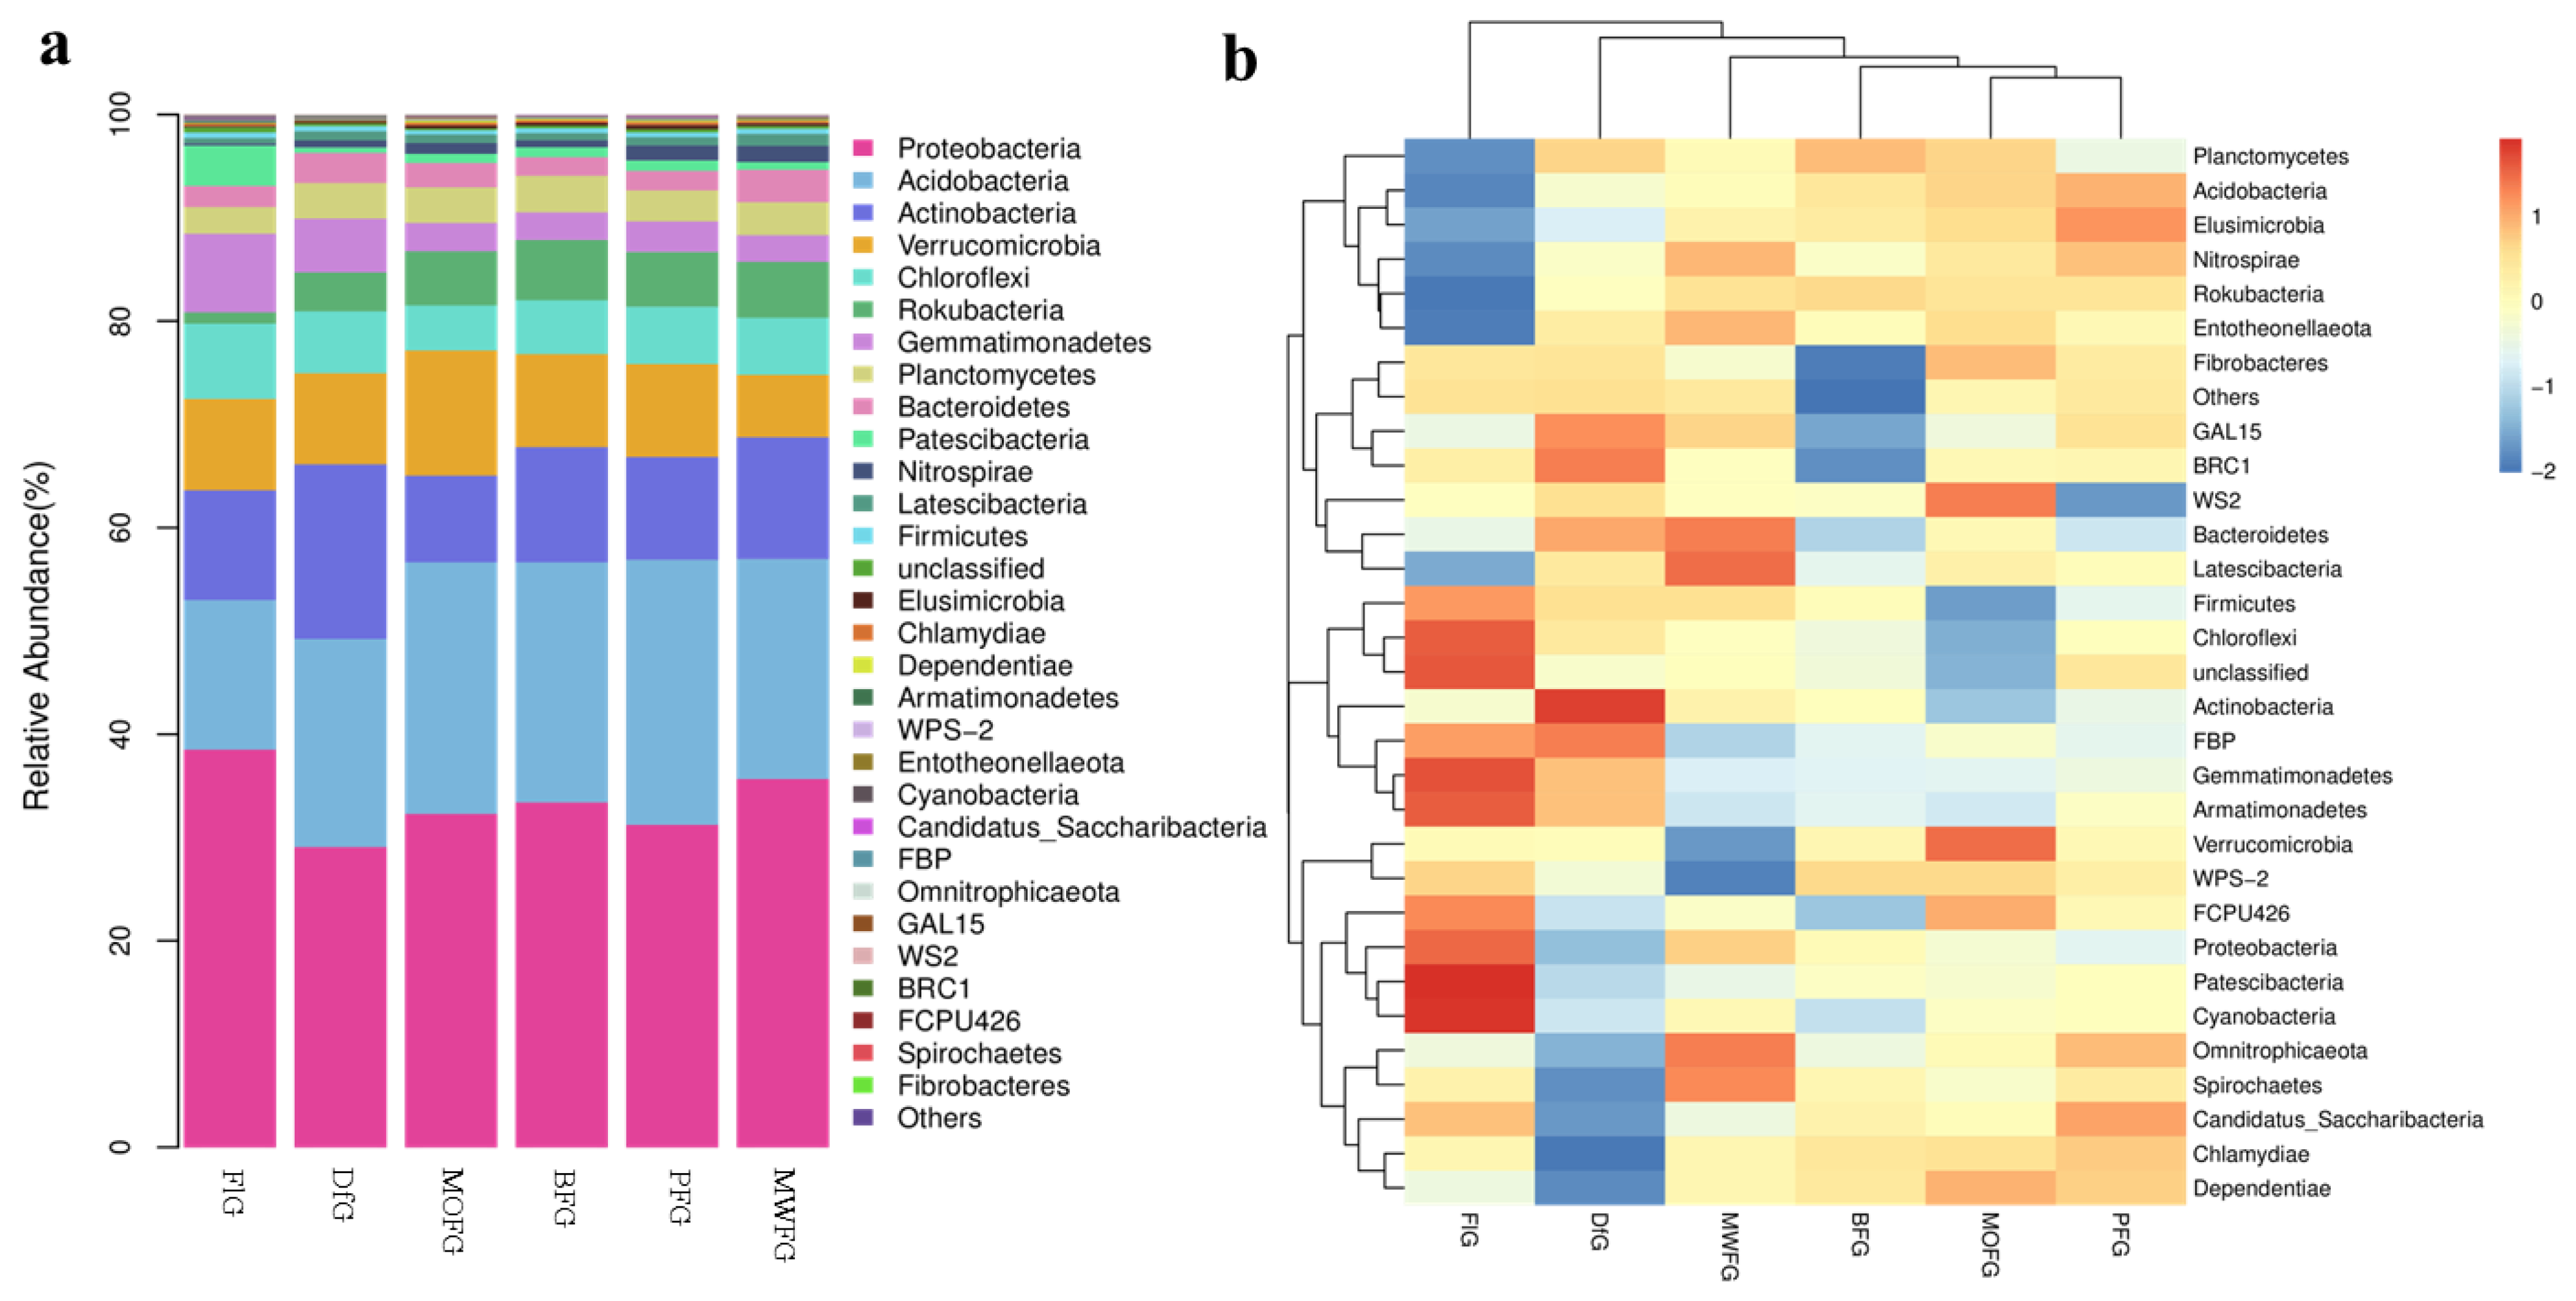
In all samples, there were nine bacterial communities with a relative abundance that was greater than 1% at the phylum level: Proteobacteria, Acidobacteria, Actinobacteria, Verrucomicrobia, Chloroflexi, Rokubacteria, Gemmatimonadetes, Planctomycetes, and Bacteroidetes (Figure 3a). It can be seen that the composition of soil microorganisms in FlG is significantly different from the other five samples. Proteobacteria (38.52%), Chloroflexi (7.28%), and Gemmatimonadetes (7.61%) were high, while Acidobacteria, (14.49%) and Rokubacteria (1.11%) were low. The actinobacteria of DfG (16.91%) was higher. The differences among the four samples of MOFG, BFG, PFG, and MWFG can be better observed through the heat maps (Figure 3b). The Planctomycetes, Acidobacteria, Elusimicrobia, Nitrosspirae, Rokubacteria, and Entotheonellaeota of FlG were lower than those of the other five groups. The Omnitrophicaeota, Spirochaetes, Candidatus Saccharibacteria, Chlamydiae, and Dependentiae of DfG were lower than those of the other groups. The Fibrobacteres, GAL15, and BRC1 of BFG were lower than those of other groups.
A linear discriminant analysis (LDA value > 4.0, Figure S3) showed the composition of bacterial communities in the six samples. The number of different bacterial species in FlG was the highest (23), while the number of PFG and MWFG was the lowest (3), indicating that the microbial species in the soil planted with ginseng in farmland were significantly different from that in the understory soil.
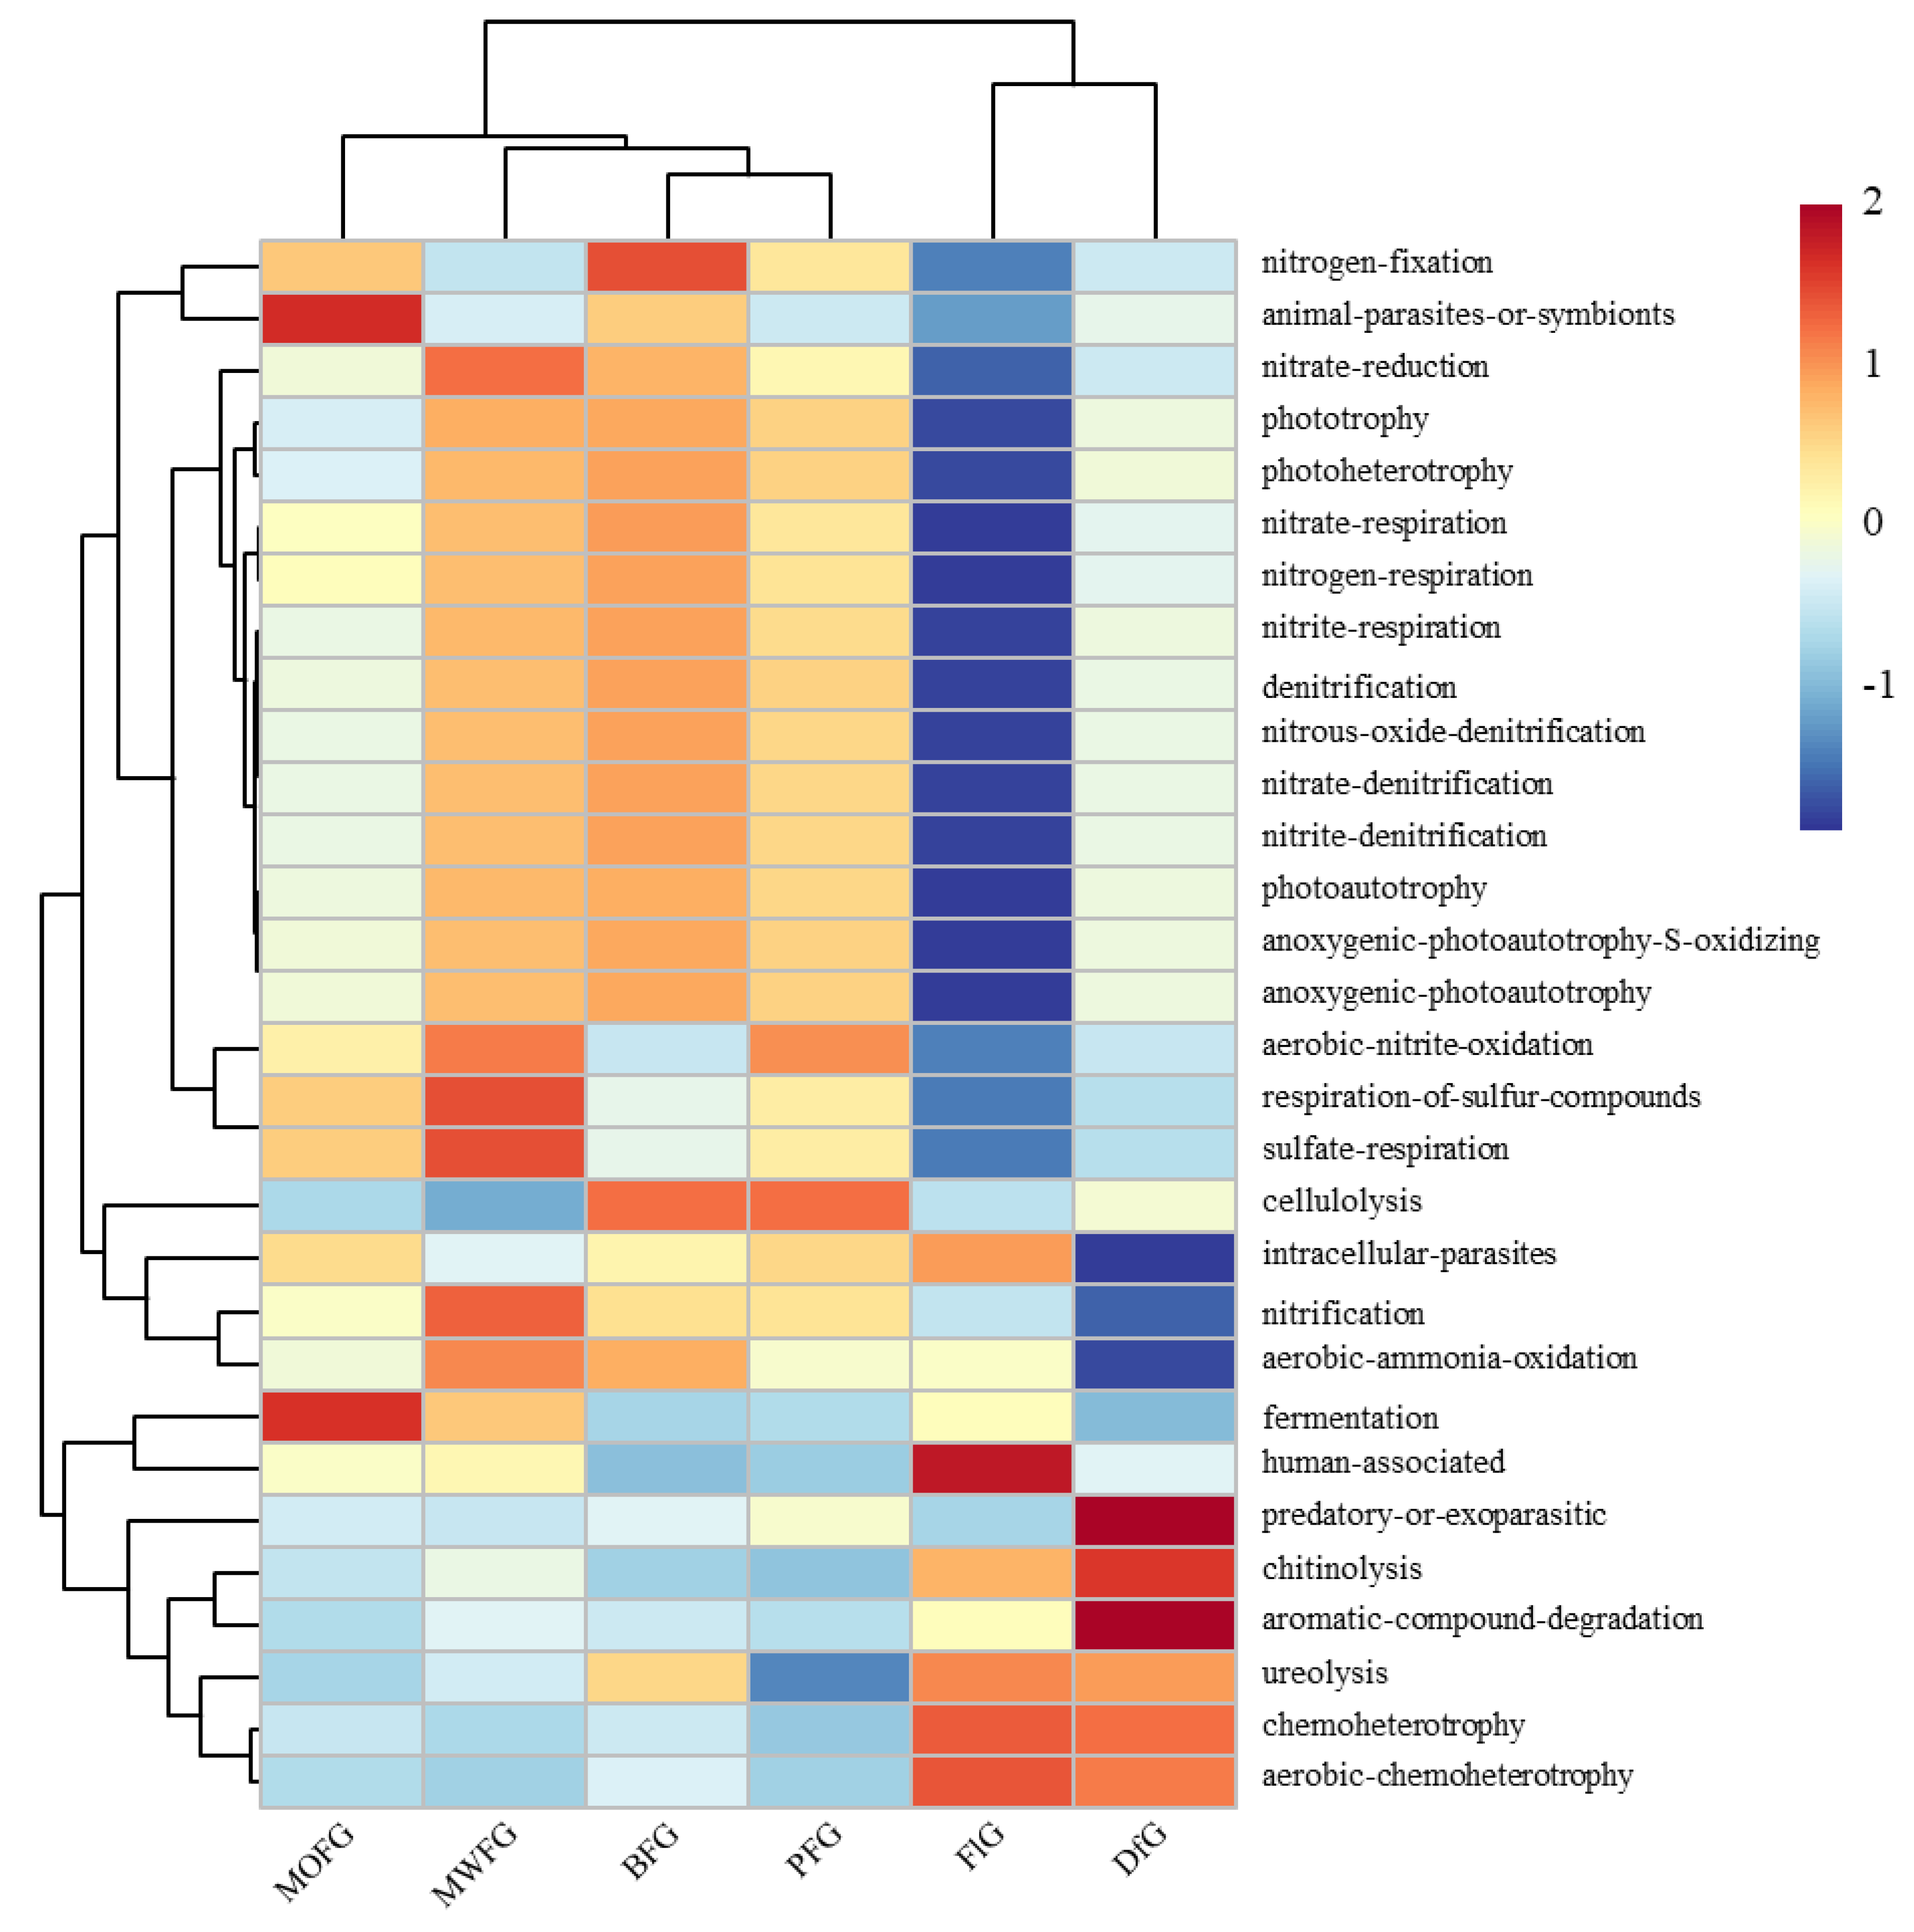
The FAPROTAX annotation results show that 33.9–39.1% of the OTUs can be assigned to the functional groups of the FAPROTAS database. The FAPROTAX prediction has been determined to be the most appropriate method for predicting the potential microbial function of environmental samples, which has been used in many previous studies. Of the 80 functions of FAPROTAX, 30 microbial function categories were assigned (OTUs > 0.1%). A cluster analysis based on bacterial function showed significant differences in the soil functional bacteria of ginseng in different planting modes (Figure 4). FlG had lower multifunctional bacteria than other treatments, which was mainly reflected in the nitrogen cycling-related microorganisms, and its human-associated microorganisms were significantly higher than those in other treatments. The lower intracellular parasites, nitcartons, when compared to the aerobic-ammonia oxidation of DfG, were higher than the predatory or exoparasitic, aromatic compound degradation. Regarding MOFG fermentation and fermentation, the number of animal parasites or symbionts was higher.
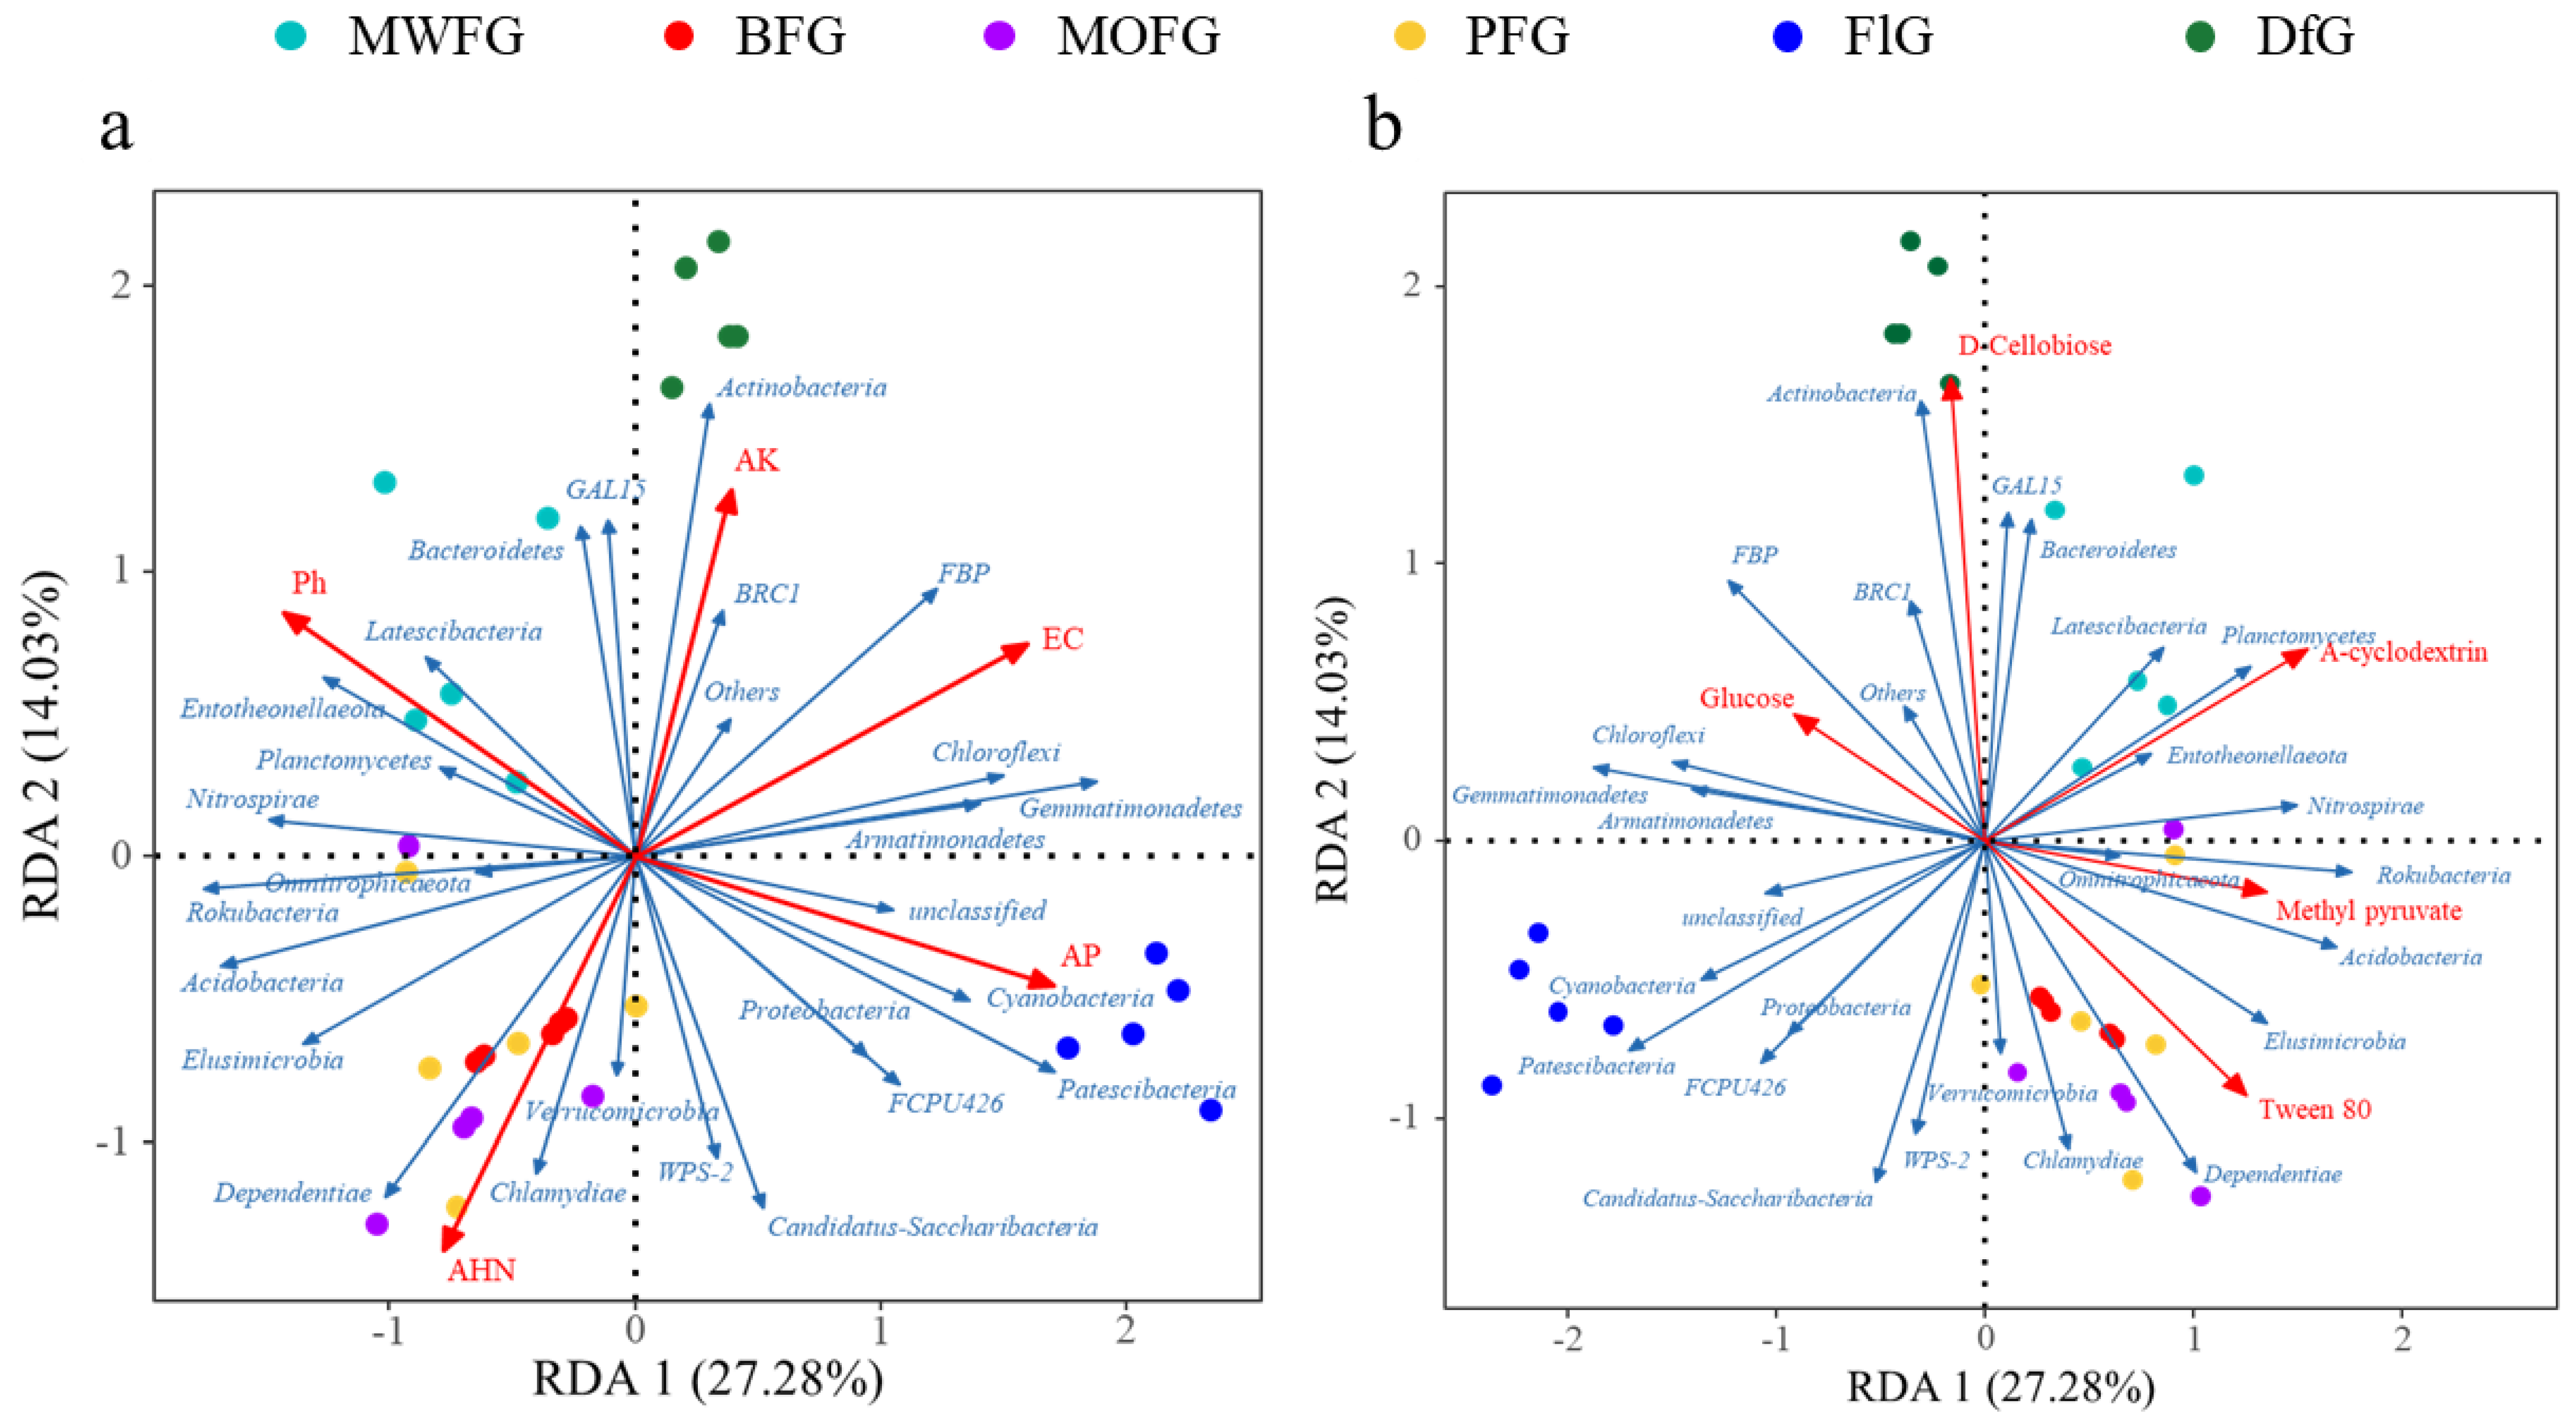
The RDA and FlG of Cyanobacteria and Patescibacteria at the phylum level related to soil chemistry (Figure 5a) and single carbon sources (Figure 5b) may be related to their high AP. They also had a low use of A-cyclodextein. Dependentiae and Chlamydiae had a high relative abundance in BFG, MOFG, and PFG; they also had a strong correlation with AHN, as well as a strong use of Tween 80. In addition, soil microorganisms from DfG had a strong beneficial effect on D-Cellobiose, which had a strong positive correlation with Actinobacteria, GAL15, and BRC1.
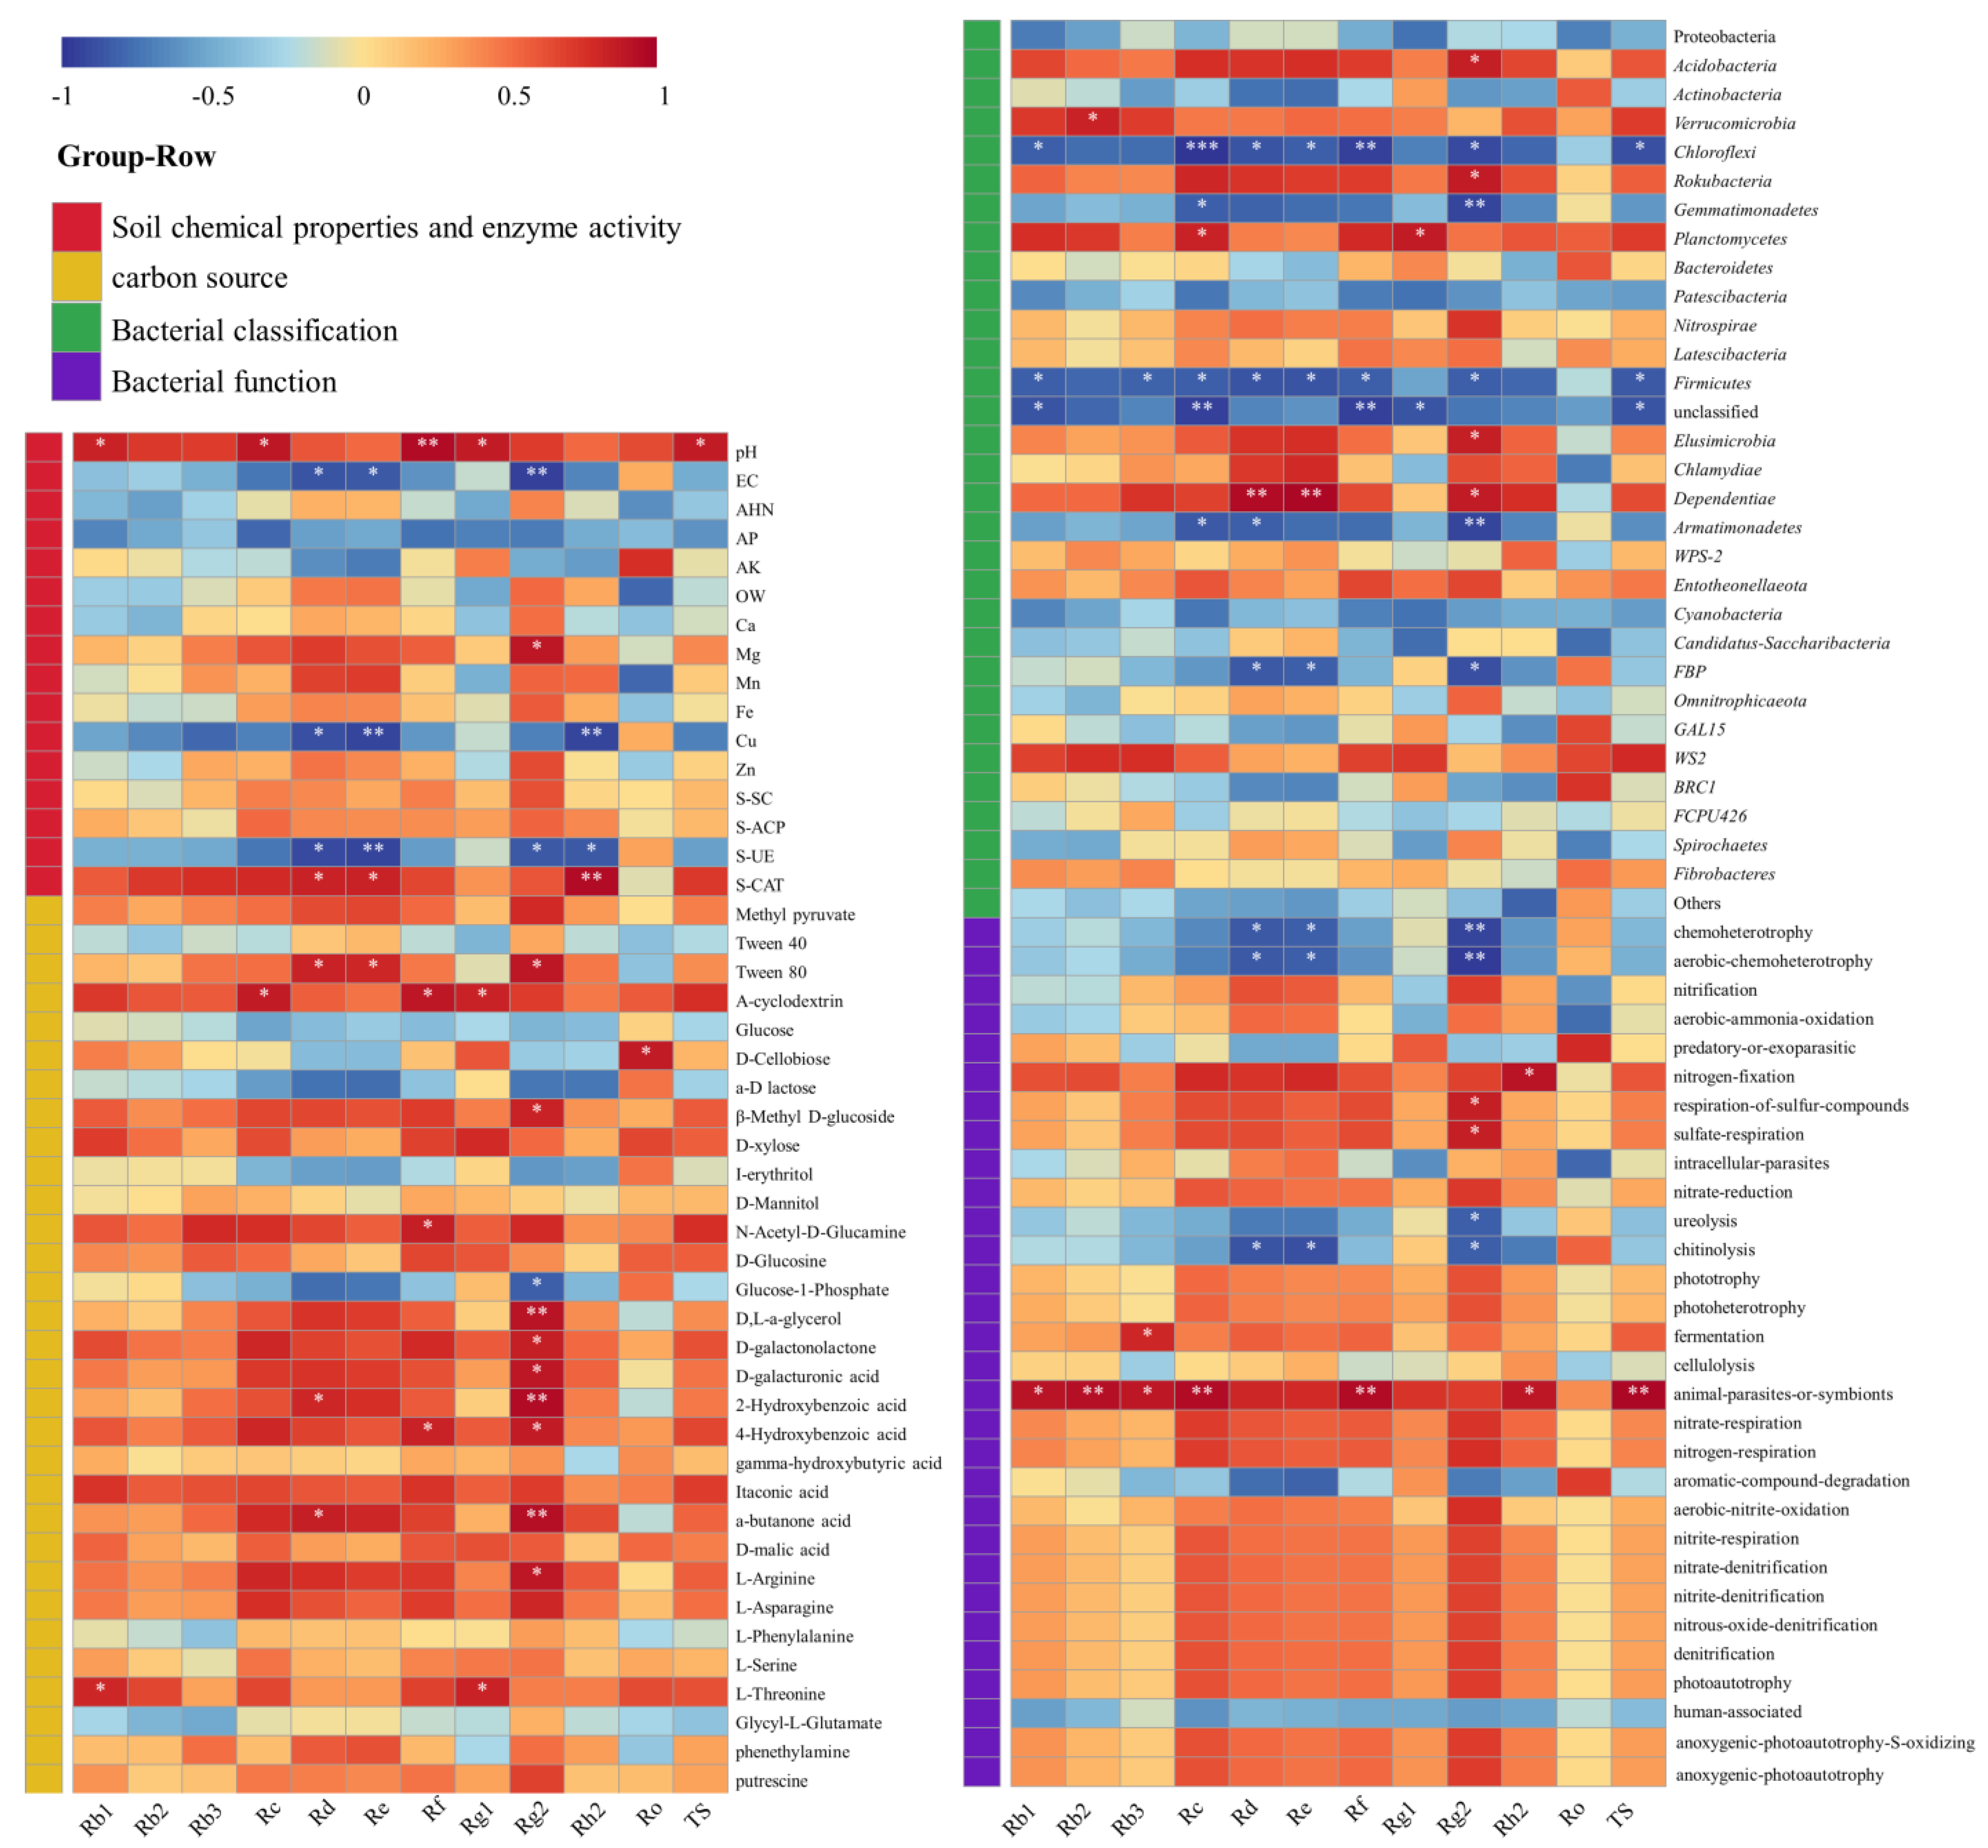
To explore the relationship between ginseng quality and soil, ginsenosides were correlated with soil chemical properties, carbon sources, bacterial abundance, and bacterial function (Figure 6). In general, soil chemical properties, enzyme activity, soil bacterial abundance, and ginsenoside content were strongly correlated, and most of them were in negative correlation. In soil chemistry and enzyme activity, pH, EC, Cu, and S-UE were strongly correlated with ginsenoside content. Soil microbial carbon sources mainly affected the content of ginsenoside Rg2 and Tween 80. A-cyclodextrin was strongly correlated with the content of ginsenoside. In terms of bacterial function, animal parasites or symbionts were positively correlated with the content of various ginseng monomer saponins, while chemoheterotrophy and cellulolysis were negatively correlated with aerobic chemoheterotrophy.
4. Discussion
4.1. Effects of Forest Type and Cultivation Methods on the Quality and Yield of Ginseng
Unlike ordinary crops, the effective components of Chinese medicinal materials are the key to determining whether they can be identified as medicinal materials. Therefore, in the process of planting, it is infeasible to simply pursue the increase in production for improving economic benefits. Some studies have shown that the saponins of ginseng under forests are significantly greater than that of ginseng in farmland, and it is found that the Rg1/Re of ginseng under forests is greater than that of ginseng in farmland [30]. The results of this study were the same as those of previous studies. Different cultivation methods had significant effects on the quality of ginseng, and the content of FlG ginsenoside and Rg1/Re were significantly lower than those of the undergrowth ginseng. The ginsenoside content of DfG was significantly lower than that of MOFG, but there was no significant difference in the ginsenoside content between DFG and the other three understory ginseng, which might be because the first planting environment of the felling forest was similar to that of the forestland; as such, the ginsenoside content of DFG was similar to that of the understory ginseng.
Not only were the fresh root weights of BFG much lower than those of the other three understory ginseng species, but the stem length and thickness of the aboveground part of BFG were also small. The aboveground part is the main one used for the plant’s photosynthesis. If the aboveground growth is poor, it will affect the material accumulation of each part of the plant [31,32,33]. The yield of understory ginseng ultimately affects the economic benefit. Considering quality and yield comprehensively, MOFG is the most suitable for planting understory ginseng, and its yield and quality are the best. In addition, MWFG has a higher yield, but its quality is lower than that of MOFG, thus it can be used as an alternative.
4.2. Differences in the Soil Chemical Properties and Enzyme Activity of Forest Types and Cultivation Methods
Soil pH is an important factor affecting ginseng cultivation [34,35,36]. The cultivation of ginseng will lead to soil acidification and pH reduction, which is also one of the reasons for the continuous cropping obstacles of ginseng [37]. The soil pH of FlG is significantly lower than that of the other five, indicating that the cultivation of ginseng in farmlands makes soil acidification more serious. Furthermore, its lower pH leads to an increase in ginseng diseases, which is also one of the reasons why ginseng cultivation in farmland generally harvests in about 5 years. The MOFG may be due to the higher pH of the soil, which is more suitable for the growth of ginseng, and thus the higher yield.
Although soil enzymes cannot directly participate in the accumulation of the effective components of ginseng, soil enzymes are the driving force of all biochemical reactions in soil, promoting the decomposition and transformation of organic matter in soil and the release of effective nutrients [38,39,40]. The S-SC and S-ACP of FlG are small, and the S-UE of DfG and FlG are significantly higher than the other four. The difference in soil enzyme activity affects the nutrient content, and ultimately leads to a difference in the ginseng.
4.3. Differences of Soil Bacteria in the Forest Types and Cultivation Methods
Soil microorganisms are the main driving force of various biogeochemical processes. Bacteria are an important part of soil microorganisms, and most of the bacteria inhabiting plant roots come from soil [41,42]. The intensity of carbon source metabolism is generally proportional to the quantity, ability, and diversity of corresponding microbes [43,44]. The results showed that the AWCD value of FlG was significantly lower than that of the other samples, indicating that the microbial activity was relatively weak, and that the use of carbon sources was insufficient (Figure 1) [45,46]. In addition, we found that the use of 2-hydroxybenzoicacid by FlG and DfG was almost zero, which may be due to the effect of non-forest ginseng cultivation on soil microbial species (Figure 2). Of course, the Biolog-ECO plate has limitations, as it detects only metabolically active and aerobic bacteria; it also provides only a small amount of ecologically relevant carbon sources [47,48].
The 16S rRNA sequencing results showed (Figure 5) that in all samples, Acidobacteria and Proteobacteria were the main component bacteria of soil, which was the same as the results of previous studies [49]. Studies have shown that Acidobacteria Gp1–3 has a relatively high abundance in forest soil [50], and is affected by soil pH [51,52]. In this study, the Acidobacteria of FlG was significantly lower than that of other samples, and its soil pH was lower, which was the same as the conclusion of previous studies. FAPROTAX was used to predict microbial function (Figure 4). Furthermore, the microbial function of FlG was significantly different from that of other plots, which was mainly reflected in the low number of microorganisms related to nitrogen metabolism, indicating that the nitrogen cycling rate of farmland soil was lower than that of woodland soil [53]. In addition, the human-associated microbes in FlG were higher, which may be due to the high abundance of human-related microbes that are caused by more human interference in the cultivation process of farmland.
4.4. Quality of Ginseng Is Related to Soil Microecology
According to the thermal map of ginsenoside content correlation (Figure 6), it was found that ginsenosides were more closely related to soil bacteria and chemical properties, indicating that they played an important role in the formation of ginseng quality. In soil chemistry and enzyme activity, the pH was positively correlated with ginsenoside content, indicating that the soil was too acidic for ginsenoside synthesis [54]. The Cu and S-UE were negatively correlated with ginsenoside content, which might be due to the inhibition of ginsenoside synthesis by a higher Cu content [55]. The soil bacteria, mainly Chloroflex and Firmicutes, have a significant negative correlation with the content of ginsenoside. We all know that Chloroflex and Firmicutes play an important role in the soil nutrient cycle and are beneficial microorganisms for plants [56,57,58], but they play a negative role in the formation of the quality of medicinal materials. This phenomenon may be caused by the unique nature of medicinal materials, as they have “yield in prosperity, quality in adversity”. Secondary metabolites are often produced when plants receive external stress [59], and a relatively good soil microbial environment is not conducive to their synthesis.
5. Conclusions
This study mainly discussed the differences in ginseng quality and soil microecology between forest planting (divided into four forest types), farmland planting, and felling planting, as well as their relationships. We found that the understory ginseng of MOFG has good quality and high yield and that it is the most suitable forest type for the development of the understory ginseng industry. Meanwhile, the understory ginseng of BFG has poor growth and good yield; thus, it should be avoided as much as possible. The pH of DfG was significantly lower than that of other plots, and the abundance of bacteria related to nitrogen metabolism was lower. The correlation results showed that soil chemical properties and bacterial abundance were strongly correlated with ginsenoside content, especially Chloroflexi and Firmicutes. In addition, the strong correlation between ginsenoside Rg2 and its many soil factors indicated that ginsenoside Rg2 was more sensitive to soil environmental changes.
Supplementary Materials
The following supporting information can be downloaded at: https://www.mdpi.com/article/10.3390/horticulturae9040520/s1, Table S1: Gradient elution conditions. Table S2: Ginsenoside standard curve and linear range. Table S3: Soil chemical properties. Table S4: Soil enzyme activities. Figure S1: UpSet diagram of bacterial OTU abundance. Figure S2: PCoA analysis of bacterial OTU abundance. Figure S3: LEfSe-based linear discriminant analysis (LDA) (LDA discrimination table, LDA > 4.0).
Author Contributions
Conceptualization, M.H. and L.Y.; Methodology, Y.L. and M.Z.; Software, Y.L. and M.Z.; Validation, Y.L. and M.Z.; Formal Analysis, Y.L. and M.Z.; Investigation, Y.L. and M.Z.; Data Curation, Y.L.; Writing—Original Draft Preparation, Y.L.; Writing—Review and Editing, M.H. and L.Y.; Visualization, Y.L.; Supervision, Y.L. and M.Z.; Project Administration, M.H. and L.Y.; Funding Acquisition, M.H. and L.Y. All authors have read and agreed to the published version of the manuscript.
Funding
This work was supported by major science and technology projects of the Jilin Provincial Science and Technology Development Plan (20200504002YY) and projects supported by the national modern agricultural industrial technology system (CARS-21).
Data Availability Statement
Not applicable.
Conflicts of Interest
The authors declare no conflict of interest.
References
- Peng, X.J.; Hao, M.Q.; Zhao, Y.C.; Cai, Y.; Chen, X.Y.; Chen, H.Y.; Zhang, Y.; Dong, L.; Liu, X.L.; Ding, C.B.; et al. Red ginseng has stronger anti-aging effects compared to ginseng possibly due to its regulation of oxidative stress and the gut microbiota. Phytomedicine 2021, 93, 153772. [Google Scholar] [CrossRef] [PubMed]
- Choi, J.H.; Jang, M.; Kim, E.-J.; Lee, M.J.; Park, K.S.; Kim, S.-H.; In, J.-G.; Kwak, Y.-S.; Park, D.-H.; Cho, S.-S.; et al. Korean Red Ginseng alleviates dehydroepiandrosterone-induced polycystic ovarian syndrome in rats via its antiinflammatory and antioxidant activities. J. Ginseng Res. 2020, 44, 790–798. [Google Scholar] [CrossRef]
- Yang, Y.; Wang, H.; Zhang, M.; Shi, M.X.; Yang, C.L.; Ni, Q.; Wang, Q.; Li, J.; Wang, X.M.; Zhang, C.; et al. Safety and antifatigue effect of Korean Red Ginseng capsule: A randomized, double-blind and placebo-controlled clinical trial. J. Ginseng Res. 2022, 46, 543–549. [Google Scholar] [CrossRef]
- Liu, H.B.; Lu, X.Y.; Hu, Y.; Fan, X.H. Chemical constituents of Panax ginseng and Panax notoginseng explain why they differ in therapeutic efficacy. Pharmacol. Res. 2020, 161, 105263. [Google Scholar] [CrossRef]
- Fang, X.; Wang, H.; Zhao, L.; Wang, M.; Sun, M. Diversity and structure of the rhizosphere microbial communities of wild and cultivated ginseng. BMC Microbiol. 2022, 22, 2. [Google Scholar] [CrossRef]
- Zhang, J.X.; Zhou, D.P.; Yuan, X.Q.; Xu, Y.H.; Chen, C.B.; Zhao, L. Soil microbiome and metabolome analysis reveals beneficial effects of ginseng-celandine rotation on the rhizosphere soil of ginseng-used fields. Rhizosphere-Neth 2022, 23, 100559. [Google Scholar] [CrossRef]
- Wu, J.-J.; Yang, Y.; Wan, Y.; Xia, J.; Xu, J.-F.; Zhang, L.; Liu, D.; Chen, L.; Tang, F.; Ao, H.; et al. New insights into the role and mechanisms of ginsenoside Rg1 in the management of Alzheimer’s disease. Biomed. Pharmacother. 2022, 152, 113207. [Google Scholar] [CrossRef]
- Sun, X.; Cheng, Y. Role of ginsenoside Rh2 in tumor therapy and tumor microenvironment immunomodulation. Biomed. Pharmacother. 2022, 156, 113912. [Google Scholar] [CrossRef]
- Zhu, L.L.; Xu, L.; Huang, Y.; Xie, C.X.; Dou, D.Q.; Xu, J. Correlations between ecological factors and the chemical compositions of mountainous forest cultivated ginseng. J. Food Compos. Anal. 2022, 114, 104867. [Google Scholar] [CrossRef]
- Xiao, C.; Yang, L.; Zhang, L.; Liu, C.; Han, M. Effects of cultivation ages and modes on microbial diversity in the rhizosphere soil of Panax ginseng. J. Ginseng. Res. 2016, 40, 28–37. [Google Scholar] [CrossRef]
- Dong, L.L.; Xu, J.; Li, Y.; Fang, H.L.; Niu, W.H.; Li, X.W.; Zhang, Y.J.; Ding, W.L.; Chen, S.L. Manipulation of microbial community in the rhizosphere alleviates the replanting issues in Panax ginseng. Soil Biol. Biochem. 2018, 125, 64–74. [Google Scholar] [CrossRef]
- Jang, S.-W.; Bin Sadiq, N.; Hamayun, M.; Jung, J.; Lee, T.; Yang, J.S.; Lee, B.; Kim, H.Y. Silicon foliage spraying improves growth characteristics, morphological traits, and root quality of Panax ginseng CAMey. Ind. Crop. Prod. 2020, 156, 112848. [Google Scholar] [CrossRef]
- Zuppinger-Dingley, D.; Schmid, B.; Petermann, J.S.; Yadav, V.; De Deyn, G.B.; Flynn, D.F.B. Selection for niche differentiation in plant communities increases biodiversity effects. Nature 2014, 515, 108–111. [Google Scholar] [CrossRef]
- Popescu, D.I.; Lengyel, E.; Apostolescu, F.G.; Soare, L.C.; Botoran, O.R.; Sutan, N.A. Volatile Compounds and Antioxidant and Antifungal Activity of Bud and Needle Extracts from Three Populations of Pinus mugo Turra Growing in Romania. Horticulturae 2022, 8, 952. [Google Scholar] [CrossRef]
- Sun, H.; Wang, Q.-X.; Liu, N.; Li, L.; Zhang, C.-G.; Liu, Z.-B.; Zhang, Y.-Y. Effects of different leaf litters on the physicochemical properties and bacterial communities in Panax ginseng-growing soil. Appl. Soil Ecol. 2017, 111, 17–24. [Google Scholar] [CrossRef]
- Sun, H.; Wang, Q.X.; Zhang, L.L.; Liu, N.; Liu, Z.B.; Lv, L.; Shao, C.; Guan, Y.M.; Ma, L.; Li, M.J.; et al. Distinct leaf litter drive the fungal communities in Panax ginseng-growing soil. Ecol. Indic. 2019, 104, 184–194. [Google Scholar] [CrossRef]
- Shala, A.Y.; Gururani, M.A. Phytochemical Properties and Diverse Beneficial Roles of Eucalyptus globulus Labill.: A Review. Horticulturae 2021, 7, 450. [Google Scholar] [CrossRef]
- Ruan, X.J. Effects of Four Factors such as Different Forest Types on the Accumulation of Ginsenosides and Amino Acids under the Forest. Master’ Thesis, Jilin Agricultural University, Changchun, China, 2019. [Google Scholar]
- Yeomans, J.C.; Bremner, J.M. A rapid and precise method for routine determination of organic carbon in soil. Commun. Soil Sci. Plant Anal. 1988, 19, 1467–1476. [Google Scholar] [CrossRef]
- Huang, S.H.; Fang, B.; Li, X.; He, S.S. Study on spatial heterogeneity of alkali-hydrolyzable nitrogen in paddy fields at the county scale. J. Ecol. Rural Environ. 2020, 36, 179–185. [Google Scholar] [CrossRef]
- Tang, J.Y.; Zhang, L.H.; Zhang, J.C.; Ren, L.H.; Zhou, Y.Y.; Zheng, Y.Y.; Luo, L.; Yang, Y.; Huang, H.L.; Chen, A.W. Physicochemical features, metal availability and enzyme activity in heavy metal-polluted soil remediated by biochar and compost. Sci. Total Environ. 2020, 701, 134751. [Google Scholar] [CrossRef]
- Papa, S.; Fusco, G.M.; Ciriello, M.; Formisano, L.; Woo, S.L.; De Pascale, S.; Rouphael, Y.; Carillo, P. Microbial and Non-Microbial Biostimulants as Innovative Tools to Increase Macro and Trace Element Mineral Composition of Tomato and Spinach. Horticulturae 2022, 8, 1157. [Google Scholar] [CrossRef]
- van Wyk, D.A.B.; Adeleke, R.; Rhode, O.H.J.; Bezuidenhout, C.C.; Mienie, C. Ecological guild and enzyme activities of rhizosphere soil microbial communities associated with Bt-maize cultivation under field conditions in North West Province of South Africa. J. Basic Microb. 2017, 57, 781–792. [Google Scholar] [CrossRef] [PubMed]
- Li, X.; Li, Y.Y.; An, S.S.; Zeng, Q.C. Effects of stem and leaf decomposition in typical herbs on soil enzyme activity and microbial diversity in the south Ningxia loess hilly region of Northwest China. J. Appl. Ecol. 2016, 27, 3182–3188. [Google Scholar]
- Tabatabai, M.A.; Bremner, J.M. Assay of urease activity in soils. Soil Biol. Biochem. 1972, 4, 479–487. [Google Scholar] [CrossRef]
- Sinha, A.K. Colorimetric assay of catalase. Anal. Biochem. 1972, 47, 389–394. [Google Scholar] [CrossRef]
- Zhang, Y.M.; Wang, X.C.C.; Cheng, Z.; Li, Y.Y.; Tang, J.L. Effects of additional fermented food wastes on nitrogen removal enhancement and sludge characteristics in a sequential batch reactor for wastewater treatment. Environ. Sci. Pollut. Res. 2016, 23, 12890–12899. [Google Scholar] [CrossRef]
- Louca, S.; Parfrey, L.W.; Doebeli, M. Decoupling function and taxonomy in the global ocean microbiome. Science 2016, 353, 1272–1277. [Google Scholar] [CrossRef]
- Wolinska, A.; Galazka, A.; Kuzniar, A.; Goraj, W.; Jastrzebska, N.; Grzadziel, J.; Stepniewska, Z. Catabolic Fingerprinting and Diversity of Bacteria in Mollic Gleysol Contaminated with Petroleum Substances. Appl. Sci. 2018, 8, 1970. [Google Scholar] [CrossRef]
- Zhu, L.L.; Xu, L.; Dou, D.Q.; Huang, L.Q. The distinct of chemical profiles of mountainous forest cultivated ginseng and garden ginseng based on ginsenosides and oligosaccharides. J. Food. Compos. Anal. 2021, 104, 104165. [Google Scholar] [CrossRef]
- Yamashita, M.; Ootsuka, C.; Kubota, H.; Adachi, S.; Yamaguchi, T.; Murata, K.; Yamamoto, T.; Ueda, T.; Ookawa, T.; Hirasawa, T. Alleles of high-yielding indica rice that improve root hydraulic conductance also increase flag leaf photosynthesis, biomass, and grain production of japonica rice in the paddy field. Field Crop. Res. 2022, 289, 108725. [Google Scholar] [CrossRef]
- Gaju, O.; DeSilva, J.; Carvalho, P.; Hawkesford, M.J.; Griffiths, S.; Greenland, A.; Foulkes, M.J. Leaf photosynthesis and associations with grain yield, biomass and nitrogen-use efficiency in landraces, synthetic-derived lines and cultivars in wheat. Field Crop. Res. 2016, 193, 1–15. [Google Scholar] [CrossRef]
- Carmo-Silva, E.; Andralojc, P.J.; Scales, J.C.; Driever, S.M.; Mead, A.; Lawson, T.; Raines, C.A.; Parry, M.A.J. Phenotyping of field-grown wheat in the UK highlights contribution of light response of photosynthesis and flag leaf longevity to grain yield. J. Exp. Bot. 2017, 68, 3473–3486. [Google Scholar] [CrossRef] [PubMed]
- Liu, S.; Wang, Z.Y.; Niu, J.F.; Dang, K.K.; Zhang, S.K.; Wang, S.Q.; Wang, Z.Z. Changes in physicochemical properties, enzymatic activities, and the microbial community of soil significantly influence the continuous cropping of Panax quinquefolius L. (American ginseng). Plant Soil 2021, 463, 427–446. [Google Scholar] [CrossRef]
- Kim, C.; Choo, G.C.; Cho, H.S.; Lim, J.T. Soil properties of cultivation sites for mountain-cultivated ginseng at local level. J. Ginseng Res. 2015, 39, 76–80. [Google Scholar] [CrossRef] [PubMed]
- Matsumoto, S.; Doi, H.; Kasuga, J. Changes over the Years in Soil Chemical Properties Associated with the Cultivation of Ginseng (Panax ginseng Meyer) on Andosol Soil. Agriculture 2022, 12, 1223. [Google Scholar] [CrossRef]
- Zhang, J.G.; Fan, S.H.; Qin, J.; Dai, J.C.; Zhao, F.J.; Gao, L.Q.; Lian, X.H.; Shang, W.J.; Xu, X.M.; Hu, X.P. Changes in the Microbiome in the Soil of an American Ginseng Continuous Plantation. Front. Plant Sci. 2020, 11, 572199. [Google Scholar] [CrossRef]
- Trasar-Cepeda, C.; Leiros, M.C.; Gil-Sotres, F. Hydrolytic enzyme activities in agricultural and forest soils. Some implications for their use as indicators of soil quality. Soil Biol. Biochem. 2008, 40, 2146–2155. [Google Scholar] [CrossRef]
- Stursova, M.; Baldrian, P. Effects of soil properties and management on the activity of soil organic matter transforming enzymes and the quantification of soil-bound and free activity. Plant Soil 2011, 338, 99–110. [Google Scholar] [CrossRef]
- Kalendar, O.V.; Kostikova, V.A.; Kukushkina, T.A.; Erst, A.S.; Kuznetsov, A.A.; Kulikovskiy, M.S.; Vasilyeva, O.Y. Seasonal Development of Paeonia obovata and Paeonia oreogeton and Their Contents of Biologically Active and Reserve Substances in the Forest-Steppe Zone of Western Siberia. Horticulturae 2023, 9, 102. [Google Scholar] [CrossRef]
- Muller, D.B.; Vogel, C.; Bai, Y.; Vorholt, J.A. The Plant Microbiota: Systems-Level Insights and Perspectives. Annu. Rev. Genet. 2016, 50, 211–234. [Google Scholar] [CrossRef]
- Wang, X.J.; Cao, B.; Zou, J.; Xu, A.Y.; Feng, X.R. Intercropping Gramineae Herbage in Semiarid Jujube Cultivar ‘LingwuChangzao’ (Ziziphus jujuba Mill. cv. LingwuChangzao) Orchard Improves Productivity, Plant Nutritional Quality, and Soil Quality. Horticulturae 2022, 8, 834. [Google Scholar] [CrossRef]
- Ge, Z.; Du, H.; Gao, Y.; Qiu, W. Analysis on Metabolic Functions of Stored Rice Microbial Communities by BIOLOG ECO Microplates. Front Microbiol. 2018, 9, 1375. [Google Scholar] [CrossRef]
- Koner, S.; Chen, J.-S.; Hsu, B.-M.; Rathod, J.; Huang, S.-W.; Chien, H.-Y.; Hussain, B.; Chan, M.W.Y. Depth-resolved microbial diversity and functional profiles of trichloroethylene-contaminated soils for Biolog EcoPlate-based biostimulation strategy. J. Hazard. Mater. 2022, 424, 127266. [Google Scholar] [CrossRef]
- Xu, H.-Q.; Zhang, J.-E.; Ouyang, Y.; Lin, L.; Quan, G.-M.; Zhao, B.-L.; Yu, J.-Y. Effects of simulated acid rain on microbial characteristics in a lateritic red soil. Environ. Sci. Pollut. Res. Int. 2015, 22, 18260–18266. [Google Scholar] [CrossRef]
- Stemmer, M.; Watzinger, A.; Blochberger, K.; Haberhauer, G.; Gerzabek, M.H. Linking dynamics of soil microbial phospholipid fatty acids to carbon mineralization in a C-13 natural abundance experiment: Impact of heavy metals and acid rain. Soil Biol. Biochem. 2007, 39, 3177–3186. [Google Scholar] [CrossRef]
- Stefanowicz, A. The biolog plates technique as a tool in ecological studies of microbial communities. Pol. J. Environ. Stud. 2006, 15, 669–676. [Google Scholar]
- Calbrix, R.; Laval, K.; Barray, S. Analysis of the potential functional diversity of the bacterial community in soil: A reproducible procedure using sole-carbon-source utilization profiles. Eur. J. Soil Biol. 2005, 41, 11–20. [Google Scholar] [CrossRef]
- Ying, Y.X.; Ding, W.L.; Li, Y. Characterization of Soil Bacterial Communities in Rhizospheric and Nonrhizospheric Soil of Panax ginseng. Biochem. Genet. 2012, 50, 848–859. [Google Scholar] [CrossRef]
- Kim, H.S.; Lee, S.H.; Jo, H.Y.; Finneran, K.T.; Kwon, M.J. Diversity and composition of soil Acidobacteria and Proteobacteria communities as a bacterial indicator of past land-use change from forest to farmland. Sci. Total Environ. 2021, 797, 148944. [Google Scholar] [CrossRef]
- Jones, R.T.; Robeson, M.S.; Lauber, C.L.; Hamady, M.; Knight, R.; Fierer, N. A comprehensive survey of soil acidobacterial diversity using pyrosequencing and clone library analyses. ISME J. 2009, 3, 442–453. [Google Scholar] [CrossRef]
- Rousk, J.; Baath, E.; Brookes, P.C.; Lauber, C.L.; Lozupone, C.; Caporaso, J.G.; Knight, R.; Fierer, N. Soil bacterial and fungal communities across a pH gradient in an arable soil. ISME J. 2010, 4, 1340–1351. [Google Scholar] [CrossRef] [PubMed]
- Sun, Y.; Li, H. Data mining for evaluating the ecological compensation, static and dynamic benefits of returning farmland to forest. Environ. Res. 2021, 201, 111524. [Google Scholar] [CrossRef] [PubMed]
- Jin, Q.; Zhang, Y.Y.; Ma, Y.Y.; Sun, H.; Guan, Y.M.; Liu, Z.B.; Ye, Q.; Zhang, Y.; Shao, C.; Mu, P.; et al. The composition and function of the soil microbial community and its driving factors before and after cultivation of Panax ginseng in farmland of different ages. Ecol. Indic. 2022, 145, 109748. [Google Scholar] [CrossRef]
- Xue, X.L.; Zhang, X.H.; Yu, J.P.; Kong, L.Y.; Wang, Z.S.; Xi, G.S. Effect of heavy metal stress on ginsenoside content. Chin. Med. Mater. 2018, 41, 2511–2515. [Google Scholar] [CrossRef]
- Semenov, M.V.; Krasnov, G.S.; Semenov, V.M.; Ksenofontova, N.; Zinyakova, N.B.; van Bruggen, A.H.C. Does fresh farmyard manure introduce surviving microbes into soil or activate soil-borne microbiota? J. Environ. Manag. 2021, 294, 113018. [Google Scholar] [CrossRef]
- Li, M.; Pommier, T.; Yin, Y.; Wang, J.N.; Gu, S.H.; Jousset, A.; Keuskamp, J.; Wang, H.G.; Wei, Z.; Xu, Y.C.; et al. Indirect reduction of Ralstonia solanacearum via pathogen helper inhibition. ISME J. 2022, 16, 868–875. [Google Scholar] [CrossRef]
- Xian, W.D.; Zhang, X.T.; Li, W.J. Research status and prospect of Curvularia viridis. J. Microb. 2020, 60, 1801–1820. [Google Scholar] [CrossRef]
- Yang, L.L.; Yang, L.; Lan, Y.M.; Zhao, Y.; Han, M.; Yang, L.M. Exogenous abscisic acid reduces saikosaponin accumulation by inhibiting saikosaponin synthesis pathway gene expression under drought stress in Bupleurum chinense DC. Ind. Crops Prod. 2020, 154, 112686. [Google Scholar] [CrossRef]
Figure 1.
The AWCD value of the soil microorganisms. MOFG, Mongolian oak forest ginseng; BFG, birch forest ginseng; MWFG, miscellaneous wood forest ginseng; PFG, poplar forest ginseng; FlG, farmland ginseng; DfG, deforestation ginseng.
Figure 1.
The AWCD value of the soil microorganisms. MOFG, Mongolian oak forest ginseng; BFG, birch forest ginseng; MWFG, miscellaneous wood forest ginseng; PFG, poplar forest ginseng; FlG, farmland ginseng; DfG, deforestation ginseng.

Figure 2.
Use degree of a single carbon source by a soil microorganism. MOFG, Mongolian oak forest ginseng; BFG, birch forest ginseng; MWFG, miscellaneous wood forest ginseng; PFG, poplar forest ginseng; FlG, farmland ginseng; DfG, deforestation ginseng. The depth of color represents the use degree of soil microorganisms to the corresponding carbon source. The darker the color is, the stronger the use degree is, and vice versa.

Figure 3.
Stripe (a) and heat map (b) of the relative abundance of bacteria at the gate level. MOFG, Mongolian oak forest ginseng; BFG, birch forest ginseng; MWFG, miscellaneous wood forest ginseng; PFG, poplar forest ginseng. FlG, farmland ginseng; DfG, deforestation ginseng. The fringe pattern (a) and thermal pattern (b) of the relative abundance of bacteria at the gate level reflect the change in the abundance from low to high with the gradient color from blue to red. The closer the color to blue, the lower the abundance, and the closer to red, the higher the abundance. The heat map is transformed by the Z value to normalize the expression abundance of the same bacteria.

Figure 4.
Bacterial function cluster heat map based on FAPROTAX prediction. MOFG, Mongolian oak forest ginseng; BFG, birch forest ginseng; MWFG, miscellaneous wood forest ginseng; PFG, poplar forest ginseng. FlG, farmland ginseng; DfG, deforestation ginseng. The gradient color from blue to red is used to reflect the change in abundance from low to high. The closer the color to blue, the lower the abundance, and the closer to red, the higher the abundance. The heat map is transformed by the Z value to normalize the expression abundance of the same bacteria.

Figure 5.
The RDA of bacteria and soil chemical properties (a). The single carbon source (b) at the gate level. Blue arrow: door of bacteria; red arrow: soil chemical properties (a), and the single carbon source (b). MOFG, Mongolian oak forest ginseng; BFG, birch forest ginseng; MWFG, miscellaneous wood forest ginseng; PFG, poplar forest ginseng. FlG, farmland ginseng; DfG, deforestation ginseng.

Figure 6.
Heat map of the correlation between ginsenoside and soil chemical properties, as well as between the carbon source, bacterial abundance, and bacterial function. Red represents a positive correlation; blue represents a negative correlation. The darker the color, the stronger the correlation. (*: p < 0.05; **: p < 0.01; ***: p < 0.001).


Table 1.
The ginseng saponin content in different planting modes.
| Rg1 (%) | Re (%) | Rf (%) | Rg2 (%) | Rc (%) | |
| MOFG | 0.1598 ± 0.0351 a | 0.3046 ± 0.0275 a | 0.1347 ± 0.0166 a | 0.0367 ± 0.0063 ab | 0.3279 ± 0.0596 a |
| BFG | 0.1189 ± 0.0176 b | 0.2613 ± 0.0338 abc | 0.0961 ± 0.017 bc | 0.0288 ± 0.0066 bc | 0.2694 ± 0.0341 ab |
| MWFG | 0.0906 ± 0.0161 b | 0.2472 ± 0.0396 bc | 0.0841 ± 0.0103 c | 0.0308 ± 0.0040 abc | 0.2109 ± 0.0253 b |
| PFG | 0.0852 ± 0.0142 b | 0.2518 ± 0.0046 bc | 0.0705 ± 0.0092 c | 0.0261 ± 0.0015 c | 0.2117 ± 0.0271 b |
| DfG | 0.0993 ± 0.0137 b | 0.2392 ± 0.0172 d | 0.0916 ± 0.0084 c | 0.0173 ± 0.0028 d | 0.2101 ± 0.0283 b |
| FlG | 0.0609 ± 0.0085 c | 0.2603 ± 0.0219 d | 0.0544 ± 0.0096 d | 0.0147 ± 0.0019 d | 0.1229 ± 0.0155 c |
| Rb1 (%) | Rb2 (%) | Rb3 (%) | Rd (%) | TS (%) | |
| MOFG | 0.5464 ± 0.0968 a | 0.5434 ± 0.0431 a | 0.0318 ± 0.0067 a | 0.0667 ± 0.0087 a | 2.1520 ± 0.0554 a |
| BFG | 0.3908 ± 0.0553 b | 0.3437 ± 0.0404 b | 0.0185 ± 0.0036 b | 0.0515 ± 0.0076 b | 1.5790 ± 0.2007 b |
| MWFG | 0.3659 ± 0.0418 c | 0.2126 ± 0.0503 c | 0.0163 ± 0.0032 b | 0.0464 ± 0.0039 b | 1.3048 ± 0.2018 bc |
| PFG | 0.2878 ± 0.0333 cd | 0.2177 ± 0.0137 d | 0.0120 ± 0.0018 b | 0.0334 ± 0.0027 cd | 1.1962 ± 0.0955 c |
| DfG | 0.4271 ± 0.0472 b | 0.3205 ± 0.0273 b | 0.0152 ± 0.0025 b | 0.0191 ± 0.0018 e | 1.3394 ± 0.1725 bc |
| FlG | 0.2318 ± 0.0326 d | 0.1195 ± 0.0244 d | 0.0148 ± 0.0031 b | 0.0226 ± 0.0042 de | 0.8019 ± 0.0834 d |
Note: TS, total ginsenoside; MOFG, Mongolian oak forest ginseng; BFG, birch forest ginseng; MWFG, miscellaneous wood forest ginseng; PFG, poplar forest ginseng; FlG, farmland ginseng; DfG, deforestation ginseng. values are the means of the five replicates ± SE. The treatment means with different letters are significantly different (p < 0.05).
Table 2.
Yield and growth status of ginseng under forest.
| Output (g·m−2) | Stem Length (cm) | Stem Thickness (cm) | Root Length (cm) | Root Thickness (cm) | Fresh Root Weight (g) | |
|---|---|---|---|---|---|---|
| MOFG | 31.25 ± 7.38 a | 23.63 ± 9.6 bc | 0.34 ± 0.07 b | 6.57 ± 2.54 a | 1.19 ± 0.23 ab | 6.63 ± 1.64 a |
| BFG | 14.62 ± 3.82 b | 19.51 ± 7.35 c | 0.24 ± 0.08 c | 6.56 ± 2.43 a | 0.95 ± 0.31 b | 2.55 ± 1.77 b |
| MWFG | 27.13 ± 4.72 a | 28.51 ± 6.13 ab | 0.35 ± 0.09 b | 6.72 ± 3.4 a | 1.21 ± 0.29 a | 6.21 ± 2.45 a |
| PFG | 26.16 ± 6.01 a | 33.06 ± 5.66 a | 0.45 ± 0.11 a | 7.95 ± 2.11 a | 1.34 ± 0.26 a | 6.49 ± 3.55 a |
Tote: MOFG, Mongolian oak forest ginseng; BFG, birch forest ginseng; MWFG, miscellaneous wood forest ginseng; PFG, poplar forest ginseng; Values are means of five replicates ± SE. Treatment means with different letters are significantly different (p < 0.05).
Disclaimer/Publisher’s Note: The statements, opinions and data contained in all publications are solely those of the individual author(s) and contributor(s) and not of MDPI and/or the editor(s). MDPI and/or the editor(s) disclaim responsibility for any injury to people or property resulting from any ideas, methods, instructions or products referred to in the content. |
© 2023 by the authors. Licensee MDPI, Basel, Switzerland. This article is an open access article distributed under the terms and conditions of the Creative Commons Attribution (CC BY) license (https://creativecommons.org/licenses/by/4.0/).
Share and Cite
MDPI and ACS Style
Lan, Y.; Zhang, M.; Han, M.; Yang, L. Differences in the Quality, Yield, and Soil Microecology of Ginseng in Different Planting Environments. Horticulturae 2023, 9, 520. https://doi.org/10.3390/horticulturae9040520
AMA Style
Lan Y, Zhang M, Han M, Yang L. Differences in the Quality, Yield, and Soil Microecology of Ginseng in Different Planting Environments. Horticulturae. 2023; 9(4):520. https://doi.org/10.3390/horticulturae9040520
Chicago/Turabian StyleLan, Yiming, Meng Zhang, Mei Han, and Limin Yang. 2023. "Differences in the Quality, Yield, and Soil Microecology of Ginseng in Different Planting Environments" Horticulturae 9, no. 4: 520. https://doi.org/10.3390/horticulturae9040520
Note that from the first issue of 2016, this journal uses article numbers instead of page numbers. See further details here.