
Precise Sensing of Leaf Temperatures for Smart Farm Applications

1
Division of Horticultural Science, Gyeongsang National University, Jinju 52725, Republic of Korea
2
Department of GreenBio Science, Gyeongsang National University, Jinju 52725, Republic of Korea
3
NEOFARM Ltd., Jinju 52711, Republic of Korea
4
Department of Smart Agro-Industry, Gyeongsang National University, Jinju 52725, Republic of Korea
*
Author to whom correspondence should be addressed.
†
These authors contributed equally to this work.
Horticulturae 2023, 9(4), 518; https://doi.org/10.3390/horticulturae9040518
Submission received: 2 March 2023
/
Revised: 17 April 2023
/
Accepted: 19 April 2023
/
Published: 21 April 2023
Abstract
:Leaf temperature represents the mixed effects of solar radiation, temperature, and CO2 enrichment on the potential production of greenhouse vegetables. However, smart farm applications that monitor and account for changes in leaf temperature are limited. This study developed new hardware and software components for leaf temperature sensing integrated into a conventional smart farm system. We demonstrated a new system to monitor leaf temperatures and improve crop yield at two greenhouse tomato and strawberry farms in South Korea. We observed a rapid decline in leaf temperature at both farms when the indoor air temperature decreased. This pattern often corresponds to stagnant CO2 assimilation. The results suggest that leaf temperature sensing is practical for slow aeration and heating that is required to optimize photosynthetic efficiency, especially in the morning and when leaf temperatures become high (over 25 °C). Specifically, smart farm implementation with leaf temperature sensing increased the yield of tomatoes by 28–43%. Furthermore, our study highlights the need to develop leaf temperature models for smart greenhouse farming that interact with nutrient and water supplies.
1. Introduction
Controlled environment agriculture (CEA) is a form of intensive farming that ensures reliable crop protection regardless of adverse environmental conditions. The agronomic importance of protected cultivation is evident, allowing efficient and high crop production in soils or substrates across various land and geographic constraints [1,2,3]. Different CEA types include greenhouse, hydroponic, aeroponic, and aquaponic systems. Each system is characterized by high technology and capital investment [4]. Compared to open fields, the total yield was 3.8 times and 2.8–25.0 times higher for tomato and other vegetable crops in hydroponic production, respectively [5]. Similarly, Maureira et al. [6] reported a 6.4 times higher tomato yield (kg m−2) in high-tech greenhouses compared to open fields. Most of these systems provide a platform for the precise control of temperature, humidity, carbon dioxide (CO2), oxygen (O2), and light, which are the main constraints on the efficiency of crop growth. Recent advances in CEA using sensor technologies have produced data and provided more accurate plant growth models [7].
Cultivating vegetables using protected structures has a long history, and modern systems appear in greenhouse cultivation [8]. Innovations in greenhouse vegetable production have been made in designing the structure, type, and quality of covering materials; screening high-yielding cultivars; and improving crop management practices, including microclimate control and integrated pest management [9]. In addition, a recent innovation in CEA is the on-demand cost-effective maintenance and precision control of greenhouse environments to achieve economic crop growth and yields. Environmental variables, in addition to management inputs and crop outputs of the CEA model, are related to the efficiency of a greenhouse system [10]. Standard variables include temperature, humidity, evapotranspiration, CO2 concentration in the air, and the amount of light entering the system [11]. For example, because photosynthesis requires energy from light, the light environment must be controlled. Xin et al. [12] highlighted the measurement of light saturation points to optimize the use of light for greenhouse crop production under different temperatures and CO2 levels. The maintenance and management of these primary variables should be based on environmental monitoring frameworks and the use of up-to-date information.
There is an ongoing effort to control multiple environments, including light and energy, fertilizers, water, and other processes (relating to crop growth, productivity, and quality) [13,14]. Such approaches are flexible and tailored to enhance resource use efficiency due to the ongoing depletion of natural resources while using lower labor inputs and precisely optimizing growth conditions. For example, studies have focused on energy efficiency [1] and water use [3,15]. These studies suggest that new crop growth control is the key to widening smart farm applications regarding sustainability, labor saving, and profitability. Other controls are used to detect and manage nutrient deficiencies, pests, and diseases [16]. Compared to conventional field cropping systems, evaluating how exactly a smart farm performs and creates an environmentally friendly footprint, such as acidification and salt accumulation in soils [17] and the potential for global warming [18], is crucial. More importantly, a smart farm system is considered an option that can address global challenges facing agriculture, such as food security, environmental pollution, and climate change [19]. Such new knowledge offers opportunities for sustainable agricultural production and the better use of natural resources. However, the effects of common factors on indoor crop growth and development may differ because a wide range of smart farm components are considered for different applications. For vegetable growth to be standardized and optimized, selecting and focusing on relevant stress factors is challenging due to the complexity of technology [20].
There is relatively little attention paid to monitoring plant parameters in addition to environmental parameters, such as temperature, relative humidity, light, and CO2 concentration [21]. Temperature near the surface of various crop parts affects plant growth and metabolism. In particular, experiments have shown that leaf temperature represents the effects of temperature on photosynthetic carbon metabolism [22]. If the leaf temperature is too high or too low, enzyme activities related to photosynthesis are likely to decrease, followed by a decline in photosynthesis, which limits plant growth and development. Leaf temperature is also associated with water vapor pressure inside the leaves, which drives transpiration [23]. Leaf temperature can proxy for plant activities to assess crop health and management. Therefore, the potential benefits of leaf temperature sensing can be used to better understand the physiological state, productivity, and input methods (e.g., irrigation) [24].
There is a need to focus on the influence of leaf temperature on crop performance, which is essentially related to the greenhouse microclimate due to its effect on heat, CO2 exchange, and water availability [25]. Leaf temperature measurements provide a baseline for optimizing leaf photosynthesis via heating, aeration, and nutrition and water supply. Leaf temperature is also the most associated with solar radiation and air temperature among the internal greenhouse conditions, which can be used to detect temperature stresses in crops. However, controlling management inputs to obtain optimal leaf temperatures is rarely considered in a greenhouse system. So far, no control setting is recommended for modifying leaf temperature. Therefore, there is a need for new input data on leaf temperature to enable the planning for (1) executing aeration, especially in the winter; (2) operating screens and opening and closing of thermal curtains; and (3) determining appropriate timing and duration for nutrition supply.
Despite the importance of leaf temperature sensing in greenhouses, few studies have provided a conceptual design, sensor composition, and configuration for practical application in protected horticulture. Thus, we aimed to provide a design concept for a leaf temperature sensor and integrate it into an existing smart greenhouse system. Based on leaf temperature monitoring, we demonstrated the management and control of primary inputs to ensure optimum growth conditions for agronomically important vegetable commodities such as tomatoes.
2. Materials and Methods
2.1. Design of a Leaf Temperature Sensor
Factors considered essential for crop growth include management inputs and variables used as proxies for crop performance and environmental conditions [21]. Management-related variables include the concentration of the supplied nutrient solution and the amount of irrigation. Variables related to crop performance and environmental conditions include leaf temperature, ground temperature, light condition, and medium moisture content. Sensing these variables is necessary as they influence the productivity and profitability of horticultural vegetables (Table 1).
Our assessment related leaf temperature to air temperature and CO2 concentration. Changes in leaf temperature are closely related to air temperature patterns, and the difference between air and leaf temperatures may affect crop transpiration [23]. Leaf temperature may influence the level of CO2 in the air inside a greenhouse because the rate of CO2 uptake during the day and catabolism after sunset are functions of temperature in proximity [26]. Managing leaf temperature and CO2 concentration is essential to improve crop photosynthetic efficiency in protected horticulture. Fruit temperature can also be used to infer the overall transfer of photosynthetic metabolites. In our smart greenhouse, based on real-time leaf temperatures, we intend to control the opening or closing of side ventilation windows, nutrient irrigation, and the heating and operation of screens and curtains in the greenhouse. In addition, precision aeration and irrigation were regulated to maintain these variables for greenhouse vegetable production.
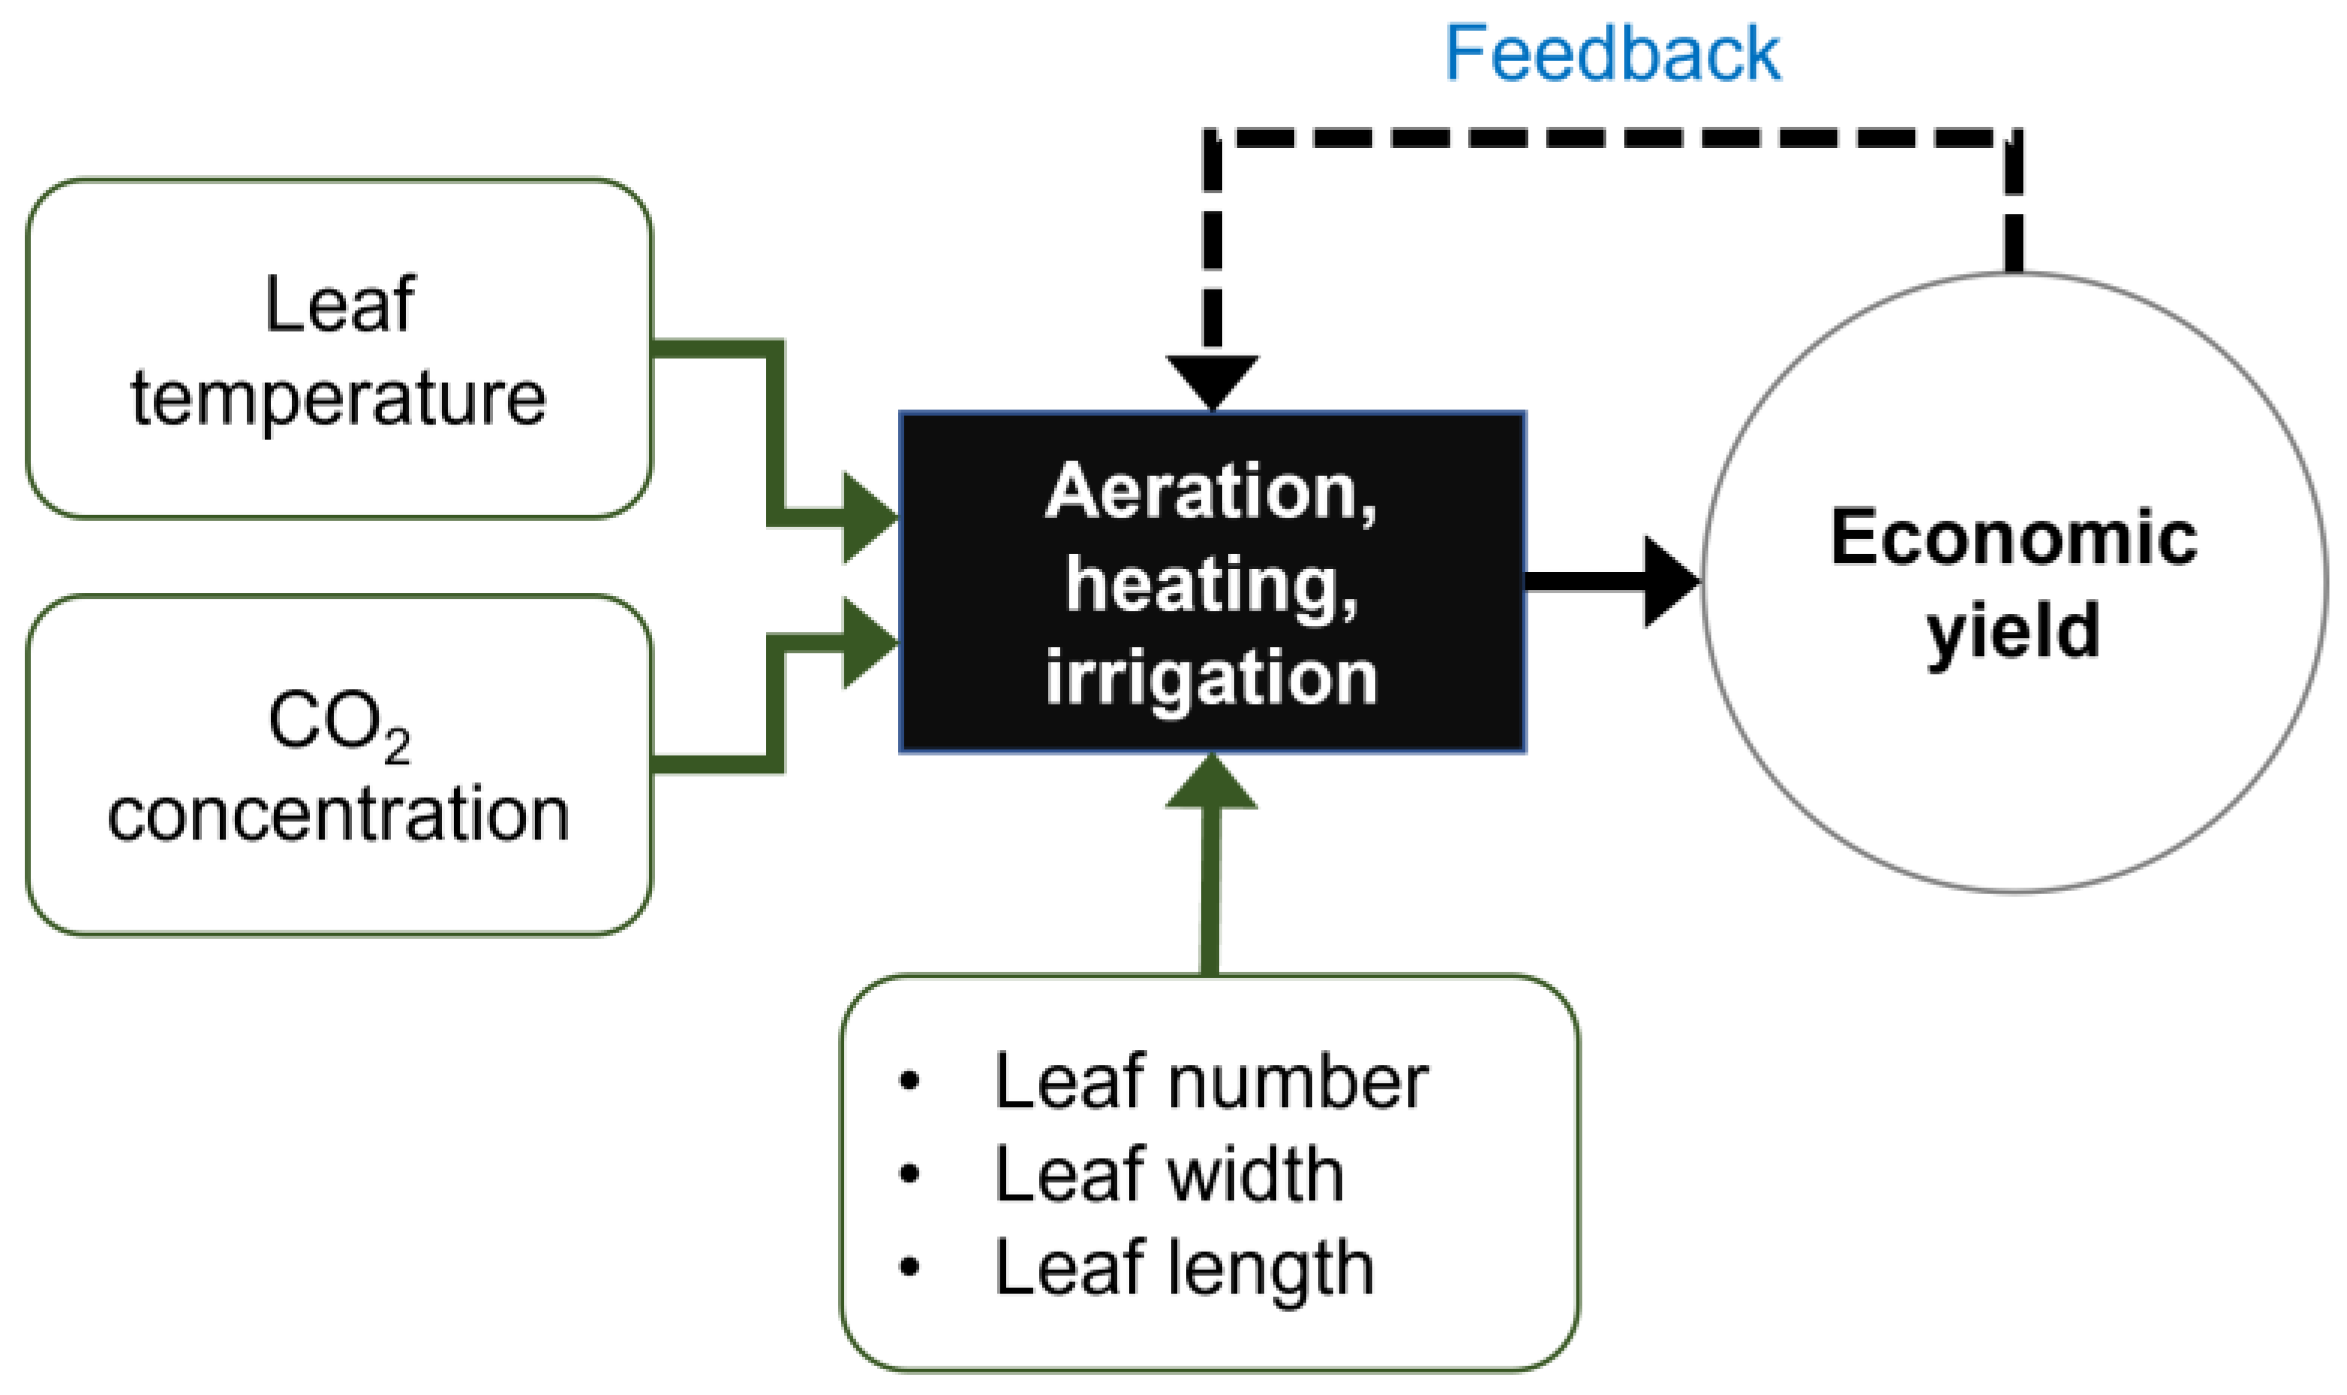
This design concept of a leaf temperature sensor is based on the following principles for smart greenhouse operation (Figure 1):
- When supplying nutrient solutions to vegetables, leaf temperature tends to decrease, suggesting increased transpiration cooling [27]. Leaf temperature is usually negatively correlated with transpiration by enhanced photosynthetic rate and heat distribution.
- CO2 assimilation patterns depend more on leaf temperature changes than air temperature [28]. Leaf CO2 assimilation is characterized by the thermal optimum, which is crop-specific and a function of temperatures in proximity.
- A lower range of leaf temperatures than air temperatures is expected, for example, when controlling window panels or heating. If this is the case, temperature stress will likely limit crop growth.
Figure 1.
Alternative “smart farm” concept for greenhouse production. Farm operations are based on a sensor network that collects real-time data on the proximal growth environments, such as leaf temperature and atmospheric CO2, enabling the precise monitoring of vegetable growth to support management decision making.

The timing and amount of aeration and irrigation can be directly determined based on the physiological responses of the crop, such as the number of leaves, leaf width, and leaf length. Approaches are available for crop imaging and analysis [29,30]. However, due to the lack of image data and analytical development, it is premature to consider such aspects in our design concept.
2.2. Development of New Hardware Components for Sensing
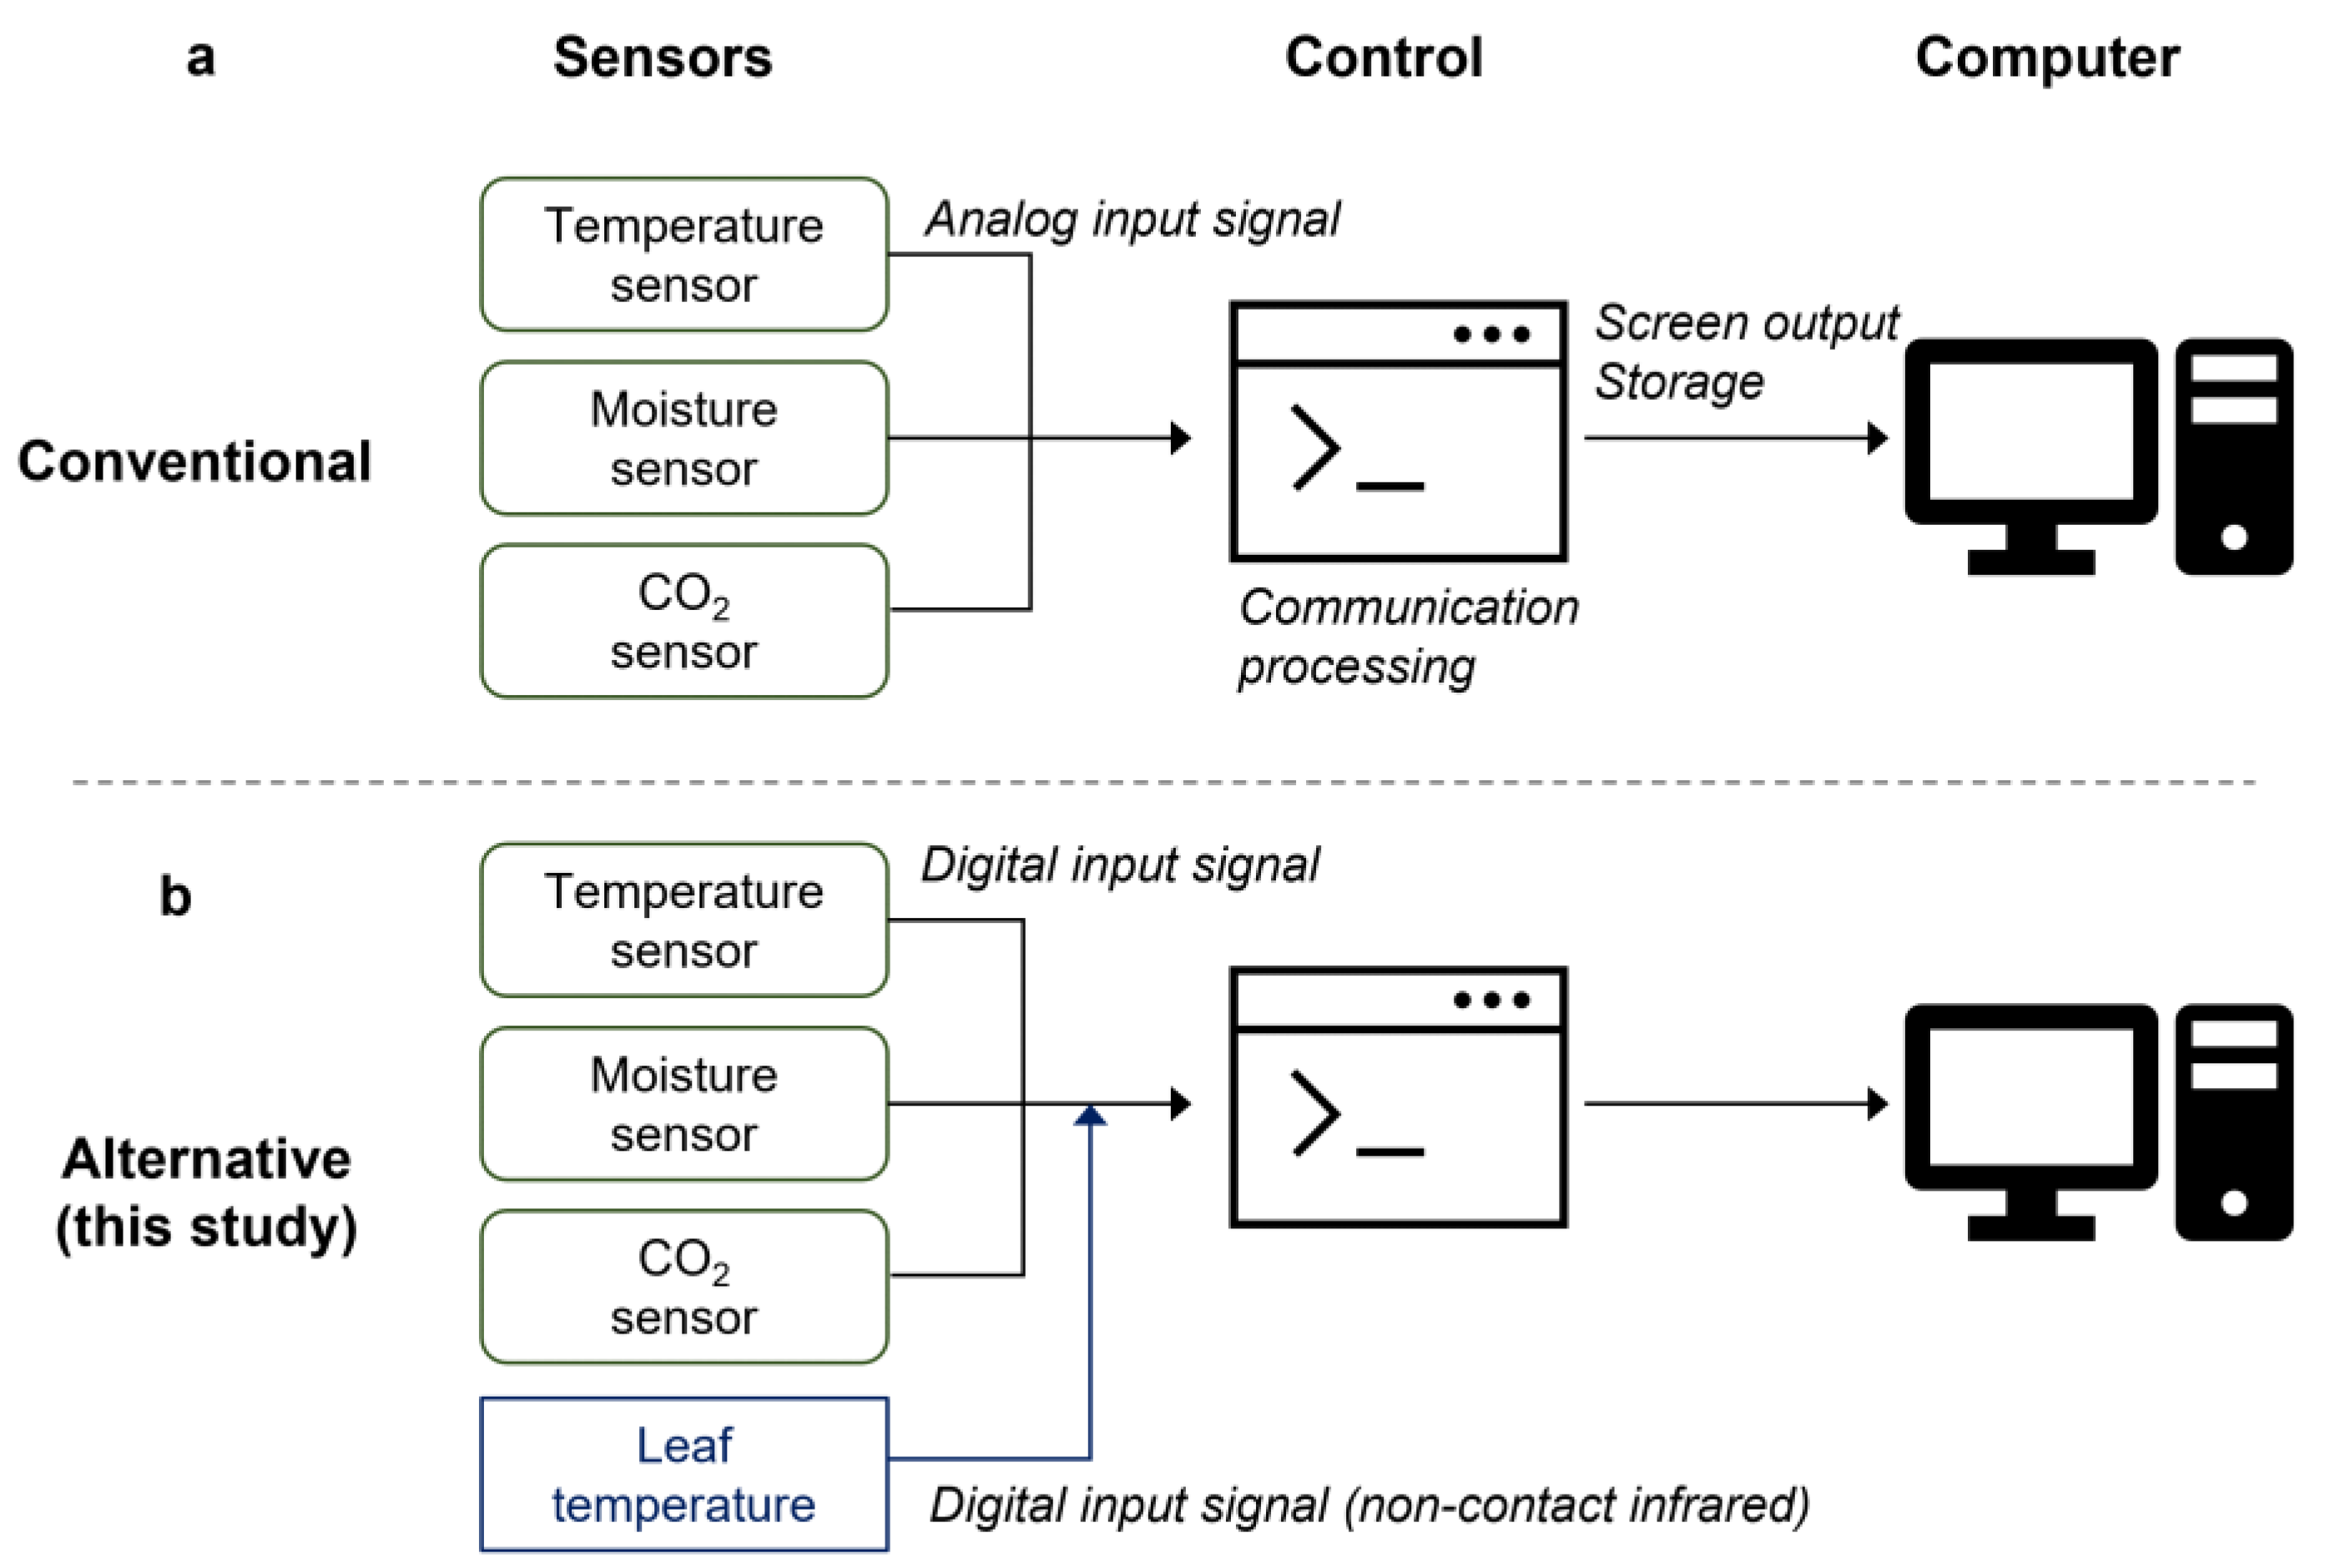
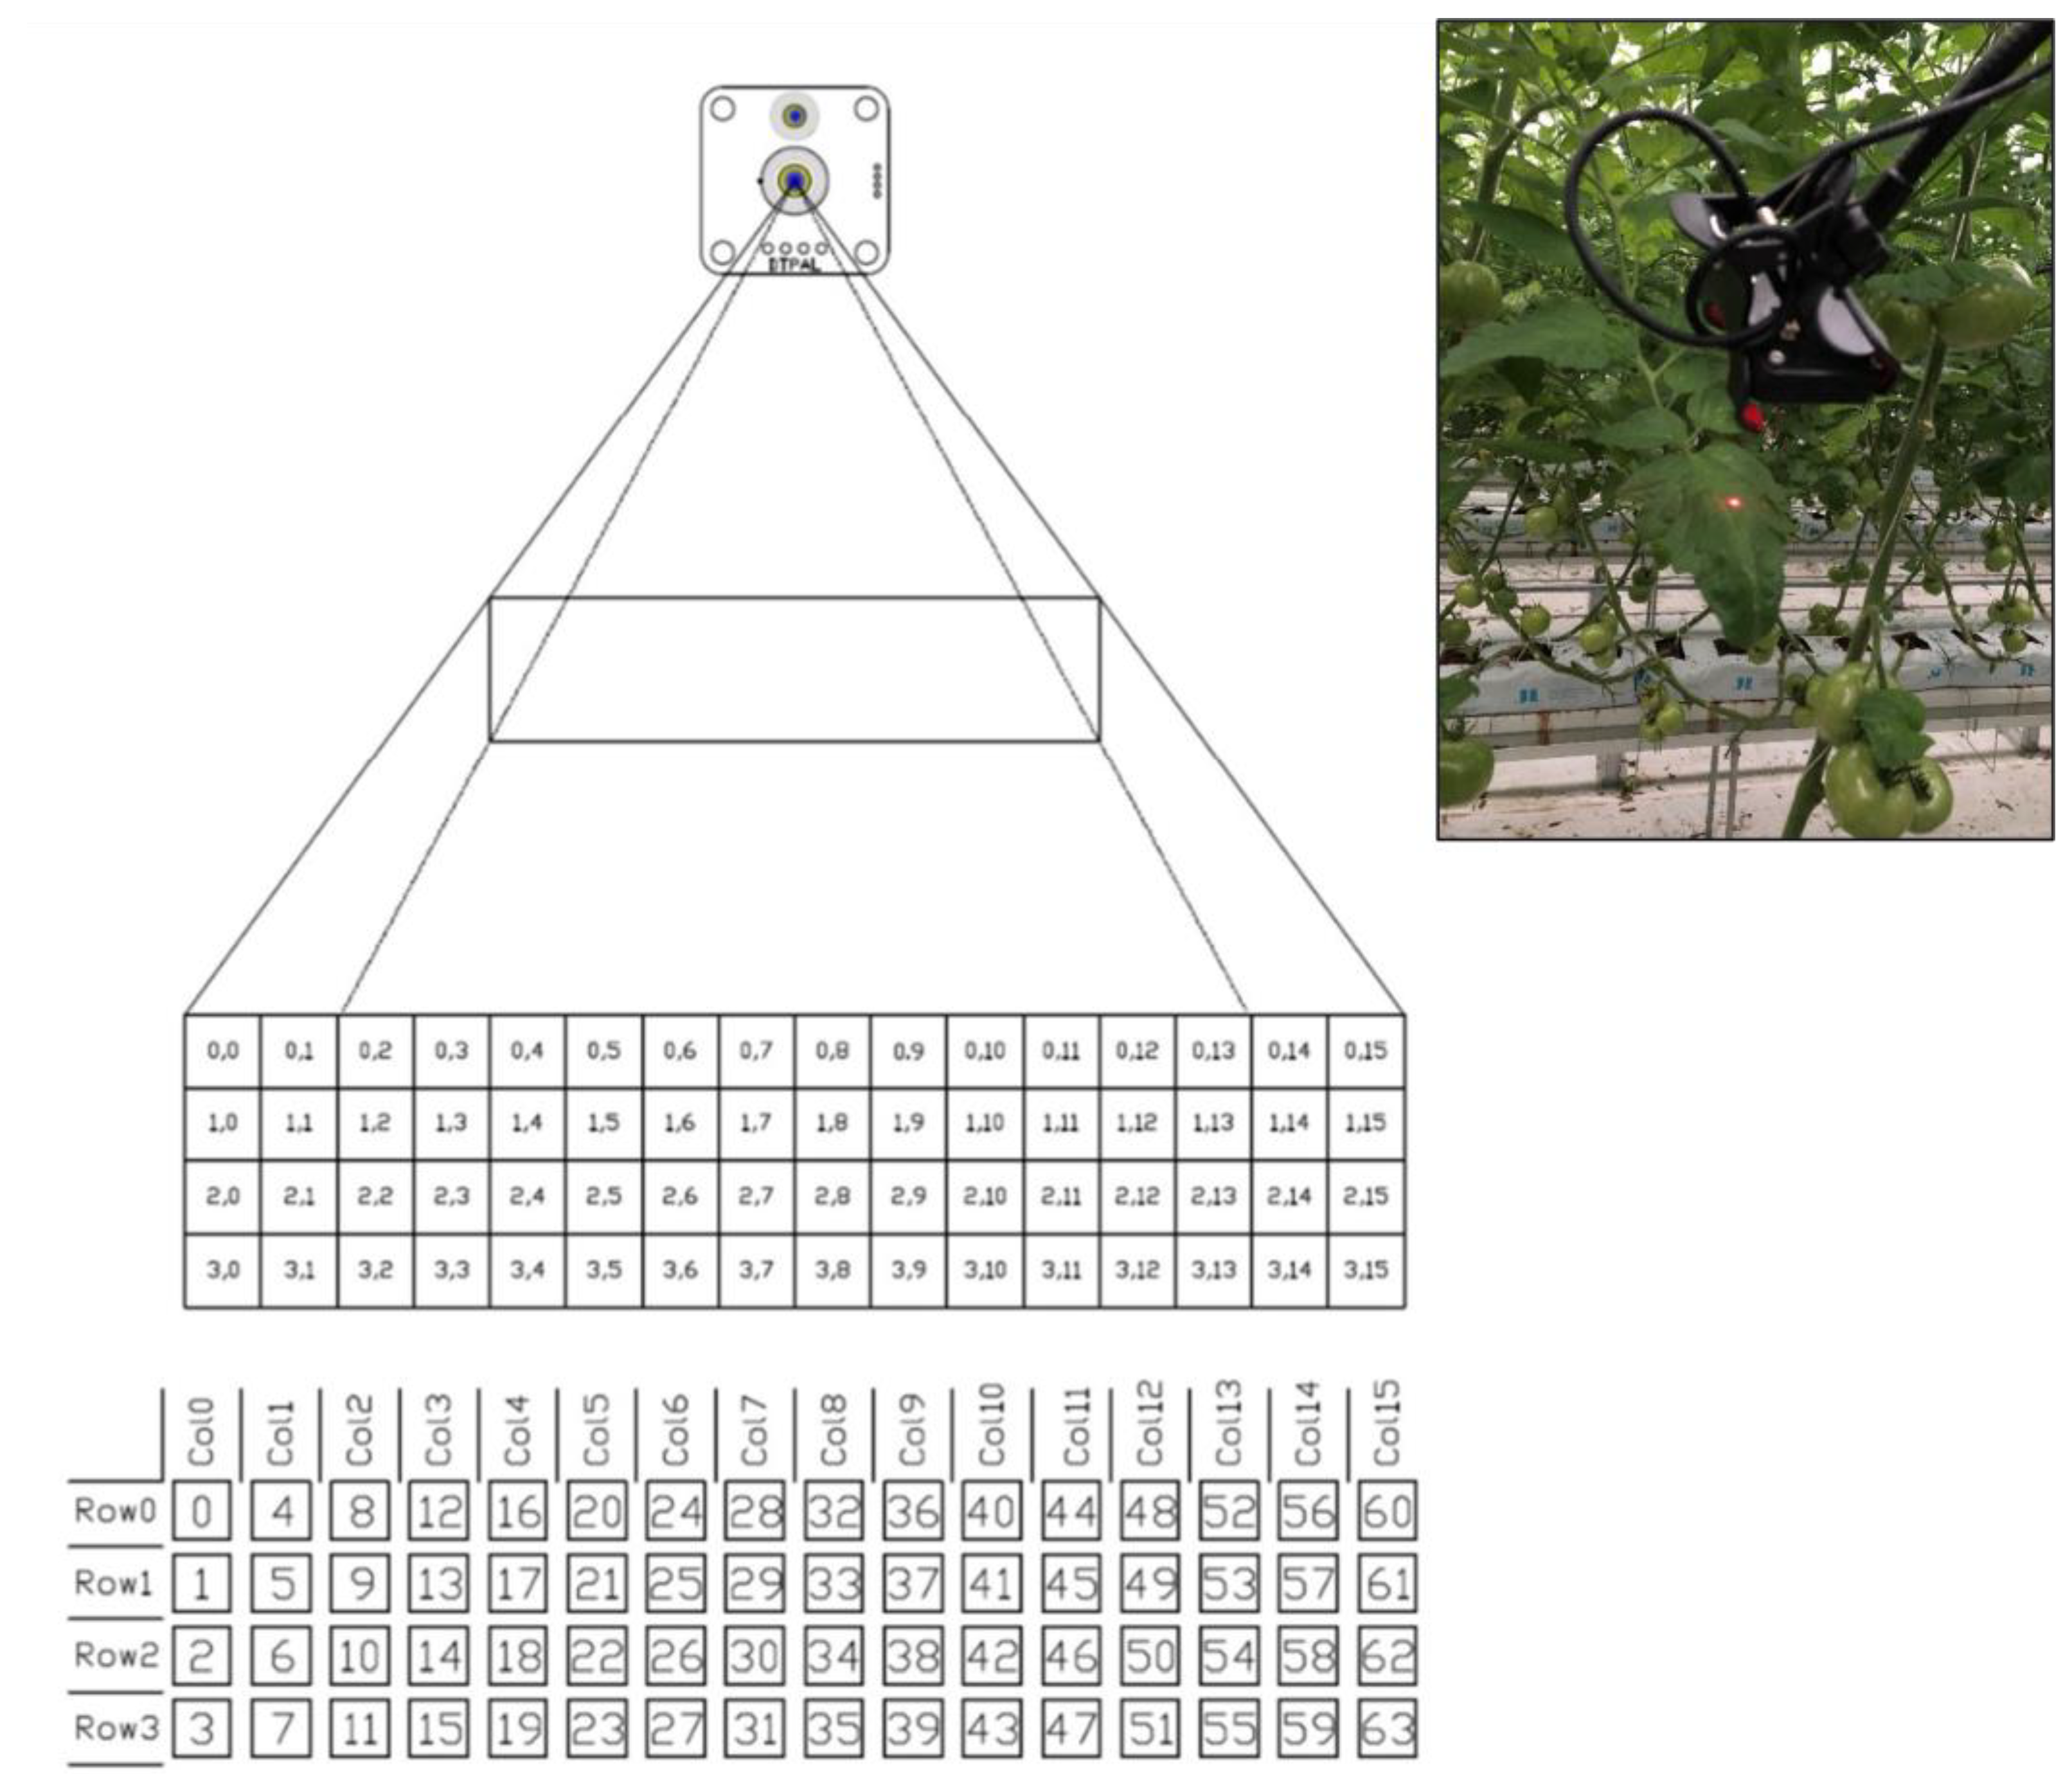
A conventional smart farm is based on a combination of sensors designed for temperature, moisture, and CO2 concentration measurements, in which analog outputs on their signals are available (Figure 2). Advances in infrared technology allow for a mobile sensor that measures a wide range of leaf temperatures to be integrated with these standard sensors (Figure 2). In this study, we developed a new sensor node with a built-in 16 × 4 thermopile infrared array sensor (DIWELL Electronics Co., Ltd., Gunpo, Republic of Korea) that simultaneously measures the temperature on a surface divided into 64 pixels (Figure 3). The non-contact infrared method, which can measure the ambient temperature of the leaf within 250 ms, was used for leaf temperature measurements. For this sensor, the infrared temperature range was between −30 °C and 300 °C at a resolution of 0.1 °C with a high accuracy of ±0.2 °C. The operating temperature ranged between −20 °C and 50 °C at 15 cm from the leaf surface. The field of view was set to 35.49° and 9.15°. We calibrated the sensor settings based on (1) the reference measurement of temperatures with a contact thermometer on the leaf surface and (2) temperatures around the leaves with a portable thermometer. Figure A1 shows a prototype of new hardware for measuring leaf temperature.
We designed the main circuit and printed circuit board for the leaf temperature sensor node by applying the STM32L476 process. This device is an ultralow-power microcontroller based on the high-performance ARM® Cortex®-M4 32 bit reduced instruction set computer core operating at a frequency of up to 80 MHz. The Cortex-M4 core features a floating-point unit with single precision, supporting all ARM single-precision data-processing instructions and data types. It also implements a complete set of digital signal processor instructions and a memory protection unit to enhance application security. We used the universal asynchronous receiver–transmitter 3.3 V transistor–transistor logic (UART 3.3 V TTL) method for serial communication. We designed a microprocessor for communication purposes using the RS485 Modbus method with a PC component. By design and in principle, the temperature sensor enables the measurement of the ambient temperature and infrared temperature of the leaves of a target crop. Thus, we adopted the same sensor to measure the temperature on the surface of the fruits.
We also developed a temperature–humidity–CO2 sensor in one sensing node. In this study, we applied the nondispersive infrared method for sensing CO2 within the 0–3000 ppm range. This method allows the signal outputs to be monitored and updated every 2.0 s, which are transferred through a UART 3.3 V TTL 9600 bps. The control equipment enabled the control and monitoring of analog and digital signal outputs. This sensor can measure temperatures in the range of −20 °C to 80 °C with an accuracy of ±0.3 °C. The response times were 5–30 s. Lastly, relative humidity (0–100% range) was sensed with an accuracy of ±2%, and its response time was 8 s. The leaf temperature sensor microprocessor also collected data from the air temperature sensor, CO2 sensor, and others (Table 1). Specifically, we used the recommended standard 232 (RS232C) for serial communication. We present the main software user interface and its block diagram in Figure A2 and Figure A3.
2.3. New Software Components for the Collection and Analysis of Sensing Data
In parallel with hardware development, we developed new software to receive digital signals from the sensor node through RS-485 Modbus communication, store data in the database, and visualize them in units of 1 min. The software specifications are outlined in Table 2, which include the operation system, communication methods, source codes, and a list of information. For our development and application process, a local database management system (DBMS) was created in MariaDB 10.4 and Net Framework 4.0 (SP1). The database schema and 32 table specifications were designed based on the entity relationship diagram and configuration information. It should be noted that we used currently available standard equipment to operate aeration, nutrient supply, and heating without any further modification. Data requirement for analysis is presented in Table A1.
2.4. Case Studies—Status of Smart Farms in the Republic of Korea
The total vegetable production areas were as follows: 44,661, 49,261, 49,652, 49,758, and 47,921 ha in 2016, 2017, 2018, 2019, and 2020, respectively [31]. In 2020, 52,444 protected horticulture farms were reported in South Korea. Specifically, greenhouse tomatoes were planted in 6391, 5782, 6058, 5706, and 5521 ha in 2016, 2017, 2018, 2019, and 2020, respectively, with corresponding yields of 61.1, 61.4, 64.2, 62.8, and 62.3 Mg ha−1, showing an annual variation of 0.5–4.4%. Approximately 16–58% of the total production systems used nutrition culture. The cropped areas for strawberries were 5978, 5907, 5969, 6421, and 5634 ha in 2016, 2017, 2018, 2019, and 2020, respectively. Strawberries were mostly produced in protected facilities, yielding 32.3, 35.7, 30.5, 36.3, and 28.8 Mg ha−1 for the same years. Strawberry yields in facility cultivation were 56–79% higher than in field cultivation.
As of 2022, only 458 farms participated in the “smart farm” program [32]. Here, tomatoes and strawberries were the dominant vegetables cultivated on 151 and 150 farms, respectively. We selected 16 farms as a leading case in which a smart farm system was implemented (Table 3). All farms, except for one, were equipped with a complex environment controller and nutrient solution suppliers. We used yield data from these leading cases to compare production before and after the implementation of smart farming. These data were used as a baseline to assess the performance of horticultural crops under smart farming conditions.
We selected three farms from among the leading cases that were previously developed and tested. We established our case study using the following steps: (1) the establishment of a new sensor network, including the leaf temperature sensing unit, (2) the collection of sensing and yield data, and (3) data analysis and interpretation. Case study 1 was established on a tomato farm (35°04′02.83″ N, 127°55′36.38″ E) near Gonyang-myeon, Sacheon-si, Gyeongsangnam-do. This case study focused on developing software, hardware, and data modules. Tomatoes were grown in a hydroponic greenhouse system. The EC and pH of the nutrient solution were 2.5 dS m−1 and 5.5–6.0, respectively. The mean day and night temperatures in the greenhouse were set to 25 °C and 15 °C during cultivation, respectively. Case study 2, consisting of the same tomato farm, as in case study 1, as well as two strawberry farms, utilized our new sensing data and relevant information to further improve the framework for data utilization. The strawberry farms were located in Jeonggok-ri, Sacheon-si, Gyeongsangnam-do (35°07′37.25″ N, 127°55′54.31″ E), Yeonsan-myeon, Nonsan-si, and Chungcheongnam-do (36°13′38.20″ N, 127°10′07.15″ E). The new sensing network should be a proof-of-concept based on a standard smart farm design. For demonstration purposes, we reported yield data from the tomato farm and sensing data from the strawberry farm in Jeonggok-ri, Sacheon-si, and Gyeongsangnam-do, using the newly developed sensing component for leaf temperature. Strawberries were placed in high-bench beds within a greenhouse and were grown hydroponically. The temperature in the greenhouse was about 20/10 °C (day/night).
2.5. Data Analyses
Tomato yields were collected to calculate descriptive statistics and yield changes before and after smart farming. All the sensing data (Table 1), including leaf temperature, were stored every minute from 1 November 2021 to 26 December 2021. The time series were aggregated into hourly data for each selected variable to reduce noise. Trends and seasonality were tested using the augmented Dickey–Fuller (ADF) test [33], and autocorrelation and partial autocorrelation were checked visually. Seasonal differencing was performed on the data to ensure that the time series data were stationary. Correlation analysis was performed on the differenced data. Furthermore, 95% confidence intervals were used to calculate mean values and differences in means. The analysis was performed using R statistical computing language and environment (version 4.0.5) [34]. We used the “stats” package to aggregate data and test the temporal stationarity and base packages for seasonal differencing. Pearson’s correlation analysis was performed using the “Hmisc” package [35].
3. Results
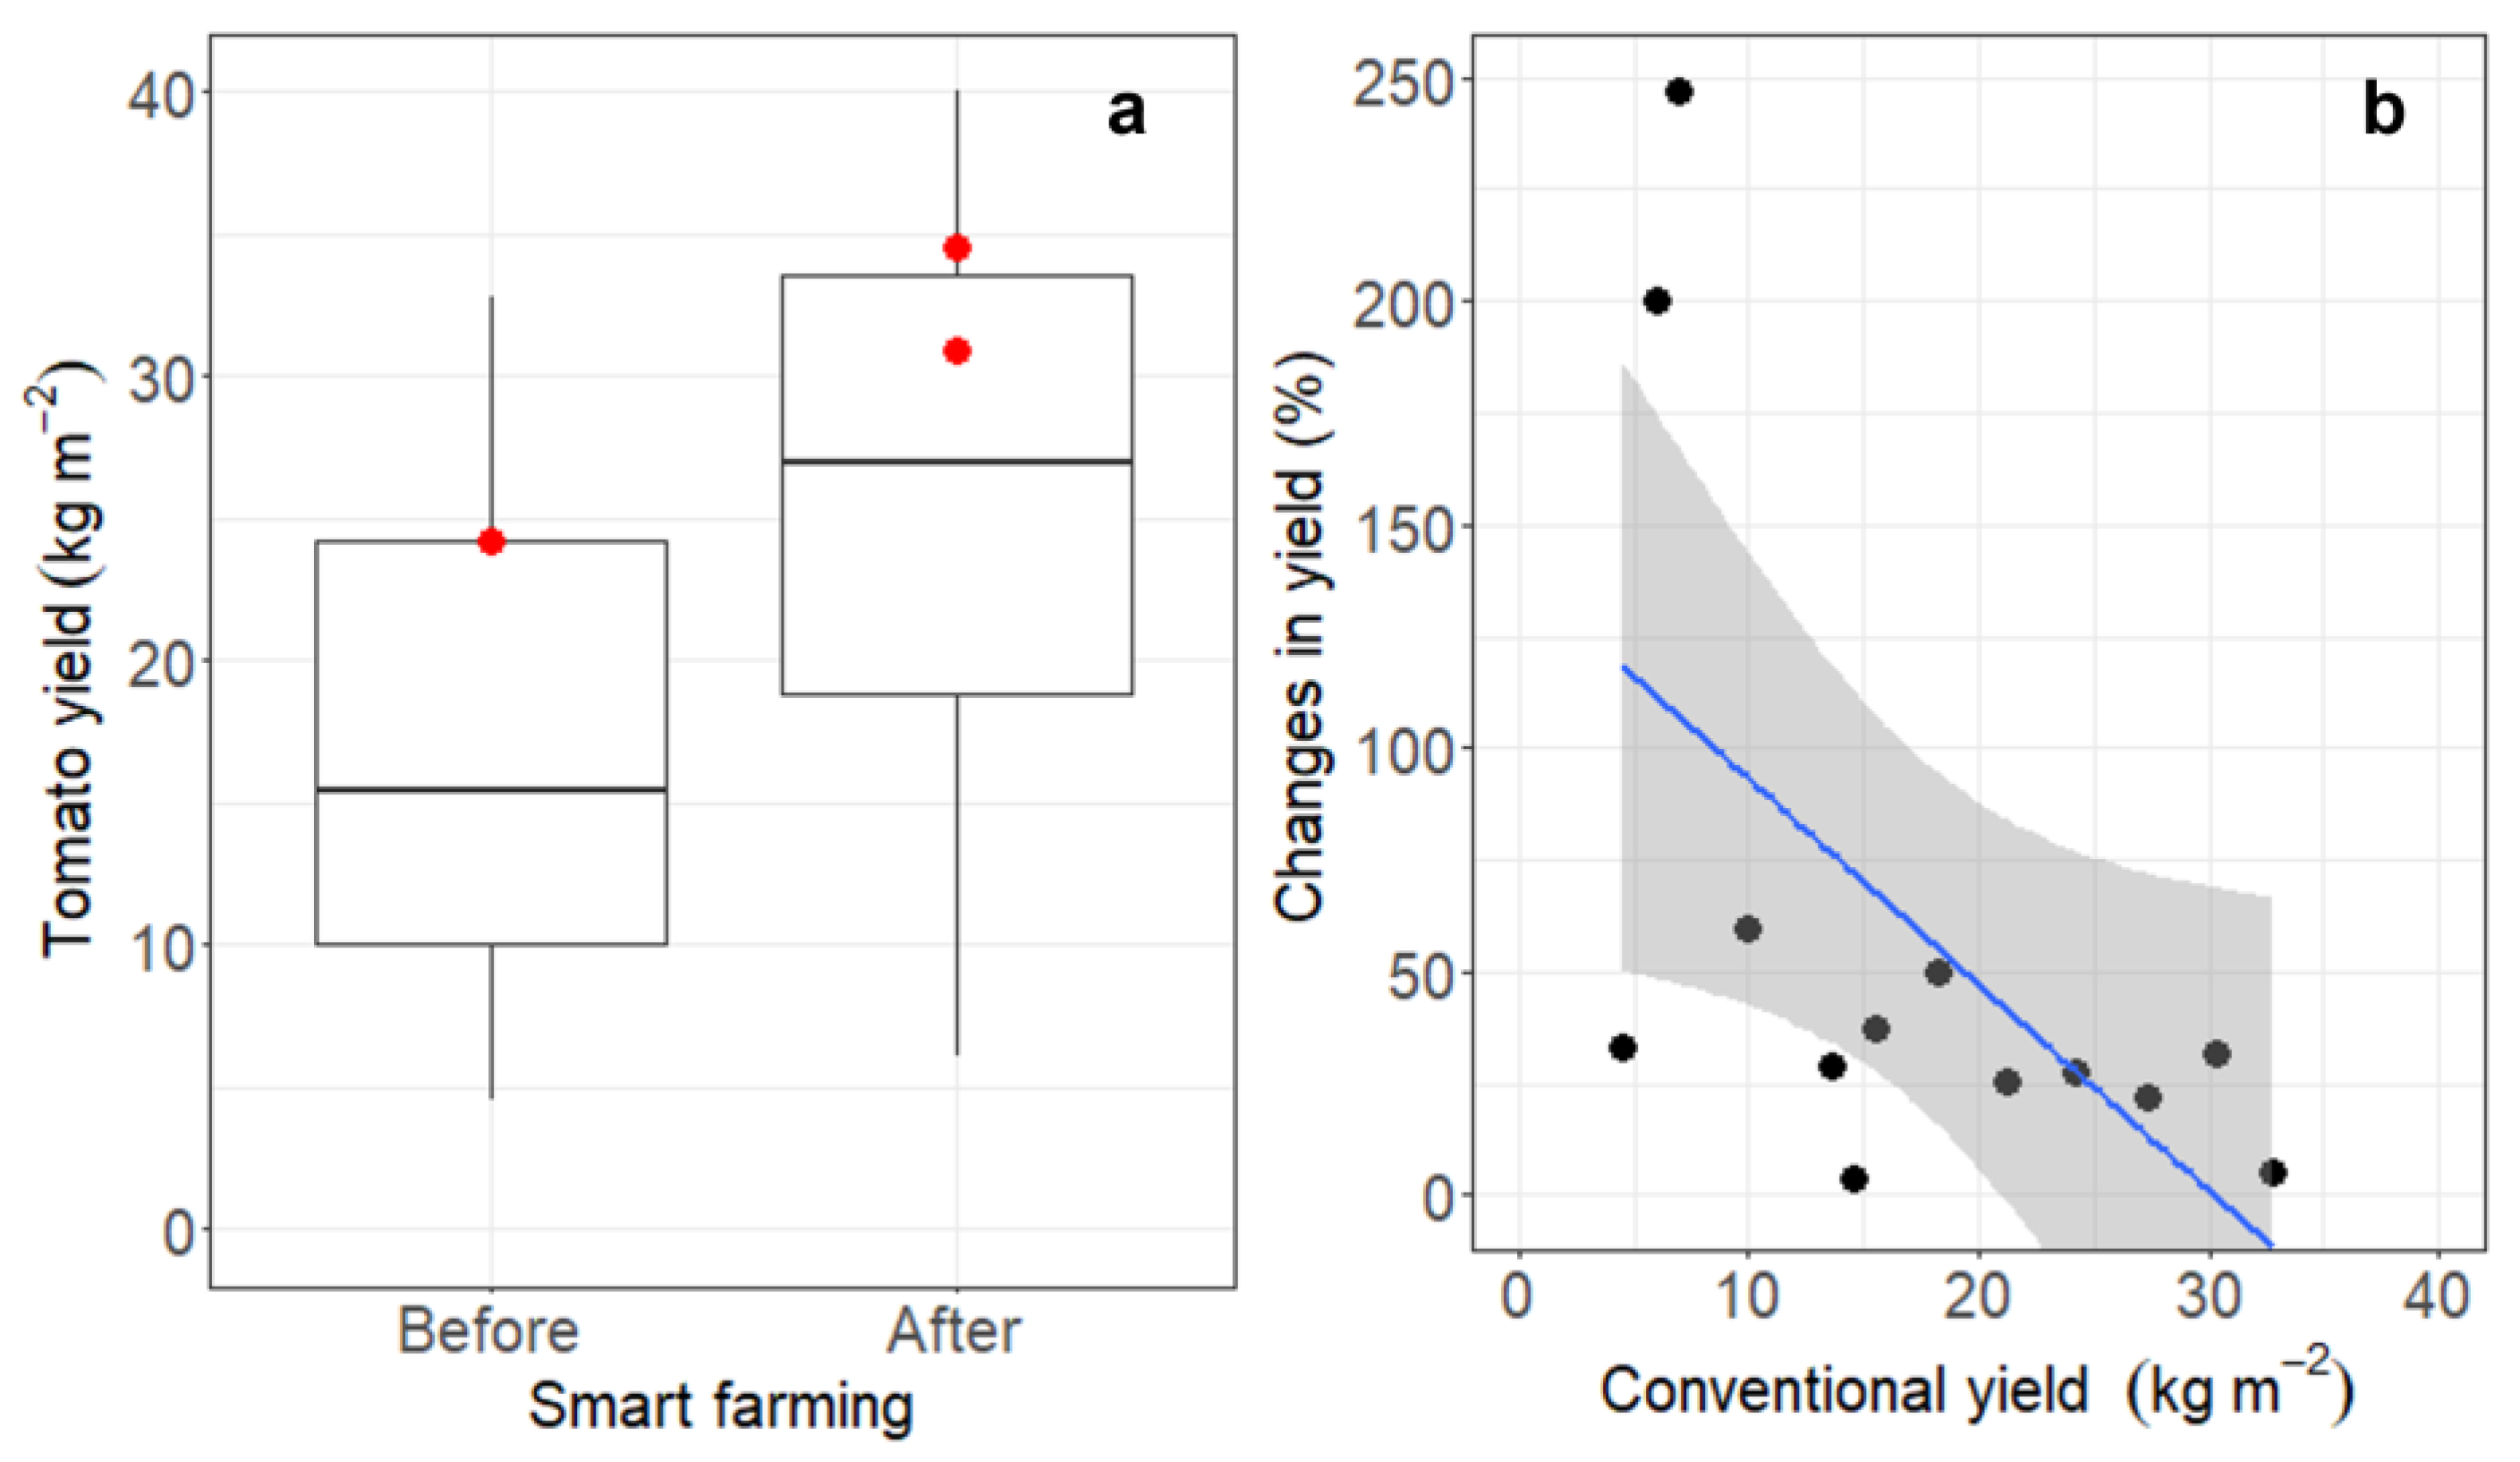
The mean and median tomato yields were 26.1 and 27.0 kg m−2 under smart farming (Figure 4). These yields were generally 25–50% higher than the conventional yields before the implementation of the smart farm system. Specifically, smart farming with leaf temperature sensing increased the yield by 28–43%. The maximum increase of 247% was obtained at a farm with relatively low productivity. For some farms with high productivity under conventional farming (e.g., over 30 kg m−2), the benefits of smart farm implementation tended to decrease but are still evident.
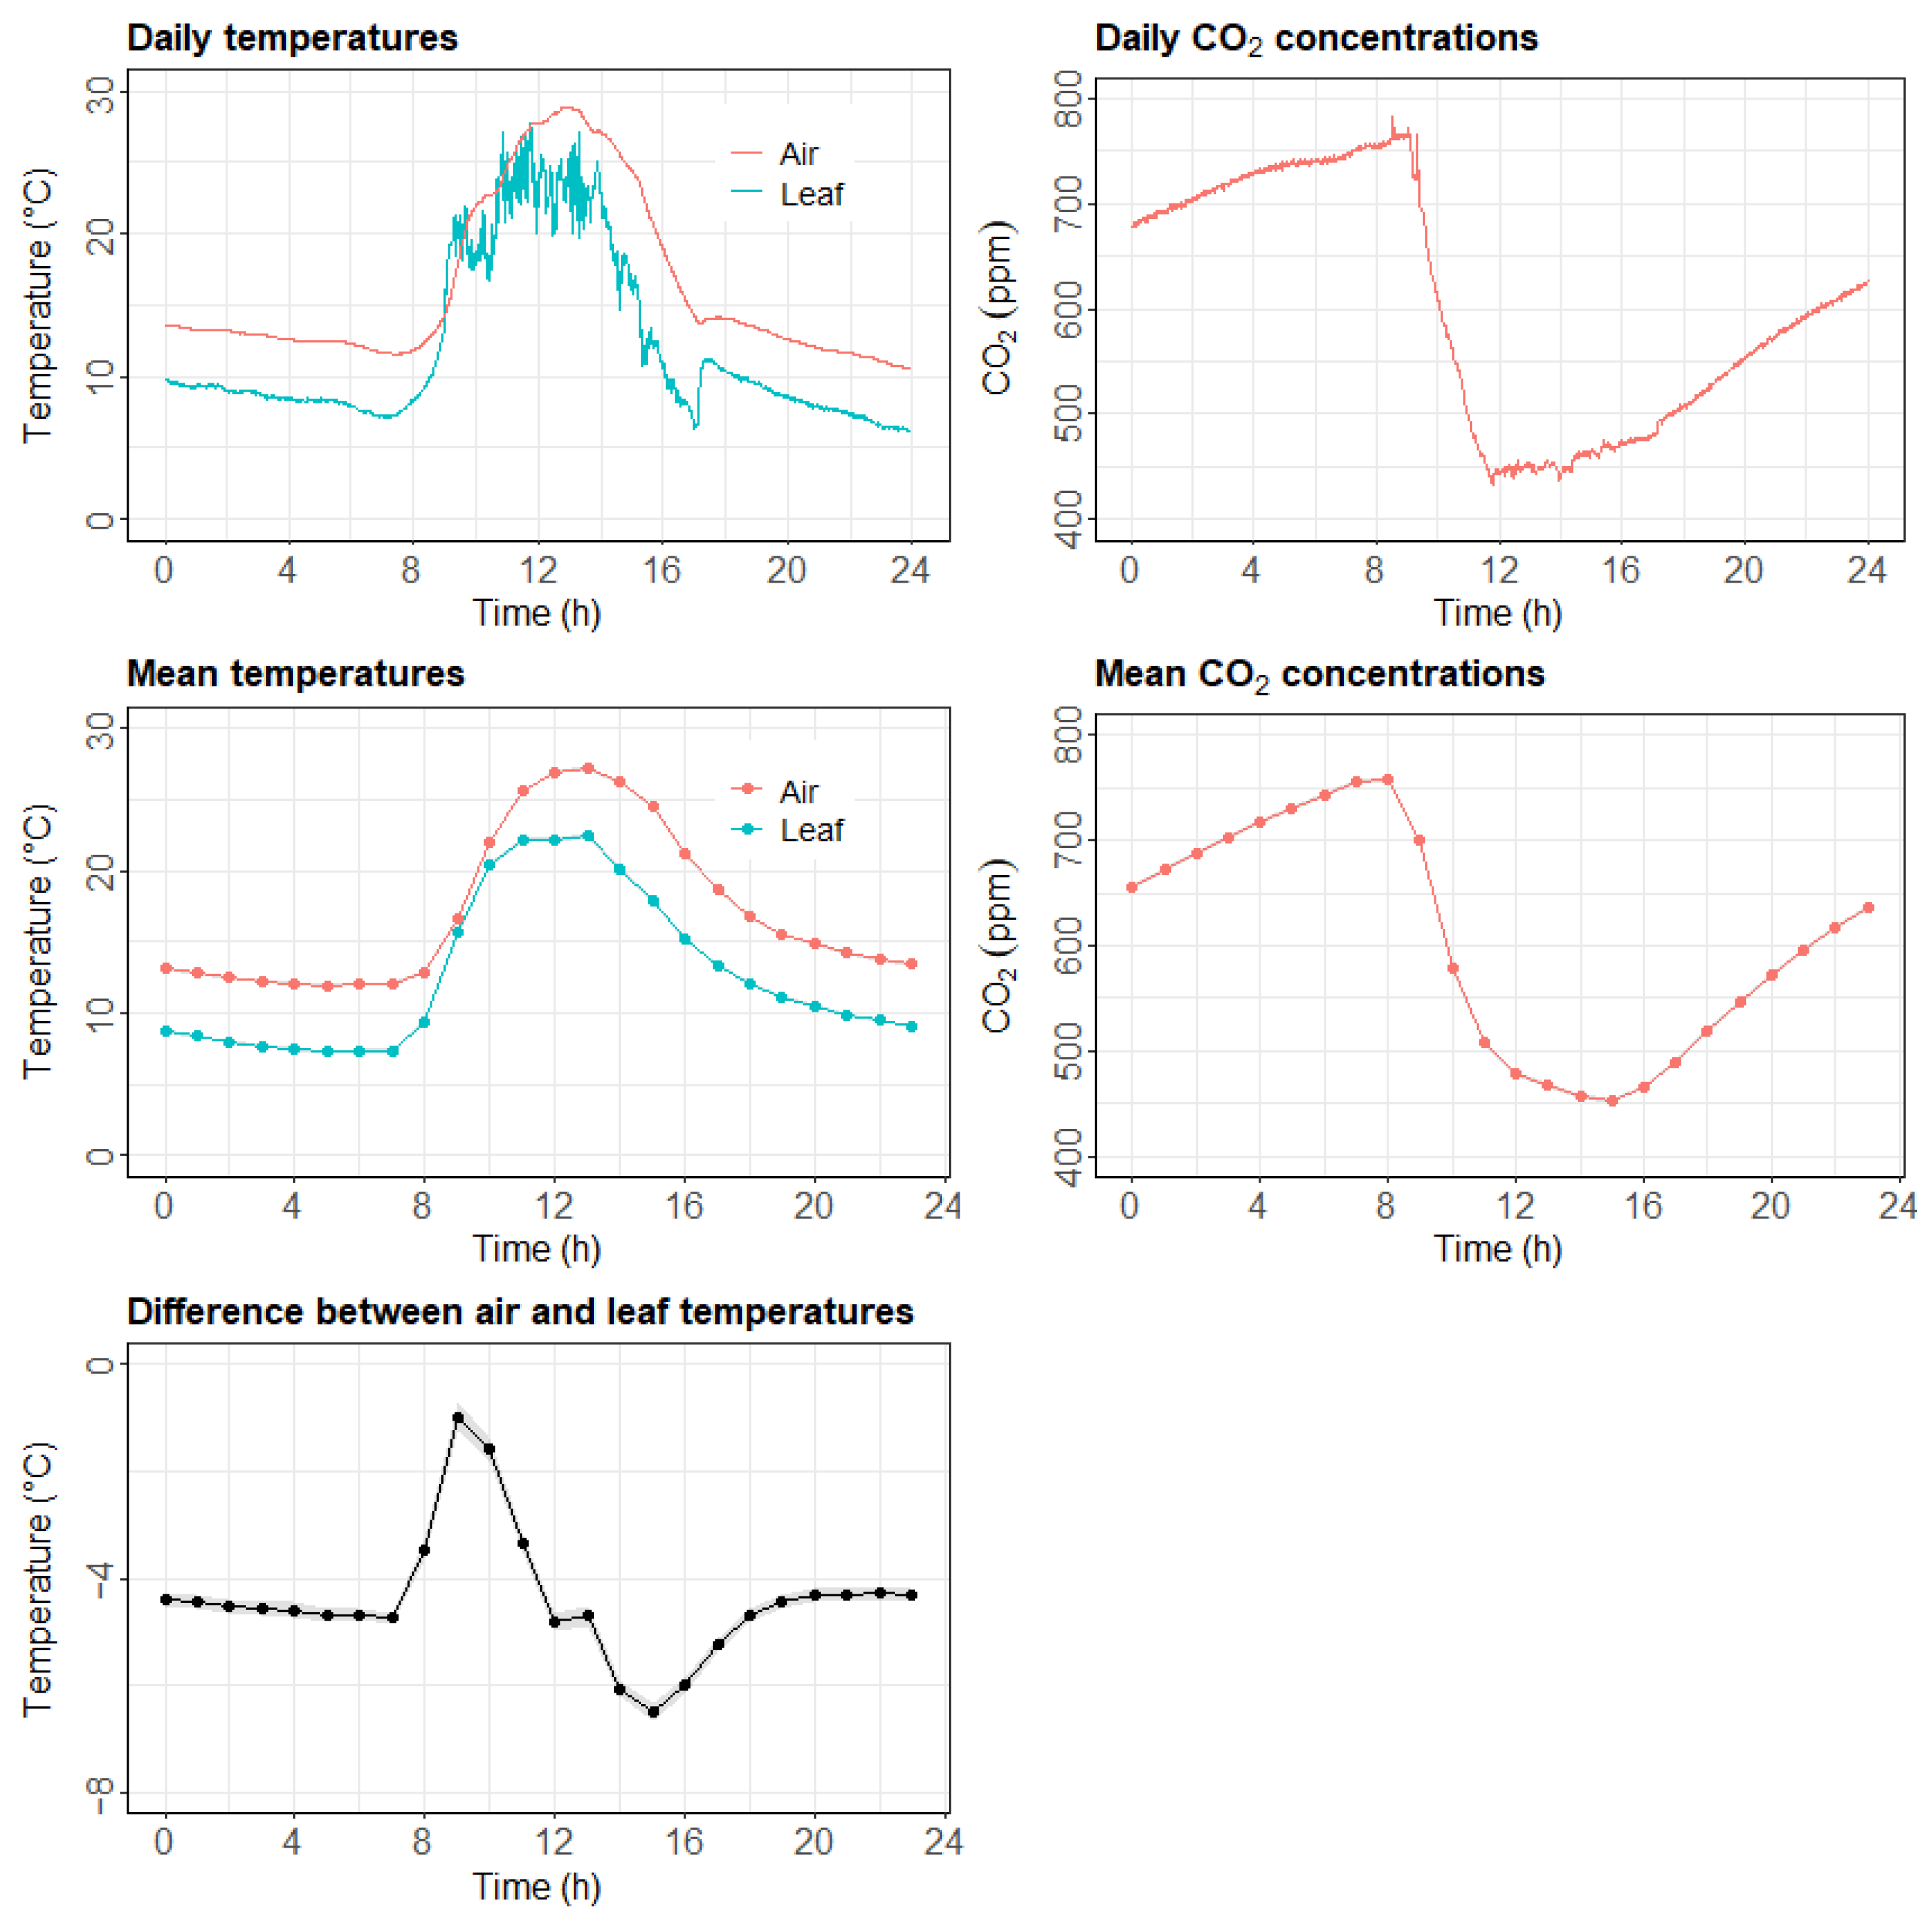
Overall, ADF test results showed that all variables were stationary, except for the pH and temperature of the drainage solution. However, these variables had a short-range autocorrelation with typical diurnal variations, such as in temperature and CO2 concentration (Figure 5). Diurnal temperature patterns show that changes in leaf temperature (3–5 °C) tended to fluctuate more than air temperature (approximately 1 °C) when heating the greenhouse between 6 a.m. and 9 a.m. After sunrise and before noon, leaf temperatures appeared to increase from 8 °C to 12 °C compared to the rise in air temperatures from 10 °C to 12 °C. When the thermal curtains were opened completely, higher leaf temperatures were observed relative to the air temperatures, with a >4 °C fluctuation in the leaf temperature due to the abrupt opening of thermal curtains, especially during winter. When the indoor air temperature increased to 28 °C, lower temperatures were required to open the windows on the sidewalls and roof. We observed a rapid drop in leaf temperature (around 7 °C) when the air temperature varied by 0.5 °C.
Leaf temperature was significantly correlated with indoor air temperature and CO2 concentration (Table 4). Significant correlations were also found with the variables that interacted with diurnal temperature patterns, such as dew point, absolute humidity, and light intensity. However, a minor relationship was found between the variables for growth media and supply and drainage solutions that were maintained uniformly.
4. Discussion
Greenhouse vegetable production has been considered a common practice in Korea since greenhouse production methods were introduced in the early 1960s [36]. In addition to the environmental sensors used in the Korean standard system, our system highlights the acquisition of monitoring frameworks in a smart farm for the capacity to track down crop photosynthetic performance. More practically, an efficient greenhouse system must support microclimate control during greenhouse crop production [37] because enhancing photosynthetic efficiency makes it possible to increase biomass production. In addition, climate control influences a range of crop responses to nutrient supply, indicating that the amount and application of a number of inputs can also be adjusted accordingly. Thus, the level of technology employed in such systems is somewhat standardized, but the sensor composition seems highly variable, with different time and labor requirements.
Leaf temperature is a function of multiple variables; most interact as stressors [38]. The contribution of this new information to environmental control and energy optimization is less known. This task was challenging because it requires the use of a new design for monitoring that encompasses additional sensing, data management, and the development of control algorithms and applications.
Daily and mean variations in CO2 concentrations were caused by the crop’s CO2 uptake during the day and then catabolism after sunset (hence CO2 accumulation). Therefore, CO2 data can be used to detect crop stress. For such a greenhouse, additional variation in CO2 concentrations may also correlate with the timing of irrigation, which would enhance microbial activity in the medium. In particular, CO2 uptake potential is highly affected by temperature in proximity, as air temperatures show typical diurnal patterns. Active crop photosynthesis often leads to high transpirational cooling. For example, cotton exhibits leaf temperatures fluctuating by 8–10 °C [39]. Moreover, subsequent airflow over the leaf surface could transiently restore ambient CO2 and cool down a head space in a complex manner [40], which explains some fluctuations in leaf temperature. This suggests that the diurnal temperature range is an essential indicator of changing climate inside a greenhouse, which must be monitored and controlled. For example, there was almost no CO2 assimilation owing to a rapid drop in leaf temperature at approximately 7 °C. Therefore, the photosynthetic efficiency appeared to be limited. In that direction, our study monitored leaf temperatures as a proxy based on the relationship between leaf temperature, air temperature, and CO2 concentration.
For most conventional smart farms, opening/closing windows and heating are based on air temperature readings. However, we demonstrated the importance of monitoring leaf temperatures to minimize direct crop temperature stress. Our results indicate that aeration must be performed in a slow mode to increase photosynthetic efficiency in the morning. In particular, aeration should be performed when leaf temperatures are higher than 25 °C until 11 a.m. Typically, temperature changes of more than 4 °C are considered signals for a crop under a stress effect. Therefore, it is important to open the thermal curtains progressively to avoid potential temperature stress on crop growth, especially during winter. It is feasible to effectively control the operation of thermal curtains during the winter season. We observed a rapid drop in leaf temperature (around 7 °C) when the air temperature varied by 0.5 °C, while lower temperatures are required to open the windows on the sidewalls and roof. Similarly, this suggests potential temperature stress on crop growth when the windows are opened without caution.
Monitoring leaf temperature as a key parameter can be used to predict key physiological processes such as net photosynthesis, transpiration, and biomass accumulation. Wang, Iddio, and Ewers [3] reviewed evapotranspiration (ET) models and key parameters for the estimation of ET to quantify crop performance in CEA. However, these models are calibrated using different methods, and validation is often lacking in the modeling process. This suggests that new data from the continuous monitoring and updating of existing data are important for data-driven models. Although used for study, the measurement of leaf temperature with thermocouples causes measurement errors due to the direct contact with the leaf, which results in heat conduction [24,41]. With the rapid development of infrared technology, scientists have used infrared radiation thermometers, which perform non-contact measurements of leaf temperature. Our study used infrared radiation thermometer systems that accurately measure leaf temperature without heat resistance. We expect that the new sensing network of vegetable production under greenhouse conditions will further improve our understanding of the contribution of controlling the growth environment and other microclimate variables for optimized crop growth (e.g., at harvest).
Further research is required to accurately monitor leaf temperature for the improvement of smart farms and assess the health and state of crops. Ragaveena, Edward, and Surendran [4] expect that “smart farming” technologies will be an integral part of farming and highlight the importance of “real-time monitoring of nutrition solution management and pest management” for crops grown in controlled environments. There are unknowns related to our sensor applications in the context of smart farming, such as the location and number of sensors, uncertain relationships with other yield-limiting factors, and a lack of consideration (in relation to heating, ventilation, lighting, etc.). Research should also address the growth response of horticulture crops and the use efficiencies of water, carbon, and nutrients to leaf temperatures. For example, associations between leaf temperatures and parameters are known in terms of gas exchange and heat balance [42].
5. Conclusions
Our study developed new hardware and software components for leaf temperature sensing integrated into a conventional smart farm system. In this study, we described the application and evaluation of leaf temperature sensing in a smart greenhouse farming system for tomatoes and strawberries. Various real-time information obtained from sensors can be used to improve crop yields. Among them, our study highlights that the precise sensing of leaf temperatures is vital for efficient smart farm applications. Our approach uses fixed infrared sensors with the advantages of a wide range and fast response. Therefore, it is practical to accurately measure leaf temperatures that differ in the range of daily changes, their fluctuations, and the phase lag of changes compared to air temperatures. Leaf temperature changes can represent the photosynthesis or respiration of the crop. The data also help to detect crop sensitivity to cold air (due to ventilation) and nutrient and moisture absorption. In addition, this sensing node is highly feasible as it can be connected to other smart farm systems that integrate management. Further engineering work should be conducted to explore energy-efficient heating, cooling, automation, and control methods. As an emerging trend in agriculture, big data analytics and artificial intelligence have recently attracted attention. We should further develop a smart greenhouse model that can optimize leaf temperatures and supply nutrient solutions to improve productivity interactively. The introduction of the smart greenhouse model demonstrated the applicability of these systems for agricultural management and information gathering in greenhouses.
This study parallels a recent trend in greenhouse production based on IoT- and ICT-based applications in smart farming. ICT and IoT technologies must be efficiently integrated into agriculture. Researchers will continue to study new technologies regarding trends in smart agriculture. We expect that our study will offer new directions for the further development of IoT- and ICT-based smart agriculture. Low-cost solutions with sensor operation, low maintenance, and high energy efficiency are in demand. Because leaf temperature in crops has become one of the most critical factors in the stage of crop growth, researchers have begun to pay more attention on it. Research on leaf temperature is still in its primary stages and focusses on studying evapotranspiration, irrigation, and crop yield. The application of leaf temperature in greenhouses should be developed to encourage farmers to engage in smart farming. Moreover, there is the need to perform an economic assessment of how suitable this system is for large areas such as greenhouses. Further studies are required to determine the effects of temperature on different parts of leaves and their growth stages for different crop species.
Author Contributions
K.-H.S. formulated the research with J.-K.L. J.-K.L. designed a leaf temperature sensor and developed its hardware/software components. H.-S.S. and J.L. performed the data analysis. K.-H.S., H.-S.S. and J.L. wrote the manuscript with input from J.-K.L. All authors have read and agreed to the published version of the manuscript.
Funding
This work was supported by "Regional Innovation Strategy (RIS)" through the National Research Foundation of Korea (NRF) funded by the Ministry of Education (MOE) (2021RIS-003) and the NRF grant funded by the Korea government (MSIT) (no. NRF-2022R1F1A1073973).
Data Availability Statement
The datasets generated during and/or analyzed during the current study are available from the corresponding author on reasonable request.
Conflicts of Interest
The authors declare no conflict of interest.
Appendix A

Table A1.
Data requirement for analysis.
| Management Element | Data |
|---|---|
| User Management |
|
| Sensor Management |
|
Figure A1.
A prototype of new hardware for measuring leaf temperature. The hardware consisted of an information collection device and a non-contact infrared thermometer. RS485 MODBUS was used as the serial communication method, with a communication speed of up to 57,600 bps. A DC24V power supply was provided.

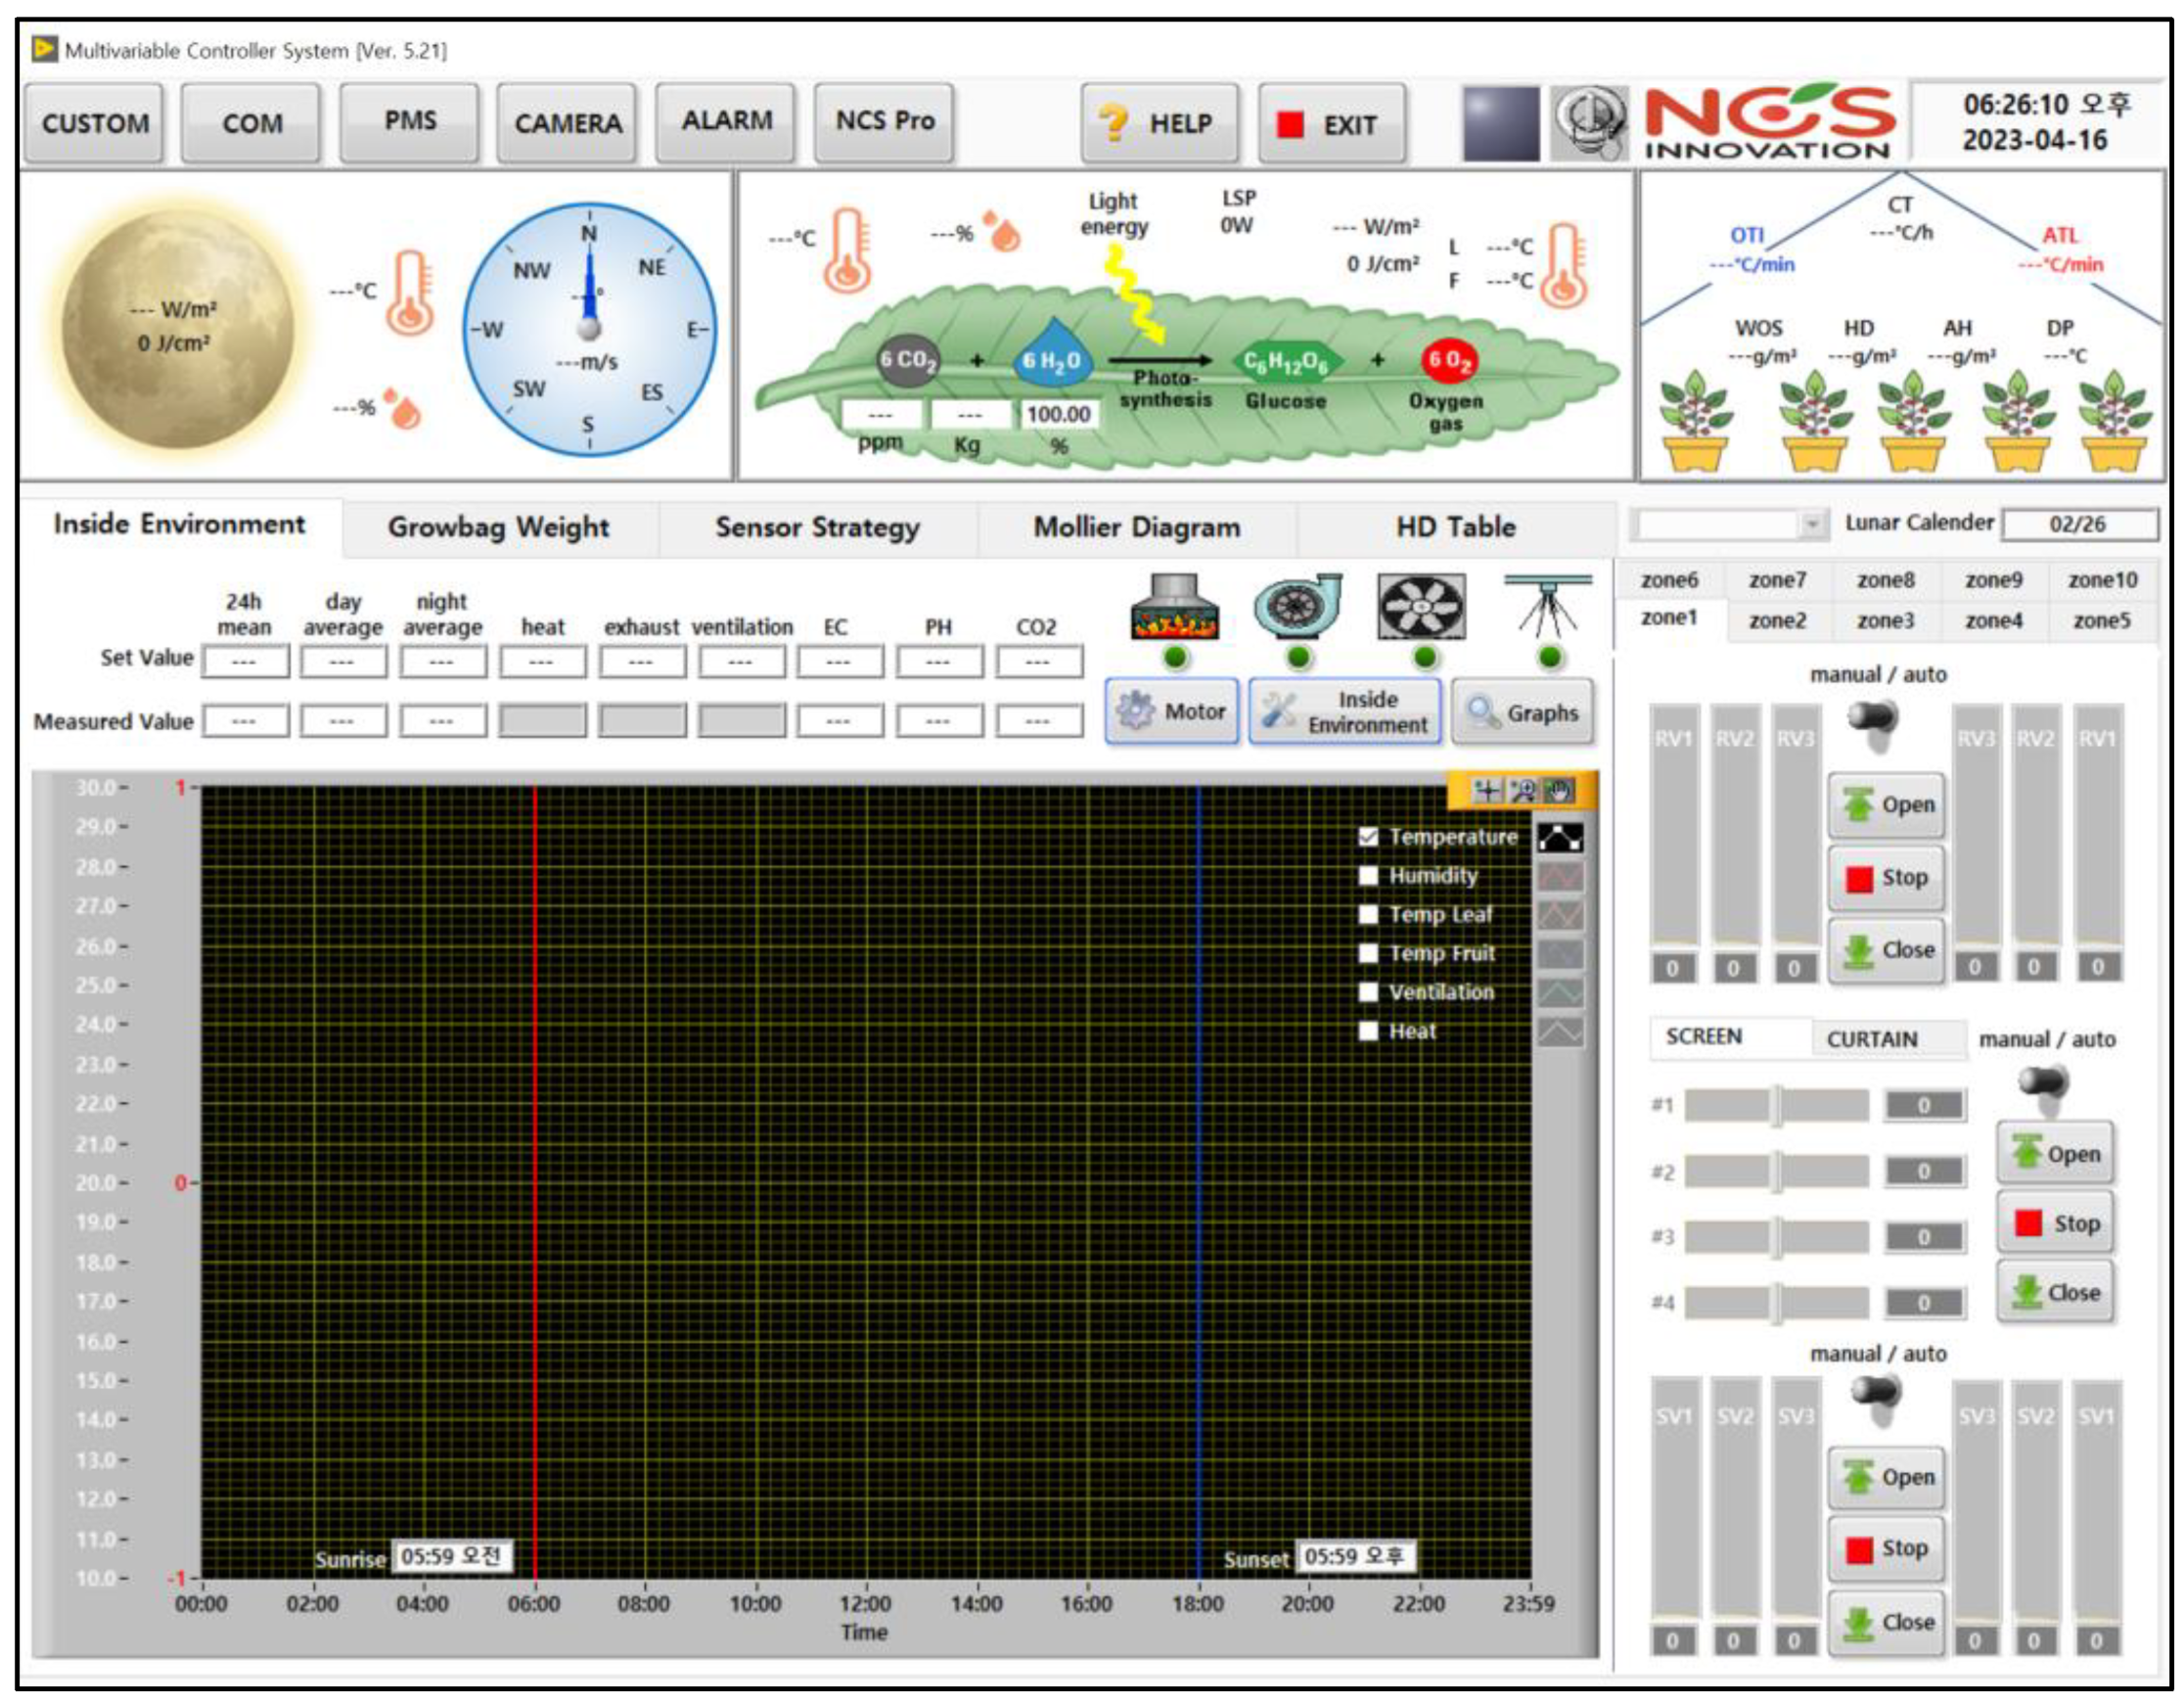
Figure A2.
The main software user interface.

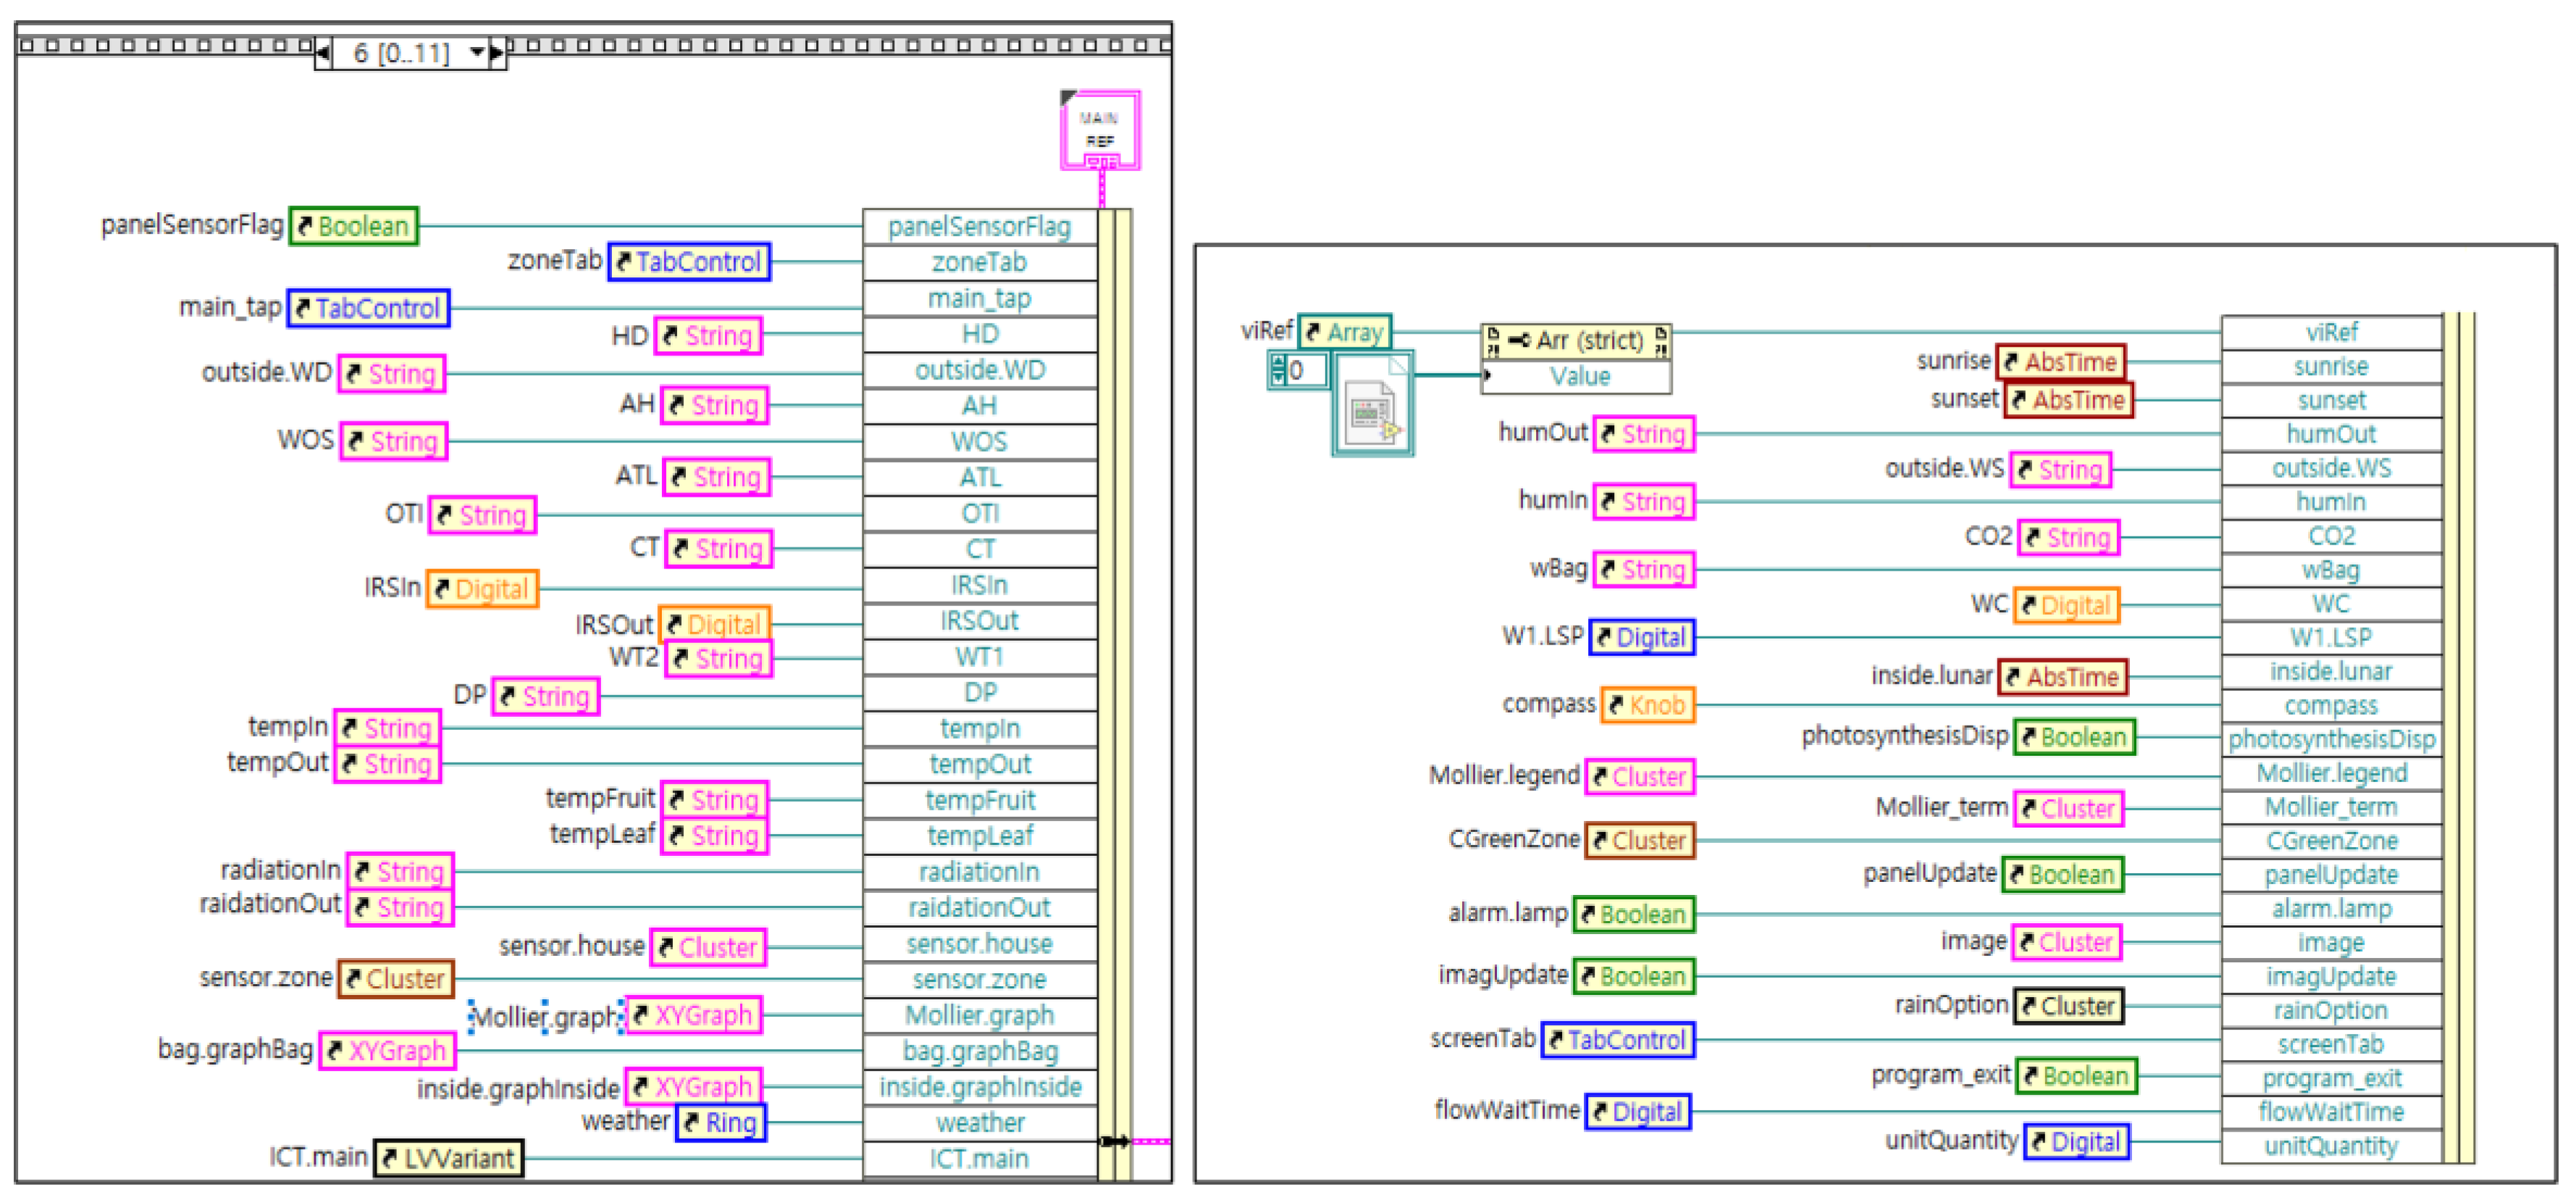
Figure A3.
Block diagram of the main software user interface, made in LabVIEW 2017 (32 bit).

References
- Engler, N.; Krarti, M. Review of energy efficiency in controlled environment agriculture. Renew. Sustain. Energy Rev. 2021, 141, 110786. [Google Scholar] [CrossRef]
- McCartney, L.; Lefsrud, M.G. Protected agriculture in extreme environments: A review of controlled environment agriculture in tropical, arid, polar, and urban locations. Appl. Eng. Agric. 2018, 34, 455–473. [Google Scholar] [CrossRef]
- Wang, L.P.; Iddio, E.; Ewers, B. Introductory overview: Evapotranspiration (ET) models for controlled environment agriculture (CEA). Comput. Electron. Agric. 2021, 190, 106447. [Google Scholar] [CrossRef]
- Ragaveena, S.; Edward, A.S.; Surendran, U. Smart controlled environment agriculture methods: A holistic review. Rev. Environ. Sci. Biotechnol. 2021, 20, 887–913. [Google Scholar] [CrossRef]
- Jensen, M.H.; Malter, A.J. Protected Agriculture, A Global Review; The World Bank: Washington, DC, USA, 1995. [Google Scholar]
- Maureira, F.; Rajagopalan, K.; Stöckle, C.O. Evaluating tomato production in open-field and high-tech greenhouse systems. J. Clean. Prod. 2022, 337, 130459. [Google Scholar] [CrossRef]
- Cohen, A.R.; Chen, G.; Berger, E.M.; Warrier, S.; Lan, G.H.; Grubert, E.; Dellaert, F.; Chen, Y.S. Dynamically controlled environment agriculture: Integrating machine learning and mechanistic and physiological models for sustainable food cultivation. ACS ES&T Eng. 2022, 2, 3–19. [Google Scholar] [CrossRef]
- Nemali, K. History of controlled environment horticulture: Greenhouses. HortScience 2022, 57, 239–246. [Google Scholar] [CrossRef]
- Baudoin, W.; Nersisyan, A.; Shamilov, A.; Hodder, A.; Gutierrez, D.; De Pascale, S.; Nicola, S.; Gruda, N.; Urban, L.; Tany, J. Good Agricultural Practices for Greenhouse Vegetable Production in the South East European Countries: Principles for Sustainable Intensification of Smallholder Farms; FAO: Rome, Italy, 2017. [Google Scholar]
- Shamshiri, R.R.; Kalantari, F.; Ting, K.C.; Thorp, K.R.; Hameed, I.A.; Weltzien, C.; Ahmad, D.; Shad, Z.M. Advances in greenhouse automation and controlled environment agriculture: A transition to plant factories and urban agriculture. Int. J. Agric. Biol. Eng. 2018, 11, 1–22. [Google Scholar] [CrossRef]
- Katul, G.G.; Oren, R.; Manzoni, S.; Higgins, C.; Parlange, M.B. Evapotranspiration: A process driving mass transport and energy exchange in the soil-plant-atmosphere-climate system. Rev. Geophys. 2012, 50. [Google Scholar] [CrossRef]
- Xin, P.P.; Li, B.; Zhang, H.H.; Hui, J. Optimization and control of the light environment for greenhouse crop production. Sci. Rep. 2019, 9, 8650. [Google Scholar] [CrossRef]
- Massa, G.D.; Kim, H.H.; Wheeler, R.M.; Mitchell, C.A. Plant productivity in response to LED lighting. HortScience 2008, 43, 1951–1956. [Google Scholar] [CrossRef]
- O’Sullivan, C.A.; Bonnett, G.D.; McIntyre, C.L.; Hochman, Z.; Wasson, A.P. Strategies to improve the productivity, product diversity and profitability of urban agriculture. Agric. Syst. 2019, 174, 133–144. [Google Scholar] [CrossRef]
- Tan, B.; Li, Y.H.; Liu, T.G.; Tan, X.; He, Y.X.; You, X.J.; Leong, K.H.; Liu, C.; Li, L.G. Response of plant rhizosphere microenvironment to water management in soil- and substrate-based controlled environment agriculture (CEA) systems: A review. Front. Plant Sci. 2021, 12, 691651. [Google Scholar] [CrossRef]
- Rai, M.; Ingle, A. Role of nanotechnology in agriculture with special reference to management of insect pests. Appl. Microbiol. Biotechnol. 2012, 94, 287–293. [Google Scholar] [CrossRef] [PubMed]
- Rayhana, R.; Xiao, G.G.; Liu, Z. Printed sensor technologies for monitoring applications in smart farming: A review. IEEE Trans. Instrum. Meas. 2021, 70, 9513419. [Google Scholar] [CrossRef]
- Nicholson, C.F.; Harbick, K.; Gómez, M.I.; Mattson, N.S. An Economic and Environmental Comparison of Conventional and Controlled Environment Agriculture (CEA) Supply Chains for Leaf Lettuce to US Cities. In Food Supply Chains in Cities: Modern Tools for Circularity and Sustainability; Aktas, E., Bourlakis, M., Eds.; Springer International Publishing: Cham, Switzerland, 2020; pp. 33–68. [Google Scholar]
- Adegbeye, M.J.; Reddy, P.R.K.; Obaisi, A.I.; Elghandour, M.M.M.Y.; Oyebamiji, K.J.; Salem, A.Z.M.; Morakinyo-Fasipe, O.T.; Cipriano-Salazar, M.; Camacho-Diaz, L.M. Sustainable agriculture options for production, greenhouse gasses and pollution alleviation, and nutrient recycling in emerging and transitional nations—An overview. J. Clean. Prod. 2020, 242, 118319. [Google Scholar] [CrossRef]
- Sicari, S.; Rizzardi, A.; Grieco, L.A.; Coen-Porisini, A. Security, privacy and trust in Internet of Things: The road ahead. Comput. Netw. 2015, 76, 146–164. [Google Scholar] [CrossRef]
- Li, H.X.; Guo, Y.; Zhao, H.J.; Wang, Y.; Chow, D. Towards automated greenhouse: A state of the art review on greenhouse monitoring methods and technologies based on internet of things. Comput. Electron. Agric. 2021, 191, 106558. [Google Scholar] [CrossRef]
- Kobza, J.; Edwards, G.E. Influences of leaf temperature on photosynthetic carbon metabolism in wheat. Plant Physiol. 1987, 83, 69–74. [Google Scholar] [CrossRef]
- Gates, D.M. Transpiration and leaf temperature. Annu. Rev. Plant Physiol. 1968, 19, 211–238. [Google Scholar] [CrossRef]
- Yu, L.; Wang, W.; Zhang, X.; Zheng, W. A Review on Leaf Temperature Sensor: Measurement Methods and Application. In Proceedings of the Computer and Computing Technologies in Agriculture IX, Beijing, China, 27–30 September 2015; pp. 216–230. [Google Scholar]
- Wang, S.; Deltour, J. An experimental model for leaf temperature of greenhouse-grown tomato. In Proceedings of the International Symposium Greenhouse Management for Better Yield & Quality in Mild Winter Climates, Antalya, Turkey, 3 November 1997; pp. 101–106. [Google Scholar]
- Mellor, R.S.; Salisbury, F.B.; Raschke, K. Leaf temperatures in controlled environments. Planta 1964, 61, 56–72. [Google Scholar] [CrossRef]
- Gates, D.M. Leaf temperature and transpiration. Agron. J. 1964, 56, 273–277. [Google Scholar] [CrossRef]
- Laing, W.A. Temperature and light response curves for photosynthesis in kiwifruit (Actinidia chinensis) cv. Hayward. N. Z. J. Agric. Res. 1985, 28, 117–124. [Google Scholar] [CrossRef]
- Darwin, B.; Dharmaraj, P.; Prince, S.; Popescu, D.E.; Hemanth, D.J. Recognition of bloom/yield in crop images using deep learning models for smart agriculture: A review. Agronomy 2021, 11, 646. [Google Scholar] [CrossRef]
- Jabir, B.; Falih, N. Deep learning-based decision support system for weeds detection in wheat fields. Int. J. Electr. Comput. Eng. 2022, 12, 816–825. [Google Scholar] [CrossRef]
- Statistics Korea. Vegetable Production—Fruits and Vegetables. 2021. Available online: https://kosis.kr/ (accessed on 20 January 2023).
- Smart Farm Korea. Smart Farm Status. 2022. Available online: https://www.smartfarmkorea.net (accessed on 20 January 2023).
- Dickey, D.A.; Fuller, W.A. Distribution of the estimators for autoregressive time series with a unit root. J. Am. Stat. Assoc. 1979, 74, 427–431. [Google Scholar] [CrossRef]
- R Core Team. R: A Language and Environment for Statistical Computing; R Foundation for Statistical Computing: Vienna, Austria, 2021. [Google Scholar]
- Harrell, F.E., Jr. Hmisc: Harrell Miscellaneous. R Package Version 4.7-1. 2022. Available online: https://CRAN.R-project.org/package=Hmisc (accessed on 20 January 2023).
- Wittwer, S.H.; Castilla, N. Protected cultivation of horticultural crops worldwide. HortTechnology 1995, 5, 6–23. [Google Scholar] [CrossRef]
- Shamshiri, R.R.; Bojic, I.; van Henten, E.; Balasundram, S.K.; Dworak, V.; Sultan, M.; Weltzien, C. Model-based evaluation of greenhouse microclimate using IoT-sensor data fusion for energy efficient crop production. J. Clean. Prod. 2020, 263, 121303. [Google Scholar] [CrossRef]
- Ramegowda, V.; Senthil-Kumar, M. The interactive effects of simultaneous biotic and abiotic stresses on plants: Mechanistic understanding from drought and pathogen combination. J. Plant Physiol. 2015, 176, 47–54. [Google Scholar] [CrossRef]
- Wise, R.R.; Olson, A.J.; Schrader, S.M.; Sharkey, T.D. Electron transport is the functional limitation of photosynthesis in field-grown Pima cotton plants at high temperature. Plant Cell Environ. 2004, 27, 717–724. [Google Scholar] [CrossRef]
- Lalic, B.; Eitzinger, J.; Marta, A.D.; Orlandini, S.; Sremac, A.F.; Pacher, B. Agricultural Meteorology and Climatology; Firenze University Press: Firenze, Italy, 2018; p. 353. [Google Scholar]
- Pieters, G.A.; Schurer, K. Leaf temperature measurement I. Thermocouples. Acta Bot. Neerl. 1973, 22, 569–580. [Google Scholar] [CrossRef]
- Hatfield, J.L.; Burke, J.J. Energy exchange and leaf temperature behavior of three plant species. Environ. Exp. Bot. 1991, 31, 295–302. [Google Scholar] [CrossRef]
Figure 2.
Conventional “smart farm” approaches used for sensor configuration, communication, and data management (a) and alternative approaches with the addition of leaf temperature monitoring (b).
Figure 2.
Conventional “smart farm” approaches used for sensor configuration, communication, and data management (a) and alternative approaches with the addition of leaf temperature monitoring (b).

Figure 3.
The leaf temperature sensor collects leaf temperatures on a 16 × 4 array layout (64 pixels) using a non-contact infrared method. These pixels are not overlapped, and the length and width of each pixel are 0.93 cm and 0.99 cm, respectively.
Figure 3.
The leaf temperature sensor collects leaf temperatures on a 16 × 4 array layout (64 pixels) using a non-contact infrared method. These pixels are not overlapped, and the length and width of each pixel are 0.93 cm and 0.99 cm, respectively.

Figure 4.
Boxplots of the measured tomato yields (a) and a scatter plot with linear regression to show farm-level changes in yield (%) after smart farming (b) from conventional yields. The red circles show the yields for a smart farm that implemented leaf temperature sensing.
Figure 4.
Boxplots of the measured tomato yields (a) and a scatter plot with linear regression to show farm-level changes in yield (%) after smart farming (b) from conventional yields. The red circles show the yields for a smart farm that implemented leaf temperature sensing.

Figure 5.
Daily and mean temperatures and CO2 concentrations for strawberries. Daily values were collected on 1 December 2021. Mean hourly values were calculated from 1 November 2021 to 26 December 2021. The shade indicates a 95% confidence interval for a difference in means.
Figure 5.
Daily and mean temperatures and CO2 concentrations for strawberries. Daily values were collected on 1 December 2021. Mean hourly values were calculated from 1 November 2021 to 26 December 2021. The shade indicates a 95% confidence interval for a difference in means.

Table 1.
A “KS X 3266” smart greenhouse, equipped with standard sensors for monitoring indoor/outdoor environments (references) and a leaf temperature sensor (this study). The terms listed here are referenced to the Foundation of Agricultural Technology Commercialization & Transfer, Korea.
Table 1.
A “KS X 3266” smart greenhouse, equipped with standard sensors for monitoring indoor/outdoor environments (references) and a leaf temperature sensor (this study). The terms listed here are referenced to the Foundation of Agricultural Technology Commercialization & Transfer, Korea.
| Component | Group | Variable | Description | Detection Range 1 |
|---|---|---|---|---|
| Standard sensors | Air (weather) | Temperature | Indoor and outdoor air temperature | −20–80 °C |
| Humidity 2 | Relative humidity in the atmosphere | 0–100% | ||
| Light intensity | Light intensity (solar radiation) inside and outside the greenhouse | 0–2000 Watts m−2 | ||
| Light integral | The number of active photons in the 400–700 nm range | 0–2000 µmol m−2 s−1 | ||
| CO2 | The concentration of CO2 in the atmosphere | 0–3000 ppm | ||
| Wind | Wind speed and wind direction | 0–40 m s−1; 0–360 azimuth | ||
| Supply/ drainage solution | EC | The electrical conductivity (EC) of a supply or drainage solution | 0–10 dS m−1 | |
| pH | The H+ ion concentration (acidity) of a supply or drainage solution | 2–12 | ||
| Soil | Temperature | The temperature of soil, media, nutrient solution, and root zone | −20–80 °C | |
| Water tension | Soil water tension (tensiometer) | 0–100 kPa | ||
| Water content | The volumetric water content of soil | 0–100% | ||
| Standard node | Data/ communi- cation | Sensor node | A device that can gather data and process the sensor information to monitor the environment and communicate with other nodes | |
| New sensor (this study) | Crop | Leaf (fruit) temperature | The leaf temperature of a crop using non-contact infrared radiation energy | −20–50 °C |
1 The detection range of each sensor reports the range of minimum to maximum. 2 Calculated as the difference between the saturated vapor pressure for a given air temperature and the absolute humidity and used for detecting humidity deficiency.
Table 2.
Specifications for hardware and software developed for this study.
| Task | Description |
|---|---|
| Operation system | Microsoft Windows 10 Pro (64 bits) |
| Communication method | RS232C 1, TCP/IP 2, RS485 Modbus |
| Source code | Written in C/C++, Python |
| Hardware/sensors |
|
| Data collection/ display |
|
| Data interpretation |
|
| Maximum number of connection nodes | 255 channels |
1 Recommended Standard 232. 2 Transmission control protocol/Internet protocol.
Table 3.
An overview of case studies used in this study. For leading cases, data on the following variables were collected: air temperature, humidity, CO2, illuminance, wind direction, wind speed, rainfall, and yields. Case study 1 focused on the development of software, hardware, and information collection, while case study 2 was established to improve a framework for data utilization. All farms were equipped with a complex environment controller (mainly for aeration) and nutrient solution suppliers.
| Farm Type | Sensing Type | Commodity | Number of Farms | Year Established |
|---|---|---|---|---|
| Leading case | Standard data | Tomatoes | 16 | 11 farms (2016), 2 farms (2017), 3 farms (2019) |
| Case study 1 | Leaf temperature | Tomato | 1 | 2017 |
| Case study 2 | Leaf temperature | Tomato | 1 | 2021 |
| Leaf temperature | Strawberry | 2 | 2021 |
Table 4.
Correlations of leaf temperature with other environmental variables under monitoring.
| Variable | r | p-Value |
|---|---|---|
| Indoor air temperature | 0.79 | <0.01 |
| Outdoor air temperature | ns | 0.613 |
| Soil (or growth media) temperature | −0.33 | <0.01 |
| Temperature of drainage solution | −0.08 | <0.01 |
| Dew point | 0.86 | <0.01 |
| Indoor air humidity | 0.08 | <0.01 |
| Outdoor air humidity | −0.49 | <0.01 |
| Humidity deficiency | 0.23 | <0.01 |
| Absolute humidity | 0.82 | <0.01 |
| CO2 concentrations inside the greenhouse | −0.54 | <0.01 |
| Light intensity inside the greenhouse | 0.72 | <0.01 |
| Light intensity outside the greenhouse | ns | 0.993 |
| Light integral inside the greenhouse | 0.07 | 0.016 |
| Light integral outside the greenhouse | ns | 0.634 |
| EC of supply solution | 0.20 | <0.01 |
| EC of drainage solution | 0.14 | <0.01 |
| pH of supply solution | −0.07 | 0.015 |
| pH of drainage solution | −0.19 | <0.01 |
| Weight of growth media | ns | 0.877 |
| Total amount of drainage solution | −0.07 | <0.01 |
ns = not significant.
Disclaimer/Publisher’s Note: The statements, opinions and data contained in all publications are solely those of the individual author(s) and contributor(s) and not of MDPI and/or the editor(s). MDPI and/or the editor(s) disclaim responsibility for any injury to people or property resulting from any ideas, methods, instructions or products referred to in the content. |
© 2023 by the authors. Licensee MDPI, Basel, Switzerland. This article is an open access article distributed under the terms and conditions of the Creative Commons Attribution (CC BY) license (https://creativecommons.org/licenses/by/4.0/).
Share and Cite
MDPI and ACS Style
Son, K.-H.; Sim, H.-S.; Lee, J.-K.; Lee, J. Precise Sensing of Leaf Temperatures for Smart Farm Applications. Horticulturae 2023, 9, 518. https://doi.org/10.3390/horticulturae9040518
AMA Style
Son K-H, Sim H-S, Lee J-K, Lee J. Precise Sensing of Leaf Temperatures for Smart Farm Applications. Horticulturae. 2023; 9(4):518. https://doi.org/10.3390/horticulturae9040518
Chicago/Turabian StyleSon, Ki-Ho, Han-Sol Sim, Jae-Kyoung Lee, and Juhwan Lee. 2023. "Precise Sensing of Leaf Temperatures for Smart Farm Applications" Horticulturae 9, no. 4: 518. https://doi.org/10.3390/horticulturae9040518
Note that from the first issue of 2016, this journal uses article numbers instead of page numbers. See further details here.